based on our analysis we have the following trading … on our analysis we have the following...
TRANSCRIPT


Based on our analysis we have the following trading ideas for Q1 2012
Long US equities / short Europe
Long US, Swiss & Canada equities
Long Swiss equities/ short CAC
Long EM / short DM equities
Long India, China, Brazil & South Africa
Short JPY above 79-80
Cover EUR shorts; reinitiate shorts at 1.39 levels
Long CADUSD; Long GBPUSD with target of 1.65
Long Copper / short Gold
Based on our analysis we have the following calls for Q2 2012
Sell on rallies (deteriorating risk appetite)
EM equities to underperform DM equities
China to show greater weakness compared to overall EM basket
Buy equity volatility (VIX, VXN)
EUR weakness to continue; DXY to appreciate
Weakness in industrial metal complex
Brent Crude – break below USD116/bbl signals reversal of the bull trend
Silver to outperform Gold
Based on our analysis we have the following calls for Q3 2012
India equities to deliver 10% returns by the end of 2012
Long US equities/short Europe
Short JPY above the 80 levels
Long agri/soft commodities
Long agri commodities/short precious metals
Short US 30yr treasury bond futures with a target of 133-135
India sector themes for the year are midcaps, healthcare, technology, private sector banks and select consumer-driven sectors, especially the food sector
Based on our analysis we have the following trading ideas for Q1 2013
Long Equities/ Short Gold
Long US equities, Europe equities (DAX in particular), India & China equities
Long US equities / Short 30-year US treasuries
Long global equity index ETFs with focus on large cap stocks
Short US 30-year treasury bond futures with a target of 133-135
Maintain short JPY trade / Reinitiate shorts in EUR at 1.37-1.38
Avoid commodity currencies
For 2013, 20-25% returns for NKY, SPX & NIFTY
Overweight on sectors: media, pharma, agrichemicals, FMCG and private sector banks
C
2013 Q3‐Q4 Outlook As liquidity drives equity markets higher in Q1/Q2 of 2013, we expect this momentum to
rebuild in second half of Q3 after recent sharp corrections due to volatility in currency markets. However, global equity markets may remain susceptible to bouts of volatility due
to higher impact costs and lower retail participation. We maintain our stand that any sharp fall in 2013, should be seen as a buying opportunity. The upswing in US equities which started in Q4 2011 should resume from mid August taking US equity markets higher in 2013.
European equity markets are also expected to rally with a lag with DAX leading th e way. Commodities currencies will remain under pressure; Brazil, Russia and Chinese equities will continue their underperformance. In India, while we favoured large cap Nifty stocks for H1 2013, H2 2013 should see increased stock specific action in the midcaps space.
Asset Allocator Recommendations – Reducing DM bond exposure and increasing allocations to global equities remains our key strategy for 2013. For equities, we recommend buying on dips rather than selling the rallies as global economic growth recovers. Naked shorts in
equities should be avoided in 2013 as the bias continues to be positive. Exposure to commodity markets should be avoided as commodities will continue to underperform global equities. We continue to recommend reducing Gold exposure but remain positive on Agri
commodities specially Cotton, Coffee and Sugar.
Big calls for CY 2013
Equities to outperform bonds globally
Equities to outperform commodities and energy in particular
Agri Commodities to outperform Gold; Cotton, Coffee & Sugar are the best play
US Dollar to outperform JPY, Euro, AUD, CHF; DXY will rally to 85‐87 in Q3/Q4
Indian equities to outperform EM indices; Q3 & Q4 will be better than Q1 & Q2
Hang Seng outperformance continues to Shanghai Composite Indices & CSI 300
Chinese equities to underperform global equities; but still deliver positive returns in 2013
Nymex crude to underperform equities but to remain volatile; Bullish in the near term with a
target of US$ 103/barrel but year‐end target is US$ 83‐85
Maintain our US, Japan and India equity market calls for 2013 giving absolute returns of 20‐25%. FIIs clients should hedge JPY exposure to protect their absolute gains
INR to appreciate in second half of Q3 and it will recover. 55‐62 range for H2 2013
Maintain Nifty target for year‐end is 7000 with a positive bias for second half of Q3
Maintain USD‐JPY year‐end target of 95‐97 and Euro target of 1.22
Based on our analysis we have the following trading ideas for Q3 2013:
Long SPX around 1570‐75 with a yearend target of 1700
Long US equities / Short 30‐year US treasuries
Maintain short JPY trade and re‐initiate shorts in Euro at 1.32‐1.33 with first target 1.27 and
yearend target of 1.21‐1.22
Buy on dips global equity ETFs with focus on large market cap stocks and gradually increase mid caps exposure in Q3/Q4
Avoid exposure to commodities in general; Long Cotton, Coffee and Sugar
Short US 30yr treasury bond futures with a target of 130 by year end
We expect India equities to recover, with a potential upside of 10% in Q3. We continues to remain overweight on Media, Private Banks, Oil & Gas, Agrochemical , Select Pharma &
FMCG stocks
Top Picks
ICICI Bank, RIL, Zee TV, Maruti Suzuki, Jet Airways, United Phosphorus, USPL, Dhanuka
Agritech, Cipla, HDFC, Sun TV, Lupin, PNB,Tata Motors(DVR), HPCL, L&T, Coal India, Mind Tree, Tech Mahindra, Century Textile, DB Corp, Aurobindo Pharma and Aditya Birla Nuvo.
Sandeep Tandon
sandeep.tandon@quant capital.co.in
+91 22 4088 0251
Arunkumar S
+91 22 4088 0152
Pushpa Rai
+91 22 4287 1455
Bhupesh Bameta, CFA
+91 22 4088 0367
Anshum Bhambri
+91 22 4088 0136
Piyush Singh
+91 22 4088 0291
Rishav Dev
+91 22 4088 0147
Hardik Ruparel
+91 22 4088 0187
Alok Bisht
+91 22 4287 1585
Aniruddha Iyer
+91 22 4287 1511
Gaurav Balre
+91 22 4287 1516
Kumar Chitalia
+91 22 4088 0135
Rebuilding Momentum in Q3 2013 Volatility to Continue in Global Currencies
Global Macro Stra tegy | Gathering Momentum 2013 Series – III Global Outlook June 2013
June 2013 2
INDEX
Macro Risk …………………………………………………………………………………………………………………………….. 3
Global Fund Flows …………………………………………………………………………………………………………………………….. 10
Global Currencies …………………………………………………………………………………………………………………………….. 15
Global Commodities …………………………………………………………………………………………………………………………….. 20
Global DM Equities …………………………………………………………………………………………………………………………….. 29
Global EM Equities …………………………………………………………………………………………………………………………….. 33
Global Fixed Income …………………………………………………………………………………………………………………………….. 35
India Outlook …………………………………………………………………………………………………………………………….. 44
Macro …………………………………………………………………………………………………………………………….. 44
Fixed Income …………………………………………………………………………………………………………………………….. 51
Equity …………………………………………………………………………………………………………………………….. 52
Key Stock Picks …………………………………………………………………………………………………………………………….. 64
June 2013 3
Macro Risk
Global quant Risk Index (QRI)
In the first half of 2013, global markets have seen a l iquidity‐driven rally on the back of easy monetary policy by the central banks in the US, Europe and Japan. As the macroeconomic scenario continues to improve in the US, the extraordinary liquidity infusion may slow
down (tapering of bond‐buying by the US Fed), which may be offset by the continually expanding monetary policy of Japan under Abenomics. As a result, we may see the liquidity driven rally temporarily grinding down as markets enter a consolidatory phase before the resumption of the next uptrend.
The current consolidation phase will be characterized by volatility in the equity, currency and credit markets as market participants re‐
base their expecta tions as long term yields rise in the developed world. We expect 30 year US bond futures to fall to 130 by December 2013 as the real economy improves giving central banks room to reduce monetary easing.
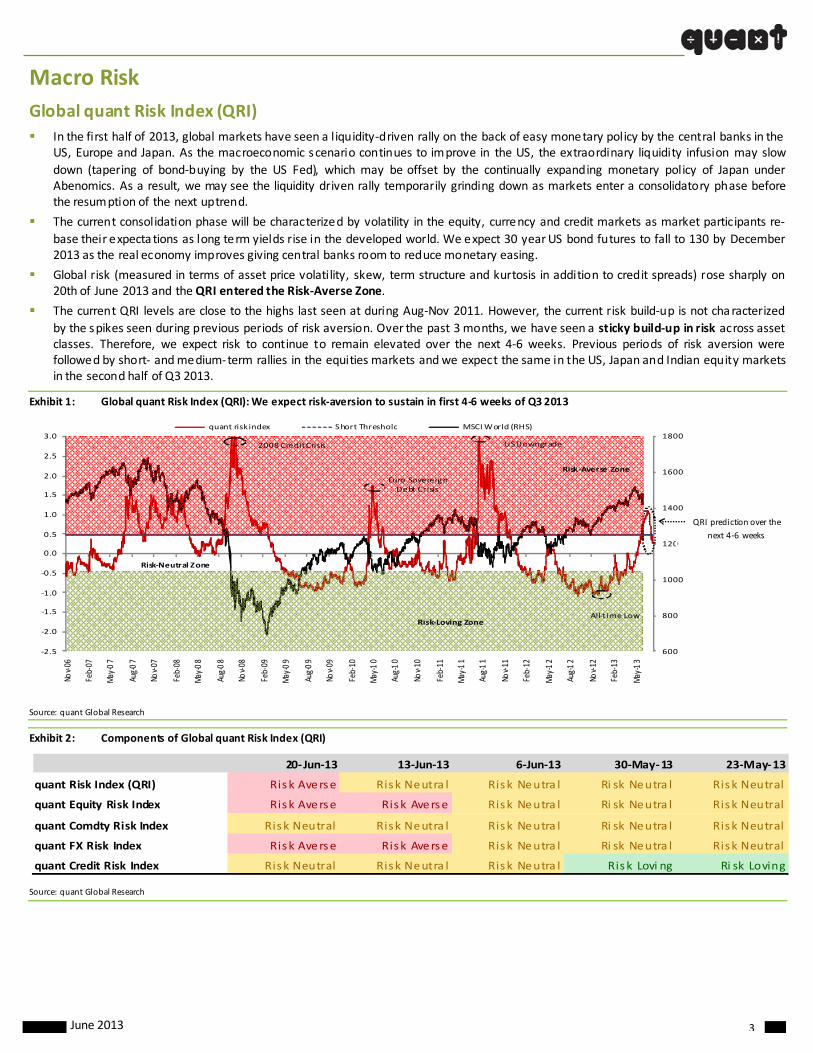
Global risk (measured in terms of asset price volatility, skew, term structure and kurtosis in addition to credit spreads) rose sharply on 20th of June 2013 and the QRI entered the Risk‐Averse Zone.
The current QRI levels are close to the highs last seen at during Aug‐Nov 2011. However, the current risk build‐up is not characterized
by the spikes seen during previous periods of risk aversion. Over the past 3 months, we have seen a sticky build‐up in risk across asset classes. Therefore, we expect risk to continue to remain elevated over the next 4‐6 weeks. Previous periods of risk aversion were followed by short‐ and medium‐term rallies in the equities markets and we expect the same in the US, Japan and Indian equity markets in the second half of Q3 2013.
Exhibit 1: Global quant Risk Index (QRI): We expect risk‐aversion to sustain in first 4‐6 weeks of Q3 2013
Source: quant Global Research
Exhibit 2: Components of Global quant Risk Index (QRI)
Source: quant Global Research
600
800
1000
1200
1400
1600
1800
Nov‐06
Feb‐07
May
‐07
Aug‐07
Nov‐07
Feb‐08
May
‐08
Aug‐08
Nov‐08
Feb‐09
May
‐09
Aug‐09
Nov‐09
Feb‐10
May
‐10
Aug‐10
Nov‐10
Feb‐11
May
‐11
Aug‐11
Nov‐11
Feb‐12
May
‐12
Aug‐12
Nov‐12
Feb‐13
May
‐13
‐2.5
‐2.0
‐1.5
‐1.0
‐0.5
0.0
0.5
1.0
1.5
2.0
2.5
3.0quant risk index Short Threshold MSCI World (RHS)
Risk‐Loving Zone
Risk‐Averse Zone
All‐t ime Low
2008 CreditCrisis US Downgrade
Euro Sovereign Debt Crisis
Risk‐Neutral Zone
20‐ Jun‐13 13‐Jun‐13 6‐Jun‐13 30‐May‐13 23‐May‐13
quant Risk Index (QRI) Risk Averse Risk Neutra l Risk Neutra l Ri sk Neutra l Risk Neutral
quant Equity Risk Index Risk Averse Risk Averse Risk Neutra l Ri sk Neutra l Risk Neutral
quant Comdty Risk Index Risk Neutral Risk Neutra l Risk Neutra l Ri sk Neutra l Risk Neutral
quant FX Risk Index Risk Averse Risk Averse Risk Neutra l Ri sk Neutra l Risk Neutral
quant Credit Risk Index Risk Neutral Risk Neutra l Risk Neutra l Risk Lovi ng Ri sk Loving
QRI prediction over the
next 4‐6 weeks
June 2013 4
Historically speaking, during the financial crisis of 2008, the QRI rose sharply to 2.8, which reflected an extremely risk‐averse environment around December 2008. Since then, the QRI dropped to the Risk‐Neutral Zone in May 2009 (seen by a rally in the equity markets from an
all‐time equity market low in March 2009). By June 2009, the QRI was in the Risk‐Loving Zone, a period which was followed by a 50‐60% rally in the equity markets.
It only rose to the Risk‐Averse Zone in May 2010 due to the Greek debt crisis. The next time the QRI went to the Risk‐Averse Zone was in August 2011 over the US downgrade and heightened concerns over the Euro zone debt crisis. It went to the Risk‐Averse Zone in May 2012 due to the continued pressure in Europe. After the LTRO and bond‐buying program, the QRI again fell into the Risk‐Loving Zone, where it
stayed till March 2013. Between March 2013 and now, we have seen a sticky build‐up in risk as the QRI has steadily inched upwards towards the Risk‐Averse Zone.
quant Equity Risk Index
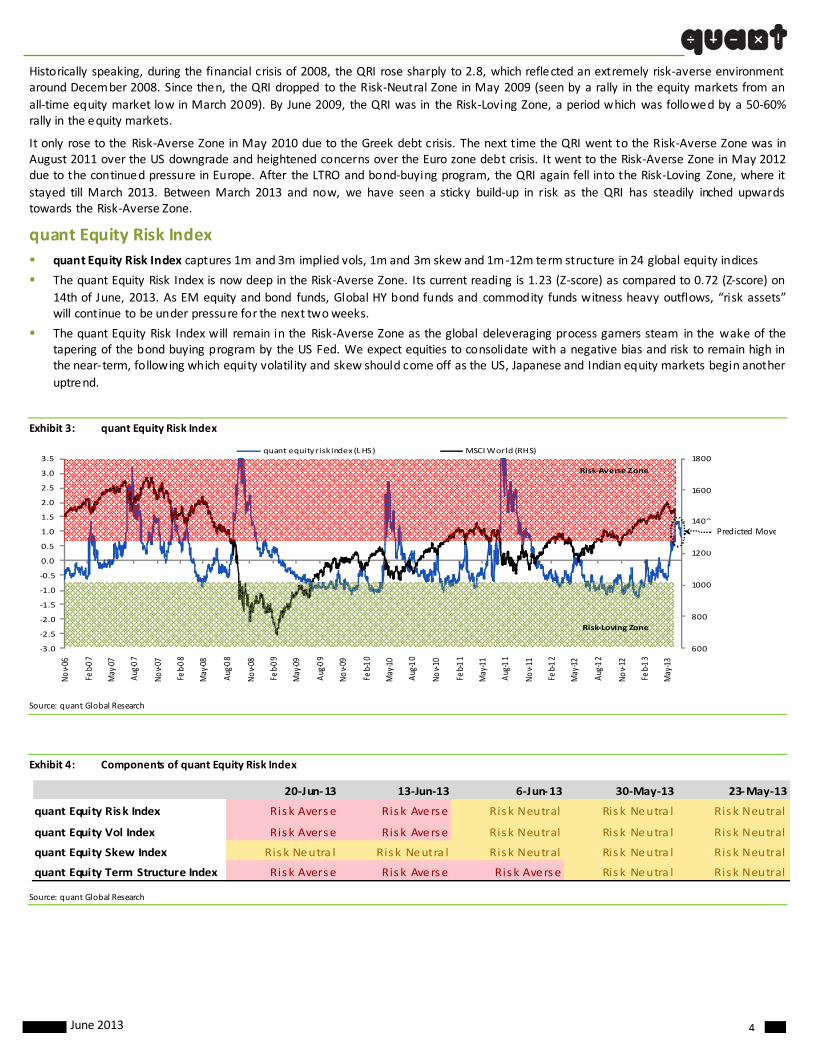
quant Equity Risk Index captures 1m and 3m implied vols, 1m and 3m skew and 1m ‐12m term structure in 24 global equity indices
The quant Equity Risk Index is now deep in the Risk‐Averse Zone. Its current reading is 1.23 (Z‐score) as compared to 0.72 (Z‐score) on
14th of June, 2013. As EM equity and bond funds, Global HY bond funds and commodity funds witness heavy outflows, “risk assets” will continue to be under pressure for the next two weeks.
The quant Equity Risk Index will remain in the Risk‐Averse Zone as the global deleveraging process garners steam in the wake of the tapering of the bond buying program by the US Fed. We expect equities to consolidate with a negative bias and risk to remain high in the near‐term, following which equity volatility and skew should come off as the US, Japanese and Indian equity markets begin another
uptrend.
Exhibit 3: quant Equity Risk Index
Source: quant Global Research
Exhibit 4: Components of quant Equity Risk Index
Source: quant Global Research
600
800
1000
1200
1400
1600
1800
‐3.0
‐2.5
‐2.0
‐1.5
‐1.0
‐0.5
0.0
0.5
1.0
1.5
2.0
2.5
3.0
3.5
Nov‐06
Feb‐07
May
‐07
Aug
‐07
Nov‐07
Feb‐08
May
‐08
Aug
‐08
Nov‐08
Feb‐09
May
‐09
Aug
‐09
Nov‐09
Feb‐10
May
‐10
Aug
‐10
Nov‐10
Feb‐11
May
‐11
Aug
‐11
Nov‐11
Feb‐12
May
‐12
Aug
‐12
Nov‐12
Feb‐13
May
‐13
quant equity risk index (LHS) MSCI World (RHS)
Risk‐Loving Zone
Risk‐Averse Zone
20‐Jun‐13 13‐Jun‐13 6‐Jun‐13 30‐May‐13 23‐May‐13
quant Equity Risk Index Risk Averse Risk Averse Risk Neutral Risk Neutra l Risk Neutral
quant Equity Vol Index Risk Averse Risk Averse Risk Neutral Risk Neutra l Risk Neutral
quant Equity Skew Index Risk Neutra l Risk Neutra l Risk Neutral Risk Neutra l Risk Neutral
quant Equity Term Structure Index Risk Averse Risk Averse Risk Averse Risk Neutra l Risk Neutral
Predicted Move
June 2013 5
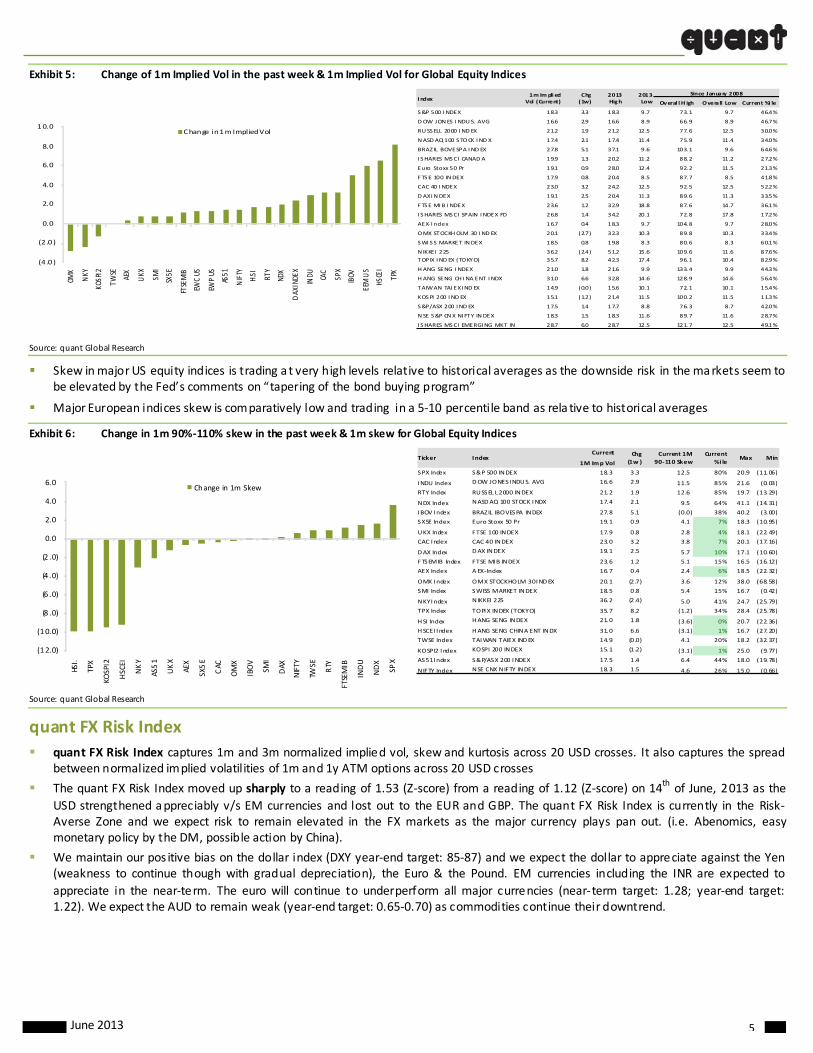
Exhibit 5: Change of 1m Implied Vol in the past week & 1m Implied Vol for Global Equity Indices
Source: quant Global Research
Skew in major US equity indices is trading at very high levels relative to historical averages as the downside risk in the markets seem to be elevated by the Fed’s comments on “tapering of the bond buying program”
Major European indices skew is comparatively low and trading in a 5‐10 percentile band as rela tive to historical averages
Exhibit 6: Change in 1m 90%‐110% skew in the past week & 1m skew for Global Equity Indices
Source: quant Global Research
quant FX Risk Index
quant FX Risk Index captures 1m and 3m normalized implied vol, skew and kurtosis across 20 USD crosses. It also captures the spread between normalized implied volatilities of 1m and 1y ATM options across 20 USD crosses
The quant FX Risk Index moved up sharply to a reading of 1.53 (Z‐score) from a reading of 1.12 (Z‐score) on 14th of June, 2013 as the
USD strengthened appreciably v/s EM currencies and lost out to the EUR and GBP. The quant FX Risk Index is currently in the Risk‐Averse Zone and we expect risk to remain elevated in the FX markets as the major currency plays pan out. (i.e. Abenomics, easy monetary policy by the DM, possible action by China).
We maintain our pos itive bias on the dollar index (DXY year‐end target: 85‐87) and we expect the dollar to appreciate against the Yen (weakness to continue though with gradual depreciation), the Euro & the Pound. EM currencies including the INR are expected to
appreciate in the near‐term. The euro will continue to underperform all major currencies (near‐term target: 1.28; year‐end target: 1.22). We expect the AUD to remain weak (year‐end target: 0.65‐0.70) as commodities continue their downtrend.
Overal l H igh Overall Low Current %i le
S&P 500 I NDEX 18.3 3.3 18.3 9.7 73. 1 9.7 46.4%
DOW JONES I NDUS. AVG 16.6 2.9 16.6 8.9 66. 9 8.9 46.7%
RUSSELL 2000 I ND EX 21.2 1.9 21.2 12.5 77. 6 12.5 30.0%
NASDAQ 100 STOCK I ND X 17.4 2.1 17.4 11.4 75. 9 11.4 34.0%
BRAZ IL BOVESPA I ND EX 27.8 5.1 37.1 9.6 103. 1 9.6 64.6%
I SHARES MSCI CANADA 19.9 1.3 20.2 11.2 88. 2 11.2 27.2%
Euro Stoxx 50 Pr 19.1 0.9 28.0 12.4 92. 2 11.5 21.3%
FTSE 100 INDEX 17.9 0.8 20.4 8.5 87. 7 8.5 41.8%
CAC 40 I NDEX 23.0 3.2 24.2 12.5 92. 5 12.5 52.2%
DAX I NDEX 19.1 2.5 20.4 11.3 89. 6 11.3 33.5%
FTSE MIB I NDEX 23.6 1.2 32.9 18.8 87. 6 14.7 36.1%
I SHARES MSCI SPAIN I NDEX FD 26.8 1.4 34.2 20.1 72. 8 17.8 17.2%
AEX‐ I ndex 16.7 0.4 18.3 9.7 104. 8 9.7 28.0%
OMX STOCKHOLM 30 I ND EX 20.1 (2.7) 32.3 10.3 89. 8 10.3 33.4%
SWI SS MARKET INDEX 18.5 0.8 19.8 8.3 80. 6 8.3 60.1%
N IKKEI 225 36.2 (2.4) 51.2 15.6 109. 6 11.6 87.6%
TOPIX I ND EX (TOKYO) 35.7 8.2 42.3 17.4 96. 1 10.4 82.9%
HANG SENG I NDEX 21.0 1.8 21.6 9.9 133. 4 9.9 44.3%
HANG SENG CH INA ENT I NDX 31.0 6.6 32.8 14.6 128. 9 14.6 56.4%
TAIWAN TAI EX I ND EX 14.9 (0.0) 15.6 10.1 72. 1 10.1 15.4%
KOSPI 200 I ND EX 15.1 (1.2) 21.4 11.5 100. 2 11.5 11.3%
S&P/ASX 200 I ND EX 17.5 1.4 17.7 8.8 76. 3 8.7 42.0%
NSE S&P CNX NI FTY INDEX 18.3 1.5 18.3 11.6 89. 7 11.6 28.7%
I SHARES MSCI EMERGING MKT IN 28.7 6.0 28.7 12.5 121. 7 12.5 49.1%
Since January 2008Index
1m Im pli ed Vol (Current)
Chg (1w)
2013 High
2013 Low
Current
1M Imp Vol
SPX Index S&P 500 INDEX 18.3 3.3 12.5 80% 20.9 (11.06)
INDU Index DOW JONES INDUS. AVG 16.6 2.9 11.5 85% 21.6 (0.03)
RTY Index RUSSEL L 2000 INDEX 21.2 1.9 12.6 85% 19.7 (13.29)
NDX Index NASDAQ 100 STOCK INDX 17.4 2.1 9.5 64% 41.1 (14.31)
IBOV I ndex BRAZIL IBOVESPA INDEX 27.8 5.1 (0.0) 38% 40.2 (3.00)
SX5E Index Euro Stoxx 50 Pr 19.1 0.9 4.1 7% 18.3 (10.95)
UKX Index FTSE 100 INDEX 17.9 0.8 2.8 4% 18.1 (22.49)
CAC I ndex CAC 40 INDEX 23.0 3.2 3.8 7% 20.1 (17.16)
DAX Index DAX INDEX 19.1 2.5 5.7 10% 17.1 (10.60)
FTSEMIB Index FTSE MIB INDEX 23.6 1.2 5.1 15% 16.5 (16.12)
AEX Index A EX‐Index 16.7 0.4 2.4 6% 18.5 (22.32)
OMX I ndex OMX STOCKHOLM 30 INDEX 20.1 (2.7) 3.6 12% 38.0 (68.58)
SMI Index SWISS MARKET INDEX 18.5 0.8 5.4 15% 16.7 (0.42)
NKY I ndex NIKKEI 225 36.2 (2.4) 5.0 41% 24.7 (25.79)
TPX Index TOPIX INDEX (TOKYO) 35.7 8.2 (1.2) 34% 28.4 (25.78)
HSI Index HANG SENG INDEX 21.0 1.8 (3.6) 0% 20.7 (22.36)
HSCEI I ndex HANG SENG CHINA ENT INDX 31.0 6.6 (3.1) 1% 16.7 (27.20)
TWSE Index TAIWAN TAIEX INDEX 14.9 (0.0) 4.1 20% 18.2 (32.37)
KOSPI2 I ndex KOSPI 200 INDEX 15.1 (1.2) (3.1) 1% 25.0 (9.77)
AS51 I ndex S&P/ASX 200 INDEX 17.5 1.4 6.4 44% 18.0 (19.78)
NIFTY Index NSE CNX NIFTY INDEX 18.3 1.5 4.6 26% 15.0 (0.66)
MinTicker IndexChg
(1w )
Current
%i leMax
Current 1M
90‐110 Skew
(4 .0 )
(2 .0 )
0.0
2.0
4.0
6.0
8.0
10.0
OMX
NKY
KOSPI2
TWSE
AEX
UKX SMI
SX5E
FTSEMIB
EWC US
EWP US
AS51
NIFTY
H.SI
RTY
NDX
DAX IN
DEX
INDU CAC
SPX
IBOV
EEM US
HSCEI
TPX
Change in 1m Implied Vol
(12.0)
(10.0)
(8 .0)
(6 .0)
(4 .0)
(2 .0)
0.0
2.0
4.0
6.0
HSI.
TPX
KOSPI2
HSCEI
NKY
AS51
UKX
AEX
SX5E
CAC
OMX
IBOV
SMI
DAX
NIFTY
TWSE
RTY
FTSEMIB
INDU
NDX
SPX
Change in 1m Skew
June 2013 6
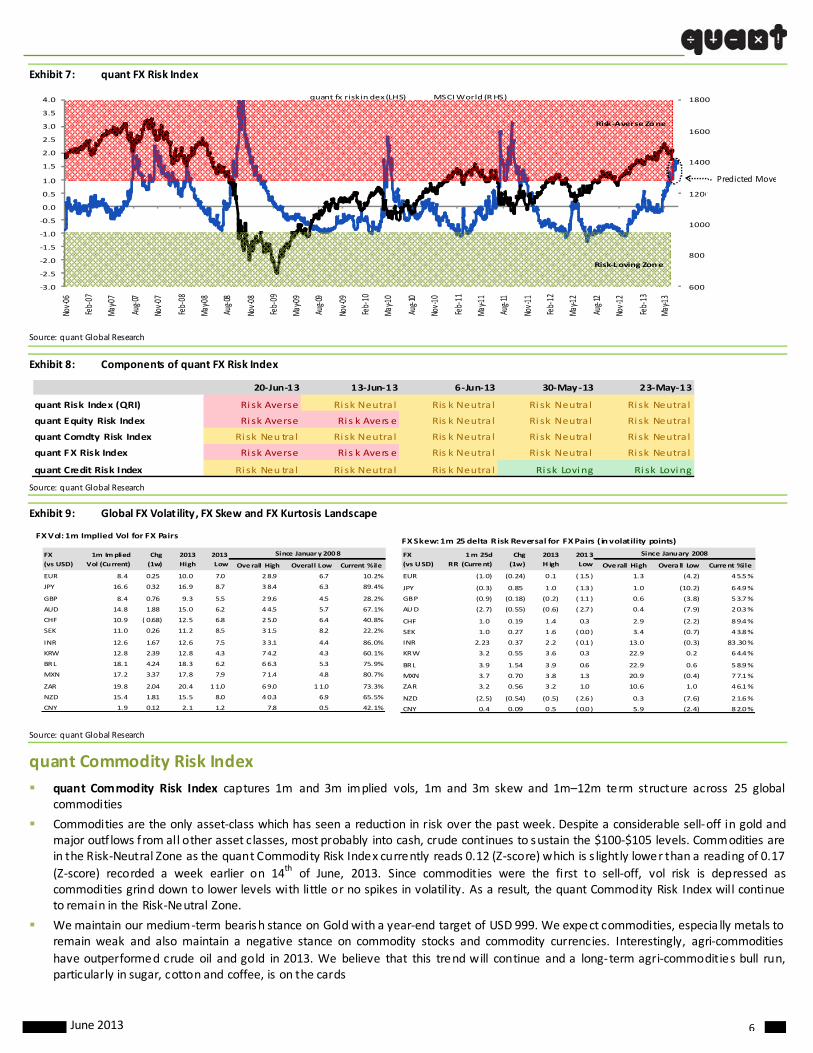
Exhibit 7: quant FX Risk Index
Source: quant Global Research
Exhibit 8: Components of quant FX Risk Index
Source: quant Global Research
Exhibit 9: Global FX Volat ility, FX Skew and FX Kurtosis Landscape
Source: quant Global Research
quant Commodity Risk Index
quant Commodity Risk Index captures 1m and 3m implied vols, 1m and 3m skew and 1m–12m term structure across 25 global commodities
Commodities are the only asset‐class which has seen a reduction in risk over the past week. Despite a considerable sell‐off in gold and major outf lows from all other asset classes, most probably into cash, crude continues to sustain the $100‐$105 levels. Commodities are in the Risk‐Neutral Zone as the quant Commodity Risk Index currently reads 0.12 (Z‐score) which is s lightly lower than a reading of 0.17
(Z‐score) recorded a week earlier on 14th of June, 2013. Since commodities were the first to sell‐off, vol risk is depressed as commodities grind down to lower levels with little or no spikes in volatility. As a result, the quant Commodity Risk Index will continue to remain in the Risk‐Neutral Zone.
We maintain our medium ‐term bearish stance on Gold with a year‐end target of USD 999. We expect commodities, especia lly metals to remain weak and also maintain a negative stance on commodity stocks and commodity currencies. Interestingly, agri‐commodities
have outperformed crude oil and gold in 2013. We believe that this trend will continue and a long‐term agri‐commodities bull run, particularly in sugar, cotton and coffee, is on the cards
600
800
1000
1200
1400
1600
1800
‐3.0
‐2.5
‐2.0
‐1.5
‐1.0
‐0.5
0.0
0.5
1.0
1.5
2.0
2.5
3.0
3.5
4.0
Nov‐06
Feb‐07
May‐07
Aug‐07
Nov‐07
Feb‐08
May‐08
Aug‐08
Nov‐08
Feb‐09
May‐09
Aug‐09
Nov‐09
Feb‐10
May‐10
Aug‐10
Nov‐10
Feb‐11
May‐11
Aug‐11
Nov‐11
Feb‐12
May‐12
Aug‐12
Nov‐12
Feb‐13
May‐13
quant fx risk in dex (LHS) MSCI World (RHS)
Risk‐Loving Zone
Risk‐Averse Zone
20‐Jun‐13 13‐Jun‐13 6‐Jun‐13 30‐May ‐13 23‐May‐13
quant Risk Index (QRI) Ri sk Averse Ri sk Neutra l Ris k Neutra l Ri sk Neutra l Ri sk Neutra l
quant Equity Risk Index Ri sk Averse Ri s k Avers e Ris k Neutra l Ri sk Neutra l Ri sk Neutra l
quant Comdty Risk Index Ri sk Neu tra l Ri sk Neutra l Ris k Neutra l Ri sk Neutra l Ri sk Neutra l
quant FX Risk Index Ri sk Averse Ri s k Avers e Ris k Neutra l Ri sk Neutra l Ri sk Neutra l
quant Credit Risk Index Ri sk Neu tra l Ri sk Neutra l Ris k Neutra l Ri sk Loving Ri sk Loving
FX Vol: 1m Implied Vol for FX Pairs
Ove rall High Overall Low Current %ile
EUR 8.4 0.25 10.0 7.0 28.9 6.7 10.2%
JPY 16.6 0.32 16.9 8.7 38.4 6.3 89.4%
GBP 8.4 0.76 9.3 5.5 29.6 4.5 28.2%
AUD 14.8 1.88 15.0 6.2 44.5 5.7 67.1%
CHF 10.9 ( 0.68) 12.5 6.8 25.0 6.4 40.8%
SEK 11.0 0.26 11.2 8.5 31.5 8.2 22.2%
INR 12.6 1.67 12.6 7.5 33.1 4.4 86.0%
KRW 12.8 2.39 12.8 4.3 74.2 4.3 60.1%
BRL 18.1 4.24 18.3 6.2 66.3 5.3 75.9%
MXN 17.2 3.37 17.8 7.9 71.4 4.8 80.7%
ZAR 19.8 2.04 20.4 11.0 69.0 11.0 73.3%
NZD 15.4 1.81 15.5 8.0 40.3 6.9 65.5%
CNY 1.9 0.12 2.1 1.2 7.8 0.5 42.1%
Since January 2008FX
(vs USD)
1m Implied
Vol (Current)
Chg
(1w)
2013
High
2013
Low
FX Skew: 1m 25 delta Risk Reversal for FX Pairs ( in volatility points)
Overall High Overa ll Low Current %ile
EUR (1.0) (0.24) 0 .1 ( 1.5 ) 1.3 (4.2) 45.5%
JPY (0.3) 0.85 1 .0 ( 1.3 ) 1.0 (10.2) 64.9%
GBP (0.9) (0.18) (0 .2) ( 1.1 ) 0.6 (3.8) 53.7%
AUD (2.7) (0.55) (0 .6) ( 2.7 ) 0.4 (7.9) 20.3%
CHF 1.0 0.19 1 .4 0.3 2.9 (2.2) 89.4%
SEK 1.0 0.27 1 .6 ( 0.0 ) 3.4 (0.7) 43.8%
INR 2.23 0.37 2 .2 ( 0.1 ) 13.0 (0.3) 83 .30%
KRW 3.2 0.55 3 .6 0.3 22.9 0.2 64.4%
BRL 3.9 1.54 3 .9 0.6 22.9 0.6 58.9%
MXN 3.7 0.70 3 .8 1.3 20.9 (0.4) 77.1%
ZAR 3.2 0.56 3 .2 1.0 10.6 1.0 46.1%
NZD (2.5) (0.54) (0 .5) ( 2.6 ) 0.3 (7.6) 21.6%
CNY 0.4 0.09 0 .5 ( 0.0 ) 5.9 (2.4) 82.0%
Since January 2008FX
(vs USD)
1m 25d
RR (Current)
Chg
(1w)
2013
H igh
2013
Low
Predicted Move

June 2013 7
Exhibit 10: quant Commodity Risk Index
Source: quant Global Research
Exhibit 11: Components of quant Commodity Risk Index
Source: quant Global Research
Exhibit 12: Global Commodity Volatility Landscape
Source: quant Global Research
600
800
1000
1200
1400
1600
1800
‐2.0
‐1.5
‐1.0
‐0.5
0.0
0.5
1.0
1.5
2.0
Nov‐06
Feb‐07
May‐07
Aug‐07
Nov‐07
Feb‐08
May‐08
Aug‐08
Nov‐08
Feb‐09
May‐09
Aug‐09
Nov‐09
Feb‐10
May‐10
Aug‐10
Nov‐10
Feb‐11
May‐11
Aug‐11
Nov‐11
Feb‐12
May‐12
Aug‐12
Nov‐12
Feb‐13
May‐13
quan t comdty risk index (LHS) MSCI World (RHS)
Risk‐Loving Zone
Risk‐Averse Zone
20‐Jun‐13 13‐Jun‐13 6‐Jun‐13 30‐May‐13 23‐May‐13
quant Comdty Risk Index Ri sk Neutral Ri sk Neutral Ri sk Neutra l Ri sk Neutra l Ri sk Neutra l
quant Comdty Vol Index Ri sk Neutral Ri sk Neutral Ri sk Neutra l Ri sk Neutra l Ri sk Neutra l
quant Comdty Skew Index Ri sk Neutral Ri sk Averse Ris k Averse Ris k Averse Ris k Averse
quant Comdty Term Structure Index Ri sk Neutral Ri sk Neutral Ris k Averse Ris k Averse Ris k Averse
Oil and Metals 1m Implied Vol
Soft Commodities 1m Implied VolSoft Commodities 1m Implied Vol Change in one week
Oil and Metals 1m Implied Vol Change in one week
Overall
High
Overall
Low
Current
%ile
WTI CRUDE FUTURE Aug13 21.5 3.0 29.4 16.4 100.4 16.4 5.5%
BRENT CRUDE FU TR Aug13 21.9 2.9 27.2 13.6 105.3 13.6 8.1%
GASOLINE RBOB FUT Ju l13 21.9 0.8 28.2 17.3 109.2 17.3 3.7%
NY Ha rb ULSD Fu t Jul13 18.8 1.2 25.5 15.8 79.4 15.8 4.4%
GAS OIL FUT (ICE ) Aug13 17.2 (0 .9) 25.6 14.2 104.4 14.2 2.4%
NATURAL GAS FU TR Ju l13 27.3 (1 .7) 36.7 27.0 160.7 27.0 0.0%
ICE NAT GAS FUT R Ju l13 15.8 (0 .2) 23.5 14.3 46.9 14.3 6.3%
GOLD 100 OZ FUTR Aug13 26.4 8.1 40.3 10.3 63.3 10.3 83.4%
SILVER FUTURE Ju l13 41.4 1 1.4 55.6 18.5 93.1 18.5 76.0%
PLATINUM FUTU RE Jul13 22.0 0.3 26.1 13.9 66.0 13.9 45.6%
PALLADIUM FUTU RE Se p13 31.4 2.0 31.4 17.4 109.5 16.2 54.0%
COPPER FUTURE Se p13 27.4 4.7 27.4 15.6 97.9 15.6 36.4%
Since Ja nuary 20082 013
LowIndex
1m Implied
Vol (Current)
Chg
(1w)
2013
High
(4.0 )
(2.0 )
0.0
2.0
4.0
6.0
8.0
10.0
12.0
14.0
Natural Gas
Gas O
il
Natural Gas (ICE
)
Platinum
Gasolin
e
Heating Oil
Palladium
Bren
t Crude
WTI Crude
Copp
er
Gold
Silver
1m Imp lied Vol Change
(4.0 )
(2.0 )
0.0
2.0
4.0
6.0
8.0
10.0
Cotton
Rough Rice
Coffe
e
Cattle Fe
eder
Lean
Hog
s
Live
Cattle
Cocoa
Soybea
n Oil
Sugar
Soybea
n Mea
l
Soyb
ean
Palm
Oil
Whe
at
Corn
1m Impl ied Vol ChangeOveral l Overal l Current
CORN FUTURE Dec13 36.8 8.9 36.8 17.3 62.1 17.1 55.2%
WHEAT FUTURE(CBT) Sep13 29.1 5.8 30.6 22.1 79.2 19.3 15.4%
SOYBEAN FUTURE Nov13 24.4 2.4 24.7 15.8 61.7 15.8 43.2%
SOYBEAN MEAL FUTR Dec13 30.1 2.0 30.1 21.0 54.6 16.4 60.8%
ROUGH RICE (CBOT) Sep13 17.0 (1.4) 20.7 9.0 63.8 9.0 15.2%
CRUDE PALM OIL FU Sep13 14.3 2.9 70.9 11.3 93.9 11.3 1.7%
SOYBEAN OIL FUTR Dec13 18.0 1.3 21.1 15.8 64.4 15.8 9.3%
COFFEE 'C' FUTURE Sep13 25.0 (1.1) 34.0 20.6 52.3 20.6 6.0%
SUGAR #11 (WORLD ) Oct13 19.1 1.6 24.4 16.0 67.2 16.0 2.6%
COTTON NO.2 FUTR Dec13 21.8 (2.8) 39.3 19.2 82.8 16.7 4.8%
COCOA FUTURE Sep13 22.3 0.4 27.9 19.9 55.4 19.9 3.9%
L IVE CATTLE FUTR Aug13 10.7 (0.1) 13.2 9.3 29.8 9.2 5.6%
CATTLE FEEDER FUT Aug13 10.3 (0.3) 14.1 7.4 27.7 6.4 14.7%
LEAN HOGS FUTURE Aug13 16.8 (0.2) 19.5 8.2 46.3 6.1 21.1%
Sinc e January 2008Index
1m Impli ed
Vol (Current)
Chg
(1w)
2013
High
2013
Low
Predicted Move

June 2013 8
quant Credit Risk Index
quant Credit Risk Index measures the credit risk as priced by sovereign and corporate CDS (and bond spreads)
The perception of credit worthiness is very important for the smooth functioning of the financial markets. As demonstrated by the global financial crisis, any shock to these perceptions can lead to severe stress in the financial systems. We compute the quant credit risk index using normalized 5 yr CDS spreads for Investment Grade (IG) and High Yield (HY) corporates in the US, Europe, EM and Asia and normalized 5 yr CDS spreads of global sovereigns
Credit spreads have finally deteriorated after the 8‐9 month tightening in spreads of global sovereigns, US and European Investment
Grade (IG) and High Y ield (HY) corporates. The quant Credit Risk Index is currently in the Risk‐Neutral Zone for the firs t time since August 2012 with a reading of 0.11 (Z‐score) as compared to ‐0.41 on the 14th of June, 2013 and we expect it to continue in the Risk‐Neutral Zone albeit with a small march to the upper band as yie lds continue to rise in the High Yie ld, MBS and Treasury markets.
Exhibit 13: quant Credit Risk Index
Source: quant Global Research
quant Cross‐Asset Correlation Index
As EM equity and bond funds, Global HY bond funds and commodity funds witness heavy outflows, risk assets continue to be under pressure.
Since March 2013, we are seeing firs t signs of RISK ON behavior as a ll assets (including money market funds) are experiencing outflows (most probably into cash). As a result, cross‐asset correla tions are mirroring asset returns as seen by the graph below.
Exhibit 14: quant Cross‐Asset Correlation Index
Source: quant Global Research
600
800
1000
1200
1400
1600
1800
‐3.0
‐2.5
‐2.0
‐1.5
‐1.0
‐0.5
0.0
0.5
1.0
1.5
2.0
2.5
3.0
3.5
Nov‐06
Feb‐07
May‐07
Aug‐07
Nov‐07
Feb‐08
May‐08
Aug‐08
Nov‐08
Feb‐09
May‐09
Aug‐09
Nov‐09
Feb‐10
May‐10
Aug‐10
Nov‐10
Feb‐11
May‐11
Aug‐11
Nov‐11
Feb‐12
May‐12
Aug‐12
Nov‐12
Feb‐13
May‐13
quant credit risk index (LHS) MSCI World (RHS)
Risk‐Loving Zone
Risk‐Averse Zone
600
800
1000
1200
1400
1600
1800
0.00
0.05
0.10
0.15
0.20
0.25
0.30
Mar‐06
Jun‐06
Sep‐06
Dec‐06
Mar‐07
Jun‐07
Sep‐07
Dec‐07
Mar‐08
Jun‐08
Sep‐08
Dec‐08
Mar‐09
Jun‐09
Sep‐09
Dec‐09
Mar‐10
Jun‐10
Sep‐10
Dec‐10
Mar‐11
Jun‐11
Sep‐11
Dec‐11
Mar‐12
Jun‐12
Sep‐12
Dec‐12
Mar‐13
Jun‐13
quant Cross‐Asset Correlation Index MSCI World (RHS)
Predicted Move
Signs of RISK ON behavior
June 2013 9
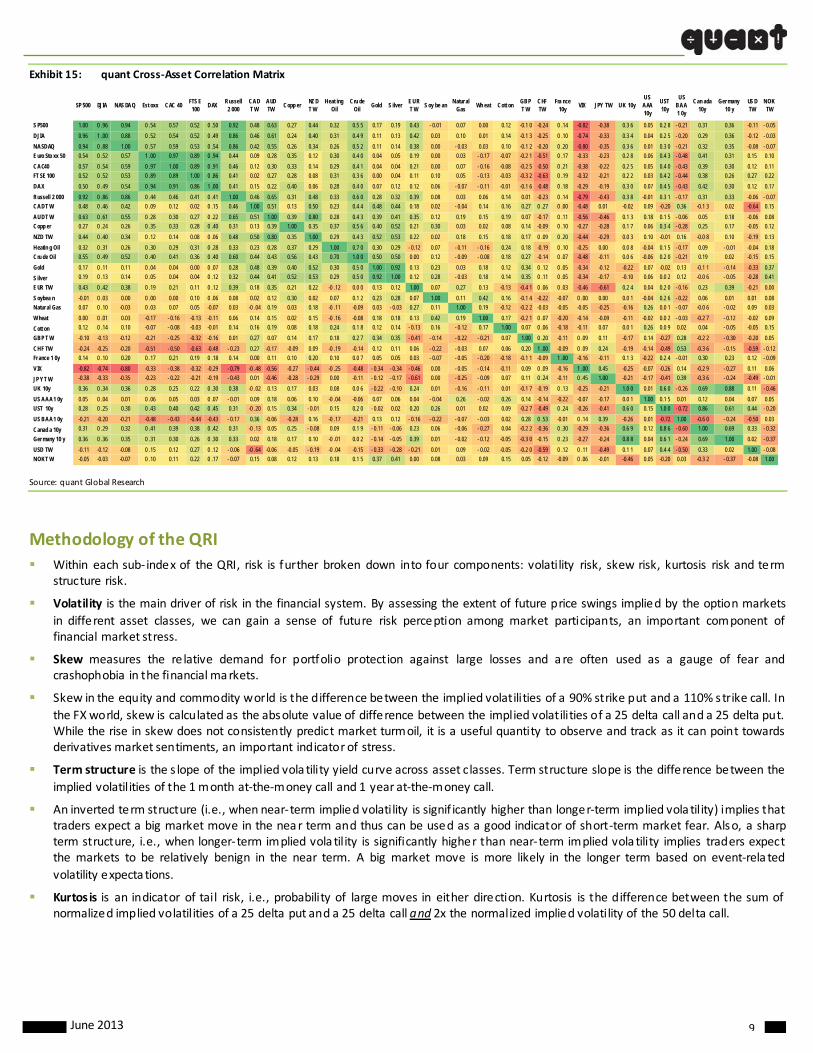
Exhibit 15: quant Cross‐Asset Correlation Matrix
Source: quant Global Research
Methodology of the QRI
Within each sub‐ index of the QRI, risk is further broken down into four components: volatility risk, skew risk, kurtosis risk and term structure risk.
Volatility is the main driver of risk in the financial system. By assessing the extent of future price swings implied by the option markets
in different asset classes, we can gain a sense of future risk perception among market participants, an important component of financial market stress.
Skew measures the re lative demand for portfolio protection against large losses and are often used as a gauge of fear and crashophobia in the financial markets.
Skew in the equity and commodity world is the difference between the implied volatilities of a 90% strike put and a 110% s trike call. In
the FX world, skew is calculated as the absolute value of difference between the implied volatilities of a 25 delta call and a 25 delta put. While the rise in skew does not consistently predict market turmoil, it is a useful quantity to observe and track as it can point towards derivatives market sentiments, an important indicator of stress.
Term structure is the s lope of the implied vola tility yield curve across asset classes. Term structure slope is the difference between the
implied volatilities of the 1 month at‐the‐money call and 1 year at‐the‐money call.
An inverted term structure (i.e., when near‐term implied volatility is signif icantly higher than longer‐term implied vola tility) implies that traders expect a big market move in the near term and thus can be used as a good indicator of short‐term market fear. Also, a sharp term structure, i.e., when longer‐term implied vola tility is significantly higher than near‐term implied vola tility implies traders expect the markets to be relatively benign in the near term. A big market move is more likely in the longer term based on event‐rela ted
volatility expecta tions.
Kurtosis is an indicator of tail risk, i.e., probability of large moves in either direction. Kurtosis is the difference between the sum of normalized implied volatilities of a 25 delta put and a 25 delta call and 2x the normalized implied volatility of the 50 delta call.
SP 500 DJIA NAS DAQ Est oxx CAC 40FTS E 100
DAXRussell 2 000
CAD T W
AUD TW
Copp erNZ D T W
Heat ing Oil
Cru de Oil
Gold S ilverE UR T W
S oy be anNatur al
GasWh eat Cott on
GBP T W
CHF TW
Fra nce 10y
VIX JPY TW UK 10yUS AAA 10y
UST 10y
US BAA 1 0y
Can ada 10y
Ger many 10 y
US D TW
NOK TW
S P500 1.00 0 .96 0.94 0 .54 0.57 0.52 0 .50 0.92 0.48 0.63 0.27 0.44 0.32 0.5 5 0.17 0.19 0.43 - 0.01 0.07 0.00 0.12 -0.1 0 -0.24 0 .14 -0.82 -0.38 0.3 6 0.05 0.2 8 - 0.21 0.31 0.36 -0.11 - 0.05
DJIA 0.96 1 .00 0.88 0 .52 0.54 0.52 0 .49 0.86 0.46 0.61 0.24 0.40 0.31 0.4 9 0.11 0.13 0.42 0.03 0.10 0.01 0.14 -0.1 3 -0.25 0 .10 -0.74 -0.33 0.3 4 0.04 0.2 5 - 0.20 0.29 0.36 -0.12 - 0.03
NASDAQ 0.94 0 .88 1.00 0 .57 0.59 0.53 0 .54 0.86 0.42 0.55 0.26 0.34 0.26 0.5 2 0.11 0.14 0.38 0.00 - 0.03 0.03 0.10 -0.1 2 -0.20 0 .20 -0.80 -0.35 0.3 6 0.01 0.3 0 - 0.21 0.32 0.35 -0.08 - 0.07
E uro Sto xx 50 0.54 0 .52 0.57 1 .00 0.97 0.89 0 .94 0.44 0.09 0.28 0.35 0.12 0.30 0.4 0 0.04 0.05 0.19 0.00 0.03 - 0.17 -0.07 -0.2 1 -0.51 0 .17 -0.33 -0.23 0.2 8 0.06 0.4 3 - 0.48 0.41 0.31 0.15 0.10
CAC40 0.57 0 .54 0.59 0 .97 1.00 0.89 0 .91 0.46 0.12 0.30 0.33 0.14 0.29 0.4 1 0.04 0.04 0.21 0.00 0.07 - 0.16 -0.08 -0.2 5 -0.50 0 .21 -0.38 -0.22 0.2 5 0.05 0.4 0 - 0.43 0.39 0.30 0.12 0.11
FT SE 100 0.52 0 .52 0.53 0 .89 0.89 1.00 0 .86 0.41 0.02 0.27 0.28 0.08 0.31 0.3 6 0.00 0.04 0.11 0.10 0.05 - 0.13 -0.03 -0.3 2 -0.63 0 .19 -0.32 -0.21 0.2 2 0.03 0.4 2 - 0.44 0.38 0.26 0.27 0.22
DAX 0.50 0 .49 0.54 0 .94 0.91 0.86 1 .00 0.41 0.15 0.22 0.40 0.06 0.28 0.4 0 0.07 0.12 0.12 0.06 - 0.07 - 0.11 -0.01 -0.1 6 -0.48 0 .18 -0.29 -0.19 0.3 0 0.07 0.4 5 - 0.43 0.42 0.30 0.12 0.17
Russell 2 000 0.92 0 .86 0.86 0 .44 0.46 0.41 0 .41 1.00 0.46 0.65 0.31 0.48 0.33 0.6 0 0.28 0.32 0.39 0.08 0.03 0.06 0.14 0.01 -0.23 0 .14 -0.79 -0.43 0.3 8 -0.01 0.3 1 - 0.17 0.31 0.33 -0.06 - 0.07
CAD T W 0.48 0 .46 0.42 0 .09 0.12 0.02 0 .15 0.46 1.00 0.51 0.13 0.50 0.23 0.4 4 0.48 0.44 0.18 0.02 - 0.04 0.14 0.16 0.27 0 .27 0 .00 -0.48 0.01 -0.02 0.09 -0.20 0.36 -0.1 3 0.02 -0.64 0.15
AUD T W 0.63 0 .61 0.55 0 .28 0.30 0.27 0 .22 0.65 0.51 1.00 0.39 0.80 0.28 0.4 3 0.39 0.41 0.35 0.12 0.19 0.15 0.19 0.07 -0.17 0 .11 -0.56 -0.46 0.1 3 0.18 0.1 5 - 0.06 0.05 0.18 -0.06 0.08
Copp er 0.27 0 .24 0.26 0 .35 0.33 0.28 0 .40 0.31 0.13 0.39 1.00 0.35 0.37 0.5 6 0.40 0.52 0.21 0.30 0.03 0.02 0.08 0.14 -0.09 0 .10 -0.27 -0.28 0.1 7 0.06 0.3 4 - 0.28 0.25 0.17 -0.05 0.12
NZD TW 0.44 0 .40 0.34 0 .12 0.14 0.08 0 .06 0.48 0.50 0.80 0.35 1.00 0.29 0.4 3 0.52 0.53 0.22 0.02 0.18 0.15 0.18 0.17 0 .09 0 .20 -0.44 -0.29 0.0 3 0.10 -0.01 0.16 -0.0 8 0.10 -0.19 0.13
Heatin g Oil 0.32 0 .31 0.26 0 .30 0.29 0.31 0 .28 0.33 0.23 0.28 0.37 0.29 1.00 0.7 0 0.30 0.29 - 0.12 0.07 - 0.11 - 0.16 0.24 0.18 -0.19 0 .10 -0.25 0.00 0.0 8 -0.04 0.1 5 - 0.17 0.09 - 0.01 -0.04 0.18
Cru de Oil 0.55 0 .49 0.52 0 .40 0.41 0.36 0 .40 0.60 0.44 0.43 0.56 0.43 0.70 1.0 0 0.50 0.50 0.00 0.12 - 0.09 - 0.08 0.18 0.27 -0.14 0 .07 -0.48 -0.11 0.0 6 -0.06 0.2 0 - 0.21 0.19 0.02 -0.15 0.15
Gold 0.17 0 .11 0.11 0 .04 0.04 0.00 0 .07 0.28 0.48 0.39 0.40 0.52 0.30 0.5 0 1.00 0.92 0.13 0.23 0.03 0.18 0.12 0.34 0 .12 0 .05 -0.34 -0.12 -0.22 0.07 -0.02 0.13 -0.1 1 - 0.14 -0.33 0.37
S ilver 0.19 0 .13 0.14 0 .05 0.04 0.04 0 .12 0.32 0.44 0.41 0.52 0.53 0.29 0.5 0 0.92 1.00 0.12 0.28 - 0.03 0.18 0.14 0.35 0 .11 0 .05 -0.34 -0.17 -0.10 0.06 0.0 2 0.12 -0.0 6 - 0.05 -0.28 0.41
E UR TW 0.43 0 .42 0.38 0 .19 0.21 0.11 0 .12 0.39 0.18 0.35 0.21 0.22 -0 .12 0.0 0 0.13 0.12 1.00 0.07 0.27 0.13 -0.13 -0.4 1 0 .06 0 .03 -0.46 -0.61 0.2 4 0.04 0.2 0 - 0.16 0.23 0.39 -0.21 0.00
S oybea n -0.01 0 .03 0.00 0 .00 0.00 0.10 0 .06 0.08 0.02 0.12 0.30 0.02 0.07 0.1 2 0.23 0.28 0.07 1.00 0.11 0.42 0.16 -0.1 4 -0.22 -0.07 0 .00 0.00 0.0 1 -0.04 0.2 6 - 0.22 0.06 0.01 0.01 0.08
Natur al Gas 0.07 0 .10 -0.03 0 .03 0.07 0.05 -0.07 0.03 -0 .04 0.19 0.03 0.18 -0 .11 -0.09 0.03 - 0.03 0.27 0.11 1.00 0.19 -0.12 -0.2 2 -0.03 -0.05 -0.05 -0.25 -0.16 0.26 0.0 1 - 0.07 -0.0 6 - 0.02 0.09 0.03
Wheat 0.00 0 .01 0.03 -0.17 - 0.16 -0.13 -0.11 0.06 0.14 0.15 0.02 0.15 -0 .16 -0.08 0.18 0.18 0.13 0.42 0.19 1.00 0.17 -0.2 1 0 .07 -0.20 -0.14 -0.09 -0.11 -0.02 0.0 2 - 0.03 -0.2 7 - 0.12 -0.02 0.09
Cott on 0.12 0 .14 0.10 -0.07 - 0.08 -0.03 -0.01 0.14 0.16 0.19 0.08 0.18 0.24 0.1 8 0.12 0.14 - 0.13 0.16 - 0.12 0.17 1.00 0.07 0 .06 -0.18 -0.11 0.07 0.0 1 0.26 0.0 9 0.02 0.04 - 0.05 -0.05 0.15
GBP T W -0.10 -0.13 -0.12 -0.21 - 0.25 -0.32 -0.16 0.01 0.27 0.07 0.14 0.17 0.18 0.2 7 0.34 0.35 - 0.41 - 0.14 - 0.22 - 0.21 0.07 1.00 0 .20 -0.11 0 .09 0.11 -0.17 0.14 -0.27 0.28 -0.2 2 - 0.30 -0.20 0.05
CHF TW -0.24 -0.25 -0.20 -0.51 - 0.50 -0.63 -0.48 - 0.23 0.27 -0.17 -0.09 0.09 -0 .19 -0.14 0.12 0.11 0.06 - 0.22 - 0.03 0.07 0.06 0.20 1 .00 -0.09 0 .09 0.24 -0.19 -0.14 -0.49 0.53 -0.3 6 - 0.15 -0.59 - 0.12
Fr ance 1 0y 0.14 0 .10 0.20 0 .17 0.21 0.19 0 .18 0.14 0.00 0.11 0.10 0.20 0.10 0.0 7 0.05 0.05 0.03 - 0.07 - 0.05 - 0.20 -0.18 -0.1 1 -0.09 1 .00 -0.16 -0.11 0.1 3 -0.22 0.2 4 - 0.01 0.30 0.23 0.12 - 0.09
V IX -0.82 -0.74 -0.80 -0.33 - 0.38 -0.32 -0.29 - 0.79 -0 .48 -0.56 -0.27 - 0.44 -0 .25 -0.48 - 0.34 - 0.34 - 0.46 0.00 - 0.05 - 0.14 -0.11 0.09 0 .09 -0.16 1 .00 0.45 -0.25 -0.07 -0.26 0.14 -0.2 9 - 0.27 0.11 0.06
JP Y T W -0.38 -0.33 -0.35 -0.23 - 0.22 -0.21 -0.19 - 0.43 0.01 -0.46 -0.28 - 0.29 0.00 -0.11 - 0.12 - 0.17 - 0.61 0.00 - 0.25 - 0.09 0.07 0.11 0 .24 -0.11 0 .45 1.00 -0.21 -0.17 -0.41 0.39 -0.3 6 - 0.24 -0.49 - 0.01
UK 10y 0.36 0 .34 0.36 0 .28 0.25 0.22 0 .30 0.38 -0 .02 0.13 0.17 0.03 0.08 0.0 6 - 0.22 - 0.10 0.24 0.01 - 0.16 - 0.11 0.01 -0.1 7 -0.19 0 .13 -0.25 -0.21 1.0 0 0.01 0.6 0 - 0.26 0.69 0.88 0.11 - 0.46
US AAA 1 0y 0.05 0 .04 0.01 0 .06 0.05 0.03 0 .07 - 0.01 0.09 0.18 0.06 0.10 -0 .04 -0.06 0.07 0.06 0.04 - 0.04 0.26 - 0.02 0.26 0.14 -0.14 -0.22 -0.07 -0.17 0.0 1 1.00 0.1 5 0.01 0.12 0.04 0.07 0.05
UST 10y 0.28 0 .25 0.30 0 .43 0.40 0.42 0 .45 0.31 -0 .20 0.15 0.34 - 0.01 0.15 0.2 0 - 0.02 0.02 0.20 0.26 0.01 0.02 0.09 -0.2 7 -0.49 0 .24 -0.26 -0.41 0.6 0 0.15 1.0 0 - 0.72 0.86 0.61 0.44 - 0.20
US BAA 1 0y -0.21 -0.20 -0.21 -0.48 - 0.43 -0.44 -0.43 - 0.17 0.36 -0.06 -0.28 0.16 -0 .17 -0.21 0.13 0.12 - 0.16 - 0.22 - 0.07 - 0.03 0.02 0.28 0 .53 -0.01 0 .14 0.39 -0.26 0.01 -0.72 1.00 -0.6 0 - 0.24 -0.50 0.03
Canad a 10y 0.31 0 .29 0.32 0 .41 0.39 0.38 0 .42 0.31 -0 .13 0.05 0.25 - 0.08 0.09 0.1 9 - 0.11 - 0.06 0.23 0.06 - 0.06 - 0.27 0.04 -0.2 2 -0.36 0 .30 -0.29 -0.36 0.6 9 0.12 0.8 6 - 0.60 1.00 0.69 0.33 - 0.32
Ger many 10 y 0.36 0 .36 0.35 0 .31 0.30 0.26 0 .30 0.33 0.02 0.18 0.17 0.10 -0 .01 0.0 2 - 0.14 - 0.05 0.39 0.01 - 0.02 - 0.12 -0.05 -0.3 0 -0.15 0 .23 -0.27 -0.24 0.8 8 0.04 0.6 1 - 0.24 0.69 1.00 0.02 - 0.37
USD TW -0.11 -0.12 -0.08 0 .15 0.12 0.27 0 .12 - 0.06 -0 .64 -0.06 -0.05 - 0.19 -0 .04 -0.15 - 0.33 - 0.28 - 0.21 0.01 0.09 - 0.02 -0.05 -0.2 0 -0.59 0 .12 0 .11 -0.49 0.1 1 0.07 0.4 4 - 0.50 0.33 0.02 1.00 - 0.08
NOK T W -0.05 -0.03 -0.07 0 .10 0.11 0.22 0 .17 - 0.07 0.15 0.08 0.12 0.13 0.18 0.1 5 0.37 0.41 0.00 0.08 0.03 0.09 0.15 0.05 -0.12 -0.09 0 .06 -0.01 -0.46 0.05 -0.20 0.03 -0.3 2 - 0.37 -0.08 1.00
June 2013 10
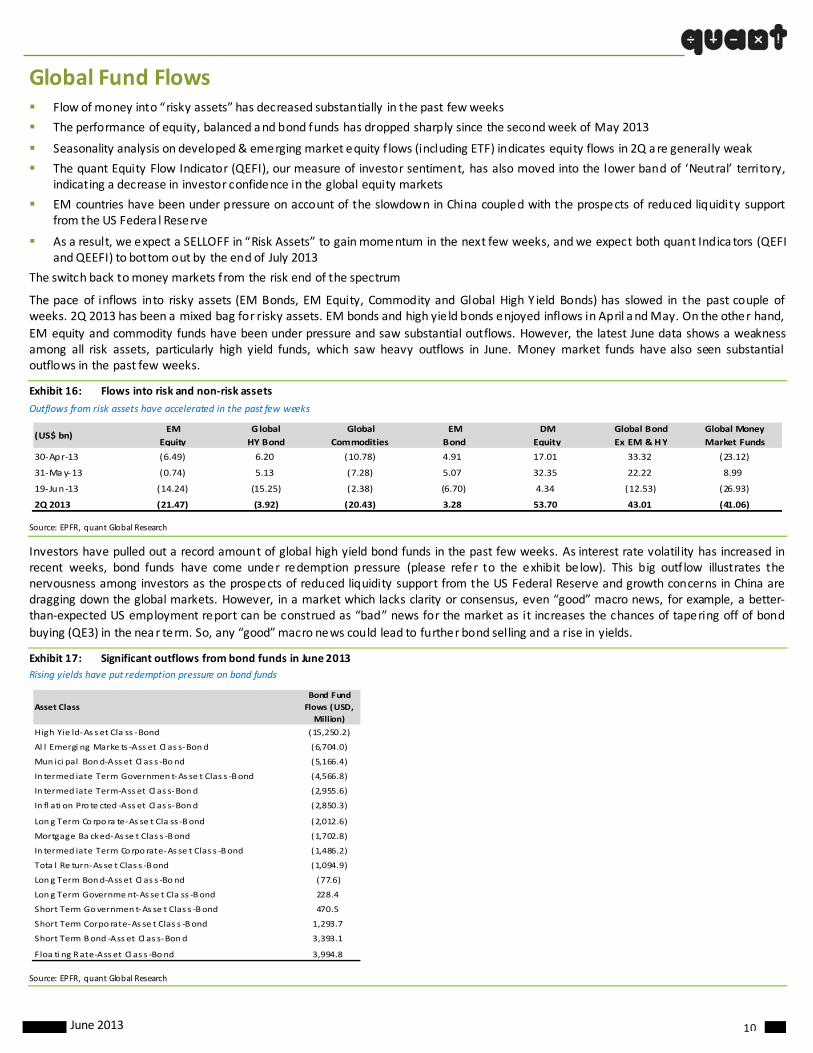
Global Fund Flows Flow of money into “risky assets” has decreased substantially in the past few weeks
The performance of equity, balanced and bond funds has dropped sharply since the second week of May 2013
Seasonality analysis on developed & emerging market equity f lows (including ETF) indicates equity flows in 2Q are generally weak
The quant Equity Flow Indicator (QEFI), our measure of investor sentiment, has also moved into the lower band of ‘Neutral’ territory, indicating a decrease in investor confidence in the global equity markets
EM countries have been under pressure on account of the slowdown in China coupled with the prospects of reduced liquidity support from the US Federa l Reserve
As a result, we expect a SELLOFF in “Risk Assets” to gain momentum in the next few weeks, and we expect both quant Indica tors (QEFI and QEEFI) to bottom out by the end of July 2013
The switch back to money markets from the risk end of the spectrum
The pace of inflows into risky assets (EM Bonds, EM Equity, Commodity and Global High Y ield Bonds) has slowed in the past couple of weeks. 2Q 2013 has been a mixed bag for risky assets. EM bonds and high yie ld bonds enjoyed inflows in April and May. On the other hand,
EM equity and commodity funds have been under pressure and saw substantial outflows. However, the latest June data shows a weakness among all risk assets, particularly high yield funds, which saw heavy outflows in June. Money market funds have also seen substantial outflows in the past few weeks.
Exhibit 16: Flows into risk and non‐risk assets
Outflows from risk assets have accelerated in the past few weeks
Source: EPFR, quant Global Research
Investors have pulled out a record amount of global high yield bond funds in the past few weeks. As interest rate volatility has increased in recent weeks, bond funds have come under redemption pressure (please refer to the exhibit below). This big outf low illustrates the nervousness among investors as the prospects of reduced liquidity support from the US Federal Reserve and growth concerns in China are dragging down the global markets. However, in a market which lacks clarity or consensus, even “good” macro news, for example, a better‐than‐expected US employment report can be construed as “bad” news for the market as it increases the chances of tapering off of bond
buying (QE3) in the near term. So, any “good” macro news could lead to further bond selling and a rise in yields.
Exhibit 17: Significant outflows from bond funds in June 2013
Rising yields have put redemption pressure on bond funds
Source: EPFR, quant Global Research
(US$ bn)EM
Equity
Global
HY Bond
Global
Commodities
EM
Bond
DM
Equity
Global Bond
Ex EM & HY
Global Money
Market Funds
30‐Apr‐13 (6.49) 6.20 (10.78) 4.91 17.01 33.32 (23.12)
31‐May‐13 (0.74) 5.13 (7.28) 5.07 32.35 22.22 8.99
19‐Jun ‐13 (14.24) (15.25) (2.38) (6.70) 4.34 (12.53) (26.93)
2Q 2013 (21.47) (3.92) (20.43) 3.28 53.70 43.01 (41.06)
Asset Class
Bond Fund
Flows (USD,
Million)
High Yie ld‐As s et Cla ss ‐Bond (15,250.2)
Al l Emergi ng Marke ts ‐Ass et Cl as s‐Bond (6,704.0)
Mun ici pal Bond‐Ass et Cl as s ‐Bond (5,166.4)
In termed iate Term Governmen t‐As se t Clas s ‐Bond (4,566.8)
In termed iate Term‐Ass et Cl as s‐Bond (2,955.6)
In fl ati on Pro te cted ‐Ass et Cl as s‐Bond (2,850.3)
Lon g Term Co rpo ra te‐As se t Cla ss ‐Bond (2,012.6)
Mortgage Ba cked‐As se t Clas s ‐Bond (1,702.8)
In termed iate Term Co rpo rate‐As se t Clas s ‐Bond (1,486.2)
Tota l Re turn‐As se t Clas s ‐Bond (1,094.9)
Lon g Term Bond‐Ass et Cl as s ‐Bond (77.6)
Lon g Term Governme nt‐As se t Cla ss ‐Bond 228.4
Short Term Governmen t‐As se t Clas s ‐Bond 470.5
Short Term Corpo rate‐As se t Clas s ‐Bond 1,293.7
Short Term Bond ‐Ass et Cl as s‐Bond 3,393.1
Floa ti ng Rate‐Ass et Cl as s ‐Bond 3,994.8

June 2013 11
The performance of equity, balanced and bond funds has dropped sharply s ince the second week of May 2013. Equity funds NAV has corrected by 2.8% since 8 May whereas bond and balanced funds have corrected by 3% each during the same period. Talks on “tapering
off” of US Fed’s QE program has driven up bond yields and caused s ignificant losses to bond investors.
Exhibit 18: EPFR survey of performance of fund managers in different asset classes
Performance of equity and bond funds has dropped sharply
Source: EPFR, quant Global Research
We think it is important to highlight this turning point as there is some degree of nervousness among bond and equity investors. We are
already seeing a weakness in select emerging markets like Brazil, India, China and Russia, even as investors grapple with concerns of continued l iquidity flows. Emerging market funds, both equities and bonds, are particularly under sharp redemption pressure. In the past four weeks, dedicated EM equity funds have seen outf lows of USD 17.1 billion, with GEM and Asia Ex Japan funds seeing outflows of USD 9.9 billion and USD 5.1 billion, respectively. EM bond funds have also seen outflows of USD 6.9 billion in the past four weeks, a majority of which has come from EM hard currency funds, which saw outflows of USD 4.3 billion. Local currency EM funds also saw outflows of USD 1.9
billion in the past four weeks (please refer to exhibit below).
Exhibit 19: Sizeable outflows from EM equity and EM bond funds
Concerns on a decelerating China economy and the US Federal Reserve’s move to end QE3 has increased redemption pressure on EM equity and bond funds
Source: EPFR, quant Global Research
Our seasonality analysis on developed & emerging market equity f lows (including ETF) indicates that in 2Q, equity flows, in general are weak (please refer to exhibit below). This analysis is based on the past 12 years’ monthly data and shows that equity investors are heavy
buyers of developed & emerging market equities from January to April. The inflows into funds dry up between May and October and again pick up in the last two months of the year.
80
85
90
95
100
105
110
115
120
125
Jan‐11
Jan‐11
Feb‐11
Mar‐11
Mar‐11
Apr‐11
May‐11
Jun‐11
Jun‐11
Jul‐11
Aug‐11
Aug‐11
Sep‐11
Oct‐11
Oct‐11
Nov‐11
Dec‐11
Dec‐11
Jan‐12
Feb‐12
Feb‐12
Mar‐12
Apr‐12
May‐12
May‐12
Jun‐12
Jul‐12
Jul‐12
Aug‐12
Sep‐12
Sep‐12
Oct‐12
Nov‐12
Nov‐12
Dec‐12
Jan‐13
Jan‐13
Feb‐13
Mar‐13
Apr‐13
Apr‐13
May‐13
Jun‐13
All Equity Funds NAV
All Bond Funds NAV
All Balanced Funds NAV
All Alternative Currency Funds NAV
‐0.8
‐0.6
‐0.4
‐0.2
0
0.2
0.4
0.6
0.8
1
Jan‐12
Feb‐12
Mar‐12
Apr‐12
May‐12
Jun‐12
Jul‐12
Aug‐12
Sep‐12
Oct‐12
Nov‐12
Dec‐12
Jan‐13
Feb‐13
Mar‐13
Apr‐13
May‐13
EM Bond Flows %AUM (4WMA) EM Equi ty Flows %AUM (4WMA)
June 2013 12
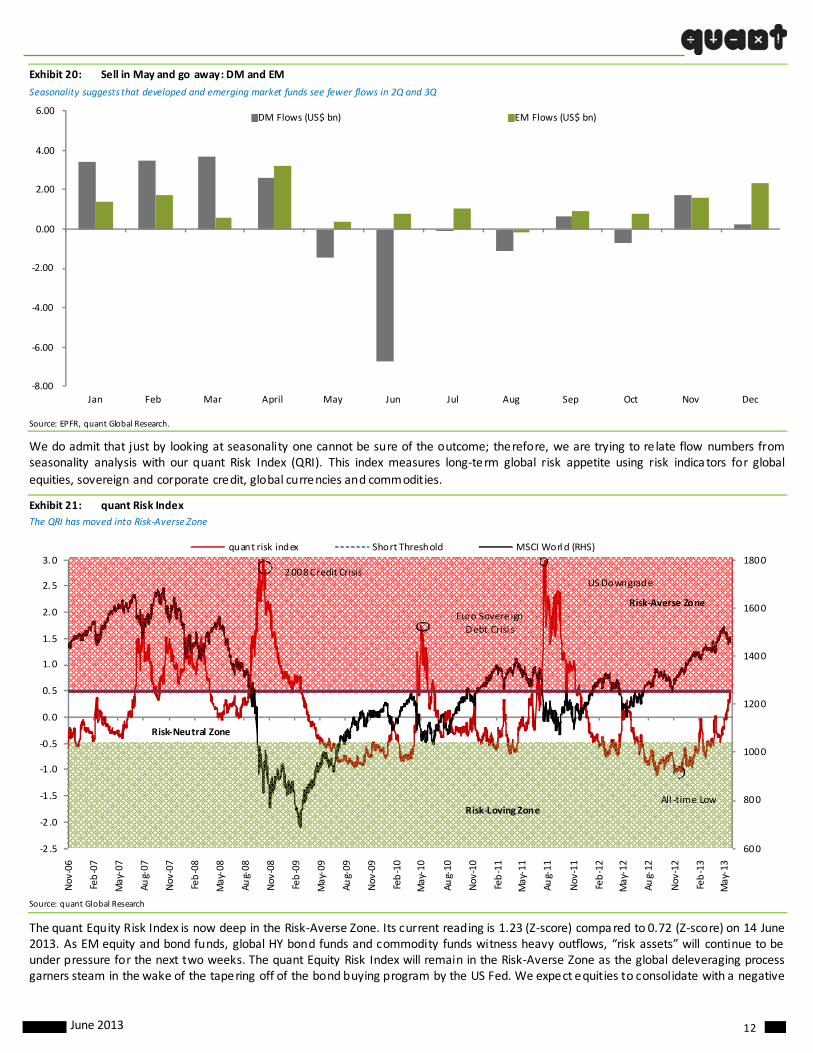
Exhibit 20: Sell in May and go away: DM and EM
Seasonality suggests that developed and emerging market funds see fewer flows in 2Q and 3Q
Source: EPFR, quant Global Research.
We do admit that just by looking at seasonality one cannot be sure of the outcome; therefore, we are trying to re late flow numbers from seasonality analysis with our quant Risk Index (QRI). This index measures long‐term global risk appetite using risk indica tors for global
equities, sovereign and corporate credit, global currencies and commodities.
Exhibit 21: quant Risk Index
The QRI has moved into Risk‐Averse Zone
Source: quant Global Research
The quant Equity Risk Index is now deep in the Risk‐Averse Zone. Its current reading is 1.23 (Z‐score) compared to 0.72 (Z‐score) on 14 June 2013. As EM equity and bond funds, global HY bond funds and commodity funds witness heavy outflows, “risk assets” will continue to be under pressure for the next two weeks. The quant Equity Risk Index will remain in the Risk‐Averse Zone as the global deleveraging process garners steam in the wake of the tapering off of the bond buying program by the US Fed. We expect equities to consolidate with a negative
‐8.00
‐6.00
‐4.00
‐2.00
0.00
2.00
4.00
6.00
Jan Feb Mar April May Jun Jul Aug Sep Oct Nov Dec
DM Flows (US$ bn) EM Flows (US$ bn)
600
800
1000
1200
1400
1600
1800
Nov
‐06
Feb‐07
May‐07
Aug‐07
Nov
‐07
Feb‐08
May‐08
Aug‐08
Nov
‐08
Feb‐09
May‐09
Aug‐09
Nov
‐09
Feb‐10
May‐10
Aug‐10
Nov
‐10
Feb‐11
May‐11
Aug‐11
Nov
‐11
Feb‐12
May‐12
Aug‐12
Nov
‐12
Feb‐13
May‐13
‐2.5
‐2.0
‐1.5
‐1.0
‐0.5
0.0
0.5
1.0
1.5
2.0
2.5
3.0
quant risk index Short Threshold MSCI Worl d (RHS)
Risk‐Loving Zone
Risk‐Averse Zone
All ‐time Low
2008 Credit CrisisUS Downgrade
Euro Sovere ign
Debt Crisi s
Risk‐Neutral Zone
June 2013 13
bias and risk to remain high in the near term, following which equity vols & skew should come off as the US and Japan equity markets begin another uptrend.
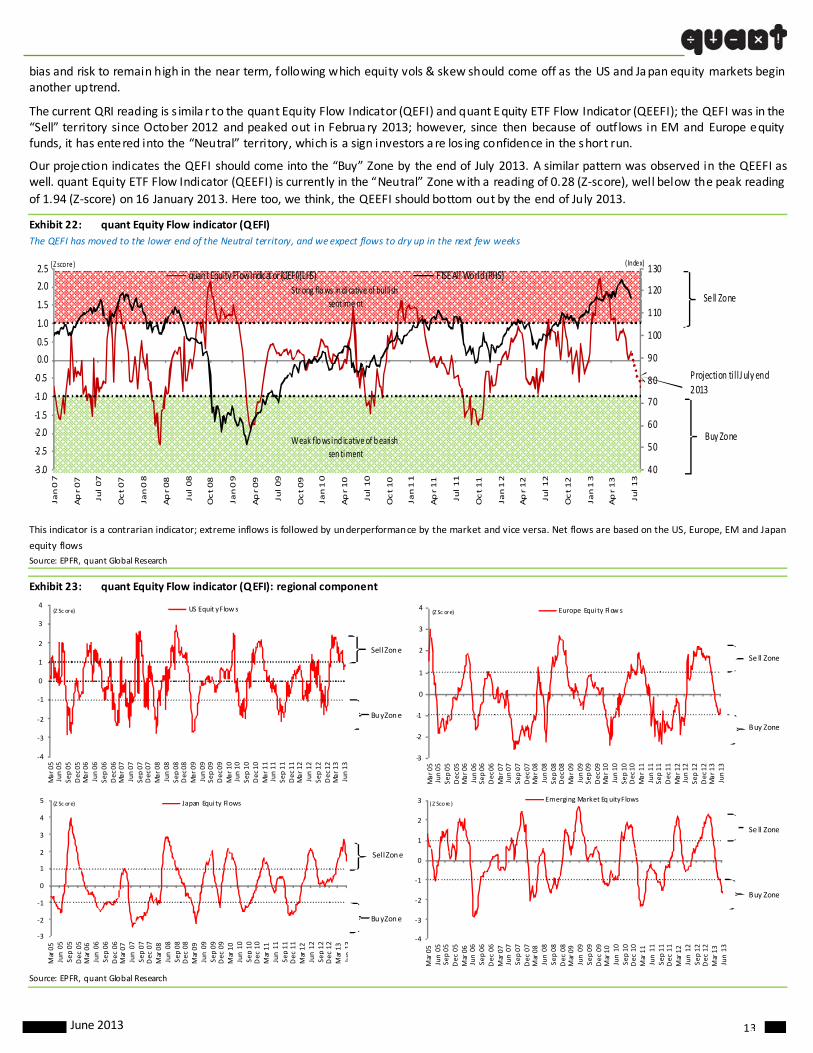
The current QRI reading is s imila r to the quant Equity Flow Indicator (QEFI) and quant Equity ETF Flow Indicator (QEEFI); the QEFI was in the “Sell” territory since October 2012 and peaked out in February 2013; however, since then because of outf lows in EM and Europe equity funds, it has entered into the “Neutral” territory, which is a sign investors are los ing confidence in the short run.
Our projection indicates the QEFI should come into the “Buy” Zone by the end of July 2013. A similar pattern was observed in the QEEFI as well. quant Equity ETF Flow Indicator (QEEFI) is currently in the “Neutral” Zone with a reading of 0.28 (Z‐score), well below the peak reading
of 1.94 (Z‐score) on 16 January 2013. Here too, we think, the QEEFI should bottom out by the end of July 2013.
Exhibit 22: quant Equity Flow indicator (QEFI)
The QEFI has moved to the lower end of the Neutral territory, and we expect flows to dry up in the next few weeks
This indicator is a contrarian indicator; extreme inflows is followed by underperformance by the market and vice versa. Net flows are based on the US, Europe, EM and Japan
equity flows
Source: EPFR, quant Global Research
Exhibit 23: quant Equity Flow indicator (QEFI): regional component
Source: EPFR, quant Global Research
Str ong flows indicative of bul lish sent iment
Weak flows ind icative of bearish sen timent
Sell Zone
Buy Zone
(Z score) ( Index)
40
50
60
70
80
90
100
110
120
130
‐3.0
‐2.5
‐2.0
‐1.5
‐1.0
‐0.5
0.0
0.5
1.0
1.5
2.0
2.5
Jan 07
Apr 07
Jul 07
Oct 07
Jan 08
Apr 08
Jul 08
Oct 08
Jan 09
Apr 09
Jul 09
Oct 09
Jan 10
Apr 10
Jul 10
Oct 10
Jan 11
Apr 11
Jul 11
Oct 11
Jan 12
Apr 12
Jul 12
Oct 12
Jan 13
Apr 13
Jul 13
quant Equity Flow Indicator (QEFI)(LHS) FTSE All World (RHS)
Projection till J uly end
2013
‐4
‐3
‐2
‐1
0
1
2
3
4
Mar 05
Jun 05
Sep 05
Dec 05
Mar 06
Jun 06
Sep 06
Dec 06
Mar 07
Jun 07
Sep 07
Dec 07
Mar 08
Jun 08
Sep 08
Dec 08
Mar 09
Jun 09
Sep 09
Dec 09
Mar 10
Jun 10
Sep 10
Dec 10
Mar 11
Jun 11
Sep 11
Dec 11
Mar 12
Jun 12
Sep 12
Dec 12
Mar 13
Jun 13
US Equit y Flow s
Sel l Zone
Buy Zone
‐3
‐2
‐1
0
1
2
3
4
Mar 05
Jun 05
Sep 05
Dec 05
Mar 06
Jun 06
Sep 06
Dec 06
Mar 07
Jun 07
Sep 07
Dec 07
Mar 08
Jun 08
Sep 08
Dec 08
Mar 09
Jun 09
Sep 09
Dec 09
Mar 10
Jun 10
Sep 10
Dec 10
Mar 11
Jun 11
Sep 11
Dec 11
Mar 12
Jun 12
Sep 12
Dec 12
Mar 13
Jun 13
Europe Equi ty Flow s
‐3
‐2
‐1
0
1
2
3
4
5
Mar 05
Jun 05
Sep 05
Dec 05
Mar 06
Jun 06
Sep 06
Dec 06
Mar 07
Jun 07
Sep 07
Dec 07
Mar 08
Jun 08
Sep 08
Dec 08
Mar 09
Jun 09
Sep 09
Dec 09
Mar 10
Jun 10
Sep 10
Dec 10
Mar 11
Jun 11
Sep 11
Dec 11
Mar 12
Jun 12
Sep 12
Dec 12
Mar 13
Jun13
Japan Equi ty Flows
‐4
‐3
‐2
‐1
0
1
2
3
Mar 05
Jun 05
Sep 05
Dec 05
Mar 06
Jun 06
Sep 06
Dec 06
Mar 07
Jun 07
Sep 07
Dec 07
Mar 08
Jun 08
Sep 08
Dec 08
Mar 09
Jun 09
Sep 09
Dec 09
Mar 10
Jun 10
Sep 10
Dec 10
Mar 11
Jun 11
Sep 11
Dec 11
Mar 12
Jun 12
Sep 12
Dec 12
Mar 13
Jun 13
Emerging Market Eq uity Flows
Se ll Zone
Buy Zone
Sel l Zone
Buy Zone
Se ll Zone
Buy Zone
(Z Sc ore) ( Z Score )
(Z Sc ore) (Z Sc ore)

June 2013 14
Exhibit 24: quant Equity ETF Flow indicator (QEEFI)
The QEEFI has moved to the lower end of the Neutral territory, and we expect flows to dry up in the next few weeks
This indicator is a contrarian indicator, extreme inflows is followed by underperformance by the market and vice versa. Net flows are based on US ,Europe, EM and Japanese
equity flows.
Source: EPFR, quant Global Research
Exhibit 25: quant Equity ETF Flow indicator (QEEFI) : regional component
Source: EPFR, quant Global Research
Once we put the current reading of all indicators into perspective along with the seasonality factor, we expect risk appetite to go down until the middle of 3Q 2013. As we have highlighted earlier, risk aversion has returned as investors ponder an end to QE3 and concerns re‐emerging on China g rowth. The only positive that we saw in this week’s data was heavy inflows of USD 7.0 billion into US equity funds; however, we note EPFR data is until Wednesday close (June 19, 2013) and outflows in the past couple of days would not get reflected until the next week. Therefore, we are of the view this is not necessarily the end of the SELLOFF in both equity and bond markets.
We expect the SELLOFF in “Risk Assets” to gain momentum in the next couple of weeks, and both quant Indicators (QEFI and QEEFI) are expected to bottom out by the end of July 2013.
Str ong flows indicative of bul lish
se ntiment
We ak flows indicative o f bearish sentimen t
Sell Zone
Buy Zone
(Z S core ) (I ndex)
40
50
60
70
80
90
100
110
120
130
‐2.5
‐2.0
‐1.5
‐1.0
‐0.5
0.0
0.5
1.0
1.5
2.0
2.5
3.0
Jan 07
Apr 07
Jul 07
Oct 07
Jan 08
Apr 08
Jul 08
Oct 08
Jan 09
Apr 09
Jul 09
Oct 09
Jan 10
Apr 10
Jul 10
Oct 10
Jan 11
Apr 11
Jul 11
Oct 11
Jan 12
Apr 12
Jul 12
Oct 12
Jan 13
Apr 13
Jul 13
quant Equity ETF Flow In dicator (QEEFI)(LHS) FTSE All World (RHS)
Projection ti ll July end
2013
‐4.0
‐3.0
‐2.0
‐1.0
0.0
1.0
2.0
3.0
4.0
5.0
Feb 05
Jul 05
Dec 05
May 06
Oct 06
Mar 07
Aug 07
Jan 08
Jun 08
Nov 08
Apr 09
Sep 09
Feb 10
Jul 10
Dec 10
May 11
Oct 11
Mar 12
Aug 12
Jan 13
Jun 13
US ETF Flows
‐5.0
‐4.0
‐3.0
‐2.0
‐1.0
0.0
1.0
2.0
3.0
4.0Fe
b 05
Jul 05
Dec 05
May 06
Oct 06
Mar 07
Aug 07
Jan 08
Jun 08
Nov 08
Apr 09
Sep 09
Feb 10
Jul 10
Dec 10
May 11
Oct 11
Mar 12
Aug 12
Jan 13
Jun 13
Europe ETF Flows
‐3 .0
‐2 .0
‐1 .0
0.0
1.0
2.0
3.0
4.0
5.0
Feb 05
Jul 0
5
Dec 05
May 06
Oct 06
Mar 07
Aug 07
Jan 08
Jun 08
Nov 08
Apr 09
Sep 09
Feb 10
Jul 1
0
Dec 10
May 11
Oct 11
Mar 12
Aug 12
Jan 13
Jun 13
Japan ETF Flows
‐4.0
‐3.0
‐2.0
‐1.0
0.0
1.0
2.0
3.0
Feb 05
Jul 05
Dec 05
May 06
Oct 06
Mar 07
Aug 07
Jan 08
Jun 08
Nov 08
Apr 09
Sep 09
Feb 10
Jul 10
Dec 10
May 11
Oct 11
Mar 12
Aug 12
Jan 13
Jun 13
Emergin g Mar ket ETF Flow s
l b l h
Sel l Zone
Buy Zone
Se ll Zone
Buy Zone
Sel l Zone
Buy Zone
Sell Zone
Buy Zone
(Z Score ) ( Z Score )
( Z Score ) ( Z Score )
June 2013 15
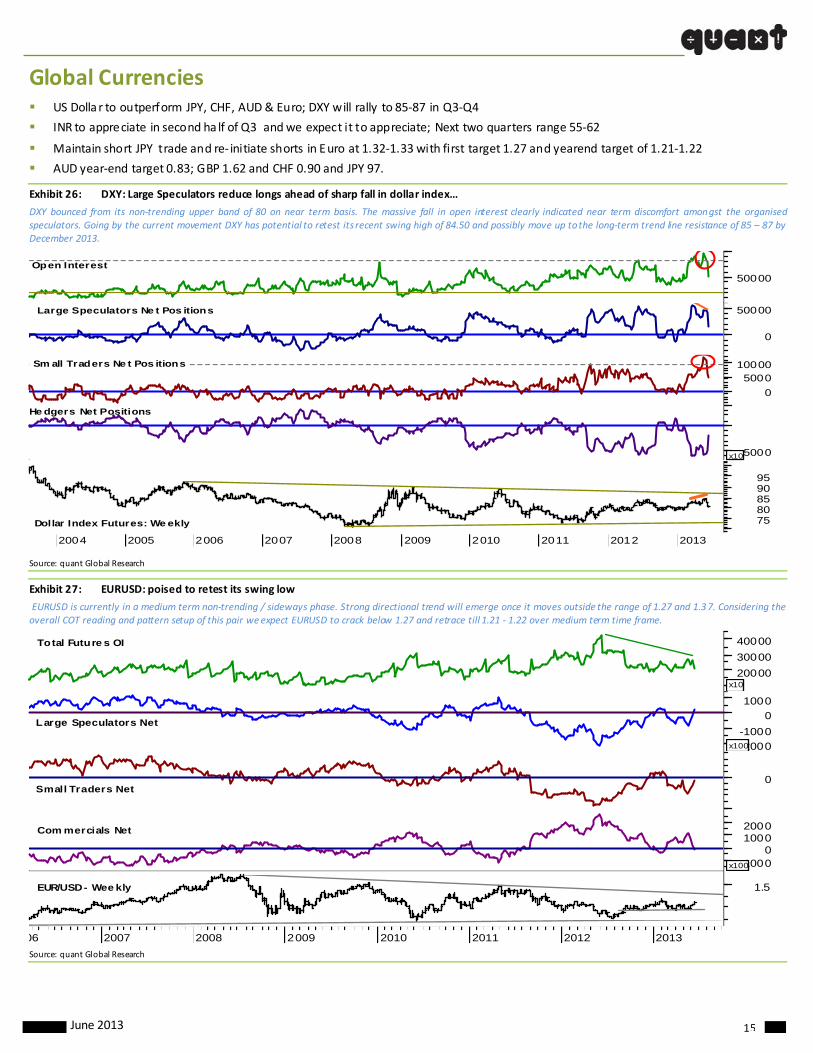
Global Currencies US Dolla r to outperform JPY, CHF, AUD & Euro; DXY will rally to 85‐87 in Q3‐Q4
INR to appreciate in second ha lf of Q3 and we expect it to appreciate; Next two quarters range 55‐62
Maintain short JPY trade and re‐ initiate shorts in Euro at 1.32‐1.33 with first target 1.27 and yearend target of 1.21‐1.22
AUD year‐end target 0.83; GBP 1.62 and CHF 0.90 and JPY 97.
Exhibit 26: DXY: Large Speculators reduce longs ahead of sharp fall in dollar index…
DXY bounced from its non‐trending upper band of 80 on near term basis. The massive fall in open interest clearly indicated near term discomfort amongst the organised speculators. Going by the current movement DXY has potential to retest its recent swing high of 84.50 and possibly move up to the long‐term trend line resistance of 85 – 87 by December 2013.
2004 2005 2006 2007 2008 2009 2010 2011 2012 2013
7580859095
Dollar Index Futures: We ekly
-5000x10
He dgers Net Positions
0
500010000Sm all Traders Ne t Pos itions
0
50000Large Speculators Ne t Pos itions
50000Open Interest
Source: quant Global Research
Exhibit 27: EURUSD: poised to retest its swing low
EURUSD is currently in a medium term non‐trending / sideways phase. Strong directional trend will emerge once it moves outside the range of 1.27 and 1.37. Considering the overall COT reading and pattern setup of this pair we expect EURUSD to crack below 1.27 and retrace till 1.21 ‐ 1.22 over medium term time frame.
06 2007 2008 2009 2010 2011 2012 2013
1.5EUR/USD - Wee kly
-10000
10002000
x100
Com mercials Net
0Small Traders Net
-2000
-1000
0
1000
x100
Large Speculators Net
20000
30000
40000
x10
Total Future s OI
Source: quant Global Research
June 2013 16
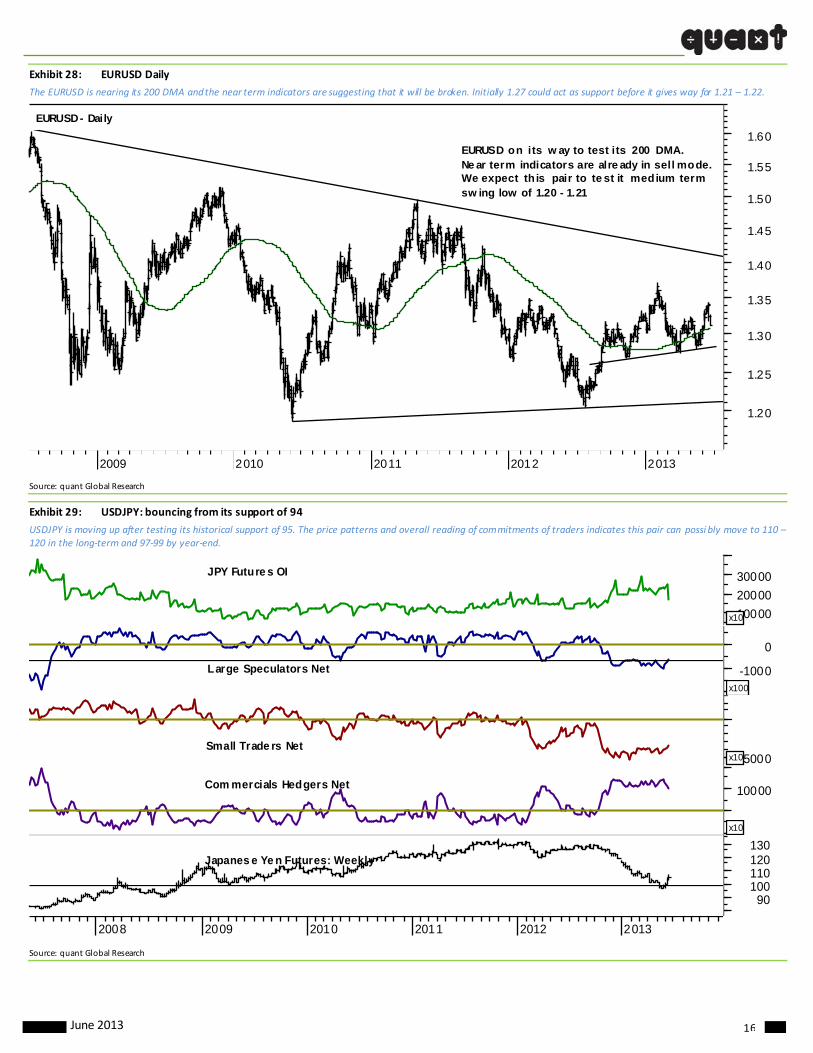
Exhibit 28: EURUSD Daily
The EURUSD is nearing its 200 DMA and the near term indicators are suggesting that it will be broken. Initially 1.27 could act as support before it gives way for 1.21 – 1.22.
2009 2010 2011 2012 2013
1.20
1.25
1.30
1.35
1.40
1.45
1.50
1.55
1.60
EURUSD - Daily
EURUSD on its w ay to test its 200 DMA.Ne ar term indicators are alre ady in sell mode.We expect th is pair to te st it medium term sw ing low of 1.20 - 1.21
Source: quant Global Research
Exhibit 29: USDJPY: bouncing from its support of 94
USDJPY is moving up after testing its historical support of 95. The price patterns and overall reading of commitments of traders indicates this pair can possi bly move to 110 – 120 in the long‐term and 97‐99 by year‐end.
2008 2009 2010 2011 2012 2013
90100110120130
Japanes e Ye n Futures: Weekly
10000
x10
Com mercials Hedgers Net
-5000x10Small Trade rs Net
-1000
0
x100
Large Speculators Net
10000
20000
30000
x10
JPY Future s OI
Source: quant Global Research

June 2013 17
Exhibit 30: AUDUSD Spot
AUDUSD was dumped sharply after prolonged non‐trending phase. It broke its historic support zone of 0.9388 and 0.9582 and likely to halt around 0.91 briefly (38% retracement of 0.60 to 1.11), and subsequently drop to its 50% retracement of 0.85.
8 2009 2010 2011 2012 2013
0.60
0.65
0.70
0.75
0.80
0.85
0.90
0.95
1.00
1.05
1.10
38.2%
50.0%
61.8%
AUDUSD Spot: Weekly
Source: quant Global Research
Exhibit 31: CFTC ‐ AUD
The Large Speculators and Small Traders short position is at its historic high level, indicating their negative bias on this pair. With this currency pair breaking its support zone, it is likely to react till 0.83‐0.85.
2008 2009 2010 2011 2012 2013
60708090
100Australian Dollar Future s: Week ly
-1000-500
0500
x100Com mercial hedgers ne t
0Small traders net
-5000
5000
x10
Large speculators net
5000100001500020000
x10
Total Futures Open Interes t
Source: quant Global Research
June 2013 18
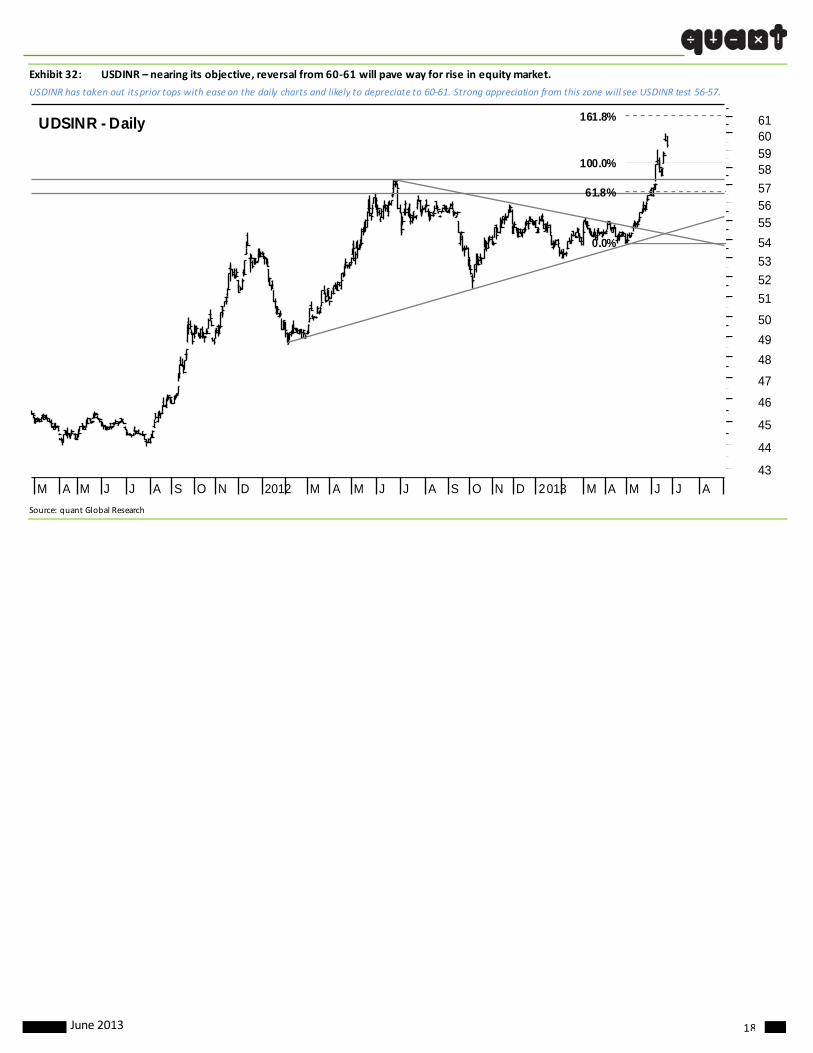
Exhibit 32: USDINR – nearing its objective, reversal from 60‐61 will pave way for rise in equity market.
USDINR has taken out its prior tops with ease on the daily charts and likely to depreciate to 60‐61. Strong appreciation from this zone will see USDINR test 56‐57.
Source: quant Global Research
M A M J J A S O N D 2012 M A M J J A S O N D 2013 M A M J J A
43
44
45
46
47
48
49
50
51
52
53
54
555657
58596061
0.0%
61.8%
100.0%
161.8%UDSINR - Daily

June 2013 19
2013 Currency consensus
Exhibit 33: Consensus G 10 currency outlook Exhibit 34: Consensus Asian currency outlook
Source: Bloomberg, quant Global Research Source: Bloomberg, quant Global Research
Exhibit 35: Consensus EMEA currency outlook Exhibit 36: Consensus Latin America currency outlook
Source: Bloomberg, quant Global Research Source: Bloomberg, quant Global Research
G10 Currencies 2013 Q3 2013 Q4 2014 Q1 2014 Q2
EURUSD 1.28 1.27 1.27 1.27
USDJPY 103 105 106 105
EURJPY 132 133 134 134
GBPUSD 1.51 1.49 1.49 1.52
EURGBP 0.85 0.85 0.84 0.85
USDCHF 0.97 1.00 1.01 1.01
EURCHF 1.24 1.26 1.27 1.27
USDCAD 1.02 1.03 1.03 1.02
AUDUSD 0.96 0.96 0.96 0.96
NZDUSD 0.80 0.80 0.80 0.80
EURDKK 7.45 7.46 7.46 7.46
USDDKK 5.83 5.92 5.92 5.97
EURNOK 7.5 7.45 7.39 7.25
USDNOK 5.84 5.91 5.95 5.95
EURSEK 8.50 8.46 8.40 8.30
USDSEK 6.63 6.69 6.73 6.73
DXY 83.8 85.7 85.9 84.0
Asian Currencies 2013 Q3 2013 Q4 2014 Q1 2014 Q2
USDCNY 6.13 6.1 6.08 6.05
USDHKD 7.76 7.76 7.77 7.76
USDINR 55.25 55 54 55.9
USDIDR 9842 9854 9795 9875
USDMYR 3.06 3.06 3.02 3.07
USDPHP 41.5 41.2 41.0 41.3
USDSGD 1.25 1.25 1.24 1.23
USDKRW 1128 1113 1095 1081
USDTWD 30 29.8 29.5 29.2
USDTHB 30.1 30 30 30.3
USDVND 21000 21000 21000 21000
EMEA Currencies 2013 Q3 2013 Q4 2014 Q1 2014 Q2
EURCZK 26 25.8 25.7 25.5
USDCZK 20.23 20.56 20.5 20.62
EURHUF 297 296 295 295
USDHUF 232 238 238 239
EURPLN 4.21 4.15 4.12 4.07
USDPLN 3.28 3.29 3.29 3.29
EURRUB 41.3 41.12 40.5 40.57
USDRUB 32.05 31.89 31.43 32.00
RUBBASK 35.78 35.48 35.33 35.5
USDTRY 1.85 1.85 1.85 1.85
USDILS 3.68 3.63 3.63 3.6
USDZAR 9.78 9.68 9.5 9.55
Latin America Currencies 2013 Q3 2013 Q4 2014 Q1 2014 Q2
USDARS 5.56 5.85 6.16 6.4
USDBRL 2.05 2.04 2.05 2.08
USDCLP 480 480 493 493
USDCOP 1855 1875 1839 1900
USDMXN 12.28 12.1 12 11.95
USDPEN 2.58 2.57 2.55 2.52
USDVEF 6.3 6.3 7.65 7.8
June 2013 20
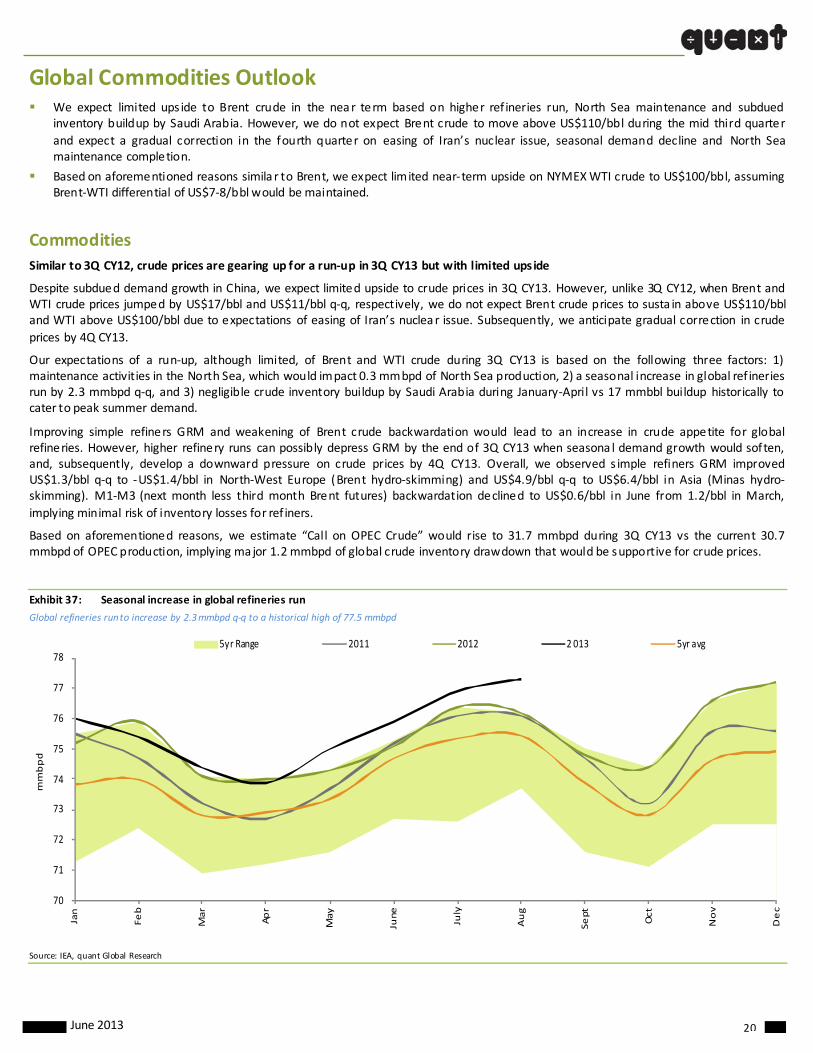
Global Commodities Outlook We expect limited ups ide to Brent crude in the near term based on higher ref ineries run, North Sea maintenance and subdued
inventory buildup by Saudi Arabia. However, we do not expect Brent crude to move above US$110/bbl during the mid third quarter
and expect a gradual correction in the fourth quarter on easing of Iran’s nuclear issue, seasonal demand decline and North Sea maintenance completion.
Based on aforementioned reasons simila r to Brent, we expect limited near‐term upside on NYMEX WTI crude to US$100/bbl, assuming Brent‐WTI differential of US$7‐8/bbl would be maintained.
Commodities
Similar to 3Q CY12, crude prices are gearing up for a run‐up in 3Q CY13 but with limited upside
Despite subdued demand growth in China, we expect limited upside to crude prices in 3Q CY13. However, unlike 3Q CY12, when Brent and WTI crude prices jumped by US$17/bbl and US$11/bbl q‐q, respectively, we do not expect Brent crude prices to susta in above US$110/bbl and WTI above US$100/bbl due to expectations of easing of Iran’s nuclea r issue. Subsequently, we anticipate gradual correction in crude
prices by 4Q CY13.
Our expectations of a run‐up, although limited, of Brent and WTI crude during 3Q CY13 is based on the following three factors: 1) maintenance activities in the North Sea, which would impact 0.3 mmbpd of North Sea production, 2) a seasonal increase in global ref ineries run by 2.3 mmbpd q‐q, and 3) negligible crude inventory buildup by Saudi Arabia during January‐April vs 17 mmbbl buildup historically to cater to peak summer demand.
Improving simple refiners GRM and weakening of Brent crude backwardation would lead to an increase in crude appetite for global refineries. However, higher refinery runs can possibly depress GRM by the end of 3Q CY13 when seasona l demand growth would soften, and, subsequently, develop a downward pressure on crude prices by 4Q CY13. Overall, we observed s imple refiners GRM improved US$1.3/bbl q‐q to ‐US$1.4/bbl in North‐West Europe (Brent hydro‐skimming) and US$4.9/bbl q‐q to US$6.4/bbl in Asia (Minas hydro‐skimming). M1‐M3 (next month less third month Brent futures) backwardation declined to US$0.6/bbl in June from 1.2/bbl in March,
implying minimal risk of inventory losses for ref iners.
Based on aforementioned reasons, we estimate “Call on OPEC Crude” would rise to 31.7 mmbpd during 3Q CY13 vs the current 30.7 mmbpd of OPEC production, implying major 1.2 mmbpd of global crude inventory drawdown that would be supportive for crude prices.
Exhibit 37: Seasonal increase in global refineries run
Global refineries run to increase by 2.3 mmbpd q‐q to a historical high of 77.5 mmbpd
70
71
72
73
74
75
76
77
78
Jan
Feb
Mar
Apr
May
June
July
Aug
Sept
Oct
Nov
Dec
mmbpd
5yr Range 2011 2012 2 013 5yr avg
Source: IEA, quant Global Research

June 2013 21
Exhibit 38: Crude inventory buildup by Saudi Arabia
Negligible crude inventory buildup by Saudi Arabia during January‐April vs 17 mmbbl build historically to cater to peak summer demand
170
190
210
230
250
270
290
Jan
Feb
Mar
Apr
May
June
July
Aug
Sept
Oct
Nov
Dec
mmbbl
5yr range 2011 2012 201 3 5yr average
Source: JODI, quant Global Research
Exhibit 39: Simple refineries GRM and Brent crude backwardation trend
Improving simple refiners GRM and weakening of Brent crude backwardation would lead to the increase in crude appetite for global refineries
0
2
4
6
8
10
12
14
16
18
(4)
(2)
0
2
4
6
8
Jan ‐13 Feb ‐13 Mar‐13 Apr‐13 May‐13 Jun‐13
US$/bbl
US$/bbl
Brent hydroskimming (NWE) Minas hydroskimming (Asia) LLS cracking (US Gulf) (RH S)
(0 .5 )
‐
0.5
1.0
1.5
2.0
2.5
3.0 Jun‐12
Jul‐1
2
Jul‐1
2
Aug‐12
Sep‐12
Sep‐12
Oct‐12
Nov‐12
Nov‐12
Dec‐12
Jan‐13
Jan‐13
Feb‐13
Mar‐13
Apr‐13
Apr‐13
May‐13
Jun‐13
US$
/bbl
Brent M1 ‐M3 price s
Source: Bloomberg, quant Global Research
Exhibit 40: Estimate for “Call on OPEC Crude”
We estimate “Call on OPEC Crude” would increase to 31.7 mmbpd during 3Q CY13 vs the current 30.7 mmbpd of OPEC production
2 9.4
0.6
1.9
(0. 3)
0.3 (0.2 )
31.7
28.0
28.5
29.0
29.5
30.0
30.5
31.0
31.5
32.0
32.5
2Q CY13 Call on OPEC crude
Increase from USA PADD3 refiners
In crease from other gl obal refiners (ex ‐US)
Non‐OPEC crude supply inc rease (ex‐US)
Saudi & Jap an direc t crude burn
OECD stock drawdown 3Q CY13 estimated Call on OPEC crude
mmbp
d
Source: quant Global Research estimates
June 2013 22
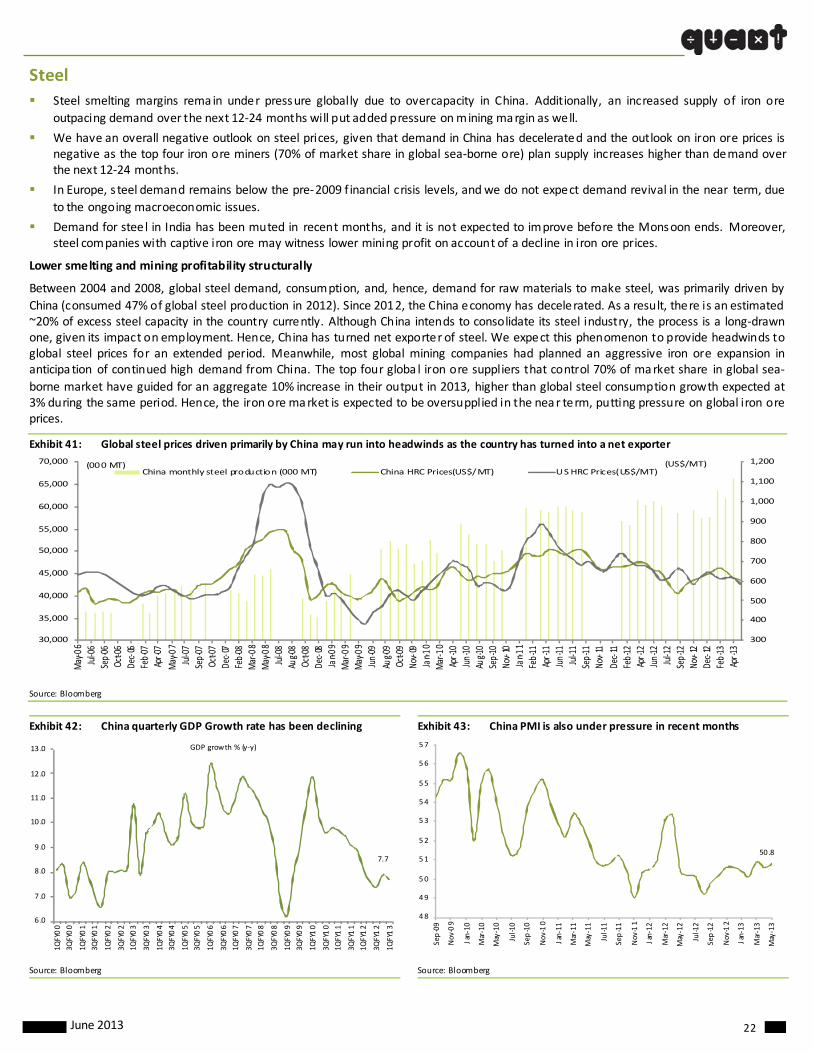
Steel
Steel smelting margins rema in under pressure globally due to overcapacity in China. Additionally, an increased supply of iron ore
outpacing demand over the next 12‐24 months will put added pressure on mining margin as well.
We have an overall negative outlook on steel prices, given that demand in China has decelerated and the outlook on iron ore prices is negative as the top four iron ore miners (70% of market share in global sea‐borne ore) plan supply increases higher than demand over the next 12‐24 months.
In Europe, steel demand remains below the pre‐2009 f inancial crisis levels, and we do not expect demand revival in the near term, due
to the ongoing macroeconomic issues.
Demand for steel in India has been muted in recent months, and it is not expected to improve before the Monsoon ends. Moreover, steel companies with captive iron ore may witness lower mining profit on account of a decline in iron ore prices.
Lower smelting and mining profitability structurally
Between 2004 and 2008, global steel demand, consumption, and, hence, demand for raw materials to make steel, was primarily driven by
China (consumed 47% of global steel production in 2012). Since 2012, the China economy has decelerated. As a result, there is an estimated ~20% of excess steel capacity in the country currently. Although China intends to consolidate its steel industry, the process is a long‐drawn one, given its impact on employment. Hence, China has turned net exporter of steel. We expect this phenomenon to provide headwinds to global steel prices for an extended period. Meanwhile, most global mining companies had planned an aggressive iron ore expansion in anticipa tion of continued high demand from China. The top four globa l iron ore suppliers that control 70% of market share in global sea‐
borne market have guided for an aggregate 10% increase in their output in 2013, higher than global steel consumption growth expected at 3% during the same period. Hence, the iron ore market is expected to be oversupplied in the near term, putting pressure on global iron ore prices.
Exhibit 41: Global steel prices driven primarily by China may run into headwinds as the country has turned into a net exporter
300
400
500
600
700
800
900
1,000
1,100
1,200
30,000
35,000
40,000
45,000
50,000
55,000
60,000
65,000
70,000
May‐06
Jul‐06
Sep‐06
Oct‐06
Dec‐06
Feb‐07
Apr‐0
7
May‐07
Jul‐07
Sep‐07
Oct‐07
Dec‐07
Feb‐08
Mar‐08
May‐08
Jul‐08
Aug‐0
8Oc
t‐08
Dec‐08
Jan‐0
9Mar‐09
May‐09
Jun‐09
Aug‐0
9Oc
t‐09
Nov‐09
Jan‐1
0Mar‐10
Apr‐1
0Jun‐10
Aug‐1
0Sep‐10
Nov‐10
Jan‐ 1
1Feb‐11
Apr‐1
1Jun‐11
Jul‐11
Sep‐11
Nov‐11
Dec‐11
Feb‐12
Apr‐1
2Jun‐12
Jul‐12
Sep‐12
Nov‐12
Dec‐12
Feb‐13
Apr‐1
3
(US$/MT)(000 MT)China monthly steel production (000 MT) China HRC Prices(US$/MT) US HRC Prices(US$/MT)
Source: Bloomberg
Exhibit 42: China quarterly GDP Growth rate has been declining Exhibit 43: China PMI is also under pressure in recent months
7.7
6 .0
7 .0
8 .0
9 .0
10 .0
11 .0
12 .0
13 .0
1QFY00
3QFY00
1QFY01
3QFY01
1QFY02
3QFY02
1QFY03
3QFY03
1QFY04
3QFY04
1QFY05
3QFY05
1QFY06
3QFY06
1QFY07
3QFY07
1QFY08
3QFY08
1QFY09
3QFY09
1QFY10
3QFY10
1QFY11
3QFY11
1QFY12
3QFY12
1QFY13
GDP growth % (y‐y)
50 .8
48
49
50
51
52
53
54
55
56
57
Sep‐09
Nov
‐09
Jan‐10
Mar‐10
May‐10
Jul‐10
Sep‐10
Nov
‐10
Jan‐11
Mar‐11
May‐11
Jul‐11
Sep‐11
Nov
‐11
Jan‐12
Mar‐12
May‐12
Jul‐12
Sep‐12
Nov
‐12
Jan‐13
Mar‐13
May‐13
Source: Bloomberg Source: Bloomberg
June 2013 23
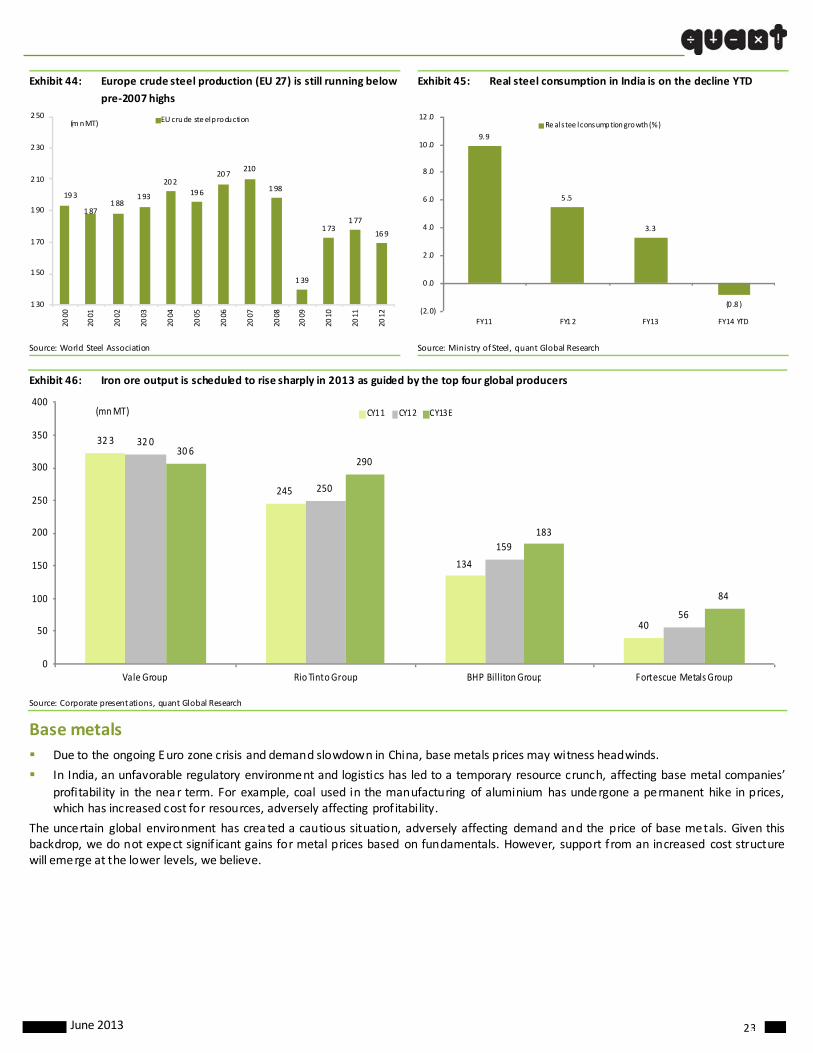
Exhibit 44: Europe crude steel production (EU 27) is still running below
pre‐2007 highs
Exhibit 45: Real steel consumption in India is on the decline YTD
193
187188
193
202
196
207210
198
139
173177
169
130
150
170
190
210
230
250
2000
2001
2002
2003
2004
2005
2006
2007
2008
2009
2010
2011
2012
(m n MT) EU crude steel production
9.9
5 .5
3.3
(0 .8 )(2.0)
0 .0
2 .0
4 .0
6 .0
8 .0
10 .0
12 .0
FY11 FY12 FY13 FY14 YTD
Re al stee l consumption growth (%)
Source: World Steel Association Source: Ministry of Steel, quant Global Research
Exhibit 46: Iron ore output is scheduled to rise sharply in 2013 as guided by the top four global producers
32 3
245
134
40
32 0
250
159
56
30 6290
183
84
0
50
100
150
200
250
300
350
400
Vale Group Rio Tinto Group BHP Billiton Group Fortescue Metals Group
(mn MT) CY11 CY12 CY13E
Source: Corporate presentations, quant Global Research
Base metals
Due to the ongoing Euro zone crisis and demand slowdown in China, base metals prices may witness headwinds.
In India, an unfavorable regulatory environment and logistics has led to a temporary resource crunch, affecting base metal companies’
profitability in the near term. For example, coal used in the manufacturing of aluminium has undergone a permanent hike in prices, which has increased cost for resources, adversely affecting prof itability.
The uncertain global environment has crea ted a cautious situation, adversely affecting demand and the price of base metals. Given this backdrop, we do not expect signif icant gains for metal prices based on fundamentals. However, support from an increased cost structure will emerge at the lower levels, we believe.

June 2013 24
Rogers International Commodity Index (RICI)
The long term broad based breadth indicator quant Composite Sustenance Index (QCSI) fell below its equilibrium even as RICI was
meandering in non‐trending mode. Subsequently, RICI fell sharply as Gold and Silver come under severe selling pressure. There is no s ign of capitula tion so far from the indicator. Therefore we expect commodities to face some more pressure in the near and medium term.
Exhibit 47: RICI
RICI is trading below its rising trendline along with QCSI in negative territory. We expect the selling pressure to persist for medium‐term.
2008 2009 2010 2011 2012 2013
2500
3000
3500
4000
4500
5000
5500
6000RICI - Daily
-10
-5
0
5
10QCSI
Source: quant Global Research
Exhibit 48: Gold Futures on Comex breached their swing lows of US$ 1523 – 1526 and set the ball rolling for a sharp correction. The 38.20%
retracement from its swing low of US$ 681 to 1921 was pierced easily and fell through the 50% retracement of 1300 with ease. Given the strong selling
momentum on medium term basis, Gold could test its 61.80% retracement of US$ 1155 and eventually it could find support around its historical highs
around US$ 999. However, on long term basis the secular trend is still up.
The medium‐term trend is damaged and weak and fresh bout of selling can see it drop to the zone of 999 – 1155.
2001 2002 2003 2004 2005 2006 2007 2008 2009 2010 2011 2012 2013 2014
500
1000
1500
20000.0%
38.2%50.0%
61.8%
100.0%
Gold Comex - Weekly1920.70
681
Strong Selling! Supports takenoff easily
j
1155
999
Long term s ecular trend is still up
Medium term correction taking place
Source: quant Global Research
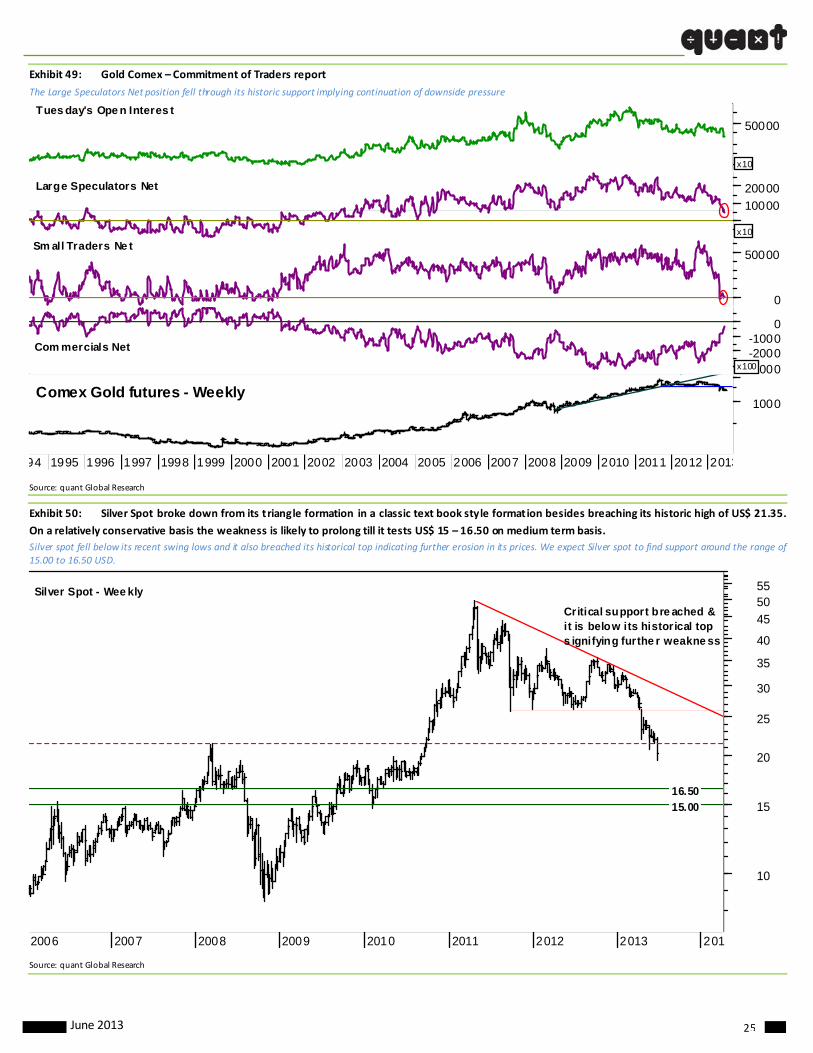
June 2013 25
Exhibit 49: Gold Comex – Commitment of Traders report
The Large Speculators Net position fell through its historic support implying continuation of downside pressure
94 1995 1996 1997 1998 1999 2000 2001 2002 2003 2004 2005 2006 2007 2008 2009 2010 2011 2012 2013
1000Comex Gold futures - Weekly
K -3000-2000-1000
0
x100
Com mercials Net
0
50000Sm all Traders Ne t
10000
20000
x10
Large Speculators Net
50000
x10
Tues day's Ope n Interes t
Source: quant Global Research
Exhibit 50: Silver Spot broke down from its triangle formation in a classic text book style formation besides breaching its historic high of US$ 21.35.
On a relatively conservative basis the weakness is likely to prolong till it tests US$ 15 – 16.50 on medium term basis.
Silver spot fell below its recent swing lows and it also breached its historical top indicating further erosion in its prices. We expect Silver spot to find support around the range of 15.00 to 16.50 USD.
2006 2007 2008 2009 2010 2011 2012 2013 201
10
15
20
25
30
35
40
45
5055Silver Spot - Wee kly
16.50
15.00
Critical support bre ached &it is below its historical tops ignifying furthe r weakne ss
Source: quant Global Research

June 2013 26
Exhibit 51: Gold Comex Futures & Volatility Index
Volatility Index of Gold rose sharply during October 2008 when the Gold Futures hit 681USD. When 1523 was breached decisively, the index shot up from US$ 13.50 to 35 within five trading days.
2009 2010 2011 2012 2013
20
30
40
50
60
70
80
90
700
800
900
1000
1100
1200
1300
1400
1500
1600
1700180019002000
Gold Volatility Inde x
Need to se e a sharp spike similar to the one in 2008 for confirming a bottom...
Gold Com ex Future s - Daily
Source: quant Global Research
Exhibit 52: Gold & Silver
The Gold/Silver Ratio is moving up in the current year as the magnitude of fall in Silver is higher than that of Gold.
2008 2009 2010 2011 2012 2013
10
20
30
40
50
Silver Spot - Daily
1000
1500Gold Futures - Daily
-10
010
20
3040
Gold/Silver Ratio
Silver outperforming Goldj
Gold outperforming Silve rih
Source: quant Global Research
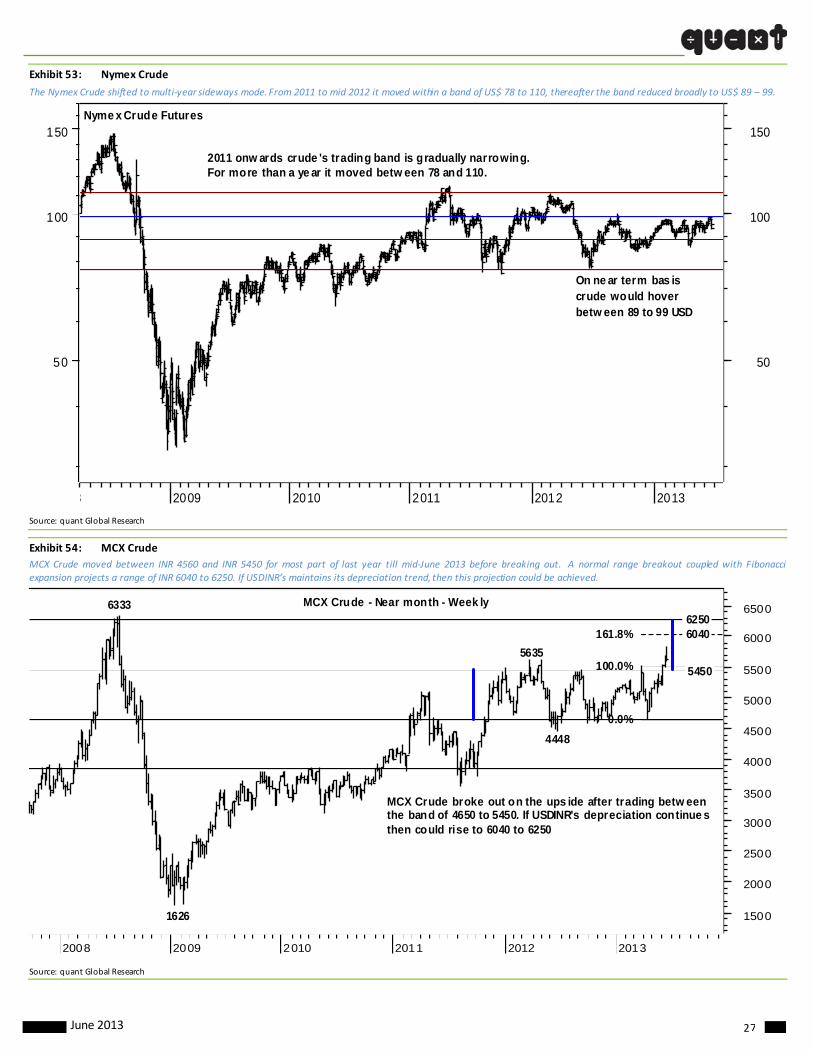
June 2013 27
Exhibit 53: Nymex Crude
The Nymex Crude shifted to multi‐year sideways mode. From 2011 to mid 2012 it moved within a band of US$ 78 to 110, thereafter the band reduced broadly to US$ 89 – 99.
8 2009 2010 2011 2012 2013
50
100
150
50
100
150Nyme x Crude Futures
On ne ar term bas is crude would hoverbetw een 89 to 99 USD
2011 onw ards crude 's trading band is gradually narrowing.For more than a ye ar it moved betw een 78 and 110.
Source: quant Global Research
Exhibit 54: MCX Crude
MCX Crude moved between INR 4560 and INR 5450 for most part of last year till mid‐June 2013 before breaking out. A normal range breakout coupled with Fibonacci expansion projects a range of INR 6040 to 6250. If USDINR’s maintains its depreciation trend, then this projection could be achieved.
2008 2009 2010 2011 2012 2013
1500
2000
2500
3000
3500
4000
4500
5000
5500
6000
6500
0.0%
100.0%
161.8%
6333
1626
5450
60406250
5635
4448
MCX Crude - Near month - Week ly
MCX Crude broke out on the ups ide after trading betw eenthe band of 4650 to 5450. If USDINR's depreciation continue sthen could rise to 6040 to 6250
Source: quant Global Research
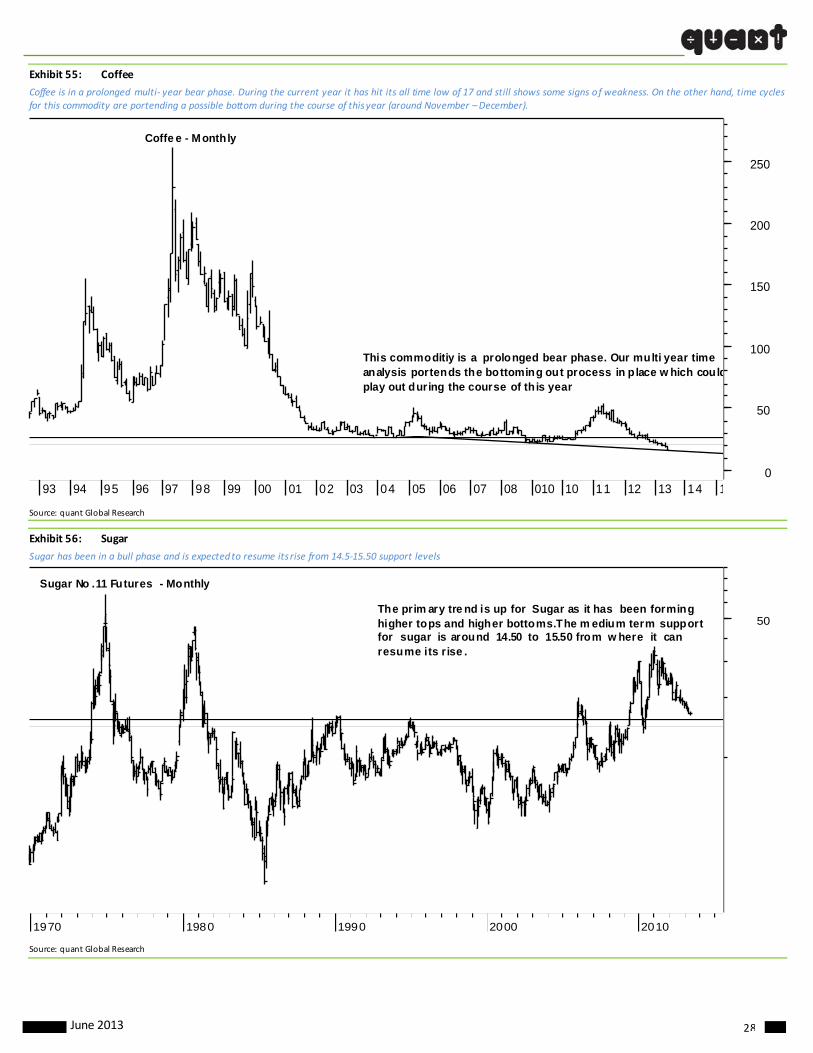
June 2013 28
Exhibit 55: Coffee
Coffee is in a prolonged multi‐ year bear phase. During the current year it has hit its all time low of 17 and still shows some signs of weakness. On the other hand, time cycles for this commodity are portending a possible bottom during the course of this year (around November – December).
93 94 95 96 97 98 99 00 01 02 03 04 05 06 07 08 010 10 11 12 13 14 10
50
100
150
200
250
Coffe e - Monthly
This commoditiy is a prolonged bear phase. Our multi year time analysis portends the bottoming out process in p lace w hich couldplay out during the course of th is year
Source: quant Global Research
Exhibit 56: Sugar
Sugar has been in a bull phase and is expected to resume its rise from 14.5‐15.50 support levels
1970 1980 1990 2000 2010
50
Sugar No .11 Futures - Monthly
The prim ary tre nd is up for Sugar as it has been forming higher tops and higher bottoms.The m edium term support for sugar is around 14.50 to 15.50 from w here it can resume its rise .
Source: quant Global Research
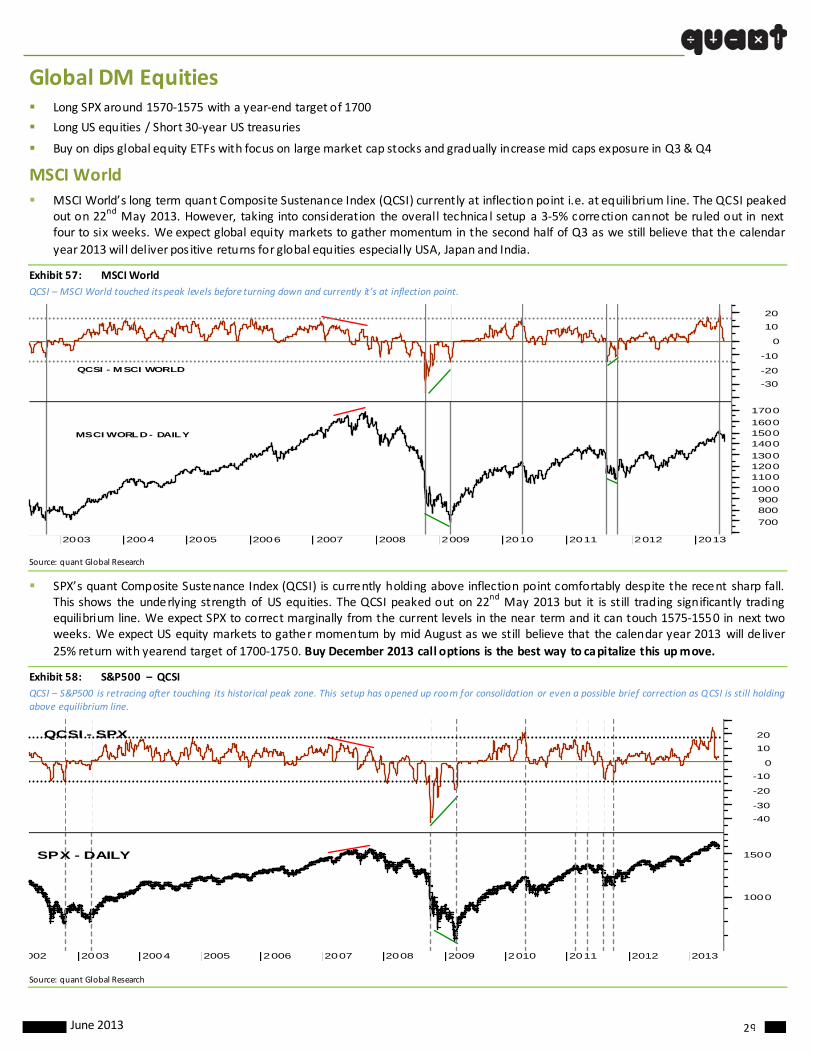
June 2013 29
Global DM Equities Long SPX around 1570‐1575 with a year‐end target of 1700
Long US equities / Short 30‐year US treasuries
Buy on dips global equity ETFs with focus on large market cap stocks and gradually increase mid caps exposure in Q3 & Q4
MSCI World
MSCI World’s long term quant Composite Sustenance Index (QCSI) currently at inflection point i.e. at equilibrium l ine. The QCSI peaked out on 22nd May 2013. However, taking into consideration the overall technica l setup a 3‐5% correction cannot be ruled out in next four to six weeks. We expect global equity markets to gather momentum in the second half of Q3 as we still believe that the calendar
year 2013 will deliver pos itive returns for global equities especially USA, Japan and India.
Exhibit 57: MSCI World
QCSI – MSCI World touched its peak levels before turning down and currently it’s at inflection point.
2003 2004 2005 2006 2007 2008 2009 2010 2011 2012 2013
700
800900
1000
110012001300
140015001600
1700
MSCI WORLD - DAILY
-30
-20
-10
0
10
20
QCSI - MSCI WORLD
Source: quant Global Research
SPX’s quant Composite Sustenance Index (QCSI) is currently holding above inflection point comfortably despite the recent sharp fall. This shows the underlying strength of US equities. The QCSI peaked out on 22nd May 2013 but it is still trading significantly trading equilibrium line. We expect SPX to correct marginally from the current levels in the near term and it can touch 1575‐1550 in next two weeks. We expect US equity markets to gather momentum by mid August as we still believe that the calendar year 2013 will deliver
25% return with yearend target of 1700‐1750. Buy December 2013 call options is the best way to capitalize this up move.
Exhibit 58: S&P500 – QCSI
QCSI – S&P500 is retracing after touching its historical peak zone. This setup has opened up room for consolidation or even a possible brief correction as QCSI is still holding above equilibrium line.
002 2003 2004 2005 2006 2007 2008 2009 2010 2011 2012 2013
1000
1500SPX - DAILY
-40
-30
-20
-10
0
10
20QCSI - SPX
Source: quant Global Research

June 2013 30
Exhibit 59: Dow Jones (DJIA)
QCSI – DJIA in the process of forming negative divergence as indicated on the chart. This is taking place after a prolonged rise. Further, unlike SPX, this index is clearly showing divergence. Such signals are precursors to change in near term trend; in this case it could lead to consolidation / correction. On a positive note the indicator has managed to well above it equilibrium line which denotes that the medium term up trend is maintained.
2006 2007 2008 2009 2010 2011 2012 2013
10000
15000DJIA : Daily
-40
-30
-20
-10
0
10
20
30QCSI - DJIA
Source: quant Global Research
Exhibit 60: NASDAQ 100
QCSI – Nasdaq 100 is reverting after hitting its resistance zone. On near term basis, the index is slipping into a corrective phase. This is relatively weaker as compared to SPX and DJIA.
2007 2008 2009 2010 2011 2012 2013
1000
1500
2000
2500
3000NASDAQ 100 - DAILY
-40-30
-20
-100
1020
QCSI - NDX
Source: quant Global Research

June 2013 31
Exhibit 61: FTSE: quant Composite Sustenance Index (QCSI) for most of the European markets have already broken the equilibrium line, reflects
weakness in the region as compared to US equities. We expect European equities to correct further from the current levels in the near term and one
should wait for some more time for better clarity.
QCSI – FTSE has hit its historical peak and currently below its equilibrium point thereby triggering an intermediate correction. The correction should continue till it manages to move above its equilibrium.
2001 2002 2003 2004 2005 2006 2007 2008 2009 2010 2011 2012 2013
3500
4000
4500
5000
5500
6000
6500
7000FTSE - DAILY
-30-20-10
01020QCSI - FTSE
Source: quant Global Research
Exhibit 62: DAX
The DAX is forming higher tops and higher bottoms signifying the trend is still up as compared to its European counterparts. On the other hand the long term breadth indicator QCSI has formed lower top and slipped below its equilibrium point into the negative territory. This could halt the current rise in near term basis.
02 2003 2004 2005 2006 2007 2008 2009 2010 2011 2012 2013
2000
2500
3000
3500
4000
4500
5000
5500
6000
6500
7000
7500
8000
8500
9000
DAX - DAILY
0
QCSI - DAX
Source: quant Global Research

June 2013 32
Exhibit 63: CAC
2006 2007 2008 2009 2010 2011 2012 2013
2500
3000
3500
4000
4500
5000
5500
6000
CAC - DailyQCSI has hit its his torical peak and curre ntly below its equilibrium point thereby triggering an intermediate correction. The corre ction should continue till it manages to move above its e quilibrium
0
QCSI
Source: quant Global Research
NKY quant Composite Sustenance Index (QCSI) has not broken its equilibrium line despite sharp correction. NIKY was the first market among global equities to peak and we strongly believe trading bottom is in place. However data points suggest that the next up move will be gradual. Weak Yen will support the Japanese market and NKY rema in our top three market picks for 2013.
Exhibit 64: Nikkei
QCSI of NKY nearly tested its major peak before the indicator reverted sharply. It is holding around equilibrium line and we believe that a trading bottom is in place.
2003 2004 2005 2006 2007 2008 2009 2010 2011 2012 2013
10000
15000
NIKKEI 225 -Daily
-100
-50
0
50
100QCSI P P
Source: quant Global Research

June 2013 33
Global EM Equities Indian equities to outperform EM indices; Q3 & Q4 will be better than Q1 & Q2
Hang Seng outperformance continues to Shanghai Composite Indices & CSI 300
Chinese equities to underperform global equities; But still deliver positive returns in 2013
Exhibit 65: MSCI ASIA EX JAPAN
QCSI – MSCI Asia Ex Japan is in the losing its momentum as negative divergence has emerged between the indicator and the index. This indicates some strain for bulls on near term basis.
2008 2009 2010 2011 2012 2013
200
250
300
350
400
450
500
550
600MSCI AC ASIA EX-JAPAN - DAILY
-30-20-10
010
QCSI - MSCI ASIA EX-JAPAN
Source: quant Global Research
Exhibit 66: QCSI – MEXICO BOLSA
Breakdown in QCSI implies near term correction in the secular up trend.
2004 2005 2006 2007 2008 2009 2010 2011 2012 2013
10000
20000
30000
40000
50000
MEXICO BOLSA - DAILY
-30-20-10
01020QCSI - MEXICO BOLSA
Source: quant Global Research
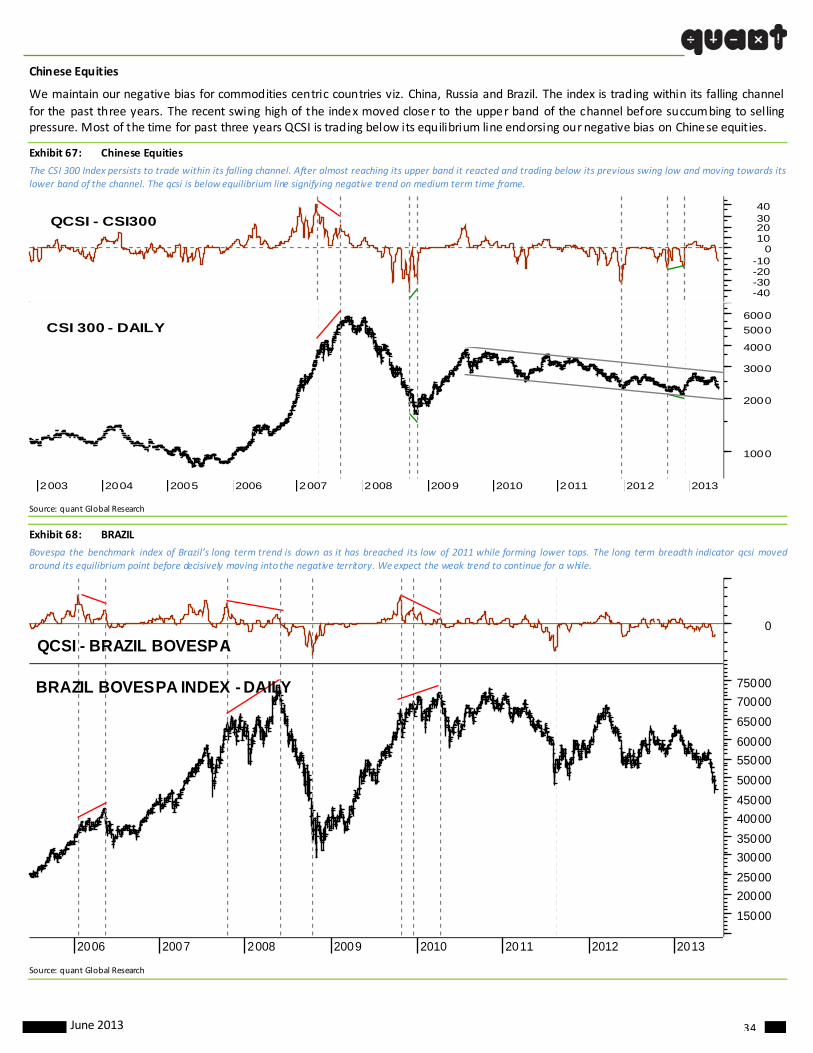
June 2013 34
Chinese Equities
We maintain our negative bias for commodities centric countries viz. China, Russia and Brazil. The index is trading within its falling channel
for the past three years. The recent swing high of the index moved closer to the upper band of the channel before succumbing to selling pressure. Most of the time for past three years QCSI is trading below its equilibrium line endorsing our negative bias on Chinese equities.
Exhibit 67: Chinese Equities
The CSI 300 Index persists to trade within its falling channel. After almost reaching its upper band it reacted and trading below its previous swing low and moving towards its lower band of the channel. The qcsi is below equilibrium line signifying negative trend on medium term time frame.
2003 2004 2005 2006 2007 2008 2009 2010 2011 2012 2013
1000
2000
3000
4000
5000
6000CSI 300 - DAILY
-40-30-20-10
010203040
QCSI - CSI300
Source: quant Global Research
Exhibit 68: BRAZIL
Bovespa the benchmark index of Brazil’s long term trend is down as it has breached its low of 2011 while forming lower tops. The long term breadth indicator qcsi moved around its equilibrium point before decisively moving into the negative territory. We expect the weak trend to continue for a while.
2006 2007 2008 2009 2010 2011 2012 2013
15000
20000
25000
30000
35000
40000
45000
50000
55000
60000
65000
70000
75000BRAZIL BOVESPA INDEX - DAILY
0
QCSI - BRAZIL BOVESPA
Source: quant Global Research

June 2013 35
Global Fixed Income Fed talk on stimulus rollback introduced volatility in bonds; market range to be wider
UST broader range 1.80%‐2.80%, near term 2.20%‐2.45%
US yield curve has signif icantly steepened and we expect further steepening
With 5s30s steepening, we recommend cautious positioning on longer end; treasury roll down recommended
Spread of UST to widen against DE bund, 10yr bund to trade in a broader range of 1.2% to 2%, narrower range at 1.40%‐1.74%
Monetary easing to continue in other DMs; rate policy more reactive to currency movement
Food inflation expected to persis t for EMs and hence aggressive easing ruled out from current levels, currency volatility to also play a
part
India 10yr benchmark yield to rally to 7.20%; recommend duration positioning around 10yr segment
With economies gaining traction, long duration portfolios to see steepening risk
On credit, we remain pos itive on US HY, US IG and EM IG bonds; returns to shrink
We remain underweight on Euro HY debt; modera te economic recovery by end of CY’13
Prefer bullet maturity bonds over callable bonds to avoid extension risk
Developed Markets (DMs) DM yields to be range bound with a bearish bias
Though Inflation not expected to show an uptick before Q4 CY13, long dura tion portfolios could see steepening risk
Continue to be positive on US HY, US IG debt; though intermediate dura tion portfolio recommended; returns to shrink
Prefer bullet maturity bonds over callable bonds to avoid extension risk
Fed surprised markets with its announcement of indication of stimulus rollback. Markets posted their worst monthly performance in May
for the year. The fear of capital loss made investors dump treasuries before the announcement. Other DM market yie lds moved in tandem.
Fed has indicated tha t US economic g rowth is stabilizing with ramp‐up in both housing and job markets. But we see growth remaining sub‐trend and spending cuts a drag. Euro‐zone remains festered in austerity induced recession while EMs led by China still show weak growth impulses. Funding conditions globally are expected to remain easy and may further ease, especially after the recent commodity fall has
suppressed inflation pressures. Fed may, thus, not reverse the QE just as yet. Commitment to l imitless liquidity injection by BOJ and ECB reinforces our g rowth expectations in DMs to remain subpar and infla tion expectations subdued.
The recent OECD report on global economy outlook, with downward revisions to GDP, corroborates our view on weak growth in the near‐ term. It notes that global economy is strengthening gradually, but the upturn remains weak and uneven. It observes that despite central bank stimulus signs of robust recovery are missing, indicating the need to keep easing bias in monetary policy. It warns of serious negative
consequences to US economy if Fed decides on QE exit; saying sharp rises in bonds yields would disrupt asset prices and hurt g rowth. It notes that adverse interactions between weakly capitalized banks, government finances and the real economy remain a significant risk along with US f iscal concerns and lack of medium term consolidation plans in Japan.
United States The chase for yield saw US High yield (HY) market register record issuances this year at USD 184bn as the yield to worst for HY bonds dropped sub 5%‐ helped by surplus liquidity, lowered default risk and volatility. Even in Europe the sales of high‐yield bonds surged to Euro
34.6 billion. Though Cyprus banking crisis had rekindled demand for safe haven assets; a timely ba il‐in and IMF‐EU financial support to Cyprus reversed the rally. However, the recent announcement by Bernanke over QE taper has lent volatility leading to sell‐off. Concerns on Fed reversing the QE have caused fear among total‐return investors who chased credit. The average yield that investors demand to hold high yield bonds has begun to climb as portfolio pos itioning gets defensive. Going forward, the current volatility is expected to subside and investor interests to revive in HY as interest ra tes remain low at least until 2014.
US treasury bonds led the recent selloff as 10yr UST yield moved over 50bps in May, crossing past the 2.15% mark. Market interpreted scaling down as a strong negative. Incrementally, treasury is expected to remain range bound; with 10yr UST yield holding a narrow range of 2.20% ‐ 2.45% in the short term as we continue to expect abundant liquidity and low borrowing costs over CY13 and place the chance of QE rollback this year at minimal. However, the interest rate volatility may remain elevated in the short term with markets keeping a vigil on US economic data, a rider in Fed’s stimulus withdrawal rhetoric. Continual shunning of Treasuries by fore ign investors in favor of riskier
assets might drag the yields higher with 10y r touching 2.40%.
US Investment Grade (IG) returns trimmed in May with drop in Treasuries. However, a stable environment, healthy earnings , conservative balance sheets and abundant l iquidity still retains IG bonds investment attractiveness. Though we believe credit quality has peaked with

June 2013 36
stalling revenue growth for US corporations, it should continue to remain strong due to robust earnings, cash pile and improving fundamentals. Though spreads over UST have only marginally trimmed, the default risks are significantly lower. To get the benefit of total
return while cautiously trading the cyclical tight spread, moving to medium duration (4‐7yrs) bonds is recommended.
US treasury inflation protected securities (TIPS) is expected to deliver no gains in a benign inflation environment. With l ittle reinforcement of QE being infla tionary they would continue to underperform treasuries. Significant excess capacity, fiscal adjustment and stimulus rollback would play against the performance of TIPS.
Euro‐zone
ECB reinforced its ability to act as crisis manager when it successfully prevented contagion out of Cyprus instability earlier this year. When most macro‐data surprised on the downside, it cut the ref inance rate by 25bps and re itera ted preparedness to use non‐standard measures to help restore economic growth. It also fostered urgent formation of banking union and pushed for structural reforms. Its efforts helped reduce risk premiums for peripheral countries with spreads sharply narrowing with German bunds.
Though recent sell off in the long US curve led sovereign bonds yields move slightly higher, we expect the yields to remain low and register
a gradual up move towards end of CY’13. A quarter more of recession, low inf lation, high unemployment, political upheavals and austerity are reasons in support of our view. Household optimism remains squeezed and credit market transmission poor. Weak growth conditions have seen ECB postpone budget deficit targets for peripheral countries.
Benign infla tion gives scope for further easing but looming German parliamenta ry elections in Sep 2013 may prevent further expansionary policy by ECB unless growth weakens substantially. We expect fiscal cutback relaxations, rising purchasing power, banking recapitalization
and greater cooperation and prog ress on bank supervisory to help deliver a mild recovery by end of CY’12. Political uncerta inty and social tension on back of rising unemployment remain the biggest downside risks.
Corporate bond issuances flourished as traditional bank loans remained weak. The Euro HY yield market which had record issuances was severely impacted by Fed’s rollback in stimulus. Though deleveraging continues, slow private consumption, sluggish exports and poor credit availability impacts margins. We remain underweight on Euro‐zone credit.
Exhibit 69: DM 10yr sovereign bond yields have surged on concerns over Feds QE taper
Source: Bloomberg, quant global research
Exhibit 70: Global Inflation moderated further; Brazil, Mexico and Russia bucking the trend
Source: Bloomberg, quant global research
Exhibit 71: DM Central Bank key policy rate: With inflation anchored, the monetary easing is becoming more pandemic
Source: Bloomberg, quant global research
Date US UK JPY Germany Denmark Australia Sweden France Switzerland Netherland Austria
New Zealand Norway Canada
6/18/2013 2.186 2.137 0.831 1.569 1.675 3.394 1.965 2.125 0.774 1.927 1.952 3.742 1.9456 2.159
6/3/2013 2.12 1.991 0.812 1.521 1.614 3.42 1.945 2.086 0.728 1.856 1.917 3.575 1.97 2.049
5/20/2013 1.966 1.915 0.844 1.376 1.509 3.225 1.801 1.877 0.675 1.681 1.714 3.396 2.119 1.918
3/19/2013 1.903 1.829 0.595 1.346 1.537 3.55 1.97 2.004 0.699 1.626 1.663 3.696 2.342 1.817
6/20/2012 1.658 1.769 0.82 1.613 1.469 3.128 1.538 2.673 0.564 2.113 2.334 3.418 2.157 1.782
Change in 10yr
benchmark yield (%) US UK JPY Germany Denmark Australia Sweden France Switzerland Netherland Austria
New Zealand Norway Canada
15 day Chng 6.60% 14.60% 1.90% 4.80% 6.10% ‐2.60% 2.00% 3.90% 4.60% 7.10% 3.50% 16.70% ‐2.44% 11.00%
1 Month Chn 22.00% 22.20% ‐1.30% 19.30% 16.60% 16.90% 16.40% 24.80% 9.90% 24.60% 23.80% 34.60% ‐17.34% 24.10%
3 Month Chn 28.30% 30.80% 23.60% 22.30% 13.80% ‐15.60% ‐0.50% 12.10% 7.50% 30.10% 28.90% 4.60% ‐39.64% 34.20%
1 Year Chng 52.80% 36.80% 1.10% ‐4.40% 20.60% 26.60% 42.70% ‐54.80% 21.00% ‐18.60% ‐38.20% 32.40% ‐21.14% 37.70%
Date US EU Japan UK China India Brazil Russia Thailand Indonesia Philippine South Korea Chile Colombia Mex ico
30‐May‐13 1.4 1.4 ‐0.7 3.1 2.1 4.7 6.5 7.4 2.27 5.47 2.6 1 0.9 2 4.63
30‐Apr ‐13 1.1 1.2 ‐0.9 2.9 2.4 4.89 6.49 7.2 2.42 5.57 2.6 1.2 1 2.02 4.65
31‐Mar‐13 1.5 1.7 ‐0.7 3.3 2.1 5.65 6.59 7 2.69 5.9 3.2 1.3 1.5 1.91 4.25
28‐ Feb‐13 2 1.8 ‐0.3 3.2 3.2 7.28 6.31 7.3 3.23 5.31 3.4 1.4 1.3 1.83 3.55
31‐ Jan‐13 1.6 2 ‐0.1 3.3 2 7.31 6.15 7.1 3.39 4.57 3 1.5 1.58 2 3.25
31‐Dec‐12 1.7 2.2 ‐0.2 3.1 2.5 7.31 5.84 6.6 3.63 4.3 2.9 1.4 1.49 2.44 3.57
30‐Nov‐12 1.8 2.2 ‐0.4 3 2 7.24 5.53 6.5 2.73 4.32 2.8 1.6 2.13 2.77 4.18
31‐Oct‐12 2.2 2.5 ‐0.3 3.2 1.7 7.32 5.45 6.5 3.32 4.61 3.1 2.1 2.92 3.06 4.6
30‐ Sep‐12 2 2.6 ‐0.4 2.6 1.9 8.07 5.28 6.6 3.38 4.31 3.6 2 2.85 3.08 4.77
31‐Aug ‐12 1.7 2.6 ‐0.4 2.9 2 8.01 5.24 5.9 2.69 4.58 3.8 1.2 2.57 3.11 4.57
Time Period Japan US UK ECB Canada AustraliaNew Zealand Sweden Norway Poland Denmark Hungary Israel Korea
Current 0.1 0.25 0.5 0.5 1 2.75 2.5 1 1.5 3 0.2 4.5 1.25 2.5
3m pri or 0.1 0.25 0.5 0.75 1 3 2.5 1 1.5 3.25 0.3 5.25 1.75 2.75
6m pri or 0.1 0.25 0.5 0.75 1 3.25 2.5 1.25 1.5 4.25 0.2 6 2 2.75
12m prio r 0.1 0.25 0.5 0.75 1 3.75 2.5 1.5 1.5 4.75 0.6 7 2.5 3.25

June 2013 37
Exhibit 72: Search of yield over last 6 months led HY YTW drop sub 5%;
IG YTM remained relatively flat; recent sharp spike
Exhibit 73: AUM in HY ETF has remained flat ; ST(<4yrs) launched last yr
saw steady surge
Source: Bloomberg Source: Bloomberg
Exhibit 74: US HY Corp issuances are at a historical YTD maximum Exhibit 75: In last 1 year US HY ETF has generated 4.5% excess return
over US IG ETF prio r to Fed rollback annoucement
Source: sifma Source: Reuters
Exhibit 76: US Corporate Profits are hitting the plateau
Exhibit 77: Recent Fed tapering talks and Inflation bottoming expecta‐
tions narrowing the spreads between 10yr UST and TIPS
Source: Bloomberg Source: Bloomberg
4.5
5
5.5
6
6.5
7
7.5
8
8.5
3.5
3.6
3.7
3.8
3.9
4
4.1
4.2
4.3
4.4
4.5
22‐May‐12
12‐Jun
‐12
3‐Jul‐12
24‐Jul‐12
14‐Au
g‐12
4‐Sep‐12
25‐Sep‐12
16‐Oct‐12
6‐Nov‐12
27‐Nov‐12
18‐Dec‐12
8‐Jan‐13
29‐Jan‐13
19‐Feb‐13
12‐M
ar‐13
2‐Apr‐13
23‐Apr‐13
14‐May‐13
4‐Jun
‐13
Jeffer ies IG YTM ‐LHS Bar clays High Yield YTW‐ RHS
0
2000
4000
6000
8000
10000
12000
14000
0
200
400
600
800
1000
1200
1400
1600
9‐Apr‐12
30‐Apr‐12
21‐May‐12
11‐Jun
‐12
2‐Jul‐12
23‐Jul‐12
13‐Au
g‐12
3‐Sep‐12
24‐Sep
‐12
15‐Oct‐12
5‐Nov‐12
26‐Nov‐12
17‐Dec‐12
7‐Jan‐13
28‐Jan‐13
18‐Feb
‐13
11‐M
ar‐13
1‐Apr‐13
22‐Apr‐13
13‐May‐13
3‐Jun
‐13
Barclays Short te rm High Yield ETF AUM ( in USD Mn) ‐LHS
Barclays High Yie ld Bond ETF AUM (in USD Mn) ‐ RHS
0
20
40
60
80
100
120
140
160
1‐Jan‐11
1‐Mar‐11
1‐May‐11
1‐Jul‐11
1‐Sep‐11
1‐Nov‐11
1‐Jan‐12
1‐Mar‐12
1‐May‐12
1‐Jul‐12
1‐Sep‐12
1‐Nov‐12
1‐Jan‐13
1‐Mar‐13
1‐May‐13
Investment Grade issaunces (USD bn) High Yield issaunces (USD bn)BARCLAYS USD
ETF return
1 Month Performance
to Last Month End
3 Month
Performance to
Last Month End
6 Month
Performance to
Last Month End
1 Year
Performance to
Last Month End
Barclays HY ETF ‐0.89 1.96 4.82 14.07
Barclays ST HY ETF ‐0.12 1.74 4.71 11.37
PIMCO IG ETF ‐2.17 ‐0.42 ‐0.42 4.81
900
1100
1300
1500
1700
1900
2100
‐40
‐30
‐20
‐10
0
10
20
30
40
50
60
70
1‐Dec‐06
1‐M
ar‐07
1‐Jun‐07
1‐Sep‐07
1‐Dec‐07
1‐M
ar‐08
1‐Jun‐08
1‐Sep‐08
1‐Dec‐08
1‐M
ar‐09
1‐Jun‐09
1‐Sep‐09
1‐Dec‐09
1‐M
ar‐10
1‐Jun‐10
1‐Sep‐10
1‐Dec‐10
1‐M
ar‐11
1‐Jun‐11
1‐Sep‐11
1‐Dec‐11
1‐M
ar‐12
1‐Jun‐12
1‐Sep‐12
1‐Dec‐12
1‐M
ar‐13
US Cor por ate Profit y‐y growth (%) US Cor por ate Profit (USD bn)
1.5
1.7
1.9
2.1
2.3
2.5
2.7
2.9
20‐Jun
‐12
4‐Jul‐12
18‐Jul‐12
1‐Aug‐12
15‐Aug‐12
29‐Aug‐12
12‐Se
p‐12
26‐Se
p‐12
10‐Oct‐12
24‐Oct‐12
7‐Nov‐12
21‐Nov‐12
5‐Dec‐12
19‐Dec‐12
2‐Jan‐13
16‐Jan‐13
30‐Jan‐13
13‐Fe
b‐13
27‐Fe
b‐13
13‐M
ar‐13
27‐M
ar‐13
10‐Apr‐13
24‐Apr‐13
8‐May‐13
22‐M
ay‐13
5‐Jun‐13
19‐Jun
‐13
UST 10yr ‐US TIPS 10yr
UST 10yr ‐US TIPS 10yr
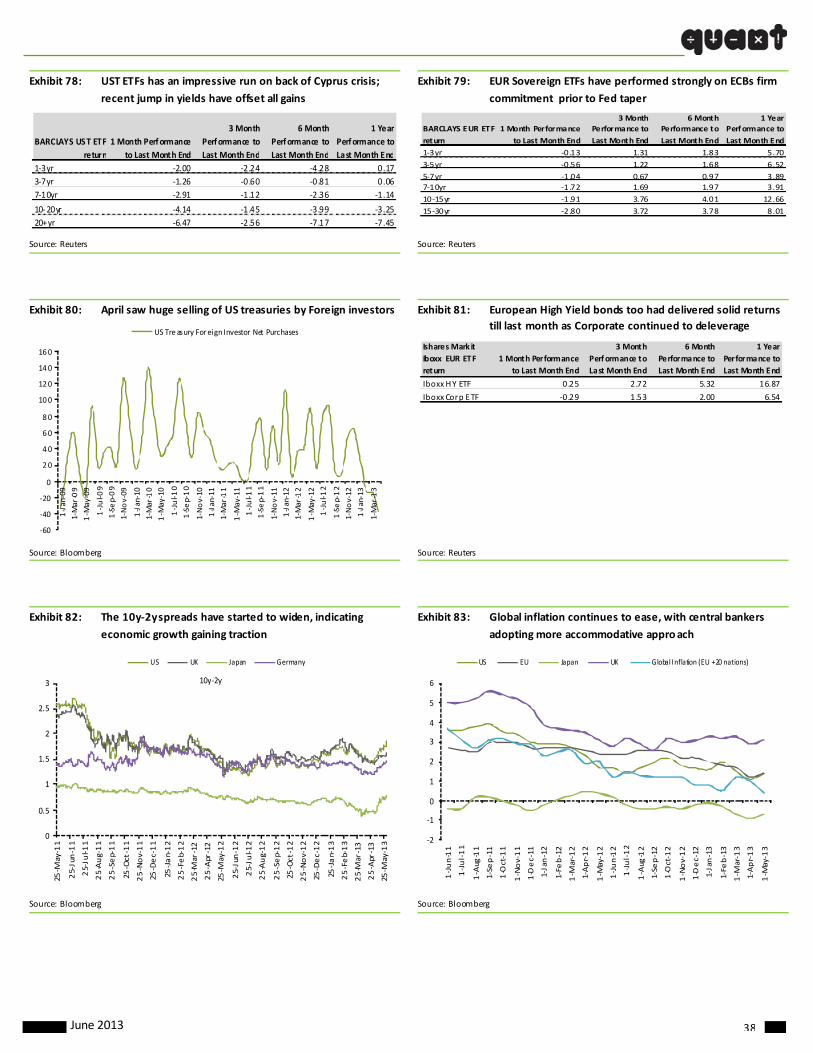
June 2013 38
Exhibit 78: UST ETFs has an impressive run on back of Cyprus crisis;
recent jump in yields have offset all gains
Exhibit 79: EUR Sovereign ETFs have performed strongly on ECBs firm
commitment prior to Fed taper
Source: Reuters Source: Reuters
Exhibit 80: April saw huge selling of US treasuries by Foreign investors
Exhibit 81: European High Yield bonds too had delivered solid returns
till last month as Corporate continued to deleverage
Source: Bloomberg Source: Reuters
Exhibit 82: The 10y‐2y spreads have started to widen, indicating
economic growth gaining traction
Exhibit 83: Global inflation continues to ease, with central bankers
adopting more accommodative approach
Source: Bloomberg Source: Bloomberg
BARCLAYS UST ETF
return
1 Month Performance
to Last Month End
3 Month
Performance to
Last Month End
6 Month
Performance to
Last Month End
1 Year
Performance to
Last Month End
1‐3yr ‐2.00 ‐2.24 ‐4.28 0.17
3‐7yr ‐1.26 ‐0.60 ‐0.81 0.06
7‐10yr ‐2.91 ‐1.12 ‐2.36 ‐1.14
10‐20yr ‐4.14 ‐1.45 ‐3.99 ‐3.25
20+yr ‐6.47 ‐2.56 ‐7.17 ‐7.45
BARCLAYS EUR ETF
return
1 Month Performance
to Last Month End
3 Month
Performance to
Last Month End
6 Month
Performance to
Last Month End
1 Year
Performance to
Last Month End
1‐3yr ‐0.13 1.31 1.83 5.70
3‐5yr ‐0.56 1.22 1.68 6.52
5‐7yr ‐1.04 0.67 0.97 3.89
7‐10yr ‐1.72 1.69 1.97 3.91
10‐15yr ‐1.91 3.76 4.01 12.66
15‐30yr ‐2.80 3.72 3.78 8.01
‐60
‐40
‐20
0
20
40
60
80
100
120
140
160
1‐Jan‐09
1‐Mar‐09
1‐M
ay‐09
1‐Jul‐0
9
1‐Sep‐09
1‐Nov‐09
1‐Jan‐10
1‐Mar‐10
1‐M
ay‐10
1‐Jul‐1
0
1‐Sep‐10
1‐Nov‐10
1‐Jan‐11
1‐Mar‐11
1‐M
ay‐11
1‐Jul‐1
1
1‐Sep‐11
1‐Nov‐11
1‐Jan‐12
1‐Mar‐12
1‐M
ay‐12
1‐Jul‐1
2
1‐Sep‐12
1‐Nov‐12
1‐Jan‐13
1‐Mar‐13
US Tre asury Foreign Investor Net Purchases
Ishares Mark it
Iboxx EUR ETF
return
1 Month Performance
to Last Month End
3 Month
Performance to
Last Month End
6 Month
Performance to
Last Month End
1 Year
Performance to
Last Month End
Iboxx HY ETF 0.25 2.72 5.32 16.87
Iboxx Corp ETF ‐0.29 1.53 2.00 6.54
0
0.5
1
1.5
2
2.5
3
25‐M
ay‐11
25‐Jun‐11
25‐Ju
l‐11
25‐Aug‐11
25‐Sep‐11
25‐Oct‐11
25‐Nov‐11
25‐Dec‐11
25‐Jan‐12
25‐Feb‐12
25‐M
ar‐12
25‐Apr‐12
25‐M
ay‐12
25‐Jun‐12
25‐Ju
l‐12
25‐Aug‐12
25‐Sep‐12
25‐Oct‐12
25‐Nov‐12
25‐Dec‐12
25‐Jan‐13
25‐Feb‐13
25‐M
ar‐13
25‐Apr‐13
25‐M
ay‐13
US UK Japan Germany
10y‐2y
‐2
‐1
0
1
2
3
4
5
6
1‐Jun‐11
1‐Jul‐11
1‐Aug
‐11
1‐Se
p‐11
1‐Oct‐11
1‐Nov‐11
1‐Dec‐11
1‐Jan‐12
1‐Fe
b‐12
1‐M
ar‐12
1‐Apr‐12
1‐M
ay‐12
1‐Jun‐12
1‐Jul‐12
1‐Aug
‐12
1‐Se
p‐12
1‐Oct‐12
1‐Nov‐12
1‐Dec‐12
1‐Jan‐13
1‐Fe
b‐13
1‐M
ar‐13
1‐Apr‐13
1‐M
ay‐13
US EU Japan UK Global Inflation (EU +20 nations)
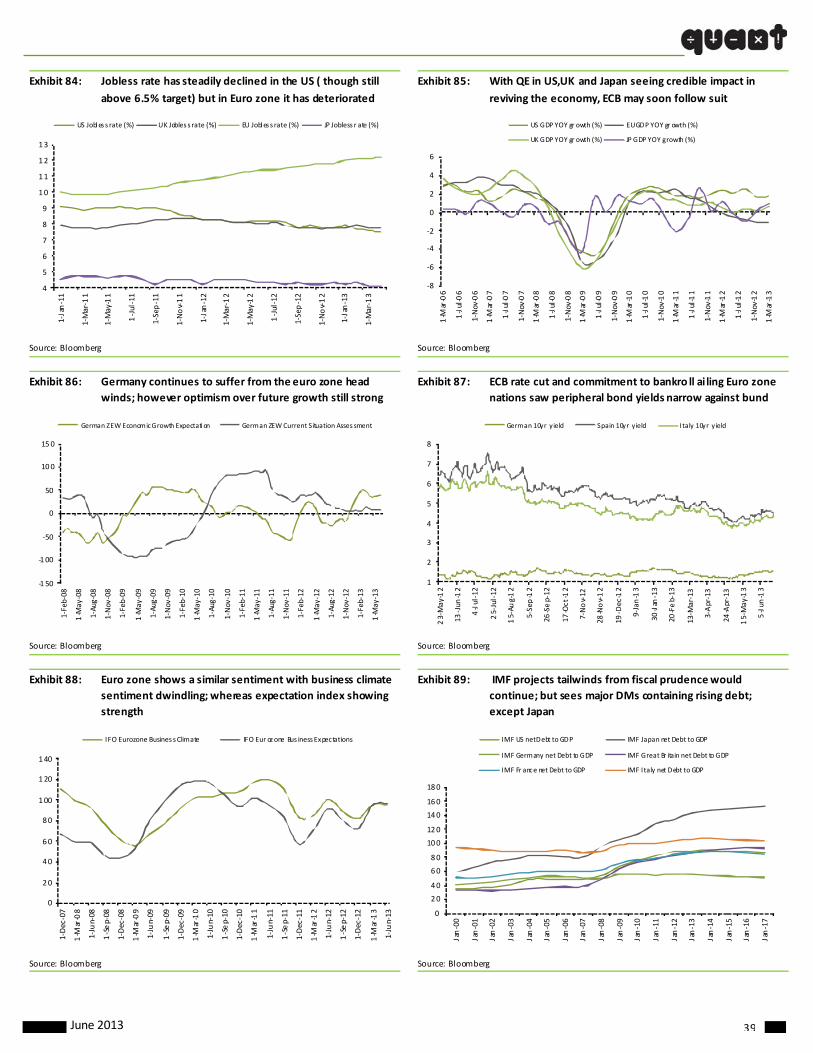
June 2013 39
Exhibit 84: Jobless rate has steadily declined in the US ( though still
above 6.5% target) but in Euro zone it has deteriorated
Exhibit 85: With QE in US,UK and Japan seeing credible impact in
reviving the economy, ECB may soon follow suit
Source: Bloomberg Source: Bloomberg
Exhibit 86: Germany continues to suffer from the euro zone head
winds; however optimism over future growth still strong
Exhibit 87: ECB rate cut and commitment to bankro ll ailing Euro zone
nations saw peripheral bond yields narrow against bund
Source: Bloomberg Source: Bloomberg
Exhibit 88: Euro zone shows a similar sentiment with business climate
sentiment dwindling; whereas expectation index showing
strength
Exhibit 89: IMF projects tailwinds from fiscal prudence would
continue; but sees major DMs containing rising debt;
except Japan
Source: Bloomberg Source: Bloomberg
4
5
6
7
8
9
10
11
12
13
1‐Jan‐11
1‐Mar‐11
1‐May‐11
1‐Jul‐11
1‐Sep‐11
1‐Nov‐11
1‐Jan‐12
1‐Mar‐12
1‐May‐12
1‐Jul‐12
1‐Sep‐12
1‐Nov‐12
1‐Jan‐13
1‐Mar‐13
US Jobles s rate (%) UK Jobles s rate (%) EU Jobles s rate (%) JP Jobless r ate (%)
‐8
‐6
‐4
‐2
0
2
4
6
1‐M
ar‐06
1‐Jul‐06
1‐Nov‐06
1‐M
ar‐07
1‐Jul‐07
1‐Nov‐07
1‐M
ar‐08
1‐Jul‐08
1‐Nov‐08
1‐M
ar‐09
1‐Jul‐09
1‐Nov‐09
1‐M
ar‐10
1‐Jul‐10
1‐Nov‐10
1‐M
ar‐11
1‐Jul‐11
1‐Nov‐11
1‐M
ar‐12
1‐Jul‐12
1 ‐Nov‐12
1‐M
ar‐13
US GDP YOY gr owth (%) EU GDP YOY gr owth (%)
UK GDP YOY gr owth (%) JP GDP YOY growth (%)
‐150
‐100
‐50
0
50
100
150
1‐Feb‐08
1‐May
‐08
1‐Aug‐08
1‐Nov
‐08
1‐Feb‐09
1‐Ma y
‐09
1‐Aug‐09
1‐Nov
‐09
1‐Feb‐10
1‐May
‐10
1‐Aug‐10
1‐Nov
‐10
1‐Feb‐11
1‐May
‐11
1‐Aug‐11
1‐Nov
‐11
1‐Feb‐12
1‐Ma y
‐12
1‐Aug‐12
1‐Nov
‐12
1‐Feb‐13
1‐May
‐13
German ZEW Economic Growth Expectati on German ZEW Current Situation Asses sment
1
2
3
4
5
6
7
823‐May
‐12
13‐Jun
‐12
4‐Jul‐12
25‐Jul‐12
15‐Au
g‐12
5‐Sep‐12
26‐Sep‐12
17‐Oct
‐12
7‐Nov‐12
28‐Nov‐12
19‐Dec
‐12
9‐Jan‐13
30‐Jan
‐13
20‐Feb‐13
13‐M
ar‐13
3‐Apr‐13
24‐Apr‐13
15‐May
‐13
5‐Jun
‐13
German 10yr yield Spain 10yr yield I taly 10yr yield
0
20
40
60
80
100
120
140
1‐Dec‐07
1‐M
ar‐08
1‐Jun‐08
1‐Sep‐08
1‐Dec‐08
1‐M
ar‐09
1‐Jun‐09
1‐Sep‐09
1‐Dec‐09
1‐M
ar‐10
1‐Jun‐10
1‐Sep‐10
1‐Dec‐10
1‐M
ar‐11
1‐Jun‐11
1‐Sep‐11
1‐Dec‐11
1‐M
ar‐12
1‐Jun‐12
1‐Sep‐12
1‐Dec‐12
1‐M
ar‐13
1‐Jun‐13
I FO Eurozone Busines s Climate IFO Eur ozone Bus iness Expectations
0
20
40
60
80
100
120
140
160
180
Jan‐00
Jan‐01
Jan‐02
Jan‐03
Jan‐04
Jan‐05
Jan‐06
Jan‐07
Jan‐08
Jan‐09
Jan‐10
Jan‐11
Jan‐12
Jan‐13
Jan‐14
Jan‐15
Jan‐16
Jan‐17
IMF US net Debt to GDP IMF Japan net Debt to GDP
IMF Germany net Debt to GDP IMF Great Br itain net Debt to GDP
IMF Fr ance net Debt to GDP IMF I taly net Debt to GDP
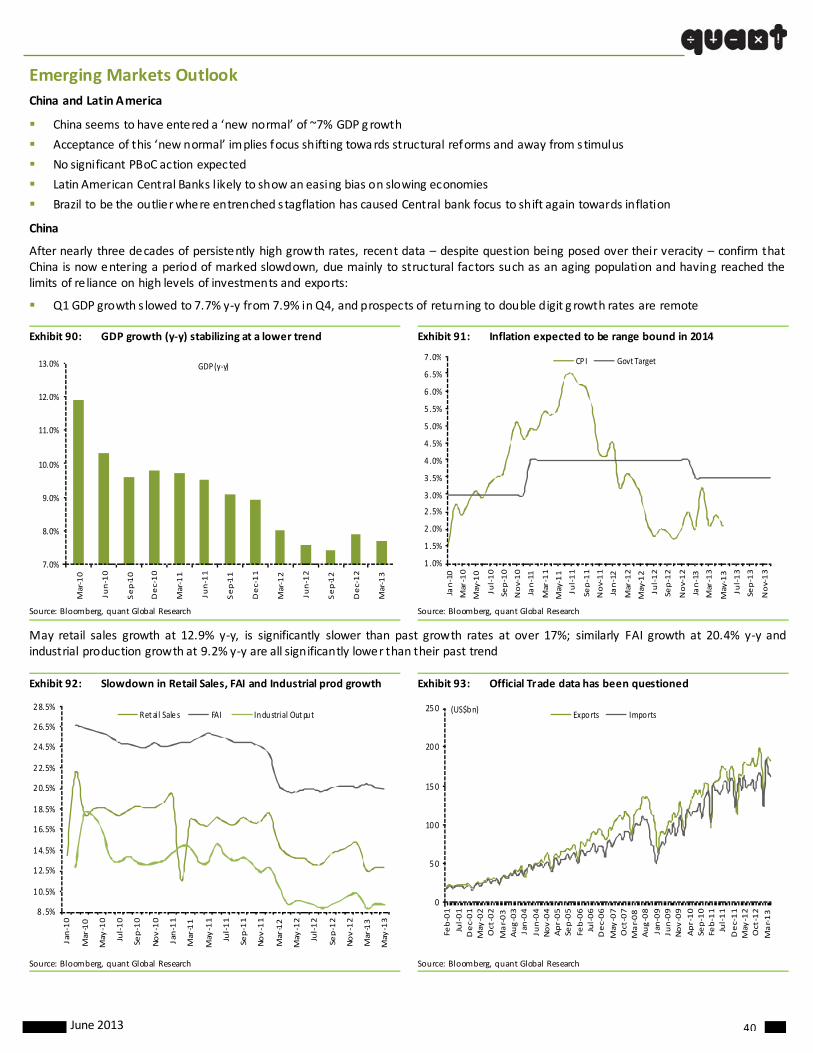
June 2013 40
Emerging Markets Outlook
China and Latin America
China seems to have entered a ‘new normal’ of ~7% GDP g rowth
Acceptance of this ‘new normal’ implies focus shifting towards structural reforms and away from stimulus
No significant PBoC action expected
Latin American Central Banks l ikely to show an easing bias on slowing economies
Brazil to be the outlier where entrenched stagflation has caused Central bank focus to shift again towards inflation
China
After nearly three decades of persistently high growth rates, recent data – despite question being posed over their veracity – confirm that China is now entering a period of marked slowdown, due mainly to structural factors such as an aging population and having reached the limits of re liance on high levels of investments and exports:
Q1 GDP growth s lowed to 7.7% y‐y from 7.9% in Q4, and prospects of returning to double digit g rowth rates are remote
Exhibit 90: GDP growth (y‐y) stabilizing at a lower trend Exhibit 91: Inflation expected to be range bound in 2014
Source: Bloomberg, quant Global Research Source: Bloomberg, quant Global Research
May retail sales growth at 12.9% y‐y, is significantly slower than past growth rates at over 17%; similarly FAI growth at 20.4% y‐y and industrial production growth at 9.2% y‐y are all significantly lower than their past trend
Exhibit 92: Slowdown in Retail Sales, FAI and Industrial prod growth Exhibit 93: Official Trade data has been questioned
Source: Bloomberg, quant Global Research Source: Bloomberg, quant Global Research
7.0%
8.0%
9.0%
10.0%
11.0%
12.0%
13.0%
Mar‐10
Jun‐10
Sep‐10
Dec‐10
Mar‐11
Jun‐11
Sep‐11
Dec‐11
Mar‐12
Jun‐12
Sep‐12
Dec‐12
Mar‐13
GDP (y‐y)
1 .0%
1 .5%
2 .0%
2 .5%
3 .0%
3 .5%
4 .0%
4 .5%
5 .0%
5 .5%
6 .0%
6 .5%
7 .0%
Jan‐10
Mar‐10
May‐10
Jul‐10
Sep‐10
Nov‐10
Jan‐11
Mar‐11
May‐11
Jul‐11
Sep‐11
Nov‐11
Jan‐12
Mar‐12
Ma y‐12
Jul‐12
Sep‐12
Nov‐12
Jan‐13
Mar‐13
Ma y‐13
Jul‐13
Sep‐13
Nov‐13
CP I Govt Target
8 .5%
10.5%
12.5%
14.5%
16.5%
18.5%
20.5%
22.5%
24.5%
26.5%
28.5%
Jan‐10
Mar‐10
May‐10
Jul‐10
Sep‐10
Nov‐10
Jan‐11
Mar‐11
Ma y‐11
Jul‐11
Sep‐11
Nov‐11
Mar‐12
May‐12
Jul‐12
Sep‐12
Nov‐12
Mar‐13
May‐13
Ret ai l Sale s FAI Industrial Output
0
50
100
150
200
250
Feb‐01
Jul‐01
Dec‐01
May‐02
Oct‐02
Mar‐03
Aug‐03
Jan‐04
Jun‐04
Nov‐04
Apr‐05
Sep‐05
Feb‐06
Jul‐06
Dec‐06
Ma y‐07
Oct‐07
Mar‐08
Aug‐08
Jan‐09
Jun‐09
Nov‐09
Apr‐10
Sep‐10
Feb‐11
Jul‐11
Dec‐11
Ma y‐12
Oct‐12
Mar‐13
(US$bn)Exports Imports

June 2013 41
The government is unlikely to try and push up growth via stimulus, as ill effects of the massive stimulus, post the 2008 f inancial crisis are still being felt in the form of massive malinvestment and build up of loca l government bad debts, which had caused Fitch to downgrade
China’s credit rating from AA‐ to A+ in April; instead the new Chinese leadership is likely to focus on structural reforms and tolera te lower growth during the readjustment duration – Premier Li Kequiang indicated recently that ~7% annual GDP g rowth ra te was acceptable.
Exhibit 94: Rise in M2 money supply indicates growth in credit Exhibit 95: PBoC unlikely to intervene via changes to RRR
Source: Bloomberg, quant Global Research estimates Source: Bloomberg, quant Global Research estimates
Expectations of lower growth also seem to be reflected in the yield curve which has f lattened over the past year
Exhibit 96: Yield Curve has flattened over last year
Source: Bloomberg, quant Global Research
In the event of government’s tolerance for an era of slower economic growth and focus on curbing excess credit growth – particula rly in the unregulated ‘shadow banking’ space – we do not expect any significant PBoC action and expect the yields to remain range bound during the quarter.
12.0%
14.0%
16.0%
18.0%
20.0%
22.0%
24.0%
26.0%
28.0%
Jan‐10
Mar‐10
May‐10
Jul‐10
Sep
‐10
Nov‐10
Jan‐11
Mar‐11
May‐11
Jul‐11
Sep
‐11
Nov‐11
Jan‐12
Mar‐12
May‐12
Jul‐12
Sep
‐12
Nov‐12
Jan‐13
Mar‐13
May‐13
1 5.0%
16.0%
17.0%
18.0%
19.0%
20.0%
21.0%
22.0%
Jan‐10
Mar‐10
May‐10
Jul‐10
Sep
‐10
Nov‐10
Jan‐11
Mar‐11
May‐11
Jul‐11
Sep
‐11
Nov‐11
Jan‐12
Mar‐12
May‐12
Jul‐12
Sep
‐12
Nov‐12
Jan‐13
Mar‐13
May‐13
RRR (%)
2.0%
2.2%
2.4%
2.6%
2.8%
3.0%
3.2%
3.4%
3.6%
3.8%
Jan‐01
Jan‐02
Jan‐03
Jan‐04
Jan‐05
Jan‐07
Jan‐10
Current 1 mnth 3 mnth 6 mnth 1 Yr

June 2013 42
Latin America
Closely linked to the slowing Chinese economy is the structural fall in demand for commodities, which seem to have entered a bear phase;
the fall in commodity prices is likely to manifest itself in the economic performance of many developing economies, which have enjoyed a sustained boom over the past decade on rising commodity export revenues.
Exhibit 97: Latin America –ex Brazil to show an easing bias
Source: CEIC, quant Global Research
Latin America, which has a preponderance of commodity exporters is thus l ikely to see an easing bias, though the Central Banks are likely to
show caution before implementing any change in policy.
The big regional exception will be Brazil, which having experimented with steep reduction in the key Selic rate to a record low 7.25% was unable to break out of the deflationary trap, caus ing the Central Bank to reverse course and implement a 25bps rise in key rate in Apr followed by a further 50bps rise in May.
Exhibit 98: Economy continues to suffer from Stagflation Exhibit 99: Inflation expected to decline in FY14
Source: Bloomberg, quant Global Research Source: Bloomberg, quant Global Research estimates
We believe that the Brazilian economic slowdown is structura l in nature and the problem of economic slowdown cannot be addressed by
monetary and fiscal stimulus alone ‐ unemployment ra te has consis tently been holding at near record lows, indicating an economy working at near potential capacity; we believe revival of pre 2008 crisis high growth levels will depend on implementing structural reforms, including infrastructure investments to remove critical bottlenecks – issues which are protracted in nature and will take time to address – any efforts to stimulate growth before addressal of these issues is likely to see a revival of inflationary pressure; we thus are bearish Brazilian credit for the immediate future as a further rise in Selic rates by a possible 50bps by the end of this quarter, is likely to lead to an
upward pressure on yields.
0.0%
2.0%
4.0%
6.0%
8.0%
10.0%
12.0%
4‐Jan‐10
4‐Feb‐10
4‐M
ar‐10
4‐Apr‐10
4‐M
ay‐10
4‐Jun‐10
4‐Jul‐10
4‐Aug‐10
4‐Sep‐10
4‐Oct‐10
4‐Nov‐10
4‐Dec‐10
4‐Jan‐11
4‐Feb‐11
4‐M
ar‐11
4‐Apr‐11
4‐M
ay‐11
4‐Jun‐11
4‐Jul‐11
4‐Aug‐11
4‐Sep‐11
4‐Oct‐11
4‐Nov‐11
4‐Dec‐11
4‐Jan‐12
4‐Feb‐12
4‐M
ar‐12
4‐Apr‐12
4‐M
ay‐12
4‐Jun‐12
4‐Jul‐12
4‐Aug‐12
4‐Sep‐12
4‐Oct‐12
4‐Nov‐12
4‐Dec‐12
4‐Jan‐13
4‐Feb‐13
4‐M
ar‐13
4‐Apr‐13
4‐M
ay‐13
4‐Jun‐13
Brazil Mexico Chile Colombia Peru
0.0%
1.0%
2.0%
3.0%
4.0%
5.0%
6.0%
7.0%
8.0%
9.0%
10 .0%
Jan‐10
Mar‐10
May‐10
Jul‐10
Sep‐10
Nov‐10
Jan‐11
Mar‐11
May‐11
Jul‐11
Sep‐11
Nov‐11
Jan‐12
Mar‐12
May‐12
Jul‐12
Sep‐12
Nov‐12
Jan‐13
Mar‐13
May‐13
GDP CPI
7.0%
8.0%
9.0%
10 .0%
11 .0%
12 .0%
13 .0%
4.0%
4.5%
5.0%
5.5%
6.0%
6.5%
7.0%
7.5%
Jan‐10
Feb‐10
Mar‐10
Apr‐10
Jun‐10
Jul‐10
Sep‐10
Oct‐10
Nov‐10
Jan‐11
Feb‐11
Mar‐11
May‐11
Jun‐11
Jul‐11
Sep‐11
Oct‐11
Nov‐11
Jan‐12
Feb‐12
A pr‐12
Ma y‐12
Jun‐12
Aug‐12
Sep‐12
Oct‐12
Dec‐12
Jan‐13
Mar‐13
A pr‐13
May‐13
(RHS)CPI SELIC
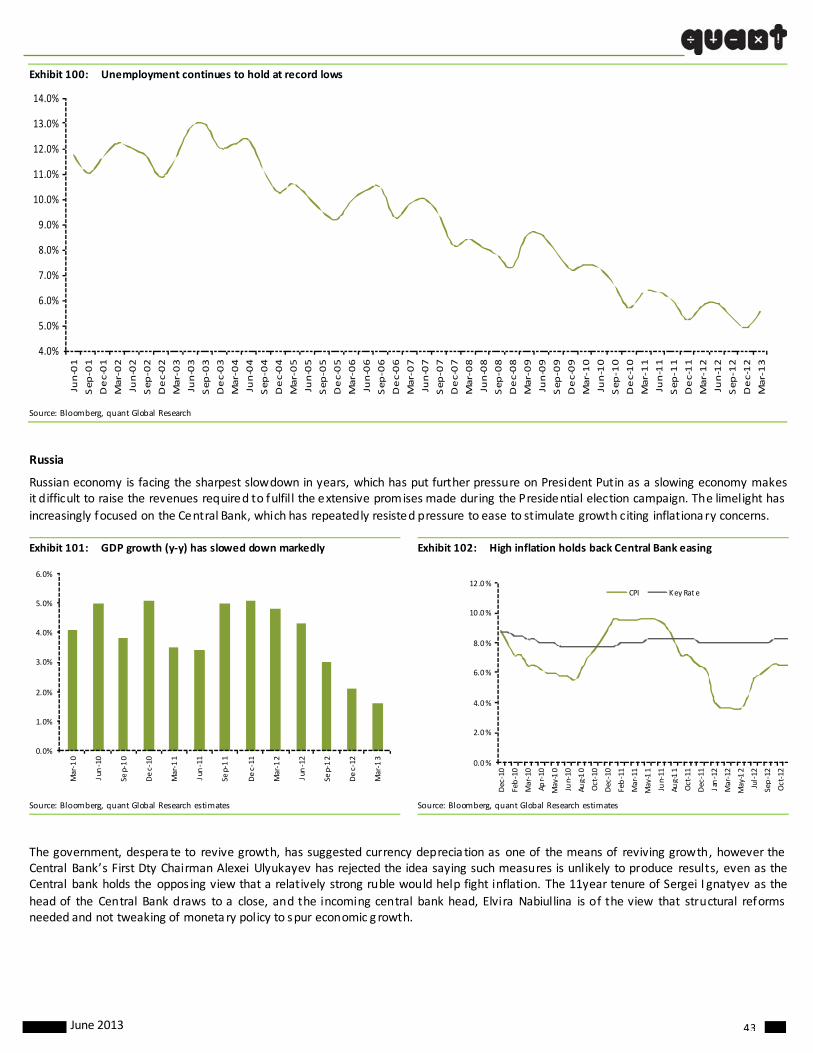
June 2013 43
Exhibit 100: Unemployment continues to hold at record lows
Source: Bloomberg, quant Global Research
Russia
Russian economy is facing the sharpest slowdown in years, which has put further pressure on President Putin as a slowing economy makes it difficult to raise the revenues required to fulfill the extensive promises made during the Presidential election campaign. The limelight has
increasingly focused on the Central Bank, which has repeatedly resisted pressure to ease to stimulate growth citing inflationary concerns.
Exhibit 101: GDP growth (y‐y) has slowed down markedly Exhibit 102: High inflation holds back Central Bank easing
Source: Bloomberg, quant Global Research estimates Source: Bloomberg, quant Global Research estimates
The government, despera te to revive growth, has suggested currency deprecia tion as one of the means of reviving growth, however the Central Bank’s First Dty Chairman Alexei Ulyukayev has rejected the idea saying such measures is unlikely to produce results, even as the Central bank holds the oppos ing view that a relatively strong ruble would help fight inflation. The 11year tenure of Sergei I gnatyev as the
head of the Central Bank draws to a close, and the incoming central bank head, Elvira Nabiullina is of the view that structural reforms needed and not tweaking of monetary policy to spur economic g rowth.
4.0%
5.0%
6.0%
7.0%
8.0%
9.0%
10.0%
11.0%
12.0%
13.0%
14.0%
Jun‐01
Sep‐01
Dec‐01
Mar‐02
Jun‐02
Sep‐02
Dec‐02
Mar‐03
Jun‐03
Sep‐03
Dec‐03
Mar‐04
Jun‐04
Sep‐04
Dec‐04
Mar‐05
Jun‐05
Sep‐05
Dec‐05
Mar‐06
Jun‐06
Sep‐06
Dec‐06
Mar‐07
Jun‐07
Sep‐07
Dec‐07
Mar‐08
Jun‐08
Sep‐08
Dec‐08
Mar‐09
Jun‐09
Sep‐09
Dec‐09
Mar‐10
Jun‐10
Sep‐10
Dec‐10
Mar‐11
Jun‐11
Sep‐11
Dec‐11
Mar‐12
Jun‐12
Sep‐12
Dec‐12
Mar‐13
0.0%
1.0%
2.0%
3.0%
4.0%
5.0%
6.0%
Mar‐10
Jun‐10
Sep‐10
Dec‐10
Mar‐11
Jun‐11
Sep‐11
Dec‐11
Mar‐12
Jun‐12
Sep‐12
Dec‐12
Mar‐13
0.0%
2.0%
4.0%
6.0%
8.0%
10 .0%
12 .0%
Dec‐10
Feb‐10
Mar‐10
Apr‐10
Ma y‐10
Jun‐10
Aug‐10
Oct‐10
Dec‐10
Feb‐11
Mar‐11
Ma y‐11
Jun‐11
Aug‐11
Oct‐11
Dec‐11
Jan‐12
Mar‐12
May‐12
Jul‐12
Sep‐12
Oct‐12
CPI Key Rat e
June 2013 44
India Outlook
Macro
Government spending and good monsoon to revive growth
Inflation expected to remain benign at an average of 5.5%
Split in opposition ranks pos itive for UPA‐2 stability
Current account to improve, but funding remains a challenge
Growth expected to gradually pick‐up in FY14
We are becoming positive on the Indian economy and expect a gradual recovery to set in FY14. We believe that while we are s till not complete ly out of the woods, the economy has bottomed out, and domestic growth and macro‐stability indicators are turning positive. The biggest risk to our view comes from external account and domestic politics. While India’s CAD is expected to head downwards, it is still expected to remain large enough to warrant benign global liquidity. We expect Indian GDP to grow by 6.0% in FY14.
Our view of uptick in growth is based on 1) increase in government expenditure, 2) good monsoon, 3) improvement in exports, 4) benign inflation, 5) low Interest rates, 6) benign international commodity prices and, 7) reduction in domestic macro‐stability risks. The key risks to our forecast comes from 1) risks to external account and currency, 2) politica l risk, 3) fiscal deficit, 4) monsoon and, 5) global risks
Mini ‘fiscal stimulus’ to boost growth
We note the recent statement made by the finance minis ter, in which he exhorted all minis tries to spend the budgeta ry allocations,
preferably in the earlier part of the year, and committed to achieve FY14 deficit target through enhanced receipts, rather than expenditure cuts. This shall provide boost to growth. Moreover, the cenatral government is also expected to urge cash rich PSUs to start investing their surplus cash (estimated at more than 1.62 lakh crore) in order to kick‐start the investment cycle.
Government plays an important role in Indian economy with Central government expenditure approximately 15% of the economy, and if we add state (and Union Territory) governments, the share rises to ~29%. The sharp contraction in government expenditure (especially in
2HFY13 at 1.4% y‐y) was therefore an important contributor to the g rowth slowdown in FY13.
We note that Central government expenditure is budgeted to rise by 18.2% y‐y in FY14, compared to only 8.1% rise in FY13. If we deflate the government’s expenditure based on expected WPI, rise in real government expenditure in FY14 will be 12.7% y‐y (we assume 5.5% average inflation in FY14), compared to 0.7% y‐y in FY13. Moreover, in absolute terms, the annual increase in government expenditure in FY14 (over FY13) is 2.5 times the increase in FY13 (over FY12). Based on rather simple calculations ( ignoring indirect impacts), the impact of
this ~12% higher growth in central government expenditure (compared to FY13) can alone add ~180bp rise to GDP growth in FY14 compared to FY13. While sharp rise in government expenditure has many indirect impacts on economic growth, ( through its impact on flow of resources to private sector, inflation, CAD etc) net impact on growth in FY14 will be pos itive.
Besides the strong budgeted growth in central government expenditure, the upcoming election year may also give a fillip to state
government expenditure, which is positive for g rowth in consumption sector.
Monsoon cheer for the economy
IMD has forecasted normal monsoon in 2013 and the prog ress of monsoon till now has been quite good, with monsoon covering the entire country about a month ahead of schedule. Cumulative rainfall in first 20 days of June has been 48% above normal and 91% of the country has received normal or excess rainfa ll, which is quite pos itive. While it is still too early to take a final call, heavy rains in the earlier part of
the season gives hope of good Kharif output. Here we would l ike to point out that recent tragic f loods in North India shall have no major negative impact on agriculture.
Although the contribution of agriculture to overall GDP has declined over the years (17.5% in 2013 compared to 29. % in 1991 and 50.7% in 1952), good Monsoon favorably impacts GDP growth, inf lation, water availability, hydro‐electricity generation, environment and consumption patterns, besides affecting overall sentiments pos itively.
Improvement in exports
Another reason for the growth slowdown and rise in CAD in FY13 has been the sharp decline in growth in exports, which comprise of 24% of the economy. Exports rose by only 3.0% y‐y in FY13, against 15.3% y‐y in FY12. Total merchandise export actua lly declined by 1.85% y‐y in dollar terms. We expect merchandise exports growth to pick up in FY14 to at least 10% y‐y, on back of improving growth prospects in US economy as well as significant INR depreciation.
Decline in inflation creates policy space for addressing growth risks
Our outlook for inflation in FY14 stays benign at 5.5%. While the recent sharp decline and volatility in currency has deterred RBI from
June 2013 45
reducing policy rates in the recent mid‐quarter policy review, the current growth inf lation dynamics provide sufficient space for rate cuts later in the year, once the currency volatility gets reduced.
We would like to highlight tha t the current cycle of g rowth slowdown began with higher inflation, which first resulted in tight monetary and then tight fiscal policy. A significant part of the current growth slowdown was thus intentional in nature to prevent overheating of the economy, reduce output gap and thereby reduce inflation. With inflation now coming down to RBI’s comfort zone, we believe that the situation is ripe for reversal of the above cycle, which shall be pos itive for growth.
Benign international commodity prices
The decline in commodity prices is another key positive for the Indian economy. CRB index and crude prices have declined by 5.2% and 8.4% ytd, respectively. The declining trend in gold prices is another positive, which if sustained, shall not only reduce import bill, but also boost domestic savings in the financial products (as opposed to physical savings in gold), which is critical for boosting investments and reducing CAD.
Commodities comprise ~60% of India’s imports, and commodity linked products has a nearly ~40% weight in the WPI basket. Moreover,
commodity prices also significantly impact government’s subs idy bill and fiscal deficit. A dollar decline in crude price reduces annual current account deficit by ~US$900 mn and fiscal deficit by ~ Rs25 bn. Decline in commodity prices is therefore an important positive for inflation, current account, fiscal health, currency and growth.
Domestic macro‐stability risks have reduced
We note that India’s macro‐stability risk indicators are on an improving trend:
Benign commodity price, especially the decline in crude prices is expected to result in decline in current account deficit. However, we note that despite the expectation of reduction in CAD, it still remains quite high and India’s BoP remains dependent on global liquidity
There has been an improvement in fisca l health of the government since September 2012, which shall pos itively impact CAD, inflation and growth
Inflation has come down sharply providing space for the RBI to start focusing on growth risks
While global risks remain, especially in Europe and China, we note that US economy is on an improving trend. Moreover, the prospect of slower China growth is impacting commodity prices negatively, which is quite positive for India.
However, we would like to point out that India’s external account vulnerability remains high despite expected decline in CAD due to prospects of reduction in capital inflows to emerging market economies.
Medium term growth outlook is positive, but reform momentum needs to pick‐up
Despite the sharp decline in the growth rate of the economy from 9.3% in FY11 to 5% in FY13, and potential GDP from 8% plus to 7% now (RBI estimate), we believe that the structural drivers of growth viz. improved efficiency due to two decades of economic reforms, high
savings rate, demographic dividend, improving socio‐economic indicators and skilled talent pool remain intact, and the long term prospects of the economy are positive.
However, we believe that the growth potential of the first generation reforms has saturated, and return to 8% plus growth from here onwards will require second dose of politically difficult reforms. Here we would like to highlight tha t the deleterious impact of reform deficit, and regulatory and policy log‐ jam, in critical infrastructural sectors ( like power, coal, oil and gas, railways, besides roads and land
acquisition) are not only hurting the long term g rowth potentia l of the economy, but is also feeding into high inflation and CAD through domestic supply constraints. Pick‐up in the reform momentum and benign global economy will be critica l for growth to return to 8% plus range.
Political space for reforms in the near term
We believe that UPA government has political space and time to push reforms, especially at a time when economy and currency looks vulnerable, and we expect vigour in policy‐making and reforms till the beginning of the monsoon session of Parliament. However, the election heavy schedule with 7 state elections and the General election practically limits the room for economic reforms and policy‐making
to 1H. While UPA government had been appearing vulnerable since losing two crucial allies TMC and DMK, the recent split in the opposition political alliance, NDA, has increased stability of the UPA‐2 government and reduced the possibility of General elections in 2013.
However, we expect populism to rise as elections draw near and it is a key concern, especially from macro‐stability point of v iew. While the expected increase in government spending is likely to provide boost to consumption g rowth, we remain concerned about potential slippages in the ambitious f iscal consolidation road‐map, which the government has embarked upon since September 2012, with
consequent risks to twin deficit, inflation and India’s sovereign rating. Particular concern will be on the likely negative impact of Food Security Bill on food subs idy, fiscal deficit and overall food economy. Moreover, the positive measures like rationalization of fuel prices may face greater political opposition (from both the ruling alliance and opposition) due to l ikely increase in political posturing.

June 2013 46
However, the biggest drag of the election heavy season and upcoming general elections in 2014 will be that investment is unlikely to pick‐up in a major way till a clearer political picture emerge about the next dispensation.
Inflation expected to remain benign
The weakening inflationary pressure has emerged as the biggest positive for the economy. While we see a gradual pick‐up in inflation from the current (May) levels of 4.7%, we expect it to remain benign and average 5.5% in FY14. Our expectation of a gradual rise in inflation is
based on 1) impact of currency deprecia tion on imported commodities (~40% of WPI basket is commodity linked), 2) expecta tion of g rowth pick‐up, 3) impact of higher government spending, 4) rationalization of administered prices, and 5) base effect. We do not see an immediate major impact of INR depreciation on inflation due to offsetting impact of weak commodity prices and weak pricing power of the producers given the weak economic growth. While the consumer inflation remains too high for comfort, it is also on a declining trajectory,
and we expect the declining trend to continue. The risk to our forecast are 1) sharp rise in government expenditure and government breaching its f iscal deficit target, 2) rise in global commodity prices even as INR remains weak, and 3)sharp growth upturn.
External account expected to improve, but remain vulnerable
CAD expected to decline in FY14
India’s external account remained under stress in CY12 with CAD scaling new peaks, rising to US$32.6 bn in 4QCY12, which at 6.7% of the GDP is more than double the sustainable level of ~2.5%. The biggest reason for the high CAD is the record high trade deficit due to both continuous weakness in exports (largely due to weak economic growth in major trading partners), and strong oil and gold imports. We note that non‐oil, non‐gold imports have remained weak (contraction in 12 of the last 13 months) due to weak demand of a slowing economy.
Oil and gold are the top two items of India’s import basket and they together account for ~45% of India’s imports. Moreover, gold and oil imports have been rela tively inelastic to economic cycle, prices and currency depreciation. In fact with weakening growth, high CPI inflation and deprecia ting currency, gold has emerged as a preferred investment option, which is further fuelling import demand. However, we expect gold and oil imports to decline in FY14. Expectation of lower gold imports is due to declining inf lation, recent declining trend in gold prices and increasing government efforts to reduce gold demand. We believe tha t government ought to come out with more innovative
steps to reduce gold imports.
We expect CAD to decline to ~4% of GDP in FY14, from ~5% of GDP in FY13. From a macro‐economic point of view, CAD is the difference between savings and investments, and thus the reduction in fiscal deficit and higher financial savings shall positively impact CAD. We also expect improving global economic scenario and weak INR to boost exports. Imports is expected to show weak growth in FY14 due to 1) positive impact of stable/declining crude and gold prices on oil and gold imports, and 2) INR depreciation and fisca l consolidation shall
result in continuation of low growth in non‐oil/non‐gold imports.
Rising debt capital becoming new source of stress in the current account
Outflow in primary income account is emerging as a new sustainable source of stress to CAD. Outflows in primary income account rose to US$6.3bn in 3QFY13, at a 3‐year annualized growth rate of 36.2%. The rise in primary income outflows is largely due to servicing of rising
external debt, and given the trend of rising externa l debt, this particula r segment will likely cause more stress in the future.
Funding CAD remains a challenge
While we expect CAD to decline in FY14, it will remain high at 4.0% of GDP, and funding it will remain a challenge. India will continue to require an average of US$7bn of capital inflows every month to fund its CAD, and given RBI’s limited ability and intent to intervene in the forex market, any slowdown or reversal of capital flows will negatively impact currency.
RBI’s forex reserves and currency market policy
RBI has preferred to keep a hand’s off policy to INR depreciation, preferring to allow it to find its level based on market forces and limiting itself to preventing sharp volatility. While India’s forex reserves at ~290 bn are not small per se, but given the high CAD, rising external debt burden and FII investment in the equity and bond markets, RBI has been extremely prudent in us ing it to defend INR.
On the other hand, we note that given the rising external vulnerability (owing to rise in external debt and deterioration in debt‐forex ratio),
RBI will try to recoup its ~US$35bn of forex reserves, which it has lost since the global financial crisis in order to support INR, whenever INR witnesses appreciating pressure beyond 53. We would l ike to highlight dolla r purchases by RBI in March and April, which shows that it is comfortable with 53‐54 range for Rupee. We thus do not expect USD‐INR to come down to below 55 on a susta inable basis in the near future. INR range for Q3 & Q4 will be 55 ‐62.
Rising vulnerability in external account
We note that in virtually every indicator, India’s external sector vulnerability has increased in the last couple of years. RBI’s effort to prevent slide in INR through forex sales has resulted in decline in forex reserve even as economy’s external debt, size, openness and imports are increasing, thereby increasing the vulnerability to reversal of capital flows. Ris ing debt inflow is another source of concern. Almost all the external debt indicators are steadily deteriorating and make India vulnerable in the event of globa l risk off. Rising external debt is also showing in the current account deficit through higher outflows in primary income account. Indian policymaker clearly requires careful
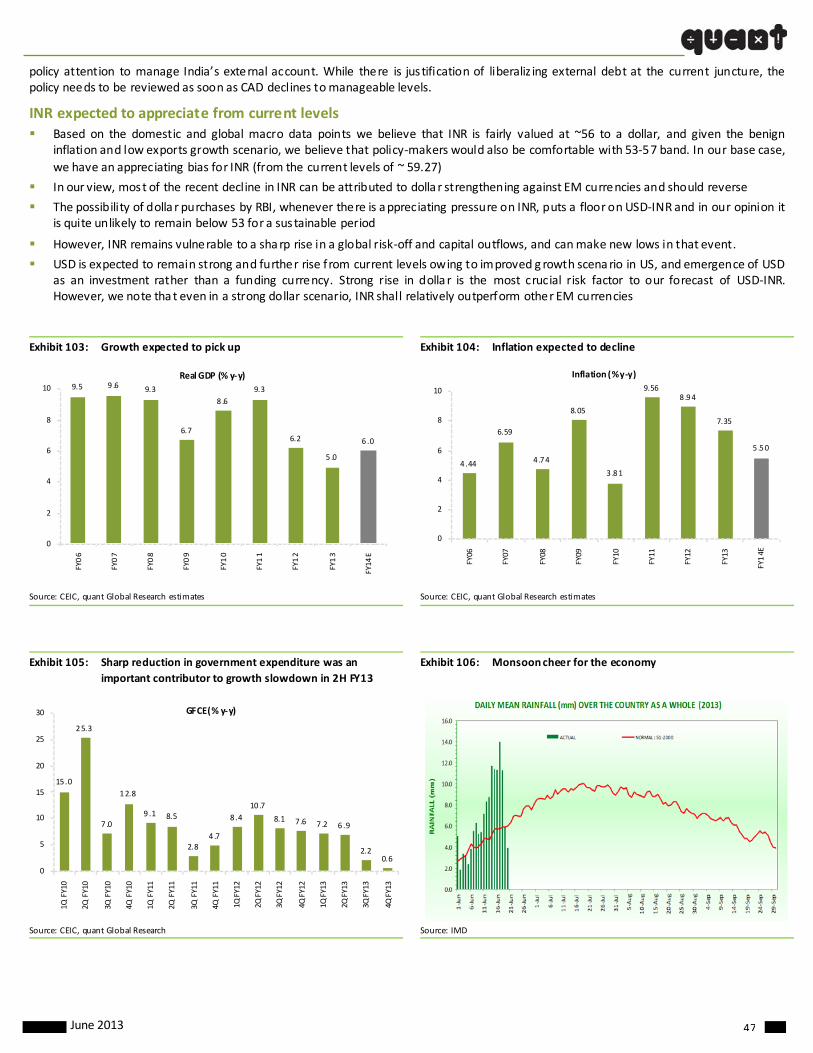
June 2013 47
policy attention to manage India’s external account. While there is jus tification of liberaliz ing external debt at the current juncture, the policy needs to be reviewed as soon as CAD declines to manageable levels.
INR expected to appreciate from current levels Based on the domestic and global macro data points we believe that INR is fairly valued at ~56 to a dollar, and given the benign
inflation and low exports growth scenario, we believe that policy‐makers would also be comfortable with 53‐57 band. In our base case,
we have an appreciating bias for INR (from the current levels of ~ 59.27)
In our view, most of the recent decline in INR can be attributed to dolla r strengthening against EM currencies and should reverse
The possibility of dolla r purchases by RBI, whenever there is appreciating pressure on INR, puts a floor on USD‐INR and in our opinion it is quite unlikely to remain below 53 for a sustainable period
However, INR remains vulnerable to a sharp rise in a global risk‐off and capital outflows, and can make new lows in that event.
USD is expected to remain strong and further rise from current levels owing to improved g rowth scenario in US, and emergence of USD as an investment rather than a funding currency. Strong rise in dolla r is the most crucial risk factor to our forecast of USD‐INR. However, we note tha t even in a strong dollar scenario, INR shall relatively outperform other EM currencies
Exhibit 103: Growth expected to pick up Exhibit 104: Inflation expected to decline
9.5 9 .6 9.3
6.7
8 .6
9.3
6.2
5 .0
6 .0
0
2
4
6
8
10
FY06
FY07
FY08
FY09
FY10
FY11
FY12
FY13
FY14
EReal GDP (% y‐y)
4 .44
6.59
4 .74
8.05
3 .81
9.568 .94
7.35
5 .50
0
2
4
6
8
10
FY06
FY07
FY08
FY09
FY10
FY11
FY12
FY13
FY14E
Inflation (% y‐y)
Source: CEIC, quant Global Research estimates Source: CEIC, quant Global Research estimates
Exhibit 105: Sharp reduction in government expenditure was an
important contributor to growth slowdown in 2H FY13
Exhibit 106: Monsoon cheer for the economy
15 .0
25.3
7 .0
12.8
9 .1 8.5
2.84 .7
8 .4
10 .7
8.1 7 .6 7 .2 6 .9
2.20.6
0
5
10
15
20
25
30
1Q FY10
2Q FY10
3Q FY10
4Q FY10
1Q FY11
2Q FY11
3Q FY11
4Q FY11
1QFY12
2QFY12
3QFY12
4QFY12
1QFY13
2QFY13
3QFY13
4QFY13
GFCE (% y‐y)
Source: CEIC, quant Global Research Source: IMD
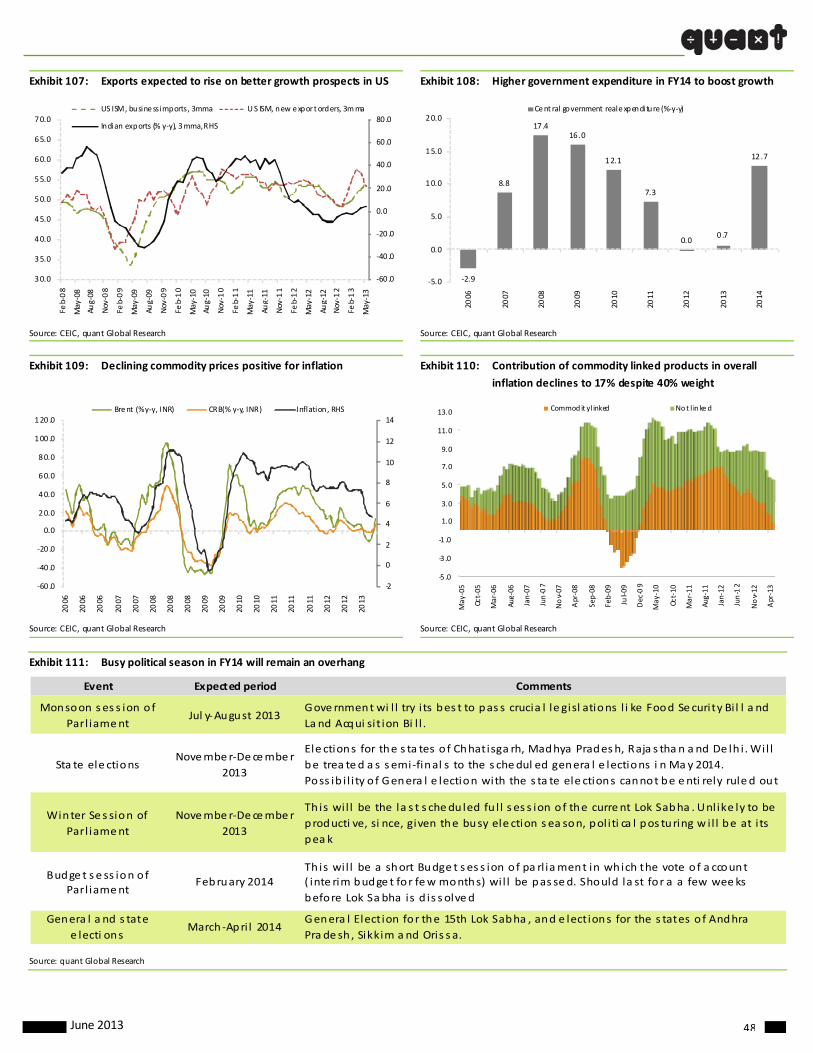
June 2013 48
Exhibit 107: Exports expected to rise on better growth prospects in US Exhibit 108: Higher government expenditure in FY14 to boost growth
‐60 .0
‐40 .0
‐20 .0
0.0
20 .0
40 .0
60 .0
80 .0
30.0
35.0
40.0
45.0
50.0
55.0
60.0
65.0
70.0
Feb‐08
Ma y‐08
Aug‐08
Nov‐08
Feb‐09
May‐09
Aug‐09
Nov‐09
Feb‐10
Ma y‐10
Aug‐10
Nov‐10
Feb‐11
May‐11
Aug‐11
Nov‐11
Feb‐12
Ma y‐12
Aug‐12
Nov‐12
Feb‐13
May‐13
US ISM, busine ss imports, 3mma US ISM, new expor t orders, 3mma
Indian exports (% y‐y), 3mma, RHS
‐2.9
8.8
17 .416 .0
12.1
7.3
0.00 .7
12 .7
‐5.0
0.0
5.0
10.0
15.0
20.0
2006
2007
2008
2009
2010
2011
2012
2013
2014
Cent ral government real expenditure (%‐y‐y)
Source: CEIC, quant Global Research Source: CEIC, quant Global Research
Exhibit 109: Declining commodity prices positive for inflation Exhibit 110: Contribution of commodity linked products in overall
inflation declines to 17% despite 40% weight
‐2
0
2
4
6
8
10
12
14
‐60 .0
‐40 .0
‐20 .0
0.0
20.0
40.0
60.0
80.0
100 .0
120 .0
2006
2006
2006
2007
2007
2008
2008
2008
2009
2009
2010
2010
2011
2011
2011
2012
2012
2013
Brent (% y‐y, INR) CRB(% y‐y, INR) Inflation, RHS
Source: CEIC, quant Global Research Source: CEIC, quant Global Research
Exhibit 111: Busy political season in FY14 will remain an overhang
Event Expected period Comments
Monsoon s es s ion of
Parl iamentJul y‐August 2013
Gove rnment wi l l try i ts bes t to pas s crucia l le gisl ations l i ke Food Se curity Bil l a nd
La nd Acqui sit ion Bi l l .
Sta te ele ctionsNovembe r‐Decembe r
2013
Ele ctions for the s ta tes of Chhatisga rh, Madhya Pradesh, Raja s tha n a nd De lh i . Will
be trea ted a s s emi‐final s to the s chedul ed genera l e lections i n May 2014.
Poss ib i l i ty of Genera l e lection with the s ta te ele ctions cannot be enti rely rule d out
Winter Se s sion of
Parl iament
Novembe r‐Decembe r
2013
Th is wil l be the la s t s chedu led fu l l s es s ion of the current Lok Sabha . Unlike ly to be
producti ve, si nce, given the busy ele ction s ea son, politi ca l pos turing wil l be at i ts
pea k
Budge t s e ss ion of Parl iament
February 2014Th is wil l be a short Budge t s es s ion of pa rl iament in which the vote of a ccount ( inte rim budge t for few months) wil l be pas sed. Should la st for a a few weeks
before Lok Sa bha is d is s olved
Genera l a nd s tate
e lecti onsMarch ‐Apri l 2014
Genera l Election for the 15th Lok Sabha , and e lections for the s tates of Andhra
Pra de sh , Sikkim a nd Oris s a.
Source: quant Global Research
‐5 .0
‐3 .0
‐1 .0
1.0
3.0
5.0
7.0
9.0
11.0
13.0
May
‐05
Oct‐05
Mar‐06
Aug‐06
Jan‐07
Jun‐07
Nov‐07
Apr‐08
Sep‐08
Feb‐09
Jul‐09
Dec
‐09
May
‐10
Oct‐10
Mar‐11
Aug‐11
Jan‐12
Jun‐12
Nov‐12
Apr‐13
Commod it y l inked Not l in ke d

June 2013 49
Exhibit 112: CAD made new highs on rising trade deficit but…. Exhibit 113: … strong capital inflows funded record high CAD
‐15
‐10
‐5
0
5
10
Jun‐05
Dec‐05
Jun‐06
Dec‐06
Jun‐07
Dec‐07
Jun‐08
Dec‐08
Jun‐09
Dec‐09
Jun‐10
Dec‐10
Jun‐11
Dec‐11
Jun‐12
Dec‐12
Curr ent account (% of GDP)
Trade de ficit Invisibles surplus Curre nt account
‐15 .0
‐10 .0
‐5 .0
0.0
5.0
10 .0
15 .0
Jun‐05
Dec
‐05
Jun‐06
Dec
‐06
Jun‐07
Dec
‐07
Jun‐08
Dec
‐08
Jun‐09
Dec
‐09
Jun‐10
Dec
‐10
Jun‐11
Dec
‐11
Jun‐12
Dec
‐12
Balance of payment (% of GDP )
Curre nt account Capital account Balance of payment
Source: CEIC, quant Global Research Source: CEIC, quant Global Research
Exhibit 114: Rising net IIP liabil ity…
Exhibit 115: …is becoming another drag on CAD
‐59 ‐81 ‐87 ‐67 ‐90 ‐107 ‐126 ‐159 ‐165 ‐189 ‐206 ‐210 ‐223 ‐202 ‐209‐249 ‐224 ‐272 ‐282
372 342 333 345 356 376 386 391 393 418 426 439 449 453 432 438 434 442 442
‐430 ‐423 ‐420 ‐411 ‐446 ‐482 ‐512 ‐550 ‐559‐608 ‐632 ‐649 ‐672 ‐655 ‐641 ‐686 ‐658
‐713 ‐724‐900
‐700
‐500
‐300
‐100
100
300
500
Jun‐08
Sep‐08
Dec‐08
Mar‐09
Jun‐09
Sep‐09
Dec‐09
Mar‐10
Jun‐10
Sep‐10
Dec‐10
Mar‐11
Jun‐11
Sep‐11
Dec‐11
Mar‐12
Jun‐12
Sep‐12
Dec‐12
Ne t IIP (US$ bn) Asse ts (US$ bn) Liab il ities (US$ bn)
Source: CEIC, quant Global Research
0
50
100
150
200
250
300
‐1
0
1
2
3
4
5
6
7
Jun‐06
Oct‐06
Feb‐07
Jun‐07
Oct‐07
Feb‐08
Jun‐08
Oct‐08
Feb‐09
Jun‐09
Oct‐09
Feb‐10
Jun‐10
Oct‐10
Feb‐11
Jun‐11
Oct‐11
Feb‐12
Jun‐12
Oct‐12
Investment income outflow (US$ mn) Ne t IIP l iabi lity
Source: CEIC, quant Global Research
Exhibit 116: Trade deficit and CAD is expected to improve on lower commodity prices and gradual pick‐up in exports
‐1 8‐17‐1 7‐18 ‐18‐19 ‐18‐1 5‐14‐1 3‐10‐1 2‐12 ‐13‐1 5‐13‐1 4‐13‐1 5‐15 ‐17‐14 ‐15‐1 6‐18‐2 0‐19‐1 9‐16 ‐18‐1 9‐18‐1 9‐20‐1 9‐20‐1 9‐24 ‐23‐2 5‐23‐2 4‐23‐2 4‐25 ‐23‐22 ‐22‐2 1‐23‐2 3‐22‐2 2‐23 ‐22‐2 2‐23‐2 2‐21‐2 4‐20 ‐21
18 1 9 19 1 9 18 1 6 1411 13 13 1 2 13 1 2 12 1 4 14 14 1 5 15 1 5 16 1 6 16
20 18 172 1
17 1 8 19 1 923 23 23 23
3 0
232 7 27 2 6 25 27
2 4 23 2 5 25 2 529
24 25 25 2 3 23 2 5 24 2 3 26 26 2 731
2 4 25
‐9 ‐10‐1 0‐13 ‐12‐10
‐7
‐6‐5 ‐5
‐4‐4 ‐5 ‐5
‐7‐7 ‐7 ‐7
‐8 ‐8‐8
‐9‐8 ‐9
‐9 ‐9 ‐8 ‐8
‐7‐8 ‐8 ‐8
‐9 ‐10‐9
‐12‐1 3
‐13 ‐13‐1 3‐13‐1 1‐11‐1 2‐12 ‐15
‐13 ‐16‐1 4
‐15‐1 1‐14
‐1 3‐14 ‐16
‐1 4‐15‐1 6
‐15‐1 3
‐14‐15‐3.5‐1 .6‐1.5
‐1 .3‐3.8‐3 .0
‐0.9
‐2.6
‐1.0‐0.8
‐0 .8‐0.6
‐2 .2‐2.1
‐1 .6‐1.7‐1.8‐2 .0
‐2.4‐2 .2
‐3.0
‐3 .0‐2.5‐4.5
‐4.2‐1.7‐1 .9‐2.6
‐3 .6‐3.4
‐5 .0‐3.0
‐3.0‐4.0‐5.3
‐2 .8‐4.4
‐7 .6‐4.1‐3 .6
‐4.6‐4.6‐6 .6‐2.6‐3 .6‐5.2
‐4 .7‐4.9
‐3.1
‐4.2
‐1.8
‐4 .1‐2.5
‐4 .5‐6.8
‐5 .3‐5.7‐7.2
‐5 .5‐3.1‐7 .5‐8.3
‐50 .0
‐40 .0
‐30 .0
‐20 .0
‐10 .0
0.0
10.0
20.0
30.0
40.0
Apr‐08
Jun‐08
Aug‐08
Oct‐08
Dec‐08
Feb‐09
Apr‐09
Jun‐09
Aug‐09
Oct‐09
Dec‐09
Feb‐10
Apr‐10
Jun‐10
Aug‐10
Oct‐10
Dec‐10
Feb‐11
Apr‐11
Jun‐11
Aug‐11
Oct‐11
Dec‐11
Feb‐12
Apr‐12
Jun‐12
Aug‐12
Oct‐12
Dec‐12
Feb‐13
Apr‐13
Breakdown of India's foreign t rade (US$ bn)
Non‐oil, non‐gold import Exports Oil import Gold import Trade deficit
Source: CEIC, quant Global Research
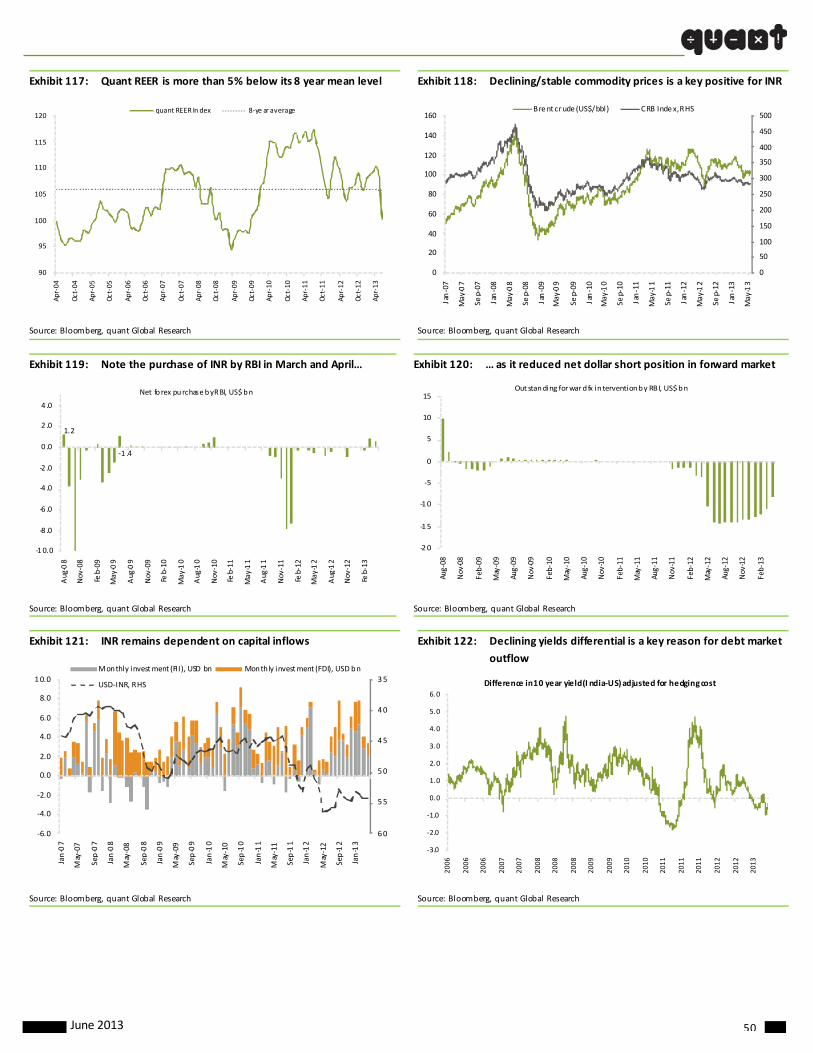
June 2013 50
Exhibit 117: Quant REER is more than 5% below its 8 year mean level
90
95
100
105
110
115
120
Apr‐04
Oct‐04
Apr‐05
Oct‐05
Apr‐06
Oct‐06
Apr‐07
Oct‐07
Apr‐08
Oct‐08
Apr‐09
Oct‐09
Apr‐10
Oct‐10
Apr‐11
Oct‐11
Apr‐12
Oct‐12
Apr‐13
quant REER In dex 8‐ye ar average
Exhibit 118: Declining/stable commodity prices is a key positive for INR
0
50
100
150
200
250
300
350
400
450
500
0
20
40
60
80
100
120
140
160
Jan‐07
May‐07
Sep‐07
Jan‐08
May‐08
Sep‐08
Jan‐09
May‐09
Sep‐09
Jan‐10
May‐10
Sep‐10
Jan‐11
May‐11
Sep‐11
Jan‐12
May‐12
Sep‐12
Jan‐13
May‐13
B re nt crude (US$/bbl) CRB Inde x, RHS
Source: Bloomberg, quant Global Research Source: Bloomberg, quant Global Research
Exhibit 119: Note the purchase of INR by RBI in March and April…
1.2
‐1 .4
‐10.0
‐8 .0
‐6 .0
‐4 .0
‐2 .0
0 .0
2 .0
4 .0
Aug
‐08
Nov
‐08
Feb‐09
May
‐09
Aug
‐09
Nov
‐09
Feb‐10
May
‐10
Aug
‐10
Nov
‐10
Feb‐11
May
‐11
Aug
‐11
Nov
‐11
Feb‐12
May
‐12
Aug
‐12
Nov
‐12
Feb‐13
Net fo rex purchase by RBI, US$ bn
Exhibit 120: … as it reduced net dollar short position in forward market
‐20
‐15
‐10
‐5
0
5
10
15
Aug‐08
Nov
‐08
Feb‐09
May‐09
Aug‐09
Nov
‐09
Feb‐10
May‐10
Aug‐10
Nov
‐10
Feb‐11
May‐11
Aug‐11
Nov
‐11
Feb‐12
May‐12
Aug‐12
Nov
‐12
Feb‐13
Out standing forward fx intervention by RBI, US$ bn
Source: Bloomberg, quant Global Research Source: Bloomberg, quant Global Research
Exhibit 121: INR remains dependent on capital inflows
35
40
45
50
55
60‐6.0
‐4.0
‐2.0
0.0
2.0
4.0
6.0
8.0
10.0
Jan‐07
May‐07
Sep‐07
Jan‐08
May‐08
Sep‐08
Jan‐09
May‐09
Sep‐09
Jan‐10
May‐10
Sep‐10
Jan‐11
Ma y‐11
Sep‐11
Jan‐12
Ma y‐12
Sep‐12
Jan‐13
Monthly investment (FII), USD bn Month ly investment (FDI), USD bn
USD‐INR, RHS
Exhibit 122: Declining yields differential is a key reason for debt market
outflow
‐3.0
‐2.0
‐1.0
0.0
1.0
2.0
3.0
4.0
5.0
6.0
2006
2006
2006
2007
2007
2008
2008
2008
2009
2009
2010
2010
2011
2011
2011
2012
2012
2013
Difference in 10 year yield (I ndia‐US) adjusted for hedging cost
Source: Bloomberg, quant Global Research Source: Bloomberg, quant Global Research
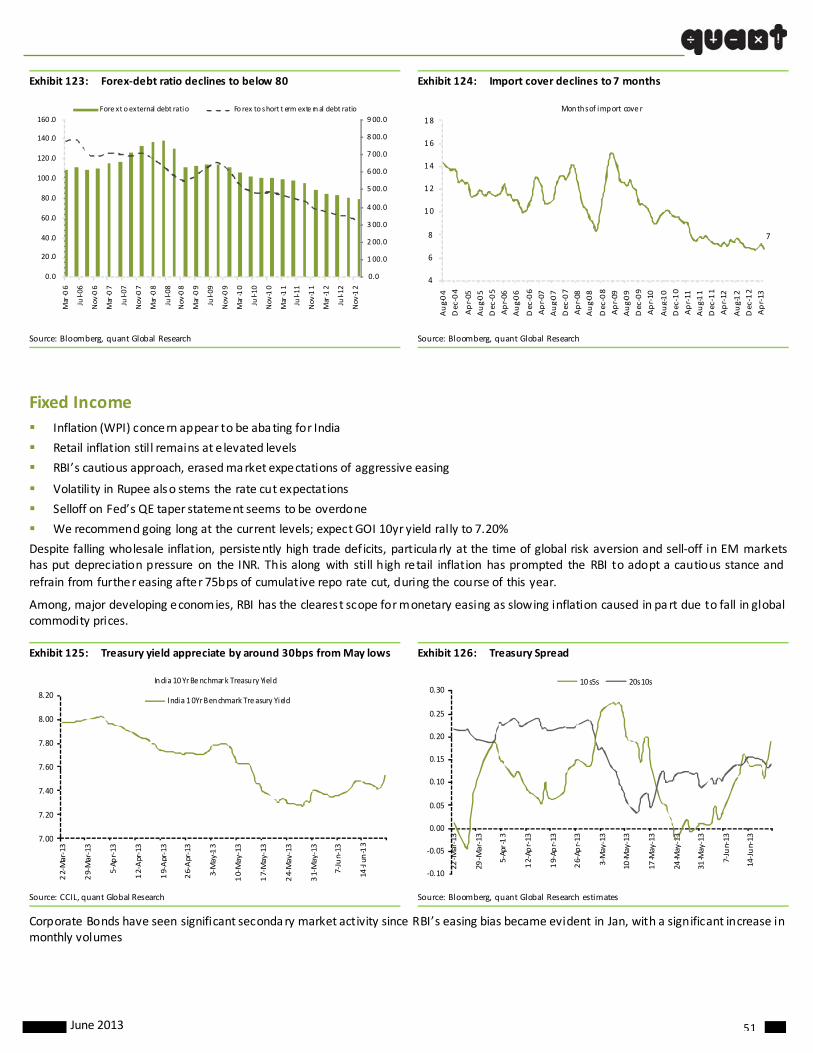
June 2013 51
Exhibit 123: Forex‐debt ratio declines to below 80
0.0
1 00.0
2 00.0
3 00.0
4 00.0
5 00.0
6 00.0
7 00.0
8 00.0
9 00.0
0.0
20 .0
40 .0
60 .0
80 .0
100 .0
120 .0
140 .0
160 .0
Mar‐06
Jul‐06
Nov‐06
Mar‐07
Jul‐07
Nov‐07
Mar‐08
Jul‐08
Nov‐08
Mar‐09
Jul‐09
Nov‐09
Mar‐10
Jul‐10
Nov‐10
Mar‐11
Jul‐11
Nov‐11
Mar‐12
Jul‐12
Nov‐12
Fore x t o external debt ratio Fo rex to short t erm exte rn al debt ratio
Exhibit 124: Import cover declines to 7 months
7
4
6
8
10
12
14
16
18
Aug‐04
Dec‐04
Apr‐05
Aug‐05
Dec‐05
Apr‐06
Aug‐06
Dec‐06
Apr‐07
Aug‐07
Dec‐07
Apr‐08
Aug‐08
Dec‐08
Apr‐09
Aug‐09
Dec‐09
Apr‐10
Aug‐10
Dec‐10
Apr‐11
Aug‐11
Dec‐11
Apr‐12
Aug‐12
Dec‐12
Apr‐13
Months of import cove r
Source: Bloomberg, quant Global Research Source: Bloomberg, quant Global Research
Fixed Income
Inflation (WPI) concern appear to be abating for India
Retail inflation still remains at elevated levels
RBI’s cautious approach, erased market expectations of aggressive easing
Volatility in Rupee also stems the rate cut expectations
Selloff on Fed’s QE taper statement seems to be overdone
We recommend going long at the current levels; expect GOI 10yr yield rally to 7.20%
Despite falling wholesale inflation, persistently high trade deficits, particula rly at the time of global risk aversion and sell‐off in EM markets has put depreciation pressure on the INR. This along with still high retail inflation has prompted the RBI to adopt a cautious stance and
refrain from further easing after 75bps of cumulative repo rate cut, during the course of this year.
Among, major developing economies, RBI has the clearest scope for monetary easing as slowing inflation caused in part due to fall in global commodity prices.
Exhibit 125: Treasury yield appreciate by around 30bps from May lows Exhibit 126: Treasury Spread
Source: CCIL, quant Global Research Source: Bloomberg, quant Global Research estimates
Corporate Bonds have seen significant secondary market activity since RBI’s easing bias became evident in Jan, with a significant increase in monthly volumes
7.00
7.20
7.40
7.60
7.80
8.00
8.20
22‐Mar‐13
29‐Mar‐13
5‐Ap
r‐13
12‐Apr‐13
19‐Apr‐13
26‐Apr‐13
3‐May‐13
10‐May‐13
17‐May‐13
24‐Ma y‐13
31‐Ma y‐13
7‐Jun‐13
14‐Jun
‐13
India 10Yr Benchmark Treasury Yield
India 10Yr Benchmark Tre asury Yield
‐0.10
‐0.05
0.00
0.05
0.10
0.15
0.20
0.25
0.30
22‐M
ar‐13
29‐M
ar‐13
5‐Apr‐13
12‐Ap
r‐13
19‐A p
r‐13
26‐Ap
r‐13
3‐Ma y‐13
10‐May‐13
17‐May‐13
24‐Ma y‐13
31‐May‐13
7‐Jun‐13
14‐Jun‐13
10 s5s 20s10s
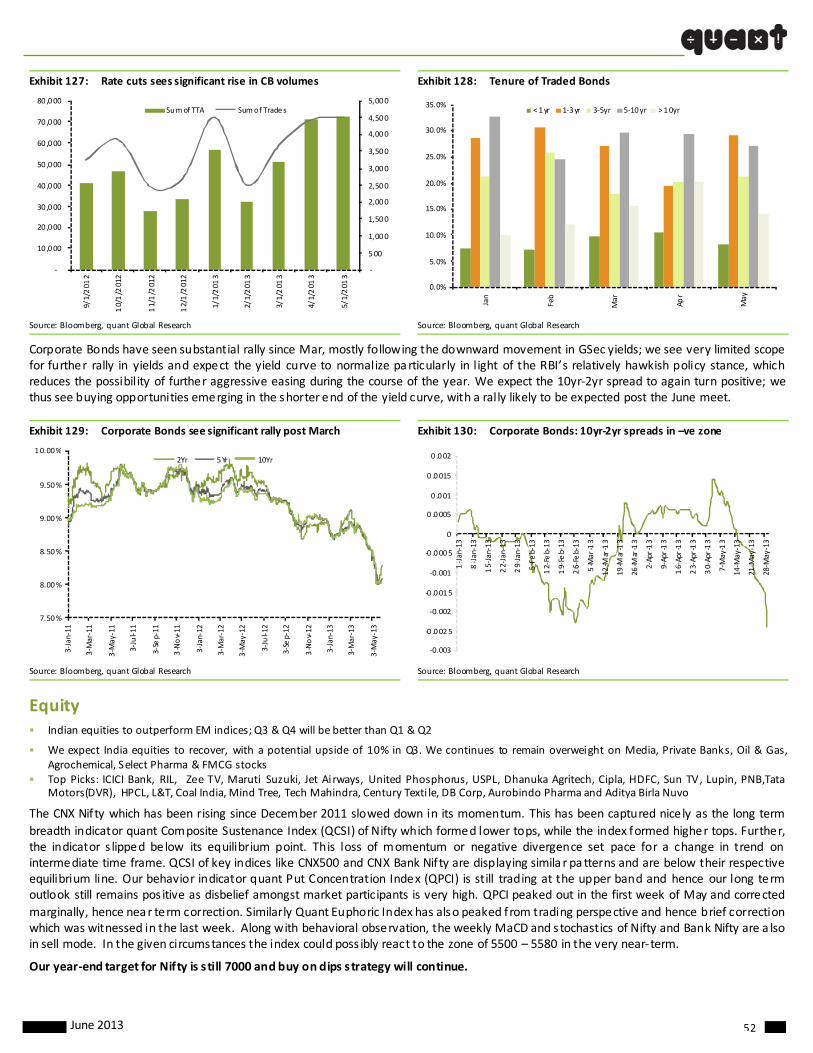
June 2013 52
Exhibit 127: Rate cuts sees significant rise in CB volumes Exhibit 128: Tenure of Traded Bonds
Source: Bloomberg, quant Global Research Source: Bloomberg, quant Global Research
Corporate Bonds have seen substantial rally since Mar, mostly following the downward movement in GSec yields; we see very limited scope for further rally in yields and expect the yield curve to normalize particularly in l ight of the RBI’s relatively hawkish policy stance, which reduces the possibility of further aggressive easing during the course of the year. We expect the 10yr‐2yr spread to again turn positive; we thus see buying opportunities emerging in the shorter end of the yield curve, with a rally likely to be expected post the June meet.
Exhibit 129: Corporate Bonds see significant rally post March Exhibit 130: Corporate Bonds: 10yr‐2yr spreads in –ve zone
Source: Bloomberg, quant Global Research Source: Bloomberg, quant Global Research
Equity Indian equities to outperform EM indices; Q3 & Q4 will be better than Q1 & Q2
We expect India equities to recover, with a potential upside of 10% in Q3. We continues to remain overweight on Media, Private Banks, Oil & Gas, Agrochemical, Select Pharma & FMCG stocks
Top Picks: ICICI Bank, RIL, Zee TV, Maruti Suzuki, Jet Airways, United Phosphorus, USPL, Dhanuka Agritech, Cipla, HDFC, Sun TV, Lupin, PNB,Tata Motors(DVR), HPCL, L&T, Coal India, Mind Tree, Tech Mahindra, Century Texti le, DB Corp, Aurobindo Pharma and Aditya Birla Nuvo
The CNX Nifty which has been rising since December 2011 slowed down in its momentum. This has been captured nice ly as the long term
breadth indicator quant Composite Sustenance Index (QCSI) of Nifty which formed lower tops, while the index formed higher tops. Further, the indicator s lipped below its equilibrium point. This loss of momentum or negative divergence set pace for a change in trend on intermediate time frame. QCSI of key indices like CNX500 and CNX Bank Nifty are displaying simila r patterns and are below their respective equilibrium line. Our behavior indicator quant Put Concentration Index (QPCI) is still trading at the upper band and hence our long term outlook still remains pos itive as disbelief amongst market participants is very high. QPCI peaked out in the first week of May and corrected
marginally, hence near term correction. Similarly Quant Euphoric Index has also peaked from trading perspective and hence brief correction which was witnessed in the last week. Along with behavioral observation, the weekly MaCD and stochastics of Nifty and Bank Nifty are a lso in sell mode. In the given circumstances the index could poss ibly react to the zone of 5500 – 5580 in the very near‐term.
Our year‐end target for Nifty is still 7000 and buy on dips strategy will continue.
‐
500
1,000
1,500
2,000
2,500
3,000
3,500
4,000
4,500
5,000
‐
10 ,000
20 ,000
30 ,000
40 ,000
50 ,000
60 ,000
70 ,000
80 ,000
9/1/201
2
10/1/2012
11/1/2012
12/1/2012
1/1/201
3
2/1/201
3
3/1/201
3
4/1/201
3
5/1/201
3
Sum of TTA Sum of Trade s
0.0%
5.0%
10.0%
15.0%
20.0%
25.0%
30.0%
35.0%
Jan
Feb
Mar
Apr
May
< 1yr 1‐3yr 3‐5yr 5‐10yr > 10yr
7.50%
8.00%
8.50%
9.00%
9.50%
10.00%
3‐Jan‐11
3‐Mar‐11
3‐May‐11
3‐Jul‐11
3‐Sep‐11
3‐Nov‐11
3‐Jan‐12
3‐Mar‐12
3‐May‐12
3‐Jul‐12
3‐Sep‐12
3‐Nov‐12
3‐Jan‐13
3‐Mar‐13
3‐May‐13
2Yr 5Yr 10Yr
‐0.003
‐0 .0025
‐0.002
‐0 .0015
‐0.001
‐0 .0005
0
0 .0005
0 .001
0 .0015
0 .0021‐Jan‐13
8‐Jan‐13
15‐Jan‐13
22‐Jan‐13
29‐Jan‐13
5‐Feb‐13
12‐Feb‐13
19‐Feb‐13
26‐Feb‐13
5‐Mar‐13
12‐M
ar‐13
19‐M
ar‐13
26‐M
ar‐13
2‐Apr‐13
9‐Apr‐13
16‐Apr‐13
23‐Apr‐13
30‐Apr‐13
7‐May‐13
14‐M
ay‐13
21‐M
ay‐13
28‐M
ay‐13
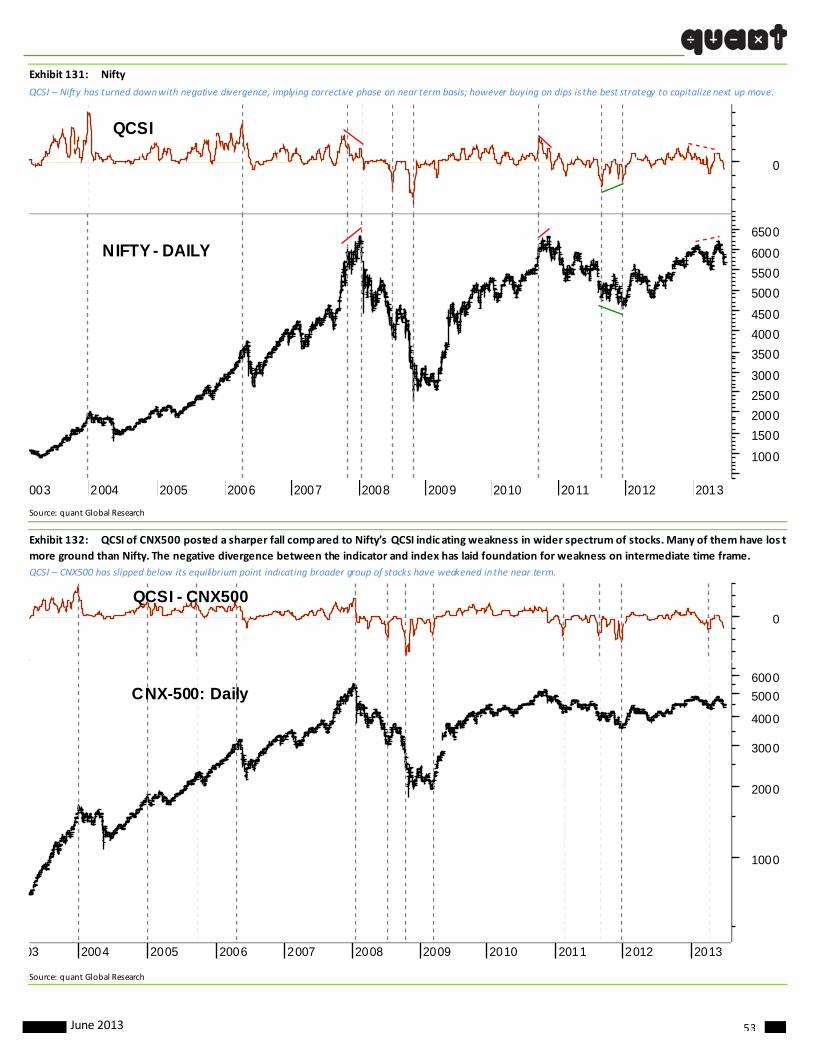
June 2013 53
Exhibit 131: Nifty
QCSI – Nifty has turned down with negative divergence, implying corrective phase on near term basis; however buying on dips is the best strategy to capitalize next up move.
003 2004 2005 2006 2007 2008 2009 2010 2011 2012 2013
1000
1500
2000
2500
3000
3500
4000
4500
5000
5500
6000
6500
NIFTY - DAILY
0
QCSI
Source: quant Global Research
Exhibit 132: QCSI of CNX500 posted a sharper fall compared to Nifty’s QCSI indic ating weakness in wider spectrum of stocks. Many of them have los t
more ground than Nifty. The negative divergence between the indicator and index has laid foundation for weakness on intermediate time frame.
QCSI – CNX500 has slipped below its equilibrium point indicating broader group of stocks have weakened in the near term.
03 2004 2005 2006 2007 2008 2009 2010 2011 2012 2013
1000
2000
3000
4000
5000
6000
CNX-500: Daily
0
QCSI - CNX500
Source: quant Global Research

June 2013 54
Exhibit 133: Nifty Weekly
M J J A S O N D 2010 A M J A S O N D 2011 A M J J A S O N 2012 A M J J A S O N D 2013 A M J J
0MaCD
50
Stochastics
4000
4500
5000
5500
6000
6500Nifty - Weekly
Source: quant Global Research
Exhibit 134: Nifty – quant Euphoria Index
2011 Feb Mar Apr May Jun Jul Aug Sep Oct Nov Dec 2013 Feb Mar Apr May Jun
4600
4700
4800
4900
5000
5100
5200
5300
5400
5500
5600
5700
5800
5900
6000
6100
6200
6300NIFTY - Daily
quant Euphoria Index
Trading Top
Trading Top
Source: quant Global Research
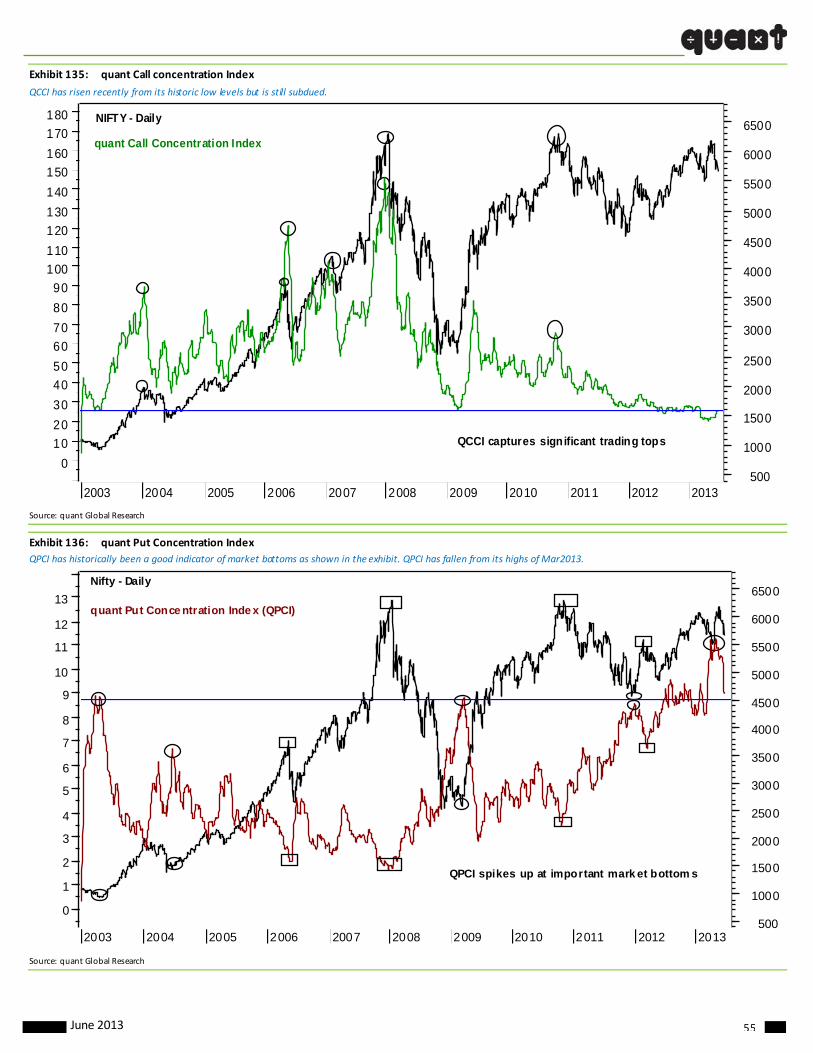
June 2013 55
Exhibit 135: quant Call concentration Index
QCCI has risen recently from its historic low levels but is still subdued.
2003 2004 2005 2006 2007 2008 2009 2010 2011 2012 2013
0
10
20
30
40
50
60
70
80
90
100
110
120
130
140
150
160
170
180
500
1000
1500
2000
2500
3000
3500
4000
4500
5000
5500
6000
6500
QCCI captures significant trading tops
NIFTY - Daily
quant Call Concentration Index
Source: quant Global Research
Exhibit 136: quant Put Concentration Index
QPCI has historically been a good indicator of market bottoms as shown in the exhibit. QPCI has fallen from its highs of Mar2013.
2003 2004 2005 2006 2007 2008 2009 2010 2011 2012 2013
0
1
2
3
4
5
6
7
8
9
10
11
12
13
500
1000
1500
2000
2500
3000
3500
4000
4500
5000
5500
6000
6500Nifty - Daily
quant Put Conce ntration Inde x (QPCI)
QPCI spikes up at important mark et bottom s
Source: quant Global Research
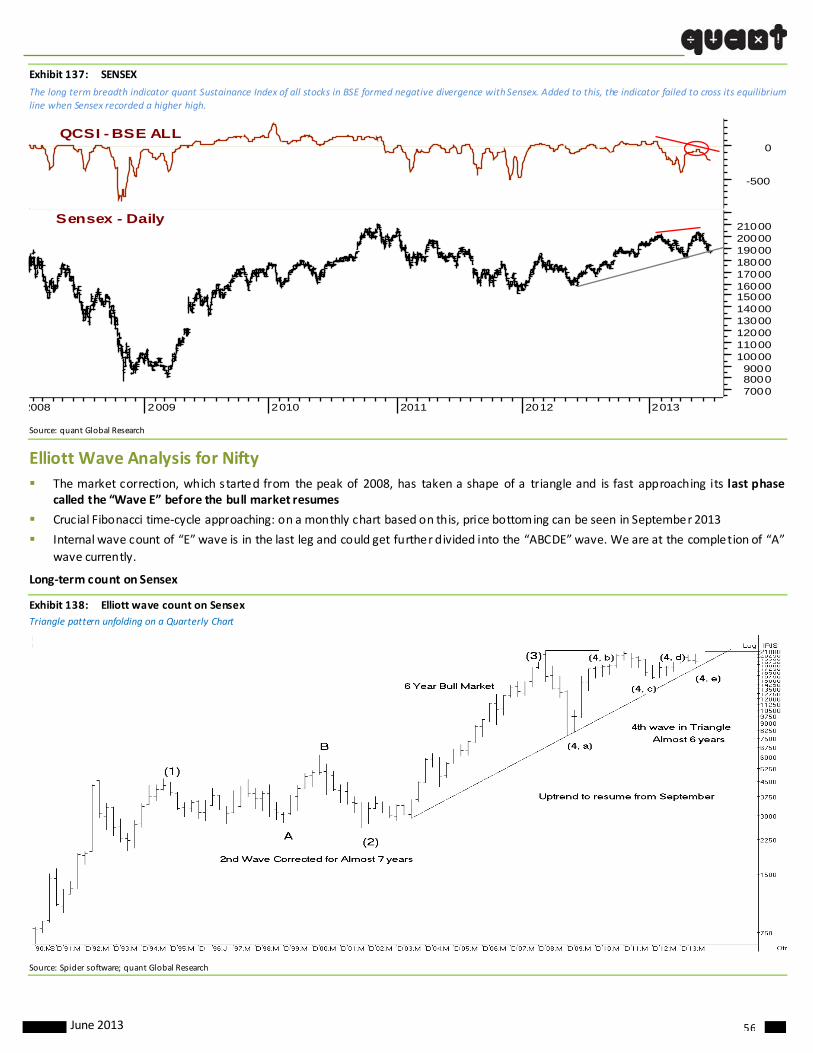
June 2013 56
Exhibit 137: SENSEX
The long term breadth indicator quant Sustainance Index of all stocks in BSE formed negative divergence with Sensex. Added to this, the indicator failed to cross its equilibrium line when Sensex recorded a higher high.
2008 2009 2010 2011 2012 2013
700080009000
100001100012000130001400015000160001700018000190002000021000
Sensex - Daily
-500
0QCSI - BSE ALL
Source: quant Global Research
Elliott Wave Analysis for Nifty
The market correction, which started from the peak of 2008, has taken a shape of a triangle and is fast approaching its last phase called the “Wave E” before the bull market resumes
Crucial Fibonacci time‐cycle approaching: on a monthly chart based on this, price bottoming can be seen in September 2013
Internal wave count of “E” wave is in the last leg and could get further divided into the “ABCDE” wave. We are at the completion of “A”
wave currently.
Long‐term count on Sensex
Exhibit 138: Elliott wave count on Sensex
Triangle pattern unfolding on a Quarterly Chart
Source: Spider software; quant Global Research
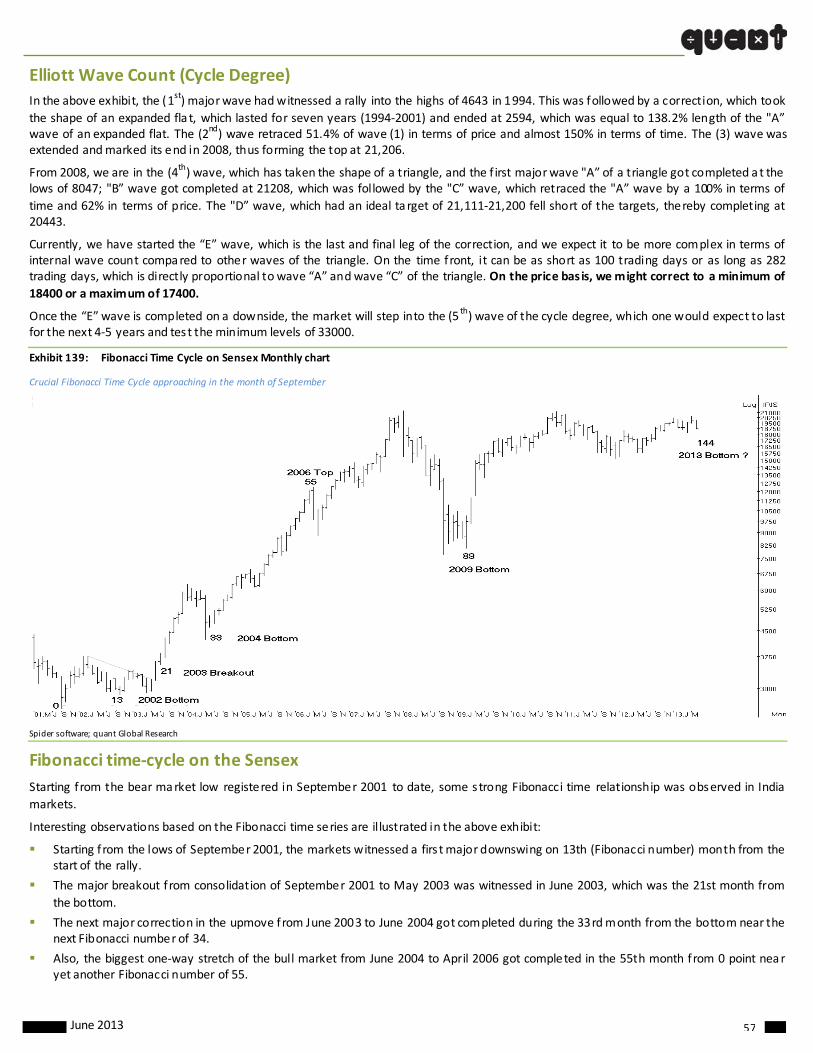
June 2013 57
Elliott Wave Count (Cycle Degree)
In the above exhibit, the (1st) major wave had witnessed a rally into the highs of 4643 in 1994. This was followed by a correction, which took
the shape of an expanded fla t, which lasted for seven years (1994‐2001) and ended at 2594, which was equal to 138.2% length of the "A” wave of an expanded flat. The (2nd) wave retraced 51.4% of wave (1) in terms of price and almost 150% in terms of time. The (3) wave was extended and marked its end in 2008, thus forming the top at 21,206.
From 2008, we are in the (4th) wave, which has taken the shape of a triangle, and the f irst major wave "A” of a triangle got completed at the lows of 8047; "B” wave got completed at 21208, which was followed by the "C” wave, which retraced the "A” wave by a 100% in terms of
time and 62% in terms of price. The "D” wave, which had an ideal ta rget of 21,111‐21,200 fell short of the targets, thereby completing at 20443.
Currently, we have started the “E” wave, which is the last and final leg of the correction, and we expect it to be more complex in terms of internal wave count compared to other waves of the triangle. On the time front, it can be as short as 100 trading days or as long as 282 trading days, which is directly proportional to wave “A” and wave “C” of the triangle. On the price basis, we might correct to a minimum of
18400 or a maximum of 17400.
Once the “E” wave is completed on a downside, the market will step into the (5th) wave of the cycle degree, which one would expect to last for the next 4‐5 years and test the minimum levels of 33000.
Exhibit 139: Fibonacci Time Cycle on Sensex Monthly chart
Crucial Fibonacci Time Cycle approaching in the month of September
Spider software; quant Global Research
Fibonacci time‐cycle on the Sensex
Starting from the bear market low registered in September 2001 to date, some strong Fibonacci time relationship was observed in India
markets.
Interesting observations based on the Fibonacci time series are il lustrated in the above exhibit:
Starting from the lows of September 2001, the markets witnessed a firs t major downswing on 13th (Fibonacci number) month from the start of the rally.
The major breakout from consolidation of September 2001 to May 2003 was witnessed in June 2003, which was the 21st month from
the bottom.
The next major correction in the upmove from June 2003 to June 2004 got completed during the 33rd month from the bottom near the next Fibonacci number of 34.
Also, the biggest one‐way stretch of the bull market from June 2004 to April 2006 got completed in the 55th month from 0 point near yet another Fibonacci number of 55.
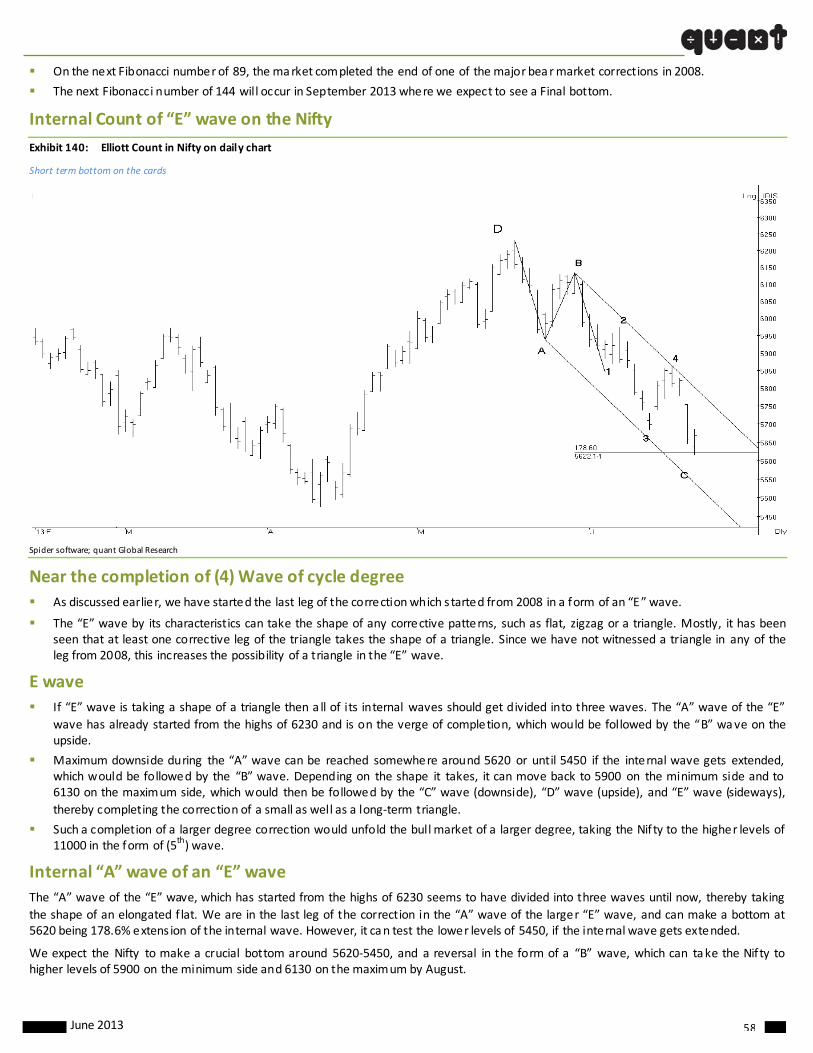
June 2013 58
On the next Fibonacci number of 89, the market completed the end of one of the major bear market corrections in 2008.
The next Fibonacci number of 144 will occur in September 2013 where we expect to see a Final bottom.
Internal Count of “E” wave on the Nifty
Exhibit 140: Elliott Count in Nifty on daily chart
Short term bottom on the cards
Spider software; quant Global Research
Near the completion of (4) Wave of cycle degree
As discussed earlier, we have started the last leg of the correction which started from 2008 in a form of an “E” wave.
The “E” wave by its characteristics can take the shape of any corrective patterns, such as flat, zigzag or a triangle. Mostly, it has been seen that at least one corrective leg of the triangle takes the shape of a triangle. Since we have not witnessed a triangle in any of the leg from 2008, this increases the possibility of a triangle in the “E” wave.
E wave
If “E” wave is taking a shape of a triangle then a ll of its internal waves should get divided into three waves. The “A” wave of the “E”
wave has already started from the highs of 6230 and is on the verge of completion, which would be followed by the “B” wave on the upside.
Maximum downside during the “A” wave can be reached somewhere around 5620 or until 5450 if the internal wave gets extended, which would be followed by the “B” wave. Depending on the shape it takes, it can move back to 5900 on the minimum side and to 6130 on the maximum side, which would then be followed by the “C” wave (downside), “D” wave (upside), and “E” wave (sideways),
thereby completing the correction of a small as well as a long‐term triangle.
Such a completion of a larger degree correction would unfold the bull market of a larger degree, taking the Nifty to the higher levels of 11000 in the form of (5th) wave.
Internal “A” wave of an “E” wave
The “A” wave of the “E” wave, which has started from the highs of 6230 seems to have divided into three waves until now, thereby taking
the shape of an elongated f lat. We are in the last leg of the correction in the “A” wave of the larger “E” wave, and can make a bottom at 5620 being 178.6% extens ion of the internal wave. However, it can test the lower levels of 5450, if the internal wave gets extended.
We expect the Nifty to make a crucial bottom around 5620‐5450, and a reversal in the form of a “B” wave, which can take the Nifty to higher levels of 5900 on the minimum side and 6130 on the maximum by August.

June 2013 59
Bank Nifty
A slowdown in the momentum of Bank Nifty in the form of negative divergence between QCSI and the index clearly pointed out for an
imminent weakness on near term basis. The index is taking support on its rising trendline. Generally this index leads the market and when it goes out of sync with Nifty, one should tread with caution. Simila rly the Bank Nifty has showcased euphoric characteristic and good trading top is in place. However our medium and long term outlook for private sector banks is still positive and buying on dips stra tegy would be rewarding. Exhibit 141: QCSI – BANK NIFTY
QCSI – Bank Nifty is losing momentum over the past the past few months. Generally, these kind of formations indicate either a halt or correction to an ongoing up move. Selective components of this index particularly PSU Banks will be under pressure on near term basis.
2006 2007 2008 2009 2010 2011 2012 2013
3000400050006000700080009000
10000110001200013000CNX BANK INDEX - DAILY
-40-30-20
-100
10203040
50QCSI - CNXBANK
Source: quant Global Research
Exhibit 142: BankNifty – quant Euphoria Index
2011 Feb Mar Apr May Jun Jul Aug Sep Oct Nov Dec 2013 Feb Mar Apr May Jun
8000
8500
9000
9500
10000
10500
11000
11500
12000
12500
13000
BANKNIFTY - Daily
quant Euphoria IndexTrading Top
Trading Top
Source: quant Global Research

June 2013 60
Exhibit 143: Time cycles in Indian equity markets can be observed on major indices like BSE Sensex and CNX Nifty. The current prominent cycle for our
market is 19 months cycle. This cycle has been effective from May 1995 onwards. The market has been moving in tranches of 19 months, up, down or
sideways. On some occasions, the previous cycle has continued its trend into the new cycle. On rarer cases the cycles has repeated for max of three
times. From May 1995 onwards, Sensex and Nifty has seen eleven 19 month cycles. The current cycle, 12th in the series which began in October 2012 is
showing signs of sideways / non‐trending bias similar to its prior two cycles. This cycle will end around May 2014 after which we call for new bullish
cycle.
The time cycle study of Indian market throws up some very interesting trend. The Nifty is moving in trances of 19 months from May 1995 and the current cycle began around October 2012 and would complete by May 2014. Going by historical time and price trend, this leg of the cycle could broadly be labelled as non‐trending.
94 96 97 98 99 00 01 02 03 04 05 06 07 08 010 10 11 12 13 14 15
1000
2000
3000
4000
5000
6000
7000NIFTY ‐ 19 MONTHS CYCLE
DN
NT
UP
UP
UP DN NT NT
NTNT
UP
Source: quant Global Research
Market participants positioning in the derivatives segment
The Retail positioning has been a leading indicator on market movement.
In the past few occurrences, retailers have remained sellers during a market rally and extreme selling has coincided with the market tops. Likewise, they have remained buyers during the slide and their extreme buying has marked a bottom.
Current participants OI positioning shows that retailers have been big buyers since the beginning of June 2013, and, hence, going by
previous instances, the markets could be in the process of bottom formation.
Retail Positioning – Futures
In June 2013, right from the start of the series we have seen the market in a corrective phase. From the highs of around 6120, we have seen covering of Retail Net Index Futures short positions and gradual crea tion of Net Index Futures Long positions recently.
Historically, we have seen that whenever the Retail Net Index Futures position has bottomed out, the market has topped; whenever the Retail Net Index Futures position has peaked out, the market has bottomed.
FII Positioning – Futures
Since the beginning of the June series, we have seen a sharp unwinding in the Net Index Futures Long positions of FIIs. FIIs have added fresh Short Index Futures positions recently of around 84k contracts. Since January 2012, we have seen that whenever FIIs have added Net Short Index Futures positions, the market has consolidated for a few weeks and then bottomed out, leading to a reversal in the FIIs’ Net Index Short Positions.
Options Positioning – FII and Retail
From Options Positioning point of view, FIIs have created massive shorts via options. On the other hand, Retail Options Positioning has been on an extreme Long side. Such a divergence in Retail and FII Options Positioning was last seen during May‐June 2012 where we had seen the markets making a short‐term bottom and consolidating for a quarter.

June 2013 61
After analyzing the above positioning of different market participants, we are of the view that we will see some consolidation, and, thereafter, resumption of an uptrend in the Nifty.
Exhibit 144: Market participants open interest in the derivatives segment (contracts)
Source: NSE, quant Global Research
Exhibit 145: Retail Positioning – Futures (contracts)
Source: NSE, quant Global Research
Exhibit 146: FII Positioning – Futures (contracts)
Source: NSE, quant Global Research
4,000
4,400
4,800
5,200
5,600
6,000
6,400
6,800
(2,000,000 )
(1,500,000 )
(1,000,000 )
(50 0,000)
‐
500,000
1,000,000
1,500,000
2,000,000
Jan‐12
Feb
‐12
Mar‐12
Apr‐12
May‐12
Jun‐12
Jul‐12
Aug‐12
Sep
‐12
Oct‐12
Nov‐12
Dec‐12
Jan‐13
Feb
‐13
Mar‐13
Apr‐13
May‐13
Jun‐13
Re tail Net Long (LHS) DII Net Long (LHS) FII Net Long (LHS) Prop Net Long (LHS) Nifty Index
Participants Open Interest
4000
4400
4800
5200
5600
6000
6400
6800
‐400000
‐200000
0
200000
400000
600000
800000
Jan‐12
Feb‐12
Mar‐12
Apr‐12
May‐12
Jun‐12
Jul‐1
2
Aug‐12
Sep‐12
Oct‐12
Nov‐12
Dec‐12
Jan‐13
Feb‐13
Mar‐13
Apr‐13
May‐13
Jun‐13
Net Future Index Net Future Stock Nifty Index
Retai l OI
4000
4400
4800
5200
5600
6000
6400
6800
‐800000
‐600000
‐400000
‐200000
0
200000
400000
600000
Jan‐12
Feb‐12
Mar‐12
Apr‐12
May‐12
Jun‐12
Jul‐12
Aug‐12
Sep‐12
Oct‐12
Nov‐12
Dec‐12
Jan‐13
Feb‐13
Mar‐13
Apr‐13
May‐13
Jun‐13
Net Future Index Net Future Stock Nifty Index
FII OI

June 2013 62
Exhibit 147: Options Positioning – FII and Retail (contracts)
Source: NSE, quant Global Research
India: Volatility analysis
Exhibit 148: Voluptuous Times: An India story
Source: quant Global Research
4000
4400
4800
5200
5600
6000
6400
6800
‐1500000
‐1000000
‐500000
0
500000
1000000
1500000
Jan‐12
Feb‐12
Mar‐12
Apr‐12
May‐12
Jun‐12
Jul‐12
Aug‐12
Sep‐12
Oct‐12
Nov‐12
Dec‐12
Jan‐13
Feb‐13
Mar‐13
Apr‐13
May‐13
Jun‐13
Retail Net Options long position FII Net Options long position Nifty Index
Options Positioning (FII & Retail)
NIFTY VIX and NIFTY Index
NIFTY Implied Vol v/s Realized Vol (Risk premium) NIFTY Historical Vol Cone
Summary
Nifty VIX rose to 19.03 from 18.35 last week as markets surged to
3m lows. Realized volatility inched up after the sharp move in Nifty
(1MHist vol : 17.74 and 2W Hist vol: 22.24).
Nif ty Implied volatility is now near the upper quartile of its trading
range over the last year. Spikes from subdued volatility regimes are
generally swift(as it was this week)anddifficult to predict.
We expect the ATM Implied Volatility to stabilize around 18%.
Traders are pricing in more macro news f low driven market
movement.12
14
16
18
20
22
24
4500
5000
5500
6000
6500
Jun‐12
Jul‐1
2
Aug‐12
Sep‐12
Oct‐1
2
Nov‐12
Dec‐12
Jan‐13
Feb‐13
Mar‐13
Apr‐1
3
May‐13
Ni fty Nifty VIX (RHS)
8
10
12
14
16
18
20
22
Jun‐12
Jul‐1
2
Aug‐12
Sep‐12
Oct‐1
2
Nov‐12
Dec‐12
Jan‐13
Feb‐13
Mar‐13
Apr‐1
3
May‐13
3m ATM Implied Vol 3m Forward Realized Vol
5%
10%
15%
20%
25%
30%
1m 2m 3m 4m 5m 6m 7m 8m 9m 10m 11m 12m
Current Imp Vol Current Reali zed Vol Max Medi an Min
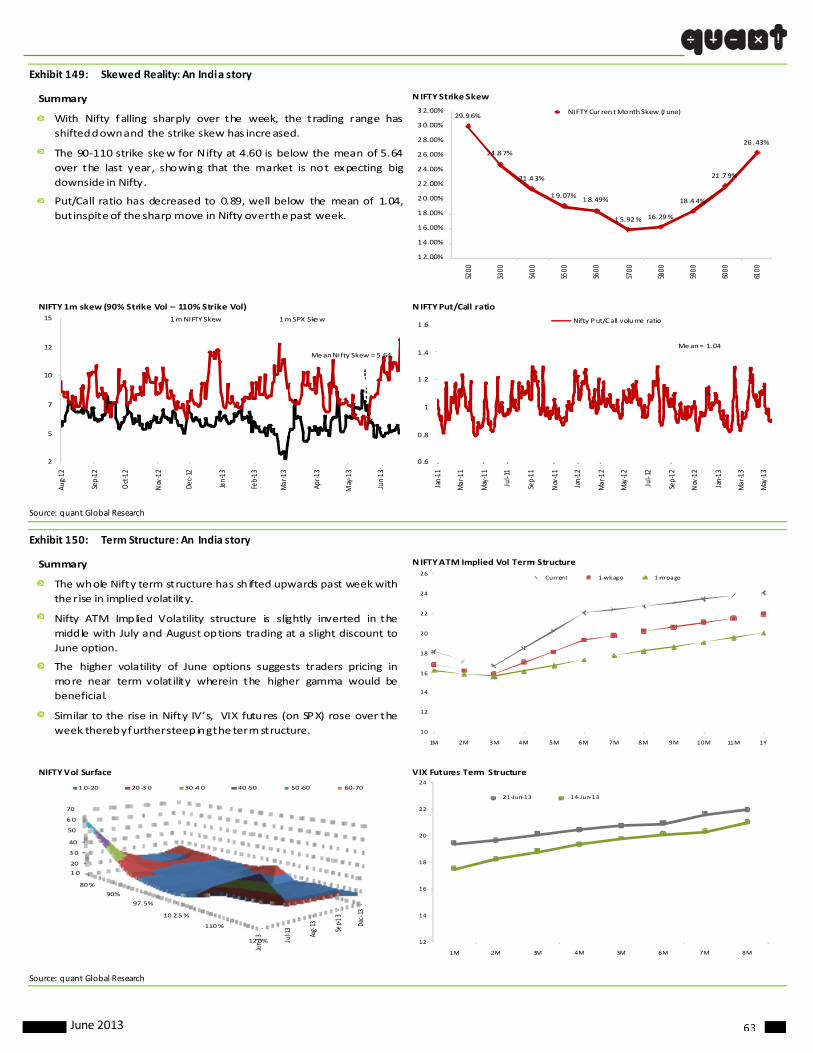
June 2013 63
Exhibit 149: Skewed Reality: An India story
Source: quant Global Research
Exhibit 150: Term Structure: An India story
Source: quant Global Research
NIFTY Strike Skew
NIFTY 1m skew (90% Strike Vol – 110% Strike Vol) N IFTY Put/Call ratio
Summary
With Nifty falling sharply over the week, the trading range has
shifteddownand the strike skew has increased.
The 90‐110 strike skew for Nifty at 4.60 is below the mean of 5.64
over the last year, showing that the market is not expecting big
downside in Nifty.
Put/Call ratio has decreased to 0.89, well below the mean of 1.04,
butinspiteof thesharp move in Nifty overthepast week.
2
5
7
10
12
15
Aug‐12
Sep‐12
Oct‐12
Nov‐12
Dec‐12
Jan‐13
Feb‐13
Mar‐13
Apr‐1
3
May‐13
Jun‐13
Mean Nifty Skew = 5 .64
1m NIFTY Skew 1m SPX Skew
0 .6
0 .8
1
1 .2
1 .4
1 .6
Jan‐11
Mar‐11
May‐11
Jul‐11
Sep‐11
Nov‐11
Jan‐12
Mar‐12
May‐12
Jul‐12
Sep‐12
Nov‐12
Jan‐13
Mar‐13
May‐13
Me an = 1.04
Nifty Put/Call volume ratio
29.96%
24 .87%
21 .43%
19.07%18.49%
15.92% 16.29%
18 .44%
21 .79%
26 .43%
12.00%
14.00%
16.00%
18.00%
20.00%
22.00%
24.00%
26.00%
28.00%
30.00%
32.00%
5200
5300
5400
5500
5600
5700
5800
5900
6000
6100
NIFTY Cur rent Month Skew (J une)
NIFTY ATM Implied Vol Term Structure
NIFTY Vol Surface VIX Futures Term Structure
Summary
The whole Nifty term structure has shifted upwards past weekwith
the rise in implied volatility.
Nifty ATM Implied Volatility structure is slightly inverted in the
middle with July and August options trading at a slight discount to
June option.
The higher volatility of June options suggests traders pricing in
more near term volatility wherein the higher gamma would be
beneficial.
Similar to the rise in Nifty IV’s, VIX futures (on SPX) rose over the
week therebyfurthersteepingthe termstructure. 10
12
14
16
18
20
22
24
26
1M 2M 3M 4M 5M 6M 7M 8M 9M 10M 11M 1Y
Current 1‐wk ago 1‐mo ago
Jun‐13
Jul‐13
Aug‐13
Sep‐13
Dec‐13
1 0
20
3 0
40
50
6 0
70
80%
90%
97.5%
10 2.5%
110%
12 0%
1 0‐20 20 ‐3 0 30 ‐4 0 40 ‐50 50 ‐60 60‐70
12
14
16
18
20
22
24
1M 2M 3M 4M 5M 6M 7M 8M
21‐Jun‐13 14‐Jun‐13
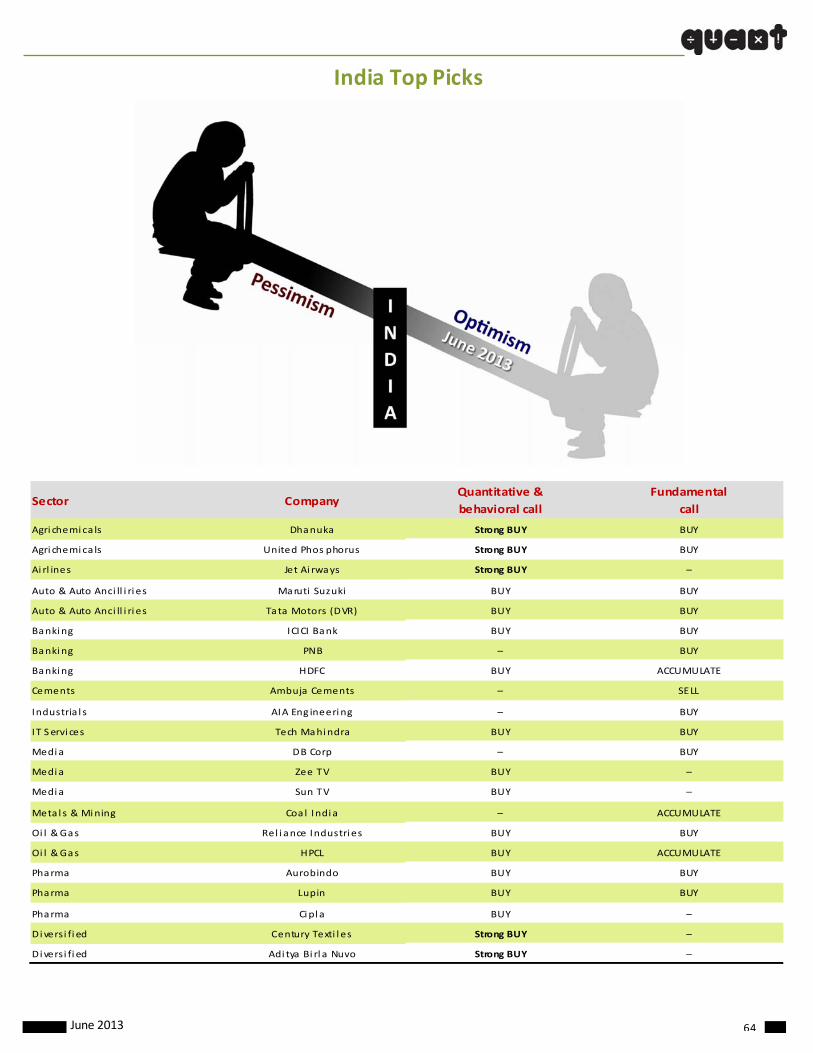
June 2013 64
India Top Picks
Sector CompanyQuantitative &
behavioral call
Fundamental
call
Agri chemica ls Dhanuka Strong BUY BUY
Agri chemica ls United Phos phorus Strong BUY BUY
Ai rl ines Jet Ai rways Strong BUY –
Auto & Auto Anci ll i ri es Maruti Suzuki BUY BUY
Auto & Auto Anci ll i ri es Tata Motors (DVR) BUY BUY
Banking ICICI Bank BUY BUY
Banking PNB – BUY
Banking HDFC BUY ACCUMULATE
Cements Ambuja Cements – SELL
Industria l s AIA Eng ineering – BUY
IT Servi ces Tech Mahindra BUY BUY
Media DB Corp – BUY
Media Zee TV BUY –
Media Sun TV BUY –
Meta l s & Mining Coa l Indi a – ACCUMULATE
Oi l & Gas Rel i ance Industri es BUY BUY
Oi l & Gas HPCL BUY ACCUMULATE
Pharma Aurobindo BUY BUY
Pharma Lupin BUY BUY
Pharma Cipl a BUY –
Diversi fi ed Century Texti l es Strong BUY –
Diversi fi ed Adi tya Bi rl a Nuvo Strong BUY –
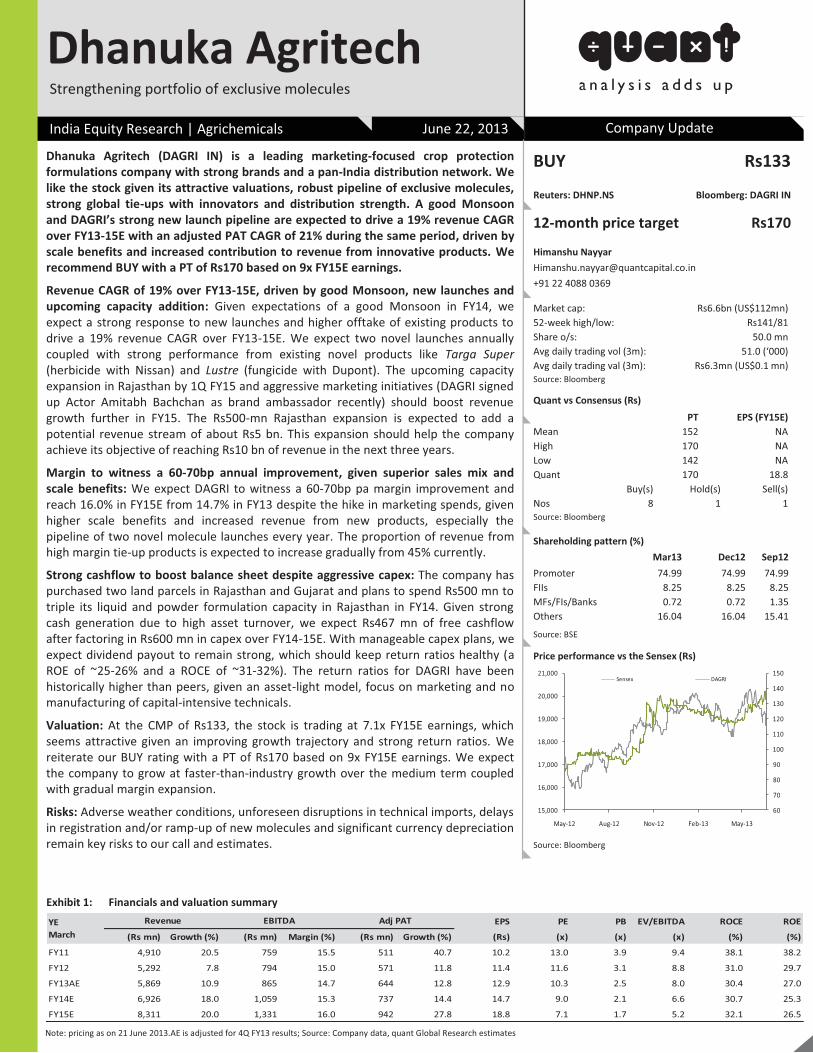
Chapter heading (1St heading)
Dhanuka Agritech (DAGRI IN) is a leading marketing-focused crop protection formulations company with strong brands and a pan-India distribution network. We like the stock given its attractive valuations, robust pipeline of exclusive molecules, strong global tie-ups with innovators and distribution strength. A good Monsoon and DAGRI’s strong new launch pipeline are expected to drive a 19% revenue CAGR over FY13-15E with an adjusted PAT CAGR of 21% during the same period, driven by scale benefits and increased contribution to revenue from innovative products. We recommend BUY with a PT of Rs170 based on 9x FY15E earnings.
Revenue CAGR of 19% over FY13-15E, driven by good Monsoon, new launches and upcoming capacity addition: Given expectations of a good Monsoon in FY14, we expect a strong response to new launches and higher offtake of existing products to drive a 19% revenue CAGR over FY13-15E. We expect two novel launches annually coupled with strong performance from existing novel products like Targa Super (herbicide with Nissan) and Lustre (fungicide with Dupont). The upcoming capacity expansion in Rajasthan by 1Q FY15 and aggressive marketing initiatives (DAGRI signed up Actor Amitabh Bachchan as brand ambassador recently) should boost revenue growth further in FY15. The Rs500-mn Rajasthan expansion is expected to add a potential revenue stream of about Rs5 bn. This expansion should help the company achieve its objective of reaching Rs10 bn of revenue in the next three years.
Margin to witness a 60-70bp annual improvement, given superior sales mix and scale benefits: We expect DAGRI to witness a 60-70bp pa margin improvement and reach 16.0% in FY15E from 14.7% in FY13 despite the hike in marketing spends, given higher scale benefits and increased revenue from new products, especially the pipeline of two novel molecule launches every year. The proportion of revenue from high margin tie-up products is expected to increase gradually from 45% currently.
Strong cashflow to boost balance sheet despite aggressive capex: The company has purchased two land parcels in Rajasthan and Gujarat and plans to spend Rs500 mn to triple its liquid and powder formulation capacity in Rajasthan in FY14. Given strong cash generation due to high asset turnover, we expect Rs467 mn of free cashflow after factoring in Rs600 mn in capex over FY14-15E. With manageable capex plans, we expect dividend payout to remain strong, which should keep return ratios healthy (a ROE of ~25-26% and a ROCE of ~31-32%). The return ratios for DAGRI have been historically higher than peers, given an asset-light model, focus on marketing and no manufacturing of capital-intensive technicals.
Valuation: At the CMP of Rs133, the stock is trading at 7.1x FY15E earnings, which seems attractive given an improving growth trajectory and strong return ratios. We reiterate our BUY rating with a PT of Rs170 based on 9x FY15E earnings. We expect the company to grow at faster-than-industry growth over the medium term coupled with gradual margin expansion.
Risks: Adverse weather conditions, unforeseen disruptions in technical imports, delays in registration and/or ramp-up of new molecules and significant currency depreciation remain key risks to our call and estimates.
BUY Rs133
Reuters: DHNP.NS Bloomberg: DAGRI IN
12-month price target Rs170
Himanshu Nayyar [email protected] +91 22 4088 0369
Market cap: Rs6.6bn (US$112mn) 52-week high/low: Rs141/81 Share o/s: 50.0 mn Avg daily trading vol (3m): 51.0 (‘000) Avg daily trading val (3m): Rs6.3mn (US$0.1 mn) Source: Bloomberg
Quant vs Consensus (Rs) PT EPS (FY15E) Mean 152 NA High 170 NA Low 142 NA Quant 170 18.8 Buy(s) Hold(s) Sell(s) Nos 8 1 1 Source: Bloomberg
Shareholding pattern (%) Mar13 Dec12 Sep12 Promoter 74.99 74.99 74.99 FIIs 8.25 8.25 8.25 MFs/FIs/Banks 0.72 0.72 1.35 Others 16.04 16.04 15.41
Source: BSE
Price performance vs the Sensex (Rs)
60
70
80
90
100
110
120
130
140
150
15,000
16,000
17,000
18,000
19,000
20,000
21,000
May-12 Aug-12 Nov-12 Feb-13 May-13
Sensex DAGRI
Source: Bloomberg
India Equity Research | Agrichemicals June 22, 2013 Company Update
Strengthening portfolio of exclusive molecules
Dhanuka Agritech
EPS PE PB EV/EBITDA ROCE ROE
(Rs mn) Growth (%) (Rs mn) Margin (%) (Rs mn) Growth (%) (Rs) (x) (x) (x) (%) (%)
FY11 4,910 20.5 759 15.5 511 40.7 10.2 13.0 3.9 9.4 38.1 38.2
FY12 5,292 7.8 794 15.0 571 11.8 11.4 11.6 3.1 8.8 31.0 29.7
FY13AE 5,869 10.9 865 14.7 644 12.8 12.9 10.3 2.5 8.0 30.4 27.0
FY14E 6,926 18.0 1,059 15.3 737 14.4 14.7 9.0 2.1 6.6 30.7 25.3
FY15E 8,311 20.0 1,331 16.0 942 27.8 18.8 7.1 1.7 5.2 32.1 26.5
YEMarch
Revenue EBITDA Adj PAT
Exhibit 1: Financials and valuation summary
Note: pricing as on 21 June 2013.AE is adjusted for 4Q FY13 results; Source: Company data, quant Global Research estimates
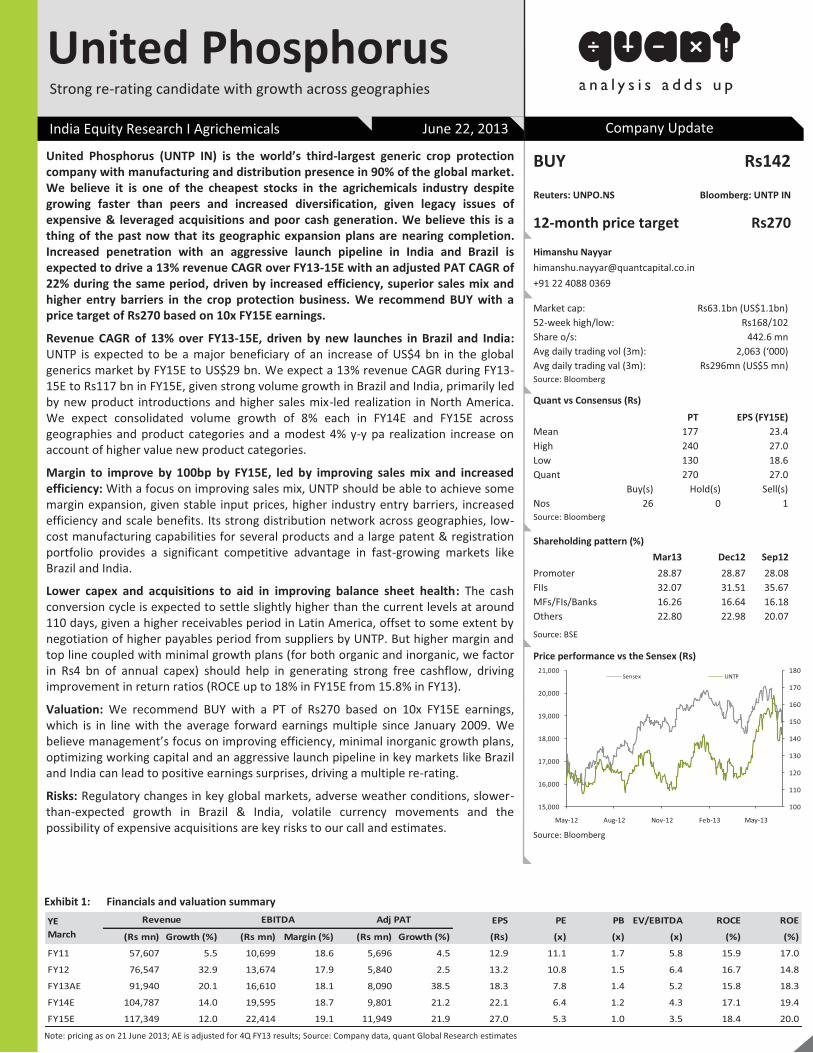
Chapter heading (1St heading)
United Phosphorus (UNTP IN) is the world’s third-largest generic crop protection company with manufacturing and distribution presence in 90% of the global market. We believe it is one of the cheapest stocks in the agrichemicals industry despite growing faster than peers and increased diversification, given legacy issues of expensive & leveraged acquisitions and poor cash generation. We believe this is a thing of the past now that its geographic expansion plans are nearing completion. Increased penetration with an aggressive launch pipeline in India and Brazil is expected to drive a 13% revenue CAGR over FY13-15E with an adjusted PAT CAGR of 22% during the same period, driven by increased efficiency, superior sales mix and higher entry barriers in the crop protection business. We recommend BUY with a price target of Rs270 based on 10x FY15E earnings.
Revenue CAGR of 13% over FY13-15E, driven by new launches in Brazil and India: UNTP is expected to be a major beneficiary of an increase of US$4 bn in the global generics market by FY15E to US$29 bn. We expect a 13% revenue CAGR during FY13-15E to Rs117 bn in FY15E, given strong volume growth in Brazil and India, primarily led by new product introductions and higher sales mix-led realization in North America. We expect consolidated volume growth of 8% each in FY14E and FY15E across geographies and product categories and a modest 4% y-y pa realization increase on account of higher value new product categories.
Margin to improve by 100bp by FY15E, led by improving sales mix and increased efficiency: With a focus on improving sales mix, UNTP should be able to achieve some margin expansion, given stable input prices, higher industry entry barriers, increased efficiency and scale benefits. Its strong distribution network across geographies, low-cost manufacturing capabilities for several products and a large patent & registration portfolio provides a significant competitive advantage in fast-growing markets like Brazil and India.
Lower capex and acquisitions to aid in improving balance sheet health: The cash conversion cycle is expected to settle slightly higher than the current levels at around 110 days, given a higher receivables period in Latin America, offset to some extent by negotiation of higher payables period from suppliers by UNTP. But higher margin and top line coupled with minimal growth plans (for both organic and inorganic, we factor in Rs4 bn of annual capex) should help in generating strong free cashflow, driving improvement in return ratios (ROCE up to 18% in FY15E from 15.8% in FY13).
Valuation: We recommend BUY with a PT of Rs270 based on 10x FY15E earnings, which is in line with the average forward earnings multiple since January 2009. We believe management’s focus on improving efficiency, minimal inorganic growth plans, optimizing working capital and an aggressive launch pipeline in key markets like Brazil and India can lead to positive earnings surprises, driving a multiple re-rating.
Risks: Regulatory changes in key global markets, adverse weather conditions, slower-than-expected growth in Brazil & India, volatile currency movements and the possibility of expensive acquisitions are key risks to our call and estimates.
BUY Rs142
Reuters: UNPO.NS Bloomberg: UNTP IN
12-month price target Rs270
Himanshu Nayyar [email protected] +91 22 4088 0369
Market cap: Rs63.1bn (US$1.1bn) 52-week high/low: Rs168/102 Share o/s: 442.6 mn Avg daily trading vol (3m): 2,063 (‘000) Avg daily trading val (3m): Rs296mn (US$5 mn) Source: Bloomberg
Quant vs Consensus (Rs) PT EPS (FY15E) Mean 177 23.4 High 240 27.0 Low 130 18.6 Quant 270 27.0 Buy(s) Hold(s) Sell(s) Nos 26 0 1 Source: Bloomberg
Shareholding pattern (%) Mar13 Dec12 Sep12 Promoter 28.87 28.87 28.08 FIIs 32.07 31.51 35.67 MFs/FIs/Banks 16.26 16.64 16.18 Others 22.80 22.98 20.07
Source: BSE
Price performance vs the Sensex (Rs)
100
110
120
130
140
150
160
170
180
15,000
16,000
17,000
18,000
19,000
20,000
21,000
May-12 Aug-12 Nov-12 Feb-13 May-13
Sensex UNTP
Source: Bloomberg
India Equity Research I Agrichemicals June 22, 2013 Company Update
Strong re-rating candidate with growth across geographies
United Phosphorus
EPS PE PB EV/EBITDA ROCE ROE
(Rs mn) Growth (%) (Rs mn) Margin (%) (Rs mn) Growth (%) (Rs) (x) (x) (x) (%) (%)
FY11 57,607 5.5 10,699 18.6 5,696 4.5 12.9 11.1 1.7 5.8 15.9 17.0
FY12 76,547 32.9 13,674 17.9 5,840 2.5 13.2 10.8 1.5 6.4 16.7 14.8
FY13AE 91,940 20.1 16,610 18.1 8,090 38.5 18.3 7.8 1.4 5.2 15.8 18.3
FY14E 104,787 14.0 19,595 18.7 9,801 21.2 22.1 6.4 1.2 4.3 17.1 19.4
FY15E 117,349 12.0 22,414 19.1 11,949 21.9 27.0 5.3 1.0 3.5 18.4 20.0
YEMarch
Revenue EBITDA Adj PAT
Exhibit 1: Financials and valuation summary
Note: pricing as on 21 June 2013; AE is adjusted for 4Q FY13 results; Source: Company data, quant Global Research estimates

Tata Motors India Equity Research | Auto & Auto Ancillaries Company Update June 22, 2013
Maruti Suzuki Shifting towards higher margin base
We recommend BUY on Maruti Suzuki (MSIL IN) with a PT of Rs2,228 based on 16x FY15E core EPS and Rs362/share cash. We are confident that EBITDA margin will return to the 12-13% levels from FY14E vs sub-10% over FY11-13, led by a favourable USD-JPY movement, SPIL merger, peaking out of petrol model discounts and improving economies of scale despite an adverse USD-INR rate. We factor in a 11% volume CAGR over FY13-15E to 1.45 mn units in FY15E. We expect recovery in the petrol portfolio, steady demand for D’zire & Ertiga (CNG version launched) as well as the proposed new SUV model XA Alpha to drive volume growth over FY14-15.
EBITDA margin set to touch 12-13% levels: We expect EBITDA margin to return to 12-13% over FY14-15E on the back of a favourable USD-JPY move, SPIL merger, peaking out of petrol model discounts and better economies of scale despite an adverse USD-INR rate. Despite demand for diesel models showing signs of weakness, we believe revenue mix of higher margin models in the form of Swift, D’zire, Ertiga and to be launched XA Alpha to be ~60% in FY15E, thus keeping the product mix rich. We factor in a USD-JPY rate at 95 for FY14-15E along with a USD-INR rate at 55 to arrive at our margin assumptions. We believe it is premature to factor in a USD-INR rate at ~60 and curtail our margin estimates currently. Thus, we would revisit at our margin estimates in case the exchange rate remains within 58-60 levels for the next 3-4 months.
We model in a volume CAGR of 11.4% over FY13-15E: We expect MSIL volume to reach 1.45 mn by FY15E, compounding at 11.4% over FY13-15E. We believe pent-up demand of the past couple of years and rising disposable income along with lower lending rates and falling petrol prices will prop up petrol car demand from FY14. Additionally with diesel car demand set to remain steady, we believe the doubling in diesel engine capacity to 0.6 mn by FY15 will help MSIL increase sales of D’zire along with launching the new SUV XA Alpha. We believe the inherent demand drivers for a steady 12% CAGR in PV demand growth in India are intact in the form of rising urbanisation, low PV penetration, rising disposable income and improving road infrastructure. With the UV-PV mix in India still being at a paltry 20% vs 40-50% in the developed markets, we believe MSIL is finally focussing in the right high growth area through models like Ertiga and XA Alpha to enhance its overall share. Also, MSIL is going to focus on exports growth by tapping new markets like Africa and LATAM to substitute ailing sales from the EU in addition to exporting Ertiga kits to Mazda and Suzuki’s Indonesia operations.
We expect ROCE to recover to the 18-20% levels from FY14E after a two-year lull: We expect ROCE of MSIL to recover to the 18-20% levels, after a lull of a couple of years, led by adverse currency movement, labour trouble at production facilities and a slowdown in petrol car demand. We expect cash & equivalent on books at Rs140 bn by FY15E against a current market cap of Rs470 bn.
Valuation: We have a PT of Rs2,228 based on 16x FY15E P/E. We value cash/share at Rs362. Any further weakening in JPY against the USD would lead to a rerating, which we have not factored into our numbers.
Risks: A sharp rise in input commodity prices along with JPY strengthening, a depreciating rupee, and rise in excise duty on diesel models and any resumption of labour troubles are the key risks to our call and estimates.
BUY Rs1,555 Reuters: MRTI.BO Bloomberg: MSIL IN
12-month price target Rs2,228 Basudeb Banerjee [email protected] 91 22 4088 0375
Ankit Pande [email protected] 91 22 4088 0393
Market cap Rs470 bn /US$7.9 bn 52 week high/low: Rs1,777/Rs1,062 Share o/s: 302 mn Share o/s (fully diluted): 302 mn Avg daily trading vol (3m): 668 ('000) Avg daily trading val (3m): Rs1,035 mn (US$18 mn) Source: Bloomberg
quant vs Consensus (Rs) PT EPS (FY15E) Mean 1,880 123.3 High 2,259 149.6 Low 1,430 109.4 quant 2,228 149.6 Buy(s) Hold(s) Sell(s) Nos 49 10 8 Source: Bloomberg
Shareholding pattern (%)
Mar13 Dec12 Sep12
Promoter 56.2 54.2 54.2 FIIs 22.4 23.1 20.5 MFs/FIs/Banks 12.6 14.4 16.2 Others 8.8 8.3 9.2 Source: BSE
Price movement (Rs) vs the Sensex
15,000
16,000
17,000
18,000
19,000
20,000
21,000
1,000
1,100
1,200
1,300
1,400
1,500
1,600
1,700
Jun-
12
Jul-1
2
Aug-
12
Sep-
12
Oct-1
2
Nov-
12
Dec-
12
Jan-
13
Feb-
13
Mar
-13
Apr-1
3
May
-13
Jun-
13
MSIL IN (Rs) Sensex (RHS)
Source: Bloomberg
Exhibit 1: Financials and valuation
Note: pricing as on 21 June 2013; AE is adjusted for 4Q FY13 results; Source: Company data, quant Global Research estimates
EPS PE EV/EBITDA ROCE ROE
(Rs mn) Growth (%) (Rs mn) Margin (%) (Rs mn) Growth (%) (Rs) (x) (x) (%) (%)
FY11 370,401 25.0 36,043 9.9 22,886 (8.4) 79.2 19.6 10.4 20.1 17.8
FY12 355,871 (3.9) 23,818 7.1 16,352 (28.5) 56.6 27.5 15.2 8.8 11.3
FY13AE 435,879 22.5 42,531 9.7 23,921 46.3 79.2 19.6 9.7 12.8 14.2
FY14E 493,990 13.3 61,768 12.5 38,620 61.4 127.9 12.2 6.2 18.9 19.0
FY15E 572,278 15.8 71,597 12.5 45,168 17.0 149.6 10.4 4.9 18.8 18.7
Adj PATRevenue EBITDAYE March
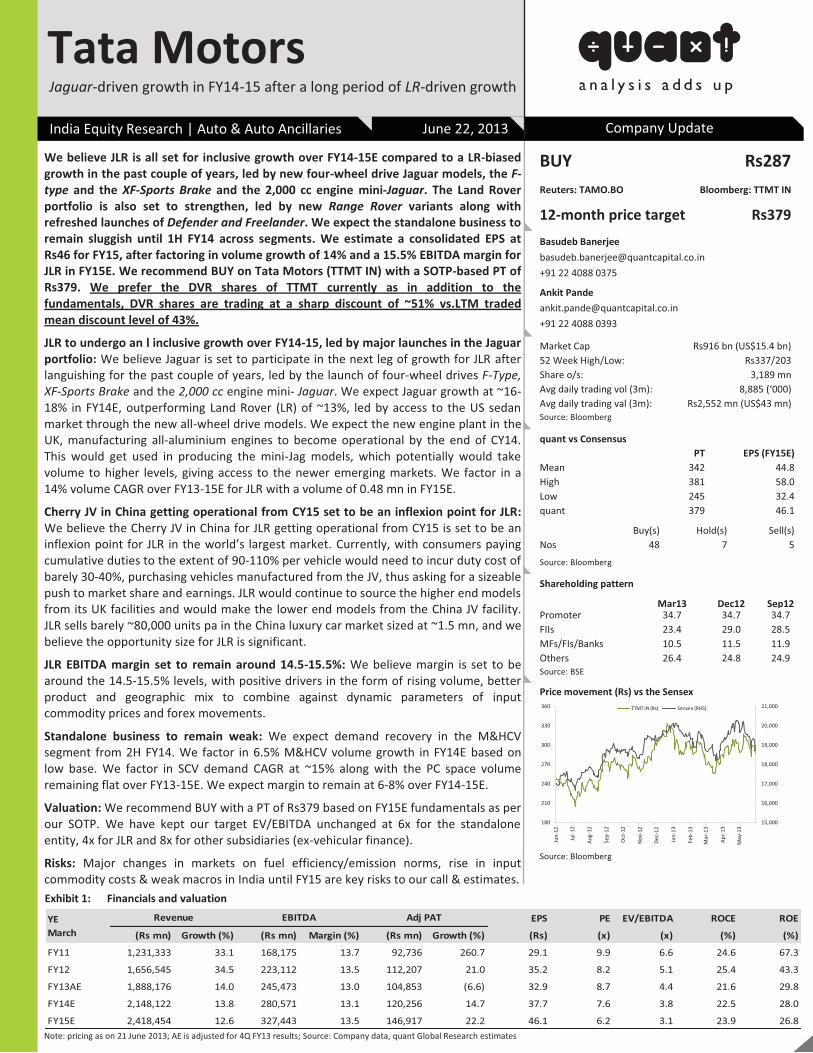
Chapter heading (1St heading)
BUY Rs287 Reuters: TAMO.BO Bloomberg: TTMT IN
12-month price target Rs379 Basudeb Banerjee [email protected] +91 22 4088 0375
Ankit Pande [email protected] +91 22 4088 0393
Market Cap Rs916 bn (US$15.4 bn) 52 Week High/Low: Rs337/203 Share o/s: 3,189 mn Avg daily trading vol (3m): 8,885 (‘000) Avg daily trading val (3m): Rs2,552 mn (US$43 mn) Source: Bloomberg
quant vs Consensus PT EPS (FY15E) Mean 342 44.8 High 381 58.0 Low 245 32.4 quant 379 46.1
Buy(s) Hold(s) Sell(s) Nos 48 7 5
Source: Bloomberg
Shareholding pattern
Mar13 Dec12 Sep12 Promoter 34.7 34.7 34.7 FIIs 23.4 29.0 28.5 MFs/FIs/Banks 10.5 11.5 11.9 Others 26.4 24.8 24.9 Source: BSE
Price movement (Rs) vs the Sensex
15,000
16,000
17,000
18,000
19,000
20,000
21,000
180
210
240
270
300
330
360
Jun-
12
Jul-1
2
Aug-
12
Sep-
12
Oct
-12
Nov
-12
Dec-
12
Jan-
13
Feb-
13
Mar
-13
Apr-
13
May
-13
TTMT IN (Rs) Sensex (RHS)
Source: Bloomberg
We believe JLR is all set for inclusive growth over FY14-15E compared to a LR-biased growth in the past couple of years, led by new four-wheel drive Jaguar models, the F-type and the XF-Sports Brake and the 2,000 cc engine mini-Jaguar. The Land Rover portfolio is also set to strengthen, led by new Range Rover variants along with refreshed launches of Defender and Freelander. We expect the standalone business to remain sluggish until 1H FY14 across segments. We estimate a consolidated EPS at Rs46 for FY15, after factoring in volume growth of 14% and a 15.5% EBITDA margin for JLR in FY15E. We recommend BUY on Tata Motors (TTMT IN) with a SOTP-based PT of Rs379. We prefer the DVR shares of TTMT currently as in addition to the fundamentals, DVR shares are trading at a sharp discount of ~51% vs.LTM traded mean discount level of 43%.
JLR to undergo an l inclusive growth over FY14-15, led by major launches in the Jaguar portfolio: We believe Jaguar is set to participate in the next leg of growth for JLR after languishing for the past couple of years, led by the launch of four-wheel drives F-Type, XF-Sports Brake and the 2,000 cc engine mini- Jaguar. We expect Jaguar growth at ~16-18% in FY14E, outperforming Land Rover (LR) of ~13%, led by access to the US sedan market through the new all-wheel drive models. We expect the new engine plant in the UK, manufacturing all-aluminium engines to become operational by the end of CY14. This would get used in producing the mini-Jag models, which potentially would take volume to higher levels, giving access to the newer emerging markets. We factor in a 14% volume CAGR over FY13-15E for JLR with a volume of 0.48 mn in FY15E.
Cherry JV in China getting operational from CY15 set to be an inflexion point for JLR: We believe the Cherry JV in China for JLR getting operational from CY15 is set to be an inflexion point for JLR in the world’s largest market. Currently, with consumers paying cumulative duties to the extent of 90-110% per vehicle would need to incur duty cost of barely 30-40%, purchasing vehicles manufactured from the JV, thus asking for a sizeable push to market share and earnings. JLR would continue to source the higher end models from its UK facilities and would make the lower end models from the China JV facility. JLR sells barely ~80,000 units pa in the China luxury car market sized at ~1.5 mn, and we believe the opportunity size for JLR is significant.
JLR EBITDA margin set to remain around 14.5-15.5%: We believe margin is set to be around the 14.5-15.5% levels, with positive drivers in the form of rising volume, better product and geographic mix to combine against dynamic parameters of input commodity prices and forex movements.
Standalone business to remain weak: We expect demand recovery in the M&HCV segment from 2H FY14. We factor in 6.5% M&HCV volume growth in FY14E based on low base. We factor in SCV demand CAGR at ~15% along with the PC space volume remaining flat over FY13-15E. We expect margin to remain at 6-8% over FY14-15E.
Valuation: We recommend BUY with a PT of Rs379 based on FY15E fundamentals as per our SOTP. We have kept our target EV/EBITDA unchanged at 6x for the standalone entity, 4x for JLR and 8x for other subsidiaries (ex-vehicular finance).
Risks: Major changes in markets on fuel efficiency/emission norms, rise in input commodity costs & weak macros in India until FY15 are key risks to our call & estimates.
India Equity Research | Auto & Auto Ancillaries June 22, 2013 Company Update
Jaguar-driven growth in FY14-15 after a long period of LR-driven growth
Tata Motors
Note: pricing as on 21 June 2013; AE is adjusted for 4Q FY13 results; Source: Company data, quant Global Research estimates
Exhibit 1: Financials and valuation
EPS PE EV/EBITDA ROCE ROE
(Rs mn) Growth (%) (Rs mn) Margin (%) (Rs mn) Growth (%) (Rs) (x) (x) (%) (%)
FY11 1,231,333 33.1 168,175 13.7 92,736 260.7 29.1 9.9 6.6 24.6 67.3
FY12 1,656,545 34.5 223,112 13.5 112,207 21.0 35.2 8.2 5.1 25.4 43.3
FY13AE 1,888,176 14.0 245,473 13.0 104,853 (6.6) 32.9 8.7 4.4 21.6 29.8
FY14E 2,148,122 13.8 280,571 13.1 120,256 14.7 37.7 7.6 3.8 22.5 28.0
FY15E 2,418,454 12.6 327,443 13.5 146,917 22.2 46.1 6.2 3.1 23.9 26.8
YEMarch
Revenue EBITDA Adj PAT
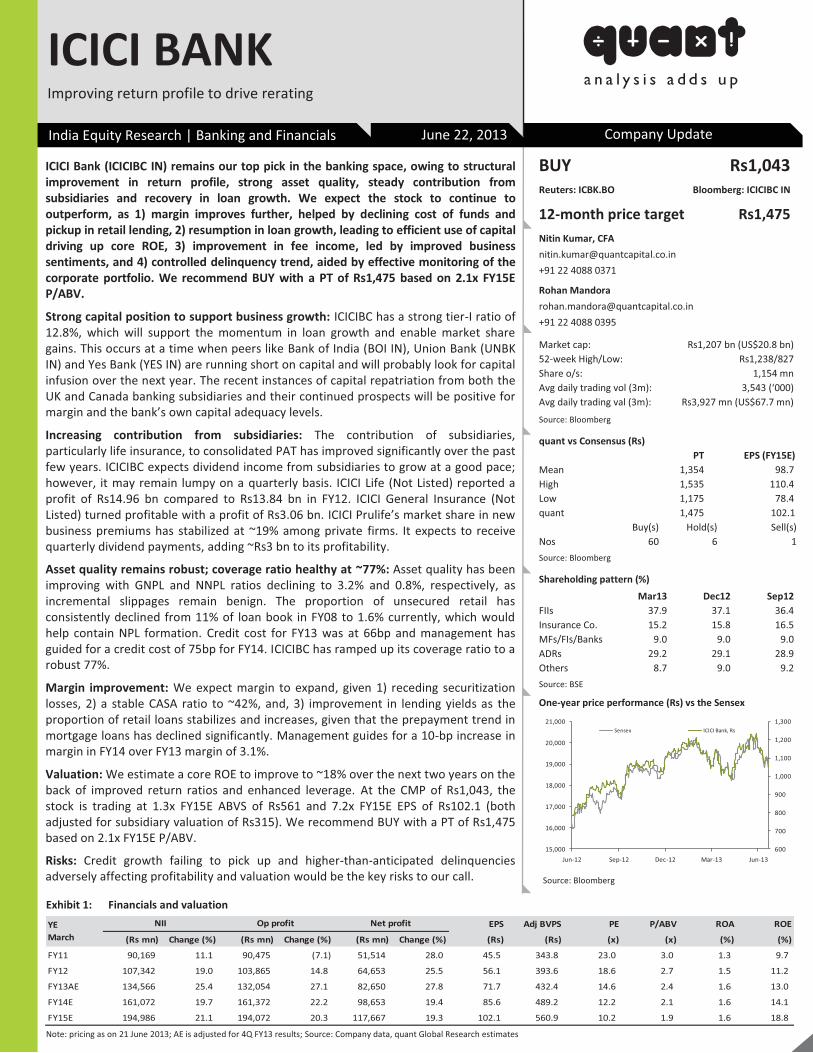
111
BUY Rs1,043 Reuters: ICBK.BO Bloomberg: ICICIBC IN
12-month price target Rs1,475 Nitin Kumar, CFA [email protected] +91 22 4088 0371
Rohan Mandora [email protected] +91 22 4088 0395
Market cap: Rs1,207 bn (US$20.8 bn) 52-week High/Low: Rs1,238/827 Share o/s: 1,154 mn Avg daily trading vol (3m): 3,543 (‘000) Avg daily trading val (3m): Rs3,927 mn (US$67.7 mn)
Source: Bloomberg
quant vs Consensus (Rs) PT EPS (FY15E)
Mean 1,354 98.7 High 1,535 110.4 Low 1,175 78.4 quant 1,475 102.1 Buy(s) Hold(s) Sell(s) Nos 60 6 1 Source: Bloomberg
Shareholding pattern (%) Mar13 Dec12 Sep12
FIIs 37.9 37.1 36.4 Insurance Co. 15.2 15.8 16.5 MFs/FIs/Banks 9.0 9.0 9.0 ADRs 29.2 29.1 28.9 Others 8.7 9.0 9.2 Source: BSE
One-year price performance (Rs) vs the Sensex
Source: Bloomberg
ICICI Bank (ICICIBC IN) remains our top pick in the banking space, owing to structural improvement in return profile, strong asset quality, steady contribution from subsidiaries and recovery in loan growth. We expect the stock to continue to outperform, as 1) margin improves further, helped by declining cost of funds and pickup in retail lending, 2) resumption in loan growth, leading to efficient use of capital driving up core ROE, 3) improvement in fee income, led by improved business sentiments, and 4) controlled delinquency trend, aided by effective monitoring of the corporate portfolio. We recommend BUY with a PT of Rs1,475 based on 2.1x FY15E P/ABV.
Strong capital position to support business growth: ICICIBC has a strong tier-I ratio of 12.8%, which will support the momentum in loan growth and enable market share gains. This occurs at a time when peers like Bank of India (BOI IN), Union Bank (UNBK IN) and Yes Bank (YES IN) are running short on capital and will probably look for capital infusion over the next year. The recent instances of capital repatriation from both the UK and Canada banking subsidiaries and their continued prospects will be positive for margin and the bank’s own capital adequacy levels.
Increasing contribution from subsidiaries: The contribution of subsidiaries, particularly life insurance, to consolidated PAT has improved significantly over the past few years. ICICIBC expects dividend income from subsidiaries to grow at a good pace; however, it may remain lumpy on a quarterly basis. ICICI Life (Not Listed) reported a profit of Rs14.96 bn compared to Rs13.84 bn in FY12. ICICI General Insurance (Not Listed) turned profitable with a profit of Rs3.06 bn. ICICI Prulife’s market share in new business premiums has stabilized at ~19% among private firms. It expects to receive quarterly dividend payments, adding ~Rs3 bn to its profitability.
Asset quality remains robust; coverage ratio healthy at ~77%: Asset quality has been improving with GNPL and NNPL ratios declining to 3.2% and 0.8%, respectively, as incremental slippages remain benign. The proportion of unsecured retail has consistently declined from 11% of loan book in FY08 to 1.6% currently, which would help contain NPL formation. Credit cost for FY13 was at 66bp and management has guided for a credit cost of 75bp for FY14. ICICIBC has ramped up its coverage ratio to a robust 77%.
Margin improvement: We expect margin to expand, given 1) receding securitization losses, 2) a stable CASA ratio to ~42%, and, 3) improvement in lending yields as the proportion of retail loans stabilizes and increases, given that the prepayment trend in mortgage loans has declined significantly. Management guides for a 10-bp increase in margin in FY14 over FY13 margin of 3.1%.
Valuation: We estimate a core ROE to improve to ~18% over the next two years on the back of improved return ratios and enhanced leverage. At the CMP of Rs1,043, the stock is trading at 1.3x FY15E ABVS of Rs561 and 7.2x FY15E EPS of Rs102.1 (both adjusted for subsidiary valuation of Rs315). We recommend BUY with a PT of Rs1,475 based on 2.1x FY15E P/ABV.
Risks: Credit growth failing to pick up and higher-than-anticipated delinquencies adversely affecting profitability and valuation would be the key risks to our call.
600
700
800
900
1,000
1,100
1,200
1,300
15,000
16,000
17,000
18,000
19,000
20,000
21,000
Jun-12 Sep-12 Dec-12 Mar-13 Jun-13
Sensex ICICI Bank, Rs
India Equity Research | Banking and Financials June 22, 2013 Company Update
ICICI BANK Improving return profile to drive rerating
EPS Adj BVPS PE P/ABV ROA ROE
(Rs mn) Change (%) (Rs mn) Change (%) (Rs mn) Change (%) (Rs) (Rs) (x) (x) (%) (%)
FY11 90,169 11.1 90,475 (7.1) 51,514 28.0 45.5 343.8 23.0 3.0 1.3 9.7
FY12 107,342 19.0 103,865 14.8 64,653 25.5 56.1 393.6 18.6 2.7 1.5 11.2
FY13AE 134,566 25.4 132,054 27.1 82,650 27.8 71.7 432.4 14.6 2.4 1.6 13.0
FY14E 161,072 19.7 161,372 22.2 98,653 19.4 85.6 489.2 12.2 2.1 1.6 14.1
FY15E 194,986 21.1 194,072 20.3 117,667 19.3 102.1 560.9 10.2 1.9 1.6 18.8
NII Net profitOp profitYE March
Exhibit 1: Financials and valuation
Note: pricing as on 21 June 2013; AE is adjusted for 4Q FY13 results; Source: Company data, quant Global Research estimates
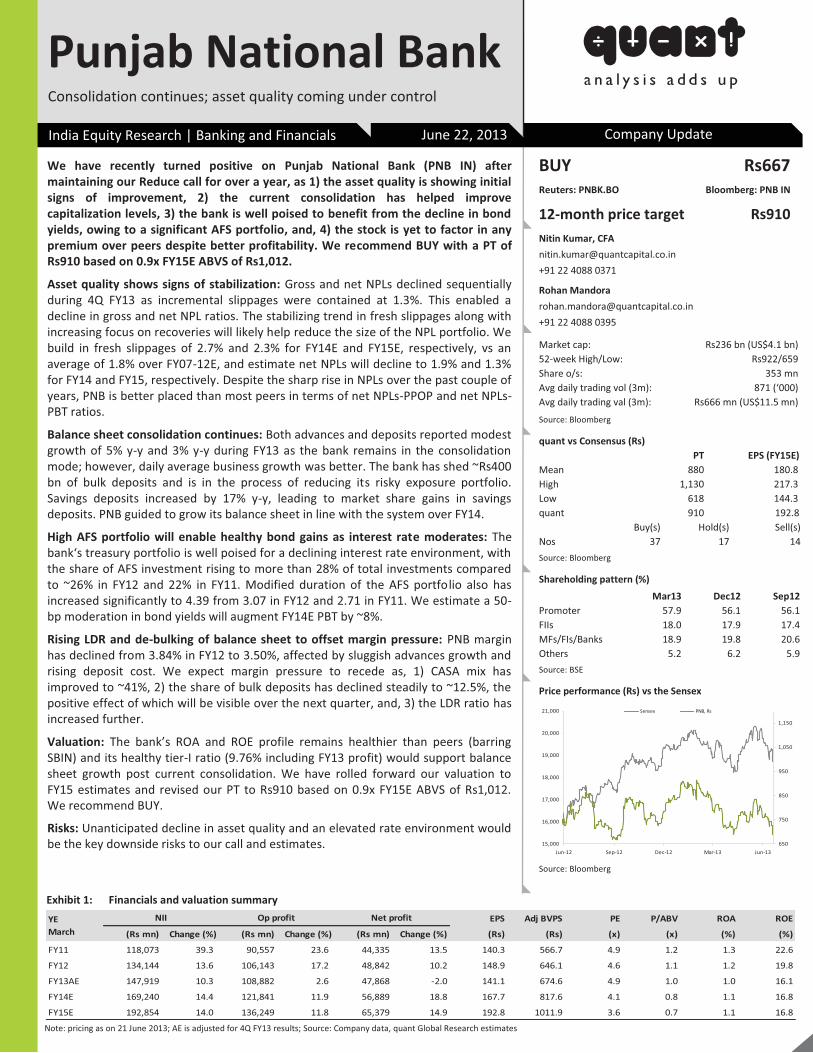
111
BUY Rs667 Reuters: PNBK.BO Bloomberg: PNB IN
12-month price target Rs910 Nitin Kumar, CFA [email protected] +91 22 4088 0371
Rohan Mandora [email protected] +91 22 4088 0395
Market cap: Rs236 bn (US$4.1 bn) 52-week High/Low: Rs922/659 Share o/s: 353 mn Avg daily trading vol (3m): 871 (‘000) Avg daily trading val (3m): Rs666 mn (US$11.5 mn)
Source: Bloomberg
quant vs Consensus (Rs) PT EPS (FY15E)
Mean 880 180.8 High 1,130 217.3 Low 618 144.3 quant 910 192.8
Buy(s) Hold(s) Sell(s) Nos 37 17 14 Source: Bloomberg
Shareholding pattern (%) Mar13 Dec12 Sep12
Promoter 57.9 56.1 56.1 FIIs 18.0 17.9 17.4 MFs/FIs/Banks 18.9 19.8 20.6 Others 5.2 6.2 5.9 Source: BSE
Price performance (Rs) vs the Sensex
Source: Bloomberg
We have recently turned positive on Punjab National Bank (PNB IN) after maintaining our Reduce call for over a year, as 1) the asset quality is showing initial signs of improvement, 2) the current consolidation has helped improve capitalization levels, 3) the bank is well poised to benefit from the decline in bond yields, owing to a significant AFS portfolio, and, 4) the stock is yet to factor in any premium over peers despite better profitability. We recommend BUY with a PT of Rs910 based on 0.9x FY15E ABVS of Rs1,012.
Asset quality shows signs of stabilization: Gross and net NPLs declined sequentially during 4Q FY13 as incremental slippages were contained at 1.3%. This enabled a decline in gross and net NPL ratios. The stabilizing trend in fresh slippages along with increasing focus on recoveries will likely help reduce the size of the NPL portfolio. We build in fresh slippages of 2.7% and 2.3% for FY14E and FY15E, respectively, vs an average of 1.8% over FY07-12E, and estimate net NPLs will decline to 1.9% and 1.3% for FY14 and FY15, respectively. Despite the sharp rise in NPLs over the past couple of years, PNB is better placed than most peers in terms of net NPLs-PPOP and net NPLs-PBT ratios.
Balance sheet consolidation continues: Both advances and deposits reported modest growth of 5% y-y and 3% y-y during FY13 as the bank remains in the consolidation mode; however, daily average business growth was better. The bank has shed ~Rs400 bn of bulk deposits and is in the process of reducing its risky exposure portfolio. Savings deposits increased by 17% y-y, leading to market share gains in savings deposits. PNB guided to grow its balance sheet in line with the system over FY14.
High AFS portfolio will enable healthy bond gains as interest rate moderates: The bank‘s treasury portfolio is well poised for a declining interest rate environment, with the share of AFS investment rising to more than 28% of total investments compared to ~26% in FY12 and 22% in FY11. Modified duration of the AFS portfolio also has increased significantly to 4.39 from 3.07 in FY12 and 2.71 in FY11. We estimate a 50-bp moderation in bond yields will augment FY14E PBT by ~8%.
Rising LDR and de-bulking of balance sheet to offset margin pressure: PNB margin has declined from 3.84% in FY12 to 3.50%, affected by sluggish advances growth and rising deposit cost. We expect margin pressure to recede as, 1) CASA mix has improved to ~41%, 2) the share of bulk deposits has declined steadily to ~12.5%, the positive effect of which will be visible over the next quarter, and, 3) the LDR ratio has increased further.
Valuation: The bank’s ROA and ROE profile remains healthier than peers (barring SBIN) and its healthy tier-I ratio (9.76% including FY13 profit) would support balance sheet growth post current consolidation. We have rolled forward our valuation to FY15 estimates and revised our PT to Rs910 based on 0.9x FY15E ABVS of Rs1,012. We recommend BUY.
Risks: Unanticipated decline in asset quality and an elevated rate environment would be the key downside risks to our call and estimates. 650
750
850
950
1,050
1,150
15,000
16,000
17,000
18,000
19,000
20,000
21,000
Jun-12 Sep-12 Dec-12 Mar-13 Jun-13
Sensex PNB, Rs
India Equity Research | Banking and Financials June 22, 2013 Company Update
Punjab National Bank
Exhibit 1: Financials and valuation summary
Note: pricing as on 21 June 2013; AE is adjusted for 4Q FY13 results; Source: Company data, quant Global Research estimates
Consolidation continues; asset quality coming under control
EPS Adj BVPS PE P/ABV ROA ROE
(Rs mn) Change (%) (Rs mn) Change (%) (Rs mn) Change (%) (Rs) (Rs) (x) (x) (%) (%)
FY11 118,073 39.3 90,557 23.6 44,335 13.5 140.3 566.7 4.9 1.2 1.3 22.6
FY12 134,144 13.6 106,143 17.2 48,842 10.2 148.9 646.1 4.6 1.1 1.2 19.8
FY13AE 147,919 10.3 108,882 2.6 47,868 -2.0 141.1 674.6 4.9 1.0 1.0 16.1
FY14E 169,240 14.4 121,841 11.9 56,889 18.8 167.7 817.6 4.1 0.8 1.1 16.8
FY15E 192,854 14.0 136,249 11.8 65,379 14.9 192.8 1011.9 3.6 0.7 1.1 16.8
NII Op profit Net profitYEMarch
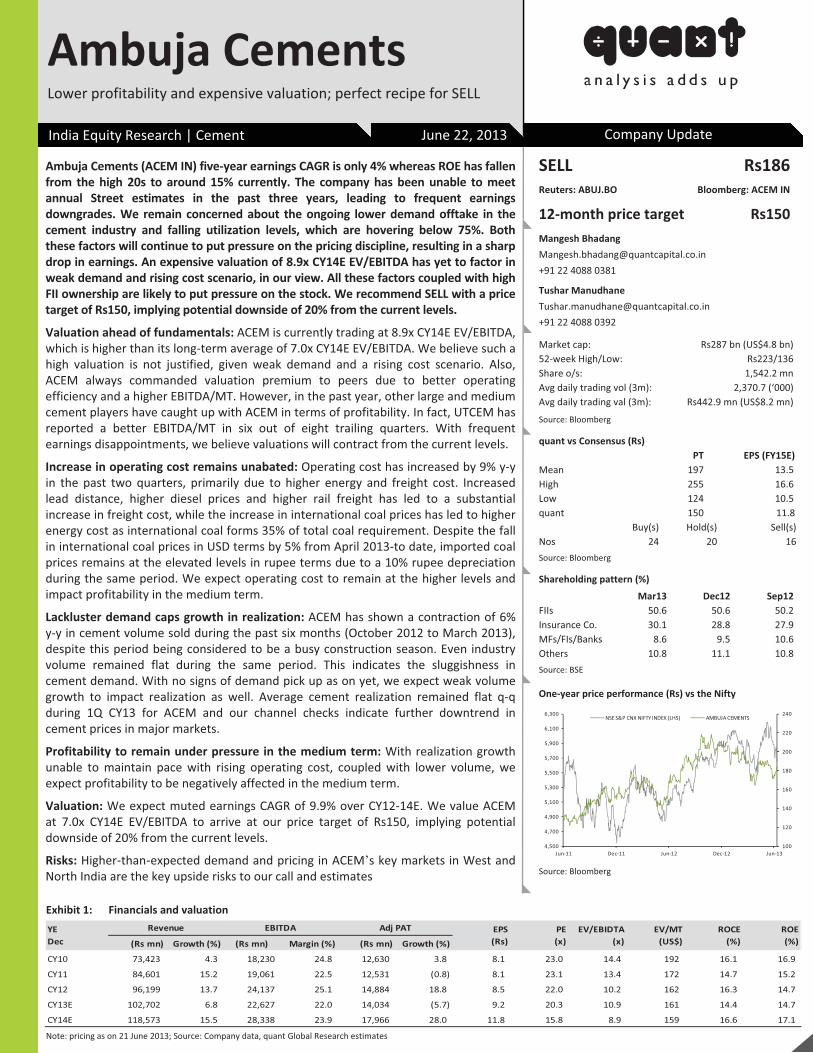
�
111
��
��
SELL� Rs186�Reuters:�ABUJ.BO� Bloomberg:�ACEM�IN�
12�month�price�target� Rs150�Mangesh�Bhadang�[email protected]�+91�22�4088�0381�
Tushar�Manudhane�[email protected]�+91�22�4088�0392�
Market�cap:� Rs287�bn�(US$4.8 bn)52�week�High/Low:� Rs223/136Share�o/s:� 1,542.2 mnAvg�daily�trading�vol�(3m):� 2,370.7 (‘000)Avg�daily�trading�val�(3m):� Rs442.9 mn�(US$8.2 mn)
Source:�Bloomberg�
quant�vs�Consensus�(Rs)�PT� EPS�(FY15E)�
Mean� 197� 13.5�High� 255� 16.6�Low� 124� 10.5�quant� 150� 11.8�� Buy(s)� Hold(s)� Sell(s)Nos� 24� 20� 16Source:�Bloomberg�
Shareholding�pattern�(%)�
Mar13 Dec12 Sep12FIIs 50.6 50.6 50.2Insurance�Co.� 30.1 28.8 27.9MFs/FIs/Banks� 8.6 9.5 10.6Others 10.8 11.1 10.8Source:�BSE�
One�year�price�performance�(Rs)�vs�the�Nifty��
Source:�Bloomberg�
Ambuja�Cements�(ACEM�IN)�five�year�earnings�CAGR�is�only�4%�whereas�ROE�has�fallen�from� the�high�20s� to� around�15%� currently.� The� company�has�been�unable� to�meet�annual� Street� estimates� in� the� past� three� years,� leading� to� frequent� earnings�downgrades.�We� remain� concerned�about� the�ongoing� lower�demand�offtake� in� the�cement� industry� and� falling� utilization� levels,� which� are� hovering� below� 75%.� Both�these�factors�will�continue�to�put�pressure�on�the�pricing�discipline,�resulting�in�a�sharp�drop�in�earnings.�An�expensive�valuation�of�8.9x�CY14E�EV/EBITDA�has�yet�to�factor�in�weak�demand�and�rising�cost�scenario,�in�our�view.�All�these�factors�coupled�with�high�FII�ownership�are�likely�to�put�pressure�on�the�stock.�We�recommend�SELL�with�a�price�target�of�Rs150,�implying�potential�downside�of�20%�from�the�current�levels.�
Valuation�ahead�of�fundamentals:�ACEM�is�currently�trading�at�8.9x�CY14E�EV/EBITDA,�which�is�higher�than�its�long�term�average�of�7.0x�CY14E�EV/EBITDA.�We�believe�such�a�high� valuation� is� not� justified,� given� weak� demand� and� a� rising� cost� scenario.� Also,�ACEM� always� commanded� valuation� premium� to� peers� due� to� better� operating�efficiency�and�a�higher�EBITDA/MT.�However,�in�the�past�year,�other�large�and�medium�cement�players�have�caught�up�with�ACEM�in�terms�of�profitability.�In�fact,�UTCEM�has�reported� a� better� EBITDA/MT� in� six� out� of� eight� trailing� quarters.� With� frequent�earnings�disappointments,�we�believe�valuations�will�contract�from�the�current�levels.��
Increase�in�operating�cost�remains�unabated:�Operating�cost�has�increased�by�9%�y�y�in� the� past� two� quarters,� primarily� due� to� higher� energy� and� freight� cost.� Increased�lead� distance,� higher� diesel� prices� and� higher� rail� freight� has� led� to� a� substantial�increase�in�freight�cost,�while�the�increase�in�international�coal�prices�has�led�to�higher�energy�cost�as�international�coal�forms�35%�of�total�coal�requirement.�Despite�the�fall�in�international�coal�prices�in�USD�terms�by�5%�from�April�2013�to�date,�imported�coal�prices�remains�at�the�elevated�levels�in�rupee�terms�due�to�a�10%�rupee�depreciation�during�the�same�period.�We�expect�operating�cost�to�remain�at�the�higher�levels�and�impact�profitability�in�the�medium�term.�
Lackluster�demand�caps�growth�in�realization:�ACEM�has�shown�a�contraction�of�6%�y�y�in�cement�volume�sold�during�the�past�six�months�(October�2012�to�March�2013),�despite�this�period�being�considered�to�be�a�busy�construction�season.�Even�industry�volume� remained� flat� during� the� same� period.� This� indicates� the� sluggishness� in�cement�demand.�With�no�signs�of�demand�pick�up�as�on�yet,�we�expect�weak�volume�growth� to� impact� realization� as� well.� Average� cement� realization� remained� flat� q�q�during� 1Q� CY13� for� ACEM� and� our� channel� checks� indicate� further� downtrend� in�cement�prices�in�major�markets.�
Profitability�to�remain�under�pressure�in�the�medium�term:�With�realization�growth�unable� to� maintain� pace� with� rising� operating� cost,� coupled� with� lower� volume,� we�expect�profitability�to�be�negatively�affected�in�the�medium�term.��
Valuation:�We�expect�muted�earnings�CAGR�of�9.9%�over�CY12�14E.�We�value�ACEM�at� 7.0x� CY14E� EV/EBITDA� to� arrive� at� our� price� target� of� Rs150,� implying� potential�downside�of�20%�from�the�current�levels.��
Risks:�Higher�than�expected�demand�and�pricing�in�ACEM’s�key�markets�in�West�and�North�India�are�the�key�upside�risks�to�our�call�and�estimates�
100
120
140
160
180
200
220
240
4,500
4,700
4,900
5,100
5,300
5,500
5,700
5,900
6,100
6,300
Jun�11 Dec�11 Jun�12 Dec�12 Jun�13
NSE�S&P�CNX�NIFTY�INDEX�(LHS) AMBUJA�CEMENTS
India�Equity�Research�|�Cement June�22,�2013 Company�Update
Ambuja�Cements�Lower�profitability�and�expensive�valuation;�perfect�recipe�for�SELL
Exhibit�1:������Financials�and�valuation�
Note:�pricing�as�on�21�June�2013;�Source:�Company�data,�quant�Global�Research�estimates�
(Rs�mn) Growth�(%) (Rs�mn) Margin�(%) (Rs�mn) Growth�(%)
CY10 73,423�������� 4.3�������������� 18,230�������� 24.8������������ 12,630�������� 3.8�������������� 8.1�������������� 23.0������������ 14.4������������ 192������������� 16.1������������ 16.9������������
CY11 84,601�������� 15.2������������ 19,061�������� 22.5������������ 12,531�������� (0.8)������������� 8.1�������������� 23.1������������ 13.4������������ 172������������� 14.7������������ 15.2������������
CY12 96,199�������� 13.7������������ 24,137�������� 25.1������������ 14,884�������� 18.8������������ 8.5�������������� 22.0������������ 10.2������������ 162������������� 16.3������������ 14.7������������
CY13E 102,702������ 6.8�������������� 22,627�������� 22.0������������ 14,034�������� (5.7)������������� 9.2�������������� 20.3������������ 10.9������������ 161������������� 14.4������������ 14.7������������
CY14E 118,573������ 15.5������������ 28,338�������� 23.9������������ 17,966�������� 28.0������������ 11.8������������ 15.8������������ 8.9�������������� 159������������� 16.6������������ 17.1������������
Revenue EBITDA Adj�PATYE�Dec
EPS(Rs)
PE(x)
EV/EBIDTA(x)
EV/MT(US$)
ROCE(%)
ROE(%)
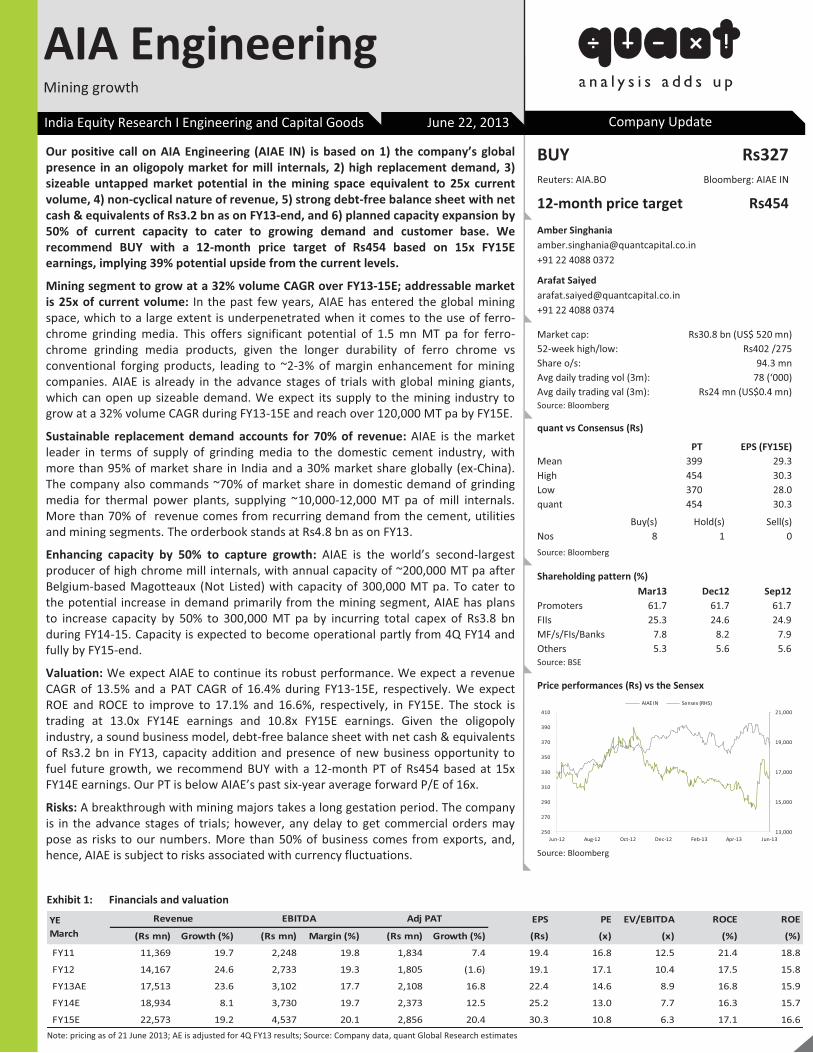
Our positive call on AIA Engineering (AIAE IN) is based on 1) the company’s global presence in an oligopoly market for mill internals, 2) high replacement demand, 3) sizeable untapped market potential in the mining space equivalent to 25x current volume, 4) non-cyclical nature of revenue, 5) strong debt-free balance sheet with net cash & equivalents of Rs3.2 bn as on FY13-end, and 6) planned capacity expansion by 50% of current capacity to cater to growing demand and customer base. We recommend BUY with a 12-month price target of Rs454 based on 15x FY15E earnings, implying 39% potential upside from the current levels.
Mining segment to grow at a 32% volume CAGR over FY13-15E; addressable market is 25x of current volume: In the past few years, AIAE has entered the global mining space, which to a large extent is underpenetrated when it comes to the use of ferro-chrome grinding media. This offers significant potential of 1.5 mn MT pa for ferro-chrome grinding media products, given the longer durability of ferro chrome vs conventional forging products, leading to ~2-3% of margin enhancement for mining companies. AIAE is already in the advance stages of trials with global mining giants, which can open up sizeable demand. We expect its supply to the mining industry to grow at a 32% volume CAGR during FY13-15E and reach over 120,000 MT pa by FY15E.
Sustainable replacement demand accounts for 70% of revenue: AIAE is the market leader in terms of supply of grinding media to the domestic cement industry, with more than 95% of market share in India and a 30% market share globally (ex-China). The company also commands ~70% of market share in domestic demand of grinding media for thermal power plants, supplying ~10,000-12,000 MT pa of mill internals. More than 70% of revenue comes from recurring demand from the cement, utilities and mining segments. The orderbook stands at Rs4.8 bn as on FY13.
Enhancing capacity by 50% to capture growth: AIAE is the world’s second-largest producer of high chrome mill internals, with annual capacity of ~200,000 MT pa after Belgium-based Magotteaux (Not Listed) with capacity of 300,000 MT pa. To cater to the potential increase in demand primarily from the mining segment, AIAE has plans to increase capacity by 50% to 300,000 MT pa by incurring total capex of Rs3.8 bn during FY14-15. Capacity is expected to become operational partly from 4Q FY14 and fully by FY15-end.
Valuation: We expect AIAE to continue its robust performance. We expect a revenue CAGR of 13.5% and a PAT CAGR of 16.4% during FY13-15E, respectively. We expect ROE and ROCE to improve to 17.1% and 16.6%, respectively, in FY15E. The stock is trading at 13.0x FY14E earnings and 10.8x FY15E earnings. Given the oligopoly industry, a sound business model, debt-free balance sheet with net cash & equivalents of Rs3.2 bn in FY13, capacity addition and presence of new business opportunity to fuel future growth, we recommend BUY with a 12-month PT of Rs454 based at 15x FY14E earnings. Our PT is below AIAE’s past six-year average forward P/E of 16x.
Risks: A breakthrough with mining majors takes a long gestation period. The company is in the advance stages of trials; however, any delay to get commercial orders may pose as risks to our numbers. More than 50% of business comes from exports, and, hence, AIAE is subject to risks associated with currency fluctuations.
BUY Rs327 Reuters: AIA.BO Bloomberg: AIAE IN
12-month price target Rs454
Amber Singhania [email protected] +91 22 4088 0372
Arafat Saiyed [email protected] +91 22 4088 0374
Market cap: Rs30.8 bn (US$ 520 mn) 52-week high/low: Rs402 /275 Share o/s: 94.3 mn Avg daily trading vol (3m): 78 (‘000) Avg daily trading val (3m): Rs24 mn (US$0.4 mn) Source: Bloomberg
quant vs Consensus (Rs)
PT EPS (FY15E) Mean 399 29.3 High 454 30.3 Low 370 28.0 quant 454 30.3
Buy(s) Hold(s) Sell(s) Nos 8 1 0 Source: Bloomberg
Shareholding pattern (%) Mar13 Dec12 Sep12 Promoters 61.7 61.7 61.7 FIIs 25.3 24.6 24.9 MF/s/FIs/Banks 7.8 8.2 7.9 Others 5.3 5.6 5.6 Source: BSE
Price performances (Rs) vs the Sensex
Source: Bloomberg
13,000
15,000
17,000
19,000
21,000
250
270
290
310
330
350
370
390
410
Jun-12 Aug-12 Oct-12 Dec-12 Feb-13 Apr-13 Jun-13
AIAE IN Sensex (RHS)
AIA Engineering
Exhibit 1: Financials and valuation
India Equity Research I Engineering and Capital Goods June 22, 2013 Company Update
Note: pricing as of 21 June 2013; AE is adjusted for 4Q FY13 results; Source: Company data, quant Global Research estimates
Mining growth
EPS PE EV/EBITDA ROCE ROE
(Rs mn) Growth (%) (Rs mn) Margin (%) (Rs mn) Growth (%) (Rs) (x) (x) (%) (%)
FY11 11,369 19.7 2,248 19.8 1,834 7.4 19.4 16.8 12.5 21.4 18.8
FY12 14,167 24.6 2,733 19.3 1,805 (1.6) 19.1 17.1 10.4 17.5 15.8
FY13AE 17,513 23.6 3,102 17.7 2,108 16.8 22.4 14.6 8.9 16.8 15.9
FY14E 18,934 8.1 3,730 19.7 2,373 12.5 25.2 13.0 7.7 16.3 15.7
FY15E 22,573 19.2 4,537 20.1 2,856 20.4 30.3 10.8 6.3 17.1 16.6
Revenue EBITDA Adj PATYE March
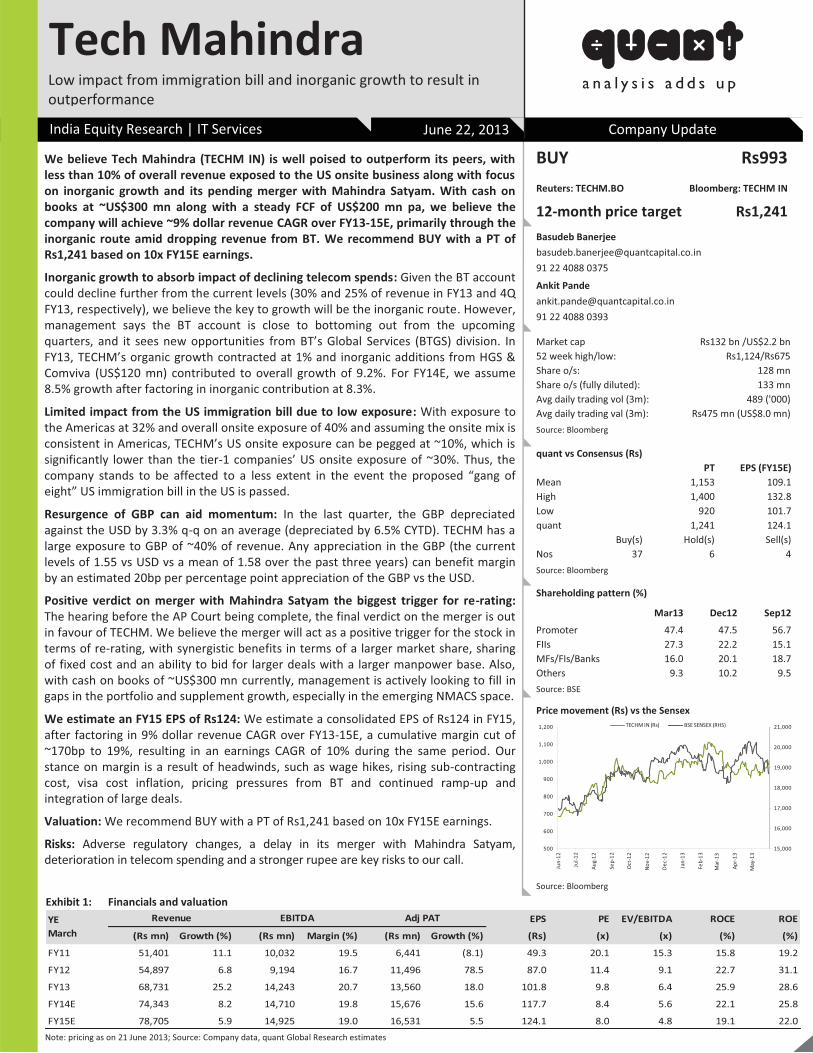
Tech Mahindra India Equity Research | IT Services Company Update
June 22, 2013
We believe Tech Mahindra (TECHM IN) is well poised to outperform its peers, with less than 10% of overall revenue exposed to the US onsite business along with focus on inorganic growth and its pending merger with Mahindra Satyam. With cash on books at ~US$300 mn along with a steady FCF of US$200 mn pa, we believe the company will achieve ~9% dollar revenue CAGR over FY13-15E, primarily through the inorganic route amid dropping revenue from BT. We recommend BUY with a PT of Rs1,241 based on 10x FY15E earnings.
Inorganic growth to absorb impact of declining telecom spends: Given the BT account could decline further from the current levels (30% and 25% of revenue in FY13 and 4Q FY13, respectively), we believe the key to growth will be the inorganic route. However, management says the BT account is close to bottoming out from the upcoming quarters, and it sees new opportunities from BT’s Global Services (BTGS) division. In FY13, TECHM’s organic growth contracted at 1% and inorganic additions from HGS & Comviva (US$120 mn) contributed to overall growth of 9.2%. For FY14E, we assume 8.5% growth after factoring in inorganic contribution at 8.3%.
Limited impact from the US immigration bill due to low exposure: With exposure to the Americas at 32% and overall onsite exposure of 40% and assuming the onsite mix is consistent in Americas, TECHM’s US onsite exposure can be pegged at ~10%, which is significantly lower than the tier-1 companies’ US onsite exposure of ~30%. Thus, the company stands to be affected to a less extent in the event the proposed “gang of eight” US immigration bill in the US is passed.
Resurgence of GBP can aid momentum: In the last quarter, the GBP depreciated against the USD by 3.3% q-q on an average (depreciated by 6.5% CYTD). TECHM has a large exposure to GBP of ~40% of revenue. Any appreciation in the GBP (the current levels of 1.55 vs USD vs a mean of 1.58 over the past three years) can benefit margin by an estimated 20bp per percentage point appreciation of the GBP vs the USD.
Positive verdict on merger with Mahindra Satyam the biggest trigger for re-rating: The hearing before the AP Court being complete, the final verdict on the merger is out in favour of TECHM. We believe the merger will act as a positive trigger for the stock in terms of re-rating, with synergistic benefits in terms of a larger market share, sharing of fixed cost and an ability to bid for larger deals with a larger manpower base. Also, with cash on books of ~US$300 mn currently, management is actively looking to fill in gaps in the portfolio and supplement growth, especially in the emerging NMACS space.
We estimate an FY15 EPS of Rs124: We estimate a consolidated EPS of Rs124 in FY15, after factoring in 9% dollar revenue CAGR over FY13-15E, a cumulative margin cut of ~170bp to 19%, resulting in an earnings CAGR of 10% during the same period. Our stance on margin is a result of headwinds, such as wage hikes, rising sub-contracting cost, visa cost inflation, pricing pressures from BT and continued ramp-up and integration of large deals.
Valuation: We recommend BUY with a PT of Rs1,241 based on 10x FY15E earnings.
Risks: Adverse regulatory changes, a delay in its merger with Mahindra Satyam, deterioration in telecom spending and a stronger rupee are key risks to our call.
Low impact from immigration bill and inorganic growth to result in outperformance
BUY Rs993 Reuters: TECHM.BO Bloomberg: TECHM IN
12-month price target Rs1,241 Basudeb Banerjee [email protected] 91 22 4088 0375
Ankit Pande [email protected] 91 22 4088 0393
Market cap Rs132 bn /US$2.2 bn 52 week high/low: Rs1,124/Rs675 Share o/s: 128 mn Share o/s (fully diluted): 133 mn Avg daily trading vol (3m): 489 ('000) Avg daily trading val (3m): Rs475 mn (US$8.0 mn) Source: Bloomberg
quant vs Consensus (Rs) PT EPS (FY15E) Mean 1,153 109.1 High 1,400 132.8 Low 920 101.7 quant 1,241 124.1 Buy(s) Hold(s) Sell(s) Nos 37 6 4 Source: Bloomberg
Shareholding pattern (%)
Mar13 Dec12 Sep12
Promoter 47.4 47.5 56.7 FIIs 27.3 22.2 15.1 MFs/FIs/Banks 16.0 20.1 18.7 Others 9.3 10.2 9.5 Source: BSE
Price movement (Rs) vs the Sensex
15,000
16,000
17,000
18,000
19,000
20,000
21,000
500
600
700
800
900
1,000
1,100
1,200
Jun-
12
Jul-1
2
Aug-
12
Sep-
12
Oct
-12
Nov
-12
Dec
-12
Jan-
13
Feb-
13
Mar
-13
Apr-
13
May
-13
TECHM IN (Rs) BSE SENSEX (RHS)
Source: Bloomberg Exhibit 1: Financials and valuation
Note: pricing as on 21 June 2013; Source: Company data, quant Global Research estimates
EPS PE EV/EBITDA ROCE ROE
(Rs mn) Growth (%) (Rs mn) Margin (%) (Rs mn) Growth (%) (Rs) (x) (x) (%) (%)
FY11 51,401 11.1 10,032 19.5 6,441 (8.1) 49.3 20.1 15.3 15.8 19.2
FY12 54,897 6.8 9,194 16.7 11,496 78.5 87.0 11.4 9.1 22.7 31.1
FY13 68,731 25.2 14,243 20.7 13,560 18.0 101.8 9.8 6.4 25.9 28.6
FY14E 74,343 8.2 14,710 19.8 15,676 15.6 117.7 8.4 5.6 22.1 25.8
FY15E 78,705 5.9 14,925 19.0 16,531 5.5 124.1 8.0 4.8 19.1 22.0
YEMarch
Revenue EBITDA Adj PAT
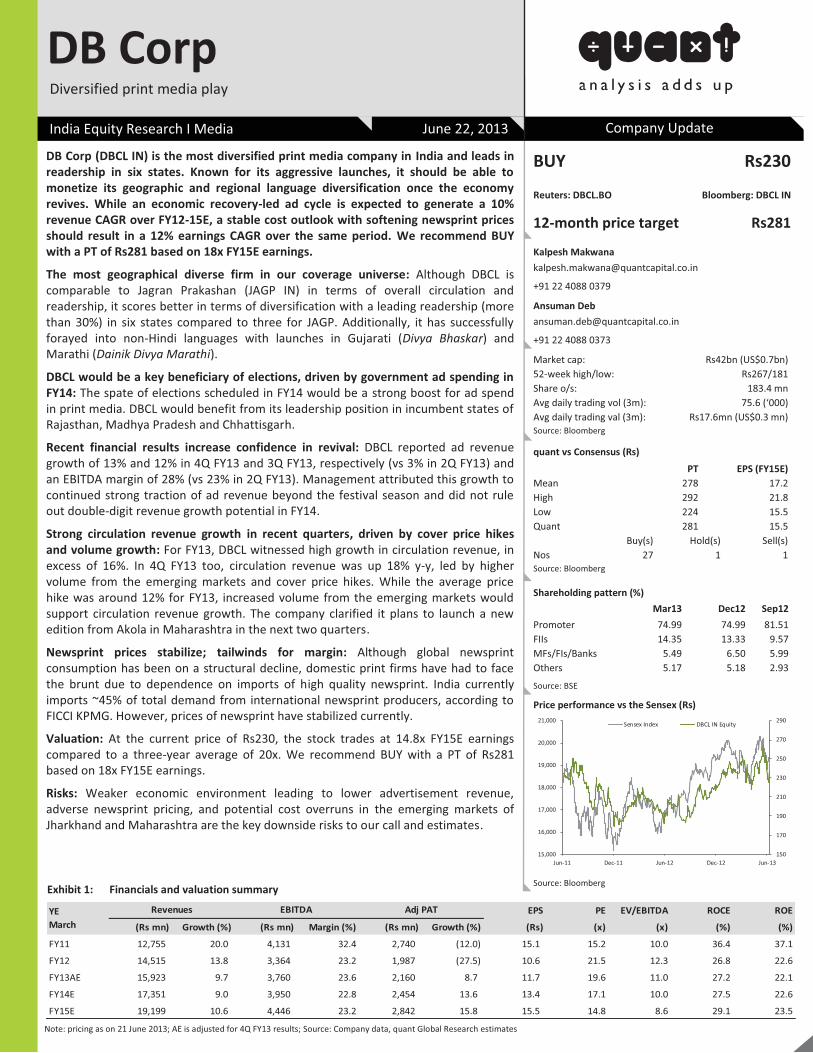
Chapter heading (1St heading)
DB Corp (DBCL IN) is the most diversified print media company in India and leads in readership in six states. Known for its aggressive launches, it should be able to monetize its geographic and regional language diversification once the economy revives. While an economic recovery-led ad cycle is expected to generate a 10% revenue CAGR over FY12-15E, a stable cost outlook with softening newsprint prices should result in a 12% earnings CAGR over the same period. We recommend BUY with a PT of Rs281 based on 18x FY15E earnings.
The most geographical diverse firm in our coverage universe: Although DBCL is comparable to Jagran Prakashan (JAGP IN) in terms of overall circulation and readership, it scores better in terms of diversification with a leading readership (more than 30%) in six states compared to three for JAGP. Additionally, it has successfully forayed into non-Hindi languages with launches in Gujarati (Divya Bhaskar) and Marathi (Dainik Divya Marathi).
DBCL would be a key beneficiary of elections, driven by government ad spending in FY14: The spate of elections scheduled in FY14 would be a strong boost for ad spend in print media. DBCL would benefit from its leadership position in incumbent states of Rajasthan, Madhya Pradesh and Chhattisgarh.
Recent financial results increase confidence in revival: DBCL reported ad revenue growth of 13% and 12% in 4Q FY13 and 3Q FY13, respectively (vs 3% in 2Q FY13) and an EBITDA margin of 28% (vs 23% in 2Q FY13). Management attributed this growth to continued strong traction of ad revenue beyond the festival season and did not rule out double-digit revenue growth potential in FY14.
Strong circulation revenue growth in recent quarters, driven by cover price hikes and volume growth: For FY13, DBCL witnessed high growth in circulation revenue, in excess of 16%. In 4Q FY13 too, circulation revenue was up 18% y-y, led by higher volume from the emerging markets and cover price hikes. While the average price hike was around 12% for FY13, increased volume from the emerging markets would support circulation revenue growth. The company clarified it plans to launch a new edition from Akola in Maharashtra in the next two quarters.
Newsprint prices stabilize; tailwinds for margin: Although global newsprint consumption has been on a structural decline, domestic print firms have had to face the brunt due to dependence on imports of high quality newsprint. India currently imports ~45% of total demand from international newsprint producers, according to FICCI KPMG. However, prices of newsprint have stabilized currently.
Valuation: At the current price of Rs230, the stock trades at 14.8x FY15E earnings compared to a three-year average of 20x. We recommend BUY with a PT of Rs281 based on 18x FY15E earnings.
Risks: Weaker economic environment leading to lower advertisement revenue, adverse newsprint pricing, and potential cost overruns in the emerging markets of Jharkhand and Maharashtra are the key downside risks to our call and estimates.
BUY Rs230
Reuters: DBCL.BO Bloomberg: DBCL IN
12-month price target Rs281
Kalpesh Makwana [email protected]
+91 22 4088 0379
Ansuman Deb [email protected]
+91 22 4088 0373
Market cap: Rs42bn (US$0.7bn) 52-week high/low: Rs267/181 Share o/s: 183.4 mn Avg daily trading vol (3m): 75.6 (‘000) Avg daily trading val (3m): Rs17.6mn (US$0.3 mn) Source: Bloomberg
quant vs Consensus (Rs) PT EPS (FY15E) Mean 278 17.2 High 292 21.8 Low 224 15.5 Quant 281 15.5 Buy(s) Hold(s) Sell(s) Nos 27 1 1 Source: Bloomberg
Shareholding pattern (%) Mar13 Dec12 Sep12 Promoter 74.99 74.99 81.51 FIIs 14.35 13.33 9.57 MFs/FIs/Banks 5.49 6.50 5.99 Others 5.17 5.18 2.93
Source: BSE
Price performance vs the Sensex (Rs)
150
170
190
210
230
250
270
290
15,000
16,000
17,000
18,000
19,000
20,000
21,000
Jun-11 Dec-11 Jun-12 Dec-12 Jun-13
Sensex Index DBCL IN Equity
Source: Bloomberg
India Equity Research I Media June 22, 2013 Company Update
Diversified print media play
DB Corp
EPS PE EV/EBITDA ROCE ROE
(Rs mn) Growth (%) (Rs mn) Margin (%) (Rs mn) Growth (%) (Rs) (x) (x) (%) (%)
FY11 12,755 20.0 4,131 32.4 2,740 (12.0) 15.1 15.2 10.0 36.4 37.1
FY12 14,515 13.8 3,364 23.2 1,987 (27.5) 10.6 21.5 12.3 26.8 22.6
FY13AE 15,923 9.7 3,760 23.6 2,160 8.7 11.7 19.6 11.0 27.2 22.1
FY14E 17,351 9.0 3,950 22.8 2,454 13.6 13.4 17.1 10.0 27.5 22.6
FY15E 19,199 10.6 4,446 23.2 2,842 15.8 15.5 14.8 8.6 29.1 23.5
Revenues EBITDA Adj PATYEMarch
Exhibit 1: Financials and valuation summary
Note: pricing as on 21 June 2013; AE is adjusted for 4Q FY13 results; Source: Company data, quant Global Research estimates
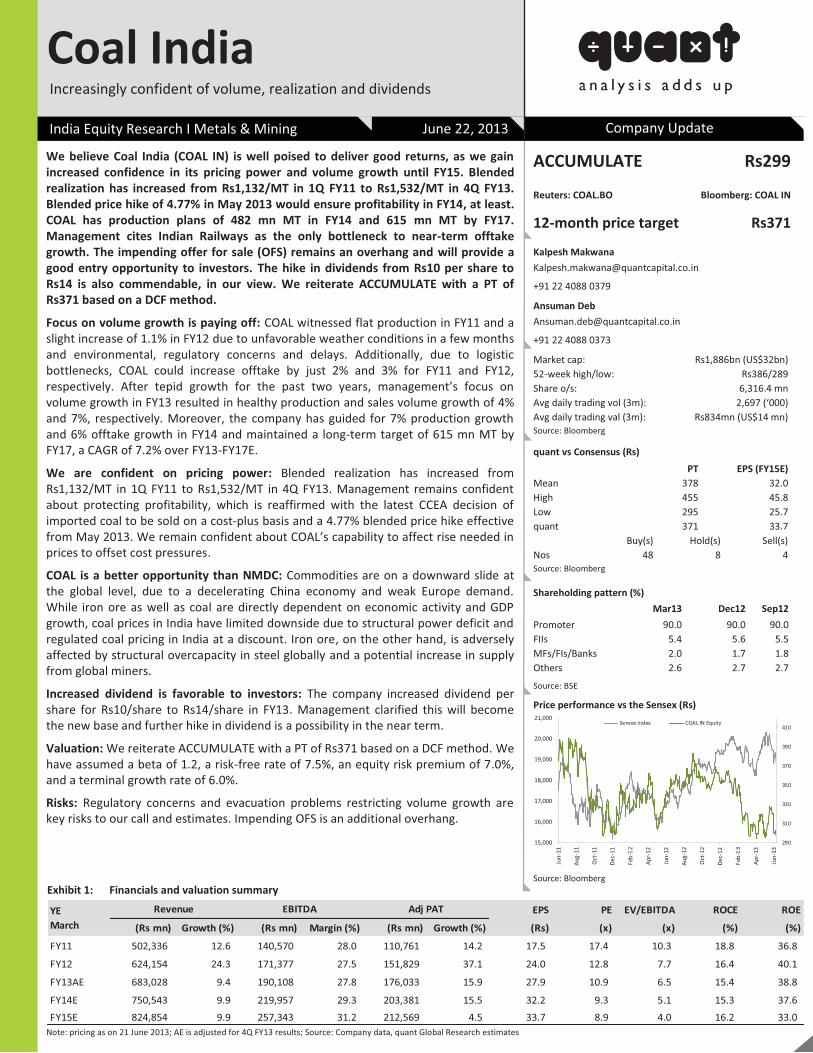
Chapter heading (1St heading)
We believe Coal India (COAL IN) is well poised to deliver good returns, as we gain increased confidence in its pricing power and volume growth until FY15. Blended realization has increased from Rs1,132/MT in 1Q FY11 to Rs1,532/MT in 4Q FY13. Blended price hike of 4.77% in May 2013 would ensure profitability in FY14, at least. COAL has production plans of 482 mn MT in FY14 and 615 mn MT by FY17. Management cites Indian Railways as the only bottleneck to near-term offtake growth. The impending offer for sale (OFS) remains an overhang and will provide a good entry opportunity to investors. The hike in dividends from Rs10 per share to Rs14 is also commendable, in our view. We reiterate ACCUMULATE with a PT of Rs371 based on a DCF method.
Focus on volume growth is paying off: COAL witnessed flat production in FY11 and a slight increase of 1.1% in FY12 due to unfavorable weather conditions in a few months and environmental, regulatory concerns and delays. Additionally, due to logistic bottlenecks, COAL could increase offtake by just 2% and 3% for FY11 and FY12, respectively. After tepid growth for the past two years, management’s focus on volume growth in FY13 resulted in healthy production and sales volume growth of 4% and 7%, respectively. Moreover, the company has guided for 7% production growth and 6% offtake growth in FY14 and maintained a long-term target of 615 mn MT by FY17, a CAGR of 7.2% over FY13-FY17E.
We are confident on pricing power: Blended realization has increased from Rs1,132/MT in 1Q FY11 to Rs1,532/MT in 4Q FY13. Management remains confident about protecting profitability, which is reaffirmed with the latest CCEA decision of imported coal to be sold on a cost-plus basis and a 4.77% blended price hike effective from May 2013. We remain confident about COAL’s capability to affect rise needed in prices to offset cost pressures.
COAL is a better opportunity than NMDC: Commodities are on a downward slide at the global level, due to a decelerating China economy and weak Europe demand. While iron ore as well as coal are directly dependent on economic activity and GDP growth, coal prices in India have limited downside due to structural power deficit and regulated coal pricing in India at a discount. Iron ore, on the other hand, is adversely affected by structural overcapacity in steel globally and a potential increase in supply from global miners.
Increased dividend is favorable to investors: The company increased dividend per share for Rs10/share to Rs14/share in FY13. Management clarified this will become the new base and further hike in dividend is a possibility in the near term.
Valuation: We reiterate ACCUMULATE with a PT of Rs371 based on a DCF method. We have assumed a beta of 1.2, a risk-free rate of 7.5%, an equity risk premium of 7.0%, and a terminal growth rate of 6.0%.
Risks: Regulatory concerns and evacuation problems restricting volume growth are key risks to our call and estimates. Impending OFS is an additional overhang.
ACCUMULATE Rs299
Reuters: COAL.BO Bloomberg: COAL IN
12-month price target Rs371
Kalpesh Makwana [email protected]
+91 22 4088 0379
Ansuman Deb [email protected]
+91 22 4088 0373
Market cap: Rs1,886bn (US$32bn) 52-week high/low: Rs386/289 Share o/s: 6,316.4 mn Avg daily trading vol (3m): 2,697 (‘000) Avg daily trading val (3m): Rs834mn (US$14 mn) Source: Bloomberg
quant vs Consensus (Rs) PT EPS (FY15E) Mean 378 32.0 High 455 45.8 Low 295 25.7 quant 371 33.7 Buy(s) Hold(s) Sell(s) Nos 48 8 4 Source: Bloomberg
Shareholding pattern (%) Mar13 Dec12 Sep12 Promoter 90.0 90.0 90.0 FIIs 5.4 5.6 5.5 MFs/FIs/Banks 2.0 1.7 1.8 Others 2.6 2.7 2.7
Source: BSE
Price performance vs the Sensex (Rs)
290
310
330
350
370
390
410
15,000
16,000
17,000
18,000
19,000
20,000
21,000
Jun-
11
Aug-
11
Oct
-11
Dec-
11
Feb-
12
Apr-
12
Jun-
12
Aug-
12
Oct
-12
Dec-
12
Feb-
13
Apr-
13
Jun-
13
Sensex Index COAL IN Equity
Source: Bloomberg
India Equity Research I Metals & Mining June 22, 2013 Company Update
Increasingly confident of volume, realization and dividends
Coal India
EPS PE EV/EBITDA ROCE ROE
(Rs mn) Growth (%) (Rs mn) Margin (%) (Rs mn) Growth (%) (Rs) (x) (x) (%) (%)
FY11 502,336 12.6 140,570 28.0 110,761 14.2 17.5 17.4 10.3 18.8 36.8
FY12 624,154 24.3 171,377 27.5 151,829 37.1 24.0 12.8 7.7 16.4 40.1
FY13AE 683,028 9.4 190,108 27.8 176,033 15.9 27.9 10.9 6.5 15.4 38.8
FY14E 750,543 9.9 219,957 29.3 203,381 15.5 32.2 9.3 5.1 15.3 37.6 FY15E 824,854 9.9 257,343 31.2 212,569 4.5 33.7 8.9 4.0 16.2 33.0
Revenue EBITDA Adj PATYEMarch
Exhibit 1: Financials and valuation summary
Note: pricing as on 21 June 2013; AE is adjusted for 4Q FY13 results; Source: Company data, quant Global Research estimates

Chapter heading (1St heading)
We recommend BUY on Reliance Industries (RIL IN) with a SOTP-based PT of Rs964, due to a favorable risk-reward as the current price factors in a nil hike in domestic gas price, improving US shale gas environment, and zero value for the telecom venture & petchem expansion projects. Subsequently, we suggest investors should exploit any correction in the stock in the next three months due to the temporary weakening in refining margin, owing to reduced global refineries outages.
Favorable risk-reward scenario: We estimate RIL’s current valuation implies a scenario of nil domestic gas price reforms, and zero value for the telecom venture & the upcoming petchem expansion project wherein we conservatively ascribe a subdued GRM of US$8.0/bbl for FY15E. Although we believe these telecom and petchem expansion projects will take at least four years to commission or ramp-up, nil value for them would be unwarranted and provide investors the option to play on the value-unlocking possibility from these projects.
We maintain our positive outlook on the E&P segment based on higher gas prices and the subsequent reserves accretion benefits: We believe a domestic gas price hike from US$4.2/mmbtu to US$8.0/mmbtu could unlock KG-D6 gas reserves value to RIL by Rs52/share for its 5 tcf gross KG-D6 gas reserves. RIL would additionally benefit from a higher value being ascribed to previous discoveries due to reduced risk and higher gas prices in CBM blocks, NEC-25 and KG-D3 blocks. We are also positive about the new discovery’s (D-55) prospects and believe the possibility of reserves upgrades cannot be ruled out based on encouraging initial results.
US shale gas business is continuously improving: Gas prices in the US recovered from multi-year lows to US$4.3/mmbtu currently, due to higher demand and lower storage levels. The company’s production ramp-up has continued across all three JVs in the US during FY13. Subsequently, RIL share of production jumped by ~100% y-y to 85 mmscfd. RIL’s audited proved reserves in the US increased by 135% to 1.9 tcfe during CY12, due to increased drilling and production ramp-up.
Reliance Retail would benefit from policy reforms in the retail sector: The Centre has allowed FDI in multi-brand retail, which would unlock value for domestic retail firms. Given Reliance Retail (Not Lsted) has more than 1,466 stores in 129 cities across India, we believe RIL will be the key beneficiary from reforms. Moreover, the company reported its retail business turned EBITDA-positive in FY13, which despite being negligible, is directionally positive. We believe RIL will gradually witness value unlocking from the retail business, with further operational improvement. We ascribe a 100% value to investments made by the company in retail or Rs51/share.
Valuation: We value RIL using SOTP-based PT at Rs964, assuming a one-year forward EV/EBITDA of 6.0x for the refining and petchem segments and FY15E GRM at US$8.0/bbl. We also assume a gradual decline in KG-D6 gas production to 7 mmscmd by FY15 and then production ramp-up to 30 mmscmd by FY17 via re-development. We recommend BUY.
Risks: Lower-than-expected refining margin and petchem margin pose as the key downside risk to our call and estimates.
BUY Rs793 Reuters: RELI.BO Bloomberg: RIL IN
12-month price target Rs964 Gagan Dixit [email protected] +91 22 4088 0368
Sapan Shah [email protected] +91 22 4088 0394
Market cap: Rs2,560.4 bn (US$43.2 bn) 52-week high/low: Rs955/682 Share o/s: 3,299.4 mn Avg daily trading vol (3m): 3,773.9 (‘000) Avg daily trading val (3m): Rs3.0 bn (US$51.2 mn) Source: Bloomberg
quant vs Consensus (Rs) PT EPS (FY15E) Mean 913 76.4 High 1115 91.4 Low 758 65.0 quant 964 67.1
Buy(s) Hold(s) Sell(s) Nos 27 23 2 Source: Bloomberg
Shareholding pattern (%) Mar13 Dec12 Sep12 Promoter 45.3 45.3 45.2 FIIs 17.8 17.8 17.7 DIIs 11.0 10.9 10.9 Others 25.9 26.0 26.2
Source: BSE
Price performance (Rs) vs the Sensex
15000
16000
17000
18000
19000
20000
550
650
750
850
950
1050
1150
Jun-
12
Jul-1
2
Aug-
12
Sep-
12
Oct-1
2
Nov
-12
Dec-
12
Jan-
13
Feb-
13
Mar
-13
Apr-1
3
May
-13
RIL IN Equity Sensex Index
Source: Bloomberg
India Equity Research | Oil & Gas June 22, 2013 Company Update
Favorable risk-reward
Reliance Industries
Note: pricing as on 21 June 2013, AE is adjusted for 4Q FY13 results; Source: Company data, quant Global Research estimates
Exhibit 1: Financials and valuation EPS PE EV/EBITDA ROCE ROE
(Rs bn) Growth (%) (Rs bn) Margin (%) (Rs bn) Growth (%) (Rs) (x) (x) (%) (%)
FY11 2,658 30.5 390 14.7 202 27.0 61.1 13.0 7.6 10.3 14.4
FY12 3,585 34.9 348 9.7 200 (0.8) 60.8 13.0 7.7 9.2 12.7
FY13AE 3,971 10.8 330 8.3 209 4.2 63.4 12.5 8.0 9.0 11.9
FY14E 2,988 (24.8) 314 10.5 210 0.5 63.7 12.5 8.1 8.4 10.9
FY15E 2,994 0.2 320 10.7 221 5.4 67.1 11.8 7.8 8.2 10.4
YE March
Revenue EBITDA Adj PAT

Chapter heading (1St heading)
We recommend ACCUMULATE on Hindustan Petroleum Corporation (HPCL IN) with our SOTP-based PT of Rs370. The stock has corrected by 19% in the past month which we believe is unwarranted. We believe it offers an opportunity for investors, as 1) the stock is trading at the lower end of its historical P/B band of 0.63-0.86x despite the decline in daily under-recoveries, 2) the regular monthly diesel price hike will gradually improve HPCL’s marketing business fundamentals, and 3) the recent rupee weakening will improve its refining business value.
HPCL trades at lower end of historical P/B band despite decline in daily under-recoveries: Current valuations of HPCL have declined into the lower levels of adjusted P/B band of 0.63-0.86x similar to the ones seen during 1H FY09 when OMCs daily under-recoveries were at a historical high of Rs5.4 bn. We believe these subdued valuations are unwarranted as OMCs’ current daily under-recoveries are just Rs2.8 bn, which could reduce further with regular diesel price hikes.
Marketing business fundamentals to improve with regular monthly diesel price hikes: The monthly hike in diesel prices would lead to the reduction in subsidy dependence, and, subsequently, interest expense, due to lower borrowings to finance delayed subsidy payment. Our analysis reveals reduction in diesel losses would lower HPCL’s interest expense by Rs6.7 bn during FY14, which would improve the company’s EPS by Rs13/share or 39% of FY14E EPS.
Rupee weakening will improve HPCL refining business value: During the past month, the rupee has depreciated by 7%, which is positive for the refining business as refining margins are dollar denominated. If we were to assume a stable GRM, rupee weakening would improve HPCL’s refining business value in rupee terms.
We believe risk of pricing of petroleum products shifting to export parity from current trade parity is remote: A risk to our call is shift from present trade parity to export parity pricing of petroleum products by the government. However, we believe the possibility of this scenario is remote as it will make OMCs’ inland refineries nonviable based on higher crude import cost. Moreover, the removal of trade parity pricing would be against the energy security perspective that was one of the main drivers to promote new refining capacity. As per our estimates, the shift from the current trade parity pricing mechanism of petroleum products (comprises 80% weight to import parity and 20% weight to export parity) to the export parity pricing mechanism could negatively impact OMCs’ GRM by ~US$2.0/bbl.
Valuation: We recommend ACCUMULATE based on gradual improvement in the OMCs outlook due to reduction in diesel under-recoveries. Our SOTP-based PT of Rs370/share comprises Rs293/share from the refining business using an EV/EBITDA of 6.0x, Rs443/share from the marketing business using a DCF method, Rs139/share from other investments and Rs505/share of net debt.
Risks: Higher-than-expected net under-recoveries burden and lower-than-expected GRM pose as the key downside risks to our call and estimates.
ACCUMULATE Rs249 Reuters: HPCL.BO Bloomberg: HPCL IN
12-month price target Rs370
Gagan Dixit [email protected] +91 22 4088 0368
Sapan Shah [email protected] +91 22 4088 0394
Market cap: Rs84.2 bn (US$1.4 bn) 52-week high/low: Rs381/248 Share o/s: 338.6 mn Avg daily trading vol (3m): 778.2 (‘000) Avg daily trading val (3m): Rs228.1 mn (US$3.9 mn) Source: Bloomberg
quant vs Consensus (Rs) PT EPS (FY15E) Mean 349 37.7 High 500 76.7 Low 261 22.2 quant 370 35.2
Buy(s) Hold(s) Sell(s) Nos 30 11 8 Source: Bloomberg
Shareholding pattern (%)
Mar13 Dec12 Sep12 Promoter 51.1 51.1 51.1 FIIs 9.8 7.3 6.2 MFs/FIs/Banks 24.1 24.9 27.0 Others 15.1 16.7 15.7
Source: BSE
Price performance (Rs) vs the Sensex
15000
16000
17000
18000
19000
20000
21000
200
250
300
350
400
450
500
Jun-
12
Jul-1
2
Aug-
12
Sep-
12
Oct-1
2
Nov-
12
Dec-
12
Jan-
13
Feb-
13
Mar
-13
Apr-1
3
May
-13
Jun-
13
HPCL IN Equity SENSEX IN Equity
Source: Bloomberg
India Equity Research | Oil & Gas June 22, 2013 Results Update
Unwarranted correction provides an attractive opportunity
HPCL
Note: pricing as on 21 June 2013, AE is adjusted for 4Q FY13 results; Source: Company data, quant Global Research estimates
Exhibit 1: Financials and valuation EPS PE EV/EBITDA ROCE ROE
(Rs mn) Growth (%) (Rs mn) Margin (%) (Rs mn) Growth (%) (Rs) (x) (x) (%) (%)
FY11 1,239,453 22.3 34,817 2.8 14,497 (29.7) 42.8 5.8 5.9 5.6 12.0
FY12 1,785,117 44.0 28,547 1.6 2,943 (79.7) 8.7 28.7 8.8 4.5 2.3
FY13AE 2,067,313 15.8 54,841 2.7 22,473 663.6 66.3 3.8 5.0 7.4 17.3
FY14E 2,109,978 2.1 50,634 2.4 11,500 (48.8) 33.9 7.3 5.9 4.8 8.7
FY15E 2,050,873 (2.8) 54,153 2.6 11,920 3.7 35.2 7.1 5.7 4.9 8.6
YE March
Revenue EBITDA Adj PAT
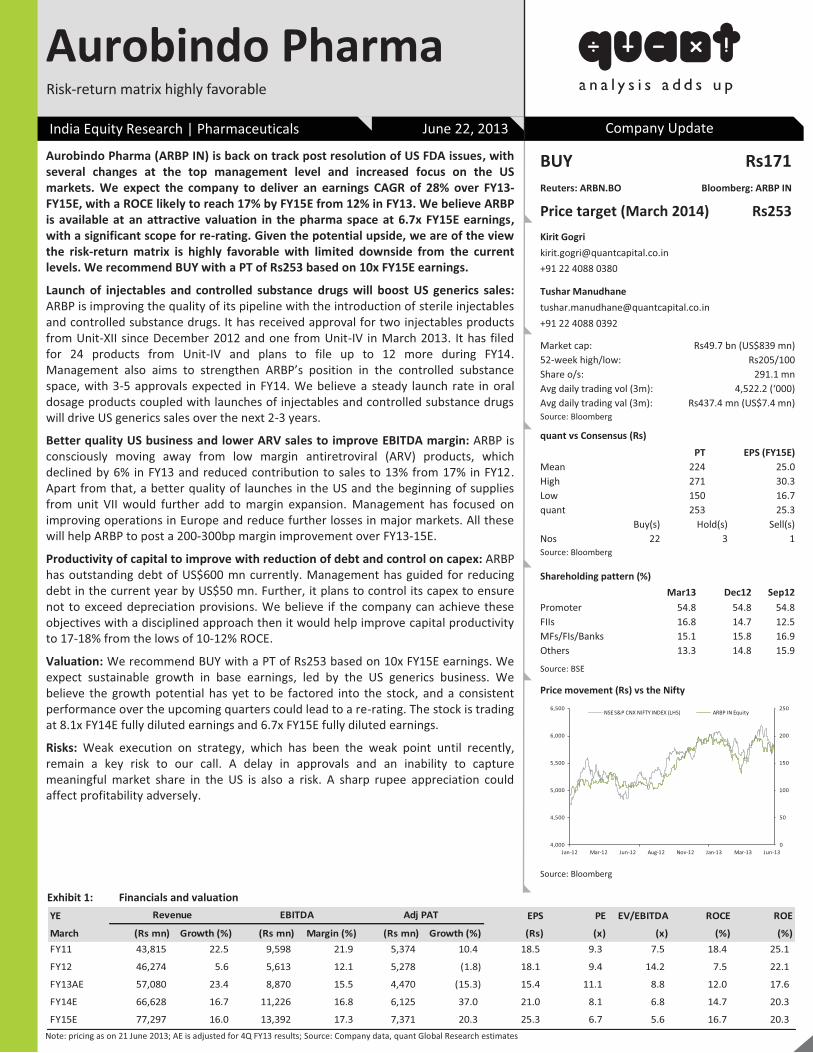
Chapter heading (1St heading)
Aurobindo Pharma (ARBP IN) is back on track post resolution of US FDA issues, with several changes at the top management level and increased focus on the US markets. We expect the company to deliver an earnings CAGR of 28% over FY13-FY15E, with a ROCE likely to reach 17% by FY15E from 12% in FY13. We believe ARBP is available at an attractive valuation in the pharma space at 6.7x FY15E earnings, with a significant scope for re-rating. Given the potential upside, we are of the view the risk-return matrix is highly favorable with limited downside from the current levels. We recommend BUY with a PT of Rs253 based on 10x FY15E earnings.
Launch of injectables and controlled substance drugs will boost US generics sales: ARBP is improving the quality of its pipeline with the introduction of sterile injectables and controlled substance drugs. It has received approval for two injectables products from Unit-XII since December 2012 and one from Unit-IV in March 2013. It has filed for 24 products from Unit-IV and plans to file up to 12 more during FY14. Management also aims to strengthen ARBP’s position in the controlled substance space, with 3-5 approvals expected in FY14. We believe a steady launch rate in oral dosage products coupled with launches of injectables and controlled substance drugs will drive US generics sales over the next 2-3 years.
Better quality US business and lower ARV sales to improve EBITDA margin: ARBP is consciously moving away from low margin antiretroviral (ARV) products, which declined by 6% in FY13 and reduced contribution to sales to 13% from 17% in FY12. Apart from that, a better quality of launches in the US and the beginning of supplies from unit VII would further add to margin expansion. Management has focused on improving operations in Europe and reduce further losses in major markets. All these will help ARBP to post a 200-300bp margin improvement over FY13-15E.
Productivity of capital to improve with reduction of debt and control on capex: ARBP has outstanding debt of US$600 mn currently. Management has guided for reducing debt in the current year by US$50 mn. Further, it plans to control its capex to ensure not to exceed depreciation provisions. We believe if the company can achieve these objectives with a disciplined approach then it would help improve capital productivity to 17-18% from the lows of 10-12% ROCE.
Valuation: We recommend BUY with a PT of Rs253 based on 10x FY15E earnings. We expect sustainable growth in base earnings, led by the US generics business. We believe the growth potential has yet to be factored into the stock, and a consistent performance over the upcoming quarters could lead to a re-rating. The stock is trading at 8.1x FY14E fully diluted earnings and 6.7x FY15E fully diluted earnings.
Risks: Weak execution on strategy, which has been the weak point until recently, remain a key risk to our call. A delay in approvals and an inability to capture meaningful market share in the US is also a risk. A sharp rupee appreciation could affect profitability adversely.
BUY Rs171 Reuters: ARBN.BO Bloomberg: ARBP IN
Price target (March 2014) Rs253 Kirit Gogri [email protected] +91 22 4088 0380
Tushar Manudhane [email protected] +91 22 4088 0392
Market cap: Rs49.7 bn (US$839 mn) 52-week high/low: Rs205/100 Share o/s: 291.1 mn Avg daily trading vol (3m): 4,522.2 (‘000) Avg daily trading val (3m): Rs437.4 mn (US$7.4 mn) Source: Bloomberg
quant vs Consensus (Rs) PT EPS (FY15E) Mean 224 25.0 High 271 30.3 Low 150 16.7 quant 253 25.3 Buy(s) Hold(s) Sell(s) Nos 22 3 1 Source: Bloomberg
Shareholding pattern (%) Mar13 Dec12 Sep12 Promoter 54.8 54.8 54.8 FIIs 16.8 14.7 12.5 MFs/FIs/Banks 15.1 15.8 16.9 Others 13.3 14.8 15.9
Source: BSE
Price movement (Rs) vs the Nifty
0
50
100
150
200
250
4,000
4,500
5,000
5,500
6,000
6,500
Jan-12 Mar-12 Jun-12 Aug-12 Nov-12 Jan-13 Mar-13 Jun-13
NSE S&P CNX NIFTY INDEX (LHS) ARBP IN Equity
Source: Bloomberg
India Equity Research | Pharmaceuticals June 22, 2013 Company Update
Risk-return matrix highly favorable
Aurobindo Pharma
Note: pricing as on 21 June 2013; AE is adjusted for 4Q FY13 results; Source: Company data, quant Global Research estimates
Exhibit 1: Financials and valuation YE EPS PE EV/EBITDA ROCE ROE
March (Rs mn) Growth (%) (Rs mn) Margin (%) (Rs mn) Growth (%) (Rs) (x) (x) (%) (%)FY11 43,815 22.5 9,598 21.9 5,374 10.4 18.5 9.3 7.5 18.4 25.1
FY12 46,274 5.6 5,613 12.1 5,278 (1.8) 18.1 9.4 14.2 7.5 22.1
FY13AE 57,080 23.4 8,870 15.5 4,470 (15.3) 15.4 11.1 8.8 12.0 17.6
FY14E 66,628 16.7 11,226 16.8 6,125 37.0 21.0 8.1 6.8 14.7 20.3
FY15E 77,297 16.0 13,392 17.3 7,371 20.3 25.3 6.7 5.6 16.7 20.3
Revenue EBITDA Adj PAT
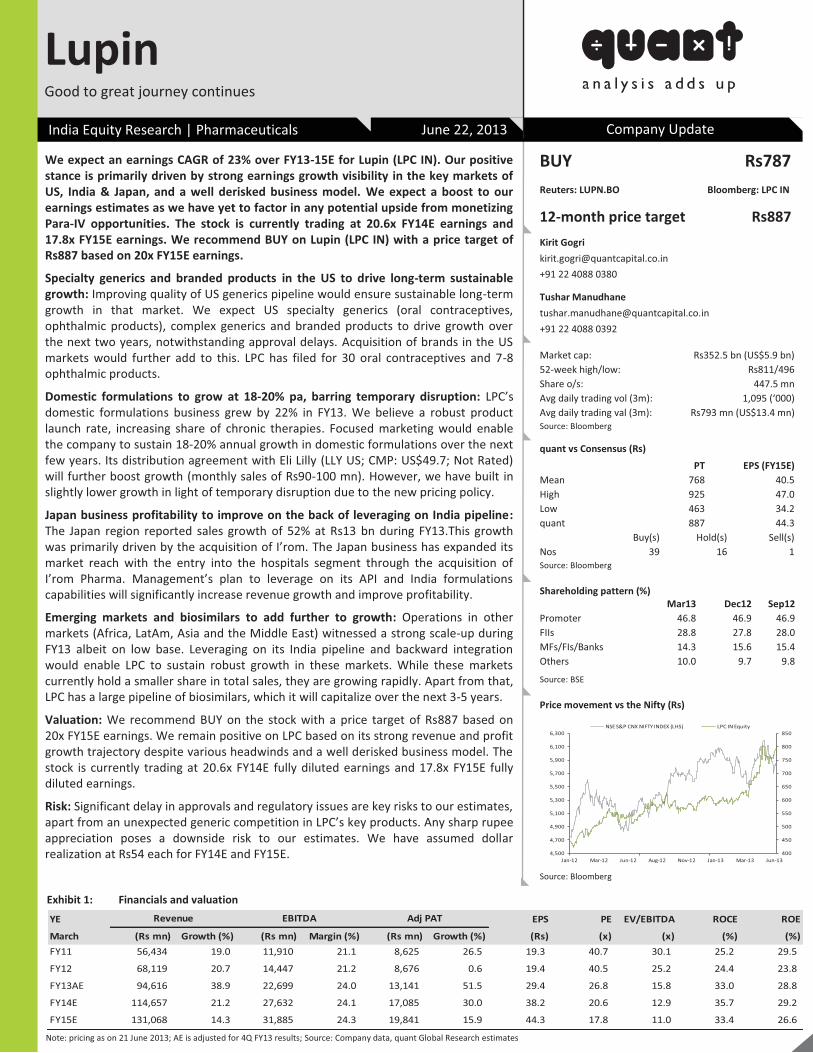
We expect an earnings CAGR of 23% over FY13-15E for Lupin (LPC IN). Our positive stance is primarily driven by strong earnings growth visibility in the key markets of US, India & Japan, and a well derisked business model. We expect a boost to our earnings estimates as we have yet to factor in any potential upside from monetizing Para-IV opportunities. The stock is currently trading at 20.6x FY14E earnings and 17.8x FY15E earnings. We recommend BUY on Lupin (LPC IN) with a price target of Rs887 based on 20x FY15E earnings.
Specialty generics and branded products in the US to drive long-term sustainable growth: Improving quality of US generics pipeline would ensure sustainable long-term growth in that market. We expect US specialty generics (oral contraceptives, ophthalmic products), complex generics and branded products to drive growth over the next two years, notwithstanding approval delays. Acquisition of brands in the US markets would further add to this. LPC has filed for 30 oral contraceptives and 7-8 ophthalmic products.
Domestic formulations to grow at 18-20% pa, barring temporary disruption: LPC’s domestic formulations business grew by 22% in FY13. We believe a robust product launch rate, increasing share of chronic therapies. Focused marketing would enable the company to sustain 18-20% annual growth in domestic formulations over the next few years. Its distribution agreement with Eli Lilly (LLY US; CMP: US$49.7; Not Rated) will further boost growth (monthly sales of Rs90-100 mn). However, we have built in slightly lower growth in light of temporary disruption due to the new pricing policy.
Japan business profitability to improve on the back of leveraging on India pipeline: The Japan region reported sales growth of 52% at Rs13 bn during FY13.This growth was primarily driven by the acquisition of I’rom. The Japan business has expanded its market reach with the entry into the hospitals segment through the acquisition of I’rom Pharma. Management’s plan to leverage on its API and India formulations capabilities will significantly increase revenue growth and improve profitability.
Emerging markets and biosimilars to add further to growth: Operations in other markets (Africa, LatAm, Asia and the Middle East) witnessed a strong scale-up during FY13 albeit on low base. Leveraging on its India pipeline and backward integration would enable LPC to sustain robust growth in these markets. While these markets currently hold a smaller share in total sales, they are growing rapidly. Apart from that, LPC has a large pipeline of biosimilars, which it will capitalize over the next 3-5 years.
Valuation: We recommend BUY on the stock with a price target of Rs887 based on 20x FY15E earnings. We remain positive on LPC based on its strong revenue and profit growth trajectory despite various headwinds and a well derisked business model. The stock is currently trading at 20.6x FY14E fully diluted earnings and 17.8x FY15E fully diluted earnings.
Risk: Significant delay in approvals and regulatory issues are key risks to our estimates, apart from an unexpected generic competition in LPC’s key products. Any sharp rupee appreciation poses a downside risk to our estimates. We have assumed dollar realization at Rs54 each for FY14E and FY15E.
BUY Rs787 Reuters: LUPN.BO Bloomberg: LPC IN
12-month price target Rs887 Kirit Gogri [email protected] +91 22 4088 0380
Tushar Manudhane [email protected] +91 22 4088 0392
Market cap: Rs352.5 bn (US$5.9 bn) 52-week high/low: Rs811/496 Share o/s: 447.5 mn Avg daily trading vol (3m): 1,095 (‘000) Avg daily trading val (3m): Rs793 mn (US$13.4 mn) Source: Bloomberg
quant vs Consensus (Rs) PT EPS (FY15E) Mean 768 40.5 High 925 47.0 Low 463 34.2 quant 887 44.3 Buy(s) Hold(s) Sell(s) Nos 39 16 1 Source: Bloomberg
Shareholding pattern (%) Mar13 Dec12 Sep12
Promoter 46.8 46.9 46.9 FIIs 28.8 27.8 28.0 MFs/FIs/Banks 14.3 15.6 15.4 Others 10.0 9.7 9.8
Source: BSE
Price movement vs the Nifty (Rs)
Source: Bloomberg
400
450
500
550
600
650
700
750
800
850
4,500
4,700
4,900
5,100
5,300
5,500
5,700
5,900
6,100
6,300
Jan-12 Mar-12 Jun-12 Aug-12 Nov-12 Jan-13 Mar-13 Jun-13
NSE S&P CNX NIFTY INDEX (LHS) LPC IN Equity
Lupin Good to great journey continues
India Equity Research | Pharmaceuticals June 22, 2013 Company Update
Note: pricing as on 21 June 2013; AE is adjusted for 4Q FY13 results; Source: Company data, quant Global Research estimates
Exhibit 1: Financials and valuation YE EPS PE EV/EBITDA ROCE ROE
March (Rs mn) Growth (%) (Rs mn) Margin (%) (Rs mn) Growth (%) (Rs) (x) (x) (%) (%)FY11 56,434 19.0 11,910 21.1 8,625 26.5 19.3 40.7 30.1 25.2 29.5
FY12 68,119 20.7 14,447 21.2 8,676 0.6 19.4 40.5 25.2 24.4 23.8
FY13AE 94,616 38.9 22,699 24.0 13,141 51.5 29.4 26.8 15.8 33.0 28.8
FY14E 114,657 21.2 27,632 24.1 17,085 30.0 38.2 20.6 12.9 35.7 29.2
FY15E 131,068 14.3 31,885 24.3 19,841 15.9 44.3 17.8 11.0 33.4 26.6
Revenue EBITDA Adj PAT
June 2013
Disclaimer:
“We, Sandeep Tandon, Arunkumar S, Pushpa Rai, Bhupesh Bameta, Anshum Bhambri, Piyush Singh, Rishav Dev, Hardik Ruparel, Alok Bisht, Aniruddha
Iyer, Gaurav Balre and Kumar Chitalia, hereby certify all of the views expressed in this report accurately reflect our personal views about the subject
company or companies and its or their securities. We also certify that no part of our compensation was, is or will be, directly or indirectly, related to the
specific recommendations or views expressed in this report."
quant Group generally prohibits its analysts, persons reporting to analysts, and members of their households from maintaining a fi nancial interest in the securities or
derivatives of any companies that the analysts cover. Additionally, quant Group generally prohibits its analysts and persons reporting to analysts from ser ving as an officer,
director, or advisory board member of any companies that the analysts cover. Our salespeople, traders, and other professionals may provide oral or written market
commentary or trading strategies to our clients that reflect opinions that are contrary to the opinions expressed herein, and our proprietary trading and investing businesses
may make investment decisions that are inconsistent with the recommendations expressed herein. In reviewing these materials, you shoul d be aware tha t any or all of the
foregoing, among other things, may give rise to real or potential conflicts of interest. Additionally, other important information regarding our relationships with the company
or companies that are the subject of this material is provided herein.
This material should not be construed as an offer to sell or the solicitation of an offer to buy any security in any jurisdiction where such an offer or solicitation would be illegal.
We are not soliciting any action based on this material. It is for the general information of clients of quant Group. It does not constitute a personal recommendation or take
into account the particular investment objectives, financial situations, or needs of individual clients. Be fore acting on any advice or recommendation in thi s material, clients
should consider whether it is suitable for their particular circumstances and, if necessary, seek profe ssional advice. The price and value of the i nvestments referred to in this
material and the income from them may go down as well as up, and investors may realize losses on any investments. Past performance is not a guide for fut ure performance,
future returns are not guaranteed and a loss of original capital may occur. quant Group does not provide tax advice to its clients, and all investors are strongly advised to
consult with their tax advisers regarding any potential investment in certain transactions — including those involving futures, options, and other derivatives as well as non
investment‐grade securities — that give rise to substantial risk and are not suitable for all investors. The material is based on information that we consider reliable, but we do
not represent that it is accurate or complete, and it should not be relied on as such. Opini ons expressed are our current opinions as of the date appearing on this material
only. We endeavor to update on a reasonable basis the information discussed in this material, but regulatory, compliance, or other reasons may prevent us from doing so.
We and our affiliates, officers, directors, and employees, including persons involved in the preparation or issuance of this material, may from time to time have "long" or
"short" positions in, act as principal in, and buy or sell the securities or derivatives thereof of companies mentioned herein and may from time to time add to or dispose of any
such securities (or investment). We and our affiliates may act as market maker or assume an underwriting commitment in the securities of companies discussed in this
document (or in related investments), may sell them to or buy them from customers on a principal basis and may also perform or seek to perform investment banking or
advisory services for or relating to those companies and may also be represented in the supervisory board or any other committee of those companies.
For the purpose of calculating whether quant Group and its affiliates hold, beneficially own, or control, including the right to vote for directors, 1% or more of the equity
shares of the subject, the holding of the issuer of a research report is also included.
quant Group and its non ‐US affiliates may, to the extent permissible under applicable laws, have acted on or used this research to the extent that it relates to non‐US issuers,
prior to or immediately following its publication. Foreign currency denominated securities are subject to fluctuations in exchange rates that could have an adverse effect on
the value or price of or income derived from the investment. In addition, investors in securities such as ADRs, the value of which are influenced by foreign
currencies, affe ctively assume currency risk. In addition, options involve risks and are not suitable for all investors. Please ensure that you have read and understood the
current derivatives risk disclosure document be fore entering into any derivative transactions.
In the US, this material is only for Qualified Institutional Buyers as de fined under rule 144(a) of the Securities Act, 1933. No part of this material may be (i) copied,
photocopied, or duplicated in any form by any means or (ii) redistributed without quant Group’s prior written consent. No part of this document may be distributed in Canada
or used by private customers in the United Kingdom.

June 2013
Global Macro / Fixed Income
Sandeep Tandon Macro Strategist 91 22 4088 0256 sandeep.tandon@quant capital.co.in
Arunkumar S Market Strategist 91 22 4088 0152 [email protected]
Pushpa Rai Fixed Income Strategist 91 22 4287 1455 [email protected]
Bhupesh Bameta, CFA India Economist 91 22 4088 0367 [email protected]
Alok Bisht Credit Analyst 91 22 4287 1585 [email protected]
Aniruddha Iyer Credit Analyst 91 22 4287 1511 [email protected]
Gaurav Balre, CFA Credit Analyst 91 22 4287 1516 [email protected]
Hardik Ruparel, CMT Technical Analyst 91 22 4088 0187 [email protected]
Fundamental Research
Kirit Gogri Fundamental Strategist, Pharma 91 22 4088 0380 [email protected]
Abhineet Anand Utilities and Industrials Analyst 91 22 4088 0396 [email protected]
Nitin Kumar, CFA Banking & Financials Analyst 91 22 4088 0371 [email protected]
Mangesh Bhadang Cement and Construction Analyst 91 22 4088 0381 [email protected]
Basudeb Banerjee Auto & Auto Ancillaries Analyst 91 22 4088 0375 [email protected]
Gagan Dixit Oil & Gas Analyst 91 22 4088 0368 [email protected]
Kalpesh Makwana Metals & Mining Analyst 91 22 4088 0379 [email protected]
Himanshu Nayyar Logistics and Agrichemicals Analyst 91 22 4088 0369 [email protected]
Amber Singhania Mid Caps Analyst 91 22 4088 0372 [email protected]
Arafat Saiyed Mid Caps Analyst 91 22 4088 0374 [email protected]
quantitative Research
Ashutosh Ojha Head of Quantitative Research 91 22 4287 1505 [email protected]
Anshum Bhambri quantitative Strategist 91 22 4088 0136 [email protected]
Rishav Dev Global Flows Strategist 91 22 4088 0147 [email protected]
Mukund Singh quantitative Analyst 91 22 4088 0321 [email protected]
Equity Derivatives / Sales Trading
Piyush Singh 91 22 4088 0291 [email protected]
Sunil Jain 91 22 4088 0132 [email protected]
Sailesh Jain 91 22 4088 0148 [email protected]
Kumar Chitalia 91 22 4088 0135 [email protected]
Pritesh Mehta 91 22 4088 0128 [email protected]
Equity Sales
Debashish Bose 91 22 4088 0138 [email protected]
Karthik Ramakrishnan 91 22 4088 0134 [email protected]
Ashok Agarwal 91 22 4088 0153 [email protected]
R Parthasarathy 91 22 4088 0171 [email protected]
Vijay Shah 91 22 4088 0151 [email protected]
Dhara Mehta 91 22 4088 0150 [email protected]
Electronic Trading
Shekhar More 91 22 4088 0299 [email protected]
Pritesh Gala 91 22 4088 0124 [email protected]
Fixed Income Sales
Altaf Qureshi 91 22 4287 1575 [email protected]
Shraddha Wade 91 22 4287 1552 [email protected]
Sabyasachi Mohanty 91 22 4287 1526 [email protected]
Nikunj Sampat 91 22 4287 1587 [email protected]
Chirag Thekdi 91 22 4287 1435 [email protected]
Mahesh Thakkar 91 22 4287 1465 [email protected]
Anila Nair 91 22 4287 1492 [email protected]
Bullion Sales
Javed Malpura 91 22 4287 1559 [email protected]
Nayan Gogri 91 22 4287 1454 [email protected]
Anand Lahoti 91 22 4287 1522 anand.lahoti @quantcapital.co.in
Kumar Aswani 91 22 4287 1407 [email protected]
Milind Pandav 91 22 4287 1453 [email protected]
June 2013 67
612, maker chambers IV, nariman point, mumbai 400 021, india
phone 91 22 4088 0100, 3025 0100 fax 91 22 4088 0198, 3025 0198