base station tests with smu200a vector signal … · special comments 1ma109_0e 4 rohde &...
TRANSCRIPT

Subject to change – Bernhard Schulz 04.2007 – 1MA109_0e
Products: R&S® Vector Signal generator SMU200A, R&S® Signal Analyzer FSP, R&S® FSU, R&S® FSQ
CDMA2000® Base Station Tests With the R&S®SMU200A Vector Signal Generator and Rohde & Schwarz Spectrum Analyzers
Application Note 1MA109 This Application Note describes measurements compliant with the CDMA2000® base station standard described in 3GPP2 C.S0010-C v2.0 / TIA/EIA-97-F-1.
The primary focus is on solutions for generating and analyzing CDMA2000 signals. The special characteristics that make the selected signal generators and signal analyzers highly suitable for this purpose are detailed, and remote control programming is demonstrated by means of a free-of-charge program.

Special Comments
1MA109_0e 2 Rohde & Schwarz
Contents 1 Overview ................................................................................................. 4 2 General.................................................................................................... 4
Special Comments............................................................................. 4 Instruments as required in the standard ............................................ 4
Channel simulator (Section 6.4.1)................................................. 4 Waveform quality measurement (Section 6.4.2) .......................... 5 Mobile station simulator (Section 6.4.3)........................................ 5 AWGN generator (Section 6.4.4).................................................. 5 CW generator (Section 6.4.5) ....................................................... 5 Spectrum analyzer (Section 6.4.6)................................................ 5 Average power meter (Section 6.4.7) ........................................... 6
Complete test setup ........................................................................... 6 Test modes ........................................................................................ 7 GDE ................................................................................................... 7
PC requirements ........................................................................... 7 Installation..................................................................................... 8 Getting started .............................................................................. 8
3 CDMA Receiver Minimum Standards ................................................... 10 Prior considerations ......................................................................... 10
Demonstration............................................................................. 10 Level............................................................................................ 10 RX test models............................................................................ 10
Frequency coverage requirements (3.1).......................................... 12 Access probe acquisition (3.2)......................................................... 12
Access channel probe acquisition (3.2.2.1) ................................ 13 Enhanced access probe acquisition (3.2.2.2) ............................. 14
R-CCCH demodulation performance (3.3) ...................................... 15 Performance in additive white Gaussian noise (3.3.1)................ 15 Performance in multipath fading with closed loop power control (3.3.2).......................................................................................... 16
R-traffic channel demodulation performance (3.6) .......................... 17 Performance in additive white Gaussian noise (3.6.1)................ 17 Performance in multipath fading without closed loop power control (3.6.2).......................................................................................... 18 Performance in multipath fading with closed loop power control (3.6.3).......................................................................................... 20
Receiver performance (3.7) ............................................................. 21 Receiver sensitivity (3.7.1) .......................................................... 21 Receiver dynamic range (3.7.2).................................................. 23 Single tone desensitization (3.7.3) .............................................. 24 Intermodulation spurious response attenuation (3.7.4) .............. 26 Adjacent channel selectivity (3.7.5)............................................. 28 Receiver blocking (3.7.6) ............................................................ 30
Limitations on emissions (3.8) ......................................................... 31 Conducted spurious emissions (3.8.1) ....................................... 31 Radiated spurious emissions (3.8.2) .......................................... 33
Receiver signal quality indicator (RSQI) (3.9) .................................. 33 4 CDMA Transmitter Minimum Standards ............................................... 34
Prior considerations ......................................................................... 34 Demonstration............................................................................. 34 TX test models............................................................................ 34
Frequency requirements (4.1).......................................................... 37 Frequency coverage (4.1.1)........................................................ 37 Frequency tolerance (4.1.2)........................................................ 37
Modulation requirements (4.2) ......................................................... 39 Synchronization and timing (4.2.1).............................................. 39

Special Comments
1MA109_0e 3 Rohde & Schwarz
Waveform quality (4.2.2)............................................................. 44 Forward power control subchannel (4.2.3) ................................. 45
RF output power requirements (4.3) ................................................ 47 Total power (4.3.1)...................................................................... 47 Pilot power (4.3.2) ....................................................................... 48 Code domain power (4.3.3) ........................................................ 50
Limitations on emissions (4.4) ......................................................... 51 Conducted spurious emissions (4.4.1) ....................................... 51 Radiated spurious emissions (4.4.2) .......................................... 54 Inter-base station transmitter intermodulation (4.4.3) ................. 54 Occupied bandwidth (4.4.4) ........................................................ 55
5 Appendix ............................................................................................... 57 Rohde & Schwarz solutions for CDMA2000 base station tests ....... 57
Signal generators........................................................................ 57 Signal analyzers.......................................................................... 58 Other instruments ....................................................................... 59
Remote sequences .......................................................................... 60 TX part (FSx) ............................................................................. 60 RX part (SMU) ........................................................................... 60
Abbreviations ................................................................................... 63 List of Figures................................................................................... 64 List of Tables.................................................................................... 65 References....................................................................................... 65 Additional information....................................................................... 66
6 Ordering Information ............................................................................. 66
CDMA2000® is a registered trademark of the Telecommunications Industry Association (TIA -USA)
The following abbreviations are used in this Application Note for Rohde & Schwarz test equipment:
• The R&S SMU vector signal generator is referred to as SMU.
• The R&S FSP spectrum analyzer is referred to as FSP.
• The R&S FSU spectrum analyzer is referred to as FSU.
• The R&S FSQ signal analyzer is referred to as FSQ.
• The FSP, FSU, and FSQ in general are referred to as FSx.

Special Comments
1MA109_0e 4 Rohde & Schwarz
1 Overview CDMA2000 as described by the Third Generation Partnership Project 2 (3GPP2) is an access method for use in the IMT-2000 proposal for third-generation (3G) cellular phone systems. The system is based on spread-spectrum codes and provides high and variable data rates.
This Application Note describes solutions for generating and analyzing CDMA2000 signals using equipment from Rohde & Schwarz. The features that make the SMU vector signal generator and the FSP and FSU spectrum analyzers and the FSQ signal analyzer highly suitable for this purpose are detailed.
This Application Note describes the solution with an SMU200A. Furthermore, various changes made to the standard are covered here.
Each measurement as described in the standard is shown, special implementation tips are provided, and typical measurement results are presented as instrument screenshots.
This Application Note covers receiver and transmitter tests in line with the following standards:
• 3GPP2 C.S0010-C v2.0
• TIA/EIA-97-F-1
Additionally, a small, free-of-charge test sequencer software program named "GDE" (=Generic Demonstration Engine) is included to show the necessary IEEE bus commands and to run all CDMA2000 tests for demonstration and evaluation.
2 General
Special Comments The specification mentions the spreading rates (SR) 1 ("1x") and 3 ("3x"). The SMU-K46 software option supports SR1, and only SR1 is described here. The SMU can generate SR3 via ARB files. See [xxx].
Very high power occurs on base stations! Be sure to use suitable attenuators in order to prevent damage to the test equipment.
All Rohde & Schwarz test equipment shall be operated using an external reference frequency.
Instruments as required in the standard The following section describes the necessary functional blocks according to the standard ([1], Section 6.4 - Standard Test Equipment) and the corresponding Rohde & Schwarz instruments and options:
Channel simulator (Section 6.4.1) The channel simulator applies different fading profiles to the signal in order to test the receiver part of the base station.

Instruments as required in the standard
1MA109_0e 5 Rohde & Schwarz
The SMU-B14 hardware option (fading simulator) for the SMU can generate all the required fading profiles quickly and easily.
Waveform quality measurement (Section 6.4.2) This calculates the difference between the ideal and the measured signal in a vector-oriented manner (I and Q components) and calculates parameters such as the rho factor or the phase error. The calculation is done in the I/Q or code domain.
The FSQ / FSU / FSP with the FS-K82 software option (CDMA2000 base station) is the ideal instrument for this kind of measurement task. It provides automatic channel detection, fast measurement in the code domain, and many different functions to evaluate CDMA2000 signals.
Mobile station simulator (Section 6.4.3) The simulator provides a CDMA2000 signal to the RX port of the base station under test for different measurements.
An SMU signal generator and the SMU-K12 software option (CDMA2000 signal generation) can generate all types of CDMA2000 signals for the 1x mode. It provides flexible signal setup for all parameters.
Please note that an SMU is NOT capable of performing an FER (frame error rate) or BER (bit error rate) measurement of a CDMA2000 signal. For FER and BER measurements, the base station must provide a "service mode" for performing the FER and BER measurement in the base station.
AWGN generator (Section 6.4.4) The AWGN generator simulates additive noise which is in reality generated by different sources like other mobile stations.
The SMU-K62 software option (additive white Gaussian noise) for the SMU can generate all the required types of noise with fast setup time and very good settability and gain flatness.
CW generator (Section 6.4.5) The CW generator is used to generate CW interference signals.
The SMU-K61 software option (multicarrier CW signals) for the SMU can generate all the CW interferer signals.
You may use a high performance CW generator from Rohde & Schwarz such as a second SMU/SMJ or SMV or SMR (with full frequency range needed) to generate the CW signal.
Spectrum analyzer (Section 6.4.6) The spectrum analyzer is used to perform power and spurious signal measurements.
You may use any Rohde & Schwarz spectrum analyzer such as the FSP,FSU or FSQ. In combination with the FS-K82 CDMA2000 software option, this is the ideal choice for performing CDMA2000 transmitter measurements and evaluating receiver spurious signals.

Complete test setup
1MA109_0e 6 Rohde & Schwarz
Average power meter (Section 6.4.7) The average power meter is used to measure the exact input power at the BS RX port or TX port.
The NRP power meter used in conjunction with the NRP-Z11 power sensor is ideal for this purpose. It offers innovative multipath sensor technology, 90 dB dynamic range, high measurement speed, and accurate measurement results.
You can use the NRP-Z11 in combination with the NRP base unit or directly connect it to your PC via USB bus (using the NRP-Z3 or NRP-Z4 option).
Complete test setup The following overview shows a recommended complete test setup for CDMA2000 BS tests.
For each individual test, only a part of the components is used. Please refer to the corresponding section in order to check which instruments are necessary.
Figure 1 - Complete test setup

Test modes
1MA109_0e 7 Rohde & Schwarz
Test modes The standard stipulates ten different test modes (Table 1).
Table 1 - Test modes
GDE This Application Note comes with a small demo program called "GDE" (=Generic Demonstration Engine) which is free of charge.
Each test described in this Application Note can be executed quickly and easily using the demo program. Results and test times can be evaluated with a single mouse click.
The program offers a straightforward user interface, benchmarking, and IEEE command sequence export functions for integrating the programming code into any user-specific test environment.
NOTE - Demonstration:
To demonstrate or evaluate the functions of the instruments, please connect the SMU vector signal generator directly to the FSx signal analyzer via the RF port.
PC requirements Recommended system configuration:
• Operating system: Windows 98 / 2000 / Me / XP Microsoft Internet Explorer 5.0 or later
• General PC requirements: - Pentium II 450 MHz or later - 128 Mbyte - 50 Mbyte free hard disk space (to store WV files and test cases) - XGA monitor (1024x768)

GDE
1MA109_0e 8 Rohde & Schwarz
• IEC/IEEE bus interface: National Instruments GPIB card, driver software version 1.7 or later
Installation The file 1MAxx_<version number>.EXE is required in order to install the sequencer GDE and the CDMA2000 test cases on the controlling PC.
Execute the installation program and select the installation directory. During installation, program files are copied to a directory of your choice. A new menu item “R&S CDMA2000 tests” is created in the START menu of your windows system.
Getting started When the program is started the first time, you are requested to register.
We kindly ask you to register GDE. Registration is free of charge and does not obligate you or your company. The unregistered version has full functionality and no expiration date.
Please follow the instructions on the screen in order to register GDE. After clicking "Continue" or entering Name and Key, the user interface will come up:
Figure 2 - GDE overview
• Under TEST GROUP, you can select between transmitter and receiver tests.
• Each test described in this Application Note is listed in the list box TEST CASE.
• Once a test case is selected, you can set up additional parameters (TEST CASE PARAMETERS).

GDE
1MA109_0e 9 Rohde & Schwarz
• Test runs are always divided into configuration and measurement. Use the buttons in the TEST CASE COMMANDS frame to start the individual test steps.
• Results and messages are displayed in the RESULT SUMMARY frame.
For details about information and installation, please refer to the manual on GDE or use the online manual by pressing the <F1> key in GDE.

Prior considerations
1MA109_0e 10 Rohde & Schwarz
3 CDMA Receiver Minimum Standards Note: If RX diversity measurements need to be carried out, a two-path SMU can generate two uncorrelated CDMA signals.
Note: The SMU can provide several different signals for triggering the BUT (frame trigger, P2S trigger, etc).
Prior considerations The tests are listed individually here based on their structure in the specification. Every test sequence of the demonstration can be run by itself. To save time, several tests can also be combined.
Demonstration For all RX measurements, the SMU generates the signal. For demonstrations the analyzer shows the test signal generated by the SMU.
Level The signal level to be set (S) is described indirectly in the specification via the noise level N and the ratio of the received energy per bit (Eb) to the received noise power and interference power (N0). Calculating the logarithm as follows
BandwidthrateBit
NE
NS b •=
0
yields
BandwidthrateBit
NE
NS b log100
++= (Formula 1)
Example: With the parameters mentioned in the specification (Access Channel Probe (3.2.2.1))
• N = - 90 dBm
• Eb/N0 = 6.5 dB
• Bit rate = 4.8 kbps
• Bandwidth = 1.23 MHz
the level S = -107.59 dBm is to be set.
For the demonstration the levels have been adapted to make it easy to display them on a spectrum analyzer.
RX test models For the RX test, specific channels for each case must be generated individually:
• R-ACH only
• R-EACH only

Prior considerations
1MA109_0e 11 Rohde & Schwarz
• R-CCCH only
With the R-traffic channels, all combinations supported by the base station must be tested. These differ depending on the radio configuration, frame duration, and data rate. Two default scenarios have been created for the demonstration in GDE:
• RC1: R-FCH on, R-SCCH0 to R-SCCH6 off, data rate 1.2 kbit/s
• RC3: R-FCH on, R-SCH1 and R-SCH2 off, data rate 1.5 kbit/s, frame duration 20 ms
By using the examples, you can simply make changes and incorporate them into your own program. Table 2 shows an overview of the instruments and options used for the RX test. Table 3 shows the individual test signals.
Table 2 - Instruments for RX tests

1MA109_0e 12 Rohde & Schwarz
Table 3 - Test signals for RX tests
Frequency coverage requirements (3.1) No measurements are necessary here, because the frequency assignment is a setting of the software in the base station.
Access probe acquisition (3.2) This test checks the receive characteristics of the base station for access probes with additive white Gaussian noise (AWGN).
The mobile station simulator generates an access probe signal (R-ACH and R-EACH) onto which AWGN is also superimposed. The base station counts the number of the successfully interpreted access probes. The ratio of interpreted access probes to transmitted access probes can be calculated using this figure.

Access probe acquisition (3.2)
1MA109_0e 13 Rohde & Schwarz
Test setup
Base StationUnder Test
Tx
Rx (A)
Rx (B)
SMU
Mobile StationSimulator
AWGNGenerator
Load
SMU-K62
Att.
Figure 3 - Test setup for access probe acquisition
Access channel probe acquisition (3.2.2.1) Settings
Table A1.1 of the specification defines the range of the Eb/N0 to be used – together with the corresponding error rate. Applying formula 1, the generator levels can be determined using the predefined noise power N of -90 dBm (SR1). The test must be carried out for all band classes.
Remote control example
The example in GDE does the following:
• Generates an R-ACH with a frame duration of 20 ms and a data rate of 4.8 kbit/s with the SMU
• Uses the generator level that has been set
• Adds AWGN with an Eb/N0 of 6.5 dB
• For demonstrations the analyzer shows the spectrum of the test signal both with and without AWGN.
Figure 4 shows the spectrum of the demonstration signal of the R-ACH.

Access probe acquisition (3.2)
1MA109_0e 14 Rohde & Schwarz
Ref -10 dBm Att 15 dB *
**
*
*
1 RMVIEW
2 RMVIEW
ASGL
RBW 10 kHzVBW 300 kHzSWT 1 s*
Center 1 GHz Span 4 MHz400 kHz/
*
-110
-100
-90
-80
-70
-60
-50
-40
-30
-20
-10
Figure 4 - Demonstration: spectrum access probe acquisition
Enhanced access probe acquisition (3.2.2.2) Settings
Table A1.2 of the specification defines the range of the Eb/N0 to be used – together with the corresponding maximum error rate. Applying formula 1, the generator levels can be determined using the predefined noise power N of -90 dBm (SR1). The test must be carried out for all band classes.
Remote control example
The example in GDE does the following:
• Generates an R-EACH with a frame duration of 20 ms and a data rate of 9.6 kbit/s with the SMU
• Uses the generator level that has been set
• Adds AWGN with an Eb/N0 of 5.7 dB
• For demonstrations the analyzer shows the spectrum of the test signal both with and without AWGN.

R-CCCH demodulation performance (3.3)
1MA109_0e 15 Rohde & Schwarz
R-CCCH demodulation performance (3.3) The tests in this area check the receive characteristics of the base station for the reverse common control channel (R-CCCH).
Performance in additive white Gaussian noise (3.3.1) This test checks the receive characteristics of the base station for the R-CCCH with additive white Gaussian noise (AWGN) by measuring the frame error rate (FER).
The mobile station simulator generates an R-CCCH plus AWGN. The base station receives the signal and must determine the frame error rate (FER). Since it is not possible to set up a call to the base station with the SMU, the base station must be changed to a suitable mode.
Test setup
Base StationUnder Test
Tx
Rx (A)
Rx (B)
SMU
Mobile StationSimulator
AWGNGenerator
Load
SMU-K62
Att.
Figure 5 - Test setup: R-CCCH demodulation, AWGN
Settings
Table A2.1.1 of the specification defines the range of the Eb/N0 to be used – together with the corresponding error rates – in six scenarios that differ with respect to data rate, frame duration, and AWGN. Applying formula 1, the generator levels are determined with the predefined noise power N of -84 dBm (SR1). The test must be carried out for all band classes.
Remote control example
The example in GDE does the following:
• Generates an R-CCCH with a frame duration of 20 ms and a data rate of 9.6 kbit/s with the SMU.
• Uses the generator level that has been set
• Adds AWGN with an Eb/N0 of 4.0 dB and 4.6 dB
• for demonstrations the analyzer shows the spectrum of the test signal both twice with and without AWGN.
Figure 6 shows the spectrum of the demonstration signal of the R-CCCH.

R-CCCH demodulation performance (3.3)
1MA109_0e 16 Rohde & Schwarz
Ref -10 dBm Att 15 dB *
**
*
*
*
1 RMVIEW
2 RMVIEW
3 RMVIEW
ASGL
RBW 100 kHzVBW 1 MHzSWT 500 ms*
Center 1 GHz Span 4 MHz400 kHz/
*
-90
-80
-70
-60
-50
-40
-30
-20
-10
Figure 6 - Demonstration: spectrum, R-CCCH demodulation
Performance in multipath fading with closed loop power control (3.3.2) This test checks the receive characteristics of the base station for the R-CCCH with additive white Gaussian noise (AWGN) and fading by measuring the frame error rate (FER).
The mobile station simulator generates an R-CCCH, simulates fading, and adds AWGN. The base station receives the signal and must determine the frame error rate (FER). Since it is not possible to set up a call to the base station with the SMU, the base station must be changed to a suitable mode.
Test setup
Base StationUnder Test
Tx
Rx (A)
Rx (B)
SMU
Mobile StationSimulator
AWGNGenerator
Load
SMU-K62
ChannelSimulator
SMU-B14
Att.
Figure 7 - Test setup: R-CCCH demodulation, fading

1MA109_0e 17 Rohde & Schwarz
Settings
The specification describes four (standard) fading profiles.
Case Channel simulator configuration SMU setting
A 1 (3 km/h, 1 path) CDMA 6
B 2 (8 km/h, 2 paths) CDMA 1
C 3 (30 km/h, 1 path) CDMA 3
D 4 (100 km/h, 3 paths) CDMA 4
Table 4 – Fading profile, R-CCCH
In addition, the band classes are combined into three groups. The six different scenarios from Section 3.3.1, which differ in data rate, frame duration, and AWGN level, are again defined for each fading profile and each group. In addition, the corresponding maximum error rates are defined. (Specification: Table A 2.2.1) Applying formula 1, the generator levels can be determined using the predefined noise power N of -84 dBm (SR1). The test must be carried out for all band classes.
Remote control example
The example in GDE does the following:
• Generates an R-CCCH with a frame duration of 20 ms and a data rate of 9.6 kbit/s with the SMU
• Uses the generator level that has been set
• Runs the four fading profiles
• Adds AWGN for each
• For demonstrations the analyzer shows the four tests.
• The analyzer level should be set to 0 dBm for the demonstration in order to be able to display the measurement results.
R-traffic channel demodulation performance (3.6) The tests in this area check the receive characteristics of the base station for the reverse traffic channel (R-TCH).
Performance in additive white Gaussian noise (3.6.1) This test checks the receive characteristics of the base station for the R-TCH with additive white Gaussian noise (AWGN) by measuring the frame error rate (FER).
The mobile station simulator generates an R-TCH plus AWGN. The base station receives the signal and must determine the frame error rate (FER). Since it is not possible to set up a call to the base station with the SMU, the base station must be changed to a suitable mode.

R-traffic channel demodulation performance (3.6)
1MA109_0e 18 Rohde & Schwarz
Test setup
Base StationUnder Test
Tx
Rx (A)
Rx (B)
SMU
Mobile StationSimulator
AWGNGenerator
Load
SMU-K62
Att.
Figure 8 - Test setup: R-TCH, AWGN
Settings
Tables A5.1.1 to A5.1.8 of the specification define the range of the Eb/N0 to be used – together with the corresponding maximum error rates – depending on the radio configuration, supported channels (R-FCH, R-DCCH, R-SCCH, and R-SCH), data rate, coding and frame duration. Applying formula 1, the generator levels can be determined using the predefined noise power N of -84 dBm (SR1). The test must be carried out for all band classes.
Remote control example
Two example in GDE do the following:
• Example for RC1 generates an R-FCH with a frame duration of 20 ms and a data rate of 1.2 kbit/s with the SMU; R-SCCHs are switched off
• Example for RC3 generates an R-FCH with a frame duration of 20 ms and a data rate of 1.5 kbit/s with the SMU; R-SCHs are switched off
• Uses the generator level that has been set
• Adds AWGN with an Eb/N0 of 4.1 dB and 4.7 dB for RC1 and 7.0 dB and 7.6 dB for RC3
• For demonstrations the analyzer shows two tests both with and without AWGN
• Settings such as channels, data rate, and frame duration can easily be changed
Performance in multipath fading without closed loop power control (3.6.2) This test checks the receive characteristics of the base station for the R-TCH with additive white Gaussian noise (AWGN) and fading by measuring the frame error rate (FER).
The mobile station simulator generates an R-TCH, simulates fading, and adds AWGN. The base station receives the signal and must determine the

R-traffic channel demodulation performance (3.6)
1MA109_0e 19 Rohde & Schwarz
frame error rate (FER). Since it is not possible to set up a call to the base station with the SMU, the base station must be changed to a suitable mode.
Test setup
Base StationUnder Test
Tx
Rx (A)
Rx (B)
SMU
Mobile StationSimulator
AWGNGenerator
Load
SMU-K62
ChannelSimulator
SMU-B14
Att.
Figure 9 - Test setup: R-TCH, fading, without closed loop
Settings
The specification describes four (standard) fading profiles.
Case Channel simulator configuration SMU setting
B 2 (8 km/h, 2 paths) CDMA 1
C 3 (30 km/h, 1 path) CDMA 3
D 4 (100 km/h, 3 paths) CDMA 4
D2 4 (100 km/h, 3 paths) CDMA 4
Table 5 - Fading profile, R-TCH
In addition, the band classes are combined into three groups. The six different scenarios from Section 3.6.1, which differ in data rate, frame duration, channels (R-FCH and R-SCCH), and AWGN level, are defined for each fading profile and each group. In addition, the corresponding maximum error rates are defined. (Specification: Tables A5.2.1 to A5.2.3) Applying formula 1, the generator levels can be determined using the predefined noise power N of -84 dBm (SR1). The test must be carried out for all band classes, but only for RC1 and RC2.
Remote control example
The example in GDE does the following:
• Generates an RC1 R-FCH with a frame duration of 20 ms and a data rate of 1.2 kbit/s with the SMU; R-SCCHs are switched off
• Uses the generator level that has been set
• Runs the four fading profiles
• Adds AWGN with an Eb/N0 of 4.1 dB and 4.7 dB

R-traffic channel demodulation performance (3.6)
1MA109_0e 20 Rohde & Schwarz
• For demonstrations the analyzer shows two tests both with and without AWGN
Performance in multipath fading with closed loop power control (3.6.3) This test checks the receive characteristics of the base station for the R-TCH with additive white Gaussian noise (AWGN) and fading by measuring the frame error rate (FER).
The mobile station simulator generates an R-TCH, simulates fading, and adds AWGN. The base station receives the signal and must determine the frame error rate (FER). Since it is not possible to set up a call to the base station with the SMU, the base station must be changed to a suitable mode.
Test setup
Base StationUnder Test
Tx
Rx (A)
Rx (B)
SMU
Mobile StationSimulator
AWGNGenerator
Load
SMU-K62
ChannelSimulator
SMU-B14
Att.
Figure 10 - Test setup: R-TCH, fading, with closed loop
Settings
The specification describes four (standard) fading profiles.
Case Channel simulator configuration SMU setting
A 1 (3 km/h, 1 path) CDMA 6
B 2 (8 km/h, 2 paths) CDMA 1
C 3 (30 km/h, 1 path) CDMA 3
D 4 (100 km/h, 3 paths) CDMA 4
Table 6 - standard fading profiles
In addition, the band classes are combined into three groups. The six different scenarios from Section 3.6.1, which differ in data rate, frame duration, channels (R-FCH, R-DCCH, R-SCCH, and R-SCH), and AWGN level, are defined for each fading profile and each group. In addition, the corresponding maximum error rates are defined. (specification: Table A 5.3.1 to A 5.3.7) Applying formula 1, the generator levels can be determined using the predefined noise power N of -84 dBm (SR1). The test must be carried out for all band classes and for all RCs.

Receiver performance (3.7)
1MA109_0e 21 Rohde & Schwarz
Remote control example
Two example in GDE do the following:
• Example for RC1 generates an R-FCH with a frame duration of 20 ms and a data rate of 1.2 kbit/s with the SMU; R-SCCHs are switched off
• Example for RC3 generates an R-FCH with a frame duration of 20 ms and a data rate of 1.5 kbit/s with the SMU; R-SCHs are switched off
• Uses the generator level that has been set
• Runs the four fading profiles
• Adds AWGN
• Settings such as channels, data rate, and frame duration can easily be changed
• For demonstrations the analyzer shows two tests both with and without AWGN
Receiver performance (3.7)
Receiver sensitivity (3.7.1) This test checks the sensitivity of the receiver of the base station for the reverse traffic channel by measuring the frame error rate (FER). Receiver sensitivity is the minimum level at which the FER does not exceed 1 %.
The mobile station simulator generates an R-TCH. The base station receives the signal and must determine the frame error rate (FER). Since it is not possible to set up a call to the base station with the SMU, the base station must be changed to a suitable mode.
Test setup
Base StationUnder Test
Tx
Rx (A)
Rx (B)
SMU
Mobile StationSimulator
Load
Att.
Figure 11 - Test setup: receiver sensitivity

Receiver performance (3.7)
1MA109_0e 22 Rohde & Schwarz
Settings
Depending on the RC, the test can be carried out either on R-FCH or R-DCCH. The test must be carried out for all band classes and all RCs. The sensitivity point should be -117 dBm for bands 450 and 800, and -119 dBm for other bands.
Remote control example
Two example in GDE do the following:
• Example for RC1 generates an R-FCH with a frame duration of 20 ms and a data rate of 1.2 kbit/s with the SMU; R-SCCHs are switched off
• Example for RC3 generates an R-FCH with a frame duration of 20 ms and a data rate of 1.5 kbit/s with the SMU; R-SCHs are switched off
• Uses the generator level that has been set
• Settings such as channels, data rate, and frame duration can easily be changed
• For demonstrations the analyzer shows the spectrum of the test signal
Figure 12 shows the spectrum of the demonstration signal for the R-TCH.
Ref -10 dBm Att 5 dB *
RBW 10 kHzVBW 300 kHz
A
**SWT 500 ms
SGL*1 RM
CLRWR
*
Center 1 GHz Span 4.5 MHz450 kHz/-110
-100
-90
-80
-70
-60
-50
-40
-30
-20
-10 CH PWR -25.20 dBm
Figure 12 - Demonstration: spectrum, receiver sensitivity

Receiver performance (3.7)
1MA109_0e 23 Rohde & Schwarz
Receiver dynamic range (3.7.2) This test shows the range of the receiver of the base station for the reverse traffic channel at which the frame error rate (FER) does not exceed 1 %. The value from test 3.7.1 is used as the lower limit.
The mobile station simulator generates an R-TCH. The base station receives the signal and must determine the frame error rate (FER). Since it is not possible to set up a call to the base station with the SMU, the base station must be changed to a suitable mode.
Test setup
Base StationUnder Test
Tx
Rx (A)
Rx (B)
SMU
Mobile StationSimulator
Load
Att.
Figure 13 - Test setup: receiver dynamic range
Settings
Depending on the RC, the test can be carried out either on R-FCH or R-DCCH. The test must be carried out for all band classes and all RCs.
Remote control example
Two example in GDE do the following:
• Example for RC1 generates an R-FCH with a frame duration of 20 ms and a data rate of 1.2 kbit/s with the SMU; R-SCCHs are switched off
• Example for RC3 generates an R-FCH with a frame duration of 20 ms and a data rate of 1.5 kbit/s with the SMU; R-SCHs are switched off
• Uses the generator level that has been set and carries out two level steps below
• Settings such as channels, data rate, and frame duration can easily be changed
• For demonstrations the analyzer shows three spectrum of the test signal with different power levels
Figure 14 shows the spectrum of the demonstration signal for the R-TCH at three different levels.

Receiver performance (3.7)
1MA109_0e 24 Rohde & Schwarz
Ref -10 dBm Att 5 dB *
RBW 10 kHz
A
*
SWT 500 ms
SGL*1 RM
VIEW
*2 RMVIEW
* VBW 300 kHz*
Center 1 GHz Span 4.5 MHz450 kHz/
*3 RMVIEW
-110
-100
-90
-80
-70
-60
-50
-40
-30
-20
-10 CH PWR -82.37 dBm
Figure 14 - Demonstration: spectrum, receiver dynamic range
Single tone desensitization (3.7.3) This test checks the receiver of the base station by means of a reverse traffic channel with the additional presence of a CW interferer.
The mobile station simulator generates an R-TCH and, with the second channel, a CW interferer (frequency offset and level see table).
Band class (subclass)
CW power above in dB
CW frequencies
50 f1 - 750 kHz and f2 + 750 kHz 0
87 f1 - 900 kHz and f2 + 900 kHz
50 f1 - 750 kHz and f2 + 750 kHz 0 (subclass 0 for China) 87 f1 – 1.11 MHz and f2 + 1.11 MHz
1,4,6,7,8,10,14,15 80 f1 – 1.25 MHz and f2 + 1.25 MHz
2,3,5,9,11,12 87 f1 - 900 kHz and f2 + 900 kHz
Table 7 - Single tone desensitization, CW levels, and CW frequencies
The base station receives the signal and must determine the frame error rate (FER). Since it is not possible to set up a call to the base station with the SMU, the base station must be changed to a suitable mode. The FER must not exceed 1.5 %.

Receiver performance (3.7)
1MA109_0e 25 Rohde & Schwarz
Test setup
Base StationUnder Test
Tx
Rx (A)
Rx (B)
SMU
Mobile StationSimulator
CWGenerator
Load
SMU-K62
Path A
Path B
Att.
Figure 15 - Test setup: single tone desensitization
Settings
Depending on the RC, the test can be carried out either on R-FCH or R-DCCH. The test must be carried out for all band classes and all RCs.
Remote control example
Two example in GDE do the following:
• Example for RC1 generates an R-FCH with a frame duration of 20 ms and a data rate of 1.2 kbit/s with the SMU; R-SCCHs are switched off
• Example for RC3 generates an R-FCH with a frame duration of 20 ms and a data rate of 1.5 kbit/s with the SMU; R-SCHs are switched off
• Uses the generator level that has been set (should be -60 dBm for the demonstration)
• Generates a CW interferer with the second channel of the SMU first with an offset of ±750 kHz and then ±900 kHz. Here, both levels are raised only 50 dB above the wanted generator level.
• For demonstrations the analyzer shows the spectrum of the test signal for three CW interferers
Figure 16 shows the spectrum of the demonstration signal for single tone desensitization.

Receiver performance (3.7)
1MA109_0e 26 Rohde & Schwarz
A
Ref -10 dBm Att 15 dB *
Center 1 GHz Span 5 MHz500 kHz/
RBW 10 kHz*
SWT 500 ms
SGL*1 RM
VIEW
*2 RMVIEW
* VBW 1 MHz*
*3 RMVIEW
-110
-100
-90
-80
-70
-60
-50
-40
-30
-20
-10
Figure 16 - Demonstration: single tone desensitization
Intermodulation spurious response attenuation (3.7.4) This test checks the receiver of the base station by means of a reverse traffic channel with the additional presence of two CW interferers that can generate intermodulation products on the receiver frequency.
Band class (subclass)
CW power above in dB
CW frequencies
f2 + 900 kHz and f2 + 1700 kHz + i * 1250 kHz 0,2,3,5,9,11 72
f1 - 900 kHz and f1 - 1700 kHz - i * 1250 kHz
f2 + 1110 kHz and f2 + 1910 kHz + i * 1250 kHz 0 (subclass 0 for China)
72
f1 - 1110 kHz and f1 - 1910 kHz - i * 1250 kHz
f2 + 1.25 MHz and f2 + 2.05 MHz + i * 1.25 MHz 1,4,6,8,14,15 70
f1 - 1.25 MHz and f1 – 2.05 MHz – i * 1.25 MHz
f2 + 1.25 MHz and f2 + 2.05 MHz + i * 1.25 MHz 7,10,12 72
f1 - 1.25 MHz and f1 – 2.05 MHz – i * 1.25 MHz
Table 8 - Intermodulation spurious response, CW levels, and CW frequencies
The mobile station simulator generates an R-TCH and, with the second channel, two CW interferers (for frequency offset and level, see Table 8 ).

Receiver performance (3.7)
1MA109_0e 27 Rohde & Schwarz
The base station receives the signal and must determine the frame error rate (FER). Since it is not possible to set up a call to the base station with the SMU, the base station must be changed to a suitable mode. The FER must not exceed 1.5 %.
Test setup
Base StationUnder Test
Tx
Rx (A)
Rx (B)
SMU
Mobile StationSimulator
CWGenerator
Load
SMU-K62
Path A
Path B
CWGenerator
Att.
Figure 17 - Test setup: intermodulation spurious response attenuation
Settings
Depending on the RC, the test can be carried out either on R-FCH or R-DCCH. The test must be carried out for all band classes and all RCs.
Remote control example
Two example in GDE do the following:
• Example for RC1 generates an R-FCH with a frame duration of 20 ms and a data rate of 1.2 kbit/s with the SMU; R-SCCHs are switched off
• Example for RC3 generates an R-FCH with a frame duration of 20 ms and a data rate of 1.5 kbit/s with the SMU; R-SCHs are switched off
• Uses the generator level that has been set (should be -60 dBm for the demonstration)
• Generates two CW interferers with offsets of ±900 kHz and ±1700 kHz with the second channel of the SMU. Here, both levels are only raised 50 dB above the wanted generator level.
• For demonstrations the analyzer shows the spectrum of the test signals twice
Figure 18 shows the spectrum of the demonstration signal for intermodulation spurious response attenuation.

Receiver performance (3.7)
1MA109_0e 28 Rohde & Schwarz
A
Ref -10 dBm Att 15 dB *
Center 1 GHz Span 5 MHz500 kHz/
RBW 10 kHz*
SWT 500 ms
SGL*1 RM
VIEW
* VBW 1 MHz*
*2 RMVIEW
-110
-100
-90
-80
-70
-60
-50
-40
-30
-20
-10
Figure 18 - Demonstration: intermodulation spurious response attenuation
Adjacent channel selectivity (3.7.5) This test checks the receiver of the base station by means of a reverse traffic channel with the additional presence of a second CDMA channel.
The mobile station simulator generates an R-TCH and, with the second channel, an additional CDMA channel (RC3) at an offset of ±2.5 MHz with a level of -53 dBm.
The base station receives the signal and must determine the frame error rate (FER). Since it is not possible to set up a call to the base station with the SMU, the base station must be changed to a suitable mode. The FER must not exceed 1.5 %.

Receiver performance (3.7)
1MA109_0e 29 Rohde & Schwarz
Test setup
Base StationUnder Test
Tx
Rx (A)
Rx (B)
SMU
Mobile StationSimulator
Load
SMU-K62
Path A
Path BMobile Station
Simulator
Att.
Figure 19 - Test setup: adjacent channel selectivity
Settings
Depending on the RC, the test can be carried out either on R-FCH or R-DCCH. The test must be carried out for all RCs but only for band class 6.
Remote control example
Two example in GDE do the following:
• Example for RC1 generates an R-FCH with a frame duration of 20 ms and a data rate of 1.2 kbit/s with the SMU; R-SCCHs are switched off
• Example for RC3 generates an R-FCH with a frame duration of 20 ms and a data rate of 1.5 kbit/s with the SMU; R-SCHs are switched off
• Uses the generator level that has been set
• Using the second channel of the SMU, generates the additional CDMA channel (RC3) with offsets of ±2.5 MHz and a level of -53 dBm.
• For demonstrations the analyzer shows twice the spectrum of the test signal
Figure 20 shows the spectrum of the demonstration signal for adjacent channel selectivity.

Receiver performance (3.7)
1MA109_0e 30 Rohde & Schwarz
A
Ref -10 dBm Att 15 dB *
Center 1 GHz Span 10 MHz1 MHz/
RBW 100 kHz*
SWT 1 s
SGL*1 RM
VIEW
* VBW 1 MHz*
*2 RMVIEW
-110
-100
-90
-80
-70
-60
-50
-40
-30
-20
-10
Figure 20 - Demonstration: spectrum, adjacent channel selectivity
Receiver blocking (3.7.6) This test checks the receiver of the base station by means of a reverse traffic channel with the additional presence of a CW interferer at various frequencies.
The mobile station simulator generates an R-TCH and, with the second channel, a CW interferer with 1 MHz steps in the frequency ranges and level as follows:
Frequency range Level above wanted signal in dB
1 MHz to 1899 MHz 100
1900 MHz to 2000 MHz (skip range +-2.5 MHz around carrier)
75
2001 MHz to 12.75 GHz 100
Table 9 - Receiver blocking, CW level, and frequency ranges
The SMU can generate frequencies of up to a maximum of 6 GHz. If the entire frequency range is used, an instrument such as the SMR must be implemented.
The base station receives the signal and must determine the frame error rate (FER). Since it is not possible to set up a call to the base station with the SMU, the base station must be changed to a suitable mode.

1MA109_0e 31 Rohde & Schwarz
Test setup
Base StationUnder Test
Tx
Rx (A)
Rx (B)
SMU
Mobile StationSimulator
CWGenerator
Load
SMU-K62
Path A
Path B
Att.
Figure 21 - Test setup: receiver blocking
Settings
Depending on the RC, the test can be carried out either on R-FCH or R-DCCH. The test must be carried out for all RCs but only for band class 6.
Remote control example
Two example in GDE do the following:
• Example for RC1 generates an R-FCH with a frame duration of 20 ms and a data rate of 1.2 kbit/s with the SMU; R-SCCHs are switched off
• Example for RC3 generates an R-FCH with a frame duration of 20 ms and a data rate of 1.5 kbit/s with the SMU; R-SCHs are switched off
• Uses the generator level that has been set (should be -60 dBm for the demonstration)
• Generates first a CW interferer at the generator frequency that has been set and then 1 MHz further with a level of 50 dB above the wanted channel with the second channel of the SMU.
• For demonstrations the analyzer shows the spectrum of the test signal
Limitations on emissions (3.8)
Conducted spurious emissions (3.8.1) Conducted spurious emissions are defined as signals at the receiver input that are generated or amplified by the base station.
Different limits are applied for the various frequency ranges (see specification )
A spectrum analyzer is connected to the input of the base station and measures the emissions with the output switched off.

Limitations on emissions (3.8)
1MA109_0e 32 Rohde & Schwarz
Test setup
Base StationUnder Test
Tx
Rx (A)
Rx (B)
SpectrumAnalyzer
Figure 22 - Test setup: conducted spurious emissions
Settings
Measures in various bands (see specification)
Remote control example
Two example in GDE do the following:
• Example 1 measures in a continuous sweep
• Example 2 measures in multiple individual sweeps
Figure 23 shows an excerpt from the GDE report.
Figure 23 - Demo: conducted spurious emissions

Receiver signal quality indicator (RSQI) (3.9)
1MA109_0e 33 Rohde & Schwarz
Radiated spurious emissions (3.8.2) The specification does not explicitly cover any measurements. Country-specific requirements are applied.
Receiver signal quality indicator (RSQI) (3.9) In this test, the calculation of the RSQI is checked by the base station. The base station must measure the Eb/N0. The mobile station simulator generates a noise with a specific level and a signal with an Eb/N0 of -6 dB. Then the power of the signal is increased in steps of 1 dB, and Eb/N0 is measured after each step until 14 dB is reached or exceeded.
Test setup
Base StationUnder Test
Tx
Rx (A)
Rx (B)
SMU
Mobile StationSimulator
Load
SMU-K62
Path A
Path BNoise
Generator
Att.
Figure 24 - Test setup: receiver signal quality indicator (RSQI)
Settings
This test applies for all band classes. Depending on the RC, the test can be carried out either on R-FCH or R-DCCH. The test must be carried out for all RCs.
Remote control example
Two example in GDE do the following:
• Example for RC1 generates an R-FCH with a frame duration of 20 ms and a data rate of 1.2 kbit/s with the SMU; R-SCCHs are switched off
• Example for RC3 generates an R-FCH with a frame duration of 20 ms and a data rate of 1.5 kbit/s with the SMU; R-SCHs are switched off
• Generates noise by means of the second channel of the SMU with the adjustable level.
• The level is initially determined by the Eb/N0 of 8 dB. It is then incremented in steps of 1 dB.
• Calculates the measured Eb/N0 for the demonstration with the analyzer at each level step.

Prior considerations
1MA109_0e 34 Rohde & Schwarz
4 CDMA Transmitter Minimum Standards
Prior considerations The tests are listed individually here based on their structure in the specification. Every test sequence of the demonstration can be run by itself. To save time, several tests can also be combined. In particular, individual measurements (e.g. CDP measurements) can be carried out together.
Demonstration For all TX measurements, the FSx measures the TX signal of the base station. For the demonstration with GDE, the signal is generated by the SMU and measured by a spectrum analyzer.
TX test models For the TX tests, the specification (Section 6.5.2) lists several test models. The model for the "normal" traffic channel consists of the following channels (Table 10):
Fraction of power Channel No.
linear log
Comments
Pilot (F-PICH) 1 20 % -7.0 dB W0128
Paging (F-PCH) 1 4.71 % -13.3 dB W164
Sync (F-SYNC) 1 18.82 % -7.3 dB W3264
Traffic (F-FCH + F-SCH)
6* 9.412 % each
-10.3 dB each
Full rate,equal power
Table 10 - Test model: F-TCH
A test model for the transmit diversity path has also been created (Table 11):
Fraction of power Channel No.
linear log
Comment
Transmit diversity pilot (F-TDPICH)
1 20 % -7.0 dB W16128
Traffic (F-FCH + F-SCH)
6* 9.412 % each
-10.3 dB each
Full rate,equal power
Table 11 - Test model: F-TCH, transmit diversity
*Note: For some tests, the max. possible number of traffic channels supported by the BS needs to be used. Six channels were always selected for the demonstration.

Prior considerations
1MA109_0e 35 Rohde & Schwarz
Furthermore, a model for packet data tests is available (Table 12):
Fraction of power Channel No.
linear log
Comments
Pilot (F-PICH) 1 10 % -10 dB W064
Paging (F-PCH) 1 10 % -10 dB W164
Sync (F-SYNC) 1 5 % -13 dB W3264
Packet data control (F-PDCCH)
1 10 % -10 dB W3364
Traffic (F-FCH) 1 10 % -10 dB variable
Packet data
(F-PDCH)
1 55 % -2.6 dB highest data rate of BS
Table 12 - Test model: F-TCH, packet data (1xEV-DV)
Three subchannels with the following settings are used for the demonstration. These can be changed in the SMU as necessary. Be sure to pay attention to any code conflicts that occur.
• Walsh codes 31, 15, and 23
• Packet interval: 20 ms
• Number of bits per packet: 408
• Data rate: 81.6 kbit/s
• Number of timeslots per packet: 4
• Modulation: QPSK
• Timeslot offset: 4, 8, and 12
Excluding the complex test models, some tests require only the pilot channel (F-PICH).
Table 13 shows an overview of the instruments and options used for the RX test. Table 14 lists the individual test signals.

Prior considerations
1MA109_0e 36 Rohde & Schwarz
Table 13 - Instruments for TX tests

1MA109_0e 37 Rohde & Schwarz
Table 14 - Signals for TX tests
Frequency requirements (4.1)
Frequency coverage (4.1.1) No measurements are necessary here, because the frequency assignment is a setting of the software in the base station.
Frequency tolerance (4.1.2) In this test, the frequency error is measured relative to the frequency that has been set. The spectrum analyzer equipped with the CDMA2000 software option (K-46) measures the frequency error by using the F-PICH. The maximum permissible tolerance is ±5 ppm.

Frequency requirements (4.1)
1MA109_0e 38 Rohde & Schwarz
Test setup
Base StationUnder Test
Tx
Rx (A)
Rx (B)
SpectrumAnalyzer
WaveformAnalyzer
Load
FS-K82
Att.
Figure 25 - Test setup: frequency tolerance
Settings
This test needs to be carried out under 4.2.2 and for all band classes.
Remote control example
The example in GDE
• Generates an F-PICH for the demonstration with the SMU
• Sets the analyzer to a frequency error measurement and outputs the values for the frequency error in Hz and in ppm
Figure 26 shows the measurement for frequency tolerance on the spectrum analyzer.

1MA109_0e 39 Rohde & Schwarz
Ref -10.0
dBm
Ref -10.0
dBm
Ref -10.0
dBm
1CLRWR
BS,1X,C0 :CODE POWER
CF 1 GHzdB PICHChan 0.64PCG 0
Start Code 0 4 Code/ Stop Code 63
ASGL
Ref -10.0
dBm
Ref -10.0
dBm
Ref -10.0
dBm
1CLRWR
RESULT SUMMARY TABLE
CF 1 GHzChan 0.64PCG 0
B
Att 15 dBAtt 15 dB
SR 19.2 ksps
Att 15 dBAtt 15 dB
SR 19.2 ksps
*
*
-63-56
-49-42-35-28
-21-14-7
RESULTS FOR SET 0 PCG 0: GLOBAL RESULTS FOR SET 0: Total PWR -24.91 dBm Carr Freq Error 108.86 Hz Pilot PWR -24.91 dBm Carr Freq Error 0.11 ppm RHO 0.99999 Chip Rate Error -0.19 ppm Composite EVM 0.31 % Trg to Frame -.------ s Pk CDE (SF 64) -65.39 dB Active Channels 1 IQ Imbal/Offset 0.02/0.02 %
CHANNEL RESULTS: Modulation BPSK Symbol Rate 19.2 ksps Timing Offset -.-- ns Channel.SF 0.64 Phase Offset -.-- mrad Channel Power Rel 0.00 dB Channel Power Abs -24.91 dBm Symbol EVM 0.04 % rms Symbol EVM 0.10 % Pk
Figure 26 - Demonstration: frequency tolerance
Modulation requirements (4.2)
Synchronization and timing (4.2.1) Pilot timing tolerance (4.2.1.1)
Every CDMA base station must adjust its time reference to the CDMA system time. If the external reference source is not present, the timing must not vary by more than 10 µs for 8 hours and should not vary by more than 3 µs.
For the test, the timing of the pilot channel is measured relative to the reference time (P2S signal, every two seconds). This requires triggering of the measuring instrument in response to the P2S signal.
The spectrum analyzer carries out a measurement in the code domain and determines the time difference of the pilot relative to the trigger.

Modulation requirements (4.2)
1MA109_0e 40 Rohde & Schwarz
Test setup
Base StationUnder Test
Tx
Rx (A)
Rx (B)
SpectrumAnalyzer
WaveformAnalyzer
Load
FS-K82
Att.
Figure 27 – Test setup: pilot timing tolerance
Settings
The base station must generate only an F-PICH. The test needs to be carried out for all CDMA channels (sectors and frequencies).
Remote control example
The example in GDE
• Generates an F-PICH for the demonstration with the SMU. The SMU provides a superframe trigger at the Marker 1 socket of the front panel. The Ext Trigger socket of the FSx must be connected with the Marker 1 socket via a BNC cable.
• Sets the analyzer to a timing measurement and outputs the values for the timing.
Figure 28 shows the measurement for pilot timing on the spectrum analyzer.

Modulation requirements (4.2)
1MA109_0e 41 Rohde & Schwarz
A
B
Ref -10.0
dBm
Ref -10.0
dBm
Ref -10.0
dBmAtt 15 dBAtt 15 dB
BS,1X,C0 :CODE POWER
dB PICH PCG 0
Start Code 0 4 Code/ Stop Code 63
1CLRWR
Ref -10.0
dBm
Ref -10.0
dBm
Ref -10.0
dBm
1CLRWR
RESULT SUMMARY TABLE
PCG 0
Att15 dBAtt15 dB
TRG
CF 1 GHz
CF 1 GHz
SGL
Chan 0.64
Chan 0.64
SR 19.2 ksps
SR 19.2 ksps
-63-56-49-42-35-28-21-14-7
RESULTS FOR SET 0 PCG 0: GLOBAL RESULTS FOR SET 0: Total PWR -24.91 dBm Carr Freq Error 108.97 Hz Pilot PWR -24.91 dBm Carr Freq Error 0.11 ppm RHO 0.99999 Chip Rate Error -0.30 ppm Composite EVM 0.30 % Trg to Frame 112.157338 ns Pk CDE (SF 64) -66.16 dB Active Channels 1 IQ Imbal/Offset 0.04/0.00 %
CHANNEL RESULTS: Modulation BPSK Symbol Rate 19.2 ksps Timing Offset -.-- ns Channel.SF 0.64 Phase Offset -.-- mrad Channel Power Rel 0.00 dB Channel Power Abs -24.91 dBm Symbol EVM 0.05 % rms Symbol EVM 0.10 % Pk
Figure 28 - Demonstration: pilot timing tolerance
Pilot channel to code channel time tolerance (4.2.1.2)
In this test, the timing between the pilot channel and the other code channels of a forward channel is checked. The difference must not be more than ±50 ns. For the transmit diversity path, the difference must not be more than ±100 ns and should be less than ±50 ns.
The spectrum analyzer carries out a measurement in the code domain and determines the time difference of the individual code channels relative to the pilot.
Test setup
Base StationUnder Test
Tx
Rx (A)
Rx (B)
SpectrumAnalyzer
Code DomainPower
Analyzer
Load
FS-K82
Att.
Figure 29 - Test setup: pilot channel to code channel time tolerance

Modulation requirements (4.2)
1MA109_0e 42 Rohde & Schwarz
Settings
The base station must generate an F-PICH and additional code channels. The test needs to be carried out for all band classes.
Remote control example
The example in GDE do the following:
• Generates an F-PICH, F-SYNC, F-PCH, an F-FCH, and an additional five F-SCHs for the demonstration with the SMU.
• Sets the analyzer to a timing measurement and outputs the values for the timing of the various code channels.
• Second example generates an F-FCH and an additional five F-SCHs for the second antenna with the SMU (transmit diversity).
• Third example generates an F-PICH, F-SYNC, F-PDCCH, F-PDCH, as well as three subchannels for packet data (1xEV-DV). Plus, an additional F-FCH is set up.
Figure 30 shows the measurement for the timing pilot channel to code channel on the spectrum analyzer.
A
B
SGLRef -10.0
dBm
Ref -10.0
dBm
Ref -10.0
dBm
1CLRWR
BS,1X,C0 :CHANNEL TAB
CF 1 GHzChan 63.64PCG 0
Ref -10.0
dBm
Ref -10.0
dBm
Ref -10.0
dBm
1CLRWR
RESULT SUMMARY TABLE
CF 1 GHzChan 63.64PCG 0
Att 15 dBAtt 15 dB
Att15 dBAtt15 dB
SR 19.2 ksps
Type Chan.SF Symb Rate RC Status Pwr Abs Pwr Rel T Offs Ph Offs ksps dBm dB ns mrad
PICH 0.64 19.2 --- active -31.91 reference 0.00 0.00SYNC 32.64 19.2 --- active -38.21 -6.30 0.09 0.11PCH 1.64 19.2 --- active -32.21 -0.31 0.02 0.15CHAN 10.64 19.2 1+2 active -35.21 -3.30 0.08 0.36CHAN 22.64 19.2 1+2 active -35.21 -3.30 0.03 -0.02CHAN 23.64 19.2 1+2 active -35.21 -3.30 0.00 0.12CHAN 24.64 19.2 1+2 active -35.21 -3.30 0.04 0.06CHAN 25.64 19.2 1+2 active -35.21 -3.30 0.10 0.27CHAN 63.64 19.2 1+2 active -35.21 -3.30 0.05 0.16---- 2.64 19.2 3-5 inact -92.77 -60.86 -.-- -.------ 3.64 19.2 3-5 inact -94.04 -62.13 -.-- -.------ 4.64 19.2 3-5 inact -92.81 -60.90 -.-- -.--
Max T 0.10 ns @ 25.64 Max Ph 0.36 mrad @ 10.64
RESULTS FOR SET 0 PCG 0: GLOBAL RESULTS FOR SET 0: Total PWR -24.94 dBm Carr Freq Error 109.38 Hz Pilot PWR -31.91 dBm Carr Freq Error 0.11 ppm RHO 0.99999 Chip Rate Error -0.01 ppm Composite EVM 0.31 % Trg to Frame -.------ s Pk CDE (SF 64) -66.26 dB Active Channels 9 IQ Imbal/Offset 0.03/0.05 %
CHANNEL RESULTS: Modulation BPSK Symbol Rate 19.2 ksps Timing Offset 0.05 ns Channel.SF 63.64 Phase Offset 0.16 mrad Channel Power Rel -3.30 dB Channel Power Abs -35.21 dBm Symbol EVM 0.14 % rms Symbol EVM 0.34 % Pk
Figure 30 - Demonstration: pilot channel to code channel time tolerance
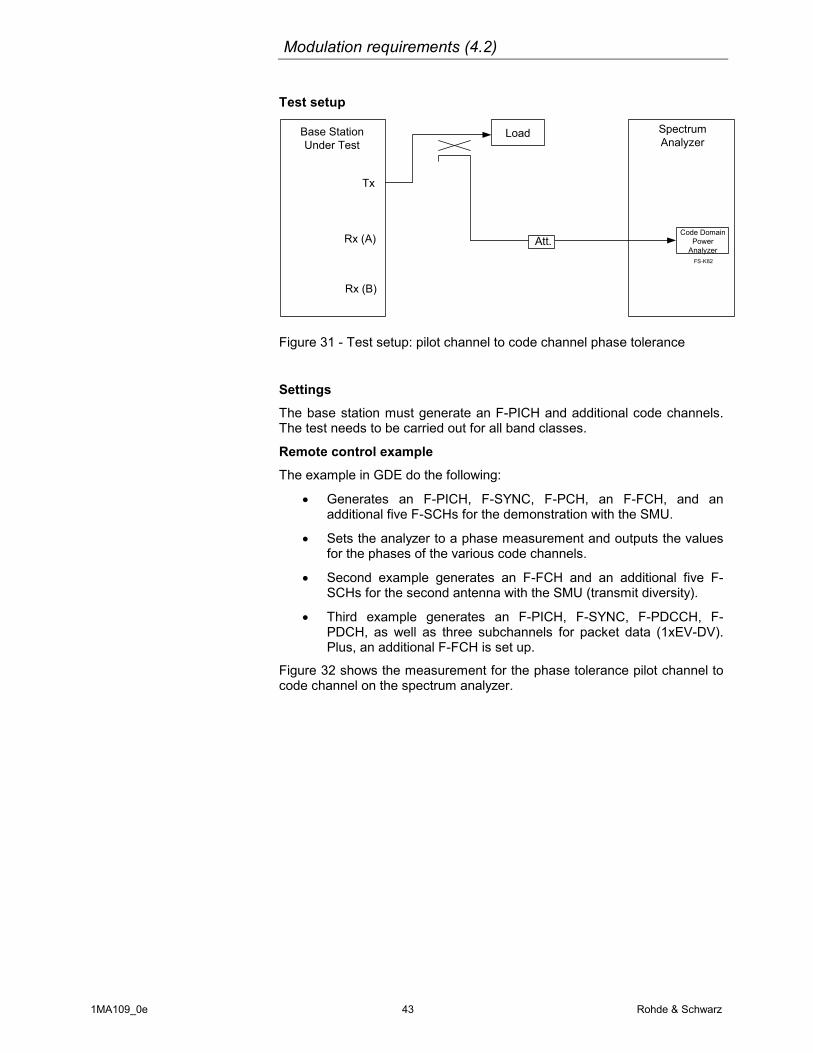
Pilot channel to code channel phase tolerance (4.2.1.3)
Here, the phase errors between the pilot channel and the other code channels of a forward channel are measured. The phase error must not exceed 0.15 rad and should be less than 0.05 rad.
The spectrum analyzer carries out a measurement in the code domain and determines the phase difference between individual code channels and the pilot.
Modulation requirements (4.2)
1MA109_0e 43 Rohde & Schwarz
Test setup
Base StationUnder Test
Tx
Rx (A)
Rx (B)
SpectrumAnalyzer
Code DomainPower
Analyzer
Load
FS-K82
Att.
Figure 31 - Test setup: pilot channel to code channel phase tolerance
Settings
The base station must generate an F-PICH and additional code channels. The test needs to be carried out for all band classes.
Remote control example
The example in GDE do the following:
• Generates an F-PICH, F-SYNC, F-PCH, an F-FCH, and an additional five F-SCHs for the demonstration with the SMU.
• Sets the analyzer to a phase measurement and outputs the values for the phases of the various code channels.
• Second example generates an F-FCH and an additional five F-SCHs for the second antenna with the SMU (transmit diversity).
• Third example generates an F-PICH, F-SYNC, F-PDCCH, F-PDCH, as well as three subchannels for packet data (1xEV-DV). Plus, an additional F-FCH is set up.
Figure 32 shows the measurement for the phase tolerance pilot channel to code channel on the spectrum analyzer.

Modulation requirements (4.2)
1MA109_0e 44 Rohde & Schwarz
A
B
SGLRef -10.0
dBm
Ref -10.0
dBm
Ref -10.0
dBm
1CLRWR
BS,1X,C0 :CHANNEL TAB
CF 1 GHzChan 63.64PCG 0
Ref -10.0
dBm
Ref -10.0
dBm
Ref -10.0
dBm
1CLRWR
RESULT SUMMARY TABLE
CF 1 GHzChan 63.64PCG 0
Att 15 dBAtt 15 dB
Att 15 dBAtt 15 dB
SR 19.2 ksps
Type Chan.SF Symb Rate RC Status Pwr Abs Pwr Rel T Offs Ph Offs ksps dBm dB ns mrad
PICH 0.64 19.2 --- active -31.91 reference 0.00 0.00SYNC 32.64 19.2 --- active -38.21 -6.30 0.09 0.11PCH 1.64 19.2 --- active -32.21 -0.31 0.02 0.15CHAN 10.64 19.2 1+2 active -35.21 -3.30 0.08 0.36CHAN 22.64 19.2 1+2 active -35.21 -3.30 0.03 -0.02CHAN 23.64 19.2 1+2 active -35.21 -3.30 0.00 0.12CHAN 24.64 19.2 1+2 active -35.21 -3.30 0.04 0.06CHAN 25.64 19.2 1+2 active -35.21 -3.30 0.10 0.27CHAN 63.64 19.2 1+2 active -35.21 -3.30 0.05 0.16---- 2.64 19.2 3-5 inact -92.77 -60.86 -.-- -.------ 3.64 19.2 3-5 inact -94.04 -62.13 -.-- -.------ 4.64 19.2 3-5 inact -92.81 -60.90 -.-- -.--
Max T 0.10 ns @ 25.64 Max Ph 0.36 mrad @ 10.64
RESULTS FOR SET 0 PCG 0: GLOBAL RESULTS FOR SET 0: Total PWR -24.94 dBm Carr Freq Error 109.38 Hz Pilot PWR -31.91 dBm Carr Freq Error 0.11 ppm RHO 0.99999 Chip Rate Error -0.01 ppm Composite EVM 0.31 % Trg to Frame -.------ s Pk CDE (SF 64) -66.26 dB Active Channels 9 IQ Imbal/Offset 0.03/0.05 %
CHANNEL RESULTS: Modulation BPSK Symbol Rate 19.2 ksps Timing Offset 0.05 ns Channel.SF 63.64 Phase Offset 0.16 mrad Channel Power Rel -3.30 dB Channel Power Abs -35.21 dBm Symbol EVM 0.14 % rms Symbol EVM 0.34 % Pk
Figure 32 - Demonstration: pilot channel to code channel phase tolerance
Waveform quality (4.2.2) In this test, the waveform quality factor (rho) of the pilot channel is checked. This factor represents the ratio of the measured signal to an ideal signal. All base stations must be better than 0.912. In addition, the requirement is higher for RC10 (see specification).
The spectrum analyzer carries out a measurement in the code domain and determines the rho factor.
Test setup
Base StationUnder Test
Tx
Rx (A)
Rx (B)
SpectrumAnalyzer
WaveformAnalyzer
Load
FS-K82
Att.
Figure 33 - Test setup: waveform quality

Modulation requirements (4.2)
1MA109_0e 45 Rohde & Schwarz
Settings
The base station must generate only an F-PICH. The test needs to be carried out for all band classes.
Remote control example
The example in GDE does the following:
• Generates an F-PICH for the demonstration with the SMU.
• Sets the analyzer to a rho measurement and outputs the values for rho.
• Note: GDE rounds rho off to 1.0 here.
Figure 34 shows the measurement for waveform quality on the spectrum analyzer.
A
B
Ref -10.0
dBm
Ref -10.0
dBm
Ref -10.0
dBmAtt 15 dBAtt 15 dB
BS,1X,C0 :CODE POWER
dB PICH PCG 0
Start Code 0 4 Code/ Stop Code 63
1CLRWR
Ref -10.0
dBm
Ref -10.0
dBm
Ref -10.0
dBm
1CLRWR
RESULT SUMMARY TABLE
PCG 0
Att 15 dBAtt 15 dB
TRG
CF 1 GHz
CF 1 GHz
SGL
Chan 0.64
Chan 0.64
SR 19.2 ksps
SR 19.2 ksps
-63-56-49-42-35-28-21-14-7
RESULTS FOR SET 0 PCG 0: GLOBAL RESULTS FOR SET 0: Total PWR -24.91 dBm Carr Freq Error 108.97 Hz Pilot PWR -24.91 dBm Carr Freq Error 0.11 ppm RHO 0.99999 Chip Rate Error -0.30 ppm Composite EVM 0.30 % Trg to Frame 112.157338 ns Pk CDE (SF 64) -66.16 dB Active Channels 1 IQ Imbal/Offset 0.04/0.00 %
CHANNEL RESULTS: Modulation BPSK Symbol Rate 19.2 ksps Timing Offset -.-- ns Channel.SF 0.64 Phase Offset -.-- mrad Channel Power Rel 0.00 dB Channel Power Abs -24.91 dBm Symbol EVM 0.05 % rms Symbol EVM 0.10 % Pk
Figure 34 - Demonstration: waveform quality
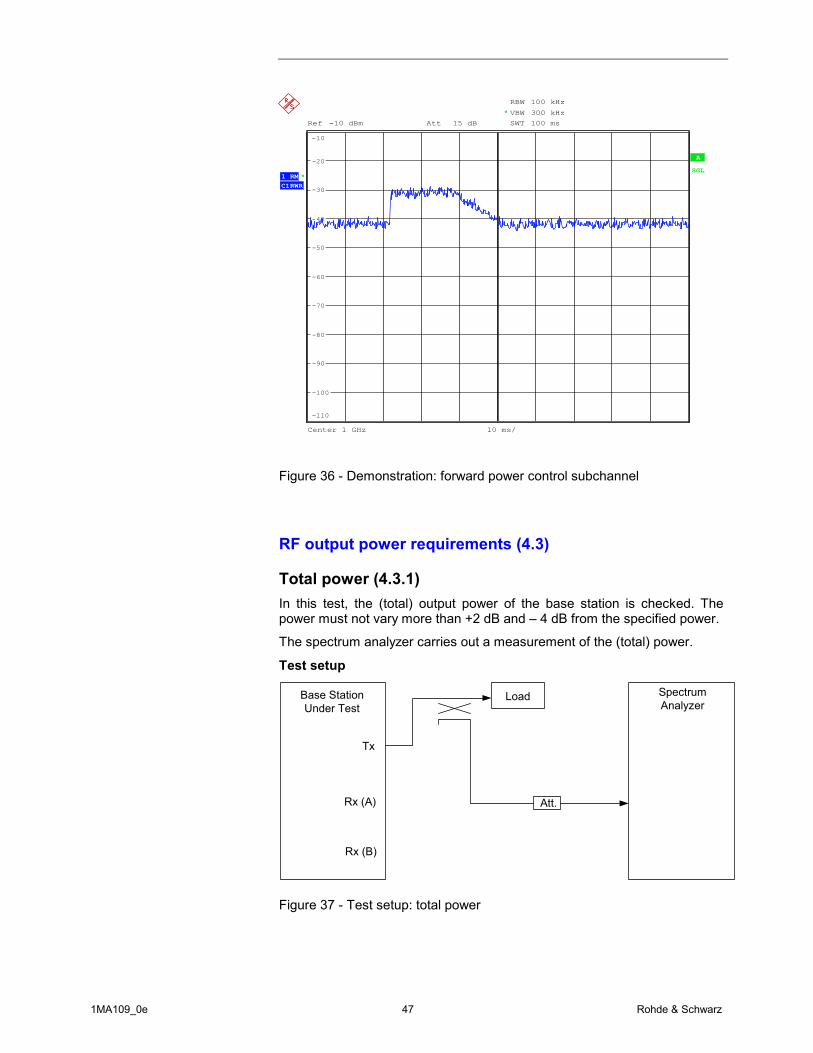
Forward power control subchannel (4.2.3) Here, the power control bits need to be checked. The mobile station simulator (SMU) generates a signal that varies by 10 dB. The base station must respond with specific power control bits.

Modulation requirements (4.2)
1MA109_0e 46 Rohde & Schwarz
Test setup
Base StationUnder Test
Tx
Rx (A)
Rx (B)
SMU
Mobile StationSimulator
Load
Att.
Figure 35 - Test setup: forward power control subchannel
Settings
The mobile station simulator generates an R-FCH. The test needs to be carried out for all band classes. The power initially remains at the same level (alternating 10), then transmits 0 ten times in order to reduce 10 dB, and then sends alternating 10 again. The signal repeats every 80 ms.
Remote control example
Two example in GDE do the following:
• Example for RC1 generates an R-FCH with a frame duration of 20 ms and a data rate of 1.2 kbit/s with the SMU; R-SCCHs are switched off
• Example for RC3 generates an R-FCH with a frame duration of 20 ms and a data rate of 1.5 kbit/s with the SMU; R-SCHs are switched off
• Measures the time characteristic of the signal in the zero span for the demonstration with a spectrum analyzer
Figure 36 shows the time characteristic of the SMU signal in the demonstration.
1MA109_0e 47 Rohde & Schwarz
Ref -10 dBm Att 15 dB
RBW 100 kHzVBW 300 kHzSWT 100 ms
*
*
Center 1 GHz 10 ms/
1 RMCLRWR
ASGL
-110
-100
-90
-80
-70
-60
-50
-40
-30
-20
-10
Figure 36 - Demonstration: forward power control subchannel
RF output power requirements (4.3)
Total power (4.3.1) In this test, the (total) output power of the base station is checked. The power must not vary more than +2 dB and – 4 dB from the specified power.
The spectrum analyzer carries out a measurement of the (total) power.
Test setup
Base StationUnder Test
Tx
Rx (A)
Rx (B)
SpectrumAnalyzer
Load
Att.
Figure 37 - Test setup: total power

RF output power requirements (4.3)
1MA109_0e 48 Rohde & Schwarz
Settings
The base station generates a complete forward channel. The test needs to be carried out for all band classes.
Remote control example
The example in GDE does the following:
• Generates an F-PICH, F-SYNC, F-PCH, an F-FCH, and an additional five F-SCHs for the demonstration with the SMU.
• Measures the channel power once with FS-K82 or via the standard channel measurement
Figure 38 shows the spectrum of the demonstration signal for total power.
Ref -10 dBm Att 5 dB *
**
BS,1X,C0 :CHAN POWER
1 RMCLRWR
ASGL
RBW 10 kHzVBW 300 kHzSWT 100 ms*
Center 1 GHz Span 2 MHz200 kHz/
*
-110
-100
-90
-80
-70
-60
-50
-40
-30
-20
-10 CH PWR -25.03 dBm
Figure 38 - Demonstration: total power
Pilot power (4.3.2) The power of the pilot channel and the total power of a forward channel are measured here. The (pilot) power must not vary more than ±0.5 dB from the specified power.
The spectrum analyzer carries out a measurement in the code domain of the pilot power and of the total power.

RF output power requirements (4.3)
1MA109_0e 49 Rohde & Schwarz
Test setup
Base StationUnder Test
Tx
Rx (A)
Rx (B)
SpectrumAnalyzer
Code DomainPower
Analyzer
Load
FS-K82
Att.
Figure 39 - Test setup: pilot power
Settings
The base station generates a complete forward channel. The test needs to be carried out for all band classes.
Remote control example
The example in GDE does the following:
• Generates an F-PICH, F-SYNC, F-PCH, an F-FCH, and an additional five F-SCHs for the demonstration with the SMU.
• Measures the total channel power as well as the pilot channel power
Figure 40 shows the demonstration measurement in the code domain.

RF output power requirements (4.3)
1MA109_0e 50 Rohde & Schwarz
A
B
Ref -10.0
dBm
Ref -10.0
dBm
Ref -10.0
dBmAtt 15 dBAtt 15 dB
BS,1X,C0 :CODE POWER
dB PICH PCG 0
Start Code 0 4 Code/ Stop Code 63
1CLRWR
CF 1 GHz
Ref -10.0
dBm
Ref -10.0
dBm
Ref -10.0
dBm
1CLRWR
RESULT SUMMARY TABLE
CF 1 GHz PCG 0
Att15 dBAtt15 dB
SGL
Chan 0.64
Chan 0.64
SR 19.2 ksps
SR 19.2 ksps
-63-56-49-42-35-28-21-14-7
RESULTS FOR SET 0 PCG 0: GLOBAL RESULTS FOR SET 0: Total PWR -24.96 dBm Carr Freq Error 106.96 Hz Pilot PWR -31.93 dBm Carr Freq Error 0.11 ppm RHO 0.99999 Chip Rate Error -0.18 ppm Composite EVM 0.32 % Trg to Frame -.------ s Pk CDE (SF 64) -65.63 dB Active Channels 9 IQ Imbal/Offset 0.07/0.08 %
CHANNEL RESULTS: Modulation BPSK Symbol Rate 19.2 ksps Timing Offset -.-- ns Channel.SF 0.64 Phase Offset -.-- mrad Channel Power Rel 0.00 dB Channel Power Abs -31.93 dBm Symbol EVM 0.11 % rms Symbol EVM 0.20 % Pk
Figure 40 - Demonstration: pilot power
Code domain power (4.3.3) The power of the individual code channels is measured here. The orthogonality of the individual codes is checked by doing this. Inactive channels must not exceed a specific level relative to the total power (see specification, Section 4.3.3.3).
The spectrum analyzer carries out a measurement of the individual code channels in the code domain.
Test setup
Base StationUnder Test
Tx
Rx (A)
Rx (B)
SpectrumAnalyzer
Code DomainPower
Analyzer
Load
FS-K82
Att.
Figure 41 - Test setup: code domain power

1MA109_0e 51 Rohde & Schwarz
Settings
The base station generates a complete forward channel. The test needs to be carried out for all band classes.
Remote control example
The example in GDE do the following:
• Generates an F-PICH, F-SYNC, F-PCH, an F-FCH, and an additional five F-SCHs for the demonstration with the SMU.
• Second example generates an F-FCH and an additional five F-SCHs with the SMU (transmit diversity) for the second antenna.
• Third example generates an F-PICH, F-SYNC, F-PDCCH, F-PDCH, as well as three subchannels for packet data (1xEV-DV). Plus, an additional F-FCH is set up.
• Measures the power of the individual (active) code channels.
Figure 42 shows the demonstration measurement in the code domain.
A
B
SGLRef -10.0
dBm
Ref -10.0
dBm
Ref -10.0
dBm
1CLRWR
BS,1X,C0 :CHANNEL TAB
CF 1 GHzChan 63.64PCG 0
Ref -10.0
dBm
Ref -10.0
dBm
Ref -10.0
dBm
1CLRWR
RESULT SUMMARY TABLE
CF 1 GHzChan 63.64PCG 0
Att 15 dBAtt 15 dB
Att15 dBAtt15 dB
SR 19.2 ksps
Type Chan.SF Symb Rate RC Status Pwr Abs Pwr Rel T Offs Ph Offs ksps dBm dB ns mrad
PICH 0.64 19.2 --- active -31.92 -6.97 -.-- -.--SYNC 32.64 19.2 --- active -38.22 -13.27 -.-- -.--PCH 1.64 19.2 --- active -32.22 -7.27 -.-- -.--CHAN 10.64 19.2 1+2 active -35.22 -10.27 -.-- -.--CHAN 22.64 19.2 1+2 active -35.22 -10.27 -.-- -.--CHAN 23.64 19.2 1+2 active -35.22 -10.27 -.-- -.--CHAN 24.64 19.2 1+2 active -35.22 -10.27 -.-- -.--CHAN 25.64 19.2 1+2 active -35.22 -10.26 -.-- -.--CHAN 63.64 19.2 1+2 active -35.22 -10.27 -.-- -.------ 2.64 19.2 3-5 inact -92.50 -67.55 -.-- -.------ 3.64 19.2 3-5 inact -92.74 -67.78 -.-- -.------ 4.64 19.2 3-5 inact -95.25 -70.30 -.-- -.--
RESULTS FOR SET 0 PCG 0: GLOBAL RESULTS FOR SET 0: Total PWR -24.95 dBm Carr Freq Error 107.31 Hz Pilot PWR -31.92 dBm Carr Freq Error 0.11 ppm RHO 0.99999 Chip Rate Error 0.04 ppm Composite EVM 0.31 % Trg to Frame -.------ s Pk CDE (SF 64) -66.43 dB Active Channels 9 IQ Imbal/Offset 0.08/0.05 %
CHANNEL RESULTS: Modulation BPSK Symbol Rate 19.2 ksps Timing Offset -.-- ns Channel.SF 63.64 Phase Offset -.-- mrad Channel Power Rel -10.27 dB Channel Power Abs -35.22 dBm Symbol EVM 0.14 % rms Symbol EVM 0.24 % Pk
Figure 42 - Demonstration: code domain power
Limitations on emissions (4.4)
Conducted spurious emissions (4.4.1) The objective here is to prevent unwanted signals from occurring outside the CDMA channel.
The spectrum analyzer measures the power that occurs outside the band. Various limits apply (see specification).

Limitations on emissions (4.4)
1MA109_0e 52 Rohde & Schwarz
Test setup
Base StationUnder Test
Tx
Rx (A)
Rx (B)
SpectrumAnalyzer
Load
Att.
Figure 43 - Test setup: conducted spurious emissions
Settings
The base station generates a complete forward channel. The test needs to be carried out for all band classes. (See Tables 4.4.1.3-1 to 4.4.1.3.-6 in the specification.)
Remote control example
The example in GDE does the following:
• Generates an F-PICH, F-SYNC, F-PCH, an F-FCH, and an additional five F-SCHs for the demonstration with the SMU.
• Measures the power values in the individual frequency ranges; the example covers various BCs.
Figure 44 shows a demonstration in GDE.

Limitations on emissions (4.4)
1MA109_0e 53 Rohde & Schwarz
Figure 44 - Demonstration: conducted spurious emissions

Limitations on emissions (4.4)
1MA109_0e 54 Rohde & Schwarz
Radiated spurious emissions (4.4.2) The specification does not explicitly cover any measurements. Regional requirements are applied.
Inter-base station transmitter intermodulation (4.4.3) The objective here is to prevent unwanted signals from occurring outside the CDMA channel due to interference from another base station.
The SMU simulates a second (interfering) base station. The spectrum analyzer measures the power at specific frequencies.
Test setup
Base StationUnder Test
Tx
Rx (A)
Rx (B)
SpectrumAnalyzer
Load
SMU
Mobile StationSimulator
SMU-K62
Att.
Att.
Figure 45 - Test setup: inter-base station transmitter intermodulation
Settings
The base station generates a complete forward channel. The test needs to be carried out for all band classes. The SMU simulates an external base station with a level 30 dB under the BUT at an offset frequency of 1.25 MHz. The spectrum analyzer performs a measurement on the imaged frequency in each case.
Remote control example
The example in GDE does the following:
• Simulates an F-PICH, F-SYNC, F-PCH, an F-FCH, and an additional five F-SCHs for the demonstration with the second channel of the SMU.
• Generates an F-PICH, F-SYNC, F-PCH, an F-FCH, plus five F-SCHs with the first channel of the SMU.
• Measures the channel power in the imaged frequency range in each case
Figure 46 shows the two spectrum measurements of the demonstration signal.

Limitations on emissions (4.4)
1MA109_0e 55 Rohde & Schwarz
A
Att 5 dB *Ref -10 dBm
SGL*1 RM
VIEW
**
*
RBW 10 kHzVBW 300 kHzSWT 300 ms*
Center 998.75 MHz Span 10 MHz1 MHz/
*2 RMVIEW
-110
-100
-90
-80
-70
-60
-50
-40
-30
-20
-10 CH PWR -22.51 dB REF PWR -24.87 dBm
Figure 46 - Demonstration: inter-base station transmitter intermodulation
Occupied bandwidth (4.4.4) The objective here is to ensure that the transmitted signal has the correct bandwidth.
The spectrum analyzer measures the occupied bandwidth.
Test setup
Base StationUnder Test
Tx
Rx (A)
Rx (B)
SpectrumAnalyzer
Load
Att.
Figure 47 - Test setup: occupied bandwidth

Limitations on emissions (4.4)
1MA109_0e 56 Rohde & Schwarz
Settings
The base station generates a complete forward channel. The test only needs to be carried out for BC3 and BC6.
Remote control example
The example in GDE does the following:
• Generates an F-PICH, F-SYNC, F-PCH, an F-FCH, and an additional five F-SCHs for the demonstration with the SMU.
• Measures the bandwidth of the signal
Figure 48 shows the demonstration measurement.
A
BS,1X,C0 :OCC BANDWDT
Center 1 GHz Span 4.2 MHz420 kHz/
Ref -10 dBm Att 5 dB *
RBW 30 kHzVBW 300 kHzSWT 100 ms
***
1 RMCLRWR
SGL
-110
-100
-90
-80
-70
-60
-50
-40
-30
-20
-10
1
Marker 1 [T1 ] -107.47 dBm
998.113669120 MHzOBW 1.272115385 MHz
T1
Temp 1 [T1 OBW] -52.32 dBm
999.360576923 MHz
T2
Temp 2 [T1 OBW] -51.49 dBm
1.000632692 GHz
Figure 48 - Demonstration: occupied bandwidth

Rohde & Schwarz solutions for CDMA2000 base station tests
1MA109_0e 57 Rohde & Schwarz
5 Appendix
Rohde & Schwarz solutions for CDMA2000 base station tests
Signal generators The SMJ vector signal generators are particularly suitable for generating CDMA2000 signals. As an SMJ is equipped with high-performance modulators, the baseband signal input to an SMJ is modulated with minimum distortion into the RF band.
The SMJ can also be used for channel simulation as a result of the wide range of options such as a fading simulator and an additive white Gaussian noise (AWGN) generator. Channel simulation is required, for example, for receiver sensitivity measurements and is often needed for customer-specific measurements.
The AMU Baseband signal generator and Fading simulator provides realtime IQ generation according to different digital standards, a flexible ARB generator and a channel simulator in one instrument (one or two pathes).

Rohde & Schwarz solutions for CDMA2000 base station tests
1MA109_0e 58 Rohde & Schwarz
The AFQ I/Q modulation generator is a flexible baseband source. With its high-end technical specifications (variable clock rate up to 300 MHz, Maximum IQ Bandwitdh of up to 100 MHz, 256 Msample or 1Gsample memory depth), the AFQ provides enhanced performance for the receiver test, baseband test, and out-of-standard applications.
Signal analyzers Three different instruments are available for signal analysis:
• For high-performance CDMA2000 code domain analysis, either the FSQ signal analyzer or the FSU spectrum analyzer is an ideal choice. Each offers excellent dynamic range and comprehensive modulation-analysis capability including code domain power (CDP) using the FS-K82 option and CCDF measurement capability.
• When the highest level of performance is not required, the FSP spectrum analyzer is an ideal choice. Its many features including fast ACP measurement and CCDF measurement enable the FSP to cover a wide range of RF measurements. With the FS-K82 option, the FSP also provides code domain power analysis and has nearly the same software capabilities as an FSU or FSQ (number of slots and EVM performance is slightly different).

Rohde & Schwarz solutions for CDMA2000 base station tests
1MA109_0e 59 Rohde & Schwarz
• The FSIQ signal analyzer can complete all the spectrum measurements plus modulation analysis and code domain power (CDP) measurement for IS95 signals, which are a subset of CDMA2000. cdmaOne measurements with the FSIQ are not discussed in this Application Note. Please refer to 1MA34 ([1]) for a detailed description of CDMA2000 measurements with the FSIQ.
Other instruments • To set up the exact power at the BS RX port, the NRP power meter in
combination with the NRP-Z11 power sensor is ideal for this purpose.
• For measurements on the CDMA2000 mobile stations (MS), you can use the CMU200 universal radiocommunication tester in combination with CMU-B83 (CDMA2000 signaling unit) and CMU-K83 .. 87 (software options for different CDMA2000 band classes).

Remote sequences
1MA109_0e 60 Rohde & Schwarz
Remote sequences The most important remote settings are briefly explained here in order to make any possible modifications easier. In the examples for GDE, comments are provided for the fully executable sequences.
TX part (FSx) General settings: SENS:FREQ:CENT <frequency> Hz // frequency DISP:WIND:TRAC:Y:RLEV <level> dBm // level SENS:ROSC:SOUR <source> // external or internal reference INST:SEL BC2K // select CDMA2000 BS measurement INIT:CONT OFF // continuous sweep off
Measurements: CALC:FEED 'XTIM:CDP:ERR:SUMM' // select measurement screen or: CALC:FEED 'XTIM:CDP:ERR:CTAB' // screen: select channel table INIT:IMM // start an individual sweep Fetch results:
Summary screen
CALC:MARK:FUNC:CDP:RES? xxx // xxx is desired measurement result CTAB screen
SENS:CDP:CODE 10 // select Walsh code CALC:MARK:FUNC:CDP:RES? xxx // fetch xxx measurement result for code 10
RX part (SMU) General settings: SOUR:FREQ <frequency> Hz // frequency SOUR:POW:LEV <level> dBm // level SOUR:BB:C2K:LINK REV // reverse link SOUR:BB:C2K:MST1:PRES // mobile station 1: preset SOUR:BB:C2K:MST1:MODE xxx // select type (traffic, dedicated control, access, enhanced access) SOUR:BB:C2K:MST1:CHAN<x>:STAT ON // activate channel no. x SOUR:BB:C2K:MST1:STAT ON // activate mobile station 1 SOUR:BB:C2K:STAT ON // activate CDMA2000 OUTP ON // activate RF
AWGN:

Remote sequences
1MA109_0e 61 Rohde & Schwarz
SOUR:AWGN:BWID 1.23MHZ // system bandwidth (CDMA2000 1.23 MHz) SOUR:AWGN:POW:MODE EN // Eb/N0 mode SOUR:AWGN:BRAT 9.6kbps // bit rate (here 9.6 kbit/s) SOUR:AWGN:ENR 5.7DB // Eb/N0 values (here 5.7 dB) SOUR:AWGN:STAT ON // AWGN on
Access probe: SOUR:BB:C2K:MST1:MODE ACC // access mode SOUR:BB:C2K:MST1:CHAN1:STAT ON // channel 1:R-ACH on
Enhanced access probe: SOUR:BB:C2K:MST1:MODE EACC // enhanced access mode SOUR:BB:C2K:MST1:CHAN2:STAT ON // channel 2: R-EACH on SOUR:BB:C2K:MST1:CHAN2:DATA:RATE DR9K6 // R-EACH data rate 9.6 kbps SOUR:BB:C2K:MST1:CHAN2:FLEN 20ms // R-EACH frame length 20 ms
Common control: SOUR:BB:C2K:MST1:MODE CCON // common control mode SOUR:BB:C2K:MST1:CHAN2:STAT ON // channel 2: R-CCCH on SOUR:BB:C2K:MST1:CHAN2:DATA:RATE DR9K6 // R-CCCH data rate 9.6 kbps SOUR:BB:C2K:MST1:CHAN2:FLEN 20ms // R-CCCH frame length 20 ms
Traffic RC1: SOUR:BB:C2K:MST1:MODE TRAF // traffic channel mode SOUR:BB:C2K:MST1:RCON 1 // RC1 SOUR:BB:C2K:MST1:CHAN1:STAT ON // R-FCH on SOUR:BB:C2K:MST1:CHAN1:DATA:RATE DR1K2 // R-FCH rate 1.2 kbps SOUR:BB:C2K:MST1:CHAN2:STAT OFF // R-SCCH0 off SOUR:BB:C2K:MST1:CHAN2:DATA:RATE DR1K2 // R-SCCH0 rate 1.2 kbps SOUR:BB:C2K:MST1:CHAN3:STAT OFF // R-SCCH1 off SOUR:BB:C2K:MST1:CHAN3:DATA:RATE DR1K2 // R-SCCH1 rate 1.2 kbps SOUR:BB:C2K:MST1:CHAN4:STAT OFF // R-SCCH2 off SOUR:BB:C2K:MST1:CHAN4:DATA:RATE DR1K2 // R-SCCH2 rate 1.2 kbps SOUR:BB:C2K:MST1:CHAN5:STAT OFF // R-SCCH3 off SOUR:BB:C2K:MST1:CHAN5:DATA:RATE DR1K2 // R-SCCH3 rate 1.2 kbps SOUR:BB:C2K:MST1:CHAN6:STAT OFF // R-SCCH4 off SOUR:BB:C2K:MST1:CHAN6:DATA:RATE DR1K2 // R-SCCH4 rate 1.2 kbps SOUR:BB:C2K:MST1:CHAN7:STAT OFF // R-SCCH5 off SOUR:BB:C2K:MST1:CHAN7:DATA:RATE DR1K2 // R-SCCH5 rate 1.2 kbps SOUR:BB:C2K:MST1:CHAN8:STAT OFF // R-SCCH6 off SOUR:BB:C2K:MST1:CHAN8:DATA:RATE DR1K2 // R-SCCH6 rate 1.2 kbps
Traffic RC3: SOUR:BB:C2K:MST1:MODE TRAF // traffic channel mode

1MA109_0e 62 Rohde & Schwarz
SOUR:BB:C2K:MST1:RCON 3 // RC3 SOUR:BB:C2K:MST1:CHAN1:STAT OFF // R-PICH off SOUR:BB:C2K:MST1:CHAN2:STAT OFF // R-DCCH off SOUR:BB:C2K:MST1:CHAN2:FLEN 20ms // R-DCCH frame length 20 ms SOUR:BB:C2K:MST1:CHAN3:STAT ON // R-FCH on SOUR:BB:C2K:MST1:CHAN3:DATA:RATE DR1K5 //R-FCH data rate 1.5 kbps SOUR:BB:C2K:MST1:CHAN3:FLEN 20ms // R-FCH frame length 20 ms SOUR:BB:C2K:MST1:CHAN4:STAT OFF // R-SCH1 off SOUR:BB:C2K:MST1:CHAN4:DATA:RATE DR1K5 // R-SCH1 data rate 1.5 kbps SOUR:BB:C2K:MST1:CHAN4:FLEN 20ms // R-FCH frame length 20 ms SOUR:BB:C2K:MST1:CHAN5:STAT OFF // R-SCH2 off SOUR:BB:C2K:MST1:CHAN5:DATA:RATE DR1K5 // R-SCH2 data rate 1.5 kbps SOUR:BB:C2K:MST1:CHAN5:FLEN 20ms // R-FCH frame length 20 ms
Fading: SOUR:FSIM:PRES // fading preset SOUR:FSIM ON // fading on SOUR:FSIM:STAN CDMA3 // fading profile selection (CDMA 3)

Abbreviations
1MA109_0e 63 Rohde & Schwarz
Abbreviations Abbrev. Meaning
ACH access channel ACP adjacent channel power ACPR adjacent channel power ratio AWGN additive white Gaussian noise BC band class (set of uplink and downlink frequencies) BER bit error rate BS base station CCH common control channel CDMA code division multiple access CDP code domain power CW continuous wave (unmodulated signal) DS direct sequence (mode for accessing the air interface) F-… forward … FCH fundamental channel FER frame error rate FL forward link (from BS to MS) LSO loopback service option MAC medium access control MC multicarrier (mode for accessing the air interface) MS mobile station MSO Markov service option PCH paging channel PEP peak average power PICH pilot channel PRBS pseudo random noise sequence R-… reverse … RBW resolution bandwidth RC radio configuration RL reverse link (from MS to BS) RSQI received signal quality indicator RX receive SCCH supplemental code channel SCH supplemental channel SO service option SR spreading rate SYNC sync channel TD transmit diversity TDPICH transmit diversity pilot channel TDSO test data service option TX transmit

List of Figures
1MA109_0e 64 Rohde & Schwarz
List of Figures Figure 1 - Complete test setup..................................................................... 6 Figure 2 - GDE overview .............................................................................. 8 Figure 3 - Test setup for access probe acquisition .................................... 13 Figure 4 - Demonstration: spectrum access probe acquisition .................. 14 Figure 5 - Test setup: R-CCCH demodulation, AWGN.............................. 15 Figure 6 - Demonstration: spectrum, R-CCCH demodulation.................... 16 Figure 7 - Test setup: R-CCCH demodulation, fading ............................... 16 Figure 8 - Test setup: R-TCH, AWGN ....................................................... 18 Figure 9 - Test setup: R-TCH, fading, without closed loop ........................ 19 Figure 10 - Test setup: R-TCH, fading, with closed loop ........................... 20 Figure 11 - Test setup: receiver sensitivity................................................. 21 Figure 12 - Demonstration: spectrum, receiver sensitivity ......................... 22 Figure 13 - Test setup: receiver dynamic range......................................... 23 Figure 14 - Demonstration: spectrum, receiver dynamic range ................ 24 Figure 15 - Test setup: single tone desensitization .................................... 25 Figure 16 - Demonstration: single tone desensitization ............................. 26 Figure 17 - Test setup: intermodulation spurious response attenuation .... 27 Figure 18 - Demonstration: intermodulation spurious response attenuation
............................................................................................................ 28 Figure 19 - Test setup: adjacent channel selectivity ................................. 29 Figure 20 - Demonstration: spectrum, adjacent channel selectivity........... 30 Figure 21 - Test setup: receiver blocking ................................................... 31 Figure 22 - Test setup: conducted spurious emissions.............................. 32 Figure 23 - Demo: conducted spurious emissions ..................................... 32 Figure 24 - Test setup: receiver signal quality indicator (RSQI)................. 33 Figure 25 - Test setup: frequency tolerance............................................... 38 Figure 26 - Demonstration: frequency tolerance........................................ 39 Figure 27 – Test setup: pilot timing tolerance ............................................ 40 Figure 28 - Demonstration: pilot timing tolerance....................................... 41 Figure 29 - Test setup: pilot channel to code channel time tolerance........ 41 Figure 30 - Demonstration: pilot channel to code channel time tolerance . 42 Figure 31 - Test setup: pilot channel to code channel phase tolerance..... 43 Figure 32 - Demonstration: pilot channel to code channel phase tolerance
............................................................................................................ 44 Figure 33 - Test setup: waveform quality ................................................... 44 Figure 34 - Demonstration: waveform quality............................................. 45 Figure 35 - Test setup: forward power control subchannel ........................ 46 Figure 36 - Demonstration: forward power control subchannel ................. 47
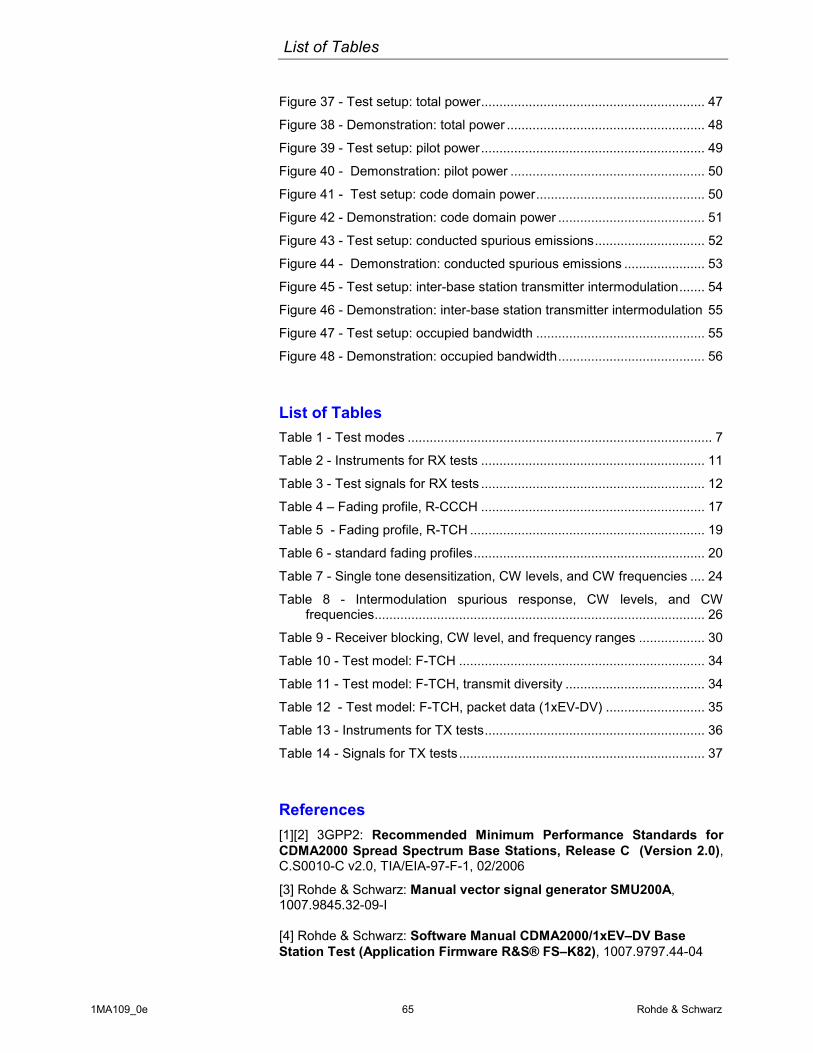
List of Tables
1MA109_0e 65 Rohde & Schwarz
Figure 37 - Test setup: total power............................................................. 47 Figure 38 - Demonstration: total power ...................................................... 48 Figure 39 - Test setup: pilot power............................................................. 49 Figure 40 - Demonstration: pilot power ..................................................... 50 Figure 41 - Test setup: code domain power.............................................. 50 Figure 42 - Demonstration: code domain power ........................................ 51 Figure 43 - Test setup: conducted spurious emissions.............................. 52 Figure 44 - Demonstration: conducted spurious emissions ...................... 53 Figure 45 - Test setup: inter-base station transmitter intermodulation....... 54 Figure 46 - Demonstration: inter-base station transmitter intermodulation 55 Figure 47 - Test setup: occupied bandwidth .............................................. 55 Figure 48 - Demonstration: occupied bandwidth........................................ 56
List of Tables Table 1 - Test modes ................................................................................... 7 Table 2 - Instruments for RX tests ............................................................. 11 Table 3 - Test signals for RX tests ............................................................. 12 Table 4 – Fading profile, R-CCCH ............................................................. 17 Table 5 - Fading profile, R-TCH ................................................................ 19 Table 6 - standard fading profiles............................................................... 20 Table 7 - Single tone desensitization, CW levels, and CW frequencies .... 24 Table 8 - Intermodulation spurious response, CW levels, and CW
frequencies.......................................................................................... 26 Table 9 - Receiver blocking, CW level, and frequency ranges .................. 30 Table 10 - Test model: F-TCH ................................................................... 34 Table 11 - Test model: F-TCH, transmit diversity ...................................... 34 Table 12 - Test model: F-TCH, packet data (1xEV-DV) ........................... 35 Table 13 - Instruments for TX tests............................................................ 36 Table 14 - Signals for TX tests................................................................... 37
References [1][2] 3GPP2: Recommended Minimum Performance Standards for CDMA2000 Spread Spectrum Base Stations, Release C (Version 2.0),C.S0010-C v2.0, TIA/EIA-97-F-1, 02/2006
[3] Rohde & Schwarz: Manual vector signal generator SMU200A,1007.9845.32-09-I [4] Rohde & Schwarz: Software Manual CDMA2000/1xEV–DV Base Station Test (Application Firmware R&S® FS–K82), 1007.9797.44-04

Additional information
1MA109_0e 66 Rohde & Schwarz
Additional information Please send comments and suggestions regarding this Application Note to [email protected]
6 Ordering Information
SMU200A Vector Signal Generator R&S® SMU200A 1141.2005.02 R&S® SMU-B102 RF Path A: 100 kHz to 2.2 GHz 1141.8503.02 R&S® SMU-B103 RF Path A: 100 kHz to 3 GHz 1141.8603.02 R&S® SMU-B104 RF Path A: 100 kHz to 4 GHz 1141.8703.02 R&S® SMU-B106 RF Path A: 100 kHz to 6 GHz 1141.8803.02 R&S® SMU-B202 RF Path B: 100 kHz to 2.2 GHz 1141.9400.02 R&S® SMU-B203 RF Path B: 100 kHz to 3 GHz 1141.9500.02 R&S® SMU-B10 Baseband with ARB (64 Msamples) 1141.7007.02 R&S® SMU-B13 Baseband Main Module 1141.8003.02 R&S® SMU-B14 Fading Simulator 1160.1800.02 R&S® SMU-K46 Software: CDMA2000 BS 1160.9876.02 Signal analyzer, spectrum analyzer, and options R&S® FSP3 9 kHz to 3 GHz 1093.4495.03 R&S® FSP7 9 kHz to 7 GHz 1093.4495.07 R&S® FSP13 9 kHz to 13 GHz 1093.4495.13 R&S® FSP30 9 kHz to 30 GHz 1093.4495.30 R&S® FSP40 9 kHz to 40 GHz 1093.4495.40 R&S®FS-K82 Software: CDMA2000 BS 1157.2316.02 R&S® FSU3 20 Hz to 3.6 GHz 1129.9003.03 R&S® FSU8 20 Hz to 8 GHz 1129.9003.08 R&S® FSU26 20 Hz to 26.5 GHz 1129.9003.26 R&S®FS-K82 Software: CDMA2000 BS 1157.2316.02 R&S® FSQ3 20 Hz to 3.6 GHz 1155.5001.03 R&S® FSQ8 20 Hz to 8 GHz 1155.5001.08 R&S® FSQ26 20 Hz to 26.5 GHz 1155.5001.26 R&S®FS-K82 Software: CDMA2000 BS 1157.2316.02
ROHDE & SCHWARZ GmbH & Co. KG . Mühldorfstraße 15 . D-81671 München . Postfach 80 14 69 . D-81614 München .
Tel (089) 4129 -0 . Fax (089) 4129 - 13777 . Internet: http://www.rohde-schwarz.com
This Application Note and the supplied programs may only be used subject to the conditions of use set forth in the download area of the Rohde & Schwarz website.