bas3 psychologist report - gl assessment · bas3 psychologist report id number ... who put him at...
TRANSCRIPT

BAS3 Psychologist Report ID number: 0009 Child's name:
Date of birth: 15/11/97 Date tested: 29/11/11 Last date tested:
Age at assessment: 14:00 Address:
School / class:
Special needs: Autism / Aspergers / ASD Home / first language: English Ethnicity: White British
Background to assessment Michael is a Year 9 student at Sunnyside Academy where he has been on roll since May 2011. He has a diagnosis of Asperger's Syndrome. Sunnyside raised Michael as a concern with the Psychology Service in October 2011 due to increasingly 'autistic' behaviour (including high levels of hand flapping) and a lack of academic progress at school. Sunnyside felt that he was not accessing the curriculum and wondered whether this was because of underlying cognitive difficulties or because of other factors. Michael's time at school is currently split between mainstream lessons and seven hours of one‐to‐one teaching from a teaching assistant in the library. In Year 4 at primary school Michael had involvement from Speech and Language Therapy and the Autistic Spectrum Condition (ASC) Advisory Teacher. Neither are currently involved although school have recently made a referral to Verity Suchly (ASC Advisory Teacher). On 28 November 2011 I observed Michael for approximately an hour in the library during a one‐to‐one science and maths lesson and observed him in a mainstream Design lesson for half an hour. On 29 November I returned to do a cognitive assessment with Michael and to find out his views about certain aspects of school.
Behavioural observations Michael presented as keen, compliant and polite throughout the observation and individual work ‐ I very much enjoyed working with him. When observing Michael I noticed that in class he tends to wait for reassurance before starting work or completing the next example. Interestingly, within the structured setting of the cognitive assessment this was not an issue. During lessons that I observed and during the assessment that I did with him, Michael's levels of arousal (i.e. how anxious/excited he is) appeared to be indicated by how often he flaps his hands and pushes his fist into his open palm. I noticed that this happened more when Michael was faced with difficult items in the assessment. During timed subtests Michael appeared to have no urgency to complete the tasks as quickly as possible. This may have affected his scores in Recall of Objects and Speed of Information Processing.
Testing undertaken Core Scales • Recognition of Designs • Word Definitions • Pattern Construction • Matrices • Verbal Similarities • Quantitative Reasoning
© 2012 GL Assessment Limited Created on 22/03/2012 for A. Psychologist of Independent Assessment Services 1

Diagnostic Scales • Recall of Objects: Immediate Verbal • Recall of Objects: Immediate Spatial • Recall of Objects: Delayed Verbal • Recall of Objects: Delayed Spatial • Recall of Digits Forward • Speed of Information Processing • Recognition of Pictures • Recall of Digits Backward Achievement Scales • Number Skills • Spelling • Word Reading A
Views of child Michael said that he enjoyed doing the assessment as we were working in a quiet calm room with "no other pupils making silly noises and no teachers shouting". He said that he likes being in the library at school as the staff keep out "all the noisy kids" and his support assistant "has time to teach me properly". When I asked Michael what he meant by "teach me properly" he said, "they explain properly so that I know what I've got to do".
Views of parents Michael's mother said that the results of the cognitive assessment agreed with her views on her son's understanding; she reported that she has been trying to tell school that he is not lazy and that he needs more time learning through discussions and learning with teachers who put him at ease rather than writing all the time.
Views of psychologist: Next steps Michael has an unusual pattern of attainments for a child on the autistic spectrum as his non‐verbal ability is a relative area of weakness. Although he scored well within the average range for verbal ability it is important to note that there are aspects of language with which he has got difficulties. For instance, Michael tends to understand and use language in a literal manner. Those working with Michael will need to be aware of this. Michael's performance in the cognitive assessment suggests that his poor performance at school is influenced by factors other than cognitive ability. Bringing together evidence from observation, test results and discussion suggests that Michael's curriculum access is currently limited by the following factors: difficulty with consistently maintaining focus on adult‐directed/adult‐chosen tasks; inconsistent motivation for adult‐directed/adult‐chosen tasks; anxiety (which appears currently to be strongly linked to a fear that teachers will shout); difficulties with non‐verbal reasoning skills; difficulty understanding the pragmatics of language; learned helplessness. A meeting with Verity Suchly, Michael's mother and myself has been arranged for 15 December, 2011 to discuss strategies to be used to support Michael's learning and inclusion at Sunnyside.
Any other comments
Assessment completed by: A. Psychologist, Independent Assessment Services
© 2012 GL Assessment Limited Created on 22/03/2012 for A. Psychologist of Independent Assessment Services 2
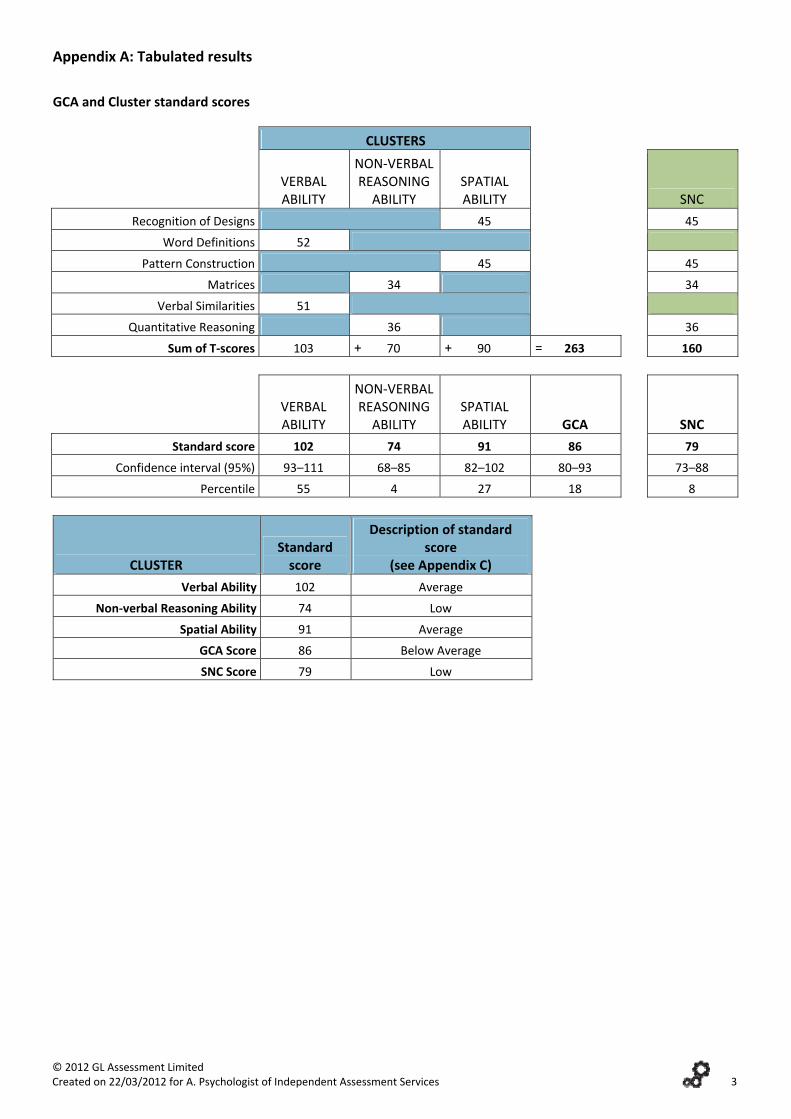
Appendix A: Tabulated results
GCA and Cluster standard scores
CLUSTERS
VERBAL ABILITY
NON‐VERBAL REASONING ABILITY
SPATIAL ABILITY
SNC
Recognition of Designs 45 45
Word Definitions 52
Pattern Construction 45 45
Matrices 34 34
Verbal Similarities 51
Quantitative Reasoning 36 36
Sum of T‐scores 103 + 70 + 90 = 263 160
VERBAL ABILITY
NON‐VERBAL REASONING ABILITY
SPATIAL ABILITY GCA
SNC
Standard score 102 74 91 86 79
Confidence interval (95%) 93–111 68–85 82–102 80–93 73–88
Percentile 55 4 27 18 8
CLUSTER Standard score
Description of standard score
(see Appendix C)
Verbal Ability 102 Average
Non‐verbal Reasoning Ability 74 Low
Spatial Ability 91 Average
GCA Score 86 Below Average
SNC Score 79 Low
© 2012 GL Assessment Limited Created on 22/03/2012 for A. Psychologist of Independent Assessment Services 3

Comparisons of GCA and Cluster Scores and observed with predicted Achievement Scale scores
Significance? COMPARISONS WITH THE GCA
Observed difference p=0.05 Y/N
Frequency (%)
Verbal ‐16 8 Y 10<>5
Non‐verbal Reasoning 12 8 Y 15
Spatial ‐5 9 N >25
Significance? BETWEEN CLUSTER COMPARISONS
Observed difference p=0.05 Y/N
Frequency (%)
Verbal vs Non‐verbal Reasoning 28 13 Y 5<>2
Verbal vs Spatial 11 14 N >25
Non‐verbal Reasoning vs Spatial ‐17 14 Y 25<>15
Significance? WITHIN CLUSTER COMPARISONS
Observed difference p=0.05 Y/N
Frequency (%)
Word Definitions vs Verbal Similarities 1 11 N >25
Matrices vs Quantitative Reasoning ‐2 11 N >25
Recognition of Designs vs Pattern Construction 0 11 N >25
Significance? OBSERVED vs PREDICTED ACHIEVEMENT COMPARISONS FOR BAS3
Observed score
Predicted score
Difference (O‐P) p=0.05 Y/N
Frequency (%)
Number Skills 77 91 14 7 Y 10<>5
Spelling 89 93 4 7 N >25
Word Reading A 93 92 ‐1 6 N >25
© 2012 GL Assessment Limited Created on 22/03/2012 for A. Psychologist of Independent Assessment Services 4

Summary of ability scores, T‐scores, percentiles and age equivalents
Significance?
Core Scales Ability score Ability score T‐score Percentile
Difference from mean core T‐score p=0.05 Y/N
Frequency (%)
Age equivalent
Recognition of Designs 106 45 31 1 9 N >25 11:09
Word Definitions 151 52 58 8 7 Y 25 15:03
Pattern Construction 197 45 31 1 6 N >25 12:09
Matrices 124 34 5 ‐10 7 Y >25 8:09
Verbal Similarities 132 51 54 7 8 N >25 14:03
Quantitative Reasoning 150 36 8 ‐8 7 Y >25 10:03
Mean T‐score = 44
Significance?
Diagnostic Scales Ability score Ability score T‐score Percentile
Difference from mean core T‐score p=0.05 Y/N
Frequency (%)
Age equivalent
Recall of Objects: Immediate Verbal
98 28 1 ‐16 14 Y >25 7:10
Recall of Objects: Immediate Spatial
8 27 1
Recall of Objects: Delayed Verbal
8 29 2
Recall of Objects: Delayed Spatial
6 27 1
Recall of Digits Forward 116 31 3 ‐13 12 Y >25 5:10
Speed of Information Processing
118 32 4 ‐12 9 Y >25 9:09
Recognition of Pictures 106 37 10 ‐7 15 N >25 7:10
Recall of Digits Backward 85 30 2 ‐14 10 Y >25 7:04 Note: The Diagnostic Scale figures are based on the BAS II norms.
Significance?
Achievement Scales Ability score
Standard score Percentile
Difference from GCA score p=0.05 Y/N
Age equivalent
Number Skills 144 77 6 ‐9 9 Y 9:03
Spelling 202 89 23 3 9 N 12:03
Word Reading A 223 93 32 7 9 N 12:09
© 2012 GL Assessment Limited Created on 22/03/2012 for A. Psychologist of Independent Assessment Services 5

Profile of results
Green = GCA and Cluster Scores; Blue = School Age Core Scales; Purple = Diagnostic Scales; Grey = Achievement Scales. The circle (standard score) or diamond (T‐score) is the child's actual score and the whiskers on either side show the 95% confidence interval. Scores falling within the shaded band are considered to be 'Average' (see Appendix C).
© 2012 GL Assessment Limited Created on 22/03/2012 for A. Psychologist of Independent Assessment Services 6

Table 1: Score descriptors for T‐scores and Achievement Scale standard scores
Scales T‐score Description of T‐score
(see Appendix C)
Recognition of Designs 45 Average
Word Definitions 52 Average
Pattern Construction 45 Average
Matrices 34 Low
Verbal Similarities 51 Average
Quantitative Reasoning 36 Low
Recall of Objects: Immediate Verbal 28 Very Low
Recall of Objects: Immediate Spatial 27 Very Low
Recall of Objects: Delayed Verbal 29 Very Low
Recall of Objects: Delayed Spatial 27 Very Low
Recall of Digits Forward 31 Low
Speed of Information Processing 32 Low
Recognition of Pictures 37 Below Average
Recall of Digits Backward 30 Very Low
Scales Standard score Description
Number Skills 77 Low
Spelling 89 Below Average
Word Reading A 93 Average
© 2012 GL Assessment Limited Created on 22/03/2012 for A. Psychologist of Independent Assessment Services 7
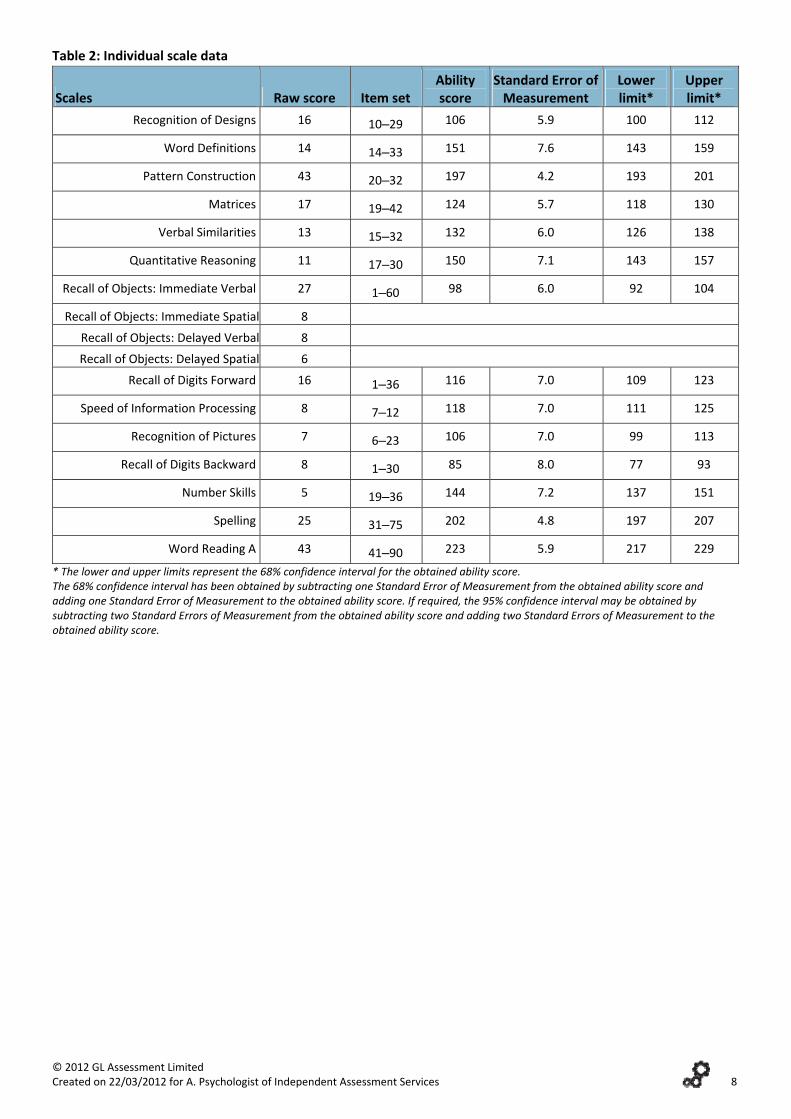
Table 2: Individual scale data
Scales Raw score Item set Ability score
Standard Error of Measurement
Lower limit*
Upper limit*
Recognition of Designs 16 10‒29 106 5.9 100 112
Word Definitions 14 14‒33 151 7.6 143 159
Pattern Construction 43 20‒32 197 4.2 193 201
Matrices 17 19‒42 124 5.7 118 130
Verbal Similarities 13 15‒32 132 6.0 126 138
Quantitative Reasoning 11 17‒30 150 7.1 143 157
Recall of Objects: Immediate Verbal 27 1‒60 98 6.0 92 104
Recall of Objects: Immediate Spatial 8
Recall of Objects: Delayed Verbal 8
Recall of Objects: Delayed Spatial 6
Recall of Digits Forward 16 1‒36 116 7.0 109 123
Speed of Information Processing 8 7‒12 118 7.0 111 125
Recognition of Pictures 7 6‒23 106 7.0 99 113
Recall of Digits Backward 8 1‒30 85 8.0 77 93
Number Skills 5 19‒36 144 7.2 137 151
Spelling 25 31‒75 202 4.8 197 207
Word Reading A 43 41‒90 223 5.9 217 229
* The lower and upper limits represent the 68% confidence interval for the obtained ability score. The 68% confidence interval has been obtained by subtracting one Standard Error of Measurement from the obtained ability score and adding one Standard Error of Measurement to the obtained ability score. If required, the 95% confidence interval may be obtained by subtracting two Standard Errors of Measurement from the obtained ability score and adding two Standard Errors of Measurement to the obtained ability score.
© 2012 GL Assessment Limited Created on 22/03/2012 for A. Psychologist of Independent Assessment Services 8

Table 3: Confidence intervals for individual scale data
Scales T‐score (95% CI)
Percentile rank (95% CI)
Recognition of Designs 33‐45‐57 4‐31‐76
Word Definitions 37‐52‐67 10‐58‐96
Pattern Construction 37‐45‐53 10‐31‐62
Matrices 23‐34‐45 1‐5‐31
Verbal Similarities 39‐51‐63 14‐54‐90
Quantitative Reasoning 22‐36‐50 1‐8‐50
Recall of Objects: Immediate Verbal 20‐28‐40 1‐1‐16
Recall of Objects: Immediate Spatial ‐‐ ‐‐
Recall of Objects: Delayed Verbal ‐‐ ‐‐
Recall of Objects: Delayed Spatial ‐‐ ‐‐
Recall of Digits Forward 20‐31‐45 1‐3‐31
Speed of Information Processing 20‐32‐46 1‐4‐34
Recognition of Pictures 23‐37‐51 1‐10‐54
Recall of Digits Backward 20‐30‐46 1‐2‐34
Scales Standard score
(95% CI) Percentile rank
(95% CI)
Number Skills 72‐77‐85 3‐6‐16
Spelling 84‐89‐95 14‐23‐37
Word Reading A 88‐93‐98 21‐32‐45 See BAS3 Technical Manual for an explanation of how the confidence intervals (CI) have been obtained. The red figure in the middle is the obtained score and the other figures represent the lower and upper limits of the confidence interval within which the true score is likely to lie.
© 2012 GL Assessment Limited Created on 22/03/2012 for A. Psychologist of Independent Assessment Services 9

Appendix B: Description of BAS3 and of what each BAS3 scale is designed to assess
Introduction The BAS3 scales are designed to estimate the current level of aspects of developed intellectual or cognitive functioning. The test data is intended to supplement rather than replace other sources of information about a child or young person's level of cognitive functioning. (Cognitive functioning refers to the ability to process verbal and non‐verbal information and to the use of reasoning skills and concepts to solve problems and puzzles.) Therefore, the data should always be interpreted alongside other information obtained from observation and behavioural assessment, together with information about the child's background and current life situation. In this way, the test results reported may be used to aid the generation of hypotheses, or to provide evidence which helps to confirm hypotheses, about the child's cognitive strengths and weaknesses. BAS3 has Cognitive Scales and three Achievement Scales. The Cognitive Scales are organised into Core and Diagnostic Scales. The Core Scales contribute to the General Conceptual Ability (GCA) Score and are also used to obtain the Cluster Scores (see below). The Diagnostic Scales provide additional information on a range of other specific abilities.
Cluster Scores There are four overall Cluster or summary scores in BAS3. These are obtained from the Core Scales. The General Conceptual Ability Score (GCA) is the score that summarises the individual's overall ability to carry out the complex transformations on information needed for reasoning and when applying concepts. It indicates the individual's capacity to adapt his or her intellect to any task and has previously been termed 'General IQ'. Within this overall general ability, it is possible to evaluate relative strengths in three more specific areas. These three factor‐based Clusters are termed Verbal Ability, Non‐verbal Reasoning Ability and Spatial Ability.
BAS3 Core Scales
Matrices This scale contributes to the GCA Score and the Non‐verbal Reasoning Ability Cluster Score. The score indicates the individual's level of non‐verbal inductive reasoning ability. The items in the scale require the ability to identify rules governing variables in abstract figures and to formulate and test these rules. Solution of the items also requires the use of verbal mediation strategies and visual‐spatial analysis, including perception of shape, relative size and orientation.
Pattern Construction This scale contributes to the GCA Score and the Spatial Ability Cluster Score. The score indicates the individual's level of visual‐spatial ability. The scale items require the ability to perceive and analyse visual information: decomposing designs into their component parts, perceiving and preserving the relative position, size and angles of the designs and using systematic spatial problem‐solving strategies such as sequential assembly, trial and error or hypothesis testing. Eye‐hand coordination is also required to solve the items.
Quantitative Reasoning This scale contributes to the GCA Score and the Non‐verbal Reasoning Ability Cluster Score. The score indicates the individual's ability to identify rules governing numerical relationships. Knowledge of numerals, basic number facts and simple arithmetic operations is required, as is retrieval of information from long‐term memory and the ability to use verbal mediation strategies.
Recognition of Designs This scale contributes to the GCA Score and the Spatial Ability Cluster Score. The score indicates the level of the individual's ability for visual‐spatial encoding and retention. Items require analysis of shape, relative size and orientation, retention of that information in visual‐spatial memory and then comparison of the recalled information with an array of options to identify the match.
© 2012 GL Assessment Limited Created on 22/03/2012 for A. Psychologist of Independent Assessment Services 10

Verbal Similarities This scale contributes to the GCA Score and the Verbal Ability Cluster Score. The items in this scale require general knowledge, vocabulary knowledge, abstract and logical thinking, the ability to distinguish between essential and superficial features, retrieval of information from long‐term memory and expressive language skills. The score indicates the individual's level of verbal reasoning ability, including the ability to identify, formulate and test super‐ordinate categories
Word Definitions This scale contributes to the GCA Score and the Verbal Ability Cluster Score and measures acquired verbal knowledge. Solution of the items requires not only vocabulary knowledge but also general knowledge, verbal conceptualisation, abstract thinking, retrieval of information from long‐term memory and expressive language skills.
BAS3 Diagnostic Scales
Recall of Digits Backward This scale taps into verbal working memory and, possibly, visualisation. It requires the oral recall of sequences of numbers in the reverse order from which they were heard.
Recall of Digits Forward This scale is primarily a measure of short‐term auditory memory span but is also influenced by auditory attention. It requires the oral recall of sequences of numbers.
Recall of Objects This scale measures short‐term and intermediate/delayed memory for visual information (pictures) using both verbal and spatial recall. Performance is influenced by the ability to use strategies for the storage and retrieval of information and by the ability to attend and concentrate.
Recognition of Pictures This scale measures short‐term visual memory. The items require efficient visual scanning, attention to visual details including shape, size and orientation and, at the lower end of the scale, the use of verbal tagging as evidenced by the spontaneous use of verbal labels when recognising the target objects.
Speed of Information Processing This scale measures speed in performing simple mental operations. It requires the ability to work fast under pressure, the ability to use sequential strategies for making comparisons, and recognition of single‐digit and multi‐digit numbers and their place values (for Booklets B and C).
BAS3 Achievement Scales
Number Skills This scale requires the ability to recognise and vocalise the names of numerals, understanding of the four arithmetical operations (addition, subtraction, multiplication and division) and ability to perform numerical calculations using whole numbers, decimals, fractions and percentages. Earlier items present the numerical tasks in a verbal context, presented orally with visual illustrations, whereas later items assess understanding of formal mathematical layout and notation.
Spelling This scale assesses knowledge and recall of spellings. Performance is influenced by visual memory for the correct spelling of whole words, knowledge of phoneme‐to‐grapheme mappings and knowledge of spelling rules. Low scores can reflect poor short‐term auditory memory for sequences. This may be shown when phonetic spelling of regular words is inadequate. Other reasons for a low level of performance are poor skills in phonological segmentation of words into component sounds or syllables, poor knowledge of letter names, letter sounds or letter combinations or poor auditory discrimination.
© 2012 GL Assessment Limited Created on 22/03/2012 for A. Psychologist of Independent Assessment Services 11

Word Reading A Performance on Word Reading is influenced by the ability to recognise printed words, efficiency of auditory working memory, skill in word analysis without contextual clues and knowledge of vocabulary. A low score can be a reflection of poor visual memory, which is often shown in a limited whole‐word sight vocabulary and which can also be associated with an over‐dependence on basic phonetic strategies. A poor short‐term auditory memory for sequences may also adversely affect performance. (This is often shown by inadequate skills in phonetic spelling of regular words.) Other reasons for a lower than average performance are poor skills in phonological segmentation of words into component sounds or syllables or poor skills in sound blending. There are two alternate forms of Word Reading, A and B.
© 2012 GL Assessment Limited Created on 22/03/2012 for A. Psychologist of Independent Assessment Services 12

Appendix C: Information about BAS3 scores
Norm‐referenced scores and BAS3
All the norm‐referenced scores obtained with BAS3 have been linked to the normal curve, as shown in the diagram. This allows each score obtained by an individual to be evaluated in relation to how many other children at that age would have the same score. In this way, it is possible to consider how average/usual a score is or how unusual it might be. T‐scores have a mean score of 50 and a standard deviation of 10 points either side. Most children (~ 68%) will score within the range 40 to 60, and around 96% will score within the broad range of standard scores from 30 to 70. T‐scores are obtained for each of the individual scales in BAS3, with the exception of the three Achievement Scales. Standard scores have a mean score of 100 and a standard deviation of 15 points either side. Most children (~ 68%) score within the range 85 to 115, and around 96% will score within the broad range of standard scores from 70 to 130. Standard scores are obtained for the four Cluster Scores in BAS3, i.e. for the GCA and for the Verbal Ability, Non‐verbal Reasoning Ability and Spatial Ability Cluster Scores. In addition, standard scores are obtained for the three Achievement Scales, i.e. for Number Skills, Spelling and Word Reading. Percentiles or percentile ranks also show where a child's score lies in relation to children of his or her same age. The 50th percentile is average. Most children (~ 68%) will obtain a percentile within the broad range from the 16th to the 84th percentile, while around 96% will obtain a percentile within the broad range from the 2nd to the 98th percentile. A score at the 10th percentile means that 10 out of 100 children in the standardisation sample achieved a similar score or lower, and 90 scored higher.
Describing the BAS3 scores Various terms are used within this report when describing a child or young person's abilities. For convenience, and in line with many other published tests, the following terms are used when describing the various scores and percentiles.
GCA / SNC, Cluster Score and Achievement Scale score descriptors (with a mean of 100 and a standard deviation of 15)
© 2012 GL Assessment Limited Created on 22/03/2012 for A. Psychologist of Independent Assessment Services 13

Scores Percentiles Very High 130 and above 98‒99 High 120‒129 91‒97 Above Average 110‒119 75‒90 Average 90‒109 25‒74 Below Average 80‒89 9‒24 Low 70‒79 3‒8
Very Low 69 and below 1‒2
T‐score descriptors (with a mean of 50 and a standard deviation of 10)
Scores Percentiles Very High 70 and above 98‒99 High 63‒69 91‒97 Above Average 57‒62 75‒90 Average 43‒56 25‒74 Below Average 37‒42 9‒24 Low 30‒36 3‒8
Very Low 29 and below 1‒2
A note of caution The descriptor for the GCA is based usually on the child's performance on six scales. The descriptive term may be considered more reliable therefore than the descriptors for the Clusters, which are based on performance on only two scales. The descriptor for the T‐score is based on performance on just one scale. Consequently, applying the seven‐point gradation to the Cluster Scores and individual T‐scores might be considered less reliable than when applied to the GCA. Therefore, some caution is needed when using the descriptors. There is a need for further caution. All the descriptors are linked to the child's single obtained scores, rather than to the confidence intervals for each of the scores. If the scores at the lower and upper ends of the confidence intervals are described, a single obtained score being described as Below Average might in fact be truly Low or truly Average. This is especially true for the T‐scores. Therefore, again caution is needed when using the descriptors. One approach to these two cautions for the Cluster Scores and T‐scores is to simplify the score categories and use the following descriptors:
Cluster Scores T‐scores Above Average 110 and above 57 and above Average 90‒109 43‒56
Below Average 57‒62 42 and below
Age equivalents The age equivalents available for each individual scale represent the median ability score in the standardisation sample for that scale at the ages specified. As such, they may help to give a guide to the age of child for which the observed performance on any one scale would be most typical.
A note of caution The standardisation data for any one individual scale has been used to develop the age equivalents for that scale. Each scale has its own set of data. This means that different ability scores on two scales may convert into the same age equivalent, or that the same ability score on two scales may convert into different age equivalents. This may lead others to question the accuracy of the scoring, whereas the differences are simply the result of the scale by scale development of BAS3.
© 2012 GL Assessment Limited Created on 22/03/2012 for A. Psychologist of Independent Assessment Services 14