bart adaptation strategy for sea- level rise in the area · bart adaptation strategy for sea-level...
TRANSCRIPT

BART Adaptation Strategy for Sea-Level Rise in the
San Francisco Bay Area
FTA Project CA-26-6006-00
with support of
National Oceanic &
Atmospheric Administration
San Francisco Bay Conservation & Development
Commission
Metropolitan Transportation Commission
Tian Feng, FAIA, FCSI
District Architect San Francisco Bay Area Rapid
Transit District [email protected]
Norman Wong, PE [email protected]
Herbert Diamant Systems Engineer

About BART

• Introduction and Background • Element 1 – Climate Hazards in the Bay Area
• Sea Level Rise, Downpour & Flooding
• Element 2 – Vulnerability and Risk Assessment • Element 3 – Adaptation Strategies
• Global Rail Sector Climate Adaptation Strategies • Adaptation Strategies • Prioritizing Adaptation Strategies
• Element 4 – Links to BART Organization and Practices
• Element 5 – Asset Management and Life-Cycle Cost Analysis
• Conclusion
Pilot Approach

Assets
Lake Merrit Station Entrance
Coliseum Traction Power Substation Fruitvale Train Control Room
West Oakland Track Portal

1 - Climate Hazards in the Bay Area
• Sea Level Rise • 2050 – 16” • 2100 – 55”
• Downpour • Current – 1.2-1.3 in/hr 100-yr 1-hr storm intensity • Future – modest, recommend 30% greater intensity
• Flooding • Current – 100- and 500-year FEMA floodplain • Future – recommend add ½ mile extent to floodplain
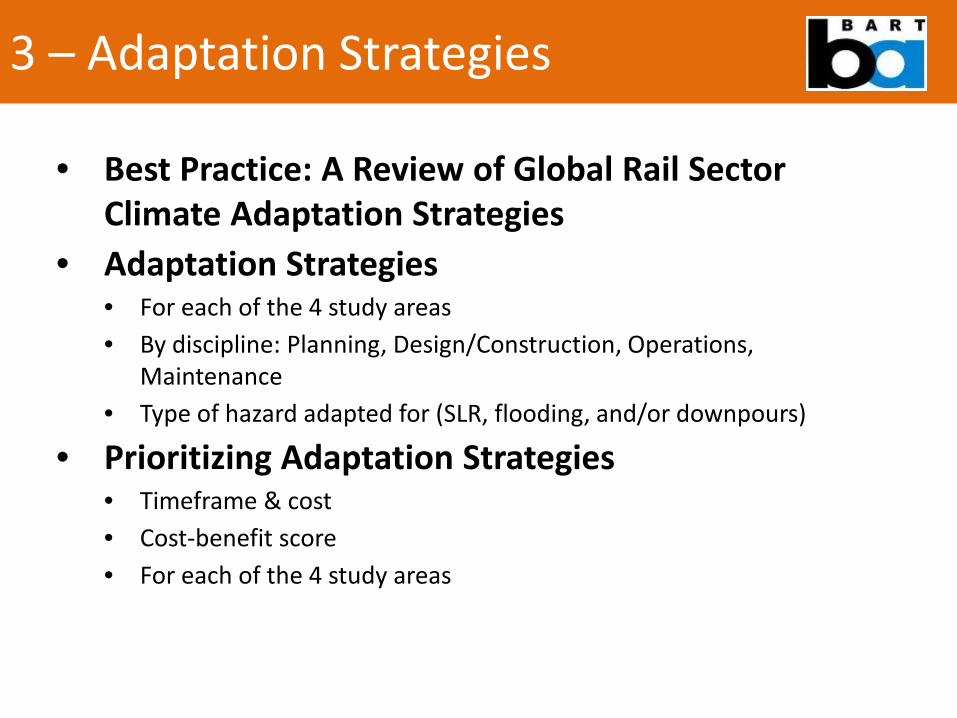
• Best Practice: A Review of Global Rail Sector Climate Adaptation Strategies
• Adaptation Strategies • For each of the 4 study areas • By discipline: Planning, Design/Construction, Operations,
Maintenance • Type of hazard adapted for (SLR, flooding, and/or downpours)
• Prioritizing Adaptation Strategies • Timeframe & cost • Cost-benefit score • For each of the 4 study areas
3 – Adaptation Strategies

Internal Stakeholder Engagement
Date
Event
Personnel
2/5/13
Adaptation Strategy
Workshop #1
Dean Giebelhausen, Section Manager Power Mechanical
Cristiana Lippert, Division Manager Mechanical Engineering
Ken Meyers, Facilities Supervisor
John Scaria, Group Manager Systems Engineering
Barney Smits, Principal Mechanical Engineer
2/27/13
Adaptation Strategy
Workshop #2
Dan Hartung, Deputy Police Chief
Mark Pfeiffer, Manager Electrical and Mechanical Engineering
Abdul Shaik, Manager, Traction Power
Pepe Vallenas, Acting Seismic Engineering Manager

Land Use/Planning
Area-wide barriers Relocate assets
Drain capacity Low impact development
Other jurisdiction involvement
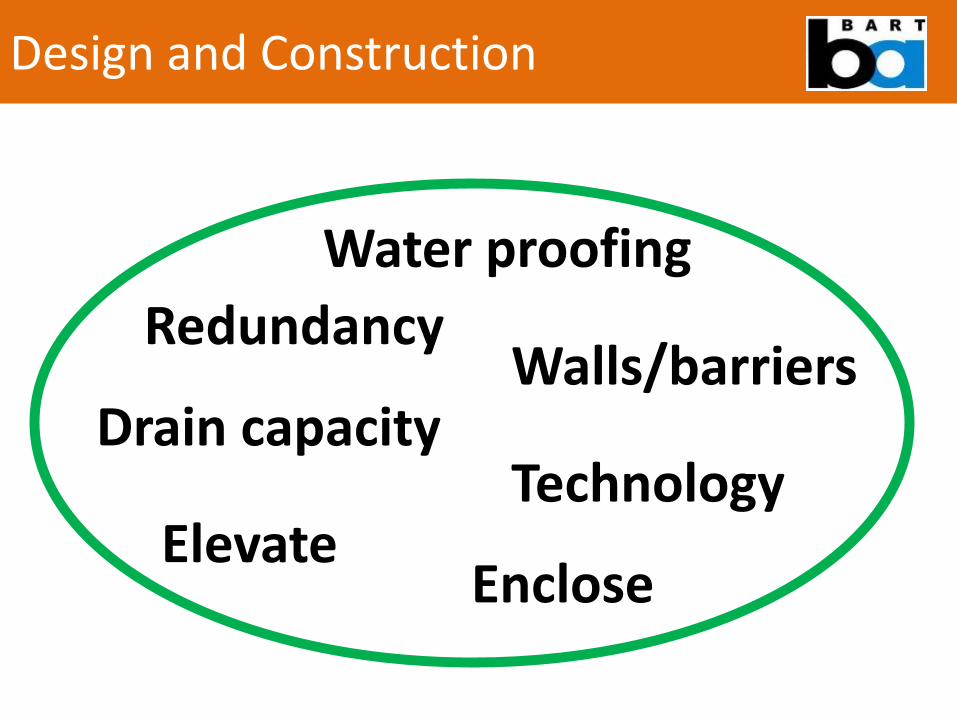
Design and Construction
Water proofing
Walls/barriers Drain capacity
Elevate Technology
Redundancy
Enclose

Operations
Asset Management
Redundancy
Inreach Groundwater Modeling
Emergency Management

Maintenance
Drain & roof systems
Reporting Equipment Monitoring

3 – Strategy Prioritization

3 – Strategy Prioritization
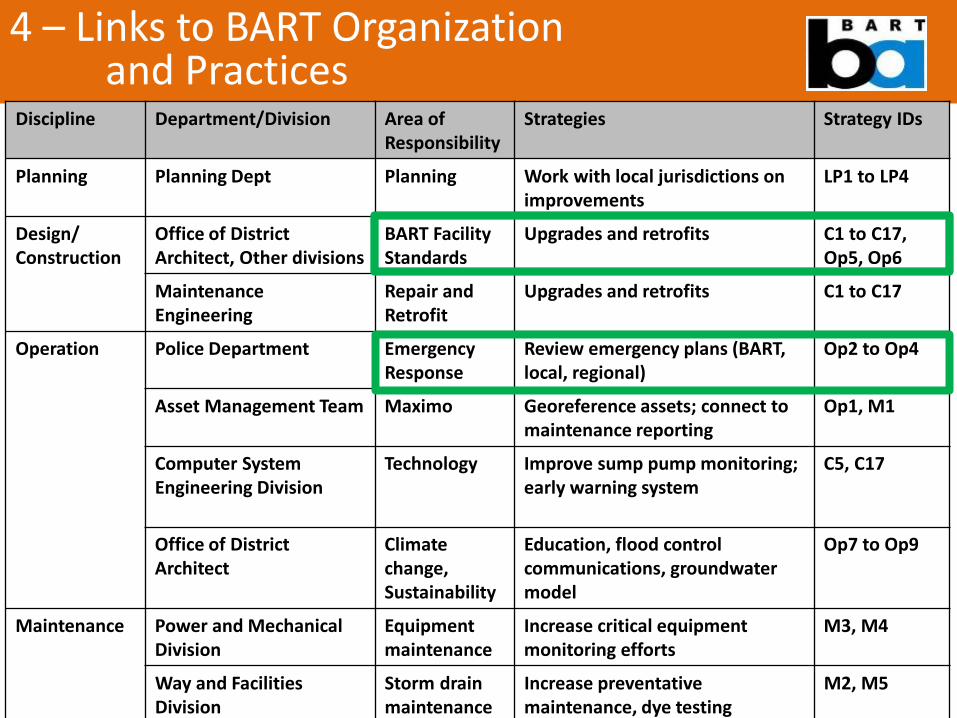
4 – Links to BART Organization and Practices Discipline Department/Division Area of
Responsibility Strategies Strategy IDs
Planning Planning Dept Planning Work with local jurisdictions on improvements
LP1 to LP4
Design/ Construction
Office of District Architect, Other divisions
BART Facility Standards
Upgrades and retrofits C1 to C17, Op5, Op6
Maintenance Engineering
Repair and Retrofit
Upgrades and retrofits
C1 to C17
Operation Police Department Emergency Response
Review emergency plans (BART, local, regional)
Op2 to Op4
Asset Management Team Maximo Georeference assets; connect to maintenance reporting
Op1, M1
Computer System Engineering Division
Technology Improve sump pump monitoring; early warning system
C5, C17
Office of District Architect
Climate change, Sustainability
Education, flood control communications, groundwater model
Op7 to Op9
Maintenance Power and Mechanical Division
Equipment maintenance
Increase critical equipment monitoring efforts
M3, M4
Way and Facilities Division
Storm drain maintenance
Increase preventative maintenance, dye testing
M2, M5

Update to BART Facilities Standards
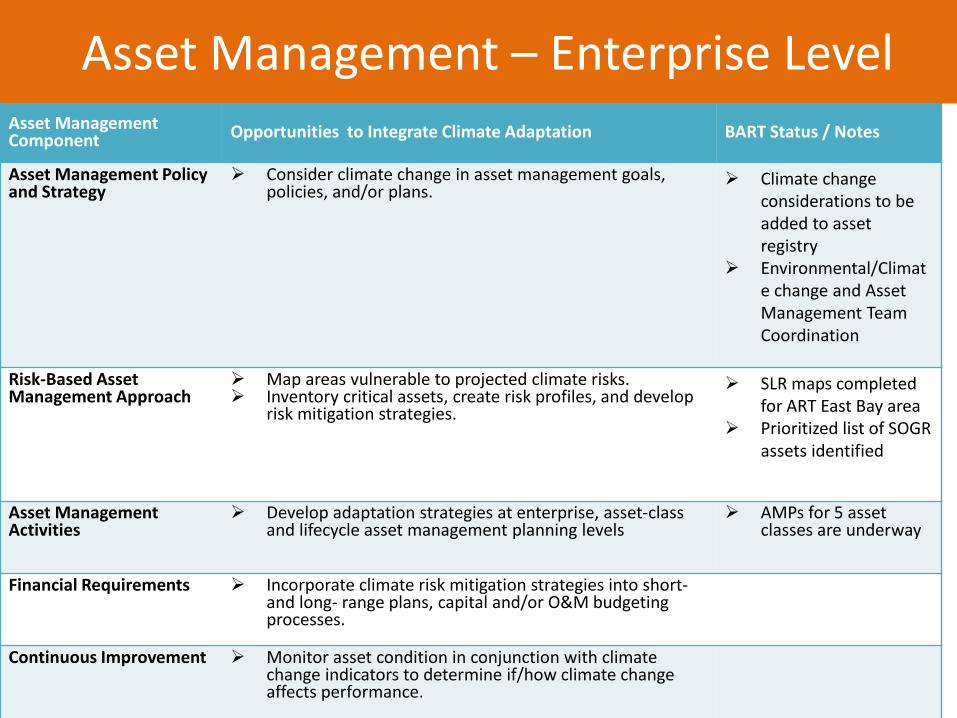
Asset Management – Enterprise Level Asset Management Component Opportunities to Integrate Climate Adaptation BART Status / Notes
Asset Management Policy and Strategy
Consider climate change in asset management goals, policies, and/or plans.
Climate change considerations to be added to asset registry
Environmental/Climate change and Asset Management Team Coordination
Risk-Based Asset Management Approach
Map areas vulnerable to projected climate risks. Inventory critical assets, create risk profiles, and develop
risk mitigation strategies. SLR maps completed
for ART East Bay area Prioritized list of SOGR
assets identified
Asset Management Activities
Develop adaptation strategies at enterprise, asset-class and lifecycle asset management planning levels
AMPs for 5 asset classes are underway
Financial Requirements Incorporate climate risk mitigation strategies into short- and long- range plans, capital and/or O&M budgeting processes.
Continuous Improvement Monitor asset condition in conjunction with climate change indicators to determine if/how climate change affects performance.

Asset Management – Asset Level Life Cycle Management Component Opportunities to Integrate Climate Change Adaptation
Roles and Responsibilities Identify resource (person, organization, or program) for climate risk data and how it will be maintained.
Asset Inventory Overlay or relate inventory to climate-related data.
Condition Assessment & Performance Monitoring
Document condition and performance monitoring in conjunction with climate conditions to understand how an asset performs under various climate extremes and if a climate risk mitigation strategy that has been implemented is effective and responsive.
Preventive/ Reactive Maintenance Plan
Update preventive and reactive/corrective maintenance practices to address different operating conditions
Asset Policy and Strategy Include goals for level of service requirements and climate change-related outcomes.
Asset Lifecycle Management Consider climate risks to asset throughout each phase: (1) Design/procure (2) Use/operate (3) Maintain/monitor (4) Rehabilitate (5) Dispose/reconstruct/replace
Capital Programming and O&M Budgeting
Consider costs of climate-related strategies (incl. costs to replace vs. retrofit vs. abandon) and the value or benefit of the measure to facilitate prioritization.
Performance Modeling Conduct performance modeling in conjunction with climate conditions.
Continuous Improvement Update asset lifecycle management plans as conditions and performance change.

Life Cycle Cost Analysis (LCCA)
Figure 6-3. Life-Cycle Cost Analysis Framework for Critical Assets
Step 1 Establish alternative scenarios
Step 2 Determine activity timing
Step 3 Estimate costs (agency and user)
Step 4 Compute life-cycle costs
Step 5 Analyze the results

Fruitvale Train Control Room

Water Intrusion Incident 11/30/12 • Incident: A20, Heavy rain and drain pipe blockage
caused rooftop ponding+intrusion and flooding from interior floor drain. Speed code issues occurred. (~3 hrs in late afternoon)
• Repair Damage: • PLM card and power supply for VPI (~$4,800) • Pipe replacement (~$500) • Labor (~$25,000)
• Delay Impact: • 34 Secondary delays between 5 and 11 minutes • Up to 21,000 riders impacted

Business-as-Usual Scenario

Adaptive Scenario

Life Cycle Cost Analysis
Business-as-Usual Scenario
Adaptive Scenario
O&M $1,330,000 $500,000
Capital $360,000 $1,140,000
TOTAL
(2013-2050 In Year of Expenditure Dollars)
$1,700,000 $1,640,000
Table 6-7. 2050 Life-Cycle Cost Comparison of BAU vs. Adaptive Scenario

• Questions • Feedback or comments
Questions?