barriers to exporting to the eu: evidence … to exporting to the eu: evidence from textiles and...
TRANSCRIPT

BARRIERS TO EXPORTING TO THE EU: EVIDENCE FROM TEXTILES AND
LEATHER GOODS FIRMS IN INDIA♣
Sangeeta Khorana∗
School of Management and Business
Aberystwyth University,
Aberystwyth SY23 3DD, United Kingdom
Tel: +44 (0) 1970 622210
Fax: +44 (0) 1970 622409
Email: [email protected]
Kwok Tong Soo
Department of Economics,
Lancaster University Management School,
Lancaster LA1 4YX, United Kingdom
Tel: +44 (0) 1524 594418
Fax: +44 (0) 1524 594244
Email: [email protected]
♣ Thanks to V.N. Balasubramanyam and Wendy Beekes for helpful suggestions on an earlier draft. The authors are responsible for any errors and omissions. This paper uses data from the project entitled “Convergence towards Regional Integration between the EU and India: Trade Implications for the UK and India”. Funding for this project by the British High Commission, India is gratefully acknowledged. *Corresponding author: [email protected]

2
Barriers to Exporting to the EU: Evidence from Textiles and Leather
Goods Firms in India
Abstract: Barriers to exporting continue to exist despite the lowering of import tariffs in
recent years. In the current business environment these include non-tariff barriers in the
foreign and home country which have the potential to impact on exporting activity of firms.
In this paper, based on primary research, we analyse barriers faced by Indian textile and
clothing and leather and footwear firms in exporting to the European Union (EU). First, we
document the manifold types of barriers that make it difficult for Indian firms to export their
products to the EU. Second, we explore the relationship between perceptions of barriers to
export and firm characteristics, using interview data from a sample of textiles and leather
goods exporting firms in India. We find that firms which are closer to ports report lower
transport costs and less corruption than firms further away from ports. Firm size, exporting
experience and whether the firm is from the textiles or leather goods industry have no
significant impact on the firm’s perception of export barriers. Finally, we assess policy
implications of the results on Indian firms’ perceptions to export barriers to shed light on
issues that need addressing in the light of ongoing negotiations for a Free Trade Agreement
(FTA) between the EU and India.
Keywords: India, EU, barriers to exports, entrepreneurship issues, textiles and clothing,
leather goods and footwear.

3
1 Export Barriers: An Overview
Despite many decades of tariff reduction under the aegis of the General Agreement on Tariffs
and Trade (GATT) and the World Trade Organization (WTO), trade barriers remain high.
Although world average import tariffs have fallen from over 20 percent in the 1980s to less
than 10 percent in 2009 (Ng, 2010) Anderson and van Wincoop (2004) in their magisterial
survey of the literature on trade costs note that the average tariff equivalent of trade costs for
industrialised countries is 170 percent. This value is higher for developing countries, and
there are large variations across industries as well. The reason for the high value of measured
trade costs is that they include much more than just tariffs and non-tariff barriers; they
include “… all costs incurred in getting a good to a final user other than the marginal cost of
producing the good itself” (Anderson and van Wincoop, 2004).
There are a large number of studies focussing on export barriers, mainly non-tariff
barriers (NTBs) that manifest as behind-the-border barriers to trade. The pioneering research
on export barriers identified the lack of knowledge of foreign markets as a dominant
impediment to international activity commitment (Aharoni, 1966). Later research classifies
barriers into internal and external barriers which impact on the activity of exporting firms.
Studies show that internal barriers such as procedural, distribution and documentation
problems are associated with the exporting firm’s organisational resources (Bilkey, 1978;
Leonidou, 1995b, 2004). Examples of such barriers include the lack of knowledge,
experience, socio-economic and managerial factors (Kaleka & Katsikeas, 1995; Leonidou,
1995 a, b). External barriers, on the other hand, originate in the external environment of the
exporting firm. Later studies further disaggregate the conceptual domain of export barriers
4
into internal-domestic, internal-foreign, external-domestic and external-foreign problems
(Morgan, 1997; Kaleka and Katsikeas 1995).
Research shows that exporters’ sensitivity to barriers in the foreign market is
determined by managerial perceptions which are in turn influenced by contextual factors
associated with firm size, resources and capability, export involvement and international
experience (Barney, 1991; Suarez-Ortega, 2003; Ojala, 2007: Karelakis et al, 2008). Studies
also show that exporters consider high banking charges, low capacity usage, and poor
technology as the major problems that affect their business operations (Frimpong & Mmieh,
2007). In more general terms, changes in consumers’ preferences, the presence of middlemen
and agent representatives, import tariffs, problems finding a trustworthy distributor in the
target country, exchange rate fluctuations, risk of losing money in the foreign market, and
quality and safety standards are other potential export barriers to firms (Rabino, 1980; Korth,
1991; Kneller & Pisu, 2011).
In Asia, export barriers are concentrated mainly in the textile and clothing sector and
studies report that most barriers are attributed to technical regulations and labelling rules
(Bhattacharya, 1999; Bhattacharya & Mukhopadhaya, 2002; Chaturvedi & Nagpal, 2003). A
primary survey on exporters’ perceptions of barriers reports an increasing incidence of non-
tariff measures on India’s exports (Saqib & Taneja, 2005) Another study on India’s textiles
and clothing sector, informs that non-preferential rules of origin and discriminatory unilateral
changes to technical rules are important barriers (Mehta 2005). The OECD survey (2005)
identifies labelling requirements, technical standards, anti-dumping measures and child
labour laws as main barriers to Indian exports of textiles and clothing in the EU. Other
related export barriers include general absence of information, lack of transparency on
procedures and regulations regarding technical specifications, inadequate information about
sampling, inspection, and testing as well as changes in packaging requirements. Finally,

5
customs procedures and valuation rules are also identified as NTBs which have the potential
to adversely impact on exporting activity (World Bank, 2009).
Studies show that the Indian industry in general has had to face competition from both
domestic and foreign firms (Sardana & Sinha, 2011). The objective of this paper is to analyse
the perceived export barriers faced by Textiles and Clothing and Leather Goods and
Footwear industries in India. These two industries together comprise just over a quarter of
India’s total exports to the EU in 2010 (EC, 2011). Using data collected through interviews
with managers of 30 firms, which are active in exporting to the EU in each of these two
sectors, we develop and estimate an econometric model that relates export barriers reported
by firms to the firms’ own characteristics. Our results on Indian firms’ perceptions to export
barriers may shed light on issues that need addressing in light of ongoing negotiations for a
Free Trade Agreement (FTA) between the EU and India. This proposed agreement aims to
address behind-the-border barriers, especially the existing NTBs to trade which is the focus
of this paper.
The paper is structured as follows. Section 2 discusses the key characteristics of
Leather and Footwear and Textiles and Clothing industries, main sectors analysed in this
study, and highlights barriers faced by Indian exporting firms in these sectors in the EU.
Section 3 details the empirical analysis of the relationship between firm characteristics and
perceptions of barriers to exporting. We find that firms which are closer to ports perceive
transport costs and corruption are less important barriers than firms which are further away.
On the other hand, firm size, exporting experience and whether the firm is in the textiles or
leather industry have no significant impact on the firm’s perception of the level of export
barriers. The final section concludes and presents policy implications of the results on Indian
firms’ perceptions to export barriers that shed light on issues that need addressing in light of
ongoing negotiations for a FTA between the EU and India.

6
7
2 Industry Overview and Export Barriers faced by Indian Firms
2.1 Industry Overview: Textiles and Clothing
The Textiles and Clothing industry in India primarily produces men’s clothing, knitted and
hosiery products (Ministry of Textiles, 2010). During 2008-09, the value of India’s Textiles
and Clothing exports was US$ 20 billion or nearly 12 percent of total national exports
(DGCI&S, 2010). Though the industry provides employment to 21 percent of the labour
force and contributes nearly 14 percent to industrial production, its share in total gross
domestic product is small, at 3 percent (Economic Survey, 2010). The Textiles and Clothing
supply chain comprises several interrelated production stages which include ginning,
spinning (yarn), weaving and knitting (fabrics), dyeing and processing, and garments
manufacturing. One end of the chain is dominated by large firms and high-street retailers
with multiple internationally located outlets. Further up the chain there are many small and
medium sized firms.
Firms in the Indian Textiles and Clothing industry are grouped into the organised and
unorganised sectors. Organised firms are medium to large-sized and often vertically
integrated along the supply chain. These are registered under the Factories Act (1948) and
further classified as those using electricity and employing 10 or more workers, or those firms
that do not use electricity but employ 20 or more workers. Firms in the unorganised sector do
not meet these criteria and comprise small firms including power-loom, handloom, hosiery,
knitting and readymade, khadi (coarse cotton cloth) and carpet manufacturing units (Ministry
of Textiles, 2010). The Indian government provides special incentives under the national
industrial policy to small firms through concessional credit, modernisation and technology

8
upgrade support, export credits, and low tax rates (Economic Survey, 2010). The number of
small firms has, therefore, increased in the unorganised sector along the supply chain.
The increase in the number of small firms is also attributed to policy guidelines of the
1990s that required these firms to produce only for the domestic market but larger firms had
to export at least 50 percent of their output. This policy resulted in an inefficient industry
with a fragmented market structure (Ministry of Textiles, 2000). The Indian government has
recently withdrawn special preferences for the small scale sector as a result of which medium
sized firms are becoming significant contributors to total apparel exports. These cost-
effective medium sized firms are situated in the Textiles and Clothing clusters which
enhances competitiveness as firms benefit from a common pool of resources and
infrastructure. Examples of successful export oriented hubs include Tirupur, Ludhiana and
Panipat, which account for 80, 95 and 75 percent of the production of total hosiery, woollen
knitwear and blankets, respectively.
2.2 Industry Overview: Leather and Footwear
India is the third largest leather producer (after China and Italy) and the fifth biggest exporter
of leather goods and accessories in the world. The leather industry is classified on the basis of
activity into: (a) leather processing firms, which include tanning and finishing units, and (b)
firms producing leather products such as footwear and its components, leather garments and
goods. The Indian leather industry produces a diverse range of products that range from raw
hides, footwear & footwear components, leather garments, leather goods to saddles & harness
products, and accessories. Leather footwear firms are located mainly in Chennai, Hyderabad,
Agra and Kanpur, leather garments in Delhi, Bangalore and Chennai, while leather
accessories are produced in Kolkata, Chennai and Kanpur (CLE, 2010).

9
As with the Textiles and Clothing industry, the Leather and Footwear industry is
divided into organised and unorganised sectors. Production is mainly concentrated in the
unorganised sector, which includes small tanning units, and contributes nearly 90 percent of
total leather exports (CLE, 2010). Firms in the unorganised sector are not registered under the
Indian Labour Act so these units have no legal obligation to provide social security benefits
for their employees. In most cases, the unorganised firms employ traditional production
technologies that are inadequate to comply with environmental regulations on effluents and
emission levels. Environmental pollution levels in tanneries and small manufacturing firms
are, therefore, high. The unorganised sector is heavily reliant on imported machines because
most small firms have limited financial resources for investments in R&D and innovation.
Not only does this stifle domestic innovation but it increases the vulnerability of firms to
changes in foreign markets. Among other shortcomings, the leather supply chain is
geographically dispersed which does not enable the firms to benefit from agglomeration
economies. The existing institutional and firm-level constraints together with existing
physical and technical infrastructural deficiencies and competition from Chinese synthetics
and non-leather products have an adverse impact on export competitiveness.
2.3 External Barriers Encountered by Indian firms in Exporting to the EU market
There is a diverse set of barriers encountered by Indian Textile and Clothing and Leather and
Footwear firms exporting to the EU. This study classifies the most frequently reported export
barriers as internal and external barriers. Internal barriers are intrinsic to the firm and home
business environment. These are characterised by problems faced in export activities and are
incurred either through the exporting firm’s organisational resources or its approach to export
marketing that affect the ability of firms to export. Examples of internal barriers within India
include transportation and distribution difficulties, inadequate market information,

10
corruption, lack of awareness about changing EU legislation and new buyers, as well as
difficulties experienced in establishing contact with new buyers in foreign markets. The
external barriers that Indian firms face in their exporting activity emanates from the EU
legislative and non-legislative market access requirements and are a result of the foreign
regulations, standards and requirements. Examples of barriers that derive from external
legislative requirements are importers’ insistence on compliance with higher than minimum
specified chemical limits, testing and certification requirements, packing and related waste in
excess of the EU norms. The non-legislative market access component originates from the
implementation of voluntary labels and standards by the EU Member States.
Within the context of EU-India trade, external barriers that industries encounter
originate from regulatory framework in the EU that are minimum quality standards to
guarantee the health and safety of the consumer or protection of the environment. These
regulations and standards are legal documents and are mandatory in all cases. Over-
implementation by importers manifests as NTBs to the exporting activity of firms which
translates into: (1) administrative burden of compliance (2) additional financial costs. For
instance, in the Leather and Footwear industry, buyers require exporters to comply with
chemicals limits in excess of the specified requirements. Examples include demand for over-
compliance with the norm on specified limits for chemicals used in leather processing and
finishing such as azodyes, chrome IV, cadmium, polychlorinated biphenyls, terphenyls, and
Benzedrine.
Another example from the Leather and Footwear industry is the EU’s Registration,
Evaluation, Authorisation and Restriction of Chemicals (REACH) legislation which aims to
phase out harmful chemicals over 10 years by employing the life cycle process approach to
production. Other related costs to implement REACH are changes necessitated in production
processes given the extant EU rules require exporting firms to identify all inputs used in

11
production of the final product. Other associated compliance costs for REACH include
independent accreditation and verification of exporters’ compliance at a fee every time this
list is updated. In addition, the EU importers overzealously implement the permissible limits
of chemicals such that presence of chromium in tanneries effluent waste (the allowed limit is
< 5mg/litre after treatment) even by a small margin has resulted in closure of many tanning
units in India. In the Textiles and Clothing sector, EU environmental regulations apply but
importers demand less than the minimum EU permissible limits of amine dyes (usage
allowed < 30 parts per million), cadmium (used to colour finished garments), mercury
compounds, and volatile organic carbons (VOCs) in printing pastes. Such technical
requirements on the minimum quality standards to guarantee the health and safety of the
consumer or the protection of the environment raise prices of imports in a way that is
equivalent to a tariff.
Further costs arise given producers have to prove conformity with any given standard
or technical regulation. In principle, certification of goods conformity can be carried out
either by the exporting firm, government agencies, or outsourced to other firms. Since
exporting firms in India and government agencies lack qualified technicians/laboratory
assistants and have shortage of testing equipment, in most cases the results of tests and
accreditation are not recognised by EU buyers. Without exception, the EU-based importers
demand that exports of Textiles and Clothing (e.g. functional garments, uniforms, upholstery
materials, home furnishings and made ups, carpets and rugs, and industrial fabrics) and
Leather and Footwear from India are tested and certified by EU nominated foreign testing
agencies, such as SGS Testing, Specialised Technology Resources Inc or even laboratories in
the EU (Khorana, et al, 2010). In addition to these, there are overheads such as consultancy
fees for certification, translation of technical documents for the certifying agencies in
languages other than English, despatch charges of samples and technical documents. Costs
12
are also involved for packaging of final product depending on destination country with
regards to waste reduction at source, elimination of harmful materials in packaging waste,
maximising the recovery of packaging waste for re-use, recycling, composting or energy
generation, and minimising final disposal. An example is the EU Directive on packaging that
imposes a specific chemicals concentration limit (100ppm by weight of lead, cadmium,
mercury and hexavalent chromium) for footwear and clothing packaging, though importers
inevitably ask Indian firms to comply with much lower limits (Chaturvedi & Nagpal, 2003).
Another barrier emanates from standards, both national and voluntary, that vary
widely between different EU Member States. In almost all cases, buyers require that product
labels be in line with both the EU legislation and Member States’ national domestic
standards. As a result, firms have to meet different standards and are unable to benefit from
economies of scale. Also it is mandatory in most EU Member States to have separate labels
on inner and outer clothing in the national language, in addition to English. Indian apparel
manufacturers are also required to import labels from designated label manufacturers in Hong
Kong China. Finally, buyers require conformity with private labelling schemes such as Öko-
Tex and Britta Steilmann (Germany) and Bra-Miljöval (Sweden) and also require to
demonstrate conformity with Markenzeichen Schastoffgeprufth Textilien (MST) and
Markenzeichen Unweltschonende Textilien (MUT), which specify norms for production
processes and standards on the degree of air, water and soil pollution. Indian firms also have
to apply for the eco-award to different EU Member States so additional voluntary standard
compliance inflates total production cost.
2.4 Internal barriers encountered by Indian firms in exporting to the EU market
Internal or domestic barriers stem from inadequate physical infrastructure, corruption and
high transport costs which impacts adversely on Indian firms’ export competitiveness.

13
Changing fashions in garments necessitate shorter production schedules and in light of the
existing physical infrastructure constraints in India it is a challenge for exporters to ensure
timely deliveries of initial and repeat orders. In particular, Indian exporters’ competitiveness
is disadvantaged by an ineffective domestic logistics system. The inefficiency of the Indian
inland transportation system is attributed to outdated transport lorries, poor road conditions,
unavailability of all-weather road connectivity, frequent road strikes, and rising fuel costs.
Exporters in north India (Agra, Kanpur, and Delhi) and east (Kolkata) are at a cost
disadvantage compared to firms located in the West because firstly, most exporters use
Jawaharlal Nehru Port Trust in Mumbai (JNPT) which is a modern state-of-art port located in
the western part of India; and, secondly, Indian Railways and a few domestic air cargo
carriers, which are the main inland transport agencies, have limited capacity to handle large
export volumes. The World Bank (2009) also identifies inland transport and port congestion
as major impediments to Indian exports. Besides, existing ports lack mechanised handling
and loading equipment which adds to loading time, increases warehousing costs and
adversely affects delivery schedules (Brooks and Stone, 2010). This leads to congestion at
JNPT. In addition to high inland transportation costs, traders face steep port charges and
terminal handling fees. Unavailability of containers is another common constraint faced by
exporters. Finally, cargo is often delayed because of numerous official and unofficial
checkpoints on the principal trade routes, in particular between state borders and district
boundaries (Planning Commission of India, 2010). In this manner, high transport costs and
physical infrastructural deficiencies impact on competitiveness directly and raise per unit
export costs.
Corruption and bureaucracy is another important barrier (Brooks and Stone, 2010).
Bribery and corruption are highlighted as a growing menace with the potential to adversely
impact on India’s economic growth (KPMG, 2011). High domestic corruption, attributed to

14
excessive governmental regulations and bureaucratic hurdles, is a commonly constraint
reported by Indian exporters (Khorana et al, 2010). Extant rules require Indian exporters to
undertake excessive administrative formalities in different offices. Examples are registering
to obtain the export code in Export Council, obtain unique business identification number
called director identification number (DIN) from the Ministry of Corporate Affairs, obtain the
Certificate of Incorporation from the Registrar of Companies, Register for Value-Added Tax
(VAT) at the Commercial Tax Office, obtain Tax Account Number (TAN) and sales tax
registration certificate at the Tax office. To set up a production unit, an exporter has to submit
as many as 35 applications for approvals, clearances and licences as well as has to make
‘facilitation payments’. Corruption is compounded by the existing governmental policy that
allows tax breaks and financial support to small exporting firms.
South Asia is characterised by inefficient customs procedures which often increases
clearance time (Hertel and Mirza, 2009). Barriers at ports include excessive paperwork
requirements, lack of standardised documents, theft and pilferage. Often there is no
transparency in inspection of export consignments and lack of clarity on documentation
required in small ports which increases waiting time of exports. Commonly reported
procedural barriers in India are excessive customs documentation and administrative
formalities. Customs clearance delay is a significant impediment to the Footwear exporting
firms in particular. The World Bank (2009) finds most time is spent complying with
burdensome paperwork and estimates that it takes 8 separate documents to export, and 9 to
import to India. In most cases, the main problem is to obtain the origin certificate and
customs certification on inward processing, temporary importation and outward processing.
Often exporting firms do not have requisite documents to prove conformity with the rules of
origin and domestic content and as a result are unable to export at preferential tariffs to the
EU. Finally, there are related problems of customs valuation at the destination port faced by

15
Indian exporters which manifests as the final barrier to small firms’ exporting activity
(Khorana, et al, 2010).
3 Export Barriers and Firm Characteristics
3.1. Data and Methods
In this section we analyse the relationship between firms’ characteristics and their perception
of the degree of barriers to exporting. We conducted interviews with managers from a sample
of 30 textiles and clothing firms and 30 leather and footwear firms. The firms selected for the
survey are chosen to provide coverage of the different types of exporting firms. The sample
includes firms that are presently exporting to the EU and to other markets. The sample of
firms selected for interview in the Textiles and Clothing sector was on the basis of
information from Apparel Exports Promotion Council (AEPC) and the Confederation of
Textile Industry in New Delhi. The Textiles and Clothing exporters interviewed were located
in export-oriented clusters all over the country. For example, in the Southern cluster the main
production clusters interviewed were Tirupur (knitted cotton garments such as T-shirts, ladies
and children wear), Coimbatore (yarn) Erode (yarn and fabrics), and Bangalore (basic and
fashion garments). In the West, the cluster in Mumbai (for made-ups such as bed sheets,
towels; and fashion garments) was selected; while Okhla in Delhi, Noida in Uttar Pradesh
and Gurgaon in Haryana (for fashion garments) were interviewed since these are the main
clusters in the North. The sample of firms in the Leather and Footwear sector was based on
registered exporters’ list with the Council for Leather Exports (CLE), Chennai. Since most
leather and footwear firms are located in Tamil Nadu, West Bengal and Uttar Pradesh, which
are the main production areas for leather footwear and accessories production, exporters
interviewed were located in Chennai, Agra and Kanpur (footwear manufacturing), Delhi and

16
Kolkata (leather accessories). Table 1 shows the geographic location of the firms in the
sample.
< Table 1 about here >
In the econometric analysis of the relationship between firm characteristics and perception of
trade barriers, we estimate the following equation:
Where trade barriers are measured using one of the following: (1) Regulations and standards;
(2) Testing and certification; (3) Labelling and packaging; (4) Environmental requirements;
(5) Transport costs; (6) Corruption and theft; (8) Customs and documentation. The first four
barriers may be categorised as external barriers; that is, barriers which make it difficult for an
Indian firm to export to the EU market. Within the external environment, barriers are
attributed to EU regulations that aim at safety, sanitation, environment, and consumer
information. The last three trade barriers may be categorised as internal barriers; that is,
domestic barriers that make general economic activity difficult for exporting firms in India.
Each trade barrier is rated by an exporting firm on a scale from 1 to 5, where a higher value
indicates a more significant barrier. A value of 1 on the scale indicates that the respondent did
not face this barrier in trading with the EU. This equation is estimated using OLS methods,
with the standard errors corrected for heteroskedasticity using the White correction.
As explanatory variables, we use four variables. First, we use the annual turnover of
the firm, measured in the natural log of rupees, as our indicator of the size of the firm. This
follows from the assumption popular in the recent theoretical literature (e.g. Melitz, 2003) in

17
which there are both fixed and variable costs of exporting. The presence of fixed costs of
exporting would suggest that large firms would perceive a relatively lower barrier to
exporting than small firms. The second explanatory variable we use is the natural log of the
number of years of export experience of the firm. If exporting costs do not change very much
over time, then the more export experience a firm has, the lower should be its perceived
export barrier, as the firm becomes familiar with the various costs associated with exporting
to the EU. Third, we use the road distance of the city in which the firm is located to the
closest major port, defined as JNPT close to Mumbai, Chennai, Kolkata, Tuticorin,
Pondicherry and Mangalore. This captures the additional costs of exporting if a firm is not
located close to the port, not only in terms of freight costs, but also port related and
administrative costs for documentation that needs to be submitted to the port authorities.
Hence we would expect firms that are further from ports to report higher barriers to exports.
Finally, we include an industry dummy to determine whether firms in one sector perceive
there to be tougher barriers to export than firms in the other sector.
Table 2 provides the summary statistics of the variables used; Panel A is for the
Textiles and Clothing industry, while Panel B is for the Leather and Footwear industry. What
is clear from this table is that firms in both industries have similar perceptions of barriers to
trade. Firms in the Textiles and Clothing industry are slightly larger on average than those in
Leather and Footwear, and are on average slightly closer to a major port. The firms in the
sample have on average 20 years of exporting experience, although this varies from 5 to 78
years.
< Table 2 about here >
18
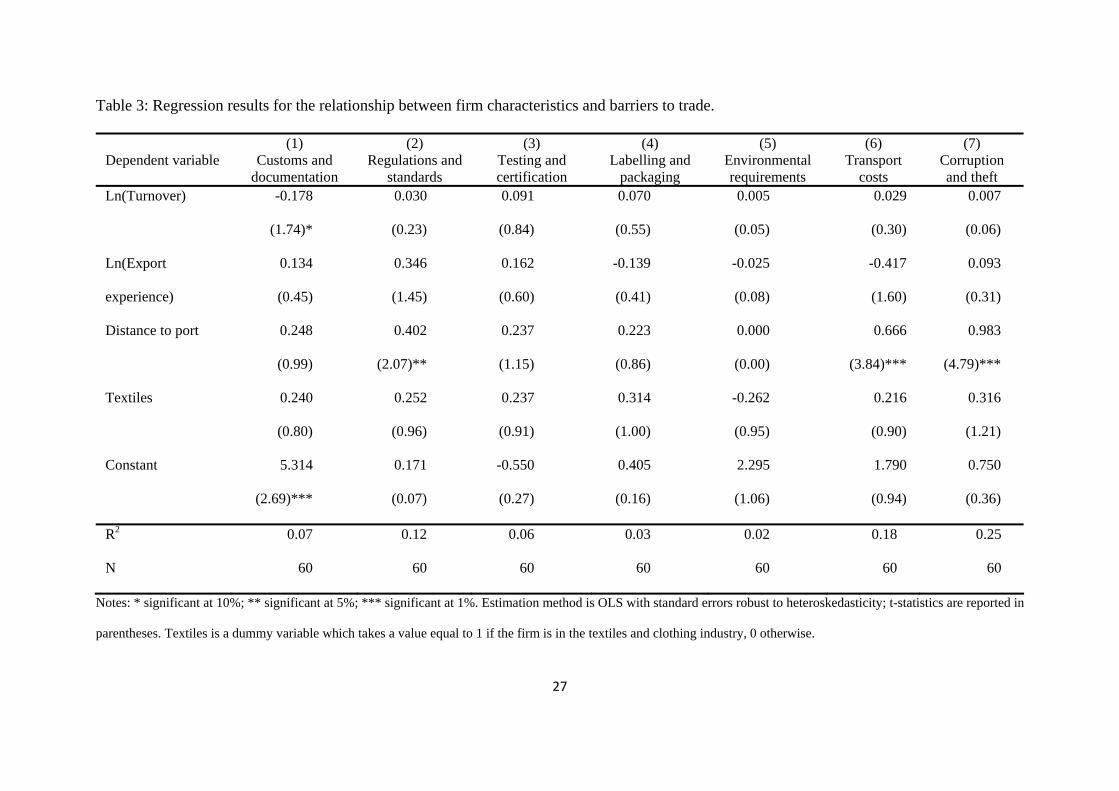
3.2 Results
Table 3 reports the results of our regression analysis. Firms that are further from a major port
report higher barriers especially in terms of regulations, transport costs and corruption. This
is what we may expect, as these firms have to incur additional inland transportation costs on
Indian roads and rail system, including many interstate tax checkpoints, and poor road
conditions and limited rail capacity as a result of ageing rail-track infrastructure. This finding
confirms an earlier report by the World Bank (2009) that highlights the poor condition of
physical infrastructure and stresses the need for investments in road and rail infrastructure.
An explanation to the perception of higher barriers faced by firms located further from ports
is that these might be less familiar with the operations of customs and other government
agencies involved in exporting than firms located closer to port cities (which may then be
interpreted as corruption). However, firm size and export experience have little influence on
the level of export barriers reported. This suggests that our priors about the role of firm size
and export experience in reducing the perceived costs of exporting are not verified in the
empirical analysis. It is possible that this is caused by the rapidly changing nature of the
trading relationships between India and her trading partners, which may impact on both, large
and small as well as experienced and inexperienced firms in the same way, thus giving no
advantage to any group of firms. A more prosaic possible explanation for the non-
significance of firm size and export experience is that larger and more experienced firms may
be reluctant to report that they face lower barriers. There is no significant impact of the
industrial sector on perceptions of barriers to exporting, confirming the initial finding in
Table 2 that firms in both industries experience similar levels of barriers.

19
< Table 3 about here >
In unreported results we added other explanatory variables to test the robustness of the results
of Table 3 and to yield additional insights. These variables were a dummy for whether or not
the firm is located in Delhi, to capture any potential advantages in terms of export facilitation
for a firm of locating in the capital, and the natural log of the population of the city the firm is
located in, to capture the additional services (both government and private) that may be
provided in a larger city that may facilitate exporting activities. However, neither of these
variables turned out to be significantly related to any of the barriers to export. From this we
may conclude that, as far as exporting is concerned, there are no statistically significant
benefits from being located in Delhi, or in a larger city as opposed to a smaller city.
4 Conclusions In this paper we have developed and estimated an econometric model of the barriers to
exporting as perceived by a sample of Indian firms in the textile and clothing and leather and
footwear industries. Our main finding is that firms which are closer to ports report less
transport costs and corruption than firms further away from ports. Importantly, firm size,
exporting experience, and whether the firm is in the textiles or leather industry, has no
significant impact on the firm’s perception of export barriers.
Our results have relevance for the ongoing EU-India negotiations for a FTA. In
section 2 we describe the NTBs faced by both Textiles and Leather goods firms in exporting
to the EU, which highlights an important area for negotiation between the two parties to the
FTA. NTBs are often an understated aspect but these are a significant problem as they
increase compliance costs and the importance of addressing NTBs has been specifically

20
highlighted in the proposed FTA. Technical regulations compliance is a fixed cost for Indian
exporters, which when combined with shortage of capital, transportation and other costs, has
a significant impact on the financial resources and profitability of small exporting firms in
particular. Within the context of ongoing EU-India FTA negotiations, existing external and
internal market barriers, in particular NTBs can be addressed through a collaborative review
of regulatory divergence and similarities between the EU and India as partner countries.
Collaboration on regulatory mechanisms will enable clear understanding of the regulatory
development and compliance requirements and foster transparency. Such consultations will
also support the Indian government in identifying export promotion programmes that are
relevant from the perspective of Indian exporters and focus on addressing the existing
internal barriers. Complementing regulations with information dissemination on national
standards, certification and accreditation procedures through national and regional contact
centres is equally vital. Besides, technical assistance commitments under the FTA framework
are important for capacity building of Indian exporters so that firms can respond to the
challenges of EU regulations, standards and the environment agenda. Addressing regulatory
divergence should be included in technical assistance as this will enable building capacity of
exporters. Also, a consultation mechanism between the EU and India is also proposed to
allow opportunity to stakeholders to discuss proposals before new standards are implemented.
In this manner, a FTA can result in an enabling external environment, which is mainly
attributed to regulatory and standards divergence, as this will provide signatories with an
opportunity to improve, harmonise, and make the regulatory environment more predictable.
This must be complemented by domestic policies to address internal barriers.
Our econometric finding that the distance from ports raises perceived barriers to trade
suggests that the mere formation of the EU-India FTA will not be a panacea to the difficulties
faced by Indian firms in exporting to the EU. In particular, it suggests that improvements in

21
domestic infrastructure will be a key component of expanding Indian trade in these sectors.
Better quality infrastructure will eventually reduce overall transit time and allow exporters to
manage the supply chain effectively to ensure timely delivery of export orders. An important
way forward to address the infrastructure constraint is to augment the existing physical
infrastructure by creating sustainable infrastructural linkages that will confer the exporting
firms with a distinct competitive cost and time advantage. Suggestions for infrastructure
enhancement include promoting private-public partnerships, privatising ports for efficient
delivery of port services including pilotage, towing, loading, handling and other ancillary
services. An associated recommendation is setting up additional export promotion clusters as
this will allow exporters to benefit from agglomeration economies in the common pool of
resources particularly physical infrastructure such as transport, technology parks, training and
design institutes and effluent management facilities. Finally, customs procedures must be
simplified and computerised as this will enhance transparency in the system and also address
high levels of corruption.
Finally, our finding that larger and more experienced exporters do not perceive lower
trade barriers is indicative of the rapid policy and economic changes occurring in the Indian
economy. In such an environment, past experiences may be less relevant, and the possibly
greater flexibility of smaller firms more important, in securing new markets for their
products.

22
References
Aharoni, Y. (1966) The Foreign Investment Decision Process. Cambridge: Harvard
University Press.
Anderson, J. E. & van Wincoop, E. (2004). Trade costs. Journal of Economic Literature,
42(3), 691-751.
Barney, J. (1991). Firm resources and sustained competitive advantage. Journal of
Management, 17: 99–120.
Bhattacharyya, B. (1999). Non-Tariff Measures on India’s Exports: An Assessment,
Occasional Paper No. 16, Indian Institute of Foreign Trade, New Delhi.
Bhattacharyya, B. & Mukhopadhya, S. (2002). Non-Tariff Measures on South Asia’s Exports:
An Assessment, August, South Asian Association for Regional Cooperation.
Bilkey, W. J. (1978). An attempted integration of the literature on the export behaviour of
firms. Journal of International Business Studies, 8(1): 33-46.
Brooks, D. H. & Stone, S. F. (2010). Accelerating Regional Integration: Issues at the Border,
ADBI Working Paper Series No: 200.
CLE (2010). Annual Statistics 2008-09. Council for Promotion of Leather Exports, Chennai.
Chaturvedi, S. & Nagpal, G. (2003). WTO and Product-Related Environmental Standards
Emerging Issues and Policy Options, Economic and Political Weekly, 4 January.
DGCI&S (2010). Annual Statistics 2009-10. Ministry of Commerce, Government of India,
New Delhi.
EC (2011). Eurostat, European Commission Office of Statistics, various statistics databases.
Retrieved September 16 2011, from http://epp.eurostat.ec.europa.eu
Economic Survey (2010). Annual Statistics 2009-10. Ministry of Commerce, Government of
India.

23
Hertel, T.W. & Mirza, T. (2009). The Role of Trade Facilitation in South Asian Economic
Integration. In Study on Intraregional Trade and Investment in South Asia, Chapter 2
(12 – 39).
Kaleka, A. & Katsikeas, C.S. (1995). Exporting problems and export involvement: the case
of Greek exporting manufacturers. Journal of Marketing Management, 7(4): 29-57.
Karelakis, C., Mattas, K. & Chryssochoidis, G. (2008). Export problems perceptions and
clustering of Greek wine firms. Euromed Journal of Business, 3 (1): 6-22.
Khorana, S., Perdikis, N., Kerr, W.A. & Yueng, M. (2010). The Era of Bilateral Agreements:
The EU and India in Search of a Partnership (1st ed.) Elgar Publishing.
KPMG (2011) Survey on Bribery and Corruption: Impact on Economy and Business
Environment, KPMG India.
Kneller, R. & Pisu, M. (2011). Barriers to Exporting: What are They and Who do They
Matter? The World Economy, 34(6): 893-930.
Korth, C. M. (1991). Managerial barriers to US exports. Business Horizons, 34(2): 18-26.
Leonidou, L. C. (1995a). Empirical research on export barriers: Review, assessment and
synthesis. Journal of International Marketing, 3(1): 29–43.
Leonidou, L. C. (1995b). Export barriers: Non-exporters perceptions. International
Marketing Review, 12(1): 4–25.
Leonidou, L. C. (2004). An analysis of the barriers hindering small business export
development. Journal of Small Business Management, 42 (3): 279-303.
Mehta, R. (2005). NTBs affecting India’s exports. Research and Information System for the
Non-Aligned and Other Developing Countries: RIS Discussion Paper no: 97.
Melitz, M. J. (2003). The impact of trade on intra-industry reallocations and aggregate
industry productivity. Econometrica, 71(6): 1695-1725
Ministry of Textiles (2010). Annual Report 2009-10, Government of India, New Delhi.

24
Ministry of Textiles (2000). National Textile Policy, Government of India, New Delhi.
Morgan, R. E. (1997). Export stimuli and export barriers: evidence from empirical research
studies. European Business Review, 97(2): 68-79.
Ng Francis, K. T. (2010). Data on Trade and Import Barriers, World Bank. Retrieved May 19
2011, from http://go.worldbank.org/LGOXFTV550
OECD (2005). Analysis of NTBs of Concern to Developing Countries,
TD/TC/WP(2004)47/REV1, Paris.
Ojala, A. (2007). Entry Barriers of Small and Medium-Sized Software Firms in the Japanese
Market. Thunderbird International Business Review, 49(6) 690-705.
Owusu-Frimpong, N. & Mmeih, S. (2007). An Evaluation of the Perceptions and Marketing
Practices of Non-traditional Exporters in Ghana. Thunderbird International Business
Review, Vol. 49(1) 57–76.
Planning Commission of India (n.d). Working Group Report on Shipping and Inland Water
Transport for the 11th Five Year Plan. Government of India.
Rabino, S. (1980). An examination of barriers to exporting encountered by small
manufacturing companies. Management International Review, 20(1): 67–73.
Saqib, M. & Taneja, N. (2005). NTBs and India’s Exports: The Case of ASEAN and Sri
Lanka, Working paper 165, ICRIER.
Sardana, G.D. and Sinha, S.K. (2011). Enhancing firm competitiveness in fast track through
total productive maintenance. International Journal of Indian Culture and Business
Management, 4(1): 88 – 103.
Suarez-Ortega, S.M. (2003). Export barriers: Insights from small and medium-sized firms.
International Small Business Journal, 21(4): 403–19.
World Bank (2009). Doing Business in India 2009. Retrieved September 18 2011, from
http://subnational.doingbusiness.org

25
Table 1: The location of the firms in the sample.
Location Textiles Leather Total
Agra 0 2 2
Bangalore 3 0 3
Chennai 1 6 7
Coimbatore 2 0 2
Delhi 5 7 12
Erode 4 0 4
Gurgaon 4 4 8
Kanpur 0 5 5
Kolkata 0 4 4
Mumbai 5 0 5
Noida 0 2 2
Tirupur 6 0 6
Total 30 30 60

26
Table 2: Descriptive statistics of the variables used in the regression analysis.
Panel A: Textiles and clothing
Variable Obs Mean Std. Dev. Min Max
Customs and documentation 30 2.97 1.07 1 5
Regulations and standards 30 2.53 0.82 1 4
Testing and certification 30 2.30 0.88 1 4
Labelling and packaging 30 2.13 1.14 1 5
Environmental requirements 30 1.80 0.81 1 3
Transport costs 30 2.03 0.76 1 4
Corruption and theft 30 2.47 0.78 1 4
Turnover (million rupees) 30 669.0 1,370 25 7,200
Export experience 30 20.53 13.01 5 78
Distance to port (km) 30 703 534 9 1,421
Panel B: Leather and footwear
Variable Obs Mean Std. Dev. Min Max
Customs and documentation 30 2.67 1.24 1 5
Regulations and standards 30 2.33 1.09 1 5
Testing and certification 30 2.13 1.07 1 5
Labelling and packaging 30 1.90 1.03 1 4
Environmental requirements 30 2.07 1.26 1 5
Transport costs 30 1.97 1.27 1 5
Corruption and theft 30 2.30 1.47 1 5
Turnover (million rupees) 30 527.0 573 50 2,100
Export experience 30 19.83 12.77 5 59
Distance to port (km) 30 859 631 7 1,419
Notes: Customs and documentation, Regulations and standards, Testing and certification, Labelling and
packaging, Environmental requirements, Transport costs, and Corruption and theft are measured on a scale from
1 to 5, with larger numbers indicating greater barriers to trade.
27
Table 3: Regression results for the relationship between firm characteristics and barriers to trade.
Dependent variable
(1) Customs and
documentation
(2) Regulations and
standards
(3) Testing and certification
(4) Labelling and
packaging
(5) Environmental requirements
(6) Transport
costs
(7) Corruption and theft
Ln(Turnover) -0.178 0.030 0.091 0.070 0.005 0.029 0.007
(1.74)* (0.23) (0.84) (0.55) (0.05) (0.30) (0.06)
0.134 0.346 0.162 -0.139 -0.025 -0.417 0.093 Ln(Export
experience) (0.45) (1.45) (0.60) (0.41) (0.08) (1.60) (0.31)
0.248 0.402 0.237 0.223 0.000 0.666 0.983 Distance to port
(0.99) (2.07)** (1.15) (0.86) (0.00) (3.84)*** (4.79)***
Textiles 0.240 0.252 0.237 0.314 -0.262 0.216 0.316
(0.80) (0.96) (0.91) (1.00) (0.95) (0.90) (1.21)
Constant 5.314 0.171 -0.550 0.405 2.295 1.790 0.750
(2.69)*** (0.07) (0.27) (0.16) (1.06) (0.94) (0.36)
R2 0.07 0.12 0.06 0.03 0.02 0.18 0.25
N 60 60 60 60 60 60 60
Notes: * significant at 10%; ** significant at 5%; *** significant at 1%. Estimation method is OLS with standard errors robust to heteroskedasticity; t-statistics are reported in
parentheses. Textiles is a dummy variable which takes a value equal to 1 if the firm is in the textiles and clothing industry, 0 otherwise.

28