barriers to entry and firm performance: a proposed model and curvilinear relationships
TRANSCRIPT
This article was downloaded by: [University of Connecticut]On: 05 October 2014, At: 20:53Publisher: RoutledgeInforma Ltd Registered in England and Wales Registered Number: 1072954 Registeredoffice: Mortimer House, 37-41 Mortimer Street, London W1T 3JH, UK
Journal of Strategic MarketingPublication details, including instructions for authors andsubscription information:http://www.tandfonline.com/loi/rjsm20
Barriers to entry and firm performance:a proposed model and curvilinearrelationshipsFahri Karakaya b & Satyanarayana Parayitam ba Department of Marketing , Charlton College of Business,University of Massachusetts , Dartmouth, North Dartmouth , MA ,02747 , USAb Department of Management , Charlton College of Business,University of Massachusetts , DartmouthPublished online: 19 Dec 2012.
To cite this article: Fahri Karakaya & Satyanarayana Parayitam (2013) Barriers to entry and firmperformance: a proposed model and curvilinear relationships, Journal of Strategic Marketing, 21:1,25-47, DOI: 10.1080/0965254X.2012.734689
To link to this article: http://dx.doi.org/10.1080/0965254X.2012.734689
PLEASE SCROLL DOWN FOR ARTICLE
Taylor & Francis makes every effort to ensure the accuracy of all the information (the“Content”) contained in the publications on our platform. However, Taylor & Francis,our agents, and our licensors make no representations or warranties whatsoever as tothe accuracy, completeness, or suitability for any purpose of the Content. Any opinionsand views expressed in this publication are the opinions and views of the authors,and are not the views of or endorsed by Taylor & Francis. The accuracy of the Contentshould not be relied upon and should be independently verified with primary sourcesof information. Taylor and Francis shall not be liable for any losses, actions, claims,proceedings, demands, costs, expenses, damages, and other liabilities whatsoever orhowsoever caused arising directly or indirectly in connection with, in relation to or arisingout of the use of the Content.
This article may be used for research, teaching, and private study purposes. Anysubstantial or systematic reproduction, redistribution, reselling, loan, sub-licensing,systematic supply, or distribution in any form to anyone is expressly forbidden. Terms &Conditions of access and use can be found at http://www.tandfonline.com/page/terms-and-conditions
Barriers to entry and firm performance: a proposed model andcurvilinear relationships
Fahri Karakayaa* and Satyanarayana Parayitamb
aDepartment of Marketing, Charlton College of Business, University of Massachusetts, Dartmouth,North Dartmouth, MA 02747, USA; bDepartment of Management, Charlton College of Business,
University of Massachusetts, Dartmouth
(Received 15 May 2012; final version received 20 September 2012)
This research examines the relationships among the barriers to market entry: capitalrequirements; competitive advantage of incumbent firms; business environment; andfirm competence, and their relationship to firm performance. Through a mail survey,data were collected on a sample of 190 companies. A hierarchical regression analysisenabled the assessment of the relationships among barriers to entry and firmperformance. In addition, the paper examines the quadratic function of second degreeamong the variables to see the curvilinear relationships between independent anddependent variables. The results indicate the presence of curvilinear relationshipsbetween some barriers for market entrants and performance of market entrants. Whilethe examination of linear relationships between barriers and firm performance isimportant, the analyses of curvilinear relationships shed more light into ourunderstanding of barriers and performance. Therefore this study contributes to theliterature by highlighting the importance of U-shaped and inverted curvilinearrelationships between barriers to entry and firm performance.
Keywords: barriers to entry; market entry barriers; market entry; competition;competitive advantage; capital requirements; firm competence; firm performance;curvilinear relationship
Introduction
Barriers to market entry are factors that influence firm profitability by preventing new
competitors from entering markets (Bain, 1956; Karakaya & Stahl, 1989; Porter, 1985;
Simon, 1996, 2005). Bain (1956, p. 3), who pioneered the concept of barriers to entry,
defined barriers as:
the advantage of established sellers in an industry over potential entrant sellers, theiradvantages being reflected in the extent to which established sellers can persistently raise theirprices above a competitive level without attracting new firms to enter the industry.
Incumbent firms raise barriers to entry to limit the number of competitors in a market.
As a result, the incumbent firms enjoy supernormal long-term industry profits (Han, Kim, &
Kim, 2001). The extant literature highlights six major barriers to entry: cost advantages of
incumbent firms; capital requirements; product differentiation advantages of incumbent
firms; access to distribution channels; customer switching costs; and government
regulations (Karakaya & Stahl, 1989; Porter, 1985). More recently, Karakaya and Kerin
(2007) examined additional barriers to entry that included incumbent structural advantage,
q 2013 Taylor & Francis
*Email: [email protected]
Journal of Strategic Marketing, 2013
Vol. 21, No. 1, 25–47, http://dx.doi.org/10.1080/0965254X.2012.734689
Dow
nloa
ded
by [
Uni
vers
ity o
f C
onne
ctic
ut]
at 2
0:53
05
Oct
ober
201
4
incumbent market strength, and financial investment of both incumbent firms and market
entrants.
Barriers to entry affect the competitive behavior of both potential market entrants and
incumbent firms. The ability to create or heighten barriers influences each incumbent
firm’s strategy and choice of action which in turn affect profitability. Consequently,
barriers to entry influence the market entrants’ decision to enter markets and their
formulation of competitive strategies (Pehrsson, 2009). Incumbent firms intentionally
build barriers to deter market entry (Gruca & Sudharshan, 1995) to dominate the market
and maximize profits. Indeed, when barriers to entry exist, incumbent firms engage in less
deterrence or defensive actions (Burch & Smiley, 1992; Karakaya & Yannopoulos, 2010).
Strong barriers do not just protect the incumbents before market entry. They safeguard
them even after initial market entry by slowing down the speed of entry, enabling them to
catch up with the new market entrants (Han et al., 2001). However, barriers to entry
provide little protection for incumbents if market entrants have innovative products (Han
et al., 2001; Markides, 1997). This is also true with innovative channels such as
eCommerce. For example, travel services such as Expedia, Travelocity, and Priceline
successfully entered the US market in the mid-1990s and were able to successfully expand
their markets to other countries. With the Internet as a new distribution channel, Apple’s
ITunes business practically rejuvenated Apple Inc., leading to other innovative and
successful products such as the IPhone, Apple TV, and Ipad.
Rationale for the present study
Previous research on the relationship between barriers to entry and firm performance
supports that higher barriers lead to lower firm performance (Cicic, Patterson, & Shoham,
2002; Patterson & Cicic, 1995; Shoham & Albaum, 1995). However, this is only true for
new market entrants. The presence of high barriers in a market forces new market entrants
to allocate more resources to overcome barriers, adversely affecting firm performance.
Literature review indicates that previous studies have not considered the interrelationships
among barriers to entry and their individual impact on firm performance (Karakaya &
Kerin, 2007). For example one of the most recent studies related to this topic was
conducted by Johnson and Tellis (2008) where the authors mostly ignored the impact of
barriers to entry when examining the drivers of success for market entry into China and
India. The rationale for the present study stems from the following reasons: (1) there is no
prior empirical research that studies the complex interrelationships among the barriers to
entry and firm performance; (2) the available existing research studies are mostly
descriptive and are scattered, focusing on the linear relationship between barriers to entry
and firm performance; (3) the relationships among the barriers to entry are more complex
than were hypothesized in earlier studies, for example, one barrier may lead to another
(capital requirements may lead to competitive advantage); (4) the conflicting results that
were found in earlier studies necessitate in-depth study of relationships among variables;
and (5) specification of a new model depicting the relationships. With the above rationale,
the present research addresses the shortcomings of previous research and builds a more
robust and sophisticated model of entry barriers. More specifically, this research attempts
to fill the void on interrelationships among barriers by developing a model that focuses on
capital requirements, unfavorable business environment, firm competence of market
entrants, and competitive advantage of incumbent firms as barriers for market entrants. We
select market entry into eCommerce markets to conduct this study because there have been
innumerable entries into and exit from the market since the emergence of the eCommerce
F. Karakaya and S. Parayitam26
Dow
nloa
ded
by [
Uni
vers
ity o
f C
onne
ctic
ut]
at 2
0:53
05
Oct
ober
201
4
industry in the early 1990s (see Cochran, Darrat, & Elkhal, 2006). Furthermore,
eCommerce will become important even for companies that are brick and mortar today
and will determine their success (Fruhling & Digman, 2000).
Theoretical background and hypotheses
Resource-based view and barriers to entry
The barriers such as capital requirements, competitive advantage, firm competence and
even the business environment to a certain extent are related to the resources a company
has. Thus, we use the resource-based view (RBV) as a theoretical platform for explaining
the relationship between barriers to entry and firm performance. According to RBV, which
is well documented in the literature (see, for example, Mahoney, 1995), firm resources are
primary predictors of superior performance (Wernerfelt, 1984). Firm resources help
organizations build competitive advantage. Indeed, RBV defines important factors that
relate to developing sustainable competitive advantage (Barney, 1986; Dierickx & Cool,
1989; Kor & Mahoney, 2004; Peteraf & Barney, 2003; Wernerfelt, 1984). These factors
are resources that are rare, unique, valuable, not perfectly imitable by competitors, and
competitively superior (Priem & Butler, 2001). Proponents of RBV argue that resources
possessing these characteristics ultimately lead to higher firm performance through
sustained competitive advantage (Barney, 1991). According to Grant (1991), major
sources of barriers to entry include economies of scale, having patent(s), experience, brand
reputation, or some other resource that incumbent firms enjoy but take time to acquire. The
resources relating to barriers to entry are categorized as financial capital, physical capital,
human capital, and organizational capital (Barney, 1991).
Lack of resources impacts the perception of business environment. When market
entrants perceive lack of resources (e.g. unavailability of financial capital), they also
perceive an unfavorable business environment because they do not have the means to deal
with such uncontrollable or uncertain environment. Similarly, when market entrants
perceive lack of resources (e.g. capital), they also perceive that their firm does not have
competence. Therefore, lack of firm competence is rooted in the RBV theory, and it is a
major barrier to entry. For example, previous research has linked information technology
capability to firm performance (Bharadwaj, 2000; Wade & Holland, 2004). Other
researchers have indicated that eCommerce adoption is related to technology competence
(Stockdale & Standing, 2004, 2006; Zhu, Kraemer, & Xu, 2003), technical resource
competence (To & Ngai, 2006), technical know-how (Darch & Lucas, 2002), and
organizational readiness (Hadaya & Pellerin, 2008). Potential market entrants lacking
technical or non-technical competencies face barriers to entry. On the other hand,
incumbent firms with strong competencies deter market entry of new firms into their
markets because potential market entrants perceive incumbent competencies as a major
barrier to overcome. Hence, resources are the key to building competence and securing
sustained competitive advantage to deter market entry of new competition.
Effects of capital requirements and business environment on competitive advantage
The barrier of capital requirements is one of the most important obstacles to market entry
for competition. High capital requirements limit the number of firms in a market and allow
the incumbent firms to maximize their market share and profits. Moreover, the presence of
high capital requirements increases the competitive advantage of incumbent firms. Based
on RBV, availability of resources generates competitive advantage (Barney, 1986;
Journal of Strategic Marketing 27
Dow
nloa
ded
by [
Uni
vers
ity o
f C
onne
ctic
ut]
at 2
0:53
05
Oct
ober
201
4
Dierickx & Cool, 1989; Wernerfelt, 1984). For example, when firms have sufficient
financial resources, the capital requirement barrier is low and insignificant. Indeed,
previous research indicates that firms with adequate resources are likely to develop
competitive advantage such as product differentiation which results from product
characteristics including physical, service, and image (Sashi & Stern, 1995). Another
important competitive advantage is cost. When incumbent firms have cost advantages and
charge low prices, they deter entry of new competition into their markets (Coeurderoy &
Dur &, 2004; Karakaya & Stahl, 1989, 1992; Porter, 1985). Cost advantages are related to
a firm’s internal or external environment, rooted in resources. Firms with adequate
resources are likely to develop technology and processes in their operations that achieve
cost advantages.
Unfavorable business environments such as distribution channels, inability to meet
demand and security issues (Razi, Tarn, & Siddiqui, 2004) do not just act as barriers to
entry for the potential market entrants; they provide competitive advantage for the
incumbent firms, simply by limiting the number of firms that can enter the market.
For example, many small manufacturers see access to distribution channels as a barrier
to reaching consumers because distributors are selective in choosing their vendors.
In addition, retail stores such as supermarkets charge high fees for shelf space (Rennhoff,
2008), which puts the smaller companies at a disadvantageous position. Based on the
above we offer the following hypotheses:
H1: Capital Requirements barrier for market entrants is positively related to
Competitive Advantage of incumbent firms.
H2: Unfavorable Business Environment barrier for market entrants is positively related
to Competitive Advantage of incumbent firms.
Effects of capital requirements and unfavorable business environment barriers for
market entrants on perceived firm competence of market entrants
As indicated earlier, firm competence or the lack thereof is an important barrier to market
entry. Previous research indicates that there is a relationship between IT capability
and adoption of new innovation, which in turn affects firm competence (Iacovou,
Benbasatand, & Dexter, 1995). For example, the technical complexity of new innovation
is a major determinant of product adoption (Agarwal & Prasad, 1998; Cooper & Zmud,
1990; Forman, 2005). Technical complexity of new products and technology is related to
the skills and knowledge of employees. A study conducted by Darch and Lucas (2002)
showed that lack of knowledge and technological skills were barriers to engaging in
eCommerce for Small and Medium Enterprises (SMEs). Lack of knowledge and skills are
more apparent in SMEs relative to large firms (Duan, Mullins, Hamblin, & Stanek, 2002).
Lack of skills and knowledge create the perception of inability to successfully utilize new
products or technology. Related to the preceding factors, technical know-how and
insufficient infrastructure are also related to firm competence and have been shown to
serve as barriers to eCommerce adoption (Dubelaar, Sohal, & Savic, 2005). In addition,
employee skills and knowledge are closely linked to firm competence (Ruiz-Ortega &
Garcıa-Villaverde, 2008) whereas a skilled and knowledgeable work force is crucial in the
successful implementation of technology (Allison, 1999). However, the shortage of skilled
employees has been recognized as one of the major problems that firms face (Bingi, Mir, &
Khamalah, 2000) and is a barrier for eCommerce adoption and its successful
implementation (Duan et al., 2002).
F. Karakaya and S. Parayitam28
Dow
nloa
ded
by [
Uni
vers
ity o
f C
onne
ctic
ut]
at 2
0:53
05
Oct
ober
201
4
Availability of financial and non-financial resources eliminates or reduces many of the
weaknesses just mentioned, thus lowering the capital requirements barrier and
strengthening firm competence. Based on the resource-based theory, business
environment (positive or negative) can have an impact on firm competence. For example,
the business environment impacts the availability of skilled employees and access to
distribution channels. Previous research linked business environment (external
environment) to firm competence (Collis & Montgomery, 2008). If business environment
is sound (e.g. availability of skilled employees, technical know-how, etc.) new firms may
enter the market and compete with the existing firms. Therefore, a dynamic business
environment hinders performance of both market entrants and the incumbent firms and
adversely affects firm competence. Based on the above arguments, we propose the
following hypotheses:
H3: Capital Requirements barrier for market entrants is negatively related to Market
Entrant Competence.
H4: Unfavorable Business Environment for market entrants is negatively related to
Market Entrant Competence.
Effects of competitive advantage and firm competence on firm performance
Competitive advantage and firm competence play an important role in determining
company effectiveness (Fuentelsaz, Gomez, & Polo, 2002). Indeed, Porter (1985) suggests
that competitive advantage is the main objective of a firm in competitive markets.
Competitive advantage consists of many variables such as cost advantage, product
differentiation, proprietary product technology or trade secrets, and so on, and they serve
as barriers for market entrants. However, the variables that determine competitive
advantage do change and the firms that follow the changes are more successful than the
ones that do not (Olusoga, Mokwa, & Noble, 1995). Tippins and Sohi (2003) indicate that
IT competence consists of technical knowledge; extent of IT usage; and computer-based
hardware, software, and support personnel, all of which can translate into competitive
advantage. While the competitive advantage of the focal firm is positively related to firm
performance, the competitive advantage enjoyed by a rival firm will result in lowering the
focal firm’s performance. For example, a study by Coltman, Devinney, and Midgley
(2007) showed that firms could expect significant e-business performance when their IT
capability is at an advanced stage. In addition, the study by Tippins and Sohi (2003)
indicated that organizational learning plays an important role in mediating the influence of
IT competency on firm performance. Similarly, Santhanam and Hartono (2003) specified
that superior IT capability leads to superior and sustained firm performance.
This discussion leads us to suggest the following hypotheses:
H5: Competitive Advantage of incumbent firms is negatively related to market entrant
performance.
H6: Firm Competence of market entrants is positively related to market entrant
performance.
Curvilinear effect of capital requirements and business environment on performance
The capital needed continues long after a company enters a market. Two studies, Coltman
et al. (2007) and Thornton and Marche (2003), dealing with the relationship between
financial barriers and firm performance, provide conflicting evidence. The study by
Journal of Strategic Marketing 29
Dow
nloa
ded
by [
Uni
vers
ity o
f C
onne
ctic
ut]
at 2
0:53
05
Oct
ober
201
4
Thornton and Marche (2003) showed that many new market entrants indeed failed because
they were unable to secure sufficient funds from either venture capitalists or generate the
funds themselves. On the other hand, the research by Coltman et al. (2007) showed no
relationship between performance and financial barriers for aggregate analysis of the total
sample. However, the study indicated significant relationships when the authors used a
segmentation-based approach of latent variables modeling for the segment of firms driven
by organizational and financial constraints.
Many start-up firms entering markets require additional funding because they may not
earn any profit for some years. For example, Amazon.com did not report any profit until
2003 although it was launched in 1995. While capital requirements adversely affect firm
performance at the beginning, as the financial requirements increase, the height of entry
barriers increases, thereby preventing the new firms to enter the market. As a consequence,
the firm performance will increase eventually. Therefore, we expect a U-shaped
relationship between capital requirements and firm performance. This curvilinear
relationship may also explain the reasons why the earlier studies (Coltman et al., 2007;
Thornton & Marche, 2003) found conflicting results.
On the contrary, during initial market entry situations when the business environment
barrier is usually high, the incumbent firm performance increases because of the small
number of competitors in the market. This is also partially due to first mover advantages
held by incumbent firms (Usero & Fernandez, 2009). As the business environment barrier
becomes lower, new firms are able to enter the market. Some followers or later market
entrants are more successful than others. For example, the followers that take non-market
actions are more successful than the followers that take more market actions (Usero &
Fernandez, 2009). As a result, the firm performance of incumbent firms will gradually
decrease. Therefore, we expect an inverted U-shaped relationship between unfavorable
business environment barrier and market entrant performance. This is also consistent with
the order of market entry literature that provides abundant examples of early and late
market entry advantages such as better products, higher market shares and profits (see De
Castro & Chrisman, 1995; Kerin, Varadarajan, & Peterson, 1992; Robinson & Fornell,
1985; Usero & Fernandez, 2009). Based on the above opinions, we offer the following
hypotheses:
H7: The relationship between Capital Requirements barrier for market entrants and
Market Entrant Performance is U-shaped.
H8: The relationship between Unfavorable Business Environment barrier for market
entrants and Market Entrant Performance is inverted U-shaped.
A conceptual model showing the relationships among the barriers, and performance
and the hypotheses is presented in Figure 1.
Methodology
Data collection
One thousand businesses located in the USA were randomly selected from a mailing list of
e-corporations directory. The business executives listed as the contact persons were
described as ‘top level professionals who are responsible for strategic business decisions
relating to the Internet’. A cover letter and the questionnaire were mailed to the selected
executives in the mailing list during spring 2009. A promise to provide the summary
results of the study was offered as an incentive to complete the survey. Thirty-two surveys
F. Karakaya and S. Parayitam30
Dow
nloa
ded
by [
Uni
vers
ity o
f C
onne
ctic
ut]
at 2
0:53
05
Oct
ober
201
4

were returned as non-deliverable or incomplete. Two hundred and three surveys were
completed, and 190 were fully usable for the purpose of this study.
Of the responding companies, 53% were in manufacturing, 26% in service, 7% in
distribution, 4% in retail, and 2% in software industries. Sixty-six percent of the
respondents had revenues under one million dollars coming directly from eCommerce
operations, while 3% had revenues over $15 million attributable to eCommerce. The
average age of the responding companies was 29 years with a minimum of zero (six
months) and a maximum 150 years. The size of the responding companies ranged from
one to 40,000 with a mean of 1017 employees. Of the responding firms, 22 were pure
online, 148 were brick and click, and 20 were brick and mortar.
Non-response bias was assessed following the procedures developed by Armstrong
and Overton (1977). The early respondents were defined as the first one-third of all
respondents in the data set, whereas the late respondents were the last one-third of all
respondents. The early and late respondents were compared on their responses. T-tests
showed that none of the 27 barriers in the survey differed in magnitude between early and
late respondents at p ¼ .05 significance level.
Measures, reliability, and validity
Using the literature on barriers to market entry, 27 potential barriers that were applicable
for the selected sample were identified (Karakaya &Kerin, 2007; Karakaya & Stahl, 1992).
The measurement of the barriers was adapted from the approaches used by Gruca and
Sudharshan (1995); Han, Kim, and Kim (2001); Karakaya and Kerin (2007); and Karakaya
and Stahl (1992). A six-point Likert scale ranging from ‘extremely high barrier’ to ‘not a
barrier’ was used. The respondents were asked to indicate their perception of the height of
each market entry barrier before market entry. In order to assure content validity of the
H7: U–shaped
H4
H1
H5H3
H2
H6
Capital RequirementsBarrier for Market
Entrants
Unfavorable BusinessEnvironment Barrier for
Market Entrants
Firm CompetenceBarrier for Market
Entrants
Market EntrantPerformance
Competitive Advantage ofIncumbent Firms Barrier
for Market Entrants
Linear relationshipsCurvilinear relationships H8: Inverted
U-shaped
Figure 1. Conceptual model and hypothesized relationships.
Journal of Strategic Marketing 31
Dow
nloa
ded
by [
Uni
vers
ity o
f C
onne
ctic
ut]
at 2
0:53
05
Oct
ober
201
4
questionnaire, the surveywas pre-testedwith 10 local eCommerce executives. Thewording
of a few questions was slightly modified based on their feedback.
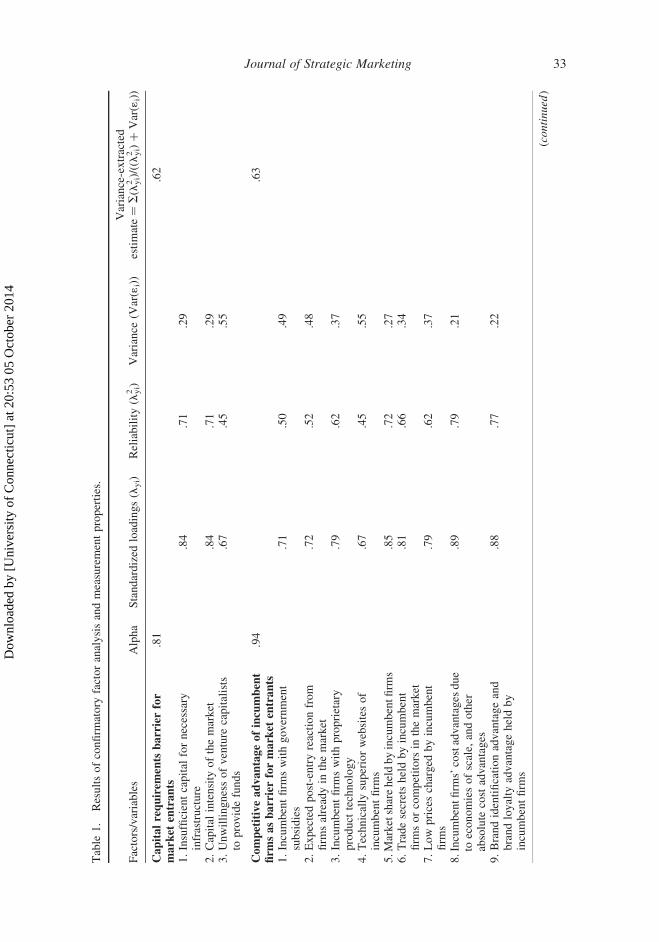
We followed the procedures outlined by Anderson and Gerbing (1988) by assessing
the reliability and unidimensionality of each construct. We conducted a confirmatory
factor analysis (CFA) using Lisrel. All of the items loaded on their respective constructs
were statistically significant. The results of the CFA for all variables and the measurement
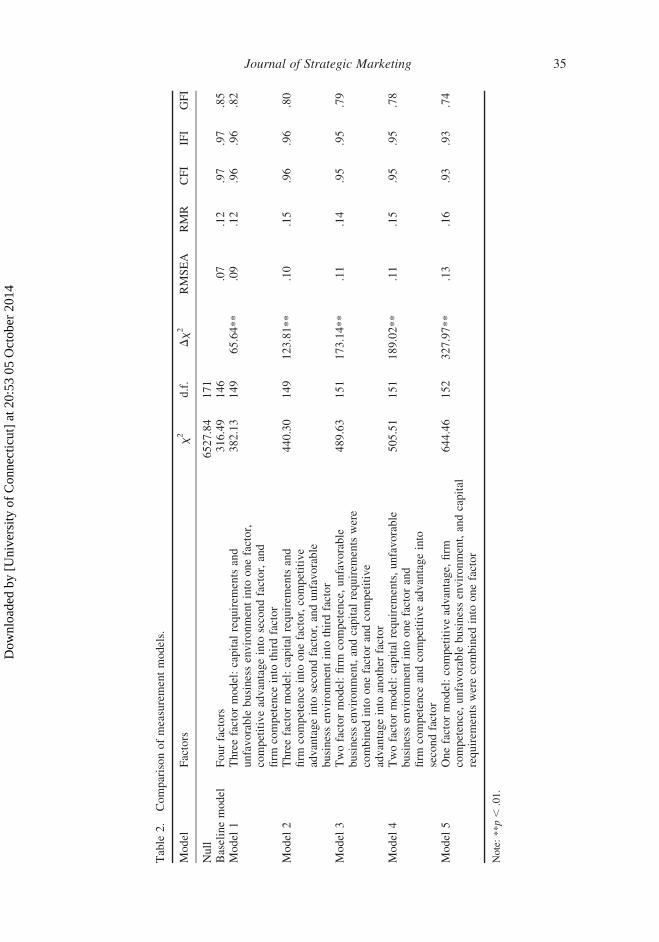
properties are reported in Table 1. We also checked the measurement properties of the
variables by comparing the baseline model with five alternate models. The comparison of
these models with the baseline model presented in Table 2 reveals the following goodness
of fit statistics: x2 ¼ 316.49 with d.f. ¼ 146; x2/d.f. ¼ 2.167; GFI ¼ 0.85; CFI ¼ 0.97;
RMSEA ¼ 0.07. Overall, these results suggest that the four-factor model renders evidence
of construct distinctiveness for firm competence, business environment, competitive
advantage, and capital requirements.
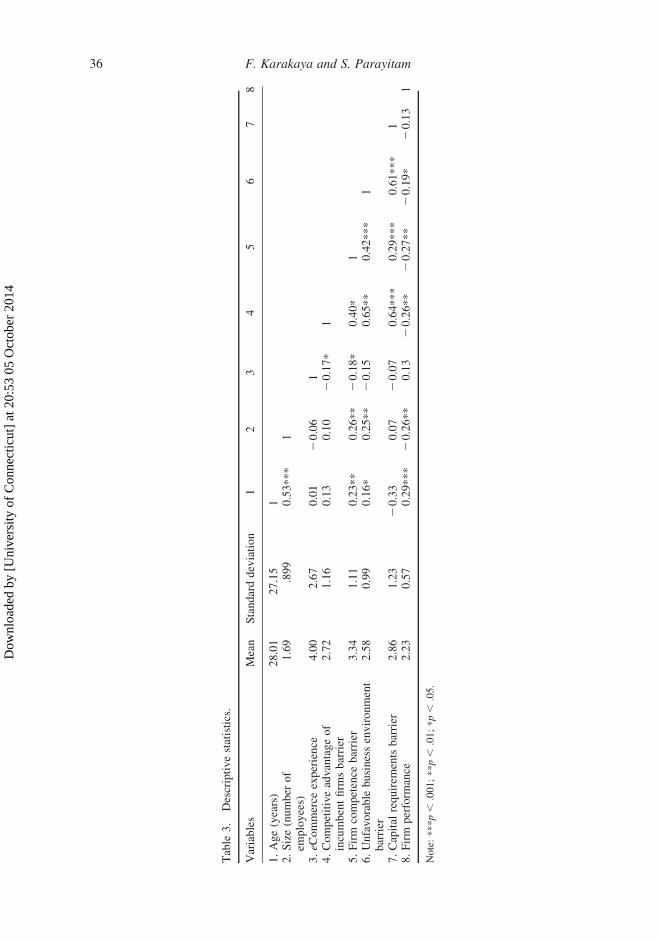
We further tested for discriminant validity by following the procedures outlined by
Fornell and Larcker (1981). We compared the square roots of the average variance
extracted (AVE) estimates of the measures with the correlation between constructs
(Table 3). The square roots of the AVEs (.79, .79, .68, and .71) are greater than all of the
corresponding correlations, thus indicating adequate discriminant validity.
As is the case in survey research, common method variance is a widely discussed and
complex problem (Podsakoff, MacKenzie, Lee, & Podsakoff, 2003). From a
methodological standpoint, since we collected data from a single source, it is possible
that self-report and mono-method bias may threaten the validity of research (Podsakoff &
Organ, 1986). At the conceptual level, we addressed the problem by using the manifest
variables that are theoretically representative measures of latent constructs and
measurements that are unambiguous. In order to minimize the common-method bias,
we followed the procedures outlined by Podsakoff and Organ (1986) and conducted
Harman’s one factor test. More than a single factor emerged demonstrating that common
method variance does not exist. The social desirability effect was also addressed by having
the survey completed anonymously.
The capital requirements barrier for market entrants included items that assess the
market entrant’s perceptions of capital intensity of the market, willingness of venture
capitalists to provide funds, and the necessary capital for infrastructure. The reliability for
the capital requirements scale was strong, with an alpha of .81.
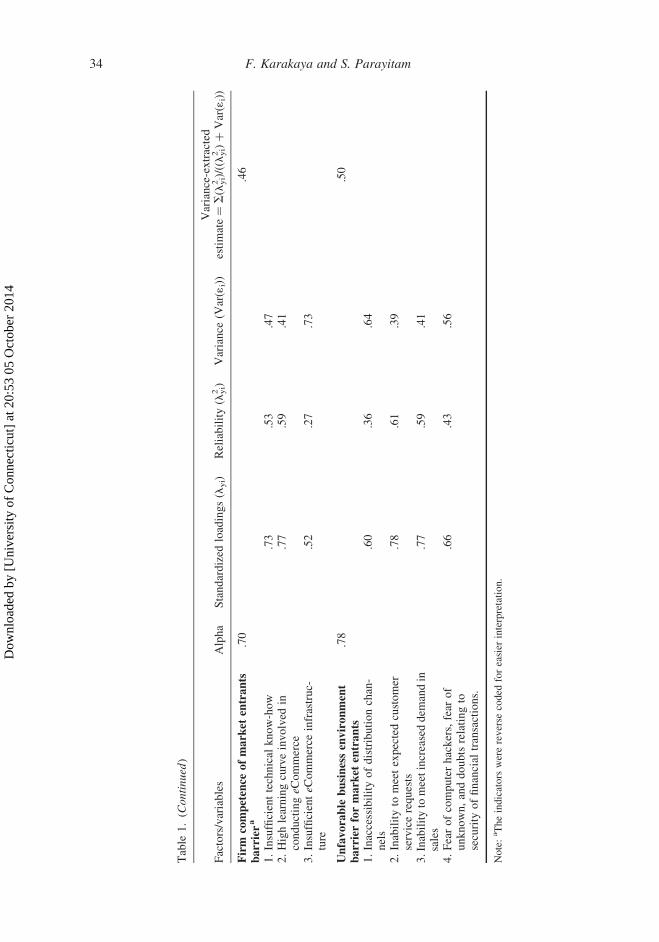
We measured the unfavorable business environment barrier for market entrants with
four items, on a six-point scale, drawing from the literature (Dubelaar et al., 2005; Razi
et al., 2004; Wen & Tarn, 2001). Unfavorable business environment is usually caused by
factors external to market entrants, but some external factors are likely to cause internal
problems. For example, inability to meet increased demand may be due to lack of supply
which then causes market entrants to view the business environment as negative. The
following items assessed the market entrant’s perception of the business environment:
inaccessibility of distribution channels; eCommerce security issues; inability to meet
increased demand; and inability to meet expected customer service requirements. The
alpha for the aggregated measure was .78.
We measured the competitive advantage of incumbent firms barrier for market entrants
using nine items, on a six-point scale, adapted from Karakaya and Kerin (2007) and
Karakaya and Stahl (1992). This measure captured the perception of the market entrants
about the competitive advantage enjoyed by the incumbent firms. The sample items of this
measure read as ‘Cost advantage of incumbent firms’, ‘Brand loyalty advantage of
incumbent firms’, ‘Trade secrets held by incumbent firms or competitors in the market’,
F. Karakaya and S. Parayitam32
Dow
nloa
ded
by [
Uni
vers
ity o
f C
onne
ctic
ut]
at 2
0:53
05
Oct
ober
201
4
Table
1.
Resultsofconfirm
atory
factoranalysisandmeasurementproperties.
Factors/variables
Alpha
Standardized
loadings(l
yi)
Reliability(l
2 yi)
Variance
(Var(1
i))
Variance-extracted
estimate¼
S(l
2 yi)/((l
2 yi)þ
Var(1
i))
Capitalrequirem
ents
barrierfor
market
entrants
.81
.62
1.Insufficientcapital
fornecessary
infrastructure
.84
.71
.29
2.Capital
intensity
ofthemarket
.84
.71
.29
3.Unwillingnessofventure
capitalists
toprovidefunds
.67
.45
.55
Competitiveadvantageofincumbent
firm
sasbarrierformarket
entrants
.94
.63
1.Incumbentfirm
swithgovernment
subsidies
.71
.50
.49
2.Expectedpost-entryreactionfrom
firm
salreadyin
themarket
.72
.52
.48
3.Incumbentfirm
swithproprietary
product
technology
.79
.62
.37
4.Technically
superiorwebsitesof
incumbentfirm
s.67
.45
.55
5.M
arketshareheldbyincumbentfirm
s.85
.72
.27
6.Tradesecretsheldbyincumbent
firm
sorcompetitors
inthemarket
.81
.66
.34
7.Low
pricescharged
byincumbent
firm
s.79
.62
.37
8.Incumbentfirm
s’costadvantages
due
toeconomiesofscale,
andother
absolute
costadvantages
.89
.79
.21
9.Brandidentificationadvantageand
brandloyalty
advantageheldby
incumbentfirm
s
.88
.77
.22
(continued
)
Journal of Strategic Marketing 33
Dow
nloa
ded
by [
Uni
vers
ity o
f C
onne
ctic
ut]
at 2
0:53
05
Oct
ober
201
4
Table
1.(C
ontinued
)
Factors/variables
Alpha
Standardized
loadings(l
yi)
Reliability(l
2 yi)
Variance
(Var(1
i))
Variance-extracted
estimate¼
S(l
2 yi)/((l
2 yi)þ
Var(1
i))
Firm
competence
ofmarket
entrants
barriera
.70
.46
1.Insufficienttechnical
know-how
.73
.53
.47
2.Highlearningcurveinvolved
inconductingeC
ommerce
.77
.59
.41
3.InsufficienteC
ommerce
infrastruc-
ture
.52
.27
.73
Unfavorable
businessenvironment
barrierformarket
entrants
.78
.50
1.Inaccessibilityofdistributionchan-
nels
.60
.36
.64
2.Inabilityto
meetexpectedcustomer
servicerequests
.78
.61
.39
3.Inabilityto
meetincreaseddem
andin
sales
.77
.59
.41
4.Fearofcomputerhackers,fear
of
unknown,anddoubtsrelatingto
security
offinancial
transactions.
.66
.43
.56
Note:aTheindicators
werereverse
coded
foreasier
interpretation.
F. Karakaya and S. Parayitam34
Dow
nloa
ded
by [
Uni
vers
ity o
f C
onne
ctic
ut]
at 2
0:53
05
Oct
ober
201
4
Table
2.
Comparisonofmeasurementmodels.
Model
Factors
x2
d.f.
Dx2
RMSEA
RMR
CFI
IFI
GFI
Null
6527.84
171
Baselinemodel
Fourfactors
316.49
146
.07
.12
.97
.97
.85
Model
1Threefactormodel:capital
requirem
entsand
unfavorable
businessenvironmentinto
onefactor,
competitiveadvantageinto
secondfactor,and
firm
competence
into
thirdfactor
382.13
149
65.64**
.09
.12
.96
.96
.82
Model
2Threefactormodel:capital
requirem
entsand
firm
competence
into
onefactor,competitive
advantageinto
secondfactor,andunfavorable
businessenvironmentinto
thirdfactor
440.30
149
123.81**
.10
.15
.96
.96
.80
Model
3Twofactormodel:firm
competence,unfavorable
businessenvironment,andcapital
requirem
entswere
combined
into
onefactorandcompetitive
advantageinto
another
factor
489.63
151
173.14**
.11
.14
.95
.95
.79
Model
4Twofactormodel:capital
requirem
ents,unfavorable
businessenvironmentinto
onefactorand
firm
competence
andcompetitiveadvantageinto
secondfactor
505.51
151
189.02**
.11
.15
.95
.95
.78
Model
5Onefactormodel:competitiveadvantage,firm
competence,unfavorable
businessenvironment,andcapital
requirem
entswerecombined
into
onefactor
644.46
152
327.97**
.13
.16
.93
.93
.74
Note:**p,
.01.
Journal of Strategic Marketing 35
Dow
nloa
ded
by [
Uni
vers
ity o
f C
onne
ctic
ut]
at 2
0:53
05
Oct
ober
201
4
Table
3.
Descriptivestatistics.
Variables
Mean
Standarddeviation
12
34
56
78
1.Age(years)
28.01
27.15
12.Size(number
of
employees)
1.69
.899
0.53***
1
3.eC
ommerce
experience
4.00
2.67
0.01
20.06
14.Competitiveadvantageof
incumbentfirm
sbarrier
2.72
1.16
0.13
0.10
20.17*
1
5.Firm
competence
barrier
3.34
1.11
0.23**
0.26**
20.18*
0.40*
16.Unfavorable
businessenvironment
barrier
2.58
0.99
0.16*
0.25**
20.15
0.65**
0.42***
1
7.Capital
requirem
entsbarrier
2.86
1.23
20.33
0.07
20.07
0.64***
0.29***
0.61***
18.Firm
perform
ance
2.23
0.57
0.29***
20.26**
0.13
20.26**
20.27**
20.19*
20.13
1
Note:***p,
.001;**p,
.01;*p,
.05.
F. Karakaya and S. Parayitam36
Dow
nloa
ded
by [
Uni
vers
ity o
f C
onne
ctic
ut]
at 2
0:53
05
Oct
ober
201
4
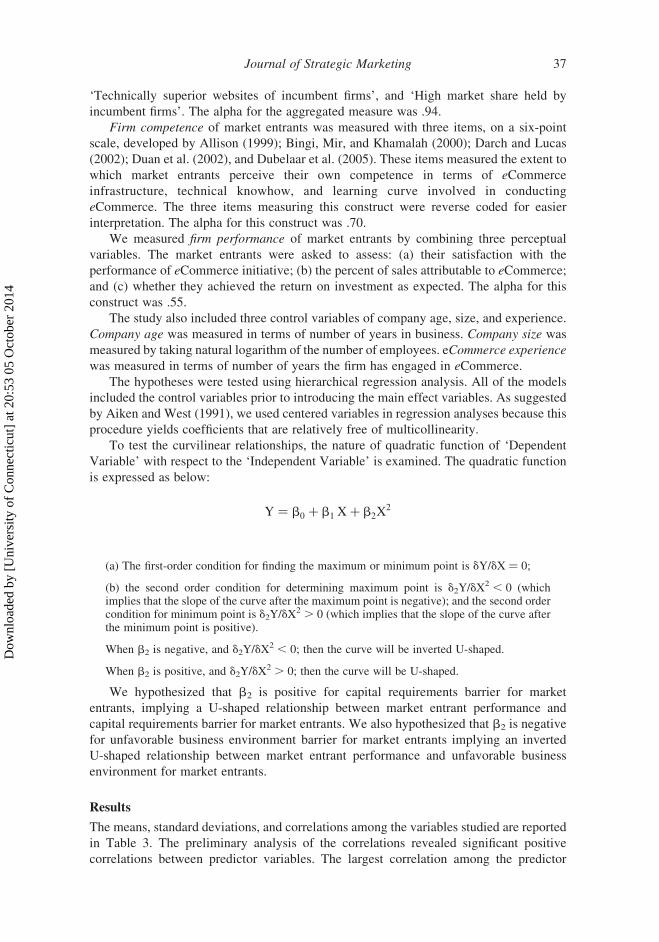
‘Technically superior websites of incumbent firms’, and ‘High market share held by
incumbent firms’. The alpha for the aggregated measure was .94.
Firm competence of market entrants was measured with three items, on a six-point
scale, developed by Allison (1999); Bingi, Mir, and Khamalah (2000); Darch and Lucas
(2002); Duan et al. (2002), and Dubelaar et al. (2005). These items measured the extent to
which market entrants perceive their own competence in terms of eCommerce
infrastructure, technical knowhow, and learning curve involved in conducting
eCommerce. The three items measuring this construct were reverse coded for easier
interpretation. The alpha for this construct was .70.
We measured firm performance of market entrants by combining three perceptual
variables. The market entrants were asked to assess: (a) their satisfaction with the
performance of eCommerce initiative; (b) the percent of sales attributable to eCommerce;
and (c) whether they achieved the return on investment as expected. The alpha for this
construct was .55.
The study also included three control variables of company age, size, and experience.
Company age was measured in terms of number of years in business. Company size was
measured by taking natural logarithm of the number of employees. eCommerce experience
was measured in terms of number of years the firm has engaged in eCommerce.
The hypotheses were tested using hierarchical regression analysis. All of the models
included the control variables prior to introducing the main effect variables. As suggested
by Aiken and West (1991), we used centered variables in regression analyses because this
procedure yields coefficients that are relatively free of multicollinearity.
To test the curvilinear relationships, the nature of quadratic function of ‘Dependent
Variable’ with respect to the ‘Independent Variable’ is examined. The quadratic function
is expressed as below:
Y ¼ b0 þ b1 Xþ b2X2
(a) The first-order condition for finding the maximum or minimum point is dY/dX ¼ 0;
(b) the second order condition for determining maximum point is d2Y/dX2 , 0 (which
implies that the slope of the curve after the maximum point is negative); and the second ordercondition for minimum point is d2Y/dX
2 . 0 (which implies that the slope of the curve afterthe minimum point is positive).
When b2 is negative, and d2Y/dX2 , 0; then the curve will be inverted U-shaped.
When b2 is positive, and d2Y/dX2 . 0; then the curve will be U-shaped.
We hypothesized that b2 is positive for capital requirements barrier for market
entrants, implying a U-shaped relationship between market entrant performance and
capital requirements barrier for market entrants. We also hypothesized that b2 is negative
for unfavorable business environment barrier for market entrants implying an inverted
U-shaped relationship between market entrant performance and unfavorable business
environment for market entrants.
Results
The means, standard deviations, and correlations among the variables studied are reported
in Table 3. The preliminary analysis of the correlations revealed significant positive
correlations between predictor variables. The largest correlation among the predictor
Journal of Strategic Marketing 37
Dow
nloa
ded
by [
Uni
vers
ity o
f C
onne
ctic
ut]
at 2
0:53
05
Oct
ober
201
4
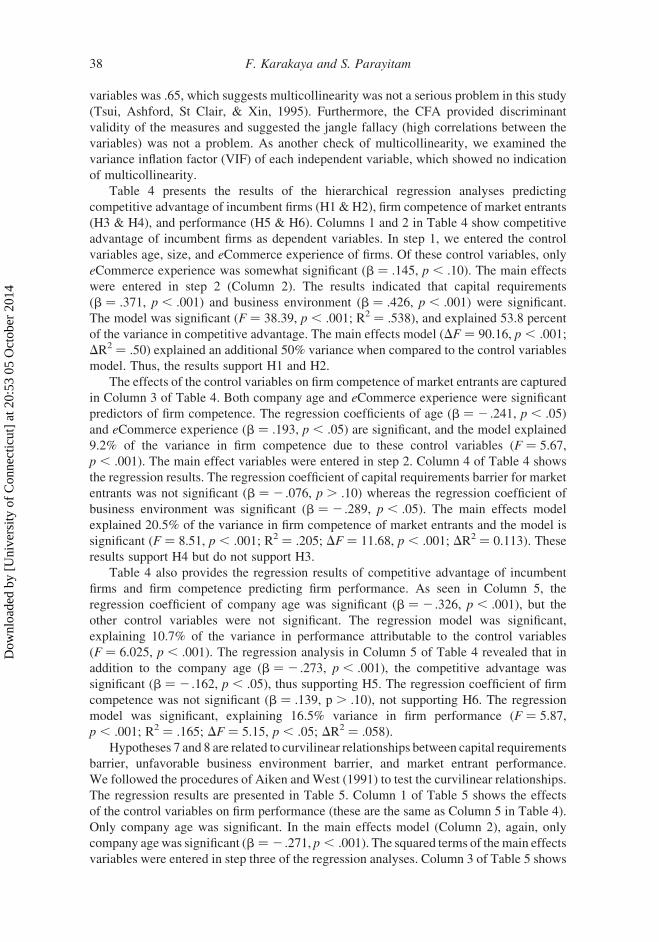
variables was .65, which suggests multicollinearity was not a serious problem in this study
(Tsui, Ashford, St Clair, & Xin, 1995). Furthermore, the CFA provided discriminant
validity of the measures and suggested the jangle fallacy (high correlations between the
variables) was not a problem. As another check of multicollinearity, we examined the
variance inflation factor (VIF) of each independent variable, which showed no indication
of multicollinearity.
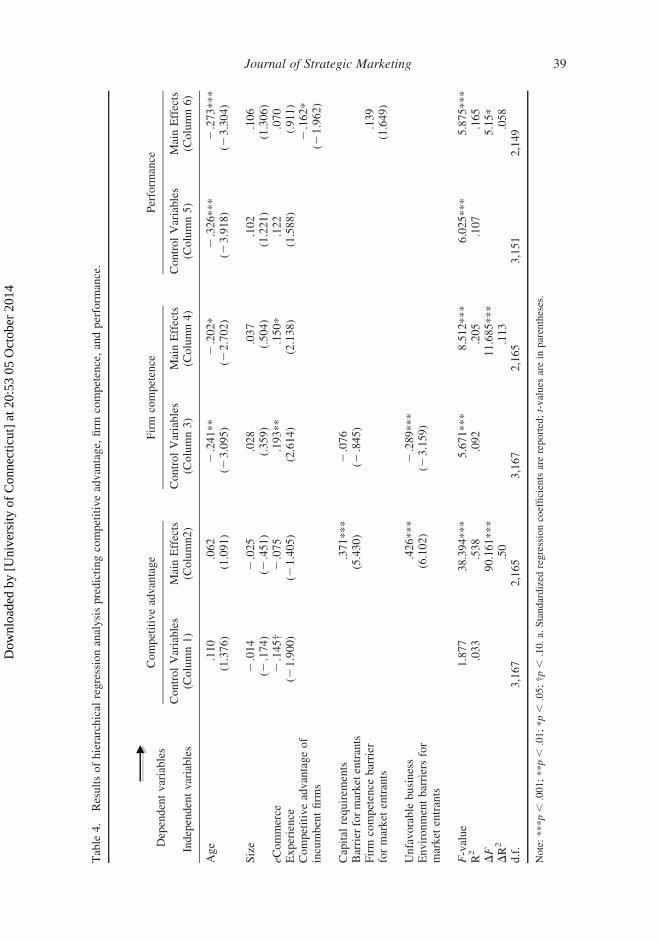
Table 4 presents the results of the hierarchical regression analyses predicting
competitive advantage of incumbent firms (H1 & H2), firm competence of market entrants
(H3 & H4), and performance (H5 & H6). Columns 1 and 2 in Table 4 show competitive
advantage of incumbent firms as dependent variables. In step 1, we entered the control
variables age, size, and eCommerce experience of firms. Of these control variables, only
eCommerce experience was somewhat significant (b ¼ .145, p , .10). The main effects
were entered in step 2 (Column 2). The results indicated that capital requirements
(b ¼ .371, p , .001) and business environment (b ¼ .426, p , .001) were significant.
The model was significant (F ¼ 38.39, p , .001; R2 ¼ .538), and explained 53.8 percent
of the variance in competitive advantage. The main effects model (DF ¼ 90.16, p , .001;
DR2 ¼ .50) explained an additional 50% variance when compared to the control variables
model. Thus, the results support H1 and H2.
The effects of the control variables on firm competence of market entrants are captured
in Column 3 of Table 4. Both company age and eCommerce experience were significant
predictors of firm competence. The regression coefficients of age (b ¼ 2 .241, p , .05)
and eCommerce experience (b ¼ .193, p , .05) are significant, and the model explained
9.2% of the variance in firm competence due to these control variables (F ¼ 5.67,
p , .001). The main effect variables were entered in step 2. Column 4 of Table 4 shows
the regression results. The regression coefficient of capital requirements barrier for market
entrants was not significant (b ¼ 2 .076, p . .10) whereas the regression coefficient of
business environment was significant (b ¼ 2 .289, p , .05). The main effects model
explained 20.5% of the variance in firm competence of market entrants and the model is
significant (F ¼ 8.51, p , .001; R2 ¼ .205; DF ¼ 11.68, p , .001; DR2 ¼ 0.113). These
results support H4 but do not support H3.
Table 4 also provides the regression results of competitive advantage of incumbent
firms and firm competence predicting firm performance. As seen in Column 5, the
regression coefficient of company age was significant (b ¼ 2 .326, p , .001), but the
other control variables were not significant. The regression model was significant,
explaining 10.7% of the variance in performance attributable to the control variables
(F ¼ 6.025, p , .001). The regression analysis in Column 5 of Table 4 revealed that in
addition to the company age (b ¼ 2 .273, p , .001), the competitive advantage was
significant (b ¼ 2 .162, p , .05), thus supporting H5. The regression coefficient of firm
competence was not significant (b ¼ .139, p . .10), not supporting H6. The regression
model was significant, explaining 16.5% variance in firm performance (F ¼ 5.87,
p , .001; R2 ¼ .165; DF ¼ 5.15, p , .05; DR2 ¼ .058).
Hypotheses 7 and 8 are related to curvilinear relationships between capital requirements
barrier, unfavorable business environment barrier, and market entrant performance.
We followed the procedures of Aiken andWest (1991) to test the curvilinear relationships.
The regression results are presented in Table 5. Column 1 of Table 5 shows the effects
of the control variables on firm performance (these are the same as Column 5 in Table 4).
Only company age was significant. In the main effects model (Column 2), again, only
company agewas significant (b ¼ 2 .271, p , .001). The squared terms of themain effects
variables were entered in step three of the regression analyses. Column 3 of Table 5 shows
F. Karakaya and S. Parayitam38
Dow
nloa
ded
by [
Uni
vers
ity o
f C
onne
ctic
ut]
at 2
0:53
05
Oct
ober
201
4
Table
4.
Resultsofhierarchical
regressionanalysispredictingcompetitiveadvantage,firm
competence,andperform
ance.
Dependentvariables
Competitiveadvantage
Firm
competence
Perform
ance
Independentvariables
ControlVariables
(Column1)
MainEffects
(Column2)
ControlVariables
(Column3)
MainEffects
(Column4)
ControlVariables
(Column5)
MainEffects
(Column6)
Age
.110
.062
2.241**
2.202*
2.326***
2.273***
(1.376)
(1.091)
(23.095)
(22.702)
(23.918)
(23.304)
Size
2.014
2.025
.028
.037
.102
.106
(2.174)
(2.451)
(.359)
(.504)
(1.221)
(1.306)
eCommerce
2.145†
2.075
.193**
.150*
.122
.070
Experience
(21.900)
(21.405)
(2.614)
(2.138)
(1.588)
(.911)
Competitiveadvantageof
incumbentfirm
s2.162*
(21.962)
Capital
requirem
ents
.371***
2.076
Barrier
formarketentrants
(5.430)
(2.845)
Firm
competence
barrier
formarket
entrants
.139
(1.649)
Unfavorable
business
Environmentbarriersfor
market
entrants
.426***
(6.102)
2.289***
(23.159)
F-value
1.877
38.394***
5.671***
8.512***
6.025***
5.875***
R2
.033
.538
.092
.205
.107
.165
DF
90.161***
11.685***
5.15*
DR2
.50
.113
.058
d.f.
3,167
2,165
3,167
2,165
3,151
2,149
Note:***p,
.001;**p,
.01;*p,
.05;†p,
.10.a.Standardized
regressioncoefficientsarereported;t-values
arein
parentheses.
Journal of Strategic Marketing 39
Dow
nloa
ded
by [
Uni
vers
ity o
f C
onne
ctic
ut]
at 2
0:53
05
Oct
ober
201
4
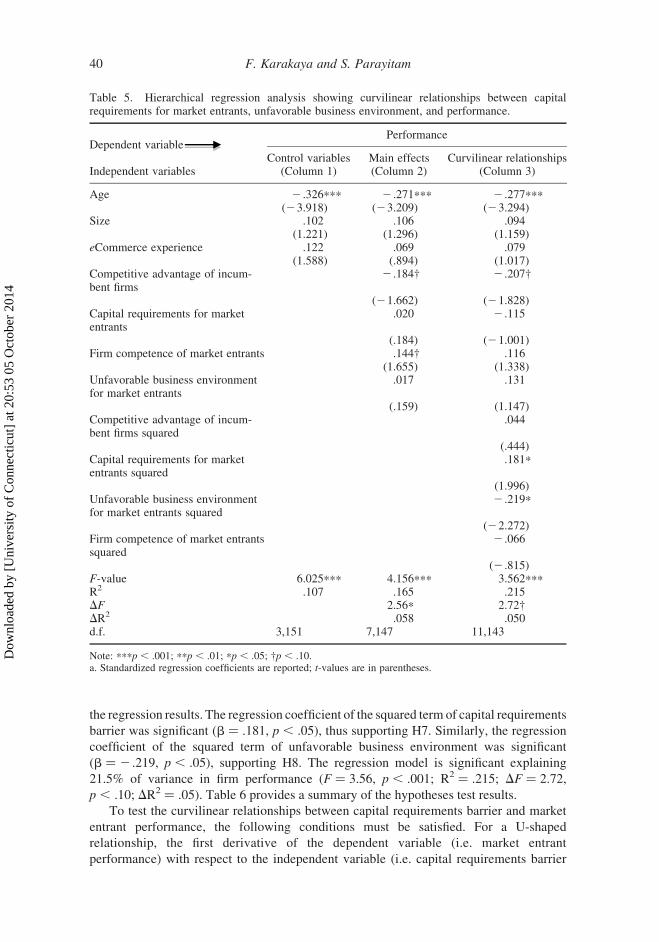
the regression results. The regression coefficient of the squared term of capital requirements
barrier was significant (b ¼ .181, p , .05), thus supporting H7. Similarly, the regression
coefficient of the squared term of unfavorable business environment was significant
(b ¼ 2 .219, p , .05), supporting H8. The regression model is significant explaining
21.5% of variance in firm performance (F ¼ 3.56, p , .001; R2 ¼ .215; DF ¼ 2.72,
p , .10; DR2 ¼ .05). Table 6 provides a summary of the hypotheses test results.
To test the curvilinear relationships between capital requirements barrier and market
entrant performance, the following conditions must be satisfied. For a U-shaped
relationship, the first derivative of the dependent variable (i.e. market entrant
performance) with respect to the independent variable (i.e. capital requirements barrier
Table 5. Hierarchical regression analysis showing curvilinear relationships between capitalrequirements for market entrants, unfavorable business environment, and performance.
Dependent variablePerformance
Independent variablesControl variables
(Column 1)Main effects(Column 2)
Curvilinear relationships(Column 3)
Age 2 .326*** 2 .271*** 2 .277***(23.918) (23.209) (23.294)
Size .102 .106 .094(1.221) (1.296) (1.159)
eCommerce experience .122 .069 .079(1.588) (.894) (1.017)
Competitive advantage of incum-bent firms
2 .184† 2 .207†
(21.662) (21.828)Capital requirements for marketentrants
.020 2 .115
(.184) (21.001)Firm competence of market entrants .144† .116
(1.655) (1.338)Unfavorable business environmentfor market entrants
.017 .131
(.159) (1.147)Competitive advantage of incum-bent firms squared
.044
(.444)Capital requirements for marketentrants squared
.181*
(1.996)Unfavorable business environmentfor market entrants squared
2 .219*
(22.272)Firm competence of market entrantssquared
2 .066
(2 .815)F-value 6.025*** 4.156*** 3.562***R2 .107 .165 .215DF 2.56* 2.72†DR2 .058 .050d.f. 3,151 7,147 11,143
Note: ***p , .001; **p , .01; *p , .05; †p , .10.a. Standardized regression coefficients are reported; t-values are in parentheses.
F. Karakaya and S. Parayitam40
Dow
nloa
ded
by [
Uni
vers
ity o
f C
onne
ctic
ut]
at 2
0:53
05
Oct
ober
201
4
for market entrants) must be equal to zero, and the second derivative of the Y with respect
to X must be greater than zero.
The quadratic curve fit of firm performance as dependent variable and capital
requirements as independent variable form the following equation:
Y ðFirm PerformanceÞ ¼ 2:1812 0:085Xþ 0:044X2 whereX ¼ Capital Requirements
dY=dX ¼ 20:085þ 0:088X ¼ 0 ð1Þ
d2Y=dX2 ¼ 0:362 . 0 ð2Þ
This positive second derivative implies that the curve is U-shaped.
By solving for X from Equation (1) we obtain X ¼ 0.965.
Since the second derivative of the function is greater than zero, the function has a
minimum value of 2.13 at X ¼ 0.965.
½Y ¼ 2:1812 ð0:085Þð0:965Þ þ 0:044ð0:965Þ2 ¼ 2:13�
These results show that the relationship between capital requirements and firm
performance is U-shaped.
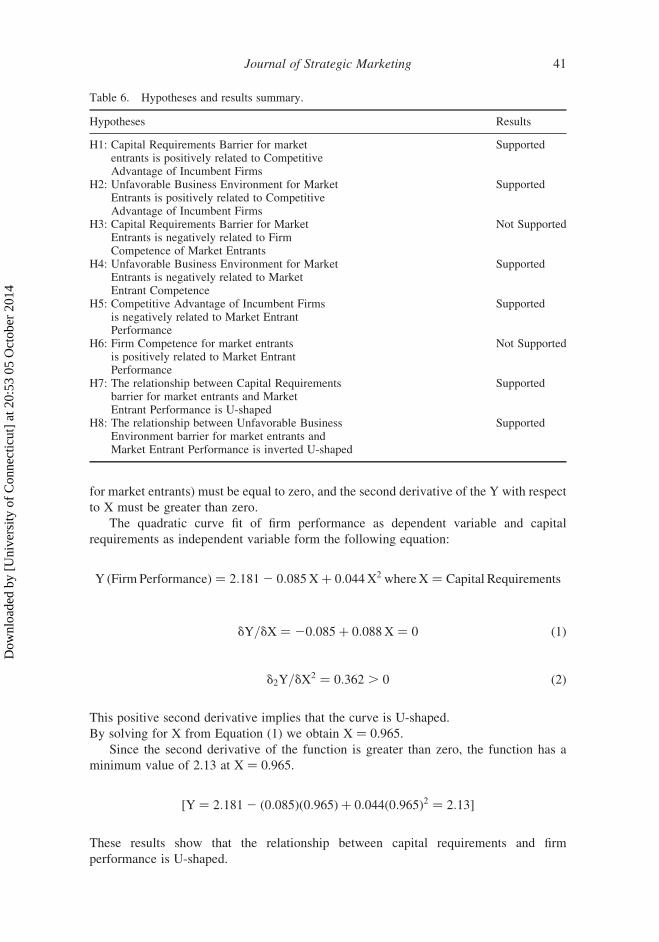
Table 6. Hypotheses and results summary.
Hypotheses Results
H1: Capital Requirements Barrier for marketentrants is positively related to CompetitiveAdvantage of Incumbent Firms
Supported
H2: Unfavorable Business Environment for MarketEntrants is positively related to CompetitiveAdvantage of Incumbent Firms
Supported
H3: Capital Requirements Barrier for MarketEntrants is negatively related to FirmCompetence of Market Entrants
Not Supported
H4: Unfavorable Business Environment for MarketEntrants is negatively related to MarketEntrant Competence
Supported
H5: Competitive Advantage of Incumbent Firmsis negatively related to Market EntrantPerformance
Supported
H6: Firm Competence for market entrantsis positively related to Market EntrantPerformance
Not Supported
H7: The relationship between Capital Requirementsbarrier for market entrants and MarketEntrant Performance is U-shaped
Supported
H8: The relationship between Unfavorable BusinessEnvironment barrier for market entrants andMarket Entrant Performance is inverted U-shaped
Supported
Journal of Strategic Marketing 41
Dow
nloa
ded
by [
Uni
vers
ity o
f C
onne
ctic
ut]
at 2
0:53
05
Oct
ober
201
4
The quadratic curve fit of firm performance as dependent variable and unfavorable
business environment as independent variable is captured hereunder:
Y ðFirm PerformanceÞ ¼ 2:2882 0:081Xþ 0:043X2 where X ¼ Business Environment
dY=dX ¼ 20:0812 0:086X ¼ 0 ð1Þ
d2Y=dX2 ¼ 20:086 , 0 ð2Þ
This negative value of the second derivative implies that the curve is inverted-U shaped.
By solving for X from Equation (1) we obtain X ¼ 20.941.
Since the second derivative of the function is greater than zero, the function has a
maximum value of 2.33 at X ¼ 20.941.
½Y ¼ 2:1812 ð0:081Þð20:941Þ2 0:043ð20:941Þ2 ¼ 2:33�
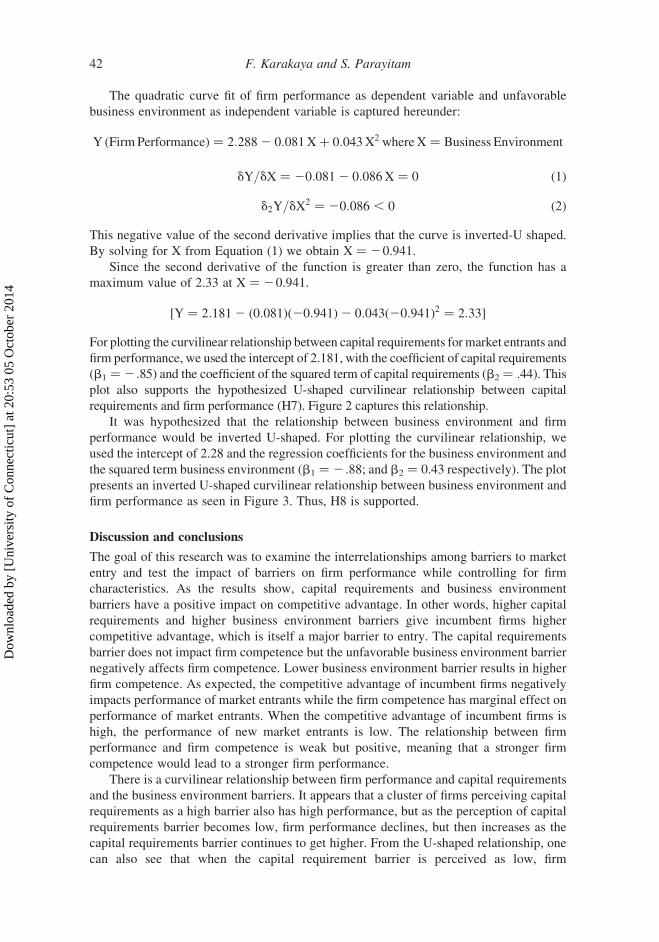
For plotting the curvilinear relationship between capital requirements formarket entrants and
firm performance, we used the intercept of 2.181, with the coefficient of capital requirements
(b1 ¼ 2 .85) and the coefficient of the squared term of capital requirements (b2 ¼ .44). This
plot also supports the hypothesized U-shaped curvilinear relationship between capital
requirements and firm performance (H7). Figure 2 captures this relationship.
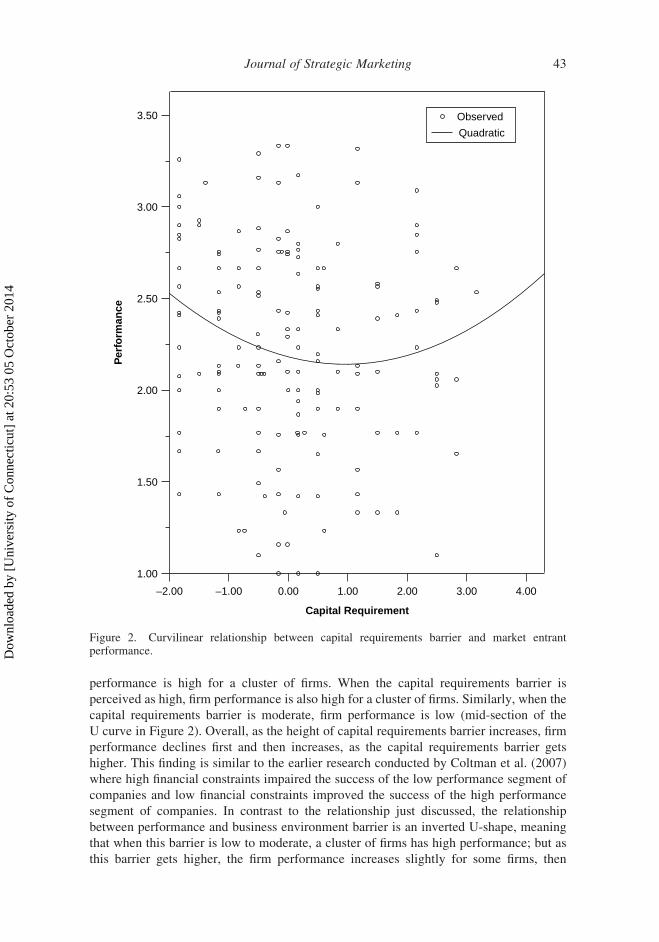
It was hypothesized that the relationship between business environment and firm
performance would be inverted U-shaped. For plotting the curvilinear relationship, we
used the intercept of 2.28 and the regression coefficients for the business environment and
the squared term business environment (b1 ¼ 2 .88; and b2 ¼ 0.43 respectively). The plot
presents an inverted U-shaped curvilinear relationship between business environment and
firm performance as seen in Figure 3. Thus, H8 is supported.
Discussion and conclusions
The goal of this research was to examine the interrelationships among barriers to market
entry and test the impact of barriers on firm performance while controlling for firm
characteristics. As the results show, capital requirements and business environment
barriers have a positive impact on competitive advantage. In other words, higher capital
requirements and higher business environment barriers give incumbent firms higher
competitive advantage, which is itself a major barrier to entry. The capital requirements
barrier does not impact firm competence but the unfavorable business environment barrier
negatively affects firm competence. Lower business environment barrier results in higher
firm competence. As expected, the competitive advantage of incumbent firms negatively
impacts performance of market entrants while the firm competence has marginal effect on
performance of market entrants. When the competitive advantage of incumbent firms is
high, the performance of new market entrants is low. The relationship between firm
performance and firm competence is weak but positive, meaning that a stronger firm
competence would lead to a stronger firm performance.
There is a curvilinear relationship between firm performance and capital requirements
and the business environment barriers. It appears that a cluster of firms perceiving capital
requirements as a high barrier also has high performance, but as the perception of capital
requirements barrier becomes low, firm performance declines, but then increases as the
capital requirements barrier continues to get higher. From the U-shaped relationship, one
can also see that when the capital requirement barrier is perceived as low, firm
F. Karakaya and S. Parayitam42
Dow
nloa
ded
by [
Uni
vers
ity o
f C
onne
ctic
ut]
at 2
0:53
05
Oct
ober
201
4
performance is high for a cluster of firms. When the capital requirements barrier is
perceived as high, firm performance is also high for a cluster of firms. Similarly, when the
capital requirements barrier is moderate, firm performance is low (mid-section of the
U curve in Figure 2). Overall, as the height of capital requirements barrier increases, firm
performance declines first and then increases, as the capital requirements barrier gets
higher. This finding is similar to the earlier research conducted by Coltman et al. (2007)
where high financial constraints impaired the success of the low performance segment of
companies and low financial constraints improved the success of the high performance
segment of companies. In contrast to the relationship just discussed, the relationship
between performance and business environment barrier is an inverted U-shape, meaning
that when this barrier is low to moderate, a cluster of firms has high performance; but as
this barrier gets higher, the firm performance increases slightly for some firms, then
3.50
3.00
2.50
2.00
Per
form
ance
1.50
1.00
–2.00 –1.00 0.00 1.00 2.00 3.00 4.00
Capital Requirement
Observed
Quadratic
Figure 2. Curvilinear relationship between capital requirements barrier and market entrantperformance.
Journal of Strategic Marketing 43
Dow
nloa
ded
by [
Uni
vers
ity o
f C
onne
ctic
ut]
at 2
0:53
05
Oct
ober
201
4
declines as the barrier becomes even stronger. An earlier study by Coltman et al. (2007)
also supports this relationship where a segment of high performance businesses faced low
business constraints.
Managerial implications and future research
The findings of this research could be utilized by businesses in understanding the nature of
barriers before entering markets and attempting to overcome them. It is equally important
for firms to build barriers to entry that relate to firm performance and deter entry of new
competition. Competitive advantage and firm competence have a direct impact on firm
performance. However, the impact of capital requirements and business environment on
firm performance is curvilinear, meaning that the impact of barriers may be negative for
some firms and positive for others. In building barriers to entry, it is important to consider
the interrelationships among the barriers. The capital requirements and business
3.50
3.00
2.50
2.00
1.50
1.00
Per
form
ance
–2.00 –1.00 0.00 1.00 2.00 3.00
Business Environment
ObservedQuadratic
Figure 3. Curvilinear relationship between business environment and market entrant performance.
F. Karakaya and S. Parayitam44
Dow
nloa
ded
by [
Uni
vers
ity o
f C
onne
ctic
ut]
at 2
0:53
05
Oct
ober
201
4
environment barriers impact the competitive advantage barrier. Similarly, the unfavorable
business environment barrier impacts firm competence. Therefore, firms should attempt to
build competitive advantage and strengthen their competence, which is more controllable
compared to other barriers to entry.
While this study showed high reliability and validity of the measures used, it also has
some limitations. First, the study has a generalizability dilemma. We only focused on
market entry into eCommerce markets. Thus, we can only say that the results apply to the
eCommerce markets despite the fact that the respondents come from a variety of other
industries. We suggest that the present model can be extended to include other markets in
general. Second, although we tested a large number of barriers to market entry, it is
possible to have other barriers in different markets. Future research could include other
industries and compare the differences in the magnitude of barriers.
The present research attempted to study the relationships between barriers to market
entry and firm performance. Interestingly, the study revealed some linear relationships and
some curvilinear relationships implying that future researchers need to focus on quadratic
moderated relationships between the barriers to market entry and firm performance. This
study did not consider firm strategy. It is highly likely that firm strategy and barriers to
entry are related and firm strategy affects firm performance. Therefore, examining specific
firm strategies and linking them to barriers to entry and performance is an area of research
that can prove beneficial and contribute to the literature. Furthermore, longitudinal studies
can help in identifying some reciprocal relationships between the variables. The present
study adds to the current theoretical work and provides some avenues for future research.
References
Agarwal, R., & Prasad, J. (1998). A conceptual and operational definition of personal innovativenessin the domain of information technology. Information Systems Research, 9, 204–215.
Aiken, L.S., &West, S. (1991).Multiple regression: Testing and interpreting interactions. NewburyPark, CA: Sage.
Allison, L.K. (1999). Information systems professional development: A work-based learning model.Journal of Contemporary Professional Development, 2(3), 86–92.
Anderson, J.C., & Gerbing, D.W. (1988). Structural equation modeling in practice: A review andrecommended two-step approach. Psychological Bulletin, 103, 411–423.
Armstrong, J., & Overton, T. (1977). Estimating nonresponse bias in mail surveys. Journal ofMarketing Research, 14, 396–402.
Bain, J. (1956). Barriers to new competition. Cambridge, MA: Harvard University Press.Barney, J.B. (1986). Strategic factor markets, expectations, luck, and business strategy.Management
Science, 32, 1231–1241.Barney, J.B. (1991). Firm resources and sustained competitive advantage. Journal of Management,
17, 1231–1241.Bharadwaj, A.S. (2000). A resource-based perspective on information technology capability and
firm performance: An empirical investigation. MIS Quarterly, 24, 169–196.Bingi, P., Mir, A., & Khamalah, J. (2000). The challenges facing global ecommerce. Information
Systems Management, 17(4), 26–34.Burch, D.S., & Smiley, R. (1992). Who deters entry? Evidence on the use of strategic entry
deterrence. Review of Economics and Statistics, 74, 509–521.Cicic, M., Patterson, P., & Shoham, A. (2002). Antecedents of international performance: A service
firms’ perspective. European Journal of Marketing, 36, 1103–1118.Cochran, J.J., Darrat, A.F., & Elkhal, K. (2006). On the bankruptcy of internet companies: An
empirical inquiry. Journal of Business Research, 59, 1193–1200.Coeurderoy, R., & Durand, R. (2004). Leveraging the advantage of early entry: Proprietary
technologies versus cost leadership. Journal of Business Research, 57(6), 583–590.Collis, D.J., & Montgomery, C.A. (2008). Competing on resources. Harvard Business Review,
86(7/8), 140–150.
Journal of Strategic Marketing 45
Dow
nloa
ded
by [
Uni
vers
ity o
f C
onne
ctic
ut]
at 2
0:53
05
Oct
ober
201
4
Coltman, T.R., Devinney, T.M., & Midgley, D.F. (2007). E-business strategy and firm performance:A latent class assessment of the drivers and impediments to success. Journal InformationTechnology, 22(2), 87–102.
Cooper, R.B., & Zmud, W. (1990). Information technology implementation research: Atechnological diffusion approach. Management Science, 36, 123–139.
Darch, H., & Lucas, T. (2002). Training as an eCommerceEnabler. Journal of Workplace Learning,14(4), 148–155.
De Castro, J.O., & Chrisman, J.J. (1995). Order of market entry, competitive strategy, and financialperformance. Journal Business Research, 33, 165–177.
Dierickx, I., & Cool, K. (1989). Asset stock accumulation and sustainability of competitiveadvantage. Management Science, 35, 1504–1511.
Duan, Y., Mullins, R., Hamblin, D., & Stanek, S. (2002). Addressing ICTs skill challenges in SMEs:Insights from three country investigations. Journal of European Industrial Training, 26,430–441.
Dubelaar, C., Sohal, A., & Savic, V. (2005). Benefits, impediments and critical success factors inB2C e-business adoption. Technovation, 25, 1251–1262.
Forman, C. (2005). The corporate digital divide: Determinants of internet adoption. ManagementScience, 51, 641–654.
Fornell, C., & Larcker, D.F. (1981). Evaluating structural equation models with unobservablevariables and measurement error. Journal Mark Res, 18, 39–50.
Fruhling, A.L., & Digman, L.A. (2000). The impact of electronic commerce on business-levelstrategies. Journal of Electronic Commerce Research, 1, 13–23.
Fuentelsaz, L., Gomez, J., & Polo, Y. (2002). Followers’ entry timing: Evidence from the Spanishbanking sector after deregulation. Strategic Management Journal, 23, 245–264.
Grant, R.M. (1991). The resource-based theory of competitive advantage: Implications for strategyformulation. California Management Review, 33(3), 114–135.
Gruca, T.S., & Sudharshan, D. (1995). A framework for entry deterrence strategy: The competitiveenvironment, choices, and consequences. Journal of Marketing, 59(3), 44–55.
Hadaya, P., & Pellerin, R. (2008). Determinants of manufacturing firms’ intent to use web-basedsystems to share inventory information with their key suppliers. International Journal ofE-Collaboration, 4(2), 29–54.
Han, J.K., Kim, N., & Kim, H.B. (2001). Entry barriers: A dull-, one-, or two-edged sword forincumbents? Unraveling the paradox from a contingency perspective. Journal of Marketing,65(1), 1–14.
Iacovou, C.L., Benbasatand, I., & Dexter, A.S. (1995). Electronic data interchange and smallorganizations: Adoption and impact of technology. MIS Quarterly, 19, 465–485.
Johnson, J.Y., & Tellis, G.J. (2008). Drivers of success for market entry into China and India.Journal of Marketing, 72(3), 1–13.
Karakaya, F., & Kerin, R. (2007). Impact of product life cycle stages on barriers to entry. JournalStrategic Marketing, 15, 287–298.
Karakaya, F., & Stahl, M.J. (1989). Barriers to entry and market entry decisions in consumer &industrial goods markets. Journal of Marketing, 53(2), 80–91.
Karakaya, F., & Stahl, M.J. (1992). Underlying dimensions of barriers to entry in consumer goodsmarkets. Journal of the Academy of Marketing Science, 20, 275–278.
Karakaya, F., & Yannopoulos, P. (2010). Defensive strategy framework in global markets: A mentalmodels approach. Euro Journal of Marketing, 44, 1077–1100.
Kerin, R.A., Varadarajan, P.R., & Peterson, R.A. (1992). First-mover advantage: A synthesis,conceptual framework. Journal of Marketing, 56(4), 33–52.
Kor, Y.Y., &Mahoney, J.T. (2004). Edith Penrose’s (1959) contributions to the resource-based viewof strategic management. Journal of Management Studies, 41, 183–191.
Mahoney, J.T. (1995). The management of resources and the resource of management. JournalBusiness Research, 33(2), 91–101.
Markides, C. (1997). Strategic innovation. Sloan Management Review, 38(3), 9–23.Olusoga, S., Mokwa, M.P., & Noble, C.H. (1995). Strategic groups, mobility barriers, and
competitive advantage: An empirical investigation. Journal of Business Research, 33, 153–163.Patterson, P.G., & Cicic, M. (1995). A typology of service firms in international markets: An
empirical investigation. Journal of International Marketing, 3(4), 57–83.
F. Karakaya and S. Parayitam46
Dow
nloa
ded
by [
Uni
vers
ity o
f C
onne
ctic
ut]
at 2
0:53
05
Oct
ober
201
4
Pehrsson, A. (2009). Barriers to entry and market strategy: A literature review and a proposed model.European Business Review, 21, 64–77.
Peteraf, M.A., & Barney, J.B. (2003). Unraveling the resource based tangle. Managerial andDecision Economics, 24, 309–323.
Podsakoff, P.M., MacKenzie, S.B., Lee, J.-Y., & Podsakoff, N.P. (2003). Common method biases inbehavioral research: A critical review of the literature & recommended remedies. Journal ofApplied Psychology, 88, 879–903.
Podsakoff, P.M., & Organ, D.W. (1986). Self-reports in organizational research: Problems &prospects. Journal of Management, 12, 531–544.
Porter, M.E. (1985). Competitive advantage: Creating and sustaining superior performance. NewYork: The Free Press.
Priem, R.L., & Butler, J.E. (2001). Is the resource-based ‘view’ a useful perspective for strategicmanagement research? Academy of Management Review, 26, 22–40.
Razi, M.A., Tarn, M.J., & Siddiqui, F.A. (2004). Exploring the failure and success of dotcoms.Information Management & Computer Security, 12, 228–244.
Rennhoff, A. (2008). Paying for shelf space: An investigation of merchandising allowances in thegrocery industry. Journal of Agricultural and Food Industrial Organization, 6, 1542–1585.
Robinson, W.T., & Fornell, C. (1985). Sources of market pioneering advantages in consumer goodsmarkets. Journal of Marketing, 7(4), 219–242.
Ruiz-Ortega, M., & Garcıa-Villaverde, P. (2008). Capabilities & competitive tactics influences onperformance: Implications of the moment of entry. Journal of Business Research, 61, 332–345.
Santhanam, R., & Hartono, E. (2003). Issues in linking IT capability to firm performance. MISQuarterly, 27, 125–153.
Sashi, C.M., & Stern, L.W. (1995). Product differentiation and market performance in producergoods industries. Journal of Business Research, 33, 115–127.
Shoham, A., & Albaum, G.S. (1995). Reducing the impact of barriers to exporting: A managerialperspective. Journal of International Marketing, 3(4), 85–106.
Simon, D. (2005). Incumbent pricing responses to entry. Strategic Management Journal, 26,1229–1244.
Simon, H. (1996). Hidden champions. Boston, MA: Harvard Business School Press.Stockdale, R., & Standing, C. (2004). Benefits and barriers of electronic marketplace participation:
An SME perspective. Journal of Enterprise Information Management, 17, 301–311.Stockdale, R., & Standing, C. (2006). A classification model to support SME ecommerce adoption
initiatives. Journal of Small Business and Enterprise Development, 13, 381–394.Thornton, J., & Marche, S. (2003). Sorting through the dot bomb rubble: How did the high-profile
e-tailers fail? Info Man., 23, 121–138.Tippins, M., & Sohi, R. (2003). IT competency and firm performance: Is organizational learning a
missing link? Strategic Management Journal, 24, 745–761.To, M.L., & Ngai, E.W.T. (2006). Predicting the organizational adoption of B2C ecommerce: An
empirical study. Industrial Management and Data Systems, 106, 1133–1147.Tsui, A.S., Ashford, S.J., St Clair, L., & Xin, K.R. (1995). Dealing with discrepant expectations:
Response strategies and managerial effectiveness. Academy of Management Journal, 38,1515–1543.
Usero, B., & Fernandez, Z. (2009). First come, first served: How market and non-market actionsinfluence pioneer market share. Journal of Business Research, 62, 1139–1145.
Wade, M., & Holland, J. (2004). The RBV and IS research: Review, extension and suggestions forfuture research. MIS Quarterly, 28, 107–142.
Wen, J.H., & Tarn, M.J. (2001). The impact of the next generation internet protocol on ecommercesecurity. Information Strategy: The Executive Journal, 17(2), 22–28.
Wernerfelt, B. (1984). A resource based view of the firm. Strategic Management Journal, 5,171–180.
Zhu, K., Kraemer, K.L., & Xu, S. (2003). E-business adoption by European firms: A cross-countryassessment of the facilitators and inhibitors. European Journal of Information Systems, 12,251–268.
Journal of Strategic Marketing 47
Dow
nloa
ded
by [
Uni
vers
ity o
f C
onne
ctic
ut]
at 2
0:53
05
Oct
ober
201
4