barriers and building blocks - fincap-two.cdn.prismic.io · it is also the case that ... barriers...
TRANSCRIPT
Barriers and Building Blocks
An overview of the 2015 Adult Financial Capability Survey

2
Barriers and Building Blocks – An overview of the 2015 Financial Capability survey
ForewordThis year sees the launch of the UK Financial Capability Strategy – a major ten-year initiative developed by the Money Advice Service and overseen by the Financial Capability Board, which is designed to stimulate and co-ordinate the active participation of a wide range of public, private and voluntary sector partners to help enable a more financially capable UK population.
The Adult Financial Capability Survey is a key component of the evidence base underpinning the development of the strategies for both the UK as a whole and the devolved nations. Much work has gone into the 2015 survey, building on previous research both here and in other countries, to ensure that the questions elicit as accurate and meaningful responses as possible. The research has been designed to provide an overview of financial behaviour and provides the facility to analyse the extent to which consumer skills, knowledge, attitudes and motivations, or the ease and accessibility of the financial services system, act as barriers or enablers to more capable behaviour.
It is clear from the findings that there is still much work to be done to improve UK adult financial capability. As well as identifying which behaviours or capability factors are relatively weak or strong across the adult population, the survey also highlights those consumer groups that would benefit most from focussed support.
Whilst this is very much work in progress, we believe that this survey has made a useful contribution to the financial capability debate. Over the next year or so we will be conducting a number of ‘deep dives’ into some of the areas highlighted by these findings. I would like to take this opportunity to thank my colleagues, members of our Research and Evaluation Group and all the agencies that have supported us on this major programme, especially GfK who managed the main survey.
Nick Watkins
Head of Insight and Evaluation
Barriers and Building Blocks – An overview of the 2015 Adult Financial Capability Survey
3
Introduction to the Survey The 2015 Adult Financial Capability Survey has been specifically designed to support the UK Financial Capability Strategy. The survey has three functions – to generate a map of adult financial capability in the UK signalling where capability is higher or lower; to provide a diagnostic tool identifying the potential enablers and barriers to financial capability; and, in time, to produce a number of high-level measures that will track the performance of the Strategy. These will be used alongside the robust evaluation of any major interventions that are designed as a consequence of the strategy.
The UK Financial Capability Strategy identifies three behavioural domains:
■ Managing money well day-to-day
■ Preparing for and managing life events
■ Dealing with financial difficulties
The survey contains measures of both the behaviours identified above and the financial capability factors, namely: skills and knowledge; attitudes and motivations; and ease and accessibility. It also reflects the importance of life-stage, as recognised in the Strategy and, as such, differentiates between young adults, the working-age population and older people in retirement. A separate Children and Young People’s Financial Capability Survey is currently in development to support that element of the Strategy.
Interviews for the adult survey were conducted with a nationally representative sample of 3,461 adults, aged 18+, living in the UK. Additional interviews were conducted in each of the devolved nations (Scotland, Wales and Northern Ireland) in order to ensure a robust base for analysis. The same is true of 18-24 year-olds, where again boost interviewing was undertaken. In total, 5,603 respondents took part in this research between April and July 2015. The survey was conducted mainly (74%) online with some face-to-face interviews (26%) to represent lighter users and non-users of the internet. The data were weighted to known population estimates.
The questionnaire was extensively developed from previous waves of financial capability research, comparison with international surveys such as those run by OECD and ASIC, specific qualitative research, cognitive testing and quantitative pilots.
More information on the survey design is available on the Money Advice Service website and the dataset will be uploaded to the UK Data Archive in due course.

Barriers and Building Blocks – An overview of the 2015 Adult Financial Capability Survey
4
Overview of capabilityWhilst most people are managing day to day, a significant minority are not. In the case of future life events, the majority of consumers are failing to prepare effectively.
Managing money day to day
Preparing for and managing life events
This tendency for consumers to be better at day-to-day management than planning ahead has been found in a number of previous research studies, suggesting it is not a function of the economic cycle.
Keeping up financially
Just over half of the population are able to keep up with their bills and commitments, without difficulty. Amongst the remainder there is a fairly even split between those who struggle sometimes and those who are in real difficulty – having either fallen behind with their bills and commitments or in the process of doing so.
One in six adults can be categorised as ‘over-indebted’ – that is, they find their debts a heavy burden or have missed payments for credit commitments or domestic bills in at least three of the last six months.
of working age people are currently paying into or
have a previous pension
of older people in retirement have some
form of plan for funding long term care
have some form of plan to meet a
financial goal
have savings equivalent to at least three months’ income
32% 34% 50% 28%
have an approach to household income and expenditure that they
think works well
61%
save every or most months
56%
could pay an unexpected bill of
£300 from savings or spare money without
cutting back
68%
have unsecured debt of less than one month’s income
70%
59%are keeping up
without difficulty
24%struggle from time to time
17%are constantly
struggling,

Barriers and Building Blocks – An overview of the 2015 Adult Financial Capability Survey
5
Financial wellbeingFinancial wellbeing is difficult to measure. One approach is to ask people how satisfied they feel with their overall financial circumstances. Perhaps not surprisingly, people in higher-income households are generally happier than those in lower-income households, as the chart below demonstrates. However, not everyone in the high-income group is satisfied with their financial circumstances – one in five record a satisfaction score of five out of ten or less, whilst a similar proportion of those with low incomes report high scores.
Other drivers of wellbeing might be the reassurance of a savings ‘cushion’ or conversely the absence of debt. In order to allow for the effect of different levels of income, the values of savings and debt are best expressed as the numbers of months of household income they represent. Given how significantly both income and costs change with retirement, the analysis below looks solely at the working-age population. As might be expected, those with higher levels of savings relative to their income, and those with lower levels of debt, are more likely to be in the most satisfied band. However, as with income neither of these completely explain consumers’ sense of wellbeing.
Whilst the level of debt is not the only factor, half of those with unsecured debt equivalent to at least three months’ income are dissatisfied with their financial circumstances. And nearly one-quarter of the working-age population regularly revolve their credit card balance or have used high-cost short-term credit.
23%of people either revolve a credit card or use high cost short-term credit
27%
35%
38%
22%
29%
48%
29%
37%
34%
40%
39%
19%
22%
30%
48%
26%
45%
29%
38%
39%
23%
16%
32%
51%
28%
37%
35%
34%
35%
31%
Household income Savings: income (months)
Debt: income (months)
0 to 5 (Not at all satisfied)
6 to 7
8 to 10 (Very
satisfied)
All £17.5K £17.5K- £49K
£50K+ Less than 1
1 to 3 3+ 3+ 1 to 3 Less than 1

Barriers and Building Blocks – An overview of the 2015 Adult Financial Capability Survey
6
Managing moneyMoney management is important. We will see later that poor day-to-day control impacts an individual’s ability to accrue savings and we know that excessive and/or impulsive use of credit can cause serious problems. The UK Financial Capability Strategy identifies a variety of behaviours; these include:
■ taking control of finances;
■ having a short term buffer;
■ using credit sensibly; and
■ maximising income
One key measure of taking control is knowing how much is in one’s current account at any one time. Yet only six in ten survey respondents thought they could answer to within £50.
A broader measure is how people keep track of their money and the survey identified a number of solutions. Techniques vary:
The extent to which people talk to their partners or spouses also varies:
Clearly, digital technology is impacting how people manage their money, with more than six in ten now using online or mobile banking. That means, however, that around one in three rely on other methods for checking their balance and managing their bank account generally. And those people who rely on paper statements tend overall to be less successful at reading the balance on a bank statement – which was presented to them as part of the ‘skills and knowledge’ section of the interview.
Method of keeping track (most frequent responses only)
Using this method to check balance
(can be more than one) (%)
Able to read balance on bank statement
(%)
Online banking 54% 88% correct
Paper statement 34% 75% correct
ATM/ branch 25% 85% correct
Mobile app 22% 89% correct
“We sit down weekly and check receipts against the bank
statement online and update our spreadsheet.”
“I keep a mental note of what I spend and look at my statement to check
now and again.”
“The joint account is for mortgage and bills, we pay into it each month, what we
have left is ours to spend and/or save; a little more goes into the joint account
than what is needed to cover bills.”
“Every month is different. Some months we may have a holiday or a wedding to attend, other months
may be quiet. We look after our own finances separately. I have
absolutely no idea how much my partner earns, nor she me.”
41%of adults do not know their current account balance within £50

Barriers and Building Blocks – An overview of the 2015 Adult Financial Capability Survey
7
BudgetingThere are problems with the word ‘budgeting’. It is an ambiguous term, with different people interpreting it very differently. As such, simply asking consumers whether or not they budget can be misleading. It is also the case that the word itself can be very off-putting for some people.
Instead, we asked people to describe their approach to keeping track of their income and expenditure. They then rated how well they thought this approach worked, using a scale from zero to ten. These self-reported scores increase with age, with a marked improvement amongst the retired.
The ratings also increase in line with household income. Similarly people with financial goals or plans tended to rate their approach more highly. The same is true of those who expressed positive attitudes about money such as confidence, self-efficacy or recognition of the importance of taking responsibility for their finances. How easily people kept up with their bills and commitments was another factor in keeping track.
Respondents to the survey were asked whether they thought of their money in terms of ‘pots’ for different things. This ‘ jam jar’ approach was almost four times more likely among people who rated their approach highly, that is eight or more out of ten.
People with an approach that they thought worked well were also more likely to have a savings buffer. Two-thirds of these respondents had £500 or more in savings, compared to only half of those with a less effective approach.
All 18+
Young adults
Working age
Retirement age
716 15 20 12 27
1122 18 21 9 14
919 17 21 12 21
310 8 19 14 45
0 to 5 (Not at all well)
6 7 8 9 10 (Very well)
Ratings Key
Barriers and Building Blocks – An overview of the 2015 Adult Financial Capability Survey
8
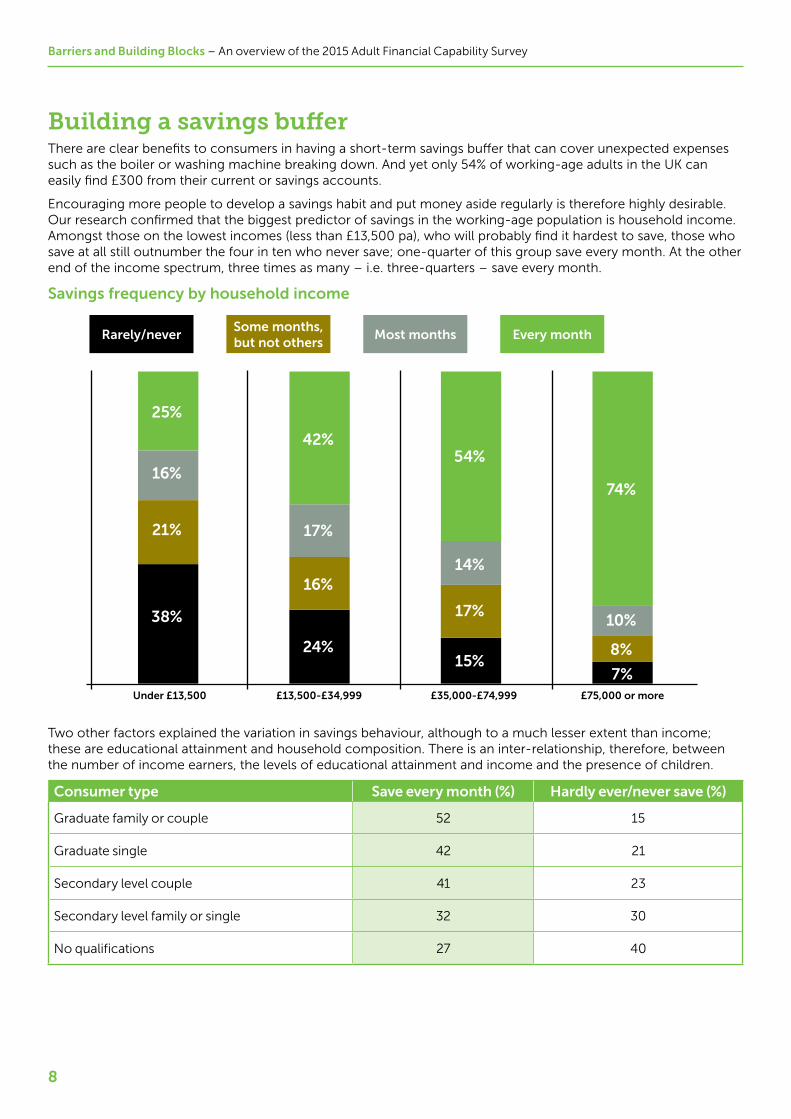
Building a savings buffer There are clear benefits to consumers in having a short-term savings buffer that can cover unexpected expenses such as the boiler or washing machine breaking down. And yet only 54% of working-age adults in the UK can easily find £300 from their current or savings accounts.
Encouraging more people to develop a savings habit and put money aside regularly is therefore highly desirable. Our research confirmed that the biggest predictor of savings in the working-age population is household income. Amongst those on the lowest incomes (less than £13,500 pa), who will probably find it hardest to save, those who save at all still outnumber the four in ten who never save; one-quarter of this group save every month. At the other end of the income spectrum, three times as many – i.e. three-quarters – save every month.
Savings frequency by household income
Two other factors explained the variation in savings behaviour, although to a much lesser extent than income; these are educational attainment and household composition. There is an inter-relationship, therefore, between the number of income earners, the levels of educational attainment and income and the presence of children.
Consumer type Save every month (%) Hardly ever/never save (%)
Graduate family or couple 52 15
Graduate single 42 21
Secondary level couple 41 23
Secondary level family or single 32 30
No qualifications 27 40
Some months, but not others
Rarely/never Most months Every month
Under £13,500 £13,500-£34,999 £35,000-£74,999 £75,000 or more
25%
16%
21%
38%
42%
17%
16%
24%
54%
14%
17%
15%
74%
10%
8%
7%
Barriers and Building Blocks – An overview of the 2015 Adult Financial Capability Survey
9
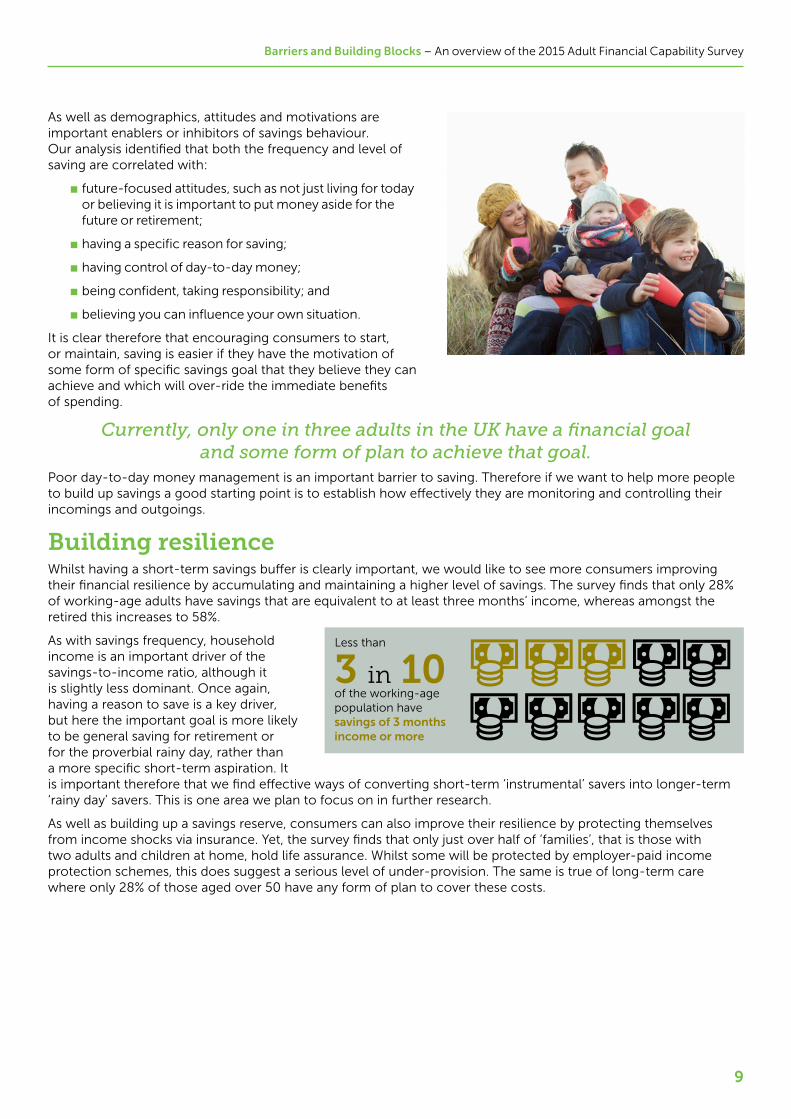
As well as demographics, attitudes and motivations are important enablers or inhibitors of savings behaviour. Our analysis identified that both the frequency and level of saving are correlated with:
■ future-focused attitudes, such as not just living for today or believing it is important to put money aside for the future or retirement;
■ having a specific reason for saving;
■ having control of day-to-day money;
■ being confident, taking responsibility; and
■ believing you can influence your own situation.
It is clear therefore that encouraging consumers to start, or maintain, saving is easier if they have the motivation of some form of specific savings goal that they believe they can achieve and which will over-ride the immediate benefits of spending.
Currently, only one in three adults in the UK have a financial goal and some form of plan to achieve that goal.
Poor day-to-day money management is an important barrier to saving. Therefore if we want to help more people to build up savings a good starting point is to establish how effectively they are monitoring and controlling their incomings and outgoings.
Building resilienceWhilst having a short-term savings buffer is clearly important, we would like to see more consumers improving their financial resilience by accumulating and maintaining a higher level of savings. The survey finds that only 28% of working-age adults have savings that are equivalent to at least three months’ income, whereas amongst the retired this increases to 58%.
As with savings frequency, household income is an important driver of the savings-to-income ratio, although it is slightly less dominant. Once again, having a reason to save is a key driver, but here the important goal is more likely to be general saving for retirement or for the proverbial rainy day, rather than a more specific short-term aspiration. It is important therefore that we find effective ways of converting short-term ‘instrumental’ savers into longer-term ‘rainy day’ savers. This is one area we plan to focus on in further research.
As well as building up a savings reserve, consumers can also improve their resilience by protecting themselves from income shocks via insurance. Yet, the survey finds that only just over half of ‘families’, that is those with two adults and children at home, hold life assurance. Whilst some will be protected by employer-paid income protection schemes, this does suggest a serious level of under-provision. The same is true of long-term care where only 28% of those aged over 50 have any form of plan to cover these costs.
3 in 10of the working-age population have savings of 3 months income or more
Less than

Barriers and Building Blocks – An overview of the 2015 Adult Financial Capability Survey
10
Filling the gaps in capability The survey has identified a number of consumer groups where behaviour is much weaker than the average in one domain or another, or where the scores for one or more financial capability factor are noticeably lower. The Money Advice Service plans to explore some of the issues raised by this analysis in more detail in the near future.
Consumer group Areas of weaker behaviour Lower internal financial capability
Ease and access issues
Young adults ■ poor budgeting
■ over-use of credit
■ low savings
■ lower confidence managing money and choosing financial products
■ less likely to shop around
Oldest (aged 75+) ■ decline in skills and knowledge
■ digital access and confidence
■ discussing finances with others
Benefit recipients ■ inability to keep up with bills and commitments
■ greater reliance on pen-and-paper methods of keeping track might be an issue
■ low savings
■ over-use of credit
■ More likely to be indebted
■ lower confidence managing money and choosing financial products
■ weaker skills and knowledge
■ access to suitable financial products may be an issue e.g. greater use of pre-pay for electricity
■ lower digital access and confidence
Social housing tenants ■ lower savings
■ more likely to be indebted
■ lower confidence managing money and choosing financial products
■ weaker skills and knowledge
■ less likely to shop around
■ lower digital access and confidence
Private sector tenants ■ over-use of credit
■ More likely to be indebted
■ less financially engaged
■ tend to think they are too busy to sort their finances
■ focus on living for today
■ don’t believe saving to be important
■ lower confidence managing money and choosing financial products

Barriers and Building Blocks – An overview of the 2015 Adult Financial Capability Survey
11
ConclusionsPeople in the UK do not manage their money as well as they might and this has knock-on effects for their ability to plan for and manage life events. Around six in ten manage their day-to-day finances reasonably well but only half that number plan for the future or have built up their financial resilience. Excessive use of credit is still an issue for some people and around eight million find their debts a heavy burden or have been in arrears.
These findings are in line with previous research and suggest that improving financial capability is a major challenge. In some consumer segments, behaviour is noticeably weaker and there are clear gaps in skills, knowledge, confidence or motivation. Ease of understanding and accessing financial products and services can also be an issue, especially for the oldest members of society.
Whilst income is a key driver of many measures of capability it is certainly not the only factor. Attitudes and motivations, as well as social norms, play an important role. So too does the extent to which consumers keep track of their money – although this may of course be partly a function of those same attitudes and motivations.
One conclusion to emerge from this research is that if we want more people to save more and save more often, we need to address a number of potential barriers. Firstly, consumers need to keep track of their money, to know how much is coming in and going out of their accounts. This concept may be more appealing to some consumers than something labelled ‘budgeting’. Then, people need a relatively short-term savings goal and the belief that they can achieve it. Once they have proved to themselves that they can save, and have directly experienced the benefits of saving, then they need to be encouraged to think about building up their resilience and taking a longer-term view. There is also some evidence that adopting a ‘jam jar’ approach to the household finances can facilitate saving.
There may well be a role for financial technology to play in making these processes easier but we need to recognise that a significant minority have not embraced online banking and still rely on paper bank statements. Whilst this is a particular issue for the oldest people, they are not the only ones who are ‘digitally excluded’.
This survey has been just one step in understanding how we might raise the overall levels of financial capability. More research and testing is needed in order to design and deliver interventions that create effective building blocks or successfully address the barriers to greater capability.
Money Advice Service Holborn Centre 120 Holborn London EC1N 2TD November 2015
For more information on our Insight and Evaluation work, go to: www.moneyadviceservice.org.uk/ en/corporate/research