barnes, henshaw, caselli, kong, jim´enez-serra, fontani, … · important to study the physical...
TRANSCRIPT

arX
iv:1
602.
0679
8v1
[as
tro-
ph.G
A]
18
Feb
2016
MNRAS 000, 1–10 (2015) Preprint 23 February 2016 Compiled using MNRAS LATEX style file v3.0
Widespread deuteration across the IRDC G035.39-00.33⋆
A . T. Barnes1,2†, S. Kong3, J. C. Tan3,4, J. D. Henshaw1, P. Caselli5,
I. Jimenez-Serra6 and F. Fontani71Astrophysics Research Institute, Liverpool John Moores University, 146 Brownlow Hill, Liverpool L3 5RF, UK2School of Physics and Astronomy, University of Leeds, LS2 9JT, Leeds, UK3Department of Astronomy, University of Florida, Gainesville, FL 32611, USA4Department of Physics, University of Florida, Gainesville, FL 32611, USA5Max-Plank-Institute for Extraterrestrial Physics (MPE), Giessenbachstrasse 1, 85748 Garching, Germany6University College London, Department of Physics and Astronomy, 132 Hampstead Road, London NW1 2PS, UK7INAF - Osservatorio Astrofisico di Arcetri, L.go E. Fermi 5, I-50125, Firenze, Italy
Accepted 2016 February 18. Received 2016 February 15; in original form 2015 October 19.
ABSTRACT
Infrared Dark Clouds (IRDCs) are cold, dense regions that are usually foundwithin Giant Molecular Clouds (GMCs). Ongoing star formation within IRDCs istypically still deeply embedded within the surrounding molecular gas. Characteris-ing the properties of relatively quiescent IRDCs may therefore help us to understandthe earliest phases of the star formation process. Studies of local molecular cloudshave revealed that deuterated species are enhanced in the earliest phases of star for-mation. In this paper we test this towards IRDC G035.39-00.33. We present an 80′′
by 140′′ map of the J = 2 → 1 transition of N2D+, obtained with the IRAM-
30m telescope. We find that N2D+ is widespread throughout G035.39-00.33. Comple-
mentary observations of N2H+ (1 − 0) are used to estimate the deuterium fraction,
DN2H+
frac ≡N (N2D+)/N (N2H
+). We report a mean DN2H+
frac =0.04± 0.01, with a maxi-
mum of DN2H+
frac =0.09± 0.02. The mean deuterium fraction is ∼ 3 orders of magnitudegreater than the interstellar [D]/[H] ratio. High angular resolution observations arerequired to exclude beam dilution effects of compact deuterated cores. Using chemical
modelling, we find that the average observed values of DN2H+
frac are in agreement with anequilibrium deuterium fraction, given the general properties of the cloud. This impliesthat the IRDC is at least ∼ 3Myr old, which is ∼ 8 times longer than the mean free-falltime of the observed deuterated region.
Key words: stars: formation: high-mass; ISM: clouds; ISM: individual (G035.39-00.33); ISM: molecules.
1 INTRODUCTION
Infrared Dark Clouds (IRDCs) are regions of cold (T < 25K;e.g. Ragan et al. 2011) and dense (n(H2) ≥ 103−4 cm−3; e.g.Hernandez et al. 2011; Butler & Tan 2012) gas, the mostmassive and dense of which have the potential to host theearliest stages of massive star and star cluster formation(Tan et al. 2014). Thus to understand these processes it isimportant to study the physical and chemical properties ofIRDCs.
⋆ Based on observations carried out with the IRAM 30m Tele-scope. IRAM is supported by INSU/CNRS (France), MPG (Ger-many) and IGN (Spain).† E-mail: [email protected]
In such cold and dense environments, some molecules“freeze-out” onto the surfaces of dust grains forming icymantles. Most notably CO is found to be highly depletedtowards dense clouds within IRDCs (e.g. Fontani et al.2012b; Giannetti et al. 2014), with line of sight CO deple-tion factors, fD, of a few being reported towards the IRDC,G035.39-00.33 (i.e. the observed gas phase abundance of COis a few times smaller than expected in the case of no deple-tion; Hernandez et al. 2011).
Unlike CO, N-bearing species, in particular NH3
and N2H+, better trace dense and cold gas (e.g.
Caselli et al. 1999; Bergin et al. 2002; Bergin & Tafalla2007; di Francesco et al. 2007; Fontani et al. 2012a,c). Thisis due to the fact that CO, largely frozen out, is unable to
c© 2015 The Authors

2 Barnes, Henshaw, Caselli, Kong, Jimenez-Serra, Fontani, Tan
Table 1. Frequency (MHz), Velocity Resolution, Beam Size, and Beam & Forward Efficiency for the observed transitions. Note that theForward and Beam Efficiencies have been extrapolated from the telescope specified values to the transition frequencies1.
Transition ν (MHz) ∆νres Beam Size1 Beam1 Forward1
( km s−1) (arcsec) Eff Eff
N2D+ (2− 1) 154217.18a 0.31 16 0.66 0.93
N2H+ (1− 0)b 93176.25c 0.61 26 0.74 0.95
C18O(1− 0) 109782.17d 0.053 22 0.73 0.97
1: www.iram.es/IRAMES/mainWiki/Iram30mEfficiencies .a: Main hyperfine component, J=2-1, F1= 3-2, F=4-3, from Dore et al. (2004), with the central frequency updated to the value foundin the CDMS catalogue (www.astro.uni-koeln.de/cdms/catalog).b: Data from Paper IV.c: Isolated hyperfine component, J= 1-0, F1= 0-1, F= 1-2, Pagani et al. (2009b).d: Cazzoli et al. (2003)
effectively destroy their molecular ion precursors (such asNH+ and H+
3 ), and hence less efficiently convert N2H+ into
HCO+. CO depletion, therefore, can boost the formation ofnitrogen-bearing species. Furthermore, in the cold and denseenvironments of molecular clouds, abundances of deuter-ated nitrogen-bearing molecules are enhanced, as the forma-tion rates of the deuterated forms of H+
3 also increase withCO freeze-out (e.g. Dalgarno & Lepp 1984; Walmsley et al.2004). These molecules are produced mainly by the exother-mic proton-deuteron exchange reaction (for para-state reac-tants and products; Pagani et al. 1992):
H+3 +HD → H2D
+ +H2 +∆E, (1)
where ∆E = 232K (Millar et al. 1989). For significant levelsof CO depletion, temperatures below 30K, and for an ortho-to-para H2 ratio less than ∼ 0.1 − 0.01 (e.g. Sipila et al.2013; Kong et al. 2015), this reaction proceeds from left toright, producing an excess of H2D
+ and an abundance ratio([H2D
+]/[H+3 ]) orders of magnitude larger than the interstel-
lar [D]/[H] ratio (∼ 1.5 × 10⁻⁵; e.g. Oliveira et al. 2003).Once the deuterated isotopologues of H+
3 have formed, theycan easily cede a deuteron to other neutral species andenhance their abundances. For example, the reactions ofdeuterated isotopologues of H+
3 with N2 can produce N2D+
increasing the deuteration fraction of N2H+, DN2H
+
frac (weadopt the notation used by Kong et al. 2015, where the non-deuterated counterpart is shown in superscript).
Measurements of DN2H+
frac towards low-mass coresrange between ≃ 0.1 − 0.7 (e.g. Crapsi et al. 2004;Belloche et al. 2006; Friesen et al. 2010, 2013; Crapsi et al.2005; Pagani et al. 2007; Bourke et al. 2012). For a sampleof potential high-mass star forming regions, Fontani et al.
(2006) found DN2H+
frac ≃ 0.015. Miettinen et al. (2011) found
DN2H+
frac ≃ 0.002-0.028 toward massive clumps within severalIRDCs, while deuterium fractions as high as in low-massprestellar cores have been observed toward massive starlessclumps/cores embedded in quiescent IRDCs (Fontani et al.2011).
This paper focusses on the massive (17,000± 5000M⊙;Kainulainen & Tan 2013), filamentary IRDC, G035.39-00.33which resides at a distance of 2.9± 0.5 kpc (Simon et al.2006)1. This IRDC was first identified as having the poten-
1 Following Hernandez et al. (2011), we adopt the kinematic dis-
tial to host massive cluster formation by Rathborne et al.(2006). The extinction mapping of Butler & Tan (2012)found several high mass surface density “cores” withinG035.39-00.33, most notably the “H6” region which con-tains ∼ 70M⊙ of material within a radius of ∼ 0.25 pc.In recent years this IRDC has been the subject ofan in-depth analysis, which has focussed on: large-scaleshocks traced by SiO emission (Jimenez-Serra et al. 2010,Paper I,), widespread CO depletion (Hernandez et al. 2011,Paper II), the virial state of the cloud (Hernandez et al.2012, Paper III) and the kinematics of the low and high den-sity gas and the excitation conditions in the cloud at vary-ing scales (Henshaw et al. 2013; Jimenez-Serra et al. 2014;Henshaw et al. 2014, Paper IV; PaperV; PaperVI, respec-tively). As widespread CO depletion has been found inG035.39-00.33, this cloud is an ideal candidate to also ex-hibit widespread deuteration. This paper presents IRAM-30m N2D
+ (2 − 1) observations of G035.39-00.33, with theaim of estimating the column density and deuterium frac-tion, and ultimately finding the evolutionary state of thecloud.
2 OBSERVATIONS
The N2D+ (2 − 1) observations were carried out through-
out August 2009 with the Institut de RadioastronomieMillimetrique 30-m telescope (IRAM-30m) at Pico Veleta,Spain. The large-scale images were obtained in the On-The-Fly (OTF) mapping mode. The central coordinates ofthe maps are α(J2000) = 18h57m08s, δ(J2000) = 02◦10′30′′
(l =35.517◦, b= -0.274◦). The off-source position used was(300′′, 0′′; in relative coordinates). The EMIR receivers wereused. The VErsatile SPectrometer Assembly (VESPA) pro-vided a spectral resolution at 156 kHz (equivalent to 0.3kms−1) at the frequency of the N2D
+(2− 1) line (main hy-perfine component frequency 154217.1805 MHz; Dore et al.2004). The data were converted into main beam brightnesstemperature, TMB, from antenna temperature, T∗
A, by us-ing the beam and forward efficiencies shown in Table 1. Sat-
tances of Simon et al. (2006), who assumed the Clemens (1985)rotation curve. This leads to a distance of 2.9 kpc for G035.39-00.33. The uncertainties in this distance are likely to be of order0.5 kpc, which could result, for example, from line-of-sight non-circular motions of ∼ 8 km s−1.
MNRAS 000, 1–10 (2015)

Widespread deuteration throughout IRDC G035.39-00.33 3
urn was observed to calculate the focus, and pointing waschecked every ∼ 2 hours on G34.3+0.2. The data were cal-ibrated with the chopper-wheel technique (Kutner & Ulich1981), with a calibration uncertainty of ∼ 20%. Informationon the beam sizes, frequencies, velocity resolutions are sum-marised in Table 1.
gildas2 packages class and mapping were used to
post-process the data. This included subtracting a single-order polynomial function to produce a flat baseline, andconvolving the OTF-data with a Gaussian kernel, increas-ing the signal- to-noise ratio, and allowing us to resamplethe data onto a regularly spaced grid. The absolute angu-lar resolution of the IRAM-30m antenna at the frequencyof the J=2 → 1 transition of N2D
+ is ∼ 16′′. Throughoutthis work, all line data are spatially smoothed to achieve aneffective angular resolution of ∼ 27′′, with a pixel spacing of13.5′′, to allow comparison with the N2H
+data.We utilise the N2H
+ (1 − 0) map from Paper IV (seethis paper for more information on the N2H
+observations),CO depletion map of Paper III, and the mass surface densitymap from Kainulainen & Tan (2013).
3 RESULTS
Figure 1 presents the averaged spectrum for the mapped re-gion, and some example spectra taken at positions of highintegrated intensity (see Figure 2). All emission above a 3σlevel of ∼ 0.21K km s−1(σ=σRMS ∆νres
√Nch; where σRMS
is the root mean square noise of the spectrum in K, Nch is thenumber of channels and ∆νres is the velocity resolution inkms−1), is seen within a velocity range of 40 − 50 kms−1.This range is comparable to that found by the previouslymentioned works on this cloud, and therefore we can be con-fident that the observed N2D
+ emission is associated withG035.39-00.33.
Each spectrum has been inspected by-eye for the pres-ence of multiple velocity components previously identified inN2H
+ and C18O emission (Paper IV; with mean N2H+ emis-
sion velocities of 42.95± 0.17 km s−1, 45.63± 0.03 kms−1,and 46.77± 0.06 kms−1). However, evidence of only onecomponent, centred at ∼ 46 km s−1 was found in the N2D
+
data. Unlike the N2H+ (1 − 0) line, where one of the seven
hyperfine components is isolated, N2D+ (2 − 1) possesses
no isolated hyperfine components; the line is a blend of40 hyperfine components, spread across a velocity rangeof 14.6 km s−1 (as shown in Figure 1, upper panel). This,as well as linewidths of ∼ 1 kms−1 (i.e. similar to those ofN2H
+ (1−0); Paper IV), makes the identification of multiplevelocity components very difficult.
Figure 2 presents a map of the N2D+ (2 − 1) emis-
sion integrated between 40 − 50 km s−1. The integratedintensity contours are overlaid on the mass surface den-sity map of Kainulainen & Tan (2013), and superimposedare the positions of the massive cores first identified byRathborne et al. (2006) in millimetre continuum emission,which have been repositioned to the mid-infrared extinctionpeaks by Butler & Tan (2012). In Figure 2 we also showthe location and strength of the 4.5µm emission (‘green
2 see https://www.iram.fr/IRAMFR/GILDAS/
25 30 35 40 45 50 55 60 65
Velocity (kms−1 )
−0.06
−0.04
−0.02
0.00
0.02
0.04
0.06
TMB (
K)
Average
−0.10−0.05
0.000.050.100.150.20
TMB (
K)
1
−0.10−0.05
0.000.050.100.150.20
TMB (
K)
2
−0.10−0.05
0.000.050.100.150.20
TMB (
K)
3
−0.10−0.05
0.000.050.100.150.20
TMB (
K)
4
25 30 35 40 45 50 55 60 65
Velocity (kms−1 )
−0.10−0.05
0.000.050.100.150.20
TMB (
K)
5
Figure 1. The upper panel shows the average spectrum ofN2D+ (2 − 1) for all positions (red histogram). The verticalblack lines below the spectrum indicate the positions and rela-tive strengths of all the hyperfine components of the N2D+ (2 −
1) transition (Dore et al. 2004), assuming a rest velocity of45.5 km s−1. The lower panels are example spectra taken frompositions of high integrated intensity, represented as the boxes onFigure 2. The dotted lines represent a velocity of 45.5 km s−1.
fuzzies’; Chambers et al. 2009), and the 8µm and 24µm(Carey et al. 2009). The N2D
+ emission is concentrated to-wards the “H6” region, and the south, near H2, H3, H4 andH5 “core” regions. However, when considering the 2σ emis-sion level there is evidence to suggest that the emission isextended across a large portion of the cloud.
4 ANALYSIS
4.1 Column density
The column densities are calculated from the integrated in-tensity of the N2D
+ (2 − 1) line, following the procedure
MNRAS 000, 1–10 (2015)

4 Barnes, Henshaw, Caselli, Kong, Jimenez-Serra, Fontani, Tan
Figure 2. The left panel shows the integrated intensity map of N2D+ (2 − 1) emission seen in contours of 2σ (dotted contour), 3σ, 4σand 5σ; where σ=0.07K km s−1. Overlaid are boxes which represent the positions of the spectra shown in Figure 1. The right panelshows the integrated intensity contours of the N2H+ (1 − 0) emission, data taken from Paper IV; contours are 5, 10 and 15σ, whereσ ∼ 0.11K km s−1. Each contour map is overlaid on the mass surface density map (Kainulainen & Tan 2013). White crosses indicatethe positions of the massive cores (Butler & Tan 2012), and the symbols indicate the positions of the 8µm and 24µm sources (greentriangles and cyan pentagons, respectively; Carey et al. 2009), and the 4.5µm extended emission sources or ‘green fuzzies’ (orange circles;Chambers et al. 2009). The size of each source represents the strength of the emission (Paper I). The hatched circle represents the effectivespatial resolution of the observations (after smoothing).
outlined in Caselli et al. (2002b) for optically thin emission.This is a reasonable assumption based on the relatively faintlines detected across the cloud. We assume a constant exci-tation temperature of Tex ∼ 4.5K (equivalent to the meanTex derived from the N2H
+ observations; Paper IV). Note,that ranging the Tex between 4-20K would cause the columndensity to vary by N (N2D
+)+30%−60%
.The mean beam-averaged column density is
N (N2D+)= 6.2± 1.4× 1011 cm−2, when imposing a
three sigma threshold on the N2D+ (2 − 1) emis-
sion. The maximum beam-averaged column density ofN2D
+ is found toward the H6 region, with a value ofN (N2D
+)= 8.0± 1.4× 1011 cm−2.
4.2 Deuterium fraction
The N2D+ to N2H
+ column density ratio is used to de-fine the deuterium fraction across the mapped region. Fig-ure 3 shows the deuterium fraction for positions where theemission of both N2D
+ and N2H+ is detected above a 2σ
(cross hatched), above a 2.5 σ (hatched), and above a 3σ(no hatch) level. We find values of the deuteration fractionslarger than 0.01 widespread throughout the cloud, with thehighest values found towards the north.
Taking into account only the emission above 3 σ, themean beam-averaged deuterium fraction across G035.39-
00.33 is DN2H+
frac =0.04± 0.01. The maximum value isfound north of the “H6” region (at α(J2000) =18h57m09s,
δ(J2000) = 02◦11′39′′), with a value of DN2H+
frac =0.09± 0.02.Note that varying the excitation temperature for both N2H
+
Figure 3. A map of the deuterium fraction. This map includesthe emission of both N2D+ and N2H+ detected at a 2σ levelshown cross hatched, above a 2.5σ level shown hatched, andabove 3σ with no hatch. Symbols are identical to those in Fig-ure 2.
and N2D+ between 4-20K would cause would cause a change
of DN2H+
frac+15%−55%
.
MNRAS 000, 1–10 (2015)

Widespread deuteration throughout IRDC G035.39-00.33 5
Figure 4. Column density of N2H+ as a function of the columndensity of N2D+, for the values found in this work and thosefound within the literature; triangles represent the low-mass starforming regions, the additional shapes represent high-mass starforming regions. Note that only the high-mass protostellar ob-jects and starless clumps (HMPO and HMSC, respectively), andIRDCs are plotted from the surveys of Fontani et al. (2011) andGerner et al. (2015). The lines overlaid represent deuterium frac-
tions of DN2H+
frac = [0.001, 0.01, 0.04, 0.1, 1.0] from right to left,respectively.
5 DISCUSSION
5.1 G035.39-00.33 in the context of other
star-forming regions
As in low-mass star-forming regions, the deuterium frac-tion of massive star-forming regions is believed to be agood evolutionary tracer (e.g. Fontani et al. 2011). However,the exact boundaries to define an evolutionary state arestill poorly understood. To show this, plotted on Figure 4is the column densities of N2D
+ and N2H+ found in this
work, and for various other high-mass (Fontani et al. 2006,2011; Miettinen et al. 2011; Gerner et al. 2015; Kong et al.2016) and low-mass (triangles only; Crapsi et al. 2005;Friesen et al. 2010, 2013) cores described within the liter-ature.
We find that our deuterium fractions are most similarto those found in IRDCs by Gerner et al. (2015), who foundmean values of ∼ 0.01-0.1 (observed at spatial resolution ofa ∼ few 10′′, at ∼ 4 kpc). However, our values are an order ofmagnitude lower than the values observed by Fontani et al.(2011) and Kong et al. (2016) towards high-mass starless
cores (HMSCs), where DN2H+
frac ∼ 0.3. Gerner et al. (2015)suggest that the low deuteration values found in their sam-ple of IRDCs may be due to the presence of unresolvedevolved objects (24µm sources). This could also be the casefor G035.39-00.33, as the average deuterium fraction is alsoclose to the values observed towards high-mass protostellarcandidates (∼ 0.04; Fontani et al. 2006, 2011).
To investigate how the N2H+and N2D
+ emission andthe deuterium fraction vary within G035.39-00.33, we plotthem as a function of mass surface density in Figure 5. If weconsider only the positions above a 3σ error threshold, thecolumn density of N2D
+ remains relatively constant withincreasing mass surface density (dynamical range of ∼ 1.5,which is similar to the scale of the uncertainties). However,for the same positions, the column density of N2H
+ showsa significant positive gradient with increasing mass surfacedensity (dynamical range of ∼ 3). This is reflected in the plotof deuterium fraction as a function of mass surface density,which shows an overall negative correlation. This is consis-tent with a picture in which the N2D
+ is more spatiallyconcentrated in cores than the N2H
+, which is also presentin the clump envelope (that dominates the mass).
Observations show that the deuterium fraction is highlysensitive to the level of CO freeze-out (e.g. Caselli et al.2002a), where the CO depletion factor, fD, can be expressedas the ratio of the observed mass surface density to mass sur-face density derived from CO emission, assuming a referenceCO fractional abundance with respect to H2. Paper III cal-culated the CO depletion averaged along each line-of-sight(i.e. each pixel) throughout G035.39-00.33, f ′
D, which is nor-malised such that on average pixels with mass surface den-sities of 0.01 g cm−2< Σ <0.03 g cm−2 are unity. Figure 5displays the deuterium fraction as a function of normalisedCO depletion factor, for which we do not see a positive corre-lation, but rather again an anti-correlation. This is contraryto what is expected, that level of deuteration is elevated indense, CO depleted cores; but it is reminiscent of the re-sults recently obtained toward the Ophiuchus low-mass starforming region (Punanova et al. 2015). These authors sug-gest that the highly deuterated but CO-rich cores may berecently formed, centrally concentrated starless cores.
These results could indicate that along the line-of-sight,high mass surface density and CO depleted positions haveenhanced N2H
+, but the N2D+ is only tracing a portion of
this in the 3rd dimension. We, therefore, suggest that mea-surements of the deuterium fraction in massive star-formingregions could be limited by low spatial resolution observa-tions (beam dilution), and/or the relatively unknown evo-lutionary stage of the gas (whether or not it has reachedchemical equilibrium or is being influenced by the presenceof YSOs). These are discussed in more detail in the followingsection.
5.2 Comparison with chemical models
To determine if the observed levels of deuteration are con-sistent with the current evolutionary stage of the G035.39-00.33, we have conducted a series of chemical models(Kong et al. 2015). The model consists of the Nahoon codeand a reduced network extracted from KIDA database(Wakelam et al. 2012), including the elements H, D, He, C,N, O. The chemical species traced by the code contain upto 3 atoms in size, except for H3O
+ and its deuterated iso-topologues, which significantly improve the consistency witha more complete network (Sipila et al. 2013). Spin states ofH2, H
+3 and their deuterated isotopologues are included, and
the formation of o-H2, p-H2, HD, o-D2, p-D2 on dust grainsurface are considered following Le Petit et al. (2002). Wefollow Pagani et al. (2009a) in calculating the dissociative
MNRAS 000, 1–10 (2015)

6 Barnes, Henshaw, Caselli, Kong, Jimenez-Serra, Fontani, Tan
Figure 5. Shown in the panels are the N2H+ (upper left) and N2D+ (upper right) column densities as a function of mass surface density,deuterium fraction as a function of mass surface density (lower left), and deuterium fraction as a function of normalised CO depletion
factor (lower right). Average errors for N2D+column density and DN2H+
fracare displayed in the upper right of each plot. Not shown are
the errors on the mass surface density and CO depletion, which are ∼30% (Kainulainen & Tan 2013) and ∼50% (Paper III), respectively.The solid and transparent points represent positions where both the N2H+ and N2D+ emission is above a 3σ and 2σ error threshold,respectively.
recombination rates of all forms of H+3 . The initial elemen-
tal abundances are listed in table 2 in Kong et al. (2015).In this paper, we treat the depletion of neutral species byreducing the initial elemental abundances of C, N, O by thedepletion factor, fD, and consider a broad combination ofphysical conditions appropriate for IRDC G035.39-00.33.
We explore a grid of models with Av = [5, 10, 20,30]mag, nH = [0.1, 1, 2, 10] × 104 cm−3, Tkin = [10, 15, 20]
K, fD = [1, 2, 3, 5, 10], to check the equilibrium DN2H+
frac and
timescale. We adopt a constant radiation field four timesstronger than the standard Habing field (G0), however be-cause of high visual extinction values considered here, smallchanges of G0 do not affect the chemistry. We also ex-plore initial ortho-to-para H2 ratios of OPRH2
0 = 0.001-3.A OPRH2
0 = 3 represents the high temperature statisticalratio limit, as ortho- and para-H2 are formed at high tem-peratures on dust grains in the ratio of their nuclear spinstate statistical weights (3:1; Flower 2003). OPRH2
0 = 0.1-1
MNRAS 000, 1–10 (2015)

Widespread deuteration throughout IRDC G035.39-00.33 7
Figure 6. Time evolution of the OPRH2 (upper panel) and
DN2H+
frac (lower panel) under different assumptions of the ini-tial OPRH2 , for nH =104 cm−3, fD =3, Tkin = 15K andAv =20mag. We explore OPRH2 from 3 down to 0.001.
are values close to those deduced by Crabtree et al. (2011)in translucent clouds with T = 50-70 K: 0.8-0.3. Recently,Xu et al. (2016) made some rough constraints on the H2
ortho-to-para ratio for the low density gas within Taurus.These authors estimate OPRH2 ∼ 0.2. Lower values areexpected in dark molecular clouds (see Sipila et al. 2013).Therefore, our OPRH2
0 exploration covers typical values ob-served in molecular clouds.
Table 2 presents the results of a subset of models withinput parameters which best represent the global propertiesof G035.39-00.33. Shown are the equilibrium deuterium frac-
tion, DN2H+
frac,eq, the time taken to achieve 90% of this value.Variation of the extinction is not displayed in the Table,as ranging Av between [10, 20, 30]mag does not signifi-cantly effect the results, however an extinction of 5mag
tends to decrease the DN2H+
frac,eq and the time by a factor ofa few. This is not thought to be an issue as the mapped re-gion of G035.39-00.33 has an average extinction of ∼ 20mag(Kainulainen & Tan 2013).
The observed deuterium fractions within G035.39-00.33are generally similar with the model equilibrium values, for
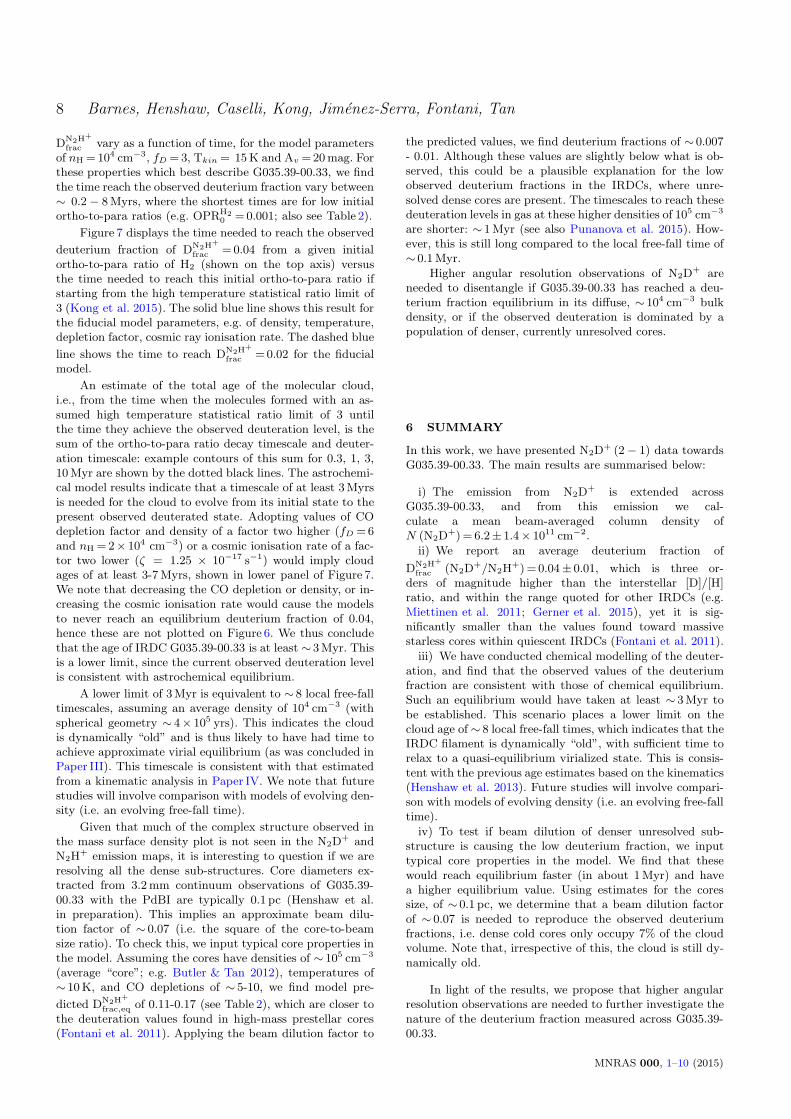
Figure 7. Time to reach the observed deuterium fraction
(DN2H+
frac =0.04) from a given initial ortho-to-para ratio of H2
(shown on the top axis) versus the time to reach this initialortho-to-para ratio if starting from statistical equilibrium ratioof 3. The solid blue line shows this result for the fiducial modelparameters, e.g. of density, temperature, depletion factor, cosmicray ionisation rate. Grey dotted lines show contours of the sum ofthe deuteration timescale and ortho-to-para ratio decay timescaleto equal 0.3, 1, 3, 10Myr, as labelled. The dashed blue line (up-
per panel) shows the time to reach DN2H+
frac =0.02 for the fiducialmodel. The dashed and dot-dashed lines (lower panel) show theeffect of varying several of the model parameters, as labelled.
kinetic temperatures of 10K and 15K. If we assume that thecloud has a mean global density nH ∼ 104 cm−3 (Paper III),a mean CO depletion of fD =3, and assume the mean kinetictemperature is comparable to the ∼ 15K dust temperaturefound by Nguyen Luong et al. (2011), the model predicted
equilibrium value is DN2H+
frac,eq =0.048, remarkably close to the
average observed value of DN2H+
frac =0.04± 0.01.Figure 6 shows how the ortho-to-para ratio of H2 and
MNRAS 000, 1–10 (2015)
8 Barnes, Henshaw, Caselli, Kong, Jimenez-Serra, Fontani, Tan
DN2H+
frac vary as a function of time, for the model parametersof nH =104 cm−3, fD =3, Tkin = 15K and Av =20mag. Forthese properties which best describe G035.39-00.33, we findthe time reach the observed deuterium fraction vary between∼ 0.2− 8Myrs, where the shortest times are for low initialortho-to-para ratios (e.g. OPRH2
0 =0.001; also see Table 2).
Figure 7 displays the time needed to reach the observed
deuterium fraction of DN2H+
frac =0.04 from a given initialortho-to-para ratio of H2 (shown on the top axis) versusthe time needed to reach this initial ortho-to-para ratio ifstarting from the high temperature statistical ratio limit of3 (Kong et al. 2015). The solid blue line shows this result forthe fiducial model parameters, e.g. of density, temperature,depletion factor, cosmic ray ionisation rate. The dashed blue
line shows the time to reach DN2H+
frac =0.02 for the fiducialmodel.
An estimate of the total age of the molecular cloud,i.e., from the time when the molecules formed with an as-sumed high temperature statistical ratio limit of 3 untilthe time they achieve the observed deuteration level, is thesum of the ortho-to-para ratio decay timescale and deuter-ation timescale: example contours of this sum for 0.3, 1, 3,10Myr are shown by the dotted black lines. The astrochemi-cal model results indicate that a timescale of at least 3Myrsis needed for the cloud to evolve from its initial state to thepresent observed deuterated state. Adopting values of COdepletion factor and density of a factor two higher (fD =6and nH =2× 104 cm−3) or a cosmic ionisation rate of a fac-tor two lower (ζ = 1.25 × 10⁻¹⁷ s−1) would imply cloudages of at least 3-7Myrs, shown in lower panel of Figure 7.We note that decreasing the CO depletion or density, or in-creasing the cosmic ionisation rate would cause the modelsto never reach an equilibrium deuterium fraction of 0.04,hence these are not plotted on Figure 6. We thus concludethat the age of IRDC G035.39-00.33 is at least ∼ 3Myr. Thisis a lower limit, since the current observed deuteration levelis consistent with astrochemical equilibrium.
A lower limit of 3Myr is equivalent to ∼ 8 local free-falltimescales, assuming an average density of 104 cm−3 (withspherical geometry ∼ 4× 10⁵ yrs). This indicates the cloudis dynamically “old” and is thus likely to have had time toachieve approximate virial equilibrium (as was concluded inPaper III). This timescale is consistent with that estimatedfrom a kinematic analysis in Paper IV. We note that futurestudies will involve comparison with models of evolving den-sity (i.e. an evolving free-fall time).
Given that much of the complex structure observed inthe mass surface density plot is not seen in the N2D
+ andN2H
+ emission maps, it is interesting to question if we areresolving all the dense sub-structures. Core diameters ex-tracted from 3.2mm continuum observations of G035.39-00.33 with the PdBI are typically 0.1 pc (Henshaw et al.in preparation). This implies an approximate beam dilu-tion factor of ∼ 0.07 (i.e. the square of the core-to-beamsize ratio). To check this, we input typical core properties inthe model. Assuming the cores have densities of ∼ 105 cm−3
(average “core”; e.g. Butler & Tan 2012), temperatures of∼ 10K, and CO depletions of ∼ 5-10, we find model pre-
dicted DN2H+
frac,eq of 0.11-0.17 (see Table 2), which are closer tothe deuteration values found in high-mass prestellar cores(Fontani et al. 2011). Applying the beam dilution factor to
the predicted values, we find deuterium fractions of ∼ 0.007- 0.01. Although these values are slightly below what is ob-served, this could be a plausible explanation for the lowobserved deuterium fractions in the IRDCs, where unre-solved dense cores are present. The timescales to reach thesedeuteration levels in gas at these higher densities of 105 cm−3
are shorter: ∼ 1Myr (see also Punanova et al. 2015). How-ever, this is still long compared to the local free-fall time of∼ 0.1Myr.
Higher angular resolution observations of N2D+ are
needed to disentangle if G035.39-00.33 has reached a deu-terium fraction equilibrium in its diffuse, ∼ 104 cm−3 bulkdensity, or if the observed deuteration is dominated by apopulation of denser, currently unresolved cores.
6 SUMMARY
In this work, we have presented N2D+ (2− 1) data towards
G035.39-00.33. The main results are summarised below:
i) The emission from N2D+ is extended across
G035.39-00.33, and from this emission we cal-culate a mean beam-averaged column density ofN (N2D
+)= 6.2± 1.4× 1011 cm−2.
ii) We report an average deuterium fraction of
DN2H+
frac (N2D+/N2H
+)=0.04± 0.01, which is three or-ders of magnitude higher than the interstellar [D]/[H]ratio, and within the range quoted for other IRDCs (e.g.Miettinen et al. 2011; Gerner et al. 2015), yet it is sig-nificantly smaller than the values found toward massivestarless cores within quiescent IRDCs (Fontani et al. 2011).
iii) We have conducted chemical modelling of the deuter-ation, and find that the observed values of the deuteriumfraction are consistent with those of chemical equilibrium.Such an equilibrium would have taken at least ∼ 3Myr tobe established. This scenario places a lower limit on thecloud age of ∼ 8 local free-fall times, which indicates that theIRDC filament is dynamically “old”, with sufficient time torelax to a quasi-equilibrium virialized state. This is consis-tent with the previous age estimates based on the kinematics(Henshaw et al. 2013). Future studies will involve compari-son with models of evolving density (i.e. an evolving free-falltime).
iv) To test if beam dilution of denser unresolved sub-structure is causing the low deuterium fraction, we inputtypical core properties in the model. We find that thesewould reach equilibrium faster (in about 1Myr) and havea higher equilibrium value. Using estimates for the coressize, of ∼ 0.1 pc, we determine that a beam dilution factorof ∼ 0.07 is needed to reproduce the observed deuteriumfractions, i.e. dense cold cores only occupy 7% of the cloudvolume. Note that, irrespective of this, the cloud is still dy-namically old.
In light of the results, we propose that higher angularresolution observations are needed to further investigate thenature of the deuterium fraction measured across G035.39-00.33.
MNRAS 000, 1–10 (2015)
Widespread deuteration throughout IRDC G035.39-00.33 9
ACKNOWLEDGEMENTS
We would like to thank the anonymous referee for their con-structive comments. Furthermore, we would like to thankMichael Butler and Jouni Kainulainen for providing us withthe mass surface density map, and Audra Hernandez forthe CO depletion factor map. This research has made useof NASA’s Astrophysics Data System. A.T.B would liketo acknowledge the funding provided by Liverpool JohnMoores University, Max-Plank -Institute for ExtraterrestrialPhysics, and the University of Leeds. P.C acknowledges thefinancial support of the European Research Council (ERC;project PALs 320620). I.J.-S. acknowledges the funding re-ceived from the STFC through an Ernest Rutherford Fel-lowship (proposal number ST/L004801/1). J.C.T. acknowl-edges NASA grant ADAP10-0110.
REFERENCES
Belloche A., Parise B., van der Tak F. F. S., Schilke P., LeuriniS., Gusten R., Nyman L.-A., 2006, A&A, 454, L51
Bergin E. A., Tafalla M., 2007, ARA&A, 45, 339Bergin E. A., Alves J., Huard T., Lada C. J., 2002, ApJL,
570, L101Bourke T. L., Myers P. C., Caselli P., Di Francesco J., Belloche
A., Plume R., Wilner D. J., 2012, ApJ, 745, 117Butler M. J., Tan J. C., 2012, ApJ, 754, 5Carey S. J., et al., 2009, PASP, 121, 76
Caselli P., Walmsley C. M., Tafalla M., Dore L., Myers P. C.,1999, ApJL, 523, L165
Caselli P., Walmsley C. M., Zucconi A., Tafalla M., Dore L., My-ers P. C., 2002a, ApJ, 565, 344
Caselli P., Benson P. J., Myers P. C., Tafalla M., 2002b, ApJ,572, 238
Cazzoli G., Puzzarini C., Lapinov A. V., 2003, ApJL, 592, L95Chambers E. T., Jackson J. M., Rathborne J. M., Simon R., 2009,
ApJS, 181, 360Clemens D. P., 1985, ApJ, 295, 422Crabtree K. N., Indriolo N., Kreckel H., Tom B. A., McCall B. J.,
2011, ApJ, 729, 15Crapsi A., Caselli P., Walmsley C. M., Tafalla M., Lee C. W.,
Bourke T. L., Myers P. C., 2004, A&A, 420, 957Crapsi A., et al., 2005, A&A, 439, 1023Dalgarno A., Lepp S., 1984, ApJL, 287, L47Dore L., Caselli P., Beninati S., Bourke T., Myers P. C., Cazzoli
G., 2004, A&A, 413, 1177Flower D., 2003, Molecular Collisions in the Interstellar MediumFontani F., Caselli P., Crapsi A., Cesaroni R., Molinari S., Testi
L., Brand J., 2006, A&A, 460, 709
Fontani F., et al., 2011, A&A, 529, L7+Fontani F., Palau A., Busquet G., Isella A., Estalella R., Sanchez-
Monge A., Caselli P., Zhang Q., 2012a, MNRAS, 423, 1691Fontani F., Giannetti A., Beltran M. T., Dodson R., Rioja M.,
Brand J., Caselli P., Cesaroni R., 2012b, MNRAS, 423, 2342Fontani F., Caselli P., Zhang Q., Brand J., Busquet G., Palau A.,
2012c, A&A, 541, A32Friesen R. K., Di Francesco J., Myers P. C., Belloche A., Shirley
Y. L., Bourke T. L., Andre P., 2010, ApJ, 718, 666Friesen R. K., Kirk H. M., Shirley Y. L., 2013, ApJ, 765, 59Gerner T., Shirley Y., Beuther H., Semenov D., Linz H., Aberts-
son T., Henning T., 2015, preprint, (arXiv:1503.06594)
Giannetti A., et al., 2014, A&A, 570, A65Henshaw J. D., Caselli P., Fontani F., Jimenez-Serra I., Tan J. C.,
Hernandez A. K., 2013, MNRAS, 428, 3425Henshaw J. D., Caselli P., Fontani F., Jimenez-Serra I., Tan J. C.,
2014, MNRAS, 440, 2860
Hernandez A. K., Tan J. C., Caselli P., Butler M. J., Jimenez-
Serra I., Fontani F., Barnes P., 2011, ApJ, 738, 11Hernandez A. K., Tan J. C., Kainulainen J., Caselli P., Butler
M. J., Jimenez-Serra I., Fontani F., 2012, ApJL, 756, L13Jimenez-Serra I., Caselli P., Tan J. C., Hernandez A. K., Fontani
F., Butler M. J., van Loo S., 2010, MNRAS, 406, 187Jimenez-Serra I., Caselli P., Fontani F., Tan J. C., Henshaw J. D.,
Kainulainen J., Hernandez A. K., 2014, MNRAS, 439, 1996Kainulainen J., Tan J. C., 2013, A&A, 549, A53Kong S., Caselli P., Tan J. C., Wakelam V., Sipila O., 2015, ApJ,
804, 98Kong S., et al., 2016, ApJ,Kutner M. L., Ulich B. L., 1981, ApJ, 250, 341Le Petit F., Roueff E., Le Bourlot J., 2002, A&A, 390, 369Miettinen O., Hennemann M., Linz H., 2011, A&A, 534, A134Millar T. J., Bennett A., Herbst E., 1989, ApJ, 340, 906Nguyen Luong Q., et al., 2011, A&A, 535, A76Oliveira C. M., Hebrard G., Howk J. C., Kruk J. W., Chayer P.,
Moos H. W., 2003, ApJ, 587, 235Pagani L., Salez M., Wannier P. G., 1992, A&A, 258, 479Pagani L., Bacmann A., Cabrit S., Vastel C., 2007, A&A, 467, 179Pagani L., et al., 2009a, A&A, 494, 623Pagani L., Daniel F., Dubernet M., 2009b, A&A, 494, 719Punanova A., Caselli P., Pon A., Belloche A., Andre P., 2015,
preprint, (arXiv:1512.02986)Ragan S. E., Bergin E. A., Wilner D., 2011, ApJ, 736, 163Rathborne J. M., Jackson J. M., Simon R., 2006, ApJ, 641, 389Simon R., Rathborne J. M., Shah R. Y., Jackson J. M., Chambers
E. T., 2006, ApJ, 653, 1325Sipila O., Caselli P., Harju J., 2013, A&A, 554, A92Tan J. C., Beltran M. T., Caselli P., Fontani F., Fuente
A., Krumholz M. R., McKee C. F., Stolte A., 2014,Protostars and Planets VI, pp 149–172
Wakelam V., et al., 2012, ApJS, 199, 21Walmsley C. M., Flower D. R., Pineau des Forets G., 2004, A&A,
418, 1035Xu D., Li D., Yue N., Goldsmith P. F., 2016, preprint,
(arXiv:1601.03165)di Francesco J., Evans II N. J., Caselli P., Myers P. C., Shirley
Y., Aikawa Y., Tafalla M., 2007, Protostars and Planets V,pp 17–32
This paper has been typeset from a TEX/LATEX file prepared by
the author.
MNRAS 000, 1–10 (2015)

10 Barnes, Henshaw, Caselli, Kong, Jimenez-Serra, Fontani, Tan
Table 2. Equilibrium deuterium fractions for models with an extinction of Av =20mag, number densities, nH, of 104 and 105 cm−3,and initial ortho-to-para H2 ratios of 0.001, 0.01, 0.1, and 1. Columns show the model inputs of gas kinetic temperature, Tkin, CO
depletion, and model outputs of equilibrium value of DN2H+
fracand the time taken to achieve 90% of this value, teq,90.
Tkin (K) fD DN2H+
frac,eq teq,90 (Myr)
OPRH2
0 = 0.001 OPRH2
0 = 0.01 OPRH2
0 = 0.1 OPRH2
0 = 1nH =104 cm−3 (tff =4.4× 10⁵ yrs)
10.0 1.0 0.021 0.73 3.24 6.19 8.3610.0 3.0 0.044 0.29 2.10 3.61 4.7310.0 5.0 0.057 0.24 1.79 3.01 3.9210.0 10.0 0.076 0.26 1.50 2.45 3.16
15.0 1.0 0.022 0.71 3.32 6.32 8.5015.0 3.0 0.048 0.27 2.06 3.52 4.6015.0 5.0 0.062 0.20 1.73 2.90 3.7615.0 10.0 0.083 0.19 1.43 2.32 2.99
20.0 1.0 0.015 0.39 2.91 6.48 8.7220.0 3.0 0.025 0.03 1.90 3.57 4.6520.0 5.0 0.029 0.003 1.61 2.91 3.7620.0 10.0 0.034 0.0005 1.32 2.32 2.96
nH =105 cm−3 (tff =1.4× 10⁵ yrs)10.0 1.0 0.026 0.67 2.87 5.23 6.9910.0 3.0 0.076 0.45 1.48 2.35 3.0210.0 5.0 0.111 0.40 1.13 1.75 2.2310.0 10.0 0.17 0.40 0.84 1.28 1.61
15.0 1.0 0.027 0.65 2.96 5.44 7.2715.0 3.0 0.079 0.32 1.48 2.37 3.0415.0 5.0 0.115 0.29 1.12 1.74 2.2115.0 10.0 0.175 0.28 0.83 1.26 1.58
20.0 1.0 0.017 0.35 2.67 5.69 7.6120.0 3.0 0.033 0.06 1.45 2.49 3.1820.0 5.0 0.04 0.01 1.09 1.81 2.2820.0 10.0 0.048 0.0004 0.79 1.27 1.59
MNRAS 000, 1–10 (2015)