barley products of different fiber composition selectively
TRANSCRIPT

Barley products of different fibre composition selectively changemicrobiota composition in rats
Downloaded from: https://research.chalmers.se, 2022-02-10 06:18 UTC
Citation for the original published paper (version of record):Teixeira, C., Prykhodko, O., Alminger, M. et al (2018)Barley products of different fibre composition selectively change microbiota composition in ratsMolecular Nutrition and Food Research, 62(19)http://dx.doi.org/10.1002/mnfr.201701023
N.B. When citing this work, cite the original published paper.
research.chalmers.se offers the possibility of retrieving research publications produced at Chalmers University of Technology.It covers all kind of research output: articles, dissertations, conference papers, reports etc. since 2004.research.chalmers.se is administrated and maintained by Chalmers Library
(article starts on next page)
RESEARCH ARTICLEMicrobiota www.mnf-journal.com
Barley Products of Different Fiber Composition SelectivelyChange Microbiota Composition in Rats
Cristina Teixeira,* Olena Prykhodko, Marie Alminger, Frida Fak Hallenius,and Margareta Nyman
Scope: Several dietary fiber properties are suggested to be important for theprofiling of the microbiota composition, but those characteristics are ratherunclear. Whether different physico-chemical properties of barley dietary fiberinfluence the gut microbiota composition is investigated.Methods and results: Seven diets containing equal amounts of dietary fiberfrom barley malts, brewer’s spent grain (BSG), and barley extracts, resulting invarying amounts of β-glucan, soluble arabinoxylan, and insolublearabinoxylan in the diets were given to conventional rats. Malts increasedmicrobiota alpha diversity more than BSG and the extracts. The intake ofsoluble arabinoxylan was related to Akkermansia and propionic acidformation in the cecum of rats, whereas β-glucan and/or insolublearabinoxylan were attributed to some potentially butyrate-producing bacteria(e.g., Lactobacillus, Blautia, and Allobaculum).Conclusion: This study demonstrates that there is a potential to stimulatebutyrate- and propionate-producing bacteria in the cecum of rats with maltproducts of specific fiber properties. Moreover, BSG, a by product from beerproduction, added to malt can possibly be used to further modulate themicrobiota composition, toward a higher butyric acid formation. A complexmixture of fiber as in the malts is of greater importance for microbiotadiversity than purer fiber extracts.
1. Introduction
There is increasing evidence of a relation between the consump-tion of dietary fiber and its effects on colonic microbiota compo-sition, and consequently to human health.Dietary fibers are indigestible food components reaching the
colon with the potential to be utilized by some species of the
Dr. C. Teixeira, Dr. O. Prykhodko, Dr. F. Fak Hallenius, Prof. M. NymanFood for Health Science CentreKemicentrumLund UniversitySE-221 00, Lund, SwedenE-mail: [email protected]
The ORCID identification number(s) for the author(s) of this articlecan be found under https://doi.org/10.1002/mnfr.201701023
C© 2018 The Authors. Published by WILEY-VCH Verlag GmbH & Co.KGaA, Weinheim. This is an open access article under the terms of theCreative Commons Attribution License, which permits use, distributionand reproduction in any medium, provided the original work is properlycited.
DOI: 10.1002/mnfr.201701023
microbiota and promote the growthof others, for example, through pHchanges and bacterial cross-feedingmechanisms.[1,2] Upon microbiotafermentation, dietary fibers can yielddifferent amounts and patterns of SCFA,mostly acetic-, propionic-, and butyricacids, which are rapidly absorbed by thecolonocytes into the circulation, servingas energy source and precursors inanti-inflammatory mechanisms.[3]
The characteristics of the dietaryfiber components reaching the colonmay affect the microbiota compositiondifferently, but this is not yet well un-derstood. Some studies suggest thatan increase of Lactobacillus in humanfeces[4] and in rat cecum[5] after con-sumption of β-glucan are due to theoligomeric form of β-glucan rather thanthe polymeric form. According to invitro studies, some Bifidobacterium andLactobacillius strains can utilize xylanoligosaccharides but not β-glucan.[6]
Furthermore, soluble arabinoxylan fromwheat are considered to be butyrogenic[7]
and propiogenic,[8] in humans and rats, respectively, and relatedwith the increase of Roseburia, Prevotella, and Bifidobacterium instudies on rodents.[9,10]
Barley is one of the most well-adapted cereal crops to differ-ent environmental conditions. There is growing interest for itsuse in human nutrition, due to its high content of dietary fiberand associated positive health effects, such as reduced risk of
Dr. C. Teixeira, Dr. M. AlmingerFood and Nutrition ScienceBiology and Biological EngineeringChalmers University of TechnologySE-412 96, Goteborg, SwedenDr. O. Prykhodko, Dr. F. Fak Hallenius, Prof. M. NymanFood TechnologyEngineering and NutritionKemicentrumLund UniversitySE-221 00, Lund, Sweden
Mol. Nutr. Food Res. 2018, 62, 1701023 1701023 (1 of 10) C© 2018 The Authors. Published by WILEY-VCH Verlag GmbH & Co. KGaA, Weinheim.

www.advancedsciencenews.com www.mnf-journal.com
Table 1. Contribution of dietary fiber components from the barley products in the diets, g per 100 g dry weight.a)
Tipple malt Cinnamon malt Standard malt BSG Mixtureb) AX extract BG extract
Total Fiber 8 (20) 8 (33) 8 (10) 8 (2.8) 8 (10) 8 (87) 8 (49)
Arabinoxylan 2.6 (5.0) 2.3 (10) 3.2 (4.6) 3.0 (1.0) 2.8 (2.6) 5.7 (76) 2.2 (2.9)
β-glucan 1.3 1.4 0.3 0.1 0.6 0.1 4.8
β-glucan Mw (g mol–1) ×106 1.4 1.3 1.0 0.4 1.1 0.07 1.6
a)Values in parenthesis refer to the soluble proportion of the fiber (%); b)Composed of Tipple malt and BSG (70:30).
cardiovascular diseases, type 2 diabetes, and colorectal cancer.[11]
β-glucan is especially highlighted in this respect, but also ara-binoxylan may be of interest, with physico-chemical propertiesdependent on variety and processing conditions, and in this waybeing a potential gut microbiota modulator.[12] Whole-grain bar-ley and especially barley malt resulted in higher levels of Blautia(butyrate-producer) in the hindgut of rats compared to a fiber-free control diet, and also of Akkermansia,[12] a bacterium that hasbeen related to reduced mucosa inflammation.[13] A considerableincrease of butyric acid formation was found in rats fed withmaltcompared with whole-grain barley.[14] This was suggested to berelated to the changed characteristics of the β-glucan due to in-creased β-glucanase activity during malting,[15] also causing theincreased number of Roseburia, Coprococcus, and Lactobacillus.[12]
However, a change of other components during this process suchas arabinoxylan cannot be excluded. Another interesting barleyproduct is brewer’s spent grain (BSG), a waste product frombrewing industry. BSG contains high amounts of hemicellulosesand protein, depending on the barley variety and processing con-ditions used. BSG was suggested to have hypocholesterolemiceffects,[16] influence lipid metabolism,[17] and to potentially actas a growth stimulator of Bifidobacterium and Lactobacillus in thedistal colon.[18]
The aim of this study was to investigate whether barley maltsand BSG with different fiber characteristics (β-glucan, solubleand insoluble arabinoxylan), could affect the microbiota compo-sition, the potential for SCFA formation, especially butyric- andpropionic acid, and metabolic functions. For this purpose, con-ventional rats were fed diets containing three barley malts fromdifferent varieties or produced at different malting conditions,a barley BSG, a mixture of malt and BSG, or a fiber-free con-trol. Since arabinoxylan and β-glucan are two of the main dietaryfibers of interest in barley, groups fed diets containing extractsfrom barley especially rich in these polymers were also included.
2. Experimental Section
2.1. Test Materials
Five barley malt products and two barley extracts were selectedand compared in the study due to their differences in contents ofarabinoxylan and β-glucan (Table 1): tipple malt (TM), cinnamonmalt (CM), standard malt (SM), BSG, a mixture of TM and BSG(mixture), β-glucan rich extract (BG extract), and arabinoxylanrich extract (AX extract).TM and CMwere produced in a pilot plant at Lahden Polttimo
Oy (Lathi, Finland), under nontraditional steeping conditions topreserve β-glucan content (35 °C and 0.4% lactic acid) and kilned
at 55−70−82 °C for 10−8−8 h, respectively. SM was steeped at14.5 °C without lactic acid, and kilned at 55−86 °C for 20 h. BSGwas a by-product from the SMmilling, mashed at 20−70 °C, anddried at 48−55 °C for a total of 20 h. Both SM and BSG wereprovided by an affiliated company to Lahden Polttimo Oy (VikingMalt AB, Halmstad, Sweden). To obtain a diet with intermediarycontent of β-glucan and arabinoxylan in relation to themalt diets,a Mixture containing 70% TM and 30% BSG was also included.AX extract was purchased from Xylophane AB (Goteborg, Swe-den) and BG extract from Lyckeby Starch AB (Kristianstad, Swe-den), and used as reference samples, due to their high amounts ofarabinoxylan and β-glucan, respectively. AX extract was isolatedfrom barley husk involving extraction at elevated pH, and accord-ing to the provider, resulting in AX of high molecular weight(Mw;�70 kDa). BG extract was obtained bymechanical fractiona-tion of barley kernels, mostly originating from the aleurone layercell walls and according to the provider, resulting in a β-glucanwith high Mw (1.6 × 10⁶). The malt products were milled to aparticle size less than 0.5 mm for characterization analysis andincorporated into test diets. The extracts were used as providedin fine powder.
2.2. Diets
The design of the study resulted in eight diets (seven test dietsand one control), composed of 12% casein, 1.2% dl-methionine,and 2% choline chloride (Sigma–Aldrich, St. Lois, MO, USA),5% maize oil (Ica, Solna, Sweden), 10% sucrose (Dan Sukker,Malmo, Sweden), and 0.8% vitamin and 4.8% mineral mixtures(Lantmannen, Malmo, Sweden) (Table S1, Supporting Informa-tion A). Furthermore, the seven test diets contained an equalamount of dietary fiber (80 g kg−1 dry weight) resulting in anamount of added barley product between 96 and 527 g kg−1.Wheat starch was added to adjust for the dry matter contentand since it is completely digested, no fiber is delivered to thecolon and there is no contribution of SCFA from this source.[19]
The control diet contained wheat starch as substitute to the fibersource (fiber-free diet). The diets were prepared in house by mix-ing all the ingredients thoroughly in a mixer for 60 min, andgiven in the form of powder.
2.3. Characterization of Test Materials
Soluble and insoluble dietary fiber contents were measured ac-cording to an enzymatic gravimetric method.[20] The neutralsugars of the isolated dietary fiber residues and fecal mate-rial were analyzed using a gas-chromatographic method,[21] and
Mol. Nutr. Food Res. 2018, 62, 1701023 1701023 (2 of 10) C© 2018 The Authors. Published by WILEY-VCH Verlag GmbH & Co. KGaA, Weinheim.
www.advancedsciencenews.com www.mnf-journal.com
arabinoxylan content was estimated as the sum of arabinose andxylose in the fiber residues. The degree of fermentation was cal-culated as in Equation (1), during the five days of the experimen-tal period.
[1 − (
grams of neutral sugars in faeces
/grams of neutral sugars consumed)] × 100 (1)
The content of β-glucan was assessed with the mixed-linkageβ-glucan assay kit (K-BGLU, Megazyme International, Ireland).The average β-glucanMw of extractable β-glucans was estimatedwith high-performance size exclusion chromatography and flu-orescence detection (HPSEC–FD) with Calcofluor post-columncomplexation.[22] Resistant starch was estimated by the differ-ence between total and available starch, obtained by an enzy-matic assay with KOH and/or digestion with α-amylase andamyloglucosidase.[23,24] The amylose content was quantified withan amylose/amylopectin kit (Megazyme International, Ireland).The crude protein was quantified with an elemental analyzer(Flash EA 1112, Thermo Fisher Scientific Inc., Waltham, MA,USA). All analyses were made at least in duplicate.
2.4. Animal Study
Male Wistar rats (n = 56) with weights between 70 and 98 g wererandomly divided into eight groups and caged individually. Theexperiment lasted for 12 days, during which rats were fed thetest and control diets and the temperature and light were keptconstant: 21 °C and 12 h light cycle. The food was restricted to12 g dry weight per day, and water was given ad libitum similarto previous studies.[25] The design of the experiment has beenused in previous experiments, and has been shown to be enoughto study changes in total fermentation of dietary fiber and SCFAformation (e.g., refs. [26–28]).During the last 5 days of the experimental period, feces were
collected daily, freeze-dried, and milled before analysis of dietaryfiber. There were no feed residues during any of the experimentaldays. After the experimental period, the rats were anesthetized bycutaneous injection with amixture of Hypnorm, Dormicum, andsterile water (1:1:2) at a dose of 0.15 ml per 100 g body weight.The weights of cecal content and cecal tissue were noted. A por-tion of the cecum content (apex) was stored at −80 °C for micro-biota analysis, while the pH of the remaining cecal content wasmeasured and stored at –40 °C until analysis of SCFA.
2.5. Cecum Analyses
SCFA in the caecum content were analyzed by GC after themate-rial was homogenized (Ultra Turrax T25 basic, IKAWERKE) andcentrifuged with 0.25 m HCl.[29]
The cecum apex was used for extraction of DNA and sequenc-ing of V1–V3 region of 16S rRNA gene, which was performedby GATC Biotech (Konstanz, Germany; www.gatc-biotech.com) by using amplicon-based method. Forward and re-verse sequence primers for amplification were 5′AGAGTTTGATCCTGGCTCAG3′ and 5′ATTACCGCGGCTGCTGG3′,respectively. Genome Sequencer Illumina HiSeq accredited
method was performed using HiSeq Rapid Run 300 bp paired-end kit (Illumina, San Diego, California, USA). Raw sequenc-ing data for both forward and reverse reads were received in aFASTQ format, accompanied by a raw-data quality report for ev-ery sample. Since the amplicons were sequenced in both direc-tions, using Next-generation Sequencing Platforms that is onlyable to generate relatively short read lengths (<500 bp), the readpairs were merged to increase the overall read length by usingFLASH v1.2.11 software tool (The Center for Computational Bi-ology, Johns Hopkins University) with maximummismatch den-sity of 0.25. Next, combined pairs of every sample (89± 1%) withmean length of 524 bp were processed for quality filtering andaccuracy of operational taxonomic units (OTU) assignment byopen-source bioinformatics pipeline, Quantitative Insights intoMicrobial Ecology (QIIME v 1.9.1). A total number of 27 858 485reads were generated after quality filtering for 56 samples with amean of 497 472.946 reads per sample (minimum 212 070 andmaximum 840 486). The sequences were grouped into OTUsat a minimum of 97% similarity. Taxonomy was assigned us-ing Greengenes database (v.13.8). In total, 431 observations wereobtained after removing singletons and low-abundance OTUs(<0.0001) resulted in seven OTUs ID at phylum and 38 OTUsID at genus levels. Next, alpha and beta diversity was analyzedat the even depth of 200 000 sequences per sample, retaining allsamples in the analysis. It is worth mentioning that the num-ber of observations before filtering and cutoff steps was 3235,giving zero approaching values for most of the taxonomic gen-era. The raw data and biom summary tables with sample readsand at genus level for each group before and after filtering areavailable in the Supporting Information (B for raw data and Cfor biom summary tables). Additionally, the QIIME statistics, in-cluding test for alpha-diversity comparison and groups’ compar-isons OTU frequencies (Kruskal–Wallis with Bonferroni correc-tion) are also available in the Supporting Information D).
2.6. Prediction of Bacterial Metagenomes Using PhylogeneticInvestigation of Communities by Reconstruction of UnobservedStates
Potential metabolic functions from the gut bacteria were ana-lyzed by inferring metabolic capacity from the 16S rRNA genesequencing data using an open-source software, Phylogenetic In-vestigation of Communities by Reconstruction of UnobservedStates (PICRUSt).[37] Results were thereafter analyzed for statis-tical significance using LEfSE with LDA score cutoffs of 2.0 (Fig-ure S2a and S2b, Supporting Information A) and 3.0 (Figure 5).
2.7. Statistical Analyses
One-way analysis of variance and Tukey’s post-hoc tests wereused to evaluate the difference between the treatments, and post-hoc Games–Howell test was used for nonhomogeneous data,with significance at p < 0.05. Correlations were evaluated withtwo-tailed Pearson’s tests: weak (±) 0.25–0.50; moderate (±)0.50–0.75; strong (±) 0.75–1. Statistical analysis was performedwith SPSS Statistics. All weights are on dry weight basis, exceptfor cecal content, cecal tissue, and SCFA.
Mol. Nutr. Food Res. 2018, 62, 1701023 1701023 (3 of 10) C© 2018 The Authors. Published by WILEY-VCH Verlag GmbH & Co. KGaA, Weinheim.

www.advancedsciencenews.com www.mnf-journal.com
3. Results and Discussion
3.1. Dietary Fiber
To investigate the possibility to modulate microbiota composi-tion and metabolic effects with barley malt products, the dietsin the present study were designed to have the same quantity oftotal fiber (80 g kg−1; Table S1, Supporting Information A), butwith different fiber characteristics of β-glucan and arabinoxylan(Table 1).Malts from the cultivar Tipple (TM), and Cinnamon (CM)were
selected due to their comparatively high β-glucan content (mean1.4 ± 0.1 g per 100 g) and Mw (mean 1.3 ± 0.1 × 10⁶ g mol−1),and these products also contributed with higher proportions ofsoluble fiber in the diets (20–33%) than SM (0.3 g per 100 g β-glucan content, 1× 10⁶ gmol−1 Mw, and 10% soluble fiber). Thereason to these differences is that SM is processed at traditionalmalting conditions to provide highly degraded β-glucan (Ta-ble 1). Another dissimilarity between the malts was that the CMdiet contributed with higher proportions of soluble arabinoxylan(10%) than the TM and SM diets (mean 4.8± 0.2%). Contents ofprotein, resistant starch, and amylose were very similar amongthe malt products (Table S2, Supporting Information A).BSG was obtained as a by-product from the mashing step of
themalting process, wheremost of the soluble compounds of themalt are removed. As a result, the product had lower contents ofsoluble fiber, soluble arabinoxylan, β-glucan, and β-glucan Mwthan the malts, but the contribution of total arabinoxylan to thediet was similar as with the SM diet (3.1 ± 0.1 g per 100 g). Thediet composed of a mixture of TM and BSG (70:30) resulted in anintermediary content of β-glucan and soluble arabinoxylan com-pared to the other malts and BSG diets and was used to evaluatethe effect of adding BSG to malt.To better understand the effect of arabinoxylan and β-glucan
on the gut microbiota composition, the effects of two barley-based extracts rich in arabinoxylan (AX) or β-glucan (BG) werestudied. Diets containing AX and BG extracts had higher pro-portions of soluble fiber (87% and 49%, respectively) com-pared with the malts and BSG diets. The BG extract diet hadthe highest β-glucan content (4.8 g per 100 g) of highest Mw(1.6× 10⁶ gmol−1), and the AX extract contributed with the high-est proportion of soluble arabinoxylan (76%).
3.2. Animal Experiment
The rats remained healthy and were active throughout the study.The daily feed intake was 12.0± 0.1 g dry weight, and the weightgain 11−13 g per rat during the last 5 days of the experiment(Table S3, Supporting Information A).Cecal pHwas higher for rats fed TM, AX, and BG extracts com-
pared with BSG diet (mean 7.1 vs 6.3 with BSG). The cecal con-tent was higher with AX and BG extracts than with the control(2.0 and 1.6 g, respectively vs 0.9 g for the control, p < 0.05). Thefecal weight was higher in rats fed diets containing SM and BSG(6.3 and 5.7 g, respectively), than in rats fed the mixture, TM,and CM (4.6−5.0 g), AX extract (3.8 g), BG extract (2.9 g), andthe fiber-free control diet (1.5 g). This could be expected sinceboth SM and BSG contained higher amounts of insoluble fiber,
known be less fermented by the microbiota, mainly contributingto fecal bulk.
3.3. Fermentation of Dietary Fiber Polysaccharides
Total dietary fiber fermentation was higher in rats fed diets con-taining AX and BG extracts (86% and 85%, respectively), thanin those rats fed CM, TM, and mixture diets (36−44%), and SMand BSG diets (21−23%) (Table S4, Supporting Information A),which corresponded with the higher content of soluble fiber andβ-glucan content, and/or Mw in the diets (Table 1). Details of thedegree of fermentation for each neutral sugar are in Table S4,Supporting Information A.
3.4. SCFAs in Cecum of Rats
Acetic, propionic, and butyric acid were the major SCFAs foundin the cecum of rats. As expected, the cecal content of total SCFAwas lower in rats fed the fiber-free control diet than in those fedAX and BG extracts (38 vs mean 78 μmol, p < 0.05) (Table 3).Acetic acid was higher in rats fed AX extract than those fed TM(53 vs 31 μmol, p < 0.05), and also the content of propionic acidcompared with rats fed SM (14 vs 8 μmol, p < 0.05). Despite thedifferent fiber composition in CM compared with BSG (CM hadhigh proportions of β-glucan and soluble arabinoxylan, whereasBSG had high proportions of insoluble arabinoxylan) both re-sulted in the highest butyric acid content, and it was significantlyhigher than in rats fed the control diet (7.3–6.7 vs 3.4 μmol,p < 0.05).Taking the characteristics of the fiber in consideration, diets
with more soluble arabinoxylan contributed to a higher propor-tion of propionic acid in the cecum of rats (Table 1 and 3), whichwas especially seen in rats fed AX extract. High proportions ofpropionic acid in the cecum of rats have also been related to thecontent of soluble arabinoxylans in a previous study.[8] Interest-ingly, soluble fiber, soluble arabinoxylan, β-glucan, and β-glucanMw were all positively correlated with the proportion of propi-onic acid, but negatively with acetic acid in the cecum of rats fedmalt/BSG diets (Table 2). No correlations were found with theproportion of cecal butyric acid.Due to practical reasons, to be able to finish the study for the
groups (two to three groups per day), we started early in themorn-ing, and consequently the test diets were removed from some ofthe rats more than 6 h before collection of the cecum content.During this time the SCFA might already have been absorbedand regressed to fasting levels, which may explain the compar-atively lower values in the present study to studies with similardesign.[12,15]
3.5. Gut Microbiota Composition
3.5.1. Diversity
A microbial community with low alpha diversity (within sam-ples) has been linked to obesity, Crohn’s disease, and ulcerativecolitis.[30,31] Notably, diets containing TM, SM, and mixture gen-erally resulted in higher cecal alpha diversity within microbial
Mol. Nutr. Food Res. 2018, 62, 1701023 1701023 (4 of 10) C© 2018 The Authors. Published by WILEY-VCH Verlag GmbH & Co. KGaA, Weinheim.
www.advancedsciencenews.com www.mnf-journal.com
Table 2. Correlation of dietary fiber intake with cecal proportion of SCFA and the most abundant phylum levels in rats fed the malt and BSG diets (tipplemalt, cinnamon malt, standard malt, standard BSG, and mixture).
% Soluble fiber Total arabinoxylan % Soluble arabinoxylan β-glucan β-glucan Mw
% Acetic −** +** −** −** −**
% Propionic ++*** −** ++*** ++*** +**
% Butyric NC NC NC NC NC
p Actinobacteria NC NC NC NC NC
p Bacteroidetes −** +** −* −* NC
p Firmicutes +* −** NC NC NC
a)*, **, ***, denotes significance at the level of p < 0.1, p < 0.05, p � 0.001, respectively (ANOVA); NC, no correlation; b)Plus/minus symbol indicates the positive/negativecorrelation between SCFA and bacteria at different correlation coefficient ranks, in absolute values: + or −, 0.25< r < 0.50; ++ or − −, 0.50 < r < 0.75; +++ or − − −,0.75 < r < 1.00.
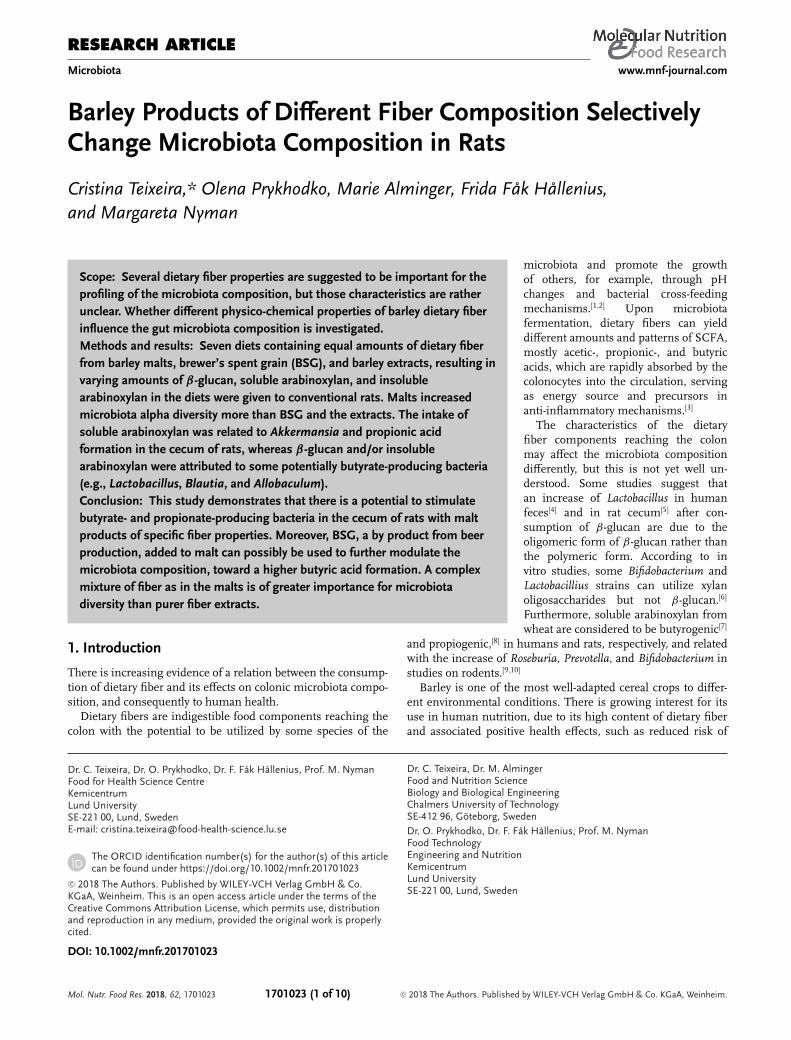
Figure 1. Alpha diversity. Alpha diversity indexes of PD (phylogenetic di-versity) whole tree in rats fed test diets containing barley products or acontrol diet. Groups with different letters are significantly different. (TM,tipple malt; CM, cinnamon malt; SM, standard malt; BSG, brewers’ spentgrain; Mix, mixture of TM and BSG 70:30; AX, arabinoxylan extract; BG,β-glucan extract; CTRL, free-fiber control).
community than rats fed the control diet, or diets containing AXor BG extracts (Figure 1). This suggests that amore complexmix-ture of fibers as found in the malts promoted the growth of agreater number of species, and would thus be interesting in re-lation to some chronic diseases.A clear clustering of groups in the principal coordinate
analysis (PCoA) of beta diversity (between samples from thesame habitat) showed that rats fed malts/BSG diets had rathersimilar microbial communities, but was completely differentfrom the gut microbiota in rats fed Control, AX, and BG extracts(Figure 2A), which also were markedly different from each other(Figure 2B). Furthermore, between the malt/BSG products,BSG displayed a distinct grouping compared with CM and SM(Figure 2C and 2D), which could be related to the differences incontent of soluble arabinoxylan (Table 1).
3.5.2. Relation between Specific Dietary Fiber Components andMicrobiota Composition
The most abundant phyla in cecum of all groups were Firmi-cutes (73−87%) and Bacteroidetes (9−24%) (Figure 3). Groups
fed BG extract and the fiber-free control had also rather high cecalamounts of Actinobacteria (6% and 15%, respectively), while con-siderably lower amounts of this phylum were found in caecumof rats fed barley malt products and AX extract (1−3.5%). Verru-comicrobia was exceptionally high in the cecum of rats fed AX ex-tract compared with the other groups (6.9% vs �0.8%, p < 0.05).The various diets thus appear to stimulate different bacterial
species (at phylum level), in the cecum of rats. By relating thecomposition of the dietary fiber included in the diets with theabundance of bacteria, Bacteroidetes were negatively correlatedwith the intake of β-glucan, proportion of soluble fiber, and sol-uble arabinoxylan (–0.314, –0.358, and –0.307, respectively) andpositively correlated with total amounts of arabinoxylan in thediet (0.465) (Table 2). On the contrary, Firmicutes were positivelycorrelated with soluble fiber (0.304) and negatively correlatedwith total arabinoxylan (–0.439). This may explain the differencesof Bacteroidetes in cecum of rats fed the malted products CMand SM (9% vs 24%, respectively), where SM contained lowerproportions of β-glucan, soluble fiber, and soluble arabinoxylanthanCM. Furthermore, the stimulation of Verrucomicrobia in ce-cum of rats fed AX extract compared with the other groups, couldpossibly be due to its high content of soluble arabinoxylan com-pared with the other barley products.
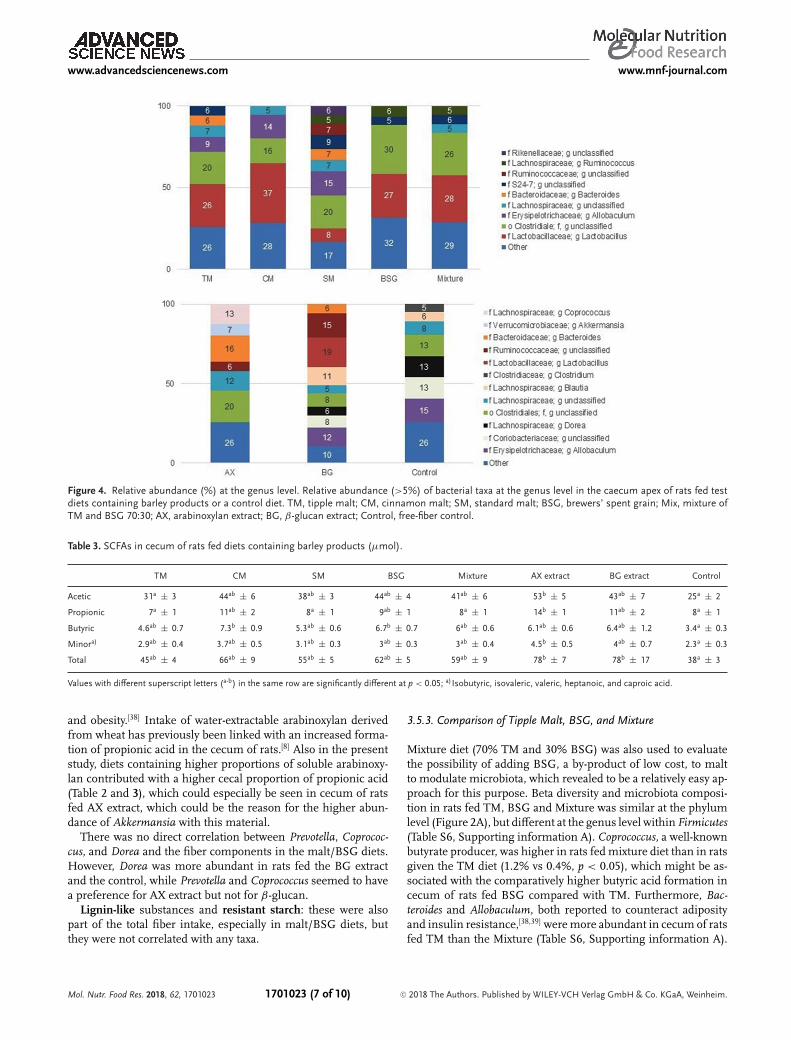
β-glucan: Rats fed BG extract had highest cecal amounts ofthe unclassified genera Ruminococcaceae (15% vs<7%, p < 0.05)(Figure 4). Furthermore, Lactobacillus was one of the most abun-dant genus in the cecum of rats fed malt/BSG diets and BG ex-tract, and the amounts were positively correlated with β-glucancontent and Mw (Table S5, Supporting information A). SomeLactobacillus strains have been found to grow in the presence ofoligosaccharides but not on polymeric β-glucan.[5,6] It may there-fore be questioned, whether some Lactobacillus in rats fed CMcontaining high β-glucan Mw have used β-glucans being de-polymerized by other bacteria. Furthermore, β-glucan in barleymalt products might not be the only preferred substrate for Lac-tobacillus. Interestingly, the BSG diet had the lowest content ofβ-glucan, but Lactobacillus was one of the most abundant generain the cecum of rats fed this diet (27%). Also in other studies,barley has shown to increase the number of Lactobacillus in com-parison with wheat, a cereal low in β-glucan.[32]
By using the software tool LEfSe to compare bacterial taxaat species level, we found that CM increased the relative abun-dance of Lactobacillus reuteri (Figure S1, Supporting informationA), a probiotic used for treatment and prevention of rotaviral
Mol. Nutr. Food Res. 2018, 62, 1701023 1701023 (5 of 10) C© 2018 The Authors. Published by WILEY-VCH Verlag GmbH & Co. KGaA, Weinheim.

www.advancedsciencenews.com www.mnf-journal.com
Figure 2. Beta diversity. Principal coordinate analysis of weighted Unifrac distancemetrics based on the taxonomic similarities between samples at genuslevel. A) Groups fed test diets containing barley products or a fiber-free control group. Barley malt/BSG groups are different from groups fed CTRL, BG,and AX. B) Groups fed CTRL, BG, and AX extract display different genus profile. C) BSG is different from SM, and (D) groups fed BSG are different fromCM. (TM, tipple malt; CM, cinnamon malt; SM standard malt; BSG, brewers’ spent grain; Mix, mixture of TM and BSG 70:30; AX, arabinoxylan extract;BG, β-glucan extract; CTRL,fiber-free control).
Figure 3. Relative abundance (%) at the phylum level. Relative abundance(%) of bacterial taxa at the phylum level in the caecum apex of rats fed testdiets containing barley products or a control diet. (TM, tipple malt; CM,cinnamon malt; SM, standard malt; BSG, brewers’ spent grain; Mix, mix-ture of TM and BSG 70:30; AX, arabinoxylan extract; BG, β-glucan extract;Control, free-fiber control).
diarrhea,[33] and a suppressor of NF-κB and TNF-α inflammationmarkers.[34,35]
Blautia was more abundant in rats fed BG extract, and thesebacteria were previously found in the cecumof rodents fedwhole-grain diets[36] and also in cecum of rats fed whole-grain barleyand barleymalt.[12] It is suggested that these bacteria benefit fromthe hydrogen as a product of glucan fermentation.[36] Thus, they
could have grown due to the depolymerization of β-glucan fromthe BG extract diet.Arabinoxylan: Total and soluble arabinoxylan affected the mi-
crobiota species differently. Unclassified Rikenellaceae, unclassi-fied S24-7, unclassified Clostridiales, Ruminococcus, Odoribacter,and Oscillospira are reported to be potentially butyrogenic[37] andwere more abundant in the cecum of rats fed diets high in to-tal arabinoxylan but low in soluble arabinoxylan (TM, SM, BSG,and mixture) (Figure 4 and Table S6, Supporting information A),and negatively correlated with soluble fiber (Table S5, Supportinginformation A), suggesting that insoluble arabinoxylan is one ofthe preferred substrates for these taxa. On the other hand, solu-ble arabinoxylan but not total arabinoxylan favored the growthof Clostridium, Blautia, Allobaculum, Coprobacillus, although inrather low abundance (<5%), and of Akkermansia in cecum ofrats fed malt/BSG. However, these bacterial species were alsocorrelated with substrates containing high content of β-glucanand β-glucan Mw. Thus, the substrate preference between ara-binoxylan and β-glucan was not that clear. Akkermansia was oneof the most abundant genus in the cecum of rats fed AX extract(7%, Figure 4), suggesting that its growth was more dependenton soluble arabinoxylan content than the other taxa. A decrease ofAkkermansia muciniphila, the only known species of this genus,has been related to an increased risk to develop ulcerative colitis
Mol. Nutr. Food Res. 2018, 62, 1701023 1701023 (6 of 10) C© 2018 The Authors. Published by WILEY-VCH Verlag GmbH & Co. KGaA, Weinheim.
www.advancedsciencenews.com www.mnf-journal.com
Figure 4. Relative abundance (%) at the genus level. Relative abundance (>5%) of bacterial taxa at the genus level in the caecum apex of rats fed testdiets containing barley products or a control diet. TM, tipple malt; CM, cinnamon malt; SM, standard malt; BSG, brewers’ spent grain; Mix, mixture ofTM and BSG 70:30; AX, arabinoxylan extract; BG, β-glucan extract; Control, free-fiber control.
Table 3. SCFAs in cecum of rats fed diets containing barley products (μmol).
TM CM SM BSG Mixture AX extract BG extract Control
Acetic 31a ± 3 44ab ± 6 38ab ± 3 44ab ± 4 41ab ± 6 53b ± 5 43ab ± 7 25a ± 2
Propionic 7a ± 1 11ab ± 2 8a ± 1 9ab ± 1 8a ± 1 14b ± 1 11ab ± 2 8a ± 1
Butyric 4.6ab ± 0.7 7.3b ± 0.9 5.3ab ± 0.6 6.7b ± 0.7 6ab ± 0.6 6.1ab ± 0.6 6.4ab ± 1.2 3.4a ± 0.3
Minora) 2.9ab ± 0.4 3.7ab ± 0.5 3.1ab ± 0.3 3ab ± 0.3 3ab ± 0.4 4.5b ± 0.5 4ab ± 0.7 2.3a ± 0.3
Total 45ab ± 4 66ab ± 9 55ab ± 5 62ab ± 5 59ab ± 9 78b ± 7 78b ± 17 38a ± 3
Values with different superscript letters (a-b) in the same row are significantly different at p < 0.05; a)Isobutyric, isovaleric, valeric, heptanoic, and caproic acid.
and obesity.[38] Intake of water-extractable arabinoxylan derivedfrom wheat has previously been linked with an increased forma-tion of propionic acid in the cecum of rats.[8] Also in the presentstudy, diets containing higher proportions of soluble arabinoxy-lan contributed with a higher cecal proportion of propionic acid(Table 2 and 3), which could especially be seen in cecum of ratsfed AX extract, which could be the reason for the higher abun-dance of Akkermansia with this material.There was no direct correlation between Prevotella, Coprococ-
cus, and Dorea and the fiber components in the malt/BSG diets.However, Dorea was more abundant in rats fed the BG extractand the control, while Prevotella and Coprococcus seemed to havea preference for AX extract but not for β-glucan.Lignin-like substances and resistant starch: these were also
part of the total fiber intake, especially in malt/BSG diets, butthey were not correlated with any taxa.
3.5.3. Comparison of Tipple Malt, BSG, and Mixture
Mixture diet (70% TM and 30% BSG) was also used to evaluatethe possibility of adding BSG, a by-product of low cost, to maltto modulate microbiota, which revealed to be a relatively easy ap-proach for this purpose. Beta diversity and microbiota composi-tion in rats fed TM, BSG and Mixture was similar at the phylumlevel (Figure 2A), but different at the genus level within Firmicutes(Table S6, Supporting information A). Coprococcus, a well-knownbutyrate producer, was higher in rats fedmixture diet than in ratsgiven the TM diet (1.2% vs 0.4%, p < 0.05), which might be as-sociated with the comparatively higher butyric acid formation incecum of rats fed BSG compared with TM. Furthermore, Bac-teroides and Allobaculum, both reported to counteract adiposityand insulin resistance,[38,39] weremore abundant in cecum of ratsfed TM than the Mixture (Table S6, Supporting information A).
Mol. Nutr. Food Res. 2018, 62, 1701023 1701023 (7 of 10) C© 2018 The Authors. Published by WILEY-VCH Verlag GmbH & Co. KGaA, Weinheim.

www.advancedsciencenews.com www.mnf-journal.com
Figure 5. Prediction of bacterial metagenomes. PICRUSt analysis of 16S rRNA gene sequencing data. Functional microbial genes shown were enrichedin the respective groups and had an LDA score higher than 3.
In this study, there was no correlation between β-glucan intakefrom malt and BSG diets and in the cecal number of Bacteroides,which contrasts with studies in feces of man.[4]
3.5.4. Prediction of Functionality of Cecal Microbial Communities
PICRUSt analysis together with LEfSe detected a total of 1, 9,12, 1, and 13 genes enriched in the cecum of rats fed control,CM, BSG, BG extract, and AX extract, respectively (Figure 5).Two genes specialized in environmental information process-ing (both membrane transporters) were enriched in the controlgroup and CM group. In the group fed BG extract, only onegene was enriched, specialized in energy metabolism. Genes en-riched in CM were involved in genetic information processing(two genes in translation and two in replication and repair) andmetabolism (two genes in membrane transport). With BSG, thegenes found were mostly involved in environmental information
(two genes in membrane transport and two in signal transduc-ing) and cellular processes, all connected to cell motility (fourgenes). One of these cell motility genes was related to flagellaassembly, which enables bacterial adhesion and invasion. Theirrelation with the colon is not straightforward, since flagella canbe present in some harmful bacteria triggering inflammation, orhelp beneficial bacteria to adhere to themucosa.[40] Five genes en-riched in AX extract were involved in diversemetabolisms (carbo-hydrate, lipid, amino acid, glycan, and co-factors and vitamins).TCA (tricarboxylic acid) cycle present in the group fed AX extractgenerates energy derived from carbohydrates, whichmay explaina high degree of fermentation, especially of arabinoxylan. Fur-thermore, in the TCA cycle one of the precursors of butyric- andpropionic acid (succinic acid) is produced, suggesting a high for-mation of these SCFA as indicated by slightly higher amountsdetected in cecum of rats fed AX extract (Table 3). The genes re-lated with glycan metabolism may reflect the high abundance ofthe mucus degrading bacteria Akkermansia in the cecum of ratsfed AX extract.[41]
Mol. Nutr. Food Res. 2018, 62, 1701023 1701023 (8 of 10) C© 2018 The Authors. Published by WILEY-VCH Verlag GmbH & Co. KGaA, Weinheim.
www.advancedsciencenews.com www.mnf-journal.com
4. Conclusions
The stimulation of most bacterial species was related to the con-tent of soluble fibers, including soluble arabinoxylan, β-glucanand/or β-glucan Mw and thus only a few with insoluble arabi-noxylan. Akkermansia was more abundant in rats fed diets richin soluble arabinoxylan and formed high cecal amounts of pro-pionic acid, while the butyrogenic Blautia, Allobaculum, and Lac-tobacillus were more abundant in diets rich in β-glucan. Of themalts, CM was particularly interesting as rats fed this productappear to give a high alpha diversity, stimulate the caecal abun-dance of Allobaculum, Blautia, and Lactobacillus, as well as bu-tyric acid. Furthermore, BSG, with its distinct fiber composition,stimulated the cecal abundance of Lactobacillus and also butyricacid. This reinforces that different microbial communities withdifferent substrate preferences can induce the formation of thesame SCFAs, or that certain taxa, such as Lactobacillus, are lit-tle dependent of substrate preference. The addition of BSG toTM (i.e., mixture diet) resulted in an intermediary abundance ofsome taxa, and a slight increase in cecal butyric acid and buty-rogenic bacteria, which shows the possibility of using BSG asa food ingredient to modulate the microbiota composition andfunction.
Supporting InformationSupporting Information is available from the Wiley Online Library or fromthe author.
AcknowledgementsThe authors thank Viking Malt AB for providing the malts and BSG. Thisstudy was financially supported by TvarLivs (Formas no 222-2011-271 andLantmannen Research Foundation), Formas (942-2015-877) and JohannaAndersson Foundation (JA2015-0025).
Ethics Approval and Consent to ParticipateThe animal experiments were approved by the Ethics Committee for Ani-mal Studies at Lund University (Ethical approval number M114-15).
Conflict of InterestF.F.H. is shareholder in ProPrev AB. The other authors declare that theyhave no competing interests.
Keywordsβ-glucan, arabinoxylan, barley malt, BSG, microbiota
Received: December 13, 2017Revised: June 23, 2018
Published online: August 12, 2018
[1] G. den Besten, K. van Eunen, A. K. Groen, K. Venema, D. J. Reijngoud,B. M. Bakker, J. Lipid Res. 2013, 54, 2325.
[2] D. Rios-Covian, P. Ruas-Madiedo, A. Margolles, M. Gueimonde, C.G. de Los Reyes-Gavilan, N. Salazar, Front. Microbiol. 2016, 7, 185.
[3] J. H. Cummings, Eur. J. Gastroenterol. Hepatol. 1997, 9, 149.[4] E. K. Mitsou, N. Panopoulou, K. Turunen, V. Spiliotis, A. Kyriacou,
Food Res. Int. 2010, 43, 1086.[5] J. Snart, R. Bibiloni, T. Grayson, C. Lay, H. Zhang, G. E. Allison, J.
K. Laverdiere, F. Temelli, T. Vasanthan, R. Bell, G. W. Tannock, Appl.Environ. Microb. 2006, 72, 1925.
[6] R. Crittenden, S. Karppinen, S. Ojanen, M. Tenkanen, R. Fagerstrom,J. Matto, M. Saarela, T. Mattila-Sandholm, K. Poutanen, J. Sci. FoodAgric. 2002, 82, 781.
[7] S. Hald, A. Dige, P. K. Theil, K. E. B. Knudsen, J. Agnholt, J. F.Dahlerup, Gastroenterology 2015, 148, S-197.
[8] L. Haska, R. Andersson, M. Nyman, Food Nutr. Res. 2011, 55.https://doi.org/10.3402/fnr.v55i0.6397
[9] A. M. Neyrinck, S. Possemiers, C. Druart, T. Van de Wiele, F. DeBacker, P. D. Cani, Y. Larondelle, N. M. Delzenne, PLoS One 2011,6, e20944.
[10] B. Damen, J. Verspreet, A. Pollet, W. F. Broekaert, J. A. Delcour, C. M.Courtin,Mol. Nutr. Food Res. 2011, 55, 1862.
[11] R. K. Newman, C. W. Newman, Barley for Food and Health: Science,Technology, and Products, John Wiley & Sons, Hoboken, New Jersey2008.
[12] Y. Zhong, M. Nyman, F. Fak,Mol. Nutr. Food Res. 2015, 59, 2066.[13] R. Caesar, V. Tremaroli, P. Kovatcheva-Datchary, P. D. Cani, F. Back-
hed, Cell. Metab. 2015, 22, 658.[14] C. E. Branning, M. E. Nyman, J. Nutr. 2011, 141, 101.[15] Y. Zhong, C. Teixeira, N. Marungruang, W. Sae-Lim, E. Tareke, R. An-
dersson, F. Fak, M. Nyman, Food Funct. 2015, 6, 3165.[16] P. Aman, Food Nutr. Res. 2006, 50, 4.[17] H. Z. Hassona, Die Nahrung 1993, 37, 576.[18] P. Moura, S. Cabanas, P. Lourenco, F. Gırio, M. C. Loureiro-Dias, M.
P. Esteves, LWT Food Sci. Technol. 2008, 41, 1952.[19] I. Bjorck, M. Nyman, B. Pedersen, M. Siljestrom, N. G. Asp, B. O.
Eggum, J. Cereal Sci. 1987, 6, 159.[20] N. G. Asp, C. G. Johansson, H. Hallmer, M. Siljestrom, J. Agric. Food
Chem. 1983, 31, 476.[21] O. Theander, P. Aman, E. Westerlund, R. Andersson, D. Pettersson,
J. AOAC Int. 1995, 78, 1030.[22] L. Rimsten, T. Stenberg, R. Andersson, A. Andersson, P. Aman, Cereal
Chem. J. 2003, 80, 485.[23] J. Holm, I. Bjorck, A. Drews, N. G. Asp, Starch-Starke 1986, 38,
224.[24] I. M. E. Bjorck, M. A. Siljestrom, J. Sci. Food Agr. 1992, 58, 541.[25] G. Jakobsdottir, J. Xu, G. Molin, S. Ahrne, M. Nyman, PLoS One 2013,
8.[26] A. M. Berggren, I. M. E. Bjorck, E. M. G. L. Nyman, B. O. Eggum, J.
Sci. Food Agric. 1993, 63, 397.[27] A. M. Henningsson, E. M. G. L. Nyman, I. M. E. Bjorck, J. Sci. Food
Agric. 2002, 82, 385.[28] M. Nyman, N.-G. Asp, Br. J. Nutr. 1985, 54, 635–643.[29] G. Zhao, M. Nyman, A. J. Jonsson, Biomed. Chromatogr. 2006, 20,
674.[30] P. J. Turnbaugh,M.Hamady, T. Yatsunenko, B. L. Cantarel, A. Duncan,
R. E. Ley, M. L. Sogin, W. J. Jones, B. A. Roe, J. P. Affourtit, M. Egholm,B. Henrissat, A. C. Heath, R. Knight, J. I. Gordon, Nature 2009, 457,480.
[31] J. Qin, R. Li, J. Raes, M. Arumugam, K. S. Burgdorf, C. Manichanh, T.Nielsen, N. Pons, F. Levenez, T. Yamada, D. R. Mende, J. Li, J. Xu, S.Li, D. Li, J. Cao, B. Wang, H. Liang, H. Zheng, Y. Xie, J. Tap, P. Lepage,M. Bertalan, J.-M. Batto, T. Hansen, D. Le Paslier, A. Linneberg, H. B.
Mol. Nutr. Food Res. 2018, 62, 1701023 1701023 (9 of 10) C© 2018 The Authors. Published by WILEY-VCH Verlag GmbH & Co. KGaA, Weinheim.

www.advancedsciencenews.com www.mnf-journal.com
Nielsen, E. Pelletier, P. Renault, T. Sicheritz-Ponten, K. Turner, H. Zhu,C. Yu, S. Li, M. Jian, Y. Zhou, Y. Li, X. Zhang, S. Li, N. Qin, H. Yang, J.Wang, S. Brunak, J. Dore, F. Guarner, K. Kristiansen, O. Pedersen, J.Parkhill, J. Weissenbach, P. Bork, S. D. Ehrlich, J. Wang, Nature 2010,464, 59.
[32] E. Weiss, T. Aumiller, H. K. Spindler, P. Rosenfelder, M. Eklund, M.Witzig, H. Jorgensen, K. E. Bach Knudsen, R. Mosenthin, J. Sci. FoodAgric. 2016, 96, 2230.
[33] M. Urbanska, D. Gieruszczak-Białek, H. Szajewska, Aliment. Pharma-col. Ther. 2016, 43, 1025.
[34] C. Iyer, A. Kosters, G. Sethi, A. B. Kunnumakkara, B. B. Aggarwal, J.Versalovic, Cell. Microbiol. 2008, 10, 1442.
[35] E. Vannier, L. C. Miller, C. A. Dinarello, J. Exp. Med. 1991, 174,281.
[36] I. Martinez, J. M. Lattimer, K. L. Hubach, J. A. Case, J. Yang, C. G.Weber, J. A. Louk, D. J. Rose, G. Kyureghian, D. A. Peterson, M. D.Haub, J. Walter, ISME J. 2013, 7, 269.
[37] C. C. Evans, K. J. LePard, J. W. Kwak, M. C. Stancukas, S. Laskowski,J. Dougherty, L. Moulton, A. Glawe, Y. Wang, V. Leone, D. A.Antonopoulos, D. Smith, E. B. Chang, M. J. Ciancio, Plos One 2014,9, e92193.
[38] M. Rajilic-Stojanovic, W. M. de Vos, FEMS Microbiol. Rev. 2014, 38,996.
[39] E. Le Chatelier, T. Nielsen, J. Qin, E. Prifti, F. Hildebrand, G. Falony,M. Almeida, M. Arumugam, J. M. Batto, S. Kennedy, P. Leonard, J. Li,K. Burgdorf, N. Grarup, T. Jorgensen, I. Brandslund, H. B. Nielsen,A. S. Juncker, M. Bertalan, F. Levenez, N. Pons, S. Rasmussen, S.Sunagawa, J. Tap, S. Tims, E. G. Zoetendal, S. Brunak, K. Clement, J.Dore, M. Kleerebezem, K. Kristiansen, P. Renault, T. Sicheritz-Ponten,W. M. de Vos, J. D. Zucker, J. Raes, T. Hansen, P. Bork, J. Wang, S. D.Ehrlich, O. Pedersen, Nature 2013, 500, 541.
[40] J. Haiko, B. Westerlund-Wikstrom, Biology 2013, 2, 1242.[41] L. E. Tailford, E. H. Crost, D. Kavanaugh, N. Juge, Front. Genet. 2015,
6, 81.
Mol. Nutr. Food Res. 2018, 62, 1701023 1701023 (10 of 10) C© 2018 The Authors. Published by WILEY-VCH Verlag GmbH & Co. KGaA, Weinheim.