barium based halide scintillator ceramics for gamma ray
TRANSCRIPT
University of Central Florida University of Central Florida
STARS STARS
Electronic Theses and Dissertations, 2004-2019
2013
Barium Based Halide Scintillator Ceramics For Gamma Ray Barium Based Halide Scintillator Ceramics For Gamma Ray
Detection Detection
William Shoulders University of Central Florida
Part of the Materials Science and Engineering Commons
Find similar works at: https://stars.library.ucf.edu/etd
University of Central Florida Libraries http://library.ucf.edu
This Masters Thesis (Open Access) is brought to you for free and open access by STARS. It has been accepted for
inclusion in Electronic Theses and Dissertations, 2004-2019 by an authorized administrator of STARS. For more
information, please contact [email protected].
STARS Citation STARS Citation Shoulders, William, "Barium Based Halide Scintillator Ceramics For Gamma Ray Detection" (2013). Electronic Theses and Dissertations, 2004-2019. 2805. https://stars.library.ucf.edu/etd/2805
BARIUM BASED HALIDE SCINTILLATOR CERAMICS FOR GAMMA RAY
DETECTION
by
WILLIAM TAYLOR SHOULDERS B.S. Ceramic and Materials Engineering, Clemson University, 2011
A thesis submitted in partial fulfillment of the requirements for the degree of Master of Science
in the Department of Mechanical, Materials and Aerospace Engineering in the College of Engineering and Computer Science
at the University of Central Florida Orlando, Florida
Summer Term 2013
Major Professor: Romain Gaume
i
ABSTRACT
As our understanding of ceramic processing methods for the purpose of fabricating
polycrystalline optical materials has increased over the past few decades, the race is on to bring
ceramic technology to markets where single crystalline materials have traditionally been used. One
such market is scintillators. This Master’s thesis focuses specifically on a class of materials
attractive for use as gamma-ray scintillators. These barium based halides can potentially be
utilized in applications ranging from ionizing radiation detection in the field to high-energy physics
experimentation. Barium bromide iodide and barium chloride single crystals have already showed
high light yield, fast scintillation decay, and high energy resolution, all desirable properties for a
scintillator. This work attempts to show the likelihood of moving towards polycrystalline
scintillators to take advantage of the lower processing temperature, higher manufacturing output,
and overall reduced cost. The experiments begin with identifying appropriate sintering conditions
for hot pressed ceramics of BaBrI and BaCl2. Possible sources of optical loss in the first phase of hot
pressed samples are investigated using a wide range of characterization tools. Preliminary
luminescence and scintillation measurements are reported for a translucent sample of BaBrI.
Recommendations are made to move toward highly transparent ceramics with scintillation
properties approaching those measured in single crystal samples.
ii

ACKNOWLEDGEMENTS
During my first year as a graduate student at UCF I hit a few speed bumps. I am thrilled to
have progressed through four semesters of course work and research to the point where I am
preparing my Master’s thesis. For all their help in keeping me on track, I must first thank my
research advisor, Romain Gaume, and my academic advisor, Kevin Coffey. I took a while to find my
comfort here at UCF and now I have the students in CREOL and the Materials Science and
Engineering departments to thank for making me feel like part of a family, a fun and quirky family
at that.
Specific to the research contained in this document, I must first thank the other members of
my research group: Dr. Samuel Paul David, Ali Jahromi, and the recent joinees, Sudeep Jung and Dr.
Shi Chen. Romain, Samuel and I have worked closely together over the past year to setup our
ceramics lab and begin work on halide ceramics. I must also thank them for allowing me to spend
five months with collaborators at Oak Ridge National Lab while the work load at UCF was still very
heavy. The team in Oak Ridge, Tennessee, who graciously allowed me to work alongside them for
five months, consists of Dr. Lynn Boatner, Dr. John Neal, Joanne Ramey, and James Kolopus.
Additional help on this project came from collaborators at Lawrence Berkley National Lab, Dr.
Gregory Bizzari and Dr. Edith Bourret-Courchesne. Although I have never met them in person, they
have provided me assistance in optical characterization of my samples.
I want to thank my fiancé, Heidi Lindler, for first agreeing to move down to Florida with me
to pursue a higher degree and second for providing me with solace at home when work has often
been hectic. Finally, our cat, Norris, has been a nice writing partner in the long nights I spent
preparing this document.
iii

TABLE OF CONTENTS
LIST OF FIGURES ................................................................................................................................................... vii
LIST OF TABLES ........................................................................................................................................................ x
1. INTRODUCTION ................................................................................................................................................... 1
1.1 Project Motivation ....................................................................................................................................... 1
1.2 Overview of Scintillators .......................................................................................................................... 2
1.3 Searching for New Scintillator Materials ........................................................................................... 6
1.4 Polycrystalline Ceramic Scintillators .................................................................................................. 8
1.4.1 Sources of Optical Loss in Ceramics .......................................................................................... 10
1.4.2 Performance of Ceramic Scintillators ....................................................................................... 11
1.5 Barium Halide Based Scintillators ...................................................................................................... 12
1.5.1 Barium Chloride ................................................................................................................................ 15
1.5.2 Barium Bromide Iodide .................................................................................................................. 19
2. EXPERIMENTAL TECHNIQUES ................................................................................................................... 22
2.1 Overview of Experiments ....................................................................................................................... 22
2.2 Sample Preparation .................................................................................................................................. 22
2.2.1 Preparation of Precursor Powders ............................................................................................ 22
2.2.2 Hot Pressing ........................................................................................................................................ 25
2.2.3 Hot Isostatic Pressing ...................................................................................................................... 26
2.3 Characterization ......................................................................................................................................... 26
iv

2.3.1 Monitoring of Sintering Behavior ............................................................................................... 26
2.3.2 Thermogravimetric Analysis ........................................................................................................ 28
2.3.3 X-ray Diffraction ................................................................................................................................ 29
2.3.4 Raman Spectroscopy ....................................................................................................................... 30
2.3.5 Scanning Electron Microscopy .................................................................................................... 32
2.3.6 X-Ray Excited Luminescence ........................................................................................................ 33
2.3.7 Pulse Height Spectrometry ........................................................................................................... 33
2.3.8 Optical Transmission ....................................................................................................................... 35
3. RESULTS AND DISCUSSION .......................................................................................................................... 36
3.1 Sample Preparation .................................................................................................................................. 36
3.2 Monitoring of Sintering Behavior ....................................................................................................... 36
3.3 Hygroscopicity of Powders .................................................................................................................... 40
3.4 Thermogravimetric Analysis ................................................................................................................ 41
3.5 X-ray Diffraction ......................................................................................................................................... 42
3.6 Raman Spectroscopy ................................................................................................................................ 48
3.7 Scanning Electron Microscopy ............................................................................................................. 52
3.8 X-Ray Excited Luminescence ................................................................................................................ 54
3.9 Pulse Height Spectra ................................................................................................................................ 55
3.10 Optical Transmission............................................................................................................................. 56
4. CONCLUSION ...................................................................................................................................................... 58
APPENDIX A: SAMPLE DATA ............................................................................................................................ 61
v

REFERENCES ........................................................................................................................................................... 62
vi
LIST OF FIGURES
Figure 1: Schematic of a detector system used to characterize scintillator materials (i.e. pulse
height spectrometry) ............................................................................................................................................................. 3
Figure 2: Sources of scattering in transparent ceramics include a) rough surfaces, b) 2nd phases at
grain boundaries, c) porosity, d) birefringence at grain boundaries, and e) inclusions ............................ 9
Figure 3: Energy level diagram for 2 common activators used in scintillator materials. The absolute
energies of the levels will fall within the band gap of the material and will also be dependent on the
crystal field. ................................................................................................................................................................ .............. 17
Figure 4: (a) BaCl2 – LaCl3 phase diagram from FACT database showing the high temperature cubic
phase and (b) BaCl2 – LaCl3 phase diagram developed by Blachnik showing high temperature solid
solution39,40. .............................................................................................................................................................................. 18
Figure 5: Apetz’s model for scattering due to birefringence in a ceramic having Δn=0.02,
thickness=2mm, navg=1.90. This relative transmittance curve is calculated for a wavelength of
435nm. ................................................................................................................................................................ ....................... 20
Figure 6: Schematic of the crystal growth process I used at ORNL 1) melting mixed precursor
powders through a quartz filter under vacuum, 2) sealing the quartz ampoule, and 3) growing a
crystal by the Bridgman method. .................................................................................................................................... 23
Figure 7: Colorless Eu:BaBrI crystal grown at LBNL ............................................................................................. 24
Figure 8: Photographs of the carbon-free hot-pressing system (a) and the commercial Thermal
Technology system with data logging (b). .................................................................................................................. 25
Figure 9: Hot Isostatic Press in the Optical Ceramics Laboratory at UCF manufactured by American
Isostatic Presses and capable of 1800°C and 230MPa. .......................................................................................... 26
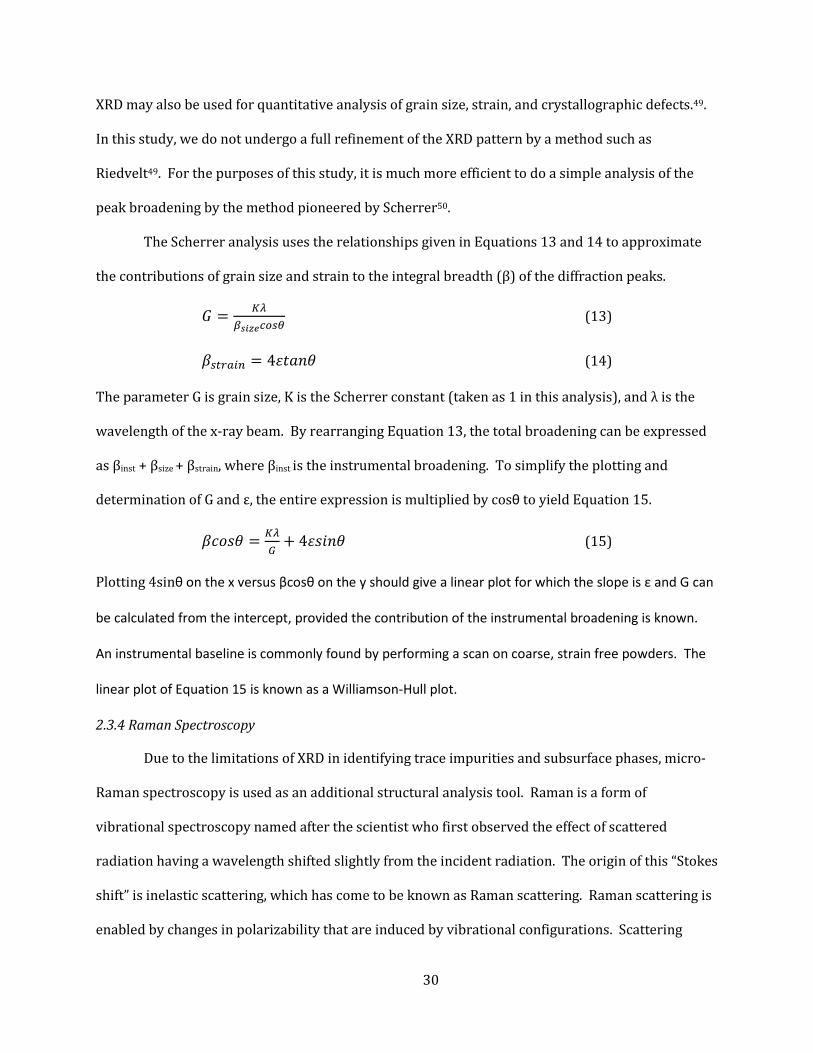
Figure 10: Schematic representation of Stokes and anti-stokes Raman scattering, where ΔE is the
energy shift (negative for Stokes and positive for anti-stokes) ......................................................................... 31
vii

Figure 11: Figure demonstrating a pulse height spectrum taken from Knoll’s text1. The shaded
region is the photopeak from which light yield and resolution are calculated. .......................................... 34
Figure 12: A treated hot press dataset showing the density (derived from the displacement),
temperature, and applied load over time. ................................................................................................................... 37
Figure 13: Graphical determination of the activation energy for densification in BaCl2 hot pressed
at 850°C. .................................................................................................................................................................................... 38
Figure 14: A of 1/RT versus the logarithm of electrical resistivity for data points extracted from
Hull’s article. ............................................................................................................................................................................ 39
Figure 15: Weight gain of halide powders. All powders were crushed to similar particle sizes.
Colorless crystals were grown in-house. ..................................................................................................................... 40
Figure 17: Schematic of F-center creation due to anion vacancies created by the loss of halogen gas
....................................................................................................................................................................................................... 42
Figure 18: XRD pattern of a Eu2+:BaBrI ceramic compared to the reference of a crushed single
crystal powder XRD pattern from the literature. ..................................................................................................... 43
Figure 19: Calculated XRD pattern of BaBrI from 2θ=49.5 to 54.0 showing the shift due to an
increase in doping from 3 wt% (red) to 6 wt% (blue). ......................................................................................... 44
Figure 20: Looking down on the c-axis at the stacked (020) planes of a BaBrI crystal. The (100)
direction is a favorable shear direction........................................................................................................................ 46
Figure 21: X-ray diffraction pattern collected on the Rigaku system for an unprotected sample of
BaCl2. The reference peak position and intensities (taken from MDI JADE database) closely match
monoclinic BaCl2-2H2O (space group 14). ................................................................................................................... 47
Figure 22: (a)Raman spectra collected from a BaCl2 sample fabricated from anhydrous BaCl2
powder and (b) a replot of the bulk spectrum the in frequency range of the Ba-Cl modes. .................. 49
Figure 23: Raman Spectra from the bulk and surface of a hot pressed BaCl2 sample fabricated from
anhydrous starting powder. .............................................................................................................................................. 51
viii

Figure 24: Raman spectra of a 6%Eu2+:BaBrI sample shown in the low frequency range of Ba-Br
and Ba-I vibrations. ............................................................................................................................................................... 52
Figure 25: SEM images of coarse BaCl2 – 2H2O starting powder (top) and a ceramic made from the
powder (bottom). The line used to count grains by the intercept method is shown. .............................. 53
Figure 26: Shearing of grains along parallel directions observed in an SEM image of BaCl2. .............. 54
Figure 27: Comparison of x-ray excited emission in BBI ceramic versus single crystal. The ceramic
was measured at ORNL and the single crystal at LBNL. ........................................................................................ 54
Figure 28: Decay time of ceramic and single crystal BaBrI measured in the pulsed x-ray system at
LBNL. τ is calculated from the fit to an exponential function. ........................................................................... 55
Figure 29: Pulse height spectra of BaBrI using both 133Ba and 137Cs gamma ray sources. .................... 56
Figure 30: Backlit photographs of a 1.5mm thick 5% Eu2+:BaBrI sample (a), a one inch diameter,
2mm thick backlit BaCl2 sample from high purity anhydrous powder (b), and a lower purity di-
hydrate BaCl2 sample before and after HIPing (c) ................................................................................................... 57
ix

LIST OF TABLES
Table 1: Measured properties of two common commercial scintillator crystals. *Light yield is
measured under 137Cs excitation at 662 keV. ............................................................................................................ 4
Table 2: A comparison of single crystalline and ceramic scintillator properties. References are
given next to values. * All energy resolution and light yield data points were measured under 137Cs
excitation, 662keV. ................................................................................................................................................................ 12
Table 3: Scintillation performance of BaCl2 crystals. All light yield measurements were done with a
10µs pulse shaping time. The afterglow is measured at the emission wavelength of the major fast
decay components of each sample. ................................................................................................................................ 16
Table 4: Measured scintillation properties in 2 different BaBrI single crystal samples. Light yield is
measured under 137Cs excitation. Optical excitation for decay measurements in the first sample
was done at 400nm. The 2 component decay in the second sample was measured under x-ray
excitation. .................................................................................................................................................................................. 21
Table 5: Activation energies of BaCl2 calculated from the densification data compared to the
activation energy calculated from high temperature conductivity data. ....................................................... 37
Table 6: Tabulation of Raman vibrational frequencies in BaCl2 from the Bohley publication. ........... 50
x

1. INTRODUCTION
1.1 Project Motivation
This master’s thesis is centered around the effort to develop new, high-performance
scintillator materials specifically for use in gamma-ray detection. The compounds barium bromide
iodide (BaBrI) and barium chloride (BaCl2) have been chosen specifically for their high light yield in
recent studies. These materials are projected to drive the improvement of detectors used for
homeland security, high energy physics, deep well drilling, and space exploration. The Optical
Ceramics Laboratory at UCF, under the direction of Dr. Romain Gaume, is currently involved in a
multi-institutional effort with Oak Ridge National Laboratory (ORNL) and Lawrence Berkley
National Laboratory (LBNL). As part of this partnership, I have conducted the research on barium
bromide iodide at ORNL while research on BaCl2 is largely confined to UCF. I routinely send
samples of ceramics to LBNL for optical characterizations outside the abilities of UCF. This
partnership has yielded a large amount of data in this first six months of work, however work by all
parties continues beyond the period of the master’s work.
The long-term goal of this work is to fabricate transparent ceramics of two potentially
bright gamma ray scintillators, BaCl2 and BaBrI, having similar scintillation performance to recent
results on single crystal BaCl2 and BaBrI. Due to the many factors playing into the performance of
polycrystalline ceramics, it is not feasible to achieve excellent transparency and scintillation
performance in the early stages of research. Therefore, the short-term goals of this project are as
follows. First, I aim to create fully dense ceramics of BaCl2 and BaBrI. Next, I seek to understand the
phase composition and structure of the ceramics including analysis of impurity phases and defects.
Expected hydrate, hydroxide, and oxide impurities lead to scattering and thus reduced optical
quality. Additionally, deviation of the compounds from stoichiometry during processing may lead
to the formation of charged defects (color centers). For the halide materials in focus, it is believed
1
that the achievement of high optical quality is strongly dependent on taking adequate measures to
protect the reactive powders and samples from the ambient atmosphere during processing. This
“hygroscopic” behavior is investigated.
The other parameters affecting the optical quality of ceramics include the volume fraction of
pores, grain size, and grain orientation. In the context of the shorter term goals of this project,
these parameters are considered secondary. The reason for this distinction between primary and
secondary objectives is, first, a logical division of priorities to make the long-term goals
manageable, and second, an attempt to understand the chemical limits to optical quality. Grain size,
grain orientation, and porosity may require systematic studies in order to optimize their
contribution to optical performance. However, if the chemistry of the compounds is not under
control, the optical performance may never meet expectations. In this report, one will find these
first steps towards achieving high performance scintillator ceramics of BaCl2 and BaBrI.
1.2 Overview of Scintillators
The general textbook definition of ‘scintillator’ is a material that converts ionizing radiation
into visible light. Scintillators are used in a broad range of applications including medical imaging,
high energy physics and national defense. The basic setup of a scintillator-based detector includes
the scintillation medium coupled to a photo-multiplier tube (PMT) or to a semiconductor optical
sensing element. A series of electronics is used to amplify, shape, and convert the analog signal to
the digital readout as seen in Figure 1. The energy of the light output from the scintillator is
correlated to the energy of the ionizing radiation (x-rays, γ-rays, neutrons, etc.). Scintillation
wavelength as well as brightness and decay speed vary widely between different scintillator
materials, so scintillators are very application specific. Concepts related to scintillation are
introduced below and discussed in greater detail the references texts by Knoll and Lecoq.1,2
The basic concepts behind scintillation involve the absorption of the ionizing radiation, the
energy transfer to luminescent species and the optical emission processes.
2

Figure 1: Schematic of a detector system used to characterize scintillator materials (i.e. pulse height spectrometry)
In scintillators, ionizing radiation is absorbed by the material through the photoelectric effect and
results in the production of electrons and holes by a multiple elastic scattering process. The
electrons and holes, eventually relax to the bottom of the conduction band and to the top of the
valence band respectively, at which point they migrate and recombine radiatively. To enhance the
radiative recombination of the charge carriers, the material is often doped with an “impurity” called
activator, which traps the charges on energy levels lying within the band gap.
The terms “relaxation” and “migration” describe the basic ideas of how we are able to
observe light emission from scintillators, but the energy decay processes are in fact very complex
and highly material-specific. Ionizing radiation with energy much greater than the band gap
(typically two to three times) creates electrons high in the conduction band and holes deep in the
valence band. Those high energy electrons and holes get rid of their energy by elastic scattering
and Auger processes until the excited electrons fall below the threshold energy (~2Eg) for
scattering. Electrons and holes lose further energy in the next step by a thermalization process in
which phonons are emitted. The final steps of the energy decay are what really determine the
performance of the scintillator. Electrons and holes in the thermal regime interact with the defect
structures of the material or transfer to the material’s luminescent centers, which ideally lead to the
recombination of electron/hole pairs and the emission of photons. However, defects in the
3

material, namely impurities and color centers, may disrupt these ideal recombinations/emissions, a
process which will be discussed later.
Table 1: Measured properties of two common commercial scintillator crystals taken from the scintillator property database3. *Light yield is measured under 137Cs excitation at 662 keV.
Property Units Tl:NaI Bi4Ge3O12 (BGO) *Light Yield (Y) Photons/MeV 43,000 9,500
Energy Resolution (R) % 7% 9% Density ρ g/cc 3.67 7.13
Decay Time(τsc) ns 230 340
Durability N/A Hygroscopic but easily encapsulated
Insensitive to atmosphere
Emission Wavelength nm 415 480
The measurable physical properties related to scintillation performance are introduced in
Table 1. The properties of thallium doped sodium iodide and bismuth germinate are presented to
give an idea of the order of magnitude of the properties for typical commercial scintillators. The
light yield of a scintillator is defined as the number of photons of light emitted per unit energy of
ionizing radiation. The total light yield depends on the efficiencies of each of the charge creation-
migration-recombination processes described above. The light yield is notably affected by non-
radiative recombination (self-quenching), unwanted absorptions, and scattering. Fundamentally,
light yield can be expressed as a product of three factors as in Equation 1.
𝑌 = 𝛼𝑆𝑄 (1)
where α is the photon to carrier conversion factor, S is the probability that carrier energy is
transferred to an emitting center (intrinsic or dopant atom), and Q is the quantum yield of
luminescent decay process. Assuming all transfer and conversion processes are perfectly efficient,
the yield can be related to the number of electrons and holes in the material as proposed by
Dorenbos.
Thus, from Equation 2 the light yield is found to be inversely proportional to the electronic bandgap
(Eg). The energy of the ionizing radiation is given by Eγ while β is a constant assumed to have an
𝑛𝑒/ℎ = 𝐸𝛾𝛽𝐸𝑔
(2)
4
approximate value of 2.5 MeV/ph4. Light yield is measured experimentally by the brightness of
scintillation light produced from a scintillator excited by a monochromatic source of radiation.
Because NaI is used as the industry standard for brightness, light yields for the BaBrI and BaCl2 in
this study are compared to NaI.
Energy resolution refers to the material’s ability to distinguish between different energies
of radiation. The energy resolution of a scintillator is primarily determined by photon statistics and
therefore improved resolutions are obtained with high light yield materials. There is also an
intrinsic component to the resolution which is related to the fact that the light yield is not a truly
linear function of the incident energy, particularly at energies below 100 keV. This so-called non-
proportionality of the response can be explained by the creation of electronic excitations including
photoelectrons (photon absorbed, electron emitted), Compton electrons (incident photon “knocks
loose” and electron and the two particles are scattered away at different angles), and Auger
electrons (emitted due to the filling of an empty core atomic energy level)5. The line width of the
photo-peak in the energy spectrum of a scintillator is determined by the relative numbers of these
electronic excitations created by an incident photon. Finally, the electronic noise originating from
the light detector (shot noise and Johnson noise) limit the overall resolution of the detector.
Resolution is determined experimentally by the ratio of the brightness of the scintillator output
versus its bandwidth for a monochromatic excitation source.
Stopping power can be described by the attenuation length of ionizing radiation in the
material. A material should stop all incoming photons before they reach the PMT. The attenuation
length (µ) is defined as the depth at which the intensity of the ionizing radiation has dropped to 1/e
of the initial value. µ can be approximated with Equation 3 by taking into account the number of
photoelectron and Compton scattering events.
𝜇 = 𝑚𝑓
𝜌(𝜎𝑐+𝜎𝑝𝑒) (3)
5
In Equation 3, mf is the formula mass, ρ is the mass density, and σc and σpe are Compton and
photoelectric scattering cross-sections respectively. To calculate the intensity of the radiation at
any depth within the material, Beer-Lambert’s law is used, as shown in Equation 4.
𝐼(𝑥) = 𝐼0exp (−𝑥/𝜇) (4)
Because σc and σpe can be difficult to approximate, often the material’s density is the major factor
considered in stopping power.
The decay time is the time elapsed from the first elastic interaction between the ionizing
radiation and bound electrons to the sensing of a photon of light. As described above, decay takes
place in multiple steps the decay times for which may vary over several orders of magnitude. A
much slower decay component causing “afterglow” lasting seconds to hours after the initial
collision of a high energy photon can also be present. Afterglow is caused by the trapping of
electrons at lattice defects and contributes to higher background signals during measurements. In
some applications, such as high counting rate or medical Positron Emission Tomography (PET),
time resolution of the scintillator is important and afterglow is highly detrimental.
Finally, the emission wavelength of the scintillator should be well matched to the
maximum efficiency of current PMT or semiconductor detectors, which is typically between 400nm
and 500nm. The emission wavelength is fundamentally determined by the electronic band
structure of the material and measured by a spectrophotometer.
1.3 Searching for New Scintillator Materials
A wide range of scintillator materials including inorganic bulk single-crystals, glasses,
nanoparticles and organic polymers has been studied. Today, however, single crystals remain the
sole class of scintillators capable of competing with semiconductors for high-energy gamma ray
detection where high brightness and energy resolution are needed. Up until recently, the discovery
of new scintillator materials was a very slow process. Simple models, for instance Equation 2, can
predict the performance of a compound. Intuition and experience on the energy band structure
6
created by the addition of specific dopant ions can also be used. However, to properly test
scintillation performance, crystals were grown by labor intensive techniques. In recent years, not
only in the field of scintillator research but in many other fields as well, new materials have
increasingly been identified by both rapid fabrication methods and high-throughput computer
modeling6.
Lawrence Berkley National Lab (LBNL) made significant progress with the former approach
beginning in the late 1980s up to the current day. This approach and its findings are discussed in
detail in the literature7–9. Other national labs in the United States have launched their scintillator
research efforts to include specific classes of materials, including halides and garnets 10. At LBNL,
the first step for the rapid experimental method was the mining of crystal data from the National
Institute of Standards and Technology (NIST) database, featuring hundreds of thousands of
inorganic compounds from past scientific studies. Properties of interest in this data mining were
favorable core-valence transitions (intrinsic scintillators), high density, absence of absorptive
metals, and no intrinsic radioactivity. Once candidate materials were identified, polycrystalline
samples were obtained by either searching material archives from previous studies or synthesizing
new material. The rapid preparation and screening of 100s of viable scintillator compounds was
initially reported in the early 2000s. Stoichiometric amounts of precursor powders from
commercial vendors were batched and melted to form the compounds in accordance with available
phase diagrams. Samples were then placed in special sample holders for analysis by large batch x-
ray diffraction (16 sample automated measurement), x-ray excited luminescence (multiple sample
turret), and a pulsed x-ray system used to estimate the decay time. From this study, a shorter list of
promising scintillator materials was constructed. Research conducted on high purity crystals
followed.
Even with the improved efficiency of rapid experimental screening techniques, the
discovery of new materials by experimental methods alone is severely limited. Careful screening of
7
100 compounds, which has taken place over the past decade with the method described in the
previous paragraph, only takes care of a small fraction of the known compounds. For this reason,
modern approaches to problems in materials science include computational materials design. One
computational method used effectively to screen scintillator materials, among other classes of
materials (thermoelectrics, solar energy materials, etc.), is known as high throughput (HT)
computational materials design. The HT approach uses a combination of data mining, quantum
mechanics, and thermodynamics requiring lots of computing power6,11,12.
First, the mining of data from the international crystal structure database (ICSD) narrows
the field of potentially good scintillators to a manageable level, much like the first step of the
experimental approach. Next, comprehensive models of electronic structure are used to predict
scintillation behavior. Models have been shown to predict the band gap somewhat accurately,
however estimation of light yield, resolution, and decay time is less trivial. Comparisons between
the experimental and calculated light yield (Y) for the well-known scintillators NaI, BGO, and YAG
shows an under-estimate in the calculations11. The most difficult parameter of the light yield
calculation to predict is the carrier to photon conversion factor (α), which varies with temperature
and between materials. Nevertheless, the purpose of developing these models is for the discovery
of new materials, not predicting the absolute values of material properties. The HT computational
methods have provided a good basis for more detailed experimental studies that take into account
more practical aspects of materials selection such as the ability to synthesize the compounds in a
laboratory.
1.4 Polycrystalline Ceramic Scintillators
In the materials science community, a ceramic is usually defined as a man-made inorganic,
non-metallic polycrystalline material. An etched ceramic viewed under an optical microscope may
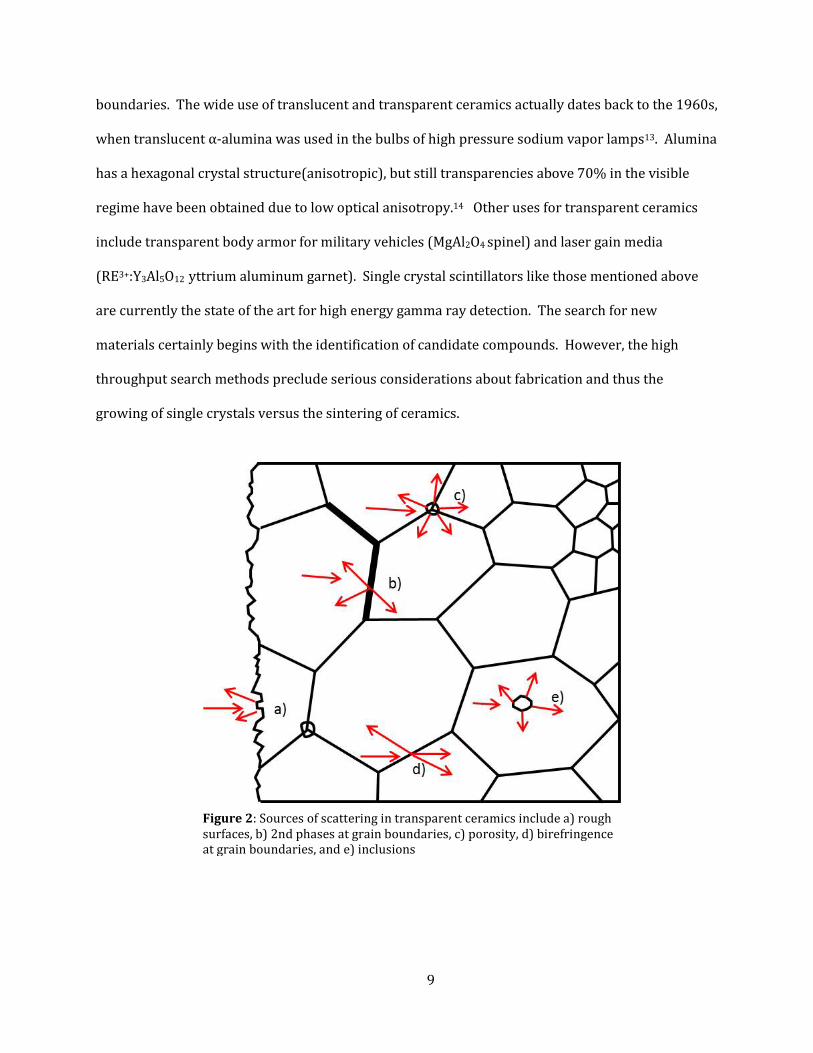
have a grain structure similar to that shown in Figure 2. Because grains are most often oriented
randomly, the mechanical and in our case optical properties encounter discontinuities at grain
8
boundaries. The wide use of translucent and transparent ceramics actually dates back to the 1960s,
when translucent α-alumina was used in the bulbs of high pressure sodium vapor lamps13. Alumina
has a hexagonal crystal structure(anisotropic), but still transparencies above 70% in the visible
regime have been obtained due to low optical anisotropy.14 Other uses for transparent ceramics
include transparent body armor for military vehicles (MgAl2O4 spinel) and laser gain media
(RE3+:Y3Al5O12 yttrium aluminum garnet). Single crystal scintillators like those mentioned above
are currently the state of the art for high energy gamma ray detection. The search for new
materials certainly begins with the identification of candidate compounds. However, the high
throughput search methods preclude serious considerations about fabrication and thus the
growing of single crystals versus the sintering of ceramics.
Figure 2: Sources of scattering in transparent ceramics include a) rough surfaces, b) 2nd phases at grain boundaries, c) porosity, d) birefringence at grain boundaries, and e) inclusions
9
There are several key limitations for available crystal growth methods.
1. Processing temperature
2. Processing time
3. Reactivity with ambient atmosphere, growing vessels
4. Cost of raw materials
The first two issues may be addressed by moving towards polycrystalline ceramic materials. The
process of forming fully dense ceramics from powders, known as sintering, takes place below the
melting temperature of a compound. Where crystal growth techniques, such as Bridgman-
Stockbarger, may take weeks at the melting temperature to grow a crystal a few centimeters in
length, most sintering techniques require only a matter of hours. Single crystals are also limited in
geometry (especially diameter), while polycrystalline ceramics can be made available in larger and
more complex geometries. One other notable advantage of ceramics over single crystals is
increased control over dopant concentrations and profiles. This is extremely useful for tailoring the
properties of solid state lasers, but also has implications for improved scintillator output. Besides
differences related to processing, the resulting properties of ceramics are different than those of
their single crystal counterparts. The presence of grain boundaries in ceramics improves their
mechanical strength compared to crystals. Grain boundaries are also effective in altering other
physical properties including thermal conductivity. With these advantages come additional
challenges for achieving good optical quality in a ceramic versus a single crystal.
1.4.1 Sources of Optical Loss in Ceramics
The fabrication of polycrystalline ceramic scintillators also has its challenges. Most
importantly, the transparency of a ceramic (and ultimately light output of the scintillator) is
determined by the extent of scattering and absorption. The sources of scattering are represented in
Figure 2. First of all, the anisotropy of the refractive index (birefringence) between neighboring
grains in a polycrystalline ceramic leads to Fresnel losses. In this phenomenon, which follows
10

Snell’s law, light refracts at the interface between two dissimilarly oriented grains. The angle of
refraction depends on the direction of propagation of the light ray with respect to the crystalline
orientation of the grains and to that of the grain boundary. This is quantified by the magnitude of
the difference in the refractive index (Δn) for this orientation. Other sources of scattering may also
exist. Incomplete densification of the ceramic results in residual porosity (npore≈1), which strongly
scatters the scintillation light. Most optical materials have an index of refraction much higher than
1, so this usually has a much stronger effect than birefringence alone. For instance, at a wavelength
of 550nm NaI has n ≈ 1.77 and BGO has n ≈ 2.57. Several other sources of scattering is shown in
Figure 2. Basically any inhomogeneity in the refractive index will lead to scattering.
Optical absorptions can also lead to a decrease in transmission of a transparent ceramic
sample. These absorptions come from heightened concentrations of chemical and structural
defects15,16. The presence of charged defects, known as “farben centren” or color centers are
frequently observed in the halide materials of interest in this study. The F-center, an electron
trapped in an anion vacancy, is a common color center in halide materials. This trapped electron
has its own characteristic resonance in the visible frequency range.17,18 This is the simplest
example of a color center, but many other types of charged defects can be formed.
1.4.2 Performance of Ceramic Scintillators
The challenges of absobers and scatterers have been largely overcome for a small set of
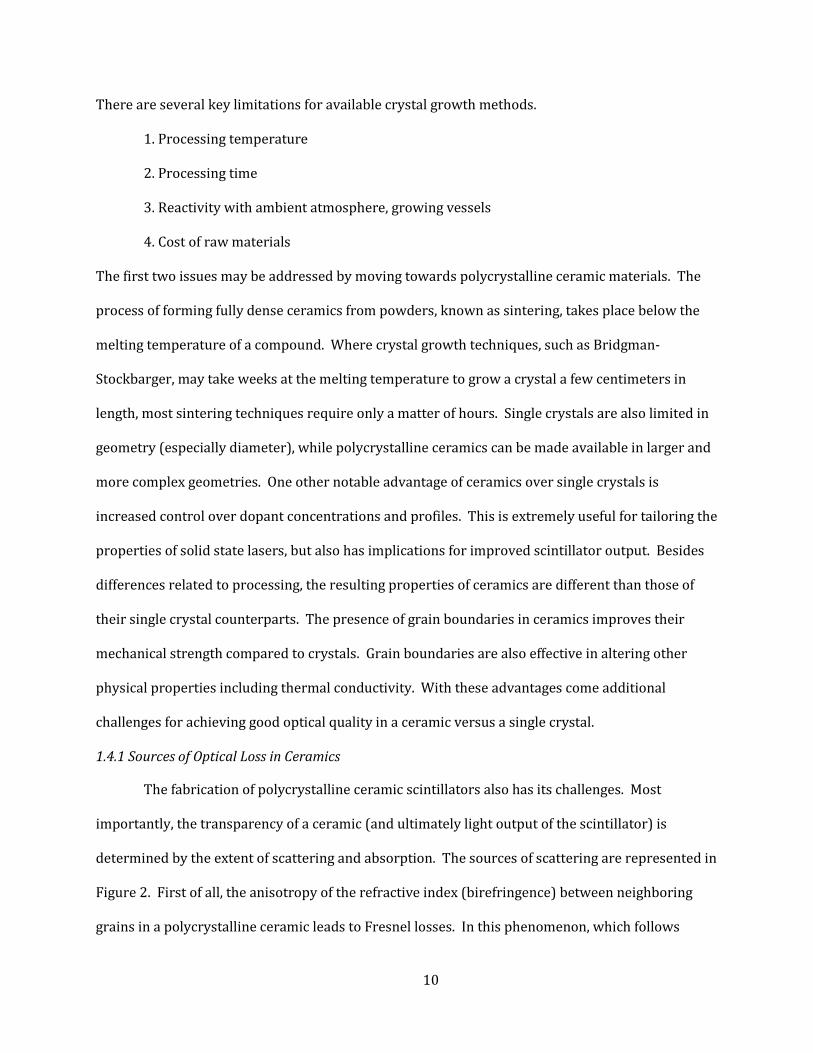
scintillator ceramics. Table 2 compares the properties of polycrystalline ceramic scintillators to
their single crystal counterparts. To date, ceramic scintillators often show poorer characteristics
than their single crystal counterparts due to the greater challenge of eliminating all sources of
optical loss.
11
Table 2: A comparison of single crystalline and ceramic scintillator properties. References are given next to values. * All energy resolution and light yield data points were measured under 137Cs excitation, 662keV.
1.5 Barium Halide Based Scintillators
One takeaway from the recent efforts to survey broad composition spaces for potential
scintillator materials is the attractiveness of the alkaline-earth halide salts. In this body of work, I
focus specifically on the barium halides. These compounds possess simple crystal structures with
predictable scintillation decay mechanisms. Additionally, their lattices are accommodating to the
size and charge of common rare-earth elements used as activators. From the processing standpoint
(covered in more detail in chapter 2), the barium halides are readily available at relatively low raw
materials costs, have relatively low melting temperatures, and exhibit lower activities with air than
some other promising metal halide scintillator materials such as SrI2 and LaBr3. The following
discussion covers the work on alkaline earth halides in the past fifty years leading up to the current
interest in barium based halides.
Publications on strontium iodide have been frequent over the past decade due to its high
light yield and the proportionality of its response. As is the case for many of the binary alkaline
earth halides, researchers have found a renewed interest over the past two decades due to
improvements in the crystal growth techniques and more recently ceramic processing. Europium
Material LSO: Ce crystal
LSO: Ce ceramic
LaBr3: 0.5%Ce crystal
LaBr3: 1%Ce ceramic BGO crystal BGO
ceramic
Refractive index biaxial biaxial uniaxial uniaxial isotropic isotropic
Light Yield (Ph/MeV) 33000(19) 28000(19) 75000(20) 42000(19) 10600 (21)
<10000(22)
Energy Resolution
(%)* 9(23) 18(23) 2.9(24) >3 9.05(21)
Decay Time (ns) 42(19) 32.8(19) 30(24) 300(25)
Emission Wavelength
(nm) 405(19) 420(19) 356; 387(24) 485(25) 500(22)
12

doped SrI2 crystals are now commercially viable gamma ray scintillators26. Studies on ceramic SrI2
have revealed that its high reactivity with the ambient atmosphere (H2O and O2) is the largest
obstacle in producing samples with adequate transparency27. To maintain a clean working
environment throughout the entire ceramic fabrication process has been a major challenge.
Nonetheless, SrI2 ceramic scintillators are still an active area of research. In this work, experimental
data for SrI2 is often used as a comparison for the BaCl2 and BaBrI.
Other alkaline earth halides have also been studied over the years. Binary compounds are
naturally the easiest to study from a chemical and structural standpoint. The availability of
experimental data from as early as the 1930s (when scintillator materials were not at the forefront
of scientific research) is also helpful in surveying their potential as scintillators. Calcium
compounds, although the least dense of the alkaline earth halides discussed here, have found their
share of applications. Calcium fluoride has been used as an x-ray detector since the middle of the
20th century and also as a tritium detector28. However, the stopping power and brightness of CaF2
are not sufficient for gamma ray detection applications of interest in this work. One can still learn
from the tremendous progress made on this material. Scientists in Russia have fabricated highly
transparent CaF2 nano-ceramics29. Grain sizes on the order of tens of nanometers can lead to
effective optical isotropy for materials possessing non-cubic crystal structures. The method of
nano-structuring as well as other methods useful in working towards transparent non-cubic
materials, such as grain texturing, will be discussed later in the context of barium chloride ceramics.
Another binary compound, barium fluoride, was first tested as a scintillator in the 1980s. In
its pure form, BaF2 has three overlapping emission bands, which can be a severe limitation to the
resolution. This is compensated by the fast decay. The ultra-fast core-valence luminescence
mechanism (typically much faster than decay in doped scintillators) is only possible in a limited
number of ions, Ba2+, Rb+, Cs+, and K+ and happens to occur most rapidly in BaF230. The band
accounting for 80% of the light output has a very slow decay time (>600ns), however the other
13
emission band corresponds to a very fast decay component (<1ns), making this material attractive
for high counting rate applications31. The slower decay components may be suppressed by adding
activators, but not without sacrificing scintillation performance in other regards32. BaF2 has its
niche in high counting rate applications not requiring high light yield. It is currently available from
industrial crystal growers mainly for use as a detector in positron emission tomography (PET
scans).
The other binary barium halides in their undoped, cerium doped, and europium doped
forms have been studied extensively33,34. Ce: BaBr2 and Eu: BaCl2 have yielded promising
experimental results, while barium iodide shows very poor light yield. However, these materials
have yet to exceed the performance of current state of the art single crystal scintillators (i.e. NaI).
Barium chloride ceramics are a major component of this study, so this material will be treated in
more detail in the next section. The mixed halides have also been investigated. The halofluorides
(BaXF, where X is Cl, Br, or I) display poor scintillation properties due to the trapping of electrons at
intrinsic defect sites35. The reason for failure of these compounds is speculated to come from the
complexity of the structure formed from the combination of fluoride and ‘X’ compounds. BaF2 is
cubic, while the other barium halides adopt an orthorhombic crystal structure. The conditions for
the formation of an extended solid solution are not favorable and a high concentration of defects is
likely. Generally, disordered and complex crystal structures are undesirable for scintillator
applications for this reason.
In conclusion, many alkaline earth halide materials have been investigated for their optical
and scintillation properties over the years. The two materials at the focus of this work have not
been treated as extensively as many of those mentioned above. Both barium bromide iodide and
barium chloride have narrow bandgaps (5.78eV and 4.12eV respectively), meaning the theoretical
limits to their light yields according to Equation 2 are roughly 46,000 ph/MeV and 64,000 ph/MeV
respectively. The Eu2+ dopant substitutes directly for the 2+ charged cations in the crystal structure
14
and the energy levels of Eu2+ fall within the bandgap of both materials. This potential for high light
yield scintillation has been identified by a combination of computer and experimental results.
1.5.1 Barium Chloride
Barium Chloride has garnered interest at a gamma ray scintillator in recent years. It adopts
an orthorhombic PbCl2-type crystal structure (Space group 62) from room temperature all the way
up to 925°C, at which point it transforms into a cubic phase until the melting point of 962°C. Even
though the structure is orthorhombic (a~7.865Å, b~4.731Å, c~9.421Å), the optical symmetry is
nearly biaxial with a Δn ~ 0.012 (na~1.7302, nb~1.7361, nc~1.7420)36. The limit on optical quality
of BaCl2 ceramics is assumed to come predominantly from the birefringence at grain boundaries.
The table below shows experimentally measured light yield, decay time, afterglow, and energy
resolution for undoped, cerium doped, and europium doped BaCl2.
The x-ray luminescence (XL) spectrum of pure BaCl2 shows three overlapping peaks, two of
which have been attributed to the afterglow in the sample33. The broad and overlapping XL peaks
correspond to a lower energy resolution. By contrast, the europium doped samples display only 2
overlapping peaks, one of which (406nm) originates from a 5d-4f transition in Eu2+. Furthermore,
the light yield is over 15% higher than NaI.
15
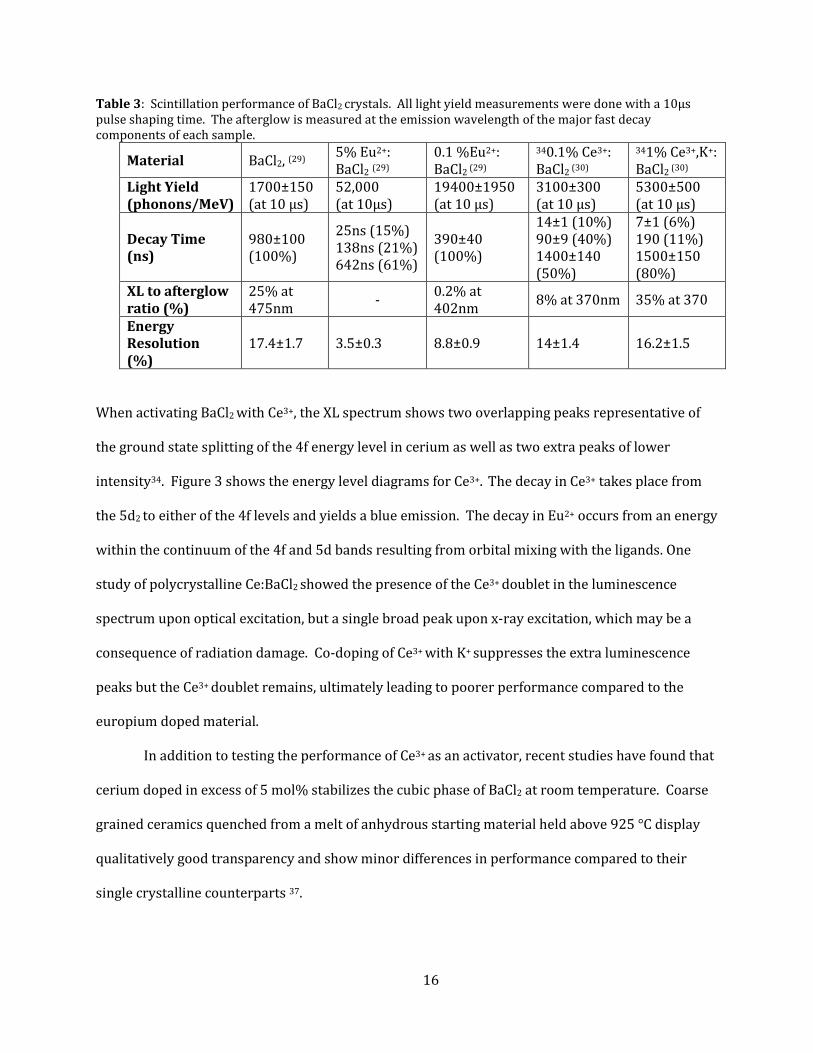
Table 3: Scintillation performance of BaCl2 crystals. All light yield measurements were done with a 10µs pulse shaping time. The afterglow is measured at the emission wavelength of the major fast decay components of each sample.
Material BaCl2, (29) 5% Eu2+: BaCl2 (29)
0.1 %Eu2+: BaCl2 (29)
340.1% Ce3+: BaCl2 (30)
341% Ce3+,K+: BaCl2 (30)
Light Yield (phonons/MeV)
1700±150 (at 10 μs)
52,000 (at 10µs)
19400±1950 (at 10 μs)
3100±300 (at 10 μs)
5300±500 (at 10 μs)
Decay Time (ns)
980±100 (100%)
25ns (15%) 138ns (21%) 642ns (61%)
390±40 (100%)
14±1 (10%) 90±9 (40%) 1400±140 (50%)
7±1 (6%) 190 (11%) 1500±150 (80%)
XL to afterglow ratio (%)
25% at 475nm - 0.2% at
402nm 8% at 370nm 35% at 370
Energy Resolution (%)
17.4±1.7 3.5±0.3 8.8±0.9 14±1.4 16.2±1.5
When activating BaCl2 with Ce3+, the XL spectrum shows two overlapping peaks representative of
the ground state splitting of the 4f energy level in cerium as well as two extra peaks of lower
intensity34. Figure 3 shows the energy level diagrams for Ce3+. The decay in Ce3+ takes place from
the 5d2 to either of the 4f levels and yields a blue emission. The decay in Eu2+ occurs from an energy
within the continuum of the 4f and 5d bands resulting from orbital mixing with the ligands. One
study of polycrystalline Ce:BaCl2 showed the presence of the Ce3+ doublet in the luminescence
spectrum upon optical excitation, but a single broad peak upon x-ray excitation, which may be a
consequence of radiation damage. Co-doping of Ce3+ with K+ suppresses the extra luminescence
peaks but the Ce3+ doublet remains, ultimately leading to poorer performance compared to the
europium doped material.
In addition to testing the performance of Ce3+ as an activator, recent studies have found that
cerium doped in excess of 5 mol% stabilizes the cubic phase of BaCl2 at room temperature. Coarse
grained ceramics quenched from a melt of anhydrous starting material held above 925 °C display
qualitatively good transparency and show minor differences in performance compared to their
single crystalline counterparts 37.
16

Figure 3: Energy level diagram for 2 common activators used in scintillator materials. The absolute energies of the levels will fall within the band gap of the material and will also be dependent on the crystal field.
The evaluation of scintillation performance in these 5% Ce3+ doped BaCl2 ceramics showed a light
yield of 7,200 ph/MeV, resolution of 23% and fast initial decay component of 50ns. Yttrium,
lutetium, samarium, gadolinium, and lanthanum cations have also been tested to stabilize the cubic
phase in BaCl2 at room temperature37,38. Figure 4 shows a phase diagram for a pseudo-binary
system which is not suitable for stabilizing the cubic phase. The region of solid solution between
301°C and 600°C is an indicator that the two cations can form a solid solution of the hexagonal
phase. However, a high temperature solid solution of cubic barium chloride and cubic CsCl is
required for a quenched sample to retain the cubic structure at room temperature. This is not
observed in the phase diagram.
A study of the BaCl2 –LaCl3 phase diagram shows some uncertainty in the BaCl2 –rich phases
due to a lack of data points. Studies by Edgar, et. al. suggest that a solid solution between these two
compounds should appear near the melting point and moderate cooling rates are successful in
retaining that cubic solid solution at room temperature.
17

Figure 4: (a) BaCl2 – LaCl3 phase diagram from FACT database showing the high temperature cubic phase and (b) BaCl2 – LaCl3 phase diagram developed by Blachnik showing high temperature solid solution39,40.
These literature results make sense in the light of the similarity of ionic size of Ba2+ and La3+,
assuming 8-coordinated barium and 9-coordinated lanthanum in the cubic structure41. The cubic
(a)
(b)
18

phase was achieved in both 11% Gd3+:BaCl2 and Gd3+, Ce2+ co-doped BaCl2. For the lanthanum
stabilized material, the luminescence is suspected to originate from the excitement of chlorine
interstitials, trapping of electrons on lanthanum ions, and the migration of electrons to europium
centers. Thus the chemical stabilization of cubic BaCl2 has its trade-offs with scintillation
performance, and is not of interest at the moment.
1.5.2 Barium Bromide Iodide
Barium bromide iodide (BBI) is a more recently discovered scintillator material being
grown at LBNL and Radiation Monitoring Devices, Inc33,42. BBI melts at 850 °C and adopts PbCl2
structure just like BaCl2. Due to the limited amount of experimental data available on this material,
simulations using density functional theory (DFT) have predicted additional properties43. The band
gap of BaBrI, calculated by three different methods, is found to be 5.78±0.67eV on average. The
average refractive index deviation (Δn) between the three principle axes for BBI was found to be
approximately 0.02. The magnitude of this refractive index variation is rather large, causing
transmission to drop rapidly in a sample having an average grain size on the order of hundreds of
nanometers. This calculation for scattering by birefringence is based on Rayleigh-Gans-Debye
theory. Assuming random orientation of grains, uniform grain size distribution, no pores, no
inclusions, and no secondary phases, the relative inline transmittance is approximated by Equation
5, originally presented by Apetz44.
𝑅𝐼𝑇 = (1 − 𝑅𝑠)exp (3𝜋2𝑟(∆𝑛)2𝑑𝜆02
) (5)
Rs is a parameter based on the difference in refractive index between 2 crystallographic directions
given by Equation 6.
𝑅𝑠 = (𝑛1−𝑛2)2
(𝑛1+𝑛2)2 (6)
For the purpose of this approximation, n1 is taken to be the average refractive index of the material
and n2 the average n plus the average deviation of n between the 3 principle axes. In Equation 5, r is
19
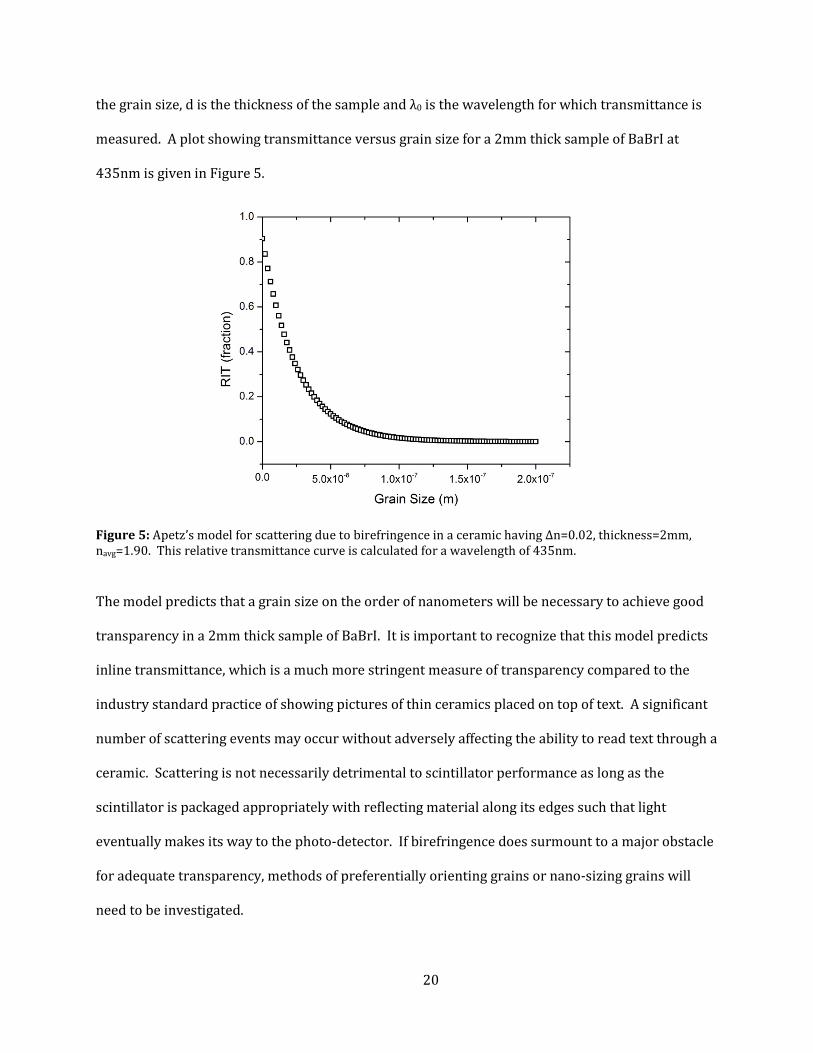
the grain size, d is the thickness of the sample and λ0 is the wavelength for which transmittance is
measured. A plot showing transmittance versus grain size for a 2mm thick sample of BaBrI at
435nm is given in Figure 5.
Figure 5: Apetz’s model for scattering due to birefringence in a ceramic having Δn=0.02, thickness=2mm, navg=1.90. This relative transmittance curve is calculated for a wavelength of 435nm.
The model predicts that a grain size on the order of nanometers will be necessary to achieve good
transparency in a 2mm thick sample of BaBrI. It is important to recognize that this model predicts
inline transmittance, which is a much more stringent measure of transparency compared to the
industry standard practice of showing pictures of thin ceramics placed on top of text. A significant
number of scattering events may occur without adversely affecting the ability to read text through a
ceramic. Scattering is not necessarily detrimental to scintillator performance as long as the
scintillator is packaged appropriately with reflecting material along its edges such that light
eventually makes its way to the photo-detector. If birefringence does surmount to a major obstacle
for adequate transparency, methods of preferentially orienting grains or nano-sizing grains will
need to be investigated.
20
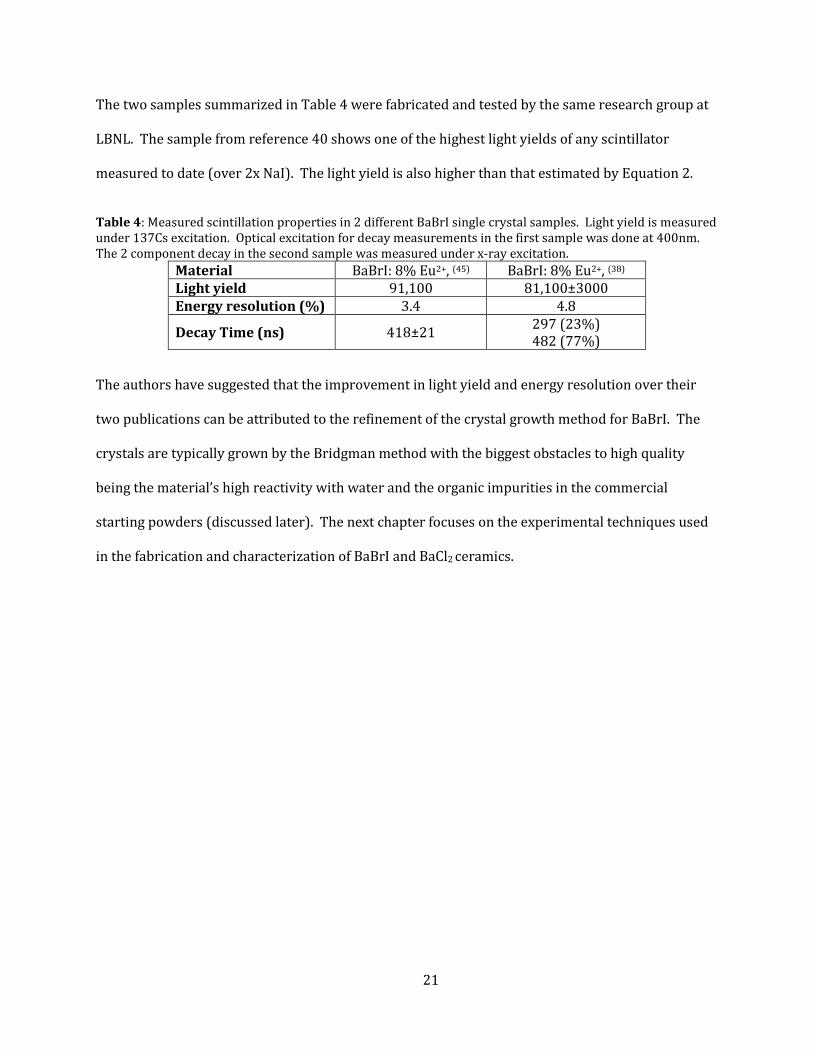
The two samples summarized in Table 4 were fabricated and tested by the same research group at
LBNL. The sample from reference 40 shows one of the highest light yields of any scintillator
measured to date (over 2x NaI). The light yield is also higher than that estimated by Equation 2.
Table 4: Measured scintillation properties in 2 different BaBrI single crystal samples. Light yield is measured under 137Cs excitation. Optical excitation for decay measurements in the first sample was done at 400nm. The 2 component decay in the second sample was measured under x-ray excitation.
Material BaBrI: 8% Eu2+, (45) BaBrI: 8% Eu2+, (38) Light yield 91,100 81,100±3000 Energy resolution (%) 3.4 4.8
Decay Time (ns) 418±21 297 (23%) 482 (77%)
The authors have suggested that the improvement in light yield and energy resolution over their
two publications can be attributed to the refinement of the crystal growth method for BaBrI. The
crystals are typically grown by the Bridgman method with the biggest obstacles to high quality
being the material’s high reactivity with water and the organic impurities in the commercial
starting powders (discussed later). The next chapter focuses on the experimental techniques used
in the fabrication and characterization of BaBrI and BaCl2 ceramics.
21

2. EXPERIMENTAL TECHNIQUES
2.1 Overview of Experiments
This project is centered on the fabrication of barium based halide ceramics and their
subsequent characterization. Starting materials are either single crystals grown by the Bridgman-
Stockbarger technique, anhydrous commercial powders, or di-hydrate commercial powders.
Powders are hot pressed into ceramics having typical densities of 98% ± 2% relative to the
theoretical density. Hot pressed ceramics are subsequently hot isostatically pressed (HIPed) to
collapse any remaining closed porosity. Additional post-treatment of samples by annealing is
sometimes necessary to reverse chemical reactions that result in coloration of the samples. Basic
optical sample preparation by grinding and polishing parallel surfaces is necessary for most
characterization techniques.
Many common structural and optical characterization tools have been used for this project.
The structural characterization techniques include x-ray diffraction (XRD), micro-Raman
spectroscopy, and scanning electron microscopy. Thermogravimetric analysis (TGA) is also used to
examine the mass lost from the starting powders upon heating. The optical transmission of the
samples is measured by ultraviolet-visible spectrophotometry. The subset of scintillation
characterization techniques includes x-ray excited luminescence (XRL) to measure a sample’s
emission under low energy (1-100keV) excitation, decay time measurement using a pulsed x-ray
source, and finally light yield and resolution measurement using pulse height spectrometry.
2.2 Sample Preparation
2.2.1 Preparation of Precursor Powders
The easiest route toward transparent ceramics of barium based halides is expected to be
through the hot pressing of crushed powders derived from highly pure single crystals. Crystals of
BaBrI doped with between 3% and 6% by weight of EuCl2 are grown by the Bridgman method at
22

ORNL and LBNL. Anhydrous powders of BaBr2, BaI2, and EuI2 each having purities of at least
99.99% are batched in stoichiometric amounts in an argon filled glove box maintained at <100ppm
H2O and <50ppm O2. The batch is then sealed in a quartz ampoule and reacted under vacuum to
form the BaBrI compound at 850°C. The ORNL process for purifying BaBrI is described in Figure 6.
The process uses a glass filter with a 100µm pore size, which lets the molten halide phase through
and leaves behind a black organic residue.
Figure 6: Schematic of the crystal growth process I used at ORNL 1) melting mixed precursor powders through a quartz filter under vacuum, 2) sealing the quartz ampoule, and 3) growing a crystal by the Bridgman method.
After purification and the formation of the BaBrI phase above 850°C, the quartz tube is sealed with
a hydrogen torch below the filter and attached to a quartz rod for suspension in the vertical
Bridgman furnace. In a typical Bridgman crystal growth, the ampoule is lowered through the
melting zone at a rate of approximately 0.04mm/h, meaning a single pass through the hot zone
takes approximately three weeks to grow a crystal several inches in length. Some systems may also
rotate the ampoule while pulling to homogenize the melted region. The Bridgman technique also
acts to purify the material. This is similar to the method of zone refining, as an ampoule is pulled
slowly through the hot-zone of a furnace, which has been set at the melting temperature of the
material. The difference in solubility of impurities in the two phases at the solid-liquid interface
will cause the impurities to either accumulate in the melt (higher solubility in melt, i.e. segregation
23

coefficient k<1) or crystallize at the edge of the melt zone (lower solubility in the melt, i.e.
segregation coefficient k>1)46. In practice, in the semi-conductor industry, hundreds of cycles are
used to achieve high purity crystals. Synthesized crystals possess multiple grains in some cases but
exhibited high clarity and no visible coloration. Impurities are concentrated at one end of the
ampoule. An example of a colorless crystal grown at LBNL is shown in Figure 7.
Figure 7: Colorless Eu:BaBrI crystal grown at LBNL
Thus far in this work, a more practical route has been adopted for the preparation of BaCl2.
Commercial powders of anhydrous BaCl2 and the di-hydrate (BaCl2-2H2O) are directly filled into the
hot pressing die without purification. This disregards the removal of any organic residues at the
moment, but BaCl2 powder preparation will employ a filtration method such as that used at ORNL in
the future. The reason for also disregarding the impurities due to water (hydrate) is the
observation in literature that BaCl2 is one of few compounds whose hydration is completely
reversible47. Thus, if anhydrous starting powder is exposed to air, it should still dehydrate
completely before sintering begins to occur. The same holds true if the starting powder is a di-
hydrate and furthermore the di-hydrate is stable and easier to handle in air. The removal of two
molecules of water from each molecule of BaCl2 in the confined space of a hot press die under one
atmosphere of flowing argon may prove to be too difficult, however the pressing of di-hydrate
powders is a very easy experiment to try.
For this study, regardless of the powder preparation method, the material is crushed in
small batches (~10g) with a mortar and pestle (inside the glove box for BaCl2) to achieve a particle
size on the order of a few micrometers. Anhydrous powders are ground just before loading into a
die to avoid excessive moisture absorption.
24
2.2.2 Hot Pressing
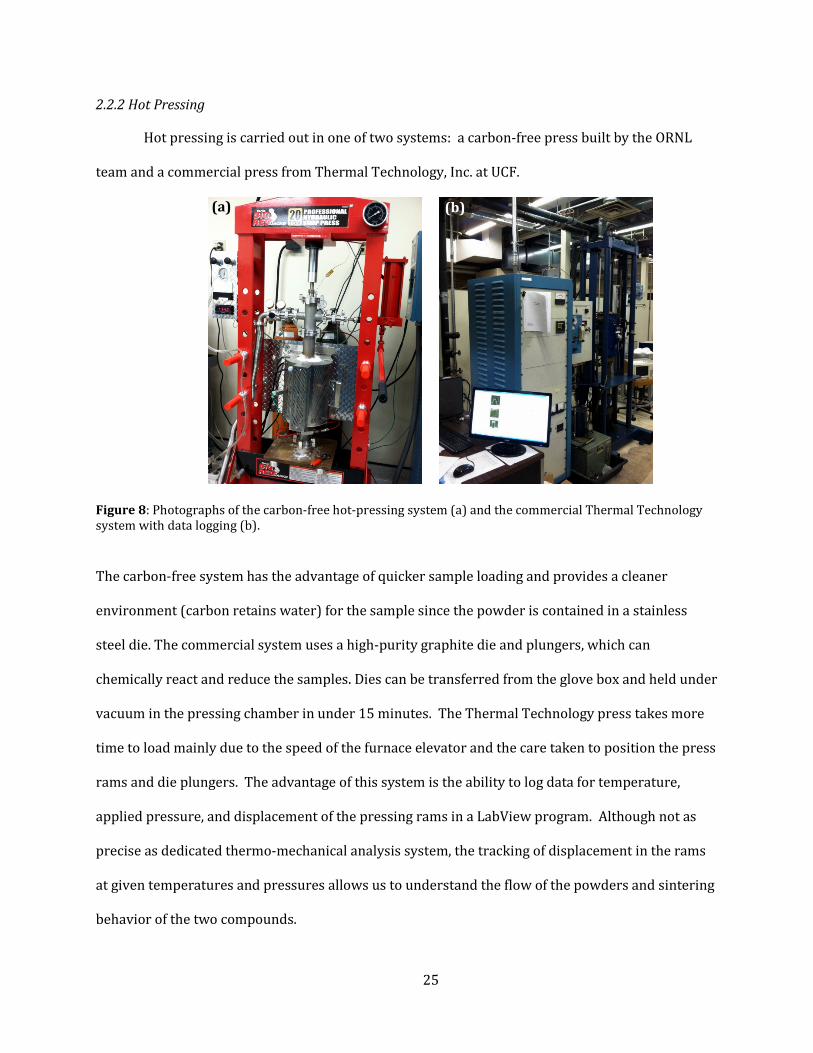
Hot pressing is carried out in one of two systems: a carbon-free press built by the ORNL
team and a commercial press from Thermal Technology, Inc. at UCF.
Figure 8: Photographs of the carbon-free hot-pressing system (a) and the commercial Thermal Technology system with data logging (b).
The carbon-free system has the advantage of quicker sample loading and provides a cleaner
environment (carbon retains water) for the sample since the powder is contained in a stainless
steel die. The commercial system uses a high-purity graphite die and plungers, which can
chemically react and reduce the samples. Dies can be transferred from the glove box and held under
vacuum in the pressing chamber in under 15 minutes. The Thermal Technology press takes more
time to load mainly due to the speed of the furnace elevator and the care taken to position the press
rams and die plungers. The advantage of this system is the ability to log data for temperature,
applied pressure, and displacement of the pressing rams in a LabView program. Although not as
precise as dedicated thermo-mechanical analysis system, the tracking of displacement in the rams
at given temperatures and pressures allows us to understand the flow of the powders and sintering
behavior of the two compounds.
(a) (b)
25

2.2.3 Hot Isostatic Pressing
Even though hot pressing may result in ceramics with densities near 99% of the theoretical
density, it is often necessary to undergo an additional step to collapse the remaining porosity.
Calculations using the Rayleigh-Gans-Debye theory, similar to those in the first chapter, show that
even very disperse concentrations of pores may severely limit the transparency of a sample. HIPing
uses compressed argon to apply isostatic pressures as high as 33kpsi (230MPa) on heated samples.
Samples with sufficient density, in which the porosity forms a closed porosity network (i.e. ρ/ρth>
90%) may reach within fractions of a percent of the theoretical density deeming them virtually
pore-free.
Figure 9: Hot Isostatic Press in the Optical Ceramics Laboratory at UCF manufactured by American Isostatic Presses and capable of 1800°C and 230MPa.
2.3 Characterization
2.3.1 Monitoring of Sintering Behavior
When working with compound for the first time, it is important to have some idea of the
appropriate sintering conditions (time, temperature, and pressure profiles). To avoid an
extraneous number of runs in the hot press before finding appropriate conditions, the hot press in
the optical ceramics laboratory at UCF is setup to record densification data. Change in
displacement of the pressing rams is monitored to the accuracy of 0.1mm over the entire sintering
run using a LabView program. In instances where the powder settles into the die under a moderate
26
load, the viscoelasticity of the powder can be observed. In the constant pressure and increasing
temperature segment of a hot-pressing run, the shape of the strain rate times temperature vs.
temperature curve can be related to the activation energy for densification in the material.
In order to extract good data from the displacement curve, it is first important to have a
good baseline to account for the thermal expansion and mechanical deformation of the hot press
and die components. Only then can the expansion of the powder compact and the strain of the
ceramic sample be extracted. This procedure was used for two different hot pressed BaCl2 samples,
one using anhydrous powder and one using di-hydrate powder. The first treatment of the raw data
is to normalize the baseline run and the sample run in time. The negative of the difference between
the sample compaction curve and the baseline compaction curve is taken as the height of the
powder compact. The strain rate in the sample is then calculated by Equation 7, where h is the
height of the sample and dh/dt is the first derivative of the height in time.
𝜀′ = 1ℎ𝑑ℎ𝑑𝑡
(7)
𝜌 = 𝑒𝜀−𝜀𝑚𝑎𝑥 (8)
The density (ρ) is then calculated as the exponential of the normalized strain (calculated by
differentiating Equation 7) as in Equation 8. This normalization sets the maximum density at the
end of the hot pressing run at 100%. This is a reasonable assumption because the measured
density of hot pressed samples is typically 95% -99% of the theoretical density in most materials
systems. The error in measurement of the density over time is roughly 2% due to the precision of
the displacement sensor, the uncertainty in the background subtraction and the deformation of the
graphite foil (grafoil) spacers.
Nevertheless, it is also helpful to use the estimated strain in the sample to calculate the
activation energy for sintering. The general form of the sintering equation expressed as the strain
rate is given in Equation 948.
27

𝜀′ = 𝐻𝐷𝐺𝑚𝐾𝑇
(𝛷𝑃)𝑛 (9)
D = 𝐷0𝑒−𝑄𝑑/𝑅𝑇 (10)
𝐺 = 𝐺0𝑒−𝑄𝑔/𝑅𝑇 (11)
ε’ is the strain rate of the ceramic, H and Φ are constants, D is the diffusivity, P is the applied
pressure, G is the grain size (which has its own exponent), and T is temperature in Kelvin. From
Equations 10 and 11, it is apparent that both diffusion and grain growth have their own activation
energy plus both properties vary with temperature. Because the region of the densification curve
examined is at constant pressure, grain size and diffusion are the only variables. Inserting
Equations 10 and 11 back into Equation 9 results in Equation 12. Thus with a plot of ln(T*ε’) vs.
1/RT, one can estimate the sum of the activation energies as the slope of the curve. If grain growth
is assumed to be minimal over the temperature range covered in the plot, the activation energy
measured approximates the activation energy for diffusion.
2.3.2 Thermogravimetric Analysis
Earlier in this report, it has been stated that possible sources of reduced optical quality in
ceramics include secondary phases and color centers. Many cautions have been taken in the
preparation of BaBrI powders to avoid contamination by the ambient atmosphere. However, given
its sensitivity to the ambient atmosphere, it is still possible for water impurities to influence the
formation of undesirable phases. TGA monitors the weight loss of a sample as a function of
temperature. The composition of the off-gas from the TGA is then analyzed with mass-
spectrometry. Secondary phases can possibly result from incomplete dehydration. Additionally,
the concentration of anion defects may increase due to loss of halogen. TGA was performed on
anhydrous powders of both BaBrI and BaCl2 using a TA Instruments Q500 system operated in
flowing argon atmosphere. The heating rate was 10°C/min and each compound was taken from
room temperature to near its melting point.
𝜀′ = 𝐶𝐾𝑇𝑒
(𝑚𝑄𝑔−𝑄𝑑)𝑅𝑇� (12)
28
2.3.3 X-ray Diffraction
The phase of the starting powders as well as bulk ceramic samples is analyzed using x-ray
diffraction (XRD). XRD works on the principle of constructive interference of the x-ray radiation.
Waves incident at an appropriate angle to diffract from certain crystallographic planes and be
constructively interfered by the waves diffracting from the identical plane below result in spikes of
x-ray intensity. On a randomly oriented powdered or non-textured ceramic sample, monitoring the
intensity of the diffracted x-ray beam as a function of scattering angle results in a pattern showing
peaks at angles where ordered crystallographic planes occur. Each space group has a unique set of
peaks. The relative intensities of the reflections are a function of the atom occupying a particular
lattice site. With modern searchable crystallographic databases, it is easy to search for published
matches to experimental patterns.
The XRD instruments used for this study were a PANalytical system in the Correlated
Electron Materials Group at ORNL and a Rigaku D/Max system at UCF, both Bragg-Brentano
geometries in which the sample tilts at an angle of θ from the incident x-ray beam, while the
detector arm tilts at an angle of 2θ from the sample. The PANalytical system is equipped with an
array of CCD detectors to capture the intensity of multiple diffraction angles simultaneously. The
PANalytical system also has a rotating sample stage to ensure a representative orientation from all
directions in the x-y plane. Both starting powders and bulk ceramics were scanned. Because XRD is
a surface analysis technique, samples scanned in the PANalytical system were protected with a
Kapton (trade name for a Dupont polymer) sheet, which only contributes a broad background peak
at low angles. Protecting samples from the air in the Rigaku system proved more difficult, so the
patterns presented in the next section were collected from exposed surfaces.
For the purpose of this study, XRD is used for more than simple phase identification. For
instance, in a sample with texture, or preferential grain orientation, the reflections corresponding
to preferred directions (aligned perpendicular to the surface of the sample) appear more intense.
29
XRD may also be used for quantitative analysis of grain size, strain, and crystallographic defects.49.
In this study, we do not undergo a full refinement of the XRD pattern by a method such as
Riedvelt49. For the purposes of this study, it is much more efficient to do a simple analysis of the
peak broadening by the method pioneered by Scherrer50.
The Scherrer analysis uses the relationships given in Equations 13 and 14 to approximate
the contributions of grain size and strain to the integral breadth (β) of the diffraction peaks.
𝐺 = 𝐾𝜆𝛽𝑠𝑖𝑧𝑒𝑐𝑜𝑠𝜃
(13)
𝛽𝑠𝑡𝑟𝑎𝑖𝑛 = 4𝜀𝑡𝑎𝑛𝜃 (14)
The parameter G is grain size, K is the Scherrer constant (taken as 1 in this analysis), and λ is the
wavelength of the x-ray beam. By rearranging Equation 13, the total broadening can be expressed
as βinst + βsize + βstrain, where βinst is the instrumental broadening. To simplify the plotting and
determination of G and ε, the entire expression is multiplied by cosθ to yield Equation 15.
𝛽𝑐𝑜𝑠𝜃 = 𝐾𝜆𝐺
+ 4𝜀𝑠𝑖𝑛𝜃 (15)
Plotting 4sinθ on the x versus βcosθ on the y should give a linear plot for which the slope is ε and G can
be calculated from the intercept, provided the contribution of the instrumental broadening is known.
An instrumental baseline is commonly found by performing a scan on coarse, strain free powders. The
linear plot of Equation 15 is known as a Williamson-Hull plot.
2.3.4 Raman Spectroscopy
Due to the limitations of XRD in identifying trace impurities and subsurface phases, micro-
Raman spectroscopy is used as an additional structural analysis tool. Raman is a form of
vibrational spectroscopy named after the scientist who first observed the effect of scattered
radiation having a wavelength shifted slightly from the incident radiation. The origin of this “Stokes
shift” is inelastic scattering, which has come to be known as Raman scattering. Raman scattering is
enabled by changes in polarizability that are induced by vibrational configurations. Scattering
30

occurs at characteristic frequency shifts symmetrically distributed away from the excitation
frequency. The red-shifted frequencies (Stokes) are more intense than the blue-shifted (anti-
Stokes), and are the ones traditionally detected. Raman scattering is depicted schematically in
Figure 10. In a modern Raman system, a sample is excited below its band gap with a laser having a
power on the order of a few milliwatts. In the Renishaw micro-Raman system used for this work,
microscope objectives are used to focus the excitation on surface features typically between 1µm
and 1mm in size. The scattered light is collected and the excitation wavelength is filtered out while
the remaining light is analyzed in a spectrometer. The resulting plot shows intensity vs. Raman
shift. This differs from another popular vibrational technique, Fourier transform infra-red
spectroscopy (FTIR). In IR spectroscopy, one detects changes in the dipolar moment induced by
vibrational configurations. The vibrational modes which lead to Raman scattering do not
necessarily result in IR absorption. Therefore a distinction must be made between Raman active
and IR active vibrational modes.
Figure 10: Schematic representation of Stokes and anti-stokes Raman scattering, where ΔE is the energy shift (negative for Stokes and positive for anti-stokes)
virtual energy
first excited state ΔE
ground state
Stokes Scattering Anti-Stokes Scattering
E0
31
Nonetheless, micro-Raman was chosen primarily for the ease of sample preparation.
Polishing need not be of high optical quality to obtain good Raman spectra. Additionally, the low
transparency of the samples fabricated in the first stage of work on halide scintillators would not
have been suitable for He-Ne based FTIR spectrometry, which works best as a transmission (as
opposed to reflection) measurement. However, dispersing sample powders in potassium bromide
and then pressing results in a transparent sample which can be examined by IR spectroscopy. This
method is reserved for future work. The Renishaw micro-Raman spectrometer in the laboratory of
Dr. Nina Orlovskya at UCF is equipped with a 514nm laser excitation source and 20x objective with
a numerical aperture of 0.2. Thus, the spot size of the laser is roughly 3µm, which is of the same
order as the grain size of BaCl2 ceramics estimated by SEM. The laser energy used for excitation is
typically 5mJ, which corresponds to roughly 50% of the maximum laser energy. Lower energy is
used to make sure the samples were not damaged, because the low transmission of the sample
leads to large absorptions at this wavelength. Spectra are collected with an integration time of 30s
on a single iteration. Due to the hygroscopic nature of the samples, a thin layer of oil is maintained
on the surface to slow down the interaction with the ambient air. A spectrum of the oil is collected
as a baseline. The z-position of the laser focus is altered to collect spectra from both the surface and
the bulk just below the surface. Focusing deep within the bulk is not possible due to the limited
transparency of samples.
2.3.5 Scanning Electron Microscopy
Because the grain size of the samples fabricated by hot pressing is projected to be in the
tens of micrometers range, optical microscopy alone is not effective in imaging the surface. To
acquire high resolution images of surface features including pores, grain boundaries, and
inclusions, it is necessary to use scanning electron microscopy (SEM). Most SEM systems are
heavily engineered systems, whose operation is simple in principle, but complex from an
engineering perspective. Generating and controlling the electron beam in comparison to the beam
32

of light used for optical microscopy, is orders of magnitude more difficult. Complex magnetic lenses
must be used in place of the glass lenses used to focus visible light. In the most basic terms, an SEM
images by refracting electrons off the surface of a sample. Because the wavelength of an electron is
much smaller than the wavelength of light, the resolution is greatly improved over light
microscopy. The Zeiss Ultra 55 system at UCF is capable of imaging features in the tens of
nanometers. Imaging features smaller than this (i.e. atoms and point defects) requires the use of
transmission electron microscopy (TEM). TEM was not found necessary at the current stage of this
study due to the added complications of sample preparation.
2.3.6 X-Ray Excited Luminescence
Facilities for measuring the x-ray excited luminescence spectra are located at both ORNL
and LBNL. The setup consists simply of an x-ray source positioned perpendicular to the edge of the
sample and a spectrometer located perpendicular to the sample surface. The use of pulsed x-rays
to determine the decay time of the luminescence in Eu2+:BaBrI was carried out at LBNL. Our
preliminary tests on BaCl2 ceramic fabrication have not yet included europium dopant for
scintillation studies. The typical setup uses a Hamamatsu N5084 Light-Excited X-ray tube. The x-
rays are estimated to have a minimum pulse width of 31 ps (fwhm) and an energy in the range of
10-15KeV51. The light emission from the sample is converted to an electrical signal with a PMT.
Because of the short time scales in the realm of scintillation and luminescent decay, the electrical
response of the PMT and subsequent electronics must be quick in order to measure the picosecond
time scales needed.
2.3.7 Pulse Height Spectrometry
An important tool for analyzing the brightness and energy resolution of a scintillator is
multichannel pulse analysis. In this technique, a monochromatic radioactive gamma ray source is
used to build a histogram of pulse height measured in the photo-detector1. In order to achieve
representative statistics of the scintillation light, a large number of sequential measurements are
33

often needed (sometimes taking hours to collect). In scintillator research terminology, the x-axis of
the spectrum is divided into discrete pulse-height bins, called channels. The plot achieved is a pulse
count for each increment of pulse height. The channel number can be related to the energy of the
detected light based on the gain of the amplifier in the system.
The interpretation of the pulse height spectrum is demonstrated using Figure 11. The
shaded peak is known as the photopeak and the position of its maximum corresponds to the
average brightness or pulse height emitted by the scintillator. The width of the photopeak relates
to the materials ability to distinguish different energies of radiation, thus a delta function is the
ideal case. The numerical value for resolution is calculated as the FWHM divided by the peak
position in percent. More to the left, the sharp rise in the spectrum is known as the Compton Edge,
named for the contribution of Compton scattering to the registration of counts at energies lower
than the energy of the incident radiation.
Figure 11: Figure demonstrating a pulse height spectrum taken from Knoll’s text1. The shaded region is the photopeak from which light yield and resolution are calculated.
The experimental setup for the measurement of pulse height spectra is located at ORNL.
Optically polished samples of 5%Eu2+:BaBrI ceramic were mounted with optical coupling grease to
the face of the PMT. The radioactive gamma-ray source of either 137Cs of 133Ba is mounted above the
sample. Pulse height spectra are collected with a Hamamatsu R6231U photo-multiplier tube and
samples are wrapped with Teflon reflector materials to increase the collected light. The signals
34

from the PMT anode were shaped with a Tennelec TC 244 spectroscopy amplifier and recorded
with an Amptek MCA8000-A multi-channel analyzer. The experimental setup is described in more
detail elsewhere26.
2.3.8 Optical Transmission
In order to observe the transmission of the translucent hot pressed ceramics in this study,
samples were first ground down to thicknesses between 1mm and 2mm, then polished by hand
using silicon carbide papers with ISO grit size designations of P500, P1000, and P2000. When
necessary, anhydrous mineral oil was used as a lubricant for polishing. A good quality polish is
important to reduce the contribution of scattering from the surface in the measurement of optical
transmission. In the case of both BaCl2 and BaBrI, many samples were translucent to the level that
printed text could be read through a backlit sample placed flat against the paper. A standard
halogen flashlight was used for backlighting. For a more quantitative analysis of transmission, the
Varian Cary 500 spectrophotometer in UCF/CREOL was used.
The Cary spectrophotometer uses a broad spectrum xenon lamp and an optical grating to
scan through a wavelength range of 190nm – 3300nm. The instrument has a dual sample chamber,
so a background spectrum is collected at the same time as the sample spectrum acquisition. The
length of a scan is roughly 15 minutes, so hygroscopic samples were not protected from the air
during a spectral acquisition. However, they were kept in mineral oil or in the glove box until the
moment they were transferred to the spectrophotometer’s sample holder.
35
3. RESULTS AND DISCUSSION
3.1 Sample Preparation
A total of 10 BaBrI samples and 5 BaCl2 samples have been fabricated. In the early stages of
studying these ceramics it is important to cover a broad range of processing conditions to optimize
the densification of these materials. Appendix 1 lists all the samples fabricated for this study along
with a description of their processing conditions and characterization. The most obvious effect on
the processing of BaBrI thus far is the exposure of the precursor powders to air. When the process
is made cleaner by working in a cleaner glove box and pre-heating the dies, the translucency of
samples pressed from the purified BaBrI powder is improved. In the case of BaCl2, the biggest
effect on the first impression of sample quality is the commercial supply of powder. Lower purity
(99%) di-hydrate powders produced opaque white samples, while higher purity powders of both
the di-hydrate and anhydrous nature, sintered under similar conditions, resulted in translucent
samples. At this time the differences in manufacture and thus the sources of impurities in the three
batches of BaCl2 powder are unknown.
3.2 Monitoring of Sintering Behavior
The plot of temperature, density, and applied load versus time for a BaCl2 ceramic is
presented in Figure 12. This densification plot corresponds to a sample fabricated from anhydrous
powder and sintered at a temperature of 850°C for six hours. A dehydration step is added at 250°C
to ensure complete removal of water. The pressure applied to the sample is increased from1MPa to
47MPa once the dwell temperature has been reached. The densification of the sample is complete
soon after the temperature reaches its dwell of 850oC and before the pressure has reached its
maximum 47MPa. Similar behavior is seen in a sample fabricated from anhydrous starting powder
and sintered for six hours at 750°C (plot not shown).
36

Table 5: Activation energies of BaCl2 calculated from the densification data compared to the activation energy calculated from high temperature conductivity data.
Sample Calculated Q
(kJ/mol)
BaCl2 ceramic from di-hydrate 23
BaCl2 ceramic from anhydrous 27
BaCl2 resistivity data 57
The calculated strain rate (ε’) in the sample is used in both cases to estimate the activation energy
for mass transport (densification) according to the equations presented in the previous section.
The 1/RT versus ln(T*ε’) plot for the sample hot pressed at 850°C is shown in Figure 13.
Figure 12: A treated hot press dataset showing the density (derived from the displacement), temperature, and applied load over time.
37
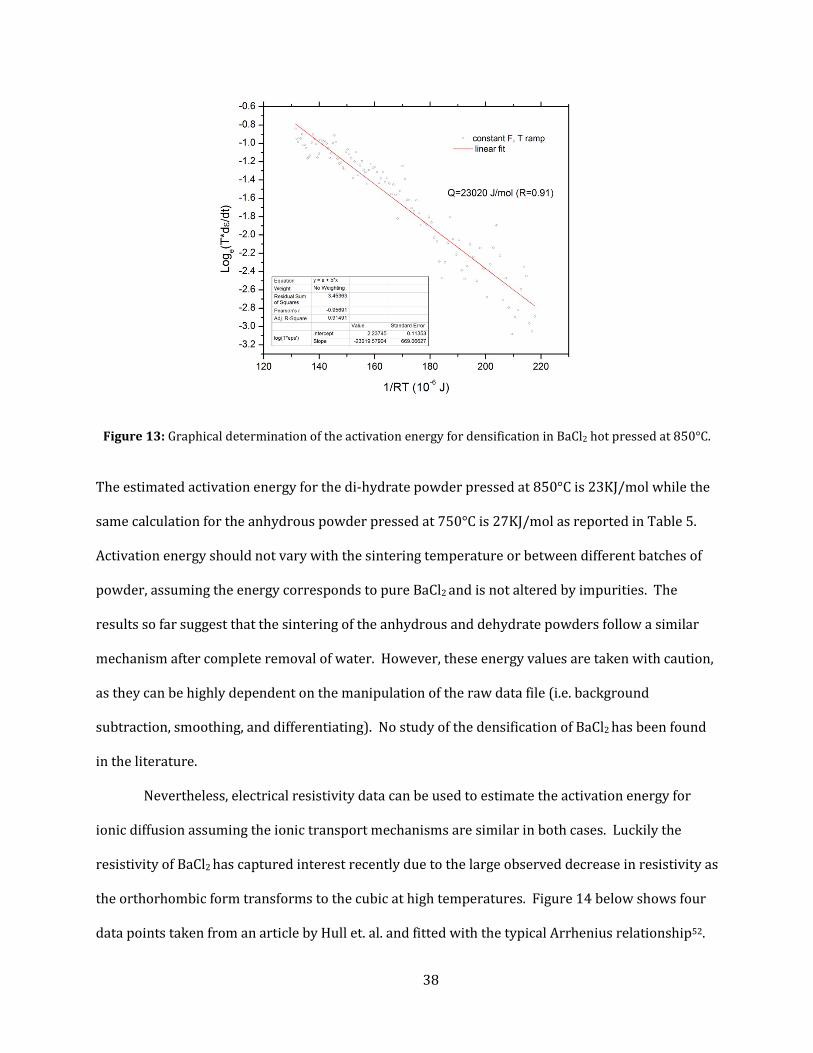
Figure 13: Graphical determination of the activation energy for densification in BaCl2 hot pressed at 850°C.
The estimated activation energy for the di-hydrate powder pressed at 850°C is 23KJ/mol while the
same calculation for the anhydrous powder pressed at 750°C is 27KJ/mol as reported in Table 5.
Activation energy should not vary with the sintering temperature or between different batches of
powder, assuming the energy corresponds to pure BaCl2 and is not altered by impurities. The
results so far suggest that the sintering of the anhydrous and dehydrate powders follow a similar
mechanism after complete removal of water. However, these energy values are taken with caution,
as they can be highly dependent on the manipulation of the raw data file (i.e. background
subtraction, smoothing, and differentiating). No study of the densification of BaCl2 has been found
in the literature.
Nevertheless, electrical resistivity data can be used to estimate the activation energy for
ionic diffusion assuming the ionic transport mechanisms are similar in both cases. Luckily the
resistivity of BaCl2 has captured interest recently due to the large observed decrease in resistivity as
the orthorhombic form transforms to the cubic at high temperatures. Figure 14 below shows four
data points taken from an article by Hull et. al. and fitted with the typical Arrhenius relationship52.
38
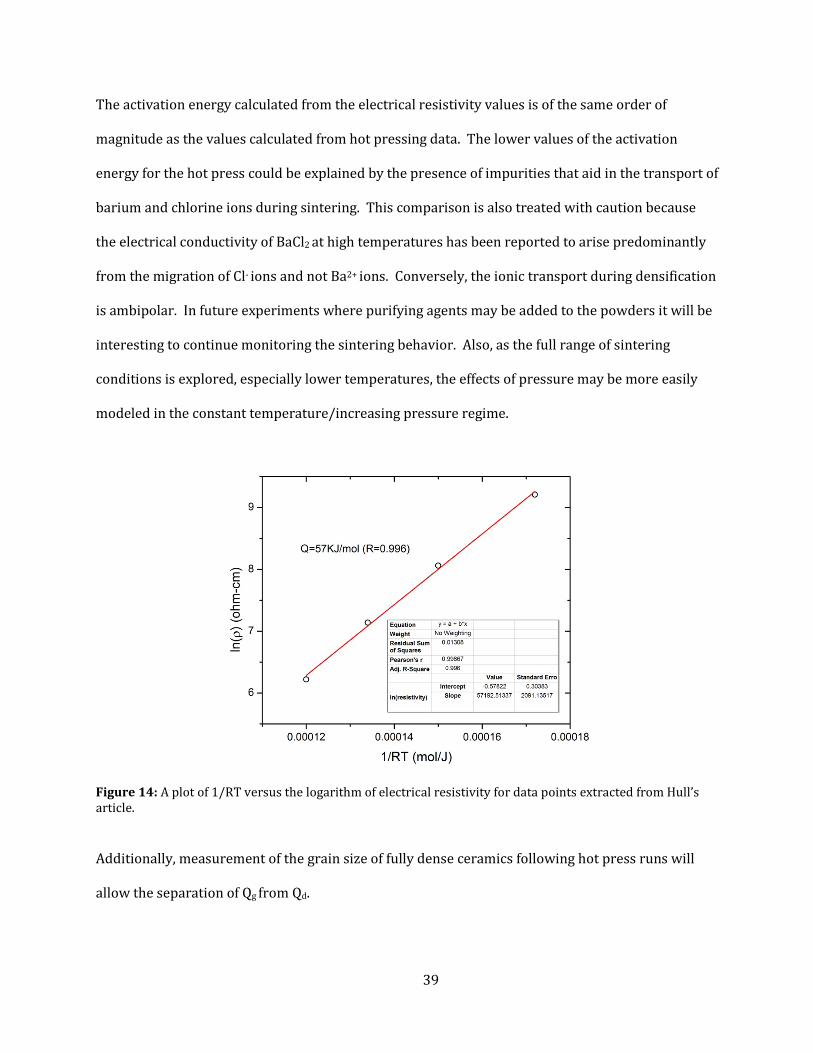
The activation energy calculated from the electrical resistivity values is of the same order of
magnitude as the values calculated from hot pressing data. The lower values of the activation
energy for the hot press could be explained by the presence of impurities that aid in the transport of
barium and chlorine ions during sintering. This comparison is also treated with caution because
the electrical conductivity of BaCl2 at high temperatures has been reported to arise predominantly
from the migration of Cl- ions and not Ba2+ ions. Conversely, the ionic transport during densification
is ambipolar. In future experiments where purifying agents may be added to the powders it will be
interesting to continue monitoring the sintering behavior. Also, as the full range of sintering
conditions is explored, especially lower temperatures, the effects of pressure may be more easily
modeled in the constant temperature/increasing pressure regime.
Figure 14: A plot of 1/RT versus the logarithm of electrical resistivity for data points extracted from Hull’s article.
Additionally, measurement of the grain size of fully dense ceramics following hot press runs will
allow the separation of Qg from Qd.
39

3.3 Hygroscopicity of Powders
The total percentage weight gain over time in air is plotted for both BaBrI and BaCl2. The
behavior of SrI2 is also plotted for the sake of comparison.
Figure 15: Weight gain of halide powders. All powders were crushed to similar particle sizes. Colorless crystals were grown in-house.
SrI2 clearly shows the highest hygroscopicity, which is in agreement with the literature27. BaCl2
shows slightly lower weight gain than BaBrI. Based on a similar study shared privately by LBNL,
many of the halide compounds reach a saturation point above 20% weight gain. However, for the
purpose of this work, reaction in the time span of roughly 0-30 minutes, while the powder is loaded
for pressing, is the main concern. Powders studied had particle sizes of roughly 20µm. If finer
milled powders are used for the purpose of achieving smaller grain sizes in the final ceramics,
weight gain is expected to happen more quickly due to the higher surface area in contact with the
ambient air. Studies on fine powders may be necessary in the future if finer grained ceramics are
necessary to gain transparency. As mentioned earlier, the hydration of BaCl2 is reported to be
reversible. This has been observed qualitatively as saturated BaCl2 powders lose weight once they
are transferred back to the glove box. Further discussion of the dehydration of the barium halide
compounds is found in the thermogravimetric analysis section.
40
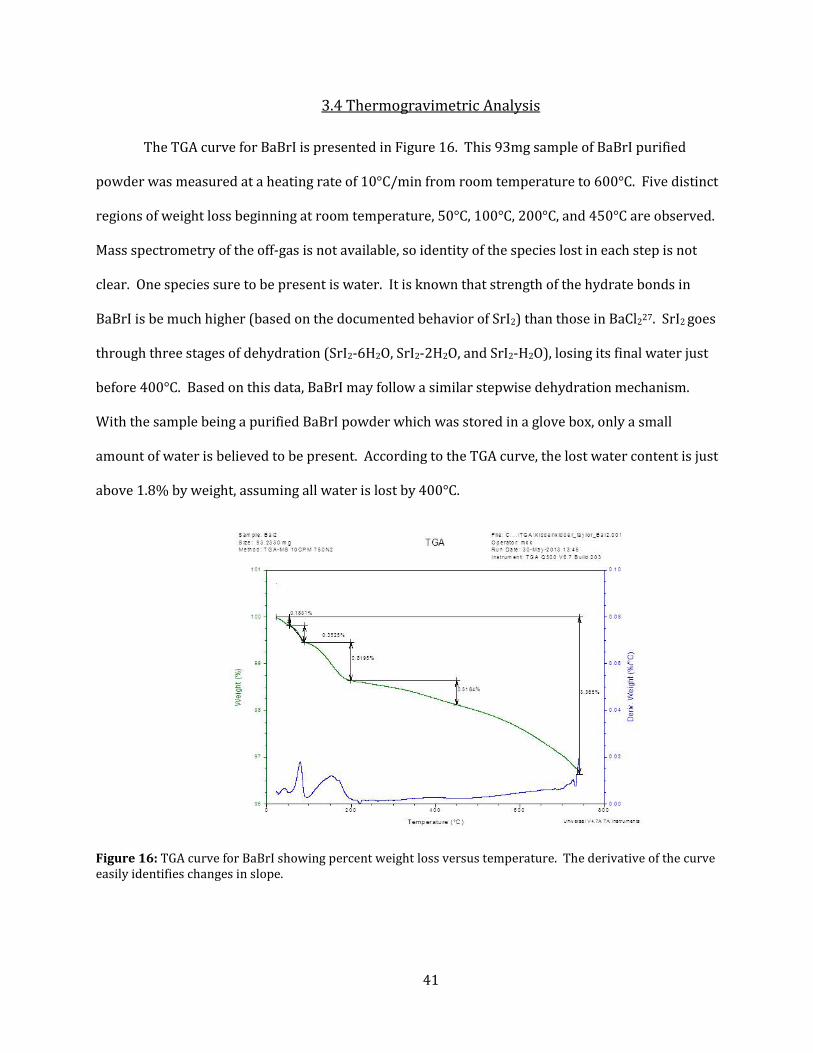
3.4 Thermogravimetric Analysis
The TGA curve for BaBrI is presented in Figure 16. This 93mg sample of BaBrI purified
powder was measured at a heating rate of 10°C/min from room temperature to 600°C. Five distinct
regions of weight loss beginning at room temperature, 50°C, 100°C, 200°C, and 450°C are observed.
Mass spectrometry of the off-gas is not available, so identity of the species lost in each step is not
clear. One species sure to be present is water. It is known that strength of the hydrate bonds in
BaBrI is be much higher (based on the documented behavior of SrI2) than those in BaCl227. SrI2 goes
through three stages of dehydration (SrI2-6H2O, SrI2-2H2O, and SrI2-H2O), losing its final water just
before 400°C. Based on this data, BaBrI may follow a similar stepwise dehydration mechanism.
With the sample being a purified BaBrI powder which was stored in a glove box, only a small
amount of water is believed to be present. According to the TGA curve, the lost water content is just
above 1.8% by weight, assuming all water is lost by 400°C.
Figure 16: TGA curve for BaBrI showing percent weight loss versus temperature. The derivative of the curve easily identifies changes in slope.
41
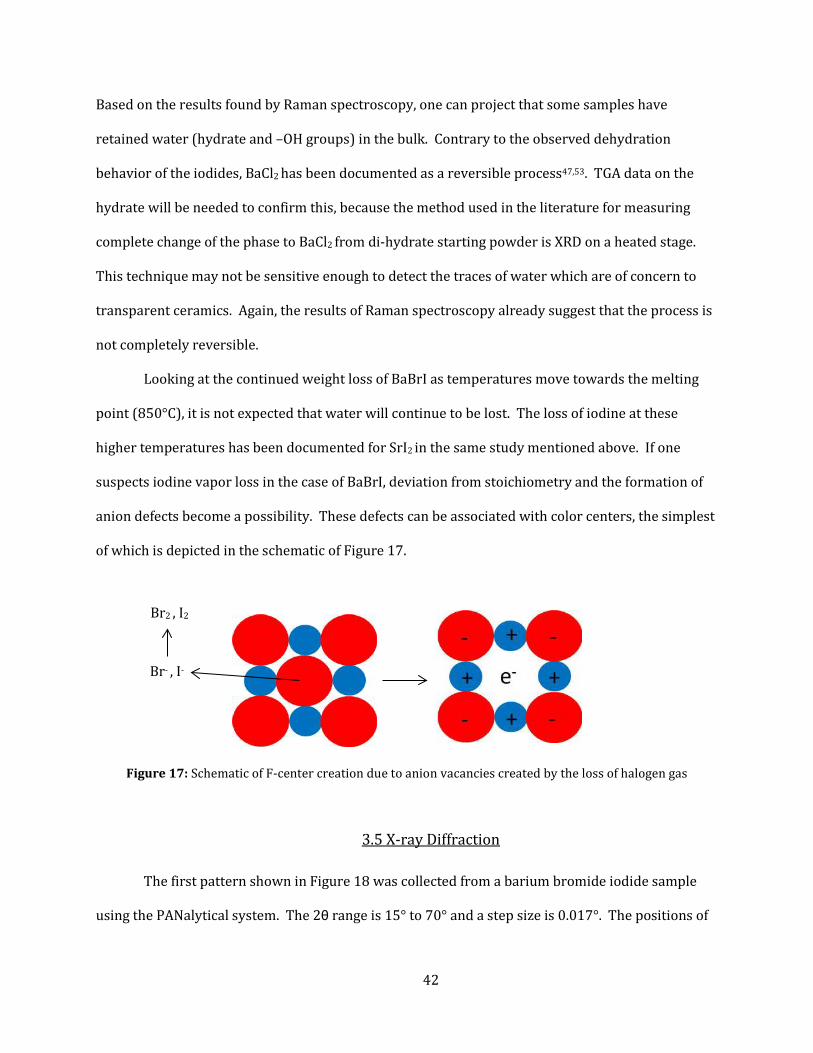
Based on the results found by Raman spectroscopy, one can project that some samples have
retained water (hydrate and –OH groups) in the bulk. Contrary to the observed dehydration
behavior of the iodides, BaCl2 has been documented as a reversible process47,53. TGA data on the
hydrate will be needed to confirm this, because the method used in the literature for measuring
complete change of the phase to BaCl2 from di-hydrate starting powder is XRD on a heated stage.
This technique may not be sensitive enough to detect the traces of water which are of concern to
transparent ceramics. Again, the results of Raman spectroscopy already suggest that the process is
not completely reversible.
Looking at the continued weight loss of BaBrI as temperatures move towards the melting
point (850°C), it is not expected that water will continue to be lost. The loss of iodine at these
higher temperatures has been documented for SrI2 in the same study mentioned above. If one
suspects iodine vapor loss in the case of BaBrI, deviation from stoichiometry and the formation of
anion defects become a possibility. These defects can be associated with color centers, the simplest
of which is depicted in the schematic of Figure 17.
Figure 17: Schematic of F-center creation due to anion vacancies created by the loss of halogen gas
3.5 X-ray Diffraction
The first pattern shown in Figure 18 was collected from a barium bromide iodide sample
using the PANalytical system. The 2θ range is 15° to 70° and a step size is 0.017°. The positions of
Br2 , I2
Br- , I-
42

the peaks for the Eu2+:BaBrI ceramic sample are a good match to the reference and to a pattern
calculated using FullProf software. There is a slight shift of the ceramic pattern toward lower
angles. Considering the orthorhombic lattice belonging to space group 62, the Eu2+ ion is expected
to substitute directly for the Ba2+ ion 42. An 8-coordinated Ba2+ ion has an ionic radius of 1.42Å
compared to 1.25Å for and 8-coordinated Eu2+ ion41. The presence of smaller ions in the lattice
leads to a reduction of the lattice parameters. The distortion of the lattice from its ideal shape is not
uniform, so the spacings between the refracting planes (d spacing) are not necessarily affected
uniformly. The change in the lattice parameters is estimated using Equations 16 and 17. The first
equation is just a weighted average of the of the lattice parameter calculated in the reference
refinement and the unit cell containing one Eu2+ ion in place of a Ba2+ ion.
Figure 18: XRD pattern of a Eu2+:BaBrI ceramic compared to the reference of a crushed single crystal powder XRD pattern from the literature.
Equation estimates the change in the lattice parameter as the difference in atomic radius of Eu2+
versus Ba2+.
43
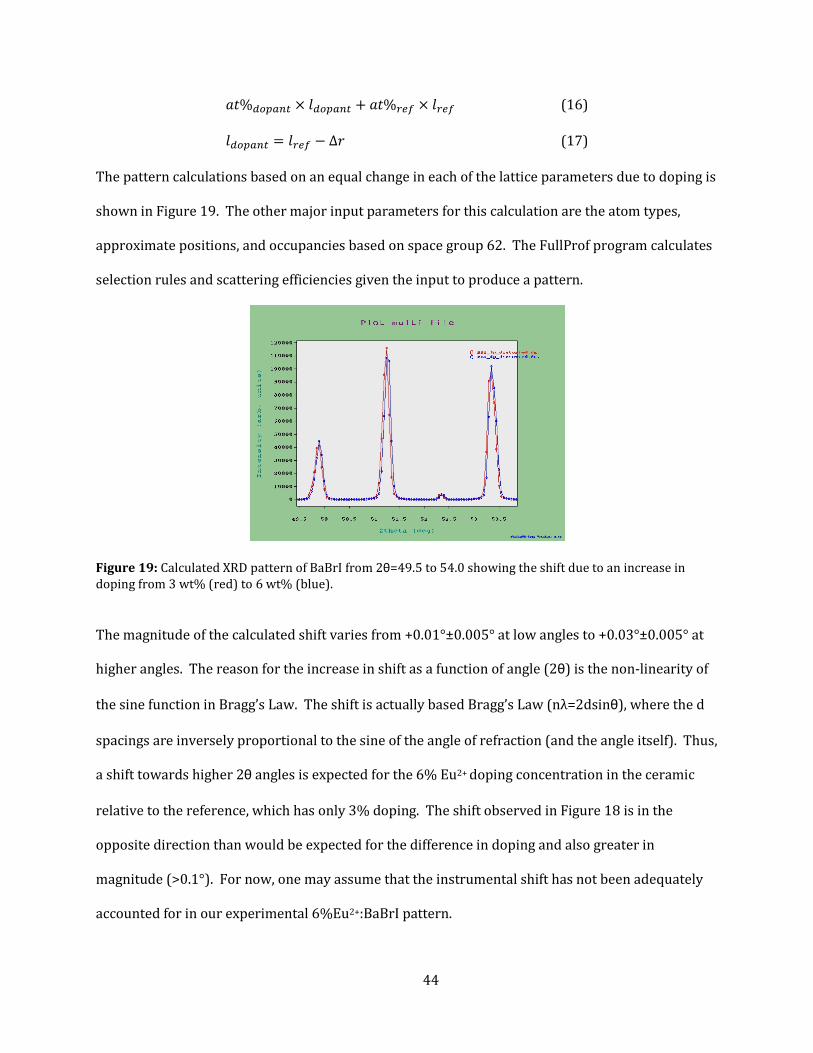
𝑎𝑡%𝑑𝑜𝑝𝑎𝑛𝑡 × 𝑙𝑑𝑜𝑝𝑎𝑛𝑡 + 𝑎𝑡%𝑟𝑒𝑓 × 𝑙𝑟𝑒𝑓 (16)
𝑙𝑑𝑜𝑝𝑎𝑛𝑡 = 𝑙𝑟𝑒𝑓 − ∆𝑟 (17)
The pattern calculations based on an equal change in each of the lattice parameters due to doping is
shown in Figure 19. The other major input parameters for this calculation are the atom types,
approximate positions, and occupancies based on space group 62. The FullProf program calculates
selection rules and scattering efficiencies given the input to produce a pattern.
Figure 19: Calculated XRD pattern of BaBrI from 2θ=49.5 to 54.0 showing the shift due to an increase in doping from 3 wt% (red) to 6 wt% (blue).
The magnitude of the calculated shift varies from +0.01°±0.005° at low angles to +0.03°±0.005° at
higher angles. The reason for the increase in shift as a function of angle (2θ) is the non-linearity of
the sine function in Bragg’s Law. The shift is actually based Bragg’s Law (nλ=2dsinθ), where the d
spacings are inversely proportional to the sine of the angle of refraction (and the angle itself). Thus,
a shift towards higher 2θ angles is expected for the 6% Eu2+ doping concentration in the ceramic
relative to the reference, which has only 3% doping. The shift observed in Figure 18 is in the
opposite direction than would be expected for the difference in doping and also greater in
magnitude (>0.1°). For now, one may assume that the instrumental shift has not been adequately
accounted for in our experimental 6%Eu2+:BaBrI pattern.
44

An additional feature of the patterns in Figure 18 is the difference in the relative intensities
of the ceramic peaks compared to those of the reference pattern. For instance, the peaks at 2θ~35,
41.5, and 62.5 are much more intense in the ceramic pattern versus the single crystal pattern.
Several other peaks, including that at 2θ~51, appear less intense in the ceramic versus the
reference. Because the reference pattern was collected from a crushed crystal, it is assumed that
diffractions from each crystallographic plane are present in equal proportions. This rise and fall of
certain peaks in the ceramic pattern relative to the identically positioned peaks in the reference
pattern suggests preferential orientation of grains. The Miller indices of the peaks appearing more
intense in the ceramic sample are shown in Figure 18. These indices correspond to the (020),
(400), and (133) planes respectively. Furthermore, the (020) plane corresponds to the cleavage
plane of the cotunnite mineral(PbCl2) , which adopts the same crystal structure as BaBrI54.
Cleavage along these closest packed planes is easily visualized in a unit cell oriented parallel to
these closest packed planes as in Figure 20. The cleavage of particles in the hot press is possible
due to the high pressures realized at particle interfaces. The preferred settling of cleaved particles
may explain the other preferred directions, (400) and (133), which are parallel or nearly parallel to
the cleavage planes. This could indicate that sheared particles have preferential directions for
settling. The evolution of texture for hot pressed barium halides is also supported by the parallel
fracture surfaces observed in an SEM image of BaCl2.
45

Figure 20: Looking down on the c-axis at the stacked (020) planes of a BaBrI crystal. The (100) direction is a favorable shear direction.
Finally, the broadening of the peaks from the pattern shown in Figure 18 was analyzed by
the Scherrer method, originally devised in the early 1900s50. The resulting analysis, described in
the Experimental Methods, showed no significant contribution of grain size or strain to peak
broadening. The grain size is not a factor because its magnitude (4µm) contributes less to the
broadening than the typical instrumental broadening. The points for 17 peaks taken for the
Williamson-Hull plot did not show good linear correlation, thus the one pattern of BaBrI analyzed
does not show evidence of strain broadening. Because residual strain in hot pressed ceramics has
been observed in the past, it will be interesting to analyze future patterns for broadening55. Strain
can affect the environment around the dopant, leading to changes in the scintillation and annealing
steps may be needed to relieve it.
Br Ba I b
a
46
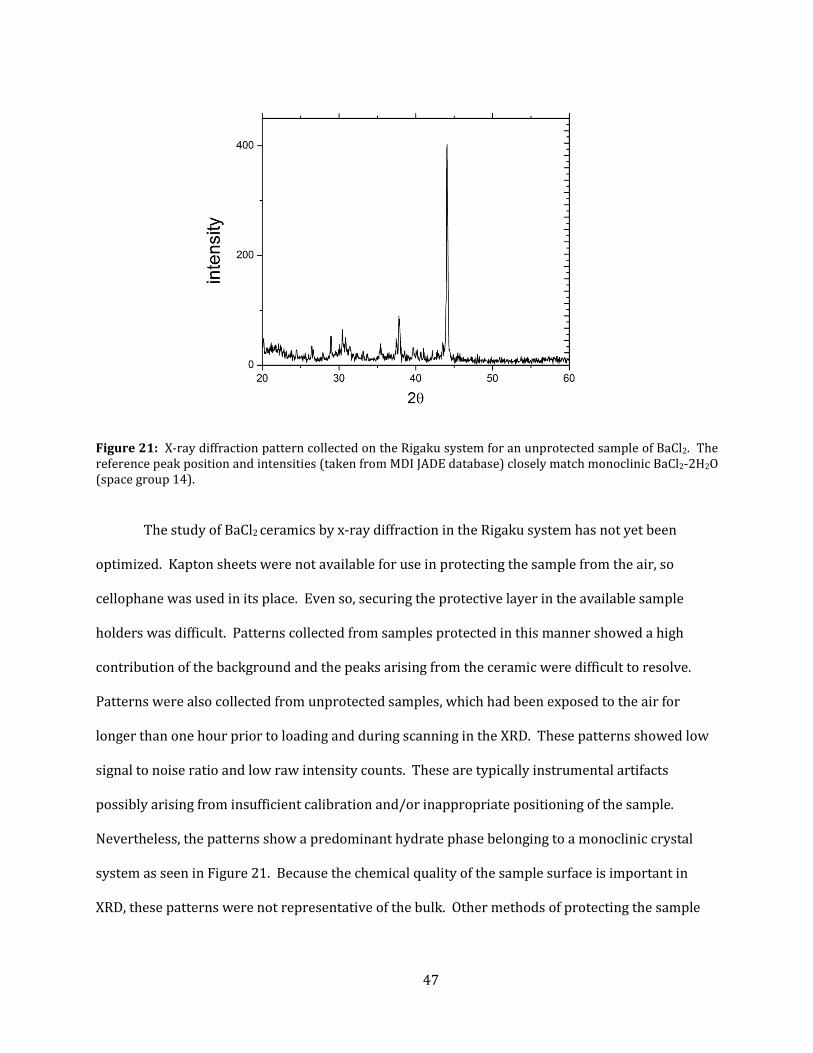
Figure 21: X-ray diffraction pattern collected on the Rigaku system for an unprotected sample of BaCl2. The reference peak position and intensities (taken from MDI JADE database) closely match monoclinic BaCl2-2H2O (space group 14).
The study of BaCl2 ceramics by x-ray diffraction in the Rigaku system has not yet been
optimized. Kapton sheets were not available for use in protecting the sample from the air, so
cellophane was used in its place. Even so, securing the protective layer in the available sample
holders was difficult. Patterns collected from samples protected in this manner showed a high
contribution of the background and the peaks arising from the ceramic were difficult to resolve.
Patterns were also collected from unprotected samples, which had been exposed to the air for
longer than one hour prior to loading and during scanning in the XRD. These patterns showed low
signal to noise ratio and low raw intensity counts. These are typically instrumental artifacts
possibly arising from insufficient calibration and/or inappropriate positioning of the sample.
Nevertheless, the patterns show a predominant hydrate phase belonging to a monoclinic crystal
system as seen in Figure 21. Because the chemical quality of the sample surface is important in
XRD, these patterns were not representative of the bulk. Other methods of protecting the sample
47
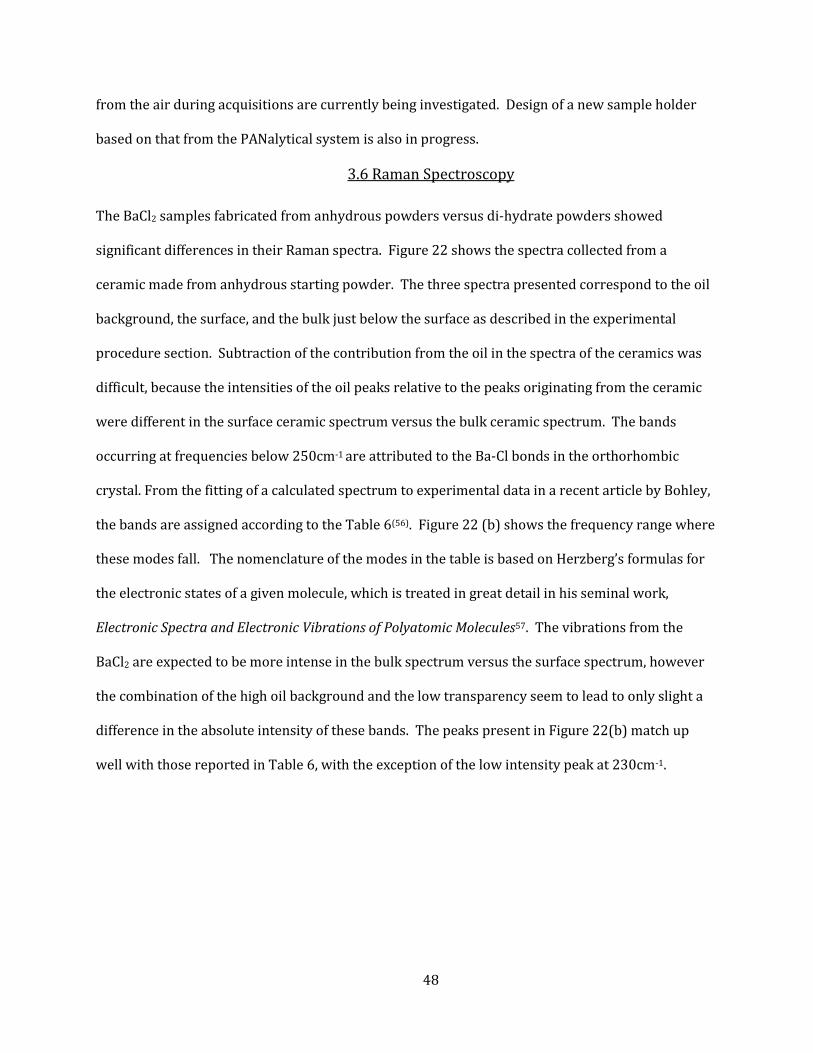
from the air during acquisitions are currently being investigated. Design of a new sample holder
based on that from the PANalytical system is also in progress.
3.6 Raman Spectroscopy
The BaCl2 samples fabricated from anhydrous powders versus di-hydrate powders showed
significant differences in their Raman spectra. Figure 22 shows the spectra collected from a
ceramic made from anhydrous starting powder. The three spectra presented correspond to the oil
background, the surface, and the bulk just below the surface as described in the experimental
procedure section. Subtraction of the contribution from the oil in the spectra of the ceramics was
difficult, because the intensities of the oil peaks relative to the peaks originating from the ceramic
were different in the surface ceramic spectrum versus the bulk ceramic spectrum. The bands
occurring at frequencies below 250cm-1 are attributed to the Ba-Cl bonds in the orthorhombic
crystal. From the fitting of a calculated spectrum to experimental data in a recent article by Bohley,
the bands are assigned according to the Table 6(56). Figure 22 (b) shows the frequency range where
these modes fall. The nomenclature of the modes in the table is based on Herzberg’s formulas for
the electronic states of a given molecule, which is treated in great detail in his seminal work,
Electronic Spectra and Electronic Vibrations of Polyatomic Molecules57. The vibrations from the
BaCl2 are expected to be more intense in the bulk spectrum versus the surface spectrum, however
the combination of the high oil background and the low transparency seem to lead to only slight a
difference in the absolute intensity of these bands. The peaks present in Figure 22(b) match up
well with those reported in Table 6, with the exception of the low intensity peak at 230cm-1.
48
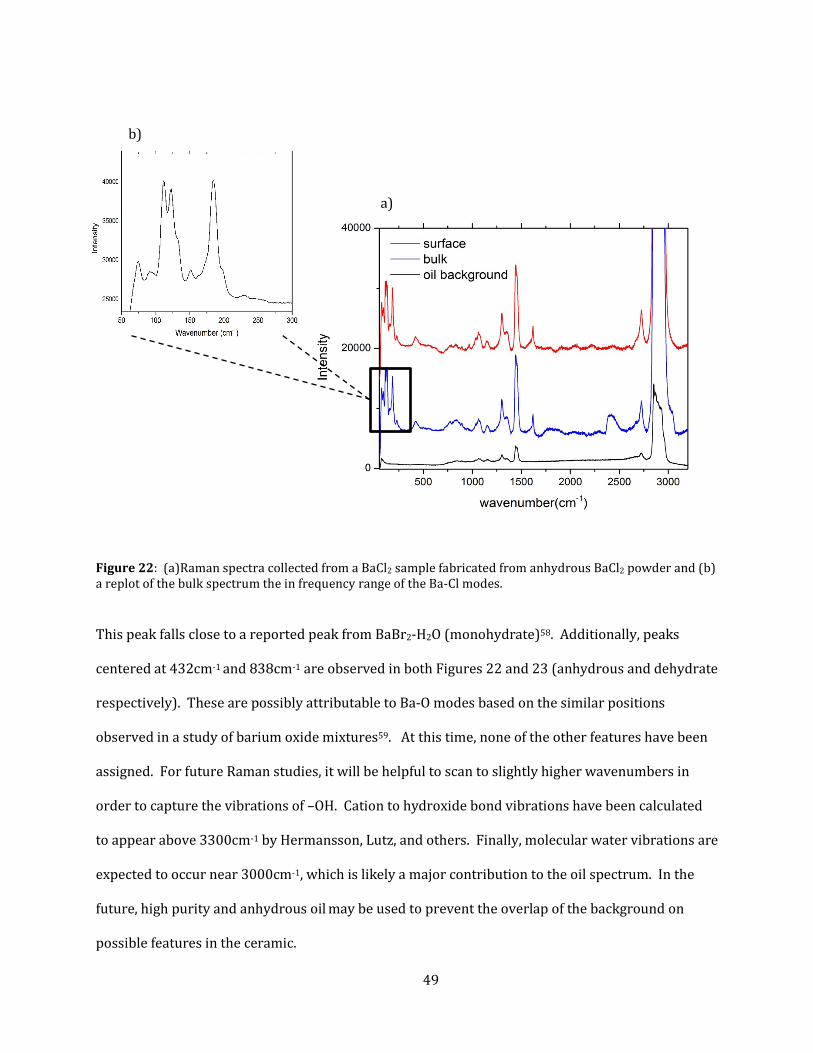
Figure 22: (a)Raman spectra collected from a BaCl2 sample fabricated from anhydrous BaCl2 powder and (b) a replot of the bulk spectrum the in frequency range of the Ba-Cl modes.
This peak falls close to a reported peak from BaBr2-H2O (monohydrate)58. Additionally, peaks
centered at 432cm-1 and 838cm-1 are observed in both Figures 22 and 23 (anhydrous and dehydrate
respectively). These are possibly attributable to Ba-O modes based on the similar positions
observed in a study of barium oxide mixtures59. At this time, none of the other features have been
assigned. For future Raman studies, it will be helpful to scan to slightly higher wavenumbers in
order to capture the vibrations of –OH. Cation to hydroxide bond vibrations have been calculated
to appear above 3300cm-1 by Hermansson, Lutz, and others. Finally, molecular water vibrations are
expected to occur near 3000cm-1, which is likely a major contribution to the oil spectrum. In the
future, high purity and anhydrous oil may be used to prevent the overlap of the background on
possible features in the ceramic.
a)
b)
49

Table 6: Tabulation of Raman vibrational frequencies in BaCl2 from the Bohley publication.
The second set of spectra, presented in Figure 23, were collected from a sample fabricated
from the di-hydrate powder. Over the collection of many spectra from 2 different samples which
started from di-hydrate powder, the conclusion is that the spectra do not consistently show
different and identifiable features to the anhydrous samples. The final spectra presented in Figure
24 shows the low frequency region of the expected vibrations of BaBrI. The BaBrI bands are in the
same frequency range to those of BaCl2, however their exact positions and relative frequencies
differ slightly due to the differences in bond length, bond angle, and atomic mass. Extensive
analysis of the BaBrI Raman spectra has not been performed at the time of publishing this report.
50

Figure 23: Raman Spectra from the bulk and surface of a hot pressed BaCl2 sample fabricated from anhydrous starting powder.
As more experience is gained with both the Renishaw system and the sensitive samples,
more definitive analysis should be possible. At this point, the excitation spot size used is on the
same order of magnitude as the grain size. Because the surface is not polished, grain boundaries
are not visible and probing individual grains is not possible. Thus in this stage of the study it makes
more sense to use a lower magnification to acquire spectra which are a better average
representation of the ceramic. Another area of future interest is the identification of crystal defects
by Raman spectroscopy60. If the concentration of defects is high enough, a signature for the
defective bonds should appear at a different frequency than the fundamental modes associate with
a ‘correct’ bond. Based on the appearance of the BaCl2 and BaBrI samples and the analysis by TGA,
it has been postulated that crystal defects, i.e. color centers are present. The use of Raman
spectroscopy as a tool to identify color centers would be an added benefit of the technique.
51

Figure 24: Raman spectra of a 6%Eu2+:BaBrI sample shown in the low frequency range of Ba-Br and Ba-I vibrations.
3.7 Scanning Electron Microscopy
Images of the BaCl2 di-hydrate starting powder and two different ceramic samples were
captured in the SEM. The ceramic in Figure 25 fabricated from the di-hydrate powder. The hot
pressing schedule included a dehydration step 250°C for six hours and then sintering at 800°C for 6
hours with an applied pressure of 45MPa. Figure 25 also shows the starting powder, which has
large agglomerates over 100µm in diameter. The fractured edge of the ceramic in the other image
displays a surprisingly small grain size. The intercept method was used to come up with an
estimated grain size of 3µm � 1µm. Thus, the large particles seen in Figure 25 (top) are indeed
large agglomerates composed of much smaller particles. The polishing and ethanol etching of the
surface of a ceramic sample to image the grain boundaries did not yield good images. The ethanol
used to etch the polished surface reacted too vigorously resulting in a wavy surface with no clear
definition of the grain boundaries. Using other etchants or even taking advantage of the moisture in
the air to etch the surface will be investigated in the future.
The grain size for the second ceramic BaCl2 sample fabricated from the anhydrous powder
was also determined with SEM. The 4µm size is comparable to the size of the grains in the di-
52
hydrate ceramic shown in Figure 25. This is the case even though the starting powder for the
second sample has a much smaller particle size.
Figure 25: SEM images of coarse BaCl2 – 2H2O starting powder (top) and a ceramic made from the powder (bottom). The line used to count grains by the intercept method is shown.
The final picture presented shows the shearing of the grains along parallel directions in a BaCl2
ceramic. This supports the evidence of the possibility of texturing in hot pressed ceramics which
was observed in the XRD for BaBrI.
In the initial investigations of BaCl2 with SEM, the energy dispersive spectroscopy (EDS)
feature on the Zeiss system was not utilized. This is an elemental analysis tool typically accurate to
roughly one weight percent. In the future, it will be interesting to probe the surface for impurities
by using this technique. EDS analyzes the energy of scattered electrons, which can be correlated to
the atomic weight of the atom from which it has been scattered. This elemental analysis will be a
good compliment to the ongoing studies using Raman spectroscopy.
32µm
53

Figure 26: Shearing of grains along parallel directions observed in an SEM image of BaCl2.
3.8 X-Ray Excited Luminescence
The x-ray excited emission spectrum of BBI ceramic and single crystal samples is presented
in Figure 27. The emission of the ceramic is centered at 418nm while the crystal is shifted slightly
towards lower wavelengths by approximately 4nm. The ceramic emission line is also significantly
broader than that of the single crystal.
Figure 27: Comparison of x-ray excited emission in BBI ceramic versus single crystal. The ceramic was measured at ORNL and the single crystal at LBNL.
The presence of one single broad emission line between 380nm and 460nm in both the x-ray
excited and optically excited (not presented here) spectra is an improvement over the first
54
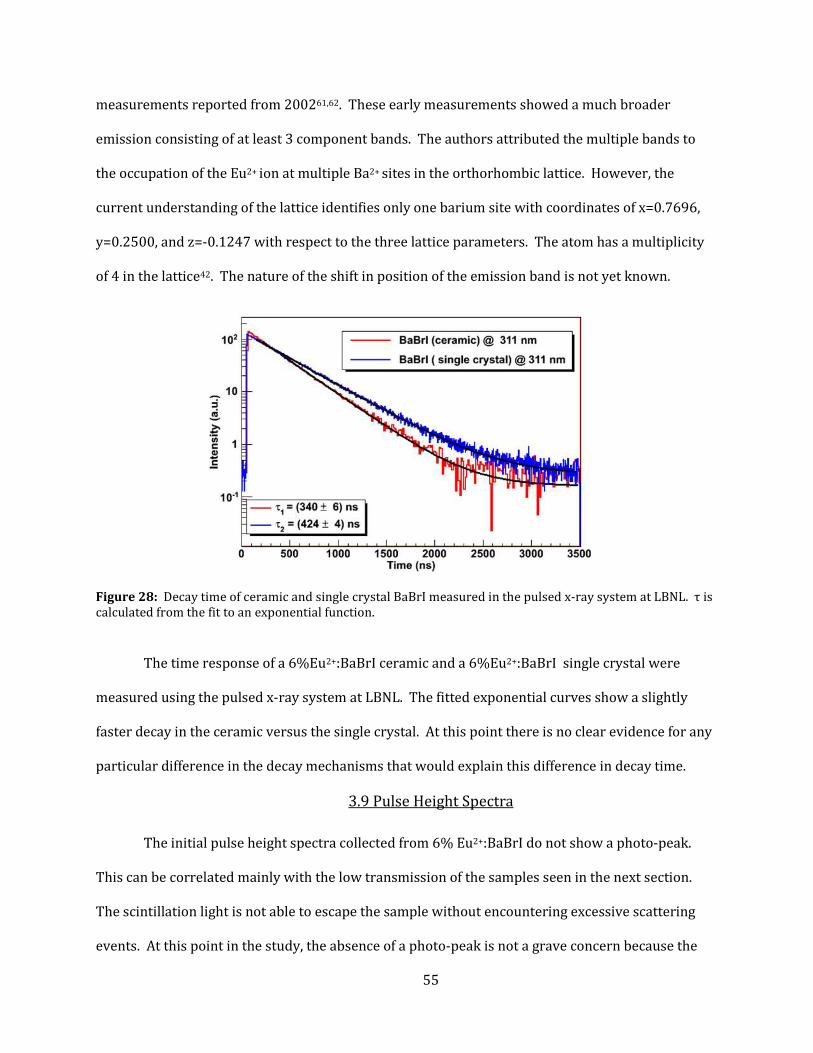
measurements reported from 200261,62. These early measurements showed a much broader
emission consisting of at least 3 component bands. The authors attributed the multiple bands to
the occupation of the Eu2+ ion at multiple Ba2+ sites in the orthorhombic lattice. However, the
current understanding of the lattice identifies only one barium site with coordinates of x=0.7696,
y=0.2500, and z=-0.1247 with respect to the three lattice parameters. The atom has a multiplicity
of 4 in the lattice42. The nature of the shift in position of the emission band is not yet known.
Figure 28: Decay time of ceramic and single crystal BaBrI measured in the pulsed x-ray system at LBNL. τ is calculated from the fit to an exponential function.
The time response of a 6%Eu2+:BaBrI ceramic and a 6%Eu2+:BaBrI single crystal were
measured using the pulsed x-ray system at LBNL. The fitted exponential curves show a slightly
faster decay in the ceramic versus the single crystal. At this point there is no clear evidence for any
particular difference in the decay mechanisms that would explain this difference in decay time.
3.9 Pulse Height Spectra
The initial pulse height spectra collected from 6% Eu2+:BaBrI do not show a photo-peak.
This can be correlated mainly with the low transmission of the samples seen in the next section.
The scintillation light is not able to escape the sample without encountering excessive scattering
events. At this point in the study, the absence of a photo-peak is not a grave concern because the
55

main tasks are to improve transparency and eliminate color centers. The addition of a dopant to
activate BaCl2 and the continued work on Eu2+ doped BaBrI will necessitate the continued study of
pulse height spectra to calculate light yield and energy resolution.
Figure 29: Pulse height spectra of BaBrI using both 133Ba and 137Cs gamma ray sources.
3.10 Optical Transmission
The visual appearance of hot pressed samples after rough polishing has varied vastly in the
course of the six months of this project. The most transparent BaBrI samples achieved still have a
strong brown color as shown in Figure 30(a). Also, the birefringence of the rather large grains
(100µm as a rough estimate) is seen by the inhomogeneous color of the sample. BaCl2 samples have
typically exhibited a grey color. Also of note are the darker spots on the sample in Figure 30 (b),
which appear to be present in the bulk as well as the surface. Attempts to determine structural
differences between these regions and the bulk ceramic by micro-Raman spectroscopy have been
unsuccessful. EDS may also be helpful in determining the nature of these inhomogeneities.
56
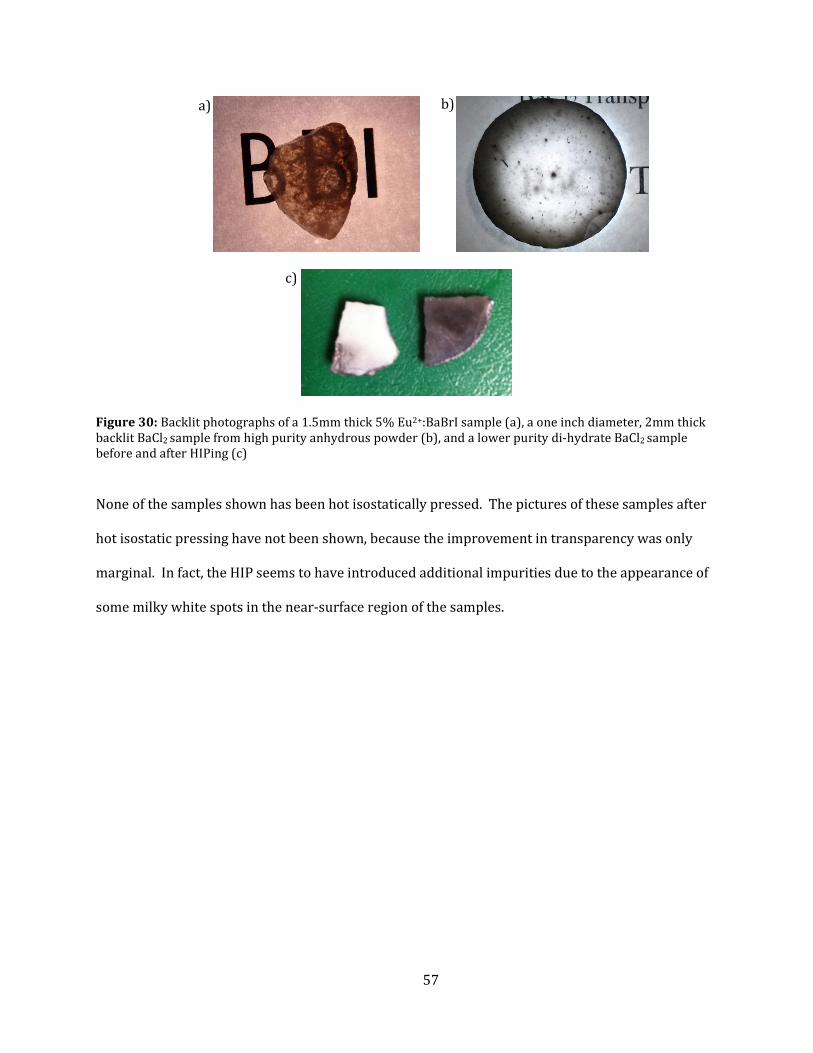
Figure 30: Backlit photographs of a 1.5mm thick 5% Eu2+:BaBrI sample (a), a one inch diameter, 2mm thick backlit BaCl2 sample from high purity anhydrous powder (b), and a lower purity di-hydrate BaCl2 sample before and after HIPing (c)
None of the samples shown has been hot isostatically pressed. The pictures of these samples after
hot isostatic pressing have not been shown, because the improvement in transparency was only
marginal. In fact, the HIP seems to have introduced additional impurities due to the appearance of
some milky white spots in the near-surface region of the samples.
a) b)
c)
57

4. CONCLUSION
The first six months of work on BaCl2 and BaBrI transparent ceramics for use as gamma ray
scintillators have yielded some exciting results. First of all, the sintering conditions for both
compounds have been nearly optimized such that full density ceramics are achieved. The sintering
mechanism of BaCl2 is believed to closely follow what is expected for pure BaCl2, based on the
agreement in calculated activation energies for mass transport in anhydrous powders, di-hydrate
powders, and resistivity data taken from the literature. More work is needed to confirm this claim
by understanding the contribution of grain size and impurities/additives to the sintering behavior.
Ceramic samples of both compounds are highly colored and mildly translucent.
Improvements to the handling of anhydrous BaBrI powders before hot pressing have led to
significant improvements in the transparency of samples. The only processing parameters varied
for BaCl2 were the starting powders (di-hydrate versus anhydrous) and the pressing temperature.
With only a handful of samples so far, the purity and source of the starting powder seems to have
the largest effect of sample transparency. 99% purity di-hydrate powders sinter to opaque, white
samples. 99.999% purity di-hydrate powders and 99.9% purity anhydrous powders sinter to
translucent, brown colored ceramics. Selection of a good powder vendor for BaCl2 is essential.
The structural analysis by XRD has confirmed the presence of the expected orthorhombic
phase in BaBrI ceramics, but has not yet been successful in confirming the phase of BaCl2 due to the
difficulty in handling the hygroscopic samples. This is mainly an issue of access to an appropriate
sample holder. Further analysis of the structure of BaCl2 by micro-Raman spectroscopy has
identified possible impurities of a mono-hydrate phase and barium oxide. The implications of the
TGA results are that large amounts of water (a few weight percent) are present in even the
anhydrous starting powders and it is unclear if any hydrate remains in the BaCl2 or BaBrI. The
58

additional source of optical loss suggested by TGA is color centers at anion vacancies created by the
loss of halogen gas.
Finally, the scintillation characterization of BaCla2 has not yet been pursued because the
early priorities include identification of impurities and color centers. On the other hand, the starting
powders for BaBrI are meticulously filtered and passed through a Bridgman furnace, so europium
is added. The characterization results show that the Eu2+:BaBrI possesses a single x-ray excited
emission line and a slightly shorter decay time than a Eu2+:BaBrI single crystal. The pulse height
spectrum shows no photopeak presumably because of low transparency, so the estimation of light
yield and resolution are not yet possible. As processing steps are altered to eliminate impurities
and defects (color centers), the study of scintillation behavior in europium doped ceramics will
become a higher priority.
The immediate follow-up work to this master’s thesis will include more experiments on the
sintering and characterization of impurities and color centers. The first order of business is to
perform thermal analysis (DTA and TGA) on all of the starting powders for both BaBrI and BaCl2.
This will help fill in the gaps for what impurities may be present off the shelf and what phases those
impurities may evolve into during sintering. The continued use of Raman spectroscopy on the
current set of samples will also help in identifying these impurities. Once the sources of impurities
and color centers have been more clearly identified, appropriate alteration of the processing
procedure will follow.
If continued characterization confirms that BaO is a significant impurity in BaCl2, several
processing modifications are possible. First of all, ammonium chloride (NH4Cl) may be used to
react with BaO impurities leaving behind BaCl2, ammonia gas, and water. A similar effect could
possibly be achieved by treating the powders with hydrochloric acid before sintering. Of course the
toxic nature of these exhaust gasses will need to be captured and neutralized appropriately. The
final possibility for eliminating impurity and color center formation during hot pressing is reactive
59
atmosphere processing63. This is a technique used by the crystal growth industry to balance the
vapor pressure of the halogens in order to prevent the formation of high concentrations of defects.
These processing ideas will be carried out at UCF. The partnership between ORNL and LBNL
should also lead to more ideas for fabricating and charactering transparent BaCl2 and BaBrI
ceramics for gamma ray detection.
60
APPENDIX A: SAMPLE DATA
61

Sample ID/dateStarting Material atmosphere T (°C) Time (h) Force Schedule notes
1/15/2013 2012 3% Eu2+ Ar2 550 4 from RT1/17/2013 2012 3% Eu2+ Ar2 550 2 from RT
1/24/2013 2012 3% Eu2+ Ar2 550 w/ degas 4 from dwell dark gray, low translucency
1/28/2013 2012 3% Eu2+ Ar2 purge 3x 520 4 from dwell dark gray, low translucency
1/30/2013 2012 3% Eu2+ Vacuum 520 4 from dwell lighter color, translucent
1/31/2013 2012 3% Eu2+ Vacuum 520 4 from dwell characterized at LBNL
2/5/2013 2012 3% Eu2+
*micronisedVacuum 550 4 from dwell black
4/10/2013 5% Eu new Vacuum 580, 470 2, 6 from dwell lighter color
4/11/2013 5% Eu new Ar2 580, 470 2, 6 from dwell most homogenous, translucent
5/1/2013 5% Eu new Vacuum, astro 580 4 from dwell slightly darker than other vac samples
5/22/2013 LBNL purified Vac, SPS 580 1 from RT opaque white, fractured
5/30/2013 99.999% purity di-hydrate
N2 550 4 from dwell translucent gray, ~1mm dark spots in bulk
5/31/2013 99.999% purity di-hydrate
N2 600 10 from dwell similar to 5/30
6/10/2013 99.999% purity di-hydrate
N2 750 10 from dwellbetter translucency, still
macro-scale inhomogeneities
6/12/2013 99% purity di-hydrate
N2 800 4 from dwell opaque & white, HIP turns sample black
6/13/2013 99% purity di-hydrate
N2 850 4 from dwell opaque & white, HIP turns sample black
6/19/2013 99.9% purity anhydrous
N2 750 10 from dwell translucent gray, ~1mm dark spots in bulk
6/21/2013 99.9% purity anhydrous
N2 800 10 from dwell translucent gray, ~1mm dark spots in bulk
6/24/2013 99.9% purity anhydrous
N2 900 2 from dwell translucent gray, ~1mm dark spots in bulk
Barium Bromide Iodide
Barium Chloride
62

REFERENCES
1. Knoll, G. F. Radiation Detection and Measurement. 112–118 (John Wiley and Sons: 2010).
2. Lecoq, P., Annenkov, A., Gektin, A., Korzhik, M. & Pedrini, C. Inorganic Scintillators for Detector Systems. 243 (Springer: The Netherlands, 2006).
3. Derenzo, S., Weber, M. & Brennan, K. Scintillation Properties. at <scintillator.lbl.gov>
4. Dorenbos, P. Scintillators for the detection of X-rays, gamma rays, and thermal neutrons. 1–11 (Delft, The Netherlands, ).at <http://www.nikhef.nl/~d90/collegediktaat/scintillators.pdf>
5. Dorenbos, P., De Haas, J. T. M. & Van Eijk, C. W. E. Non-proportionality in the scintillation response and the energy resolution obtainable with scintillation crystals. IEEE Transactions on Nuclear Science 42, 2190–2202 (1995).
6. Curtarolo, S. et al. The high-throughput highway to computational materials design. Nature materials 12, 191–201 (2013).
7. Derenzo, S. E., Moses, W. W., Cahoon, J. L., Perera, R. C. C. & Litton, J. E. Prospects for new inorganic scintillators. IEEE Transactions on Nuclear Science 37, 203–208 (1990).
8. DERENZO, S. E., MOSES, W. W., WEBER, M. J. & WEST, A. C. METHODS FOR A SYSTEMATIC, COMPREHENSIVE SEARCH FOR FAST, HEAVY SCINTILLATOR MATERIALS. Proceedings of The Material Research Society 348, 39–49 (1994).
9. Derenzo, S. & Bizarri, G. New Scintillators Discovered by High-Throughput Screening. Nuclear Instruments and Methods in Physics Research A 652, 247–250 (2011).
10. Cherepy, N. J., Payne, S. J. & Al., E. Scintillators with Potential to Supersede Lanthanum Bromide. 8 (2008).
11. Setyawan, W., Gaume, R. M., Lam, S., Feigelson, R. S. & Curtarolo, S. High-throughput combinatorial database of electronic band structures for inorganic scintillator materials. ACS combinatorial science 13, 382–90 (2011).
12. Singh, D. Structure and optical properties of high light output halide scintillators. Physical Review B 82, 155145 (2010).
13. Coble, R. L. Transparent Alumina and Method of Preparation. (1961).
14. Petit, J., Dethare, P. & Sergent, A. Sintering of Alpha-Alumina for Highly Transparent Ceramic Applications. Journal of the American Ceramic Society 31, 1957–1963 (2011).
15. Greskovich, C. & Duclos, S. CERAMIC SCINTILLATORS. Annual Review of Materials Science 27, 69–88 (1997).
63

16. Li, Q., Zhang, G.-P., Wang, H. & Lei, L.-W. Effect of pores on transmission properties of transparent ceramics. Optoelectronics and Advanced Materials-Rapid Communications 5, 673–676 (2011).
17. Seitz, F. Color Centers in Alkali Halide Crystals. Reviews of Modern Physics 18, 384–408 (1946).
18. Hayes, W. & Stoneham, A. M. Defects and Defect Processes in Nonmetallic Solids. (John Wiley and Sons: 1985).
19. Wisniewski, D. J. & Boatner, L. A. Performance of new ceramic scintillators for gammaand x-ray detection. Proc. of SPIE 6706, (2007).
20. De Haas, J. T. M. & Dorenbos, P. Advances in yield calibration of scintillators. IEEE Transactions on Nuclear Science 55, 1086–1092 (2008).
21. Sakai, E. Recent Measurements on Scintillator-Photodetector Systems. IEEE TRANSACTIONS ON NUCLEAR SCIENCE 34, 418–422 (1987).
22. De Mello, A. C. S. et al. Optical properties of pure and Cr3+ doped BGO ceramic scintillators. physica status solidi (c) 4, 980–983 (2007).
23. Wang, Y. & Van Loef, E. Lu2SiO5:Ce Optical Ceramic Scintillator for PET. IEEE TRANSACTIONS ON NUCLEAR SCIENCE 56, 887 (2009).
24. Van Loef, E. V. D., Dorenbos, P. & Van Eijk, C. W. E. Scintillation properties of LaCl3:Ce 3+ crystals: Fast, efficient and high-energy-resolution scintillators. Nuclear Instruments & Methods in Physics Research Section A 486, 254–258 (2002).
25. Grabmaier, B. C. Crystal Scintillators. IEEE Transactions on Nuclear Science 31, 372–376 (1984).
26. Cherepy, N. J. SrI2 scintillator for gamma ray spectroscopy. Proc. of SPIE 7449, (2009).
27. Podowitz, S. R., Gaume, R. M., Hong, W. T., Laouar, A. & Feigelson, R. S. Fabrication and Properties of Translucent SrI2 and Eu:SrI2 Scintillator Ceramics. IEEE Transactions on Nuclear Science 57, (2010).
28. Colmenares, C., Shapiro, E. G., Barry, P. E. & Prevo, C. T. A europium-doped, calcium-fluoride scintillator system for low-level tritium detection. Nuclear Instruments and Methods 114, 277–289 (1974).
29. Basiev, T. T. et al. Fluoride optical nanoceramics. Russian Chemical Bulletin 57, 877–886 (2009).
30. Rodnyi, P. A. Progress in fast scintillators. Radiation Measurements 33, 605–614 (2001).
64
31. Laval, M. et al. Barium fluoride — Inorganic scintillator for subnanosecond timing. Nuclear Instruments and Methods in Physics Research 206, 169–176 (1983).
32. Woody, C. L., Levy, P. W. & Kierstend, J. A. Slow Component Suppression and Radiation Damage in Doped BaF2 Crystals. IEEE Transactions on Nuclear Science 36, 536–542 (1989).
33. Selling, J., Birowosuto, M. D., Dorenbos, P. & Schweizer, S. Europium-doped barium halide scintillators for x-ray and γ-ray detections. Journal of Applied Physics 101, 034901 (2007).
34. Selling, J., Schweizer, S., Birowosuto, M. D. & Dorenbos, P. Cerium-doped barium halide scintillators for x-ray and γ-ray detections. Journal of Applied Physics 102, 074915 (2007).
35. Yedukondalu, N. et al. Electronic structure, optical properties, and bonding in alkaline-earth halofluoride scintillators: BaClF, BaBrF, and BaIF. Physical Review B 83, 165117 (2011).
36. Li, H. H. Refractive Index of Alkaline Earth Halides and Its Wavelength and Temperature Derivatives. J. Phys. Chem. Ref. Data 9, 283 (1980).
37. Edgar, A., Bartle, M., Varoy, C., Raymond, S. & Williams, G. Structure and Scintillation Properties of Cerium-Doped Barium Chloride Ceramics: Effects of Cation and Anion Substitution. IEEE Transactions on Nuclear Science 57, 1218–1222 (2010).
38. Edgar, A., Zimmermann, J., Von Seggern, H. & Varoy, C. R. Lanthanum-stabilized europium-doped cubic barium chloride: An efficient x-ray phosphor. Journal of Applied Physics 107, 083516 (2010).
39. FACT salt phase diagrams. at <http://www.crct.polymtl.ca/fact/documentation/FTsalt/FTsalt_Figs.htm>
40. BLACHNIK, R., ALBERT, G. & ENNING, E. Zur Kenntnis der Zustandsdiagramme SECIJ MCI,(SE = La, Sm, Gd, Yb; M = Sr, Ba). Z. anorg. allg. Chem. 522, 207–216 (1985).
41. Shannon, R. D. Revised Effective Ionic Radii and Systematic Studies of Interatomic Distances in Halides and Chalcogenides. Acta Crystallographica 32, (1976).
42. Gundiah, G., Hanrahan, S. M., Hollander, F. J. & Bourret-Courchesne, E. D. Europium-doped barium bromide iodide. Acta crystallographica. Section E, Structure reports online 65, i76–i77 (2009).
43. Singh, D. J. Near optical isotropy in noncubic SrI2: Density functional calculations. Applied Physics Letters 92, 201908 (2008).
44. Apetz, R. & Van Bruggen, M. P. B. Transparent Alumina: A Light-Scattering Model. J. Am. Ceram. Soc. 86, 480–486 (2003).
45. Bizarri, G., Bourret-Courchesne, E. D., Yan, Z. & Derenzo, S. E. Scintillation and Optical Properties of BaBrI: Eu2+ and CsBa2I5: Eu2+. IEEE Transactions on Nuclear Science 58, 3403–3410 (2011).
65
46. Dhanaraj, G., Byrappa, K. & Prasad, V. Chapter 25.4: Pregrowth Purification. Handbook of Crystal Growth 851–852 (2010).
47. Osterheld, R. K. & Bloom, P. R. Dehydration Kinetics for Barium Chloride Dihydrate Single Crystals. The Journal of Physical Chemistry 82, (1978).
48. Guillon, O. Effects of Applied Stress and Heating Rate in Field Assisted Sintering. Sintering: Engineering Materials 35 195–213 (2013).
49. Speakman, S. A. Fundamental of Rietvelt Refinement. 1–54 (2011).
50. Patterson, A. L. The Scherrer Formula for X-Ray Particle Size Determination. Physical Review Letters 56, 978–982 (1939).
51. Moses, W. & Derenzo, S. E. Scintillator Characterization using the LBL Pulsed X-Ray Facility. Radiation Measurements 24, 337–341 (1995).
52. Hull, S., Norberg, S., Ahmed, I., Eriksson, S. & Mohn, C. High temperature crystal structures and superionic properties of SrCl2, BrBr2, BaCl2, and BaBr2. Journal of Solid State Chemistry 184, 2925–2935 (2011).
53. Lumpkin & Perlmutter Thermal and water vapor effects on the rate of the dehydration reactions of barium chloride. Thermochemica Acta 335–349 (1995).
54. Anthony, Bideaux, Bladh & Nichols Handbook of Minerology Volume 1. (2005).
55. Bhattacharya, S. Pressure-assisted densification of non-homogeneous ceramic compacts. (1997).
56. Bohley, C., Wagner, J.-M., Pfau, C., Miclea, P.-T. & Schweizer, S. Raman spectra of barium halides in orthorhombic and hexagonal symmetry: An ab initio study. Physical Review B 83, (2011).
57. Herzberg, G. Electronic Spectra and Electronic Vibration in Polyatomic Molecules. (D. Van Nostrand Company, Inc.: New York, NY, 1966).
58. Henning, J., Beckenkamp, K. & Lutz, H. D. Single-Crystal Raman Studies on the Solid Hydrates MX2-H20 (M = Ba, Sr; X = OH, Br, I). Applied Spectroscopy 44, 992–997 (1990).
59. De Waal, D., Range, K. J., Konigstein, M. & Kiefer, W. Raman Spectra of the Barium Oxide Peroxide and Strontium Oxide Peroxide Series. Journal of Raman Spectroscopy 29, 109–113 (1998).
60. Kitajima, M. Defects in crystals studied by Raman scattering. Critical Reviews in Solid State and Materials Sciences 22, 275–349 (2006).
61. Lenus, A. J. & Rajan, K. G. Luminescence behaviour of Eu2+-doped BaClI and BaBrI. Materials Letters 57, (2002).
66

62. Rajan, K. G. & Lenus, A. J. X-ray excited optical luminescence studies on the system BaXY (X,Y = F, Cl, Br, I). Pramans journal of physics 2, 323–338 (2005).
63. Pastor, R. C. & Pastor, A. C. Reactive Atmosphere Processing Method of Crystal Growth of Alkaline Earth Chlorides. (1978).
67