baringo smart survey report july 2019
TRANSCRIPT

BARINGO SMART SURVEY REPORT JULY 2019
ACKNOWLEDGEMENT
This survey was carried out through the participation of many partners at different levels in the
County who are highly acknowledged. Appreciation to UNICEF for funding and providing technical
support during the survey.
Special thanks to officers from Department of Health, Baringo County Government World Vision –
Kenya, for their implementation role, for the active participation and the supervision roles they played
during the survey.
Special gratitude is extended to the households who participated in the survey. The local
administrators are also acknowledged for their role in mobilizing the community and acting as guides
to the enumerators during the exercise.
Lastly, the survey teams specifically the team leaders and enumerators are appreciated for the good
work of collecting excellent data

Table of content
Contents ACKNOWLEDGEMENT ....................................................................................................................................... 2
Table of content ....................................................................................................................................................... 3
ACCROYNM AND ABBREVIATIONS .............................................................................................................. 5
1.0 EXECUTIVE SUMMARY ................................................................................................................................ 7
2.0 INTRODUCTION ................................................................................................................................................ 10
2.1 Back ground Information ................................................................................................................................. 10
2.2 Timing of the Survey ........................................................................................................................................ 10
2.3 Objective of the Survey .................................................................................................................................... 11
2.4 SURVEY METHODOLOGY .................................................................................................................................. 11
2.4.1 Survey Area ................................................................................................................................................................. 11 2.4.1 Survey Design ............................................................................................................................................................. 11 2.4.2 Study Population ......................................................................................................................................................... 11 2.4.3 Sample Size ................................................................................................................................................................. 11 2.4.4 Data Collected ............................................................................................................................................................. 12
2.5 Survey Organisation ......................................................................................................................................... 12
Questionnaire ........................................................................................................................................................ 12
Data Analysis and Report Writing .......................................................................................................................... 12
Indicators, Guidelines and Formulas used in determining Acute Malnutrition Weight for height (WFH) index .. 12
2.6 Referrals ........................................................................................................................................................... 13
2.7 Ethical consideration ........................................................................................................................................ 13
3.0 SURVEY FINDINGS ............................................................................................................................................ 14
3.1 General characteristics of study population and households.......................................................................... 14
3.1.1 Demographics .............................................................................................................................................................. 14 3.1.2 Residency and Caregiver’s Marital Status of the respondent ...................................................................................... 14
3.2 Socio-economic characteristics of households ................................................................................................ 14
3.2.1 Highest Education level attained by head of household .............................................................................. 14
3.2.2 School Enrolment for 3-18 years ................................................................................................................................. 15 3.2.2 Occupation of the household head ............................................................................................................................... 15 3.2.3. Main source of Income of the Household Head ......................................................................................................... 16
3.3 NUTRITION STATUS OF CHILDREN ................................................................................................................... 16
3.3.1 Prevalence of acute malnutrition (weight-for-height z-score) ..................................................................... 16
3.3.2. Prevalence of acute malnutrition based on MUAC .................................................................................................... 17 3.3.3. Prevalence of Underweight......................................................................................................................................... 18 3.3.4 Prevalence of stunting ................................................................................................................................................. 18
3.4 CHILDREN’S MORBIDITY AND HEALTH SEEKING BEHAVIOR ............................................................................ 18
3.4.1 Child morbidity ........................................................................................................................................................... 18 3.4.1.1 Therapeutic Zinc Supplementation during Watery Diarrhoea Episodes ................................................................... 19 3.4.2. Health Seeking Behavior ............................................................................................................................................ 19
3.5 CHILDHOOD IMMUNIZATION, VITAMIN A SUPPLEMENTATION AND DEWORMING ...................................... 20
3.5.1. Childhood Immunization ............................................................................................................................................ 20 3.5.2 Vitamin A supplementation ......................................................................................................................................... 21 3.5.3. De-worming ................................................................................................................................................................ 22
3.5 MATERNAL NUTRITION .................................................................................................................................... 22
3.5.1 Women physiological status ........................................................................................................................................ 23 3.5.2 Iron and Folic Acid Supplementation (IFAS) .............................................................................................................. 23 3.5.3 Maternal Nutrition ....................................................................................................................................................... 24
3.6 WATER SANITATION& HYGIENE ....................................................................................................................... 24
3.6.1 Main Source of Water .................................................................................................................................................. 24 3.6.2 Distance to Water Source and Queuing Time.............................................................................................................. 25
3.7 Hygiene and sanitation .................................................................................................................................... 27
3.7.1 Hand washing .............................................................................................................................................................. 27 3.7.2 Sanitation Facilities ..................................................................................................................................................... 28
3.5 FOOD SECURITY ................................................................................................................................................ 29
3.5.1 Household Dietary Diversity (HDD) ........................................................................................................................... 29 3.5.2 Women Dietary diversity score ................................................................................................................................... 31 3.5.3 Food Consumption Score Classification ...................................................................................................................... 32 3.5.4 Food Consumption Score –Nutrition ........................................................................................................................... 33
3.6 Coping strategy Index ...................................................................................................................................... 33
3.7 Food Fortification ............................................................................................................................................. 34
4.0 CONCLUSION AND RECOMMENDATIONS ........................................................................................................ 36
ANNEX 2: Questionnaire .................................................................................................................................... 39

ACCROYNM AND ABBREVIATIONS
ANC: Antenatal Care
BCG: Bacillus Calmette–Guérin
BSFP: Blanket Supplementary Feeding Program
CI: Confidence Interval
CHMT: County Health Management Team
CLTs: Community Led Total Sanitation
CSI: Coping Strategy Index
DEFF: Design Effect
DHIS: District Health Information System
ECD: Early Childhood Development
ENA: Emergency Nutrition Assessment
FAO: Food and Agricultural Organization
FCS: Food consumption Score
FHK: Food for the Hungry Kenya
GAM: Global Acute Malnutrition
HAZ: Weight-for-Age Z score
HH: Household
HDDS: Household Dietary Diversity Score
HiNi: High Impact Nutrition Intervention
IFAS: Iron Folic Acid Supplementation
KABP: Knowledge, Attitude, Behavior and Practice
KII: Key Informant Interview
MAM: Moderate Acute Malnutrition
MNP: Micro Nutrient Powder
MIYCN: Maternal Infant Young Child Nutrition
MoH: Ministry of Health

MUAC: Mid Upper Arm Circumference
NDMA: National Draught Management Authority
NGO: Non-Governmental Organization
NIWG: Nutrition Information Working Group
OPV: Oral Poliovirus Vaccines
ORS: Oral Rehydration Salts
P&G: Procter & Gamble
PPS: Probability Proportional to Population Size
SAM: Severe Acute Malnutrition
SCHMT: Sub-County Health Management Team
SMART: Standardized Monitoring and Assessment in Relief and Transition
SPSS: Statistical Packages for social Sciences
UN: United Nations
UNICEF: United Nation Children Fund
WDDS: Women Dietary Diversity Score
WHO: World Health Organization
WAZ: Weight-for-Age Z score
WFA: Weight-for-Age
WHZ: Weight-for-Height Z score
WRA: Women of Reproductive age
VIP: Ventilated Improved Pit
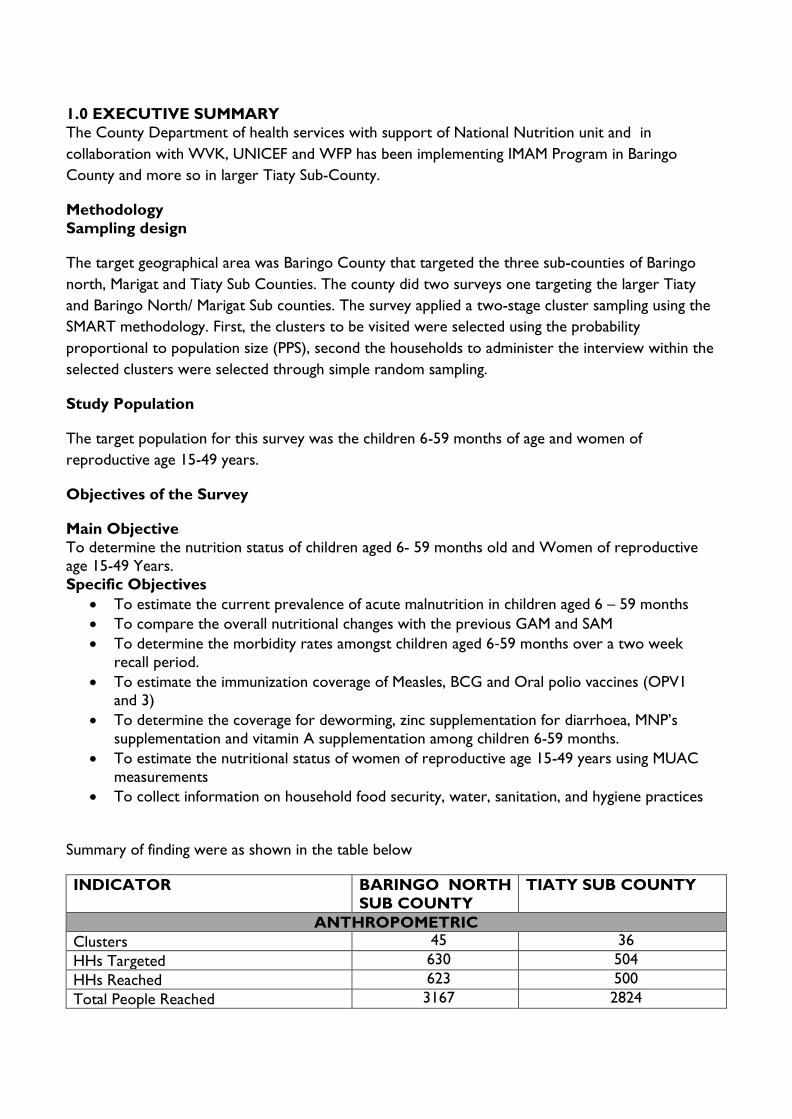
1.0 EXECUTIVE SUMMARY
The County Department of health services with support of National Nutrition unit and in
collaboration with WVK, UNICEF and WFP has been implementing IMAM Program in Baringo
County and more so in larger Tiaty Sub-County.
Methodology
Sampling design
The target geographical area was Baringo County that targeted the three sub-counties of Baringo
north, Marigat and Tiaty Sub Counties. The county did two surveys one targeting the larger Tiaty
and Baringo North/ Marigat Sub counties. The survey applied a two-stage cluster sampling using the
SMART methodology. First, the clusters to be visited were selected using the probability
proportional to population size (PPS), second the households to administer the interview within the
selected clusters were selected through simple random sampling.
Study Population
The target population for this survey was the children 6-59 months of age and women of
reproductive age 15-49 years.
Objectives of the Survey
Main Objective
To determine the nutrition status of children aged 6- 59 months old and Women of reproductive
age 15-49 Years.
Specific Objectives
• To estimate the current prevalence of acute malnutrition in children aged 6 – 59 months
• To compare the overall nutritional changes with the previous GAM and SAM
• To determine the morbidity rates amongst children aged 6‐59 months over a two week
recall period.
• To estimate the immunization coverage of Measles, BCG and Oral polio vaccines (OPV1 and 3)
• To determine the coverage for deworming, zinc supplementation for diarrhoea, MNP’s
supplementation and vitamin A supplementation among children 6-59 months.
• To estimate the nutritional status of women of reproductive age 15-49 years using MUAC
measurements
• To collect information on household food security, water, sanitation, and hygiene practices
Summary of finding were as shown in the table below
INDICATOR BARINGO NORTH
SUB COUNTY
TIATY SUB COUNTY
ANTHROPOMETRIC
Clusters 45 36
HHs Targeted 630 504
HHs Reached 623 500
Total People Reached 3167 2824

Prevalence of global malnutrition (49) 9.3 % (6.9 – 12.3 95% C.I.)
(130) 20.9 % (17.0 - 25.4 95%
C.I.)
Prevalence of severe malnutrition (12) 2.3 % (1.3 – 4.1 95% C.I.)
(22) 3.5 % (1.9 - 6.6 95% C.I.)
Prevalence of global malnutrition by
MUAC
(18) 3.4 % (2.2 - 5.3
95% C.I.)
(51) 8.1 % (5.8 - 11.2 95%
C.I.)
Prevalence of severe malnutrition by
MUAC
(6) 1.1 % (0.5 - 2.4 95%
C.I.)
(5) 0.8 % (0.2 - 2.6 95% C.I.)
Global underweight (113) 21.4 % (17.9 -
25.5 95% C.I.)
(251) 40.4 % (36.0 - 44.9 95% C.I.)
Severe Underweight (25) 4.7 % (3.1 - 7.3
95% C.I.)
(80) 12.9 % (10.8 - 15.3 95% C.I.)
Global Stunting (146) 28.1 % (23.4 - 33.2 95% C.I.)
(246) 40.1 % (35.5 - 45.0 95% C.I.)
Severe Stunting (46) 8.8 % (6.5 - 11.9
95% C.I.)
(79) 12.9 % (10.1 - 16.3 95%
C.I.)
IMMUNIZATION
Measles Coverage at 9 Months by Card 67.6% 26.5%
Measles Coverage at 9 Months by Recall 28.2% 48.1
Measles Coverage at 18 Months by Card 63.7% 7.1%
Measles Coverage at 18 Months by Recall 29.2 15.7%
BCG by scar 97.9% 93.7%
OPV 1 by Card 69.7% 33.5%
OPV 1 by Recall 27.5% 58.1%
OPV 3 by Card 69.3% 30.2%
OPV 3 by Recall 27.7% 53.8%
Zinc Supplementation 82.4% 68.6%
Vitamin A Supplementation (6-11 Months
)- Once
69.2% 43.4%
Vitamin A Supplementation (12-59
Months) - Once
69.7% 41.2%
Vitamin A Supplementation (12-59
Months) - Twice
50.9% 8.3%
Vitamin A (6 – 59 months) – once 69.7% 43.9%
Deworming (12-59 months) 68.3% 35.2%
CHILD MORBIDITY
Sickness two weeks prior to survey 25.9% 29.4%
Fever 12.8% 39.0%
Acute Respiratory Infection 82.1% 58%
Watery diarrhoea 10.9% 31.2%
Bloody diarrhoea 1.3% 2.4%
MATERNAL NUTRITION
MUAC <21cm for WRA 2% 8.2%
MUAC (21 < 23 cm) For WRA
MUAC <21cm for PLW 1.5% 6.8%
Iron Folate Supplementation 86.3% 68%
W-MDD <5 food groups 70.9% 84.7%
FOOD SECURITY
Poor FCS 12.4% 2.7%

Border FCS 12.4% 17.7%
Good FCS 84.9% 69.9%
HDD < 3 food groups 3.2% 34.1%
HDD 3-5 food groups 43% 43.2%
HDD > 5 food groups 53.8% 22.7%
CSI 15.2% 16.7%
WASH
Piped water system 8.8% 5.4%
Tube well / borehole 12.5% 15.6%
Dug well 0% 0.8%
Spring 16.7% 0.2%
Rainwater 3.9% 0%
Tanker-truck 0.5% 0%
Cart with small tank 0.6% 0.2%
Water kiosk 3.9% 2.4%
Surface water 52.3% 76.2%
Pit latrine 72.6% 6.6%
Hanging toilet / hanging latrine 0.0% 0.6%
No facility / bush / field 27.4% 93.4%
Aware of handwashing 82.2% 88.2%
Hand washing at 4 critical times 10.1% 2.2%
Water treatment 28.6% 4.4%

2.0 INTRODUCTION
2.1 Back ground Information
Baringo County is situated in the Rift Valley Region and shares borders with 8 counties namely, West
Pokot to the North West, Turkana to the North, Samburu to the North East, Laikipia to the East,
Nakuru to the South, Kericho and Uasin-Gishu Counties to the South West, and Elgeyo-Marakwet to
the West. The County consist of seven Sub-Counties, namely Baringo South, Mogotio, Eldama Ravine,
Baringo Central, Baringo North East Pokot and Tiaty East. It has 30 Wards and 116 Locations. The
County occupies an area of 11,015 square kilometers with a population of 555,561 people in 2009. The
population was projected to be 723,411, 853, 515 in 2017 and 2022 respectively. The county has five
livelihood zones: Pastoral 33%, Agro-Pastoral 9%, Marginal mixed farming 39%, Mixed Farming 14% and
Irrigated Cropping 4%.
Figure 1: East Pokot sub-county Livelihood Zones
Legend Livelihood zone
Pastoral
Agro-Pastoral
2.2 Timing of the Survey
Baringo County has two rainfall seasons; long rains (April-June) and short rains; (October-December)
season. The seasonal calendar also characterizes dry season into short (January-March) and long; July-
September dry season. The county inhabitants depend on long rains season rather than the short rains
season. The nutrition SMART survey was conducted in line with Long Rains seasonal assessment and
survey findings were used to classify and inform on outcome indicators (nutrition status) during long
rains assessment in August 2019.

Jan Feb Mar Apr May Jun Jul Aug Sep Oct Nov Dec
Short Dry Season Long Rain Long dry spell Short Rains
2.3 Objective of the Survey
The overall objective
To determine the nutrition status of children aged 6- 59 months old and Women of reproductive age
15-49 Years.
Specific objectives
➢ To estimate the current prevalence of acute malnutrition in children aged 6 – 59 months
➢ To compare the overall nutritional changes with the previous GAM and SAM.
➢ To determine the morbidity rates amongst children aged 0-59 months over a two-week recall
period.
➢ To estimate the immunization coverage of Measles, BCG and Oral polio vaccines (OPV1 and 3).
➢ To determine the coverage for deworming, zinc supplementation for diarrhea and vitamin A
supplementation among children 6-59 months.
➢ To estimate the nutritional status of women of reproductive age 15-49 years using MUAC
measurements
➢ To collect information on possible underlying causes of malnutrition such as household food
security, water, sanitation, and hygiene practices
2.4 SURVEY METHODOLOGY
2.4.1 Survey Area
The target geographical area was Baringo County and the survey covered three Sub Counties: Baringo
North, Marigat and larger Tiaty Sub counties.
2.4.1 Survey Design
The survey applied a two stage stratified cluster sampling using the SMART methodology with the
clusters being selected using the probability proportional to population size (PPS). Stage one sampling
involved the sampling of the clusters to be included in the survey while the second stage sampling
involved the selection of the households from the sampled clusters.
2.4.2 Study Population
The target population for the survey was children aged 6 – 59 months for the anthropometric
component and women of reproductive age between 15 – 49 years for the maternal nutrition
component.
2.4.3 Sample Size
The anthropometric survey sample size was calculated using the SMART survey calculator. The
parameters of interest were captured in the ENA 9th July 2015 software and the respective number of
children and households required for the survey computed. The sampling frame for this survey was the
updated list of villages (with current projected population) from the survey area.

2.4.4 Data Collected
Quantitative data collection method was used to collect the survey data; the following data was
collected:
1. Anthropometry (weight, height, oedema, MUAC, age, sex) for children aged 6-59 months and
MUAC for women of reproductive age.
2. Vaccination information ( OPV1 and 3, measles, BCG, and Vitamin A supplementation)
3. Incidences of childhood illnesses in the last 2 weeks prior to the survey
4. Food security information (Household Dietary Diversity Score, Women dietary Diversity Score,
Food consumption Score , Food consumption Score-Nutrition and Coping strategy Index)
5. Water and sanitation Hygiene (Latrine access and coverage, water treatment and hand washing)
The survey adopted the data collection tools recommended in the nutrition survey guidelines with a few
modifications to cater for all the objectives of the survey.
2.5 Survey Organisation
• Coordination/Collaboration: Before the survey was conducted, meetings were held with the
respective authorities and key stakeholders briefed them about the purpose, objectives and
methods for the survey. The survey details were discussed with the County Health office, key
partners on the ground. The authorities were requested to officially inform the communities
(villages) that were involved in the assessment.
• Recruiting the Survey Team: Recruitment was done in collaboration with the Ministry of
Health office at the County level in order to give ownership and participation in the assessment.
• Training of the Survey Team: The teams were given 4-days training prior to fieldwork,
including a standardization test to ensure standardization of measurement and recording practice.
All data collectors were trained on taking anthropometric measurements, completion of
questionnaires and sampling methodology. The data collection forms and questionnaires were pilot
tested in clusters not selected to be part of the larger survey, to ensure that the interviewers and
respondents understand the questions and that interviewers follow correct protocols.
Questionnaire
The survey adopted the data collection tools recommended in the Nutrition Information Working
Group.
Data Analysis and Report Writing
• Data Analysis: the data downloading and analysis was done using ENA for SMART, Excel and
SPSS Statistical software version 22. Results are presented using the new WHO reference levels.
Indicators, Guidelines and Formulas used in determining Acute Malnutrition Weight for height (WFH)
index
This was estimated from a combination of the weight for height (WFH) index values (and/or edema) and
by sex based on WHO standards 2006. This index was expressed in WFH indices in Z-scores, according
to WHO 2006 reference standards.
Z-Score:

➢ Severe acute malnutrition is defined by WFH < -3 SD and/or existing bilateral edema,
➢ Moderate acute malnutrition is defined by WFH < -2 SD and >-3 SD and no edema
➢ Global acute malnutrition is defined by WFH < -2 SD and/or existing bilateral edema.
Mid upper arm circumference (MUAC) MUAC analysis was also undertaken to determine the nutrition
status of sampled children and women of reproductive age (15-49 years). The following MUAC criteria
were applied.
MUAC guidelines: Interpretation
Children 6-59 Months
MUAC<115mm and /or Bilateral Edema Severe Acute Malnutrition
MUAC >=115mm and <125mm (no bilateral Edema) Moderate acute Malnutrition
MUAC>=125mm and <135mm(No bilateral Edema) Risk of Malnutrition
MUAC>135mm (No bilateral Edema) Adequate Nutritional Status
Women of reproductive age (15-49 Years)
MUAC >21-23cm At risk of malnutrition
MUAC <21cm Maternal Acute Malnutrition
2.6 Referrals
During the survey, all severe and moderately malnourished children as per MUAC and Weight-for-
Height cut offs referred to the nearby health service delivery points offering IMAM services. Pregnant
and lactating women with MUAC less than 21 cm were referred to the nearer by health facility.
2.7 Ethical consideration
Sufficient information was provided to the local authorities about the survey including the purpose and
objectives of the survey, the nature of the data collection procedures, the target group, and survey
procedures. Verbal consent was obtained from all adult participants and parents/caregivers of all eligible
children in the survey. The decision of the caregiver to participate or withdrawal was respected. Privacy
and confidentiality of survey respondent and data was adhered to.

3.0 SURVEY FINDINGS
3.1 General characteristics of study population and households
3.1.1 Demographics
In Baringo North/ Marigat Sub County, the total number of households surveyed were 623 out of planned
630. From the total number of households reached 531 were children aged between 6 and 59 months were reached for anthropometric measurements out of the planned 521. The average number of persons
per household in Baringo North/ Marigat was 5.08 while the proportion of children under five was 16.8%.
In Tiaty Sub County, the total number of households surveyed were 500 out of planned 504. From the
total number of household reached 628 children aged between 6 and 59 months were reached for
anthropometric measurements out of the planned 361. The average number of persons per household
in Tiaty was 5.63 while the proportion of children under five was 22.4% form the survey.
Target per the survey plan Actual No Reached
Survey Zone No. of
HH
No. of
Children
Number
of Clusters
No. of HH
Assessed
No. of
Children
Total
Household
Members
Baringo North
and Marigat
630 521 45 623 531 3167
Tiaty 504 361 36 500 628 2824
3.1.2 Residency and Caregiver’s Marital Status of the respondent
Majority of the respondent at 98.4% in Baringo North/ Marigat and 99.8% in Tiaty were residence of
these Sub counties.
3.2 Socio-economic characteristics of households
3.2.1 Highest Education level attained by head of household Majority of the Household head at 58% in Baringo North/ Marigat had attained primary level education while in
Tiaty 62.8% confirmed to have no education. Illiteracy level is very high in Tiaty Sub County as shown by the
figure below.
7.8 7.03.6 3.2
78.4
2.6
46.7
22.1
13.5 15.1
Pre primary Primary Secondary Tertiary None
Tiaty Baringo North/ Marigat

3.2.2 School Enrolment for 3-18 years
In Tiaty 54.8 percent of the school going children were enrolled in school while In Baringo North/ Marigat 94.7
percent of the school going children in were enrolled in school. Tiaty had the biggest proportion of children not
enrolled in school due to various reasons, family responsibilities at 31.1%, household not valuing schooling at
21.1% and there were no schools in the area as confirmed by 20.4 % of the respondent.
Reason for not enrolled Tiaty Baringo
North/Marigat
Chronic sickness 0.5% 1.4%
Family labour responsibilities 31.1%
working outside home 0.5%
Teacher absenteeism 0.8%
Too poor to buy school items 2.6% 4.1%
HH does not value schooling 21.1% 1.4%
No food in the school 0.2%
Migrated from school area 0.2%
No school in the area 20.4% 4.1%
Married 3.3% 1.4%
Other (parent consider them still young) 19.2% 87.8%
3.2.2 Occupation of the household head
In Tiaty majority of the households were doing livestock herding as their main occupation. In Baringo
North/Marigat the household head had various occupation, for instance 42.2% were doing crop
farming/own farm labour, 29.2% did waged labour (casual) and 13.6% were employed (salaried).
4.0
42.2
13.6
29.2
4.7
1.6
1.8
2.9
Livestock herding
crop farming/Own farm labour
Employed (salaried)
Waged labour (Casual)
Petty trade
Merchant/trader
Firewood/charcoal
other
Baringo North/Marigat
77.9
8.8
1.8
5.0
4.6
.8
.8
.4
Livestock herding
crop farming/Own farm…
Employed (salaried)
Waged labour (Casual)
Petty trade
Merchant/trader
Firewood/charcoal
other
Tiaty

3.2.3. Main source of Income of the Household Head
In Tiaty, survey results indicated that 74.5% of the household were selling livestock as a source of
income. Baringo North had various sources of income, 34.8% were doing casual labour as their main a
source of income, 31.9% were selling crops as a as their main source of income and 11.2% had
permanent job as their main source of income.
3.3 NUTRITION STATUS OF CHILDREN
3.3.1 Prevalence of acute malnutrition (weight-for-height z-score)
Global Acute Malnutrition (GAM) is defined as the proportion of children with a z-score of less than -2
z-scores weight-for-height and/or presence of oedema. GAM has two categories where severe acute
malnutrition (SAM) is defined as the proportion of children with less than -3 z-scores weight-for-height
and/or presence of oedema and Moderate acute malnutrition (MAM) is defined as the proportion of
children with < -2 and >-3 z-scores weight-for-height.
Further, based on MUAC, GAM was defined as the proportion of children with a MUAC of less 125 mm
and/or presence of oedema. SAM based on MUAC was defined as the proportion of children with a
MUAC of less than 115 mm and/or presence of oedema. MAM based on MUAC was defined as the
proportion of children with a MUAC ≥115 mm – <12.5 mm
Malnutrition by Z-Score: WHO (2006) Standard
• Severe acute malnutrition is defined by WFH < -3 SD and/or existing bilateral edema on the
lower limbs
• Moderate acute malnutrition is defined by WFH < -2 SD and >-3 SD and no edema
• Global acute malnutrition is defined by WFH < -2 SD and/or existing bilateral edema
Malnutrition by MUAC
• Severe malnutrition is defined by MUAC<115 mm and/or presence of bilateral edema
• Moderate malnutrition is defined by MUAC < 125 mm and ≥115 mm and no edema
• Global acute malnutrition is defined by MUAC <125 mm and/or existing bilateral edema
74.5
1.2
5.4
6.0
6.4
1.8
.6
.2
.0
4.0
3.5
1.0
31.9
8.0
34.8
11.2
.0
.6
1.4
7.2
Sale of livestock
Sale of livestock products
Sale of crops
Petty trading e.g. sale of firewood
Casual labor
Permanent job
Sale of personal assets
Income earned by Children
Older persons programme
other
Baringo North/ Marigat Tiaty

The results indicated that GAM for Baringo North/Marigat 9.3% (6.9 -12.3 95% C.I.) which is at Alert.
Compare to 2018, it was also at Alert 7.8 % (5.2 - 11.5 95% C.I.) showing no significant difference, a P.
value= 0.4487. GAM for Tiaty was 20.9 % (17.0 - 25.4 95% C.I.) which is Critical. Compared to 2018
the GAM was Critical, for Tiaty which was at 16.8 % (13.9 - 20.2 95% C.I.) showing no Significant
difference, P. value= 0.1148.
Baringo North/
Marigat 2019
Tiaty 2019
Prevalence of global malnutrition
(<-2 z-score and/or oedema)
(49) 9.3 % (6.9 – 12.3 95%
C.I.)
(130) 20.9 % (17.0 - 25.4
95% C.I.)
Prevalence of severe malnutrition
(<-3 z-score and/or oedema)
(12) 2.3 % (1.3 – 4.1 95%
C.I.)
(22) 3.5 % (1.9 - 6.6 95%
C.I.)
3.3.2. Prevalence of acute malnutrition based on MUAC
The mid-upper arm circumference (MUAC) is a low sensitive indicator of acute malnutrition compared
to weight for height Z-scores. Prevalence of GAM by MUAC is usually lower compared to WFH z-
scores. MUAC used as a rapid screening tool for admission into nutrition intervention program.
The survey showed that GAM by MUAC for Baringo North/Marigat was 3.4 % (2.2 - 5.3 95% C.I.) which
was at ALERT compared to 2.6 % (1.5 - 4.3 95% C.I.) in 2018 that was also at ALERT. GAM By MUAC
for Tiaty was 8.1 % (5.8 - 11.2 95% C.I.) which was Critical Compared to 3.4 % (2.0 - 5.7 95% C.I.) in 2018 which
was at ALERT showing a significantly different, a P value of 0.0028.
Baringo North/Marigat
2019
All n = 531
Tiaty 2019
All n = 633
Prevalence of global malnutrition
(< 125 mm and/or oedema)
(18) 3.4 %
(2.2 - 5.3 95% C.I.)
(51) 8.1 %
(5.8 - 11.2 95% C.I.)
Prevalence of severe malnutrition
(< 115 mm and/or oedema)
(6) 1.1 %
(0.5 - 2.4 95% C.I.)
(5) 0.8 %
(0.2 - 2.6 95% C.I.)
21.10%18.40%
23% 23.30%25.20%
16.80%
20.90%
3.00% 3.00% 3.50% 4%5.80%
4% 3.50%
2014 2015 2016 Jan-17 Jul-17 Jul-18 Jul-19
GAM TRENDS
GAM SAM

3.3.3. Prevalence of Underweight
The weight-for-age (WFA) index provides a composite measure of wasting and stunting and is
commonly used to monitor the growth of individual children in Mother-child booklet since it enables
mothers to easily visualize the trend of their children’s increase in weight against age. A low WFA is
referred to as underweight.
Baringo North/Marigat 2019
All n = 527
Tiaty 2019
All n = 622
Prevalence of underweight
(<-2 z-score)
(113) 21.4 %
(17.9 - 25.5 95% C.I.)
(251) 40.4 %
(36.0 - 44.9 95% C.I.)
Prevalence of severe
underweight
(<-3 z-score)
(25) 4.7 %
(3.1 - 7.3 95% C.I.)
(80) 12.9 %
(10.8 - 15.3 95% C.I.)
3.3.4 Prevalence of stunting
Height for age (stunting) is an indicator of chronic (long-term) malnutrition arising from deprivation
related to persistent/chronic poor food security situation, micronutrient deficiencies, recurrent illnesses
and other factors, which interrupt normal growth. Unlike wasting, it is not affected by seasonality but is
rather related to the long-term effects of socio-economic development and long-standing food
insecurity situation. A low height-for-age reflects deficits in linear growth and is referred to as stunting.
The findings indicated that stunting for Tiaty was 40.1 % (35.5 - 45.0 95% C.I.) which was Very High
compared to 30.0 % (24.3 - 36.4 95% C.I.) in 2018, which was high. Stunting for Baringo north/ Marigat was
28.1 % (23.4 - 33.2 95% C.I.) which was Medium compared to 28.5 % (23.7 - 33.7 95% C.I.) in 2018 which was
also classified as Medium
Baringo North/Marigat 2019
All n = 520
Tiaty 2019
All n =613
Prevalence of stunting
(<-2 z-score)
(146) 28.1 % (23.4 - 33.2 95%
C.I.)
(246) 40.1 %
(35.5 - 45.0 95% C.I.)
Prevalence of severe stunting
(<-3 z-score)
(46) 8.8 % (6.5 - 11.9 95% C.I.) (79) 12.9 %
(10.1 - 16.3 95% C.I.)
3.4 CHILDREN’S MORBIDITY AND HEALTH SEEKING BEHAVIOR
Disease are categorized as immediate causes of malnutrition in the UNICEF conceptual framework.
Disease can affects food intake and nutrient absorption within human body thus jeopardize immunity
and further worsening the disease that leads to malnutrition.
3.4.1 Child morbidity
The survey findings showed that 25.9% and 29.4% of household in Tiaty and Baringo north/ Marigat
respectively reported that their children under five were ill in the past two week prior to the survey.
Fever/Malaria and ARI/Cough had the highest prevalence across the two sub counties as shown in the

figure below
3.4.1.1 Therapeutic Zinc Supplementation during Watery Diarrhoea Episodes
Zinc supplementation reduces the duration and severity of diarrhoea. In 2004 WHO and UNICEF
recommended incorporating zinc supplementation (20 mg/day for 10-14 days for children 6 months and
older, 10 mg/day for children under 6 months of age) as an adjunct treatment to low osmolality oral
rehydration salts (ORS), and continuing child feeding for managing acute diarrhoea. Kenya has adopted
these recommendations and enshrined this in the Kenyan policy guideline on control and management
of diarrhoea diseases in children below five years where all under-fives with diarrhoea should be given
zinc supplements as soon as possible.
Indicator Baringo North/Marigat Tiaty
n N % n N %
Zinc Supplementation 2019 14 17 82.40% 35 51 68.60%
2018 16 18 88.90% 3 12 25%
Majority of the children who had diarrhoea in Baringo North/ Marigat were supplemented with zinc.
There was improvement in zinc supplementation for Tiaty Sub County from 25% in 2018 to 68.6% in
2019, this can be attributed to improved health system in the sub county.
3.4.2. Health Seeking Behavior
Among the children who were ill in the past two weeks prior to the survey, 84.8%, 76.3% in Tiaty and
Baringo North/Marigat respectively sought assistance
2019 2018 2019 2018
Tiaty Baringo North/ Marigat
39.00%39.80%
12.80% 18.10%
58%
48.70%
82.10%67.90%
31.20%
5.10% 10.90% 9.30%2.40% 0%1.30% 0%
10.40% 6.40% 5.80% 4.70%
malaria ARI/Cough waterly diarrhoea Bloody diarrhoea other

Among those who sought assistance, 64% sought assistance in public clinic, 9.4% in mobile clinic and
8.6% in private clinic in Tiaty Sub County. In Baringo/ Marigat 87.4% sought assistance from public clinic
and 6.7% in private clinics.
3.5 CHILDHOOD IMMUNIZATION, VITAMIN A SUPPLEMENTATION AND
DEWORMING
3.5.1. Childhood Immunization
Kenya aims to achieve 90% under one immunization coverage by the end of second medium term plan
(2013- 2017). The Kenya guideline on immunization defines a fully immunized child as one who has
received all the prescribed antigens and at least one Vitamin A dose under the national immunization
schedule before the first birthday. Immunization is a simple and effective way of protecting children from
serious diseases. It not only helps protect individuals, it also protects the broader community by
minimizing the spread of disease. Vaccines work by triggering the immune system to fight against certain
diseases. If a vaccinated person comes in contact with these diseases, their immune system is able to
respond more effectively, preventing the disease from developing or greatly reducing its severity. High
immunization rates in the community have led to many of diseases becoming rare. However, they still
exist and the risks of side-effects or complications from these diseases are far greater than the very
small risks of side effects from vaccination.
This survey assessed the coverage of 4 vaccines namely, BCG, OPV1, OPV3, and measles at 9 and 18
months. The BCG vaccine has variable efficacy or protection against tuberculosis (TB) ranging from 60-
80% for a period ranging from 10-15 years. It is known to be effective in reducing the likelihood and
severity of military TB and TB meningitis especially in infants and young children. This is especially
important in Kenya where TB is highly prevalent, and the chances of an infant or young child being
exposed to an infectious case are high.
From the survey the results indicated that 93.7%, 97.9% of the children under five in Tiaty and Baringo
North/Marigat respectively had a BCG scar. Baringo North/Marigat had good performance in terms of
immunization. From the finding 95.8%, 92.9% had been immunized with measles antigen at 9 months and
1.40%8.60%
13.70%
64%
9.40%
1.40% 4.30%5.90% 6.70%
87.40%
4.20%
Traditionalhealer
Private clinic shop public clinic mobile clinic relative or friend local herbs
Where they sought assistance
Tiaty Baringo North/Marigat

18 months respectively. Also 97.2%, 97% had been immunized with OPV1 and OPV 3 antigen
respectively. In Tiaty 74.6%, 22.8% of the under-five had been immunized against measles at 9 months
and 18 months respectively. A proportion of 91.6%, 84% of the under-five had been immunized of OPV1
and OPV3 respectively.
3.5.2 Vitamin A supplementation
Over 140 million children are at greater risk of illness, hearing loss, blindness and even death if urgent
action is not taken to provide them with life-saving vitamin A supplements. Two doses of vitamin A
every year can save thousands of children’s lives. According to the new UNICEF report; “Coverage at a
crossroads: New directions for vitamin A supplementation programmes”1, global coverage of vitamin A
supplementation (VAS) has dropped to a six-year low, leaving more than one third of children
unprotected from the devastating impacts of vitamin A deficiency. As the world mobilizes towards the
2030 Agenda for Sustainable Development – and particularly the target of ending preventable deaths in
children under age 5, there has never been a more urgent time to reprioritize this safe, cost-effective
and evidence-based intervention.
According to Kenya’s national nutrition action plan 2012-2017, the third priority objective is to reduce
the prevalence of micro nutrient deficiencies especially through awareness, food fortification and
supplementation. In these interventions, Vitamin A deficiency has been identified as a key micronutrient
of concern (NNAP, 2012-2017). Furthermore, The Lancet medical journal lists vitamin A large-scale
supplementation has proven potential to reduce the number of preventable child deaths each year
(Jones et al, 2003). Improving the vitamin A status of deficient children enhances their resistance to
disease and can reduce mortality from all causes by approximately 23 per cent (UNICEF, 2007). During
much of early childhood – from 6 months to 5 years of age – two high-dose supplements of vitamin A
per year, spaced four to six months apart, can strengthen the immune systems and improve chances of
survival (WHO, 2018). Vitamin A supplementation among children below the age of 5 years offers
1 UNICEF. Coverage at a Crossroads: New directions for vitamin A supplementation programmes, New York, 2018.
OPV1
OPV3
Measles 9
Measles 18
69.7
69.3
67.6
63.7
27.5
27.7
28.2
29.2
.2
.6
1.6
3.4
2.6
2.4
2.6
3.7
Baringo north/Marigat
Yes by card Yes by recall No Don’t know
OPV1
OPV3
Measles 9
Measles 18
33.5
30.2
26.5
7.1
58.1
53.8
48.1
15.7
7.1
14.4
23.6
75.3
1.3
1.6
1.9
1.8
Tiaty
Yes by card Yes by recall No Don’t know

protection against common childhood infections and substantially reduces mortality hence improving the
child’s survival.
The survey results indicated that Vitamin A supplementation was below national target for both Baringo
north/Marigat. According to the survey, 69.2%, 43.4% of the children aged 6- 11 months in Baringo
North/ Marigat and Tiaty Sub County were supplemented with vitamin A at least once, and 69.7%,
41.2% of children aged 12 to 59 months in Baringo North/ Marigat and Tiaty Sub County had been at
least supplemented once. Further analysis showed that 50.9%, 8.3% of children in Baringo North/
Marigat and Tiaty Sub County aged 12-59 months had been supplement with VIT A twice compared to
the ministry of health national target of 80%.
The table below show supplementation for different age category of under five years
Age-
category Baringo
North/Marigat
Tiaty Frequency
category
Baringo
North/Marigat
Tiaty
6-59months 531 628 6-59months
(once)
69.7%(n=370) 43.9%(n=276)
6-11 months 65 76 6-11months
(once)
69.2%(n=45) 43.4%(n=33)
12-59 months 466 554 12-59months
(once)
69.7%(n=325) 41.2%(n=228)
12-59months
(twice)
50.9%(n=237) 8.3%(46)
3.5.3. De-worming
De-worming is an essential intervention in controlling parasites including helminthes, schistosomiasis
(bilharzias) and prevention of anemia. WHO recommends that children in developing countries exposed
to poor sanitation and poor availability of clean safe water to be de-wormed once every 6 months. In
this survey, de-worming was assessed for children aged 12-59 months old.
In Tiaty 35.2% of children, aged 12-59 months had been dewormed once and 2.2% had dewormed twice.
In Baringo North/ Marigat 68.3% of children aged 12-59 had been dewormed once and 13.8% had
dewormed twice.
3.5 MATERNAL NUTRITION
Evidence shows that the current total deaths in children younger than five years can be reduced by 15%
if populations can access ten evidence-based interventions when implemented at scale with a coverage
of 90% (Bhutta, et.al. 2013). One of these strategies, has a positive effect on child survival during ‘the
window of opportunity’ which is also referred to as the 1st 1000 days (from conception to two years of
age). One of them is optimal maternal nutrition during pregnancy, an enhanced nutrition package for the
infant and young child focusing on promotion of exclusive breastfeeding. Pregnancy and lactation
imposes a big nutrient-need load on mothers, which in the absence of adequate extra nutrients leads to
utilization of body nutrient reserves leading to malnutrition. Gestational malnutrition leads to low birth
weights and may ultimately culminate in poor child growth and development, thus there is an urgent
need to address high rates of malnutrition among pregnant women. Household food insecurity is a key
indicator/determinant for poor adult nutritional status. A high number of malnourished PLWs increase
the risk of growth retardation of the fetus and consequently an increase in low birth weight and
malnutrition burden spreads to both U5 children and caretakers from the same household faced with
food insecurity and related vulnerabilities, a common scenario during nutrition emergency episodes.
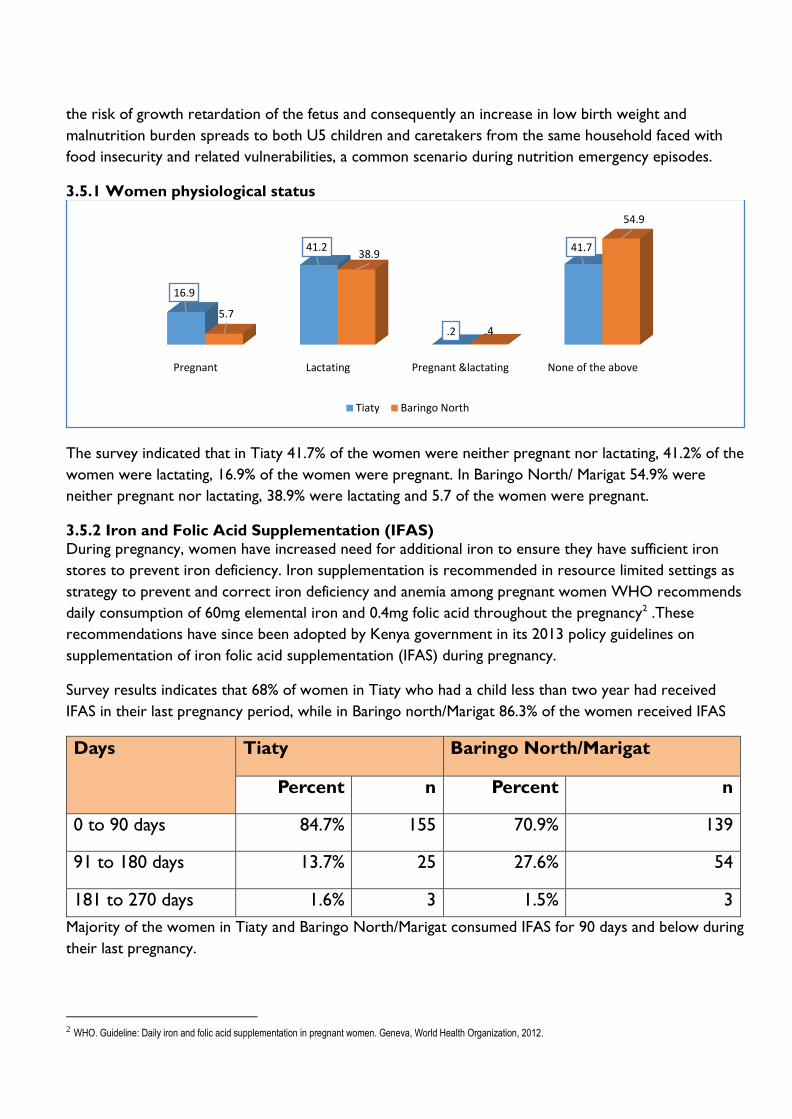
3.5.1 Women physiological status
The survey indicated that in Tiaty 41.7% of the women were neither pregnant nor lactating, 41.2% of the
women were lactating, 16.9% of the women were pregnant. In Baringo North/ Marigat 54.9% were
neither pregnant nor lactating, 38.9% were lactating and 5.7 of the women were pregnant.
3.5.2 Iron and Folic Acid Supplementation (IFAS)
During pregnancy, women have increased need for additional iron to ensure they have sufficient iron
stores to prevent iron deficiency. Iron supplementation is recommended in resource limited settings as
strategy to prevent and correct iron deficiency and anemia among pregnant women WHO recommends
daily consumption of 60mg elemental iron and 0.4mg folic acid throughout the pregnancy2 .These
recommendations have since been adopted by Kenya government in its 2013 policy guidelines on
supplementation of iron folic acid supplementation (IFAS) during pregnancy.
Survey results indicates that 68% of women in Tiaty who had a child less than two year had received
IFAS in their last pregnancy period, while in Baringo north/Marigat 86.3% of the women received IFAS
Days Tiaty Baringo North/Marigat
Percent n Percent n
0 to 90 days 84.7% 155 70.9% 139
91 to 180 days 13.7% 25 27.6% 54
181 to 270 days 1.6% 3 1.5% 3
Majority of the women in Tiaty and Baringo North/Marigat consumed IFAS for 90 days and below during
their last pregnancy.
2 WHO. Guideline: Daily iron and folic acid supplementation in pregnant women. Geneva, World Health Organization, 2012.
Pregnant Lactating Pregnant &lactating None of the above
16.9
41.2
.2
41.7
5.7
38.9
.4
54.9
Tiaty Baringo North
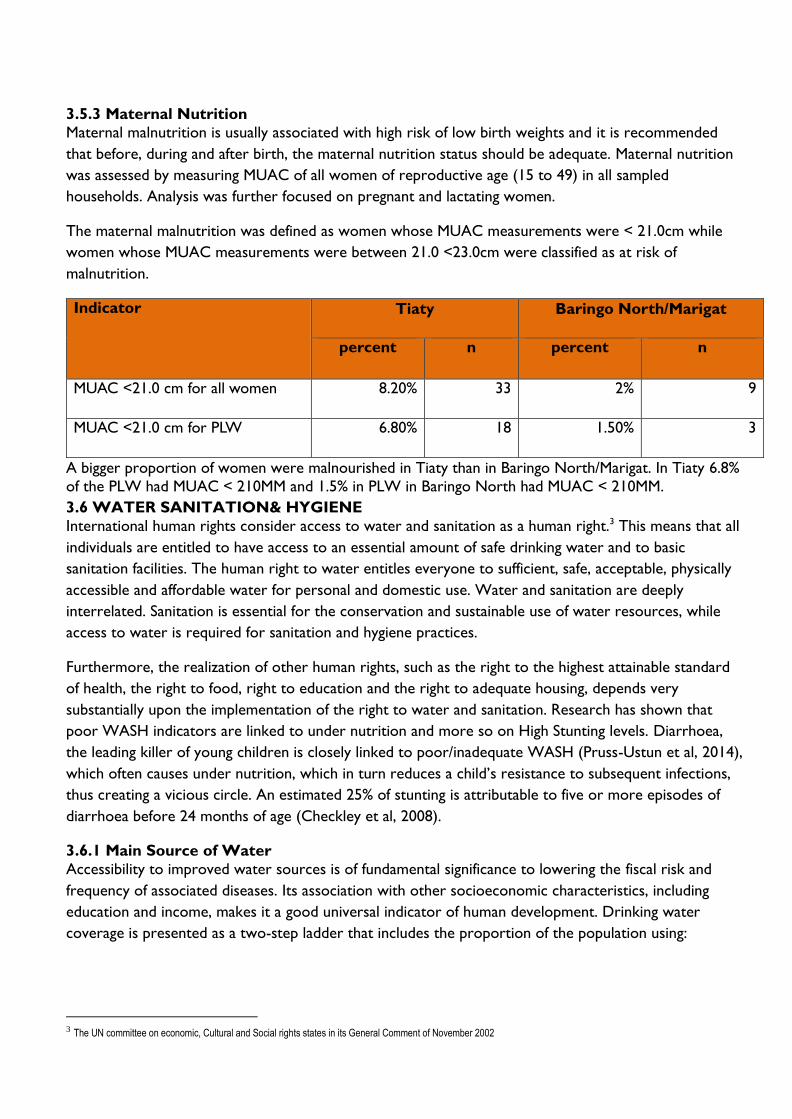
3.5.3 Maternal Nutrition
Maternal malnutrition is usually associated with high risk of low birth weights and it is recommended
that before, during and after birth, the maternal nutrition status should be adequate. Maternal nutrition
was assessed by measuring MUAC of all women of reproductive age (15 to 49) in all sampled
households. Analysis was further focused on pregnant and lactating women.
The maternal malnutrition was defined as women whose MUAC measurements were < 21.0cm while
women whose MUAC measurements were between 21.0 <23.0cm were classified as at risk of
malnutrition.
Indicator Tiaty Baringo North/Marigat
percent n percent n
MUAC <21.0 cm for all women 8.20% 33 2% 9
MUAC <21.0 cm for PLW 6.80% 18 1.50% 3
A bigger proportion of women were malnourished in Tiaty than in Baringo North/Marigat. In Tiaty 6.8%
of the PLW had MUAC < 210MM and 1.5% in PLW in Baringo North had MUAC < 210MM.
3.6 WATER SANITATION& HYGIENE
International human rights consider access to water and sanitation as a human right.3 This means that all
individuals are entitled to have access to an essential amount of safe drinking water and to basic
sanitation facilities. The human right to water entitles everyone to sufficient, safe, acceptable, physically
accessible and affordable water for personal and domestic use. Water and sanitation are deeply
interrelated. Sanitation is essential for the conservation and sustainable use of water resources, while
access to water is required for sanitation and hygiene practices.
Furthermore, the realization of other human rights, such as the right to the highest attainable standard
of health, the right to food, right to education and the right to adequate housing, depends very
substantially upon the implementation of the right to water and sanitation. Research has shown that
poor WASH indicators are linked to under nutrition and more so on High Stunting levels. Diarrhoea,
the leading killer of young children is closely linked to poor/inadequate WASH (Pruss-Ustun et al, 2014),
which often causes under nutrition, which in turn reduces a child’s resistance to subsequent infections,
thus creating a vicious circle. An estimated 25% of stunting is attributable to five or more episodes of
diarrhoea before 24 months of age (Checkley et al, 2008).
3.6.1 Main Source of Water
Accessibility to improved water sources is of fundamental significance to lowering the fiscal risk and
frequency of associated diseases. Its association with other socioeconomic characteristics, including
education and income, makes it a good universal indicator of human development. Drinking water
coverage is presented as a two-step ladder that includes the proportion of the population using:
3 The UN committee on economic, Cultural and Social rights states in its General Comment of November 2002

• Unimproved drinking water sources which include: Unprotected dug well, unprotected spring,
cart with small tank/drum, tanker truck, and surface water (river, dam, lake, pond, stream, canal,
irrigation channels), bottled water
• Improved drinking water sources also piped water which include: Public taps or standpipes, tube
wells or boreholes, protected dug wells, protected springs and rainwater collection, Piped
household water connection located inside the user’s dwelling, plot or yard.
From the survey result it indicated that in Baringo North / Marigat 52.3%, get water from surface water,
16.7% from spring and 12.5% from Borehole. In Tiaty 76.2%, get water from surface water and 15.6%
from boreholes
3.6.2 Distance to Water Source and Queuing Time
According to SPHERE handbook for minimum standards for WASH, the maximum distance from any
household to the nearest water point should be 500 meters. It also gives the maximum queuing time at
a water source, which should be not more than 15 minutes, and it should not take more than three
minutes to fill a 20-litre container.
3.6.2.1 Distance to water sources
In Tiaty Sub County majority at 65.4% trek for > 500M to the water source while 34.6 trek for < 500m.
In Baringo North/Marigat 58.7% trek for < 500M to water source while 41.3% trek for > 500M
52.3
16.7
12.5
8.8
3.9
3.9
0.6
0.8
0.5
76.2
0.2
15.6
5.4
2.4
0
0.2
0
0
Surface Water
Spring
Borehole
Piped water system
Water kiosk
Rain Water
Cart With small tank
Dug well
Tanker Track
Sources of water
Tiaty Baringo North/South

3.6.2.2 Queuing time to water sources
In Tiaty a bigger proportion queue for water in < 30 Minutes. This can be attributed to that majority get
water from surface water source. In Baringo North/ Marigat 68.9 queue for < 30 Minutes while 31.2%
queue for > 30 Minutes
Majority at of Baringo North/Marigat and Tiaty do not treat their water before use this stands at 71.4%,
95.6% respectively. Among those who treat water in Tiaty, they use pot filters and boiling to treat water while
in Baringo North/Marigat they boil and also use chemical (chlorine and water guard)
58.7
35.3
5.9
0.0
34.6
48
16.6
0.8
less than 500M(less than 15 minutes)
More than 500M less than 2km (15min to 1hr)
More than 2km (1 to 2hrs)
more than 3.5km
Trekking data
Tiaty Baringo North/Marigat
68.9
15.6
15.6
91.3
6.5
2.2
less than 30 minutes
30 to 60 minutes
more than 1 hour
Queuing time at water source
Tiaty Baringo North/Marigat

3.7 Hygiene and sanitation
3.7.1 Hand washing
Hand washing with soap is one of the most effective and inexpensive interventions for preventing
diarrhoeal diseases and pneumonia, which together account for 3.5 million child deaths annually
worldwide.4 Hand washing is important for good health. Effective washing can be practiced with
alternatives to soap and using a variety of different hygienic facilities. Overall, interventions to promote
hand washing might save a million lives a year. Each person should be able to wash hands with water and
soap after toilet use, before food preparation, before eating and after cleaning babies. From the survey
resulty 88.2% and 82.2% of the respondent were not aware of hand washing In Tiaty and Baringo North/
Marigat respectively. Hand washing four critical times was at 2.2% in Tiaty and 10.1% in Baringo North/
Marigat.
4 Cairncross, S. and Valdmanis V. (2006) Chapter 41: Water Supply, Sanitation, and Hygiene Promotion. In D.T. Jamison, J.G. Breman, A.R. Measham, et al.
(Editors), Disease Control Priorities in Developing Countries, 2nd edition (771-792). Washington (DC): World Bank.
78.7%
31.5%
0.6%
36.4%
13.6%
59.1%
Boiling Chemical (chrorine,pur,waterguard) Pot filters
Water treatment
Baringo North/South Tiaty

3.7.2 Sanitation Facilities
People with at least basic sanitation services are considered to have safely managed sanitation services if
the excreta from their homes is transported through sewers and treated off-site. Poor management of
excreta is linked to transmission of diseases such as cholera, diarrhoea, dysentery, hepatitis A, typhoid
and polio, and also contributes to malnutrition. Inadequate sanitation is estimated to cause 280 000
diarrhoeal deaths annually and is a major factor in several neglected tropical diseases, including intestinal
worms, schistosomiasis, and trachoma. Proper sanitation facilities (for example, toilets and latrines)
promote health because they allow people to dispose of their waste appropriately. Sanitation Facilities
are classified as:
• Improved sanitation, which include:
✓ Flush toilet
✓ Connection to a piped sewer system
✓ Connection to a septic system
✓ Flush / pour-flush to a pit latrine
✓ Pit latrine with slab
✓ Ventilated improved pit latrine (abbreviated as VIP latrine)
✓ Composting toilet
• Unimproved Sanitation which include:
✓ Public or shared latrine (meaning a toilet that is used by more than one household)
✓ Flush/pour flush to elsewhere (not into a pit, septic tank, or sewer)
✓ Pit latrine without slab
✓ Bucket latrines
✓ Hanging toilet / latrine ✓ No facilities / bush / field (open defecation)
The finding indicated latrine coverage in Baringo North/Marigat was at 72.6% and 6.6% in Tiaty Sub
County. Household practicing open defecation were 93.4% in Tiaty and 27.4% in Baringo North/
Marigat.
79.1%
72.9%
45.1%
11.9%
10.1%
84.6%
9.8%
40.4%
9.4%
2.2%
Before eating
After toilet
Before toilet
After taking children to the toilet
Hand Washing at 4 critical times
Baringo North/South N=623, Tiaty N=500
Tiaty Baringo North / South

3.5 FOOD SECURITY
3.5.1 Household Dietary Diversity (HDD)
Household dietary diversity Score (HDDS) is a measure of food consumption that reflects household
access to a variety of foods. It is not meant to be used in accessing dietary diversity at individual level (FAO, 2010). Minimum Household Dietary Diversity is an indicator of whether or not a household has
consumed at least three out of twelve defined food groups within the last 7 days. Survey findings shows
53.8%, 22.7% of the household surveyed had consumed more than 5 food groups in Baringo North and
Tiaty Sub County respectively.
Micronutrient malnutrition is a global problem much bigger than hunger and imposes enormous costs
on societies in terms of ill health, lives lost, reduced economic productivity and poor quality of life.
Addressing the global challenge of micronutrient malnutrition requires the need for many strategies –
both short- and intermediate-term and long-term sustainable approaches. In addition to the conventional
approaches of micronutrient supplementation and fortification, promoting sustainable food based
approaches to enable adequate intakes of micronutrients by much of the population includes dietary
0.2
72.4
27.4
0.0 0.00.05.2
93.4
0.8 0.6
Mobile toilet Pit Latrine Open Defecation Compositing toilet Hanging toilet
Sanitation facility
Baringo North/Marigat Tiaty
< 3 food groups 3 to 5 food groups > 5 food groups
34.10%
43.20%
22.70%
3.20%
43%
53.80%
HDDS
TIATY BARINGO NORTH/ MARIGAT

diversification strategies and agriculture-based approaches. Dietary diversification is possible by the
promotion of homestead food production, which includes home gardening, small livestock rearing and
fishing as well as the processing and preservation of food. Analysis on iron rich foods shows that less
iron rich foods were consumed in Tiaty Sub County as shown in the table below. Protein rich food were
highly consumed in both Baringo north and Tiaty Sub County. These results reflects the ones recorded
during SMART survey 2019 which illustrated similar trends in 2018.
78.70%
6.90%
20.10%
73.00%
0.20%6.60%
93.30%
16.50%
34.50%
49%
23.10%
9.80%
67.10%
0% 2.40%
97.60%
No
ne
Som
etim
e
At
leas
t d
aily
No
ne
Som
etim
e
At
leas
t d
aily
No
ne
Som
etim
e
At
leas
t d
aily
No
ne
Som
etim
e
At
leas
t d
aily
No
ne
Som
etim
e
At
leas
t d
aily
No
ne
Som
etim
e
At
leas
t d
aily
STARCHES PROTEINS IRON VIT_A OIL FRUITS_VEG
TIATY BARINGO NORTH/ MARIGAT

3.5.2 Women Dietary diversity score
Women of reproductive age (WRA) are often nutritionally vulnerable because of the
physiological demands of pregnancy and lactation. Requirements for most nutrients are higher
for pregnant and lactating women than for adult men (National Research Council, 2006),
World Health Organization [WHO]/ Food and Agriculture Organization of the United
Nations (FAO, 2016). Outside of pregnancy and lactation, other than for iron, requirements
for WRA may be similar to or lower than those of adult men, but because women may be
smaller and eat less (fewer calories), they require a more nutrient-dense diet (Torheim and
Arimond, 2013). Insufficient nutrient intakes before and during pregnancy and lactation can
affect both women and their infants. Yet in many resource-poor environments, diet quality
for WRA is very poor, and there are gaps between intakes and requirements for a range of
micronutrients (Arimond et al., 2010; Kavle, 2017).
MDD-W6 is a dichotomous indicator of whether or not women 15-49 years of age have
consumed at least five out of ten defined food groups the previous day or night. The
proportion of women 15–49 years of age who reach this minimum in a population can be used
as a proxy indicator for higher micronutrient adequacy, one important dimension of diet
quality. The indicator constitutes an important step towards filling the need for indicators for
use in national and subnational assessments. It is a population-level indicator based on a recall
period of a single day and night, so although data are collected from individual women, the
Indicator cannot be used to describe diet quality for an individual woman. This is because of
normal day-to-day variability in individual intakes.
The results below indicated that in Tiaty majority of the women at 66.3% consumed less than
5 food groups, 33.7% consumed 5 or more food groups. In Baringo North/ Marigat majority
at 65.1% consumed 5 or more food groups and 34.9% consumed less than 5 food groups.
Further analysis on women of reproductive age 24 hours recall showed that women in Tiaty consumed less
good groups as compared to Baringo North. Only the consumption of milk was higher in Tiaty as compared
to Baringo North/Marigat
Food Groups consumed by women of reproductive age
Tiaty Baringo North/ Marigat
66.30%
34.90%33.70%
65.10%
< 5 food groups >= 5 food groups

3.5.3 Food Consumption Score Classification
The food consumption score is an acceptable proxy indicator to measure caloric intake and
diet quality at household level, giving an indication of food security status of the household.
It’s a composite score based on dietary diversity, food frequency and relative nutritional
importance of different food groups.
Food consumption score classifies households in to 3 categories namely, poor, borderline and
acceptable (FAO 2010). Food security situation in Baringo North and Tiaty had improved where
most of the household their FCS was acceptable 69.9% Tiaty and 84.9% Baringo North.
However a significant 12.4% (2019) compared to 1.5% (2018) in Tiaty had a poor FCS while it
remained unchanged (2018 and 2019) at 2.7 percent in Baringo North.
STARCH
PULSE_LEGUMES
NUTS_SEEDS
MILK
FLESH_MEAT
EGGS
VITA_GREENLEAFY_VEG
0THERVITA_VEGFRUITS
OTHERVEG
OTHERFRUITS
Baringo North/ Marigat Tiaty
POOR BORDERLINE ACCEPTABLE
12.40%17.70%
69.90%
2.70%12.40%
84.90%
FCS
TIATY BARINGO NORTH/ MARIGAT

Page 33 of 61
3.5.4 Food Consumption Score –Nutrition
Deficiencies in micronutrients, such as vitamin A and iron, over a long period, lead to chronic
undernutrition. Iron deficiency leads to anemia and Vitamin A deficiency leads to blindness and
interferes with the normal functioning of the immune system, growth and development as well
as reproduction.
Among the household who had acceptable FCS in Baringo North and Tiaty, majority consumed
on daily basis the protein rich foods, Vitamin A rich foods and iron rich foods. This is well
illustrated in the tables below.
Further analysis on average number of days micronutrient were consumed in a household
showed that, in Baringo North Protein, iron, Fruits and vegetables, starches and Oil were
consumed over 5 days in a week. In Tiaty Sub County only proteins, Vitamin A were
consumed for more than 5 days in a week.
3.6 Coping strategy Index
The Coping Strategy Index (CSI), is a proxy indicator for access to food and change in the
consumption patterns of a given household. For each coping strategy, the frequency score (0
to 7) is multiplied by the universal severity weight. A weighted score allows one to measure the frequency and severity of coping strategies.
78.70%
6.90%20.10%
73.00%
0.20%6.60%
93.30%
16.50%
34.50%49%
23.10%9.80%
67.10%
0% 2.40%
97.60%
No
ne
Som
etim
e
At
leas
t d
aily
No
ne
Som
etim
e
At
leas
t d
aily
No
ne
Som
etim
e
At
leas
t d
aily
No
ne
Som
etim
e
At
leas
t d
aily
No
ne
Som
etim
e
At
leas
t d
aily
No
ne
Som
etim
e
At
leas
t d
aily
STARCHES PROTEINS IRON VIT_A OIL FRUITS_VEG
TIATY BARINGO NORTH/ MARIGAT
4.6
5.6
4.2
5.4
2.8
4.5
6.25.9
6.9
4.65.1
7.0
STARCHES PROTEINS IRON VIT_A OIL FRUITS_VEG
TIATY BARINGO NORTH/ MARIGAT

Page 34 of 61
Data is collected on the number of days in the last seven days a household used a specific
coping strategy due to a shortage of food and/or income. The average CSI for Tiaty Sub County
for SMART 2019 was 16.72 compared to 18.17 (2018) while for Baringo North was 15.17 (2019)
as compared to 18.28 (2018). The CSI for Tiaty has continued to reduce compared to the last
three years showing either better adaptation or a shift in livelihoods.
Baringo North/Marigat
Tiaty
N
Av. CSI/
Days
Weight
of CSI
Total
Weight
CSI n
Av. CSI/
Days
Weight
of CSI
Total
Weight
CSI
Rely on less preferred
and less expensive
foods? 235 2.48 1 2.48 330 2.27 1 2.27
Borrow food, or rely
on help from a friend
or relative? 181 1.8 2 3.6 254 1.63 2 3.26
Limit portion size at
mealtimes? 218 2.1 1 2.1 275 2.17 1 2.17
Restrict consumption
by adults in order for
small
children to eat? 141 2.02 3 6.06 233 1.74 3 5.22
Reduce number of
meals eaten in a day? 219 2.48 1 2.48 256 2.25 1 2.25
Total Weighted CSI 16.72 15.17
3.7 Food Fortification
Fortification is adding vitamins and minerals to foods to prevent nutritional deficiencies. The
nutrients regularly used in grain fortification prevent diseases, strengthen immune systems, and
improve productivity and cognitive development. Wheat flour, maize flour, and rice are primarily
fortified to:
• Prevent nutritional anemia
• Prevent birth defects of the brain and spine
• Increase productivity
• Improve economic progress
Food fortification was identified as the second strategy of four by the WHO and FAO to begin decreasing the incidence of nutrient deficiencies at the global level. As outlined by the FAO, the most common fortified foods are cereals (and cereal based products), milk (and milk products), fats and oils, accessory food items, tea and other beverages, and infant formulas. Undernutrition and nutrient deficiency is estimated globally to cause between 3 and 5 million deaths per year. Food fortification was assessed and only 2.8% and 14% in Tiaty and Baringo North respectively reported to have seen the Food fortification Logo.

Page 35 of 61
Respondent knowledge on fortification logo
From the survey results, 54.3% of the respondent from Baringo North/Marigat confirmed
their main source of flour was bought from a nearby Posho mill and 40.6 of the respondent
from Tiaty confirmed to buy flour from the shops.
Main Source of flour in Baringo
86.0%
97.2%
14.0%
2.8%
0.0% 20.0% 40.0% 60.0% 80.0% 100.0% 120.0%
Baringo North/Marigat
Tiaty
With knowledge on food fortification No knowlegde on food fortification
54.3%
40.9%
4.3%
0.5%
21.0%
38.2%
40.6%
0.2%
0.0% 10.0% 20.0% 30.0% 40.0% 50.0% 60.0%
Bought from a nearby Posho Mill
Maize is taken for milling at a nearby Posho Mill
Bought from the shops, supermarket
Others (own production)
Tiaty Baringo North/Marigat
Page 36 of 61
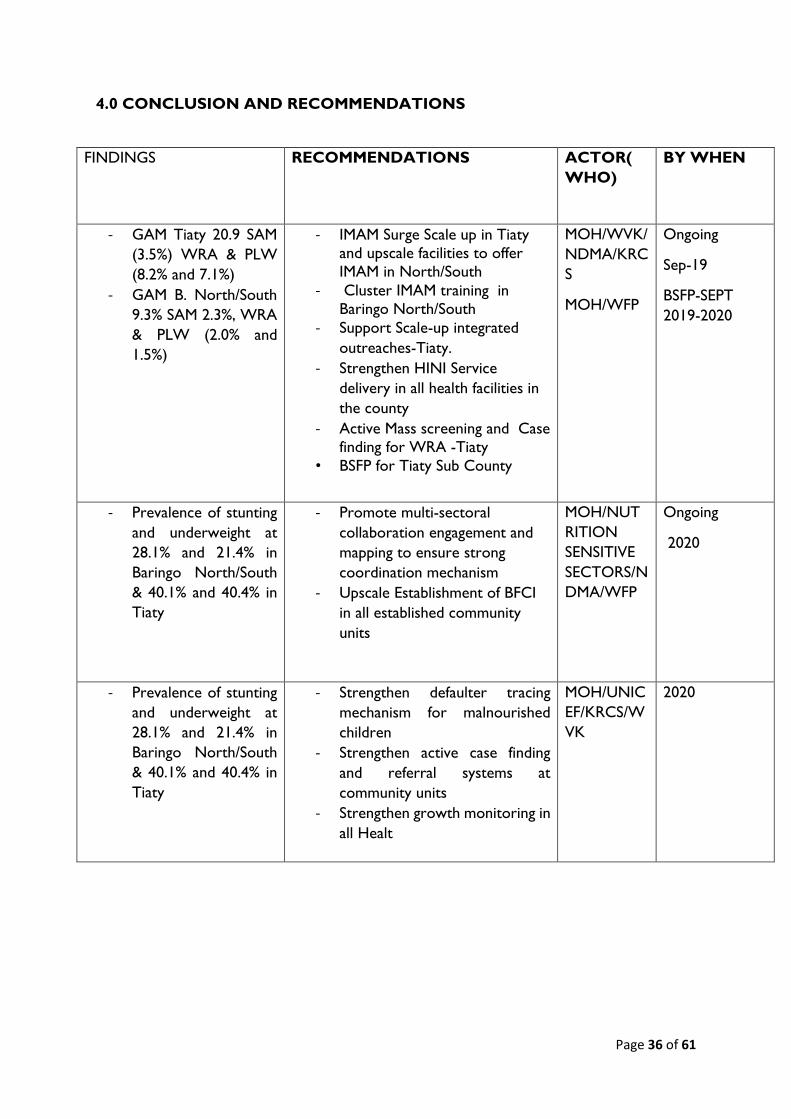
4.0 CONCLUSION AND RECOMMENDATIONS
FINDINGS RECOMMENDATIONS ACTOR(
WHO)
BY WHEN
- GAM Tiaty 20.9 SAM
(3.5%) WRA & PLW
(8.2% and 7.1%)
- GAM B. North/South
9.3% SAM 2.3%, WRA
& PLW (2.0% and
1.5%)
- IMAM Surge Scale up in Tiaty
and upscale facilities to offer
IMAM in North/South
- Cluster IMAM training in
Baringo North/South
- Support Scale-up integrated
outreaches-Tiaty.
- Strengthen HINI Service
delivery in all health facilities in
the county
- Active Mass screening and Case
finding for WRA -Tiaty
• BSFP for Tiaty Sub County
MOH/WVK/
NDMA/KRC
S
MOH/WFP
Ongoing
Sep-19
BSFP-SEPT
2019-2020
- Prevalence of stunting
and underweight at
28.1% and 21.4% in
Baringo North/South
& 40.1% and 40.4% in
Tiaty
- Promote multi-sectoral
collaboration engagement and
mapping to ensure strong
coordination mechanism
- Upscale Establishment of BFCI
in all established community
units
MOH/NUT
RITION
SENSITIVE
SECTORS/N
DMA/WFP
Ongoing
2020
- Prevalence of stunting
and underweight at
28.1% and 21.4% in
Baringo North/South
& 40.1% and 40.4% in
Tiaty
- Strengthen defaulter tracing
mechanism for malnourished
children
- Strengthen active case finding
and referral systems at
community units
- Strengthen growth monitoring in
all Healt
MOH/UNIC
EF/KRCS/W
VK
2020

Page 37 of 61
- Vitamin A
supplementation
among children
- Routine Vitamin A
supplementation at the facility
level, during outreaches and
malezi bora week.
- Conduct vitamin A sensitization
training for all health workers
- Conduct bi-annually vitamin A
Data Quality Audit.
- Strengthen Vitamin A supply
chain management
MOH/UNIC
EF/KRCS/W
VK
Ongoing
OCT 2019-
2020 May
- Deworming coverage
of 35.2% Tiaty and
68.3% Baringo North /
South, below target of
80%.
- Routine Deworming at the
facility level and during malezi
bora week.
- Strengthening the dewormers
supply chain management
MOH Ongoing
Sep-19
- Pregnant mothers
who received IFAS
was 68.0% in Tiaty and
86.3% in Baringo
North/South
- Routine supplementation of IFAS
at the facility level during ANC
Visits and at outreaches.
- Support training of HCW on
MIYCN and Micronutrient.
- IFAS Refresher training for all
health workers
MOH/UNIC
EF/WVK
Scale to 2020
- Immunization/vaccinat
ion coverage of BCG
vaccine, OPV1, OPV3
and measles (1st & 2nd
dose) above 80%.
- Strengthen Documentation of
Reports of the children
immunized.
- Upscale and support integrated
outreaches where not accessible
to health care services
MOH Ongoing
OCT 2019
- Zinc supplementation
82.4% in Baringo
North/South and
68.6& in Tiaty
- Scale-up IMCI and
ICCM(Provide ORT guidelines
for all facilities
- strengthen supply chain for Zn
MOH Ongoing and to
be upscale
OCT 2019-
2020

Page 38 of 61
- Main source at water
for drinking was from
unsafe sources.
- Community sensitization on
treatment of water at household
level
MOH/KRCS
/WVI
Ongoing AUG
2019
- Only 10.1% Baringo
North and 2.2% Tiaty
of respondents at
household practice
the 4 handwashing
practices at a given
point.
- Community sensitization on
hand washing practices
- Train CHV'S ON BFCI modules
MOH/KRCS
/WVI/UNIC
EF
OCT 2019-
2020 OCT
- High rate of Open
defecation
- Tiaty 93.4 vs 27.4
B/North
- Scale up implementation of
WASH-CLTS-Nutrition
activities at community level and
schools.
MOH/UNIC
EF/WVI
JUL- DEC 2019
- Poor dietary diversity - Up scaling baby friendly
Community Initiatives in
community units
- Health education on dietary
diversity
- Formation and training of
community groups ,Fathers and
MTMSG'S
- Promote dietary diversification
through Kitchen gardening,
dietary formulation and cooking
demonstration
MOH/MOA/
WFP/UNICE
F
JUL- DEC 2019
- Low awareness on
food fortification
- Health education on the on use
fortified foods
- Conduct community
sensitization on importance of
using fortified foods
MOH/UNIC
EF/WFP
JUL 2019-2020

Page 39 of 61
ANNEX 2: Questionnaire
1.IDENTIFICATION 1.1 Data Collector___________________ 1.2 Team Leader_______________
1.3 Survey date (dd/mm/yy)--------------------------
1.4 County 1.5 Sub
County
1.6
Ward
1.7
Location
1.8 Sub-
Location
1.9
Village
1.10 Cluster
No
1.11 HH
No
1.12 Team
No.
1.13
Household
geographic
al
coordinate
s
Latitud
e
________
__
Longitud
e
__________
____
2. Household Demographics
2.1 2.2a 2.2b 2.3 2.4 2.5 2.6 2.7a 2.7b 2.8 2.10
Age
Group
Please
give me
the
names of
the
persons
who
usually
live in
your
househol
d.
Pleas
e
indica
te the
house
hold
head
(write
HH
on
the
mem
ber’s
colu
mn)
Age
(Record
age in
MONT
HS for
children
<5yrs
and
YEARS
for
those ≥
5
years’s)
Chil
ds
age
verifi
ed
by
1=He
alth
card
2=Bir
th
certifi
cate/
notifi
cation
Sex
1=
Male
2=
Fem
ale
If
between
3 and 18
years
old, Is
the child
attendin
g school?
1 = Yes
2 = No
(If yes go
to 2.8; If
no go t o
2.7)
Main
reason
for not
attendi
ng
school
(Enter
one
code
from
list)
1=Chro
nic
Sickness
2=Weat
her
(rain,
2.7a,
What
is the
child
doing
when
not in
school
?
1=Wor
king on
family
farm
2=Herd
ing
Livesto
ck
What
is the
highes
t level
of
educat
ion
attain
ed?(le
vel
compl
eted)
From
5 yrs
and
above
1 =Pre
primary
If the
househ
old
owns
mosqui
to
net/s,
who
slept
under
the
mosqui
to net
last
night?
(Probe-
enter all
response
s
mentione
d (Use 1
if “Yes”
Ye
ars
Mo
nths

Page 40 of 61
3=Ba
ptism
card
4=Re
call
5.
other
____
____
specif
y
floods,
storms)
3=Famil
y labour
responsi
bilities
4=Work
ing
outside
home
5=Teach
er
absentee
ism/lack
of
teachers
6= Fees
or costs
7=Hous
ehold
doesn’t
see
value of
schoolin
g
8 =No
food in
the
schools
9 =
Migrated
/ moved
from
school
area
(includin
g
displace
ments)
3=Wor
king for
paymen
t away
from
home
4=Left
home
for
elsewh
ere
5=Chil
d living
on the
street
6:
Other
specify
_____
_____
2=
Primary
3=Seco
ndary
4=Terti
ary
5=
None
6=othe
rs(speci
fy)
Go to
questio
n to 2.9
↓
2 if “No
and 3 if
not
applicabl
e) go to
question
2.11

Page 41 of 61
10=Inse
curity/vi
olence
11-No
school
Near by
12=Marr
ied
13.
Pregnant
/ taking
care of
her own
child
13=othe
rs
(specify)
………
………
…..
< 5
YRS
1
2
3
4
>5 TO
<18
YRS
5
6
7
8
9
10
11
12
13
Page 42 of 61
ADUL
T (18
years
and
above)
14)
15
16
2.9 How many mosquito nets does this household have? ____________________ (Indicate no.)
go to question 2.10 before proceeding to question 2.11
2.1
1
Main Occupation of the Household
Head – HH.
(enter code from list)
1=Livestock herding
2=Own farm labour
3=Employed (salaried)
4=Waged labour (Casual)
5=Petty trade
6=Merchant/trader
7=Firewood/charcoal
8=Fishing
9= Income earned by children
10=Others (Specify)
|____|
2.12. What is the main current source of income of the
household?
1. =No income
2. = Sale of livestock
3. = Sale of livestock products
4. = Sale of crops
5. = Petty trading e.g. sale of firewood
6. =Casual labor
7. =Permanent job
8. = Sale of personal assets
9. = Remittance
10. Other-Specify |____|
2.1
3
Marital status of the respondent
1. = Married
2. = Single
3. = Widowed
4. = separated
5. = Divorced.
|____|
2.14. What is the residency status of the household?
1. IDP
2.Refugee
3. Resident |____|
2.1
5
Are there children who have come to live
with you recently?
1. YES
2. NO
2.15b If yes, why did the child/children come to live with you?

Page 43 of 61
1= Did not have access to food
2=Father and Mother left home
3=Child was living on the street,
4=Care giver died
5= Other specify
______________________________________________
__

Page 44 of 61
Fever with
Malaria:
High
temperature
with shivering
Cough/ARI: Any
episode with
severe, persistent
cough or difficulty
breathing
Watery
diarrhoea: Any
episode of three or
more watery stools
per day
Bloody diarrhoea:
Any episode of three
or more stools with
blood per day
3. 4. 5. CHILD HEALTH AND NUTRITION (ONLY FOR CHILDREN 6-59 MONTHS OF AGE; IF N/A SKIP TO
SECTION 3.6)
Instructions: The caregiver of the child should be the main respondent for this section
3.1 CHILD ANTHROPOMETRY 3.2 and 3.3 CHILD MORBIDITY
(Please fill in ALL REQUIRED details below. Maintain the same child number as part 2)
A
Chi
ld
No.
B C D E F G H I J K 3.2 a 3.2 b 3.3 a 3.3 b 3.3 c
what is
the
relation
ship of
the
respond
ent with
the
child/chi
ldren
1=Mothe
r
SEX
Female
…...F
Male
…..….
M
Exact
Birth
Date
Age
in
mont
hs
Weig
ht
(KG)
XX.X
Heig
ht
(CM
)
XX.
X
Oede
ma
Y=
Yes
N=
No
MUA
C
(cm)
XX.X
Is the
child
in any
nutriti
on
progra
m
1. Ye
s
2. No
If yes
to
questi
on J.
which
nutrit
ion
progr
am?
1.OT
P
Has
your
child
(NAME
) been
ill in
the
past
two
weeks?
If YES,
which
illness
(multiple
responses
possible)
1 = Fever
with chills
like malaria
When the
child was
sick did you
seek
assistance?
1.Yes
2. No
If the
response is
yes to
question #
3.2 where
did you
seek
assistance?
(More than
one
response
possible-
If the child had
watery
diarrhoea in
the last TWO
(2) WEEKS,
did the child
get:
1. ORS
2. Zinc
supplement
ation?

Page 45 of 61
2=Father
3=Sibling
4=Grand
mother
5=Other
(specify)
If no
skip to
questi
ons
3.2
2.SFP
3.BSF
P
Othe
r
Specif
y
____
__
1.Yes
2. No
If No,
skip to
3.4
2 = ARI
/Cough
3 =
Watery
diarrhoea
4 = Bloody
diarrhoea
5 = Other
(specify)
See case
definitions
above
1. Traditional
healer
2.Communit
y health
worker
3. Private
clinic/
pharmacy
4. Shop/kiosk
5.Public clinic
6. Mobile
clinic
7. Relative or
friend
8. Local
herbs
9.NGO/FBO
Show sample
and probe
further for this
component
check the
remaining
drugs(confirm
from mother
child booklet)
01
02
03
04

Page 46 of 61
3.4 Maintain the same child number as part 2 and 3.1 above
A1 A2 B C D E F G H I
Child
No.
How
many
times
has
child
received
Vitamin
A
in the
past
year?
(show
sample)
Has the
child
received
vitamin A
suppleme
nt in the
past 6
months?
How
many
times
did the
child
receive
vitamin A
capsules
from the
facility or
out reach
If
Vitamin
A
received
how
many
times in
the past
one year
did the
child
receive
verified
by
Card?
FOR
CHILD
REN
12-59
MONT
HS
How
many
times
has
child
received
drugs for
worms
in the
past
year?
(show
Sample)
Has the
child
received
BCG
vaccination
?
Check for
BCG scar.
1 = scar
2=No
scar
Has child
received
OPV1
vaccination
1=Yes,
Card
2=Yes,
Recall
3 = No
4 = Do not
know
Has child
received
OPV3
vaccination?
1=Yes,
Card
2=Yes,
Recall
3 = No
4 = Do not
know
Has child
received
measles
vaccination
at 9
months
(On the
upper right
shoulder)?
1=Yes,
Card
2=Yes,
Recall
3 = No
4 = Do
not know
Has child
received
the second
measles
vaccination
(18 to 59
months )
(On the
upper right
shoulder)?
1=Yes,
Card
2=Yes,
Recall
3 = No
4 = Do
not know
Page 47 of 61
01
02
03
04
3.5 MNP Programme Coverage. Maintain the same child number as part 2 and 3.1 above. Ask all the relevant questions
(3.5.1 to 3.6.4) before moving on to fill responses for the next child. THIS SECTION SHOULD ONLY BE ADMINISTERED IF MNP
PROGRAM IS BEING IMPLEMENTED OR HAS BEEN IMPLEMENTED

Page 48 of 61
3.5 Enrolment in an MNP program 3.6 Consumption of MNPs
3.5.1.
Is the child enrolled in
the MNP
program?(show the
example of the MNP
sachet)
(record the code in
the respective child’s
number)
Yes =1
No=0
If no go to 3.5.2,
If yes go to section
3.6.1
3.5.2
If the child, 6-23months, is
not enrolled for MNP, give
reason. (Multiple answers
possible. Record the
code/codes in the
respective child’s number.
DO NOT READ the
answers)
Do not know about MNPs
….......………1
Discouraged from what I
heard from others
……...........................................
...2
The child has not fallen ill,
so have not gone to the
health facility ….
….....…..3
Health facility or outreach
is far ….....…4
3.6.1
Has the
child
consumed
MNPs in
the last 7
days?(show
s the MNP
sachet)
(record
the code
in the
respective
child’s
number)
YES = 1
N0= 0
If no skip
to 3.6.3
3.6.2
If yes, how frequent
do you give MNP to
your child? (record
the code in the
respective child’s
number)
Every day
……..........……….1
Every other day
........….……..2
Every third day
……......……..3
2 days per week at
any day ....4
Any day when I
remember..…5
3.6.3
If no, since when
did you stop
feeding MNPs to
your child?
(record the code
in the respective
child’s number)
1 week to 2 weeks
ago ....1
2 week to 1
month ago ....2
More than 1
month ..........3
3.6.4
What are the reasons
to stop feeding your
child with MNPs?
(Multiple answers
possible. Record the
code/codes in the
respective child’s
number. DO NOT
READ the answers)
Finished all of the
sachets .............1
Child did not like it
.......................2
Husband did not agree
to give to the child
..................3
Sachet got damaged
………….4

Page 49 of 61
Ch ild receiving therapeutic
or supplementary foods
..............................5
Other reason, specify
...…….....……….6
Skip to 3.7
Child had diarrhea after
being given vitamin and
mineral powder ……..5
Child fell
sick.......................6
Forgot
…………………….…..
7
Child enrolled in IMAM
program …8
Other
(Specify)___________
___ ..9
Chil
d 1
Chil
d 2

Page 50 of 61
Chil
d 3
Chil
d 4

Page 51 of 61
MATERNAL NUTRITION FOR WOMEN OF REPRODUCTIVE AGE (15-49 YEARS)(Please
insert appropriate number in the box)
3.7 3.8 3.9 3.10 3.11
Woman ID.
(all women in
the HH aged 15-
49 years from
the household
demographics –
section 2 )
What is the mother’s
/ caretaker’s
physiological status
1. Pregnant
2. Lactating
3. not pregnant
and not
lactating
4. Pregnant and
lactating
Mother/
caretaker’s
MUAC
reading:
____.__cm
During the pregnancy
of the (name of the
youngest biological
child below 24
months) did you take
the following
supplements?
indicate
1. Yes
2. No
3. Don’t know
4. N/A
If Yes, for how
many days did you
take?
(probe and
approximate the
number of days)
Iron
tabl
ets
syru
p
Folic
acid
Combi
ned
iron
and
folic
acid
supple
ments
Iron
table
ts
syru
p
Fol
ic
aci
d
Combi
ned
iron
and
folic
acid
supple
ments
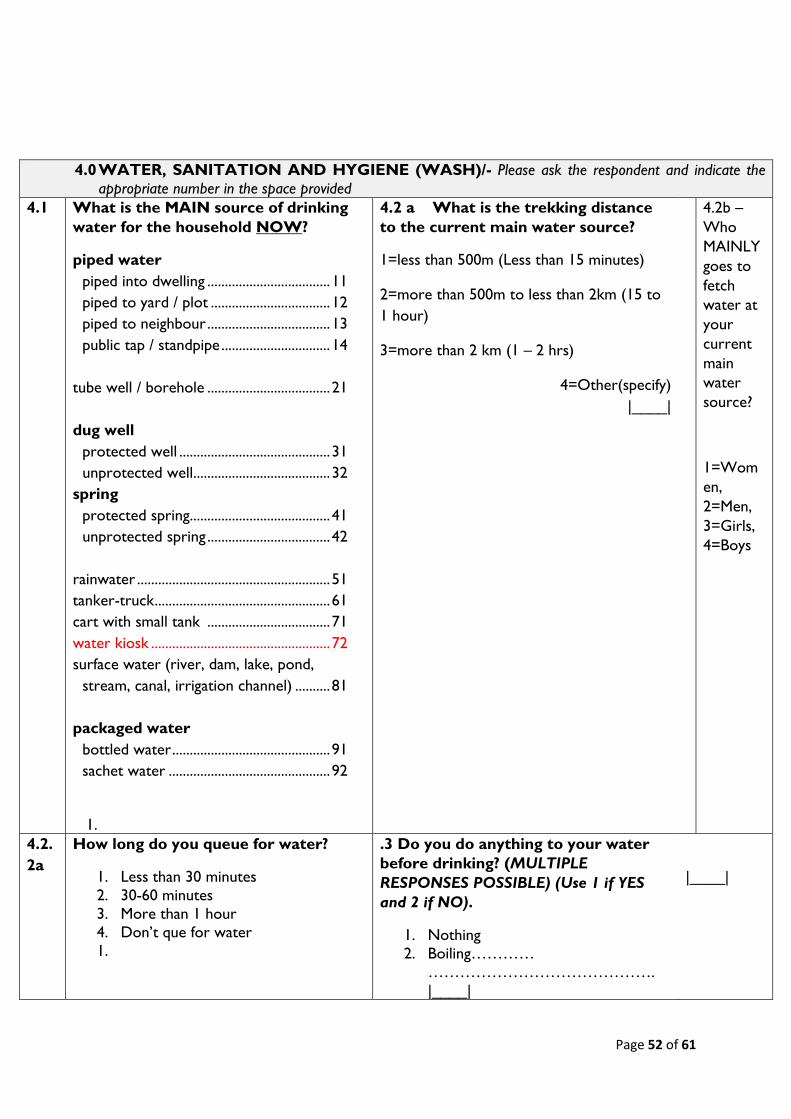
Page 52 of 61
4.0 WATER, SANITATION AND HYGIENE (WASH)/- Please ask the respondent and indicate the
appropriate number in the space provided
4.1 What is the MAIN source of drinking
water for the household NOW?
piped water
piped into dwelling ................................... 11
piped to yard / plot .................................. 12
piped to neighbour ................................... 13
public tap / standpipe ............................... 14
tube well / borehole ................................... 21
dug well
protected well ........................................... 31
unprotected well ....................................... 32
spring
protected spring........................................ 41
unprotected spring ................................... 42
rainwater ....................................................... 51
tanker-truck .................................................. 61
cart with small tank ................................... 71
water kiosk ................................................... 72
surface water (river, dam, lake, pond,
stream, canal, irrigation channel) .......... 81
packaged water
bottled water ............................................. 91
sachet water .............................................. 92
1.
4.2 a What is the trekking distance
to the current main water source?
1=less than 500m (Less than 15 minutes)
2=more than 500m to less than 2km (15 to
1 hour)
3=more than 2 km (1 – 2 hrs)
4=Other(specify)
|____|
4.2b –
Who
MAINLY
goes to
fetch
water at
your
current
main
water
source?
1=Wom
en,
2=Men,
3=Girls,
4=Boys
4.2.
2a
How long do you queue for water?
1. Less than 30 minutes
2. 30-60 minutes
3. More than 1 hour
4. Don’t que for water
1.
.3 Do you do anything to your water
before drinking? (MULTIPLE
RESPONSES POSSIBLE) (Use 1 if YES
and 2 if NO).
1. Nothing
2. Boiling…………
…………………………………….
|____|
|____|

Page 53 of 61
3. Chemicals
(Chlorine,Pur,Waterguard)……………
|____|
4. Traditional
herb…………………………………
…... |____|
5. Pot
filters………………………………
…………….. |____|
5.
4.3a
|____|
6.
4.4 Where do you store water for
drinking?
1. Open container / Jerrican
2. Closed container / Jerrican
|____|
4.5 How much water did your household use
YESTERDAY (excluding for animals)?
(Ask the question in the number of 20 liter Jerrican and
convert to liters & write down the total quantity used in
liters)
|____|
4.6 Do you pay for water?
1. Yes
2. No (If No skip to Question
4.7.1) |____|
4.6.1 If yes, how much
per 20 liters jerrican
_________ KSh/20ltrs
4.6.2 If paid
per month how
much |____|
4.7.
1a
We would like to learn about where
members of this household wash their
hands.
Can you please show me where members of
your household most often wash their
hands?
Record result and observation.
OBSERVED
FIXED FACILITY OBSERVED (SINK / TAP)
IN DWELLING ............................................... 1
IN YARD /PLOT ............................................. 2
MOBILE OBJECT OBSERVED
4.7.1b Is soap or detergent or ash/mud/sand
present at the place for handwashing?
YES, PRESENT ............................................ 1
NO, NOT PRESENT ... ……………………2
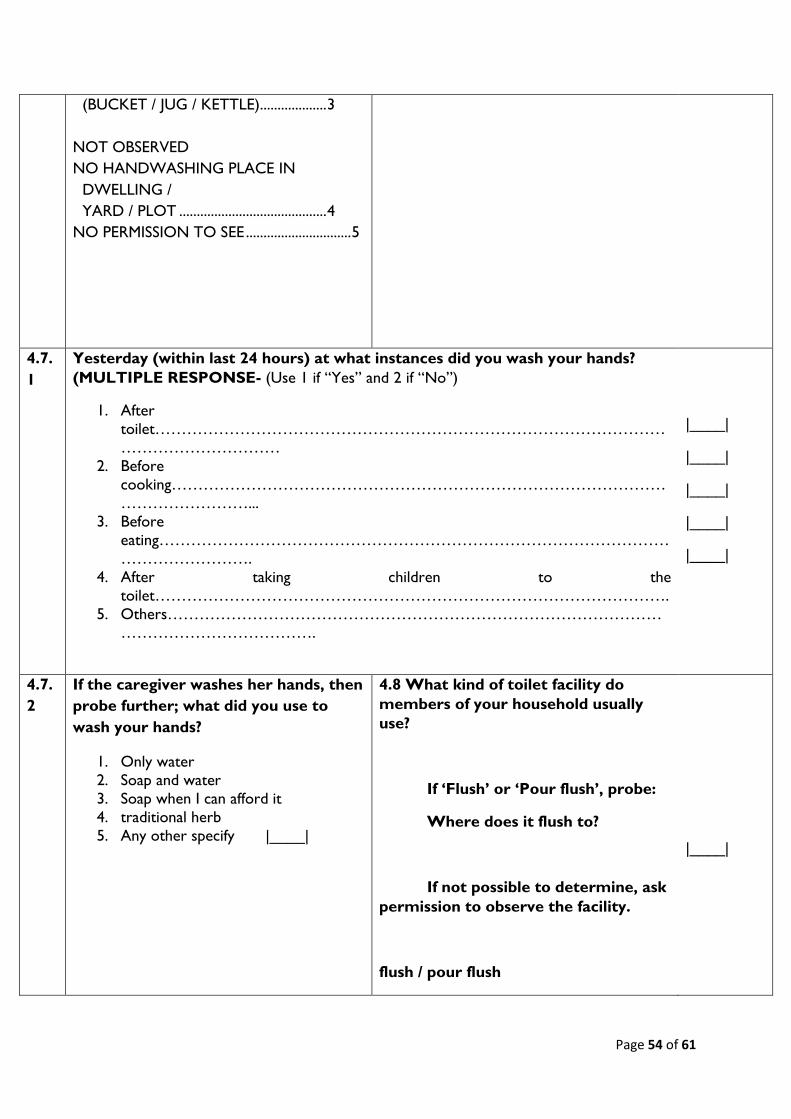
Page 54 of 61
(BUCKET / JUG / KETTLE) ................... 3
NOT OBSERVED
NO HANDWASHING PLACE IN
DWELLING /
YARD / PLOT .......................................... 4
NO PERMISSION TO SEE .............................. 5
4.7.
1
Yesterday (within last 24 hours) at what instances did you wash your hands?
(MULTIPLE RESPONSE- (Use 1 if “Yes” and 2 if “No”)
1. After
toilet……………………………………………………………………………………
…………………………
2. Before
cooking…………………………………………………………………………………
……………………...
3. Before
eating……………………………………………………………………………………
…………………….
4. After taking children to the
toilet…………………………………………………………………………………….
5. Others…………………………………………………………………………………
……………………………….
|____|
|____|
|____|
|____|
|____|
4.7.
2
If the caregiver washes her hands, then
probe further; what did you use to
wash your hands?
1. Only water
2. Soap and water
3. Soap when I can afford it
4. traditional herb
5. Any other specify |____|
4.8 What kind of toilet facility do
members of your household usually
use?
If ‘Flush’ or ‘Pour flush’, probe:
Where does it flush to?
If not possible to determine, ask
permission to observe the facility.
flush / pour flush
|____|

Page 55 of 61
flush to piped sewer system
11
flush to septic tank 12
flush to pit latrine 13
flush to open drain 14
flush to DK where 18
pit latrine
ventilated improved pit
latrine 21
pit latrine with slab 22
pit latrine without slab /
open pit 23
composting toilet 31
bucket 41
hanging toilet /
hanging latrine 51
no facility / bush / field 95
1. OTHER (specify) 96

Page 56 of 61
5.0: Food frequency and Household Dietary Diversity
*Type of food* Did members of
your household
consume any
food from these
food groups in
the last 7
days?(food must
have been
cooked/served at the
household)
0-No
1-Yes
If yes, mark days the food was consumed in
the last 7 days?
0-No
1-Yes
What was the
main source of
the dominant
food item
consumed in the
HHD?
1.Own
production
2.Purchase
3.Gifts from
friends/familie
s
4.Food aid
5.Traded or
Bartered
6.Borrowed
7.Gathering/w
ild fruits
8.Other
(specify)
WOMEN DIETARY
DIVERSITY
ONLY FOR WOMEN AGE
15 TO 49 YEARS. REFER
TO THE HOUSEHOLD
DEMOGRAPHICS
SECTION Q2.3 AND Q2.5
Please describe the foods
that you ate or drank
yesterday during day and
night at home or outside
the home (start with the
first food or drink of the
morning)
0-No
1-Yes
D1 D2 D 3 D 4 D5 D 6 D7 TOT
AL
Wom
an
ID…
……
Wom
an
ID…
…..
Wom
an ID
…….
Wom
an
ID…
…..

Page 57 of 61
5.1. Cereals and cereal
products (e.g. sorghum,
maize, spaghetti, pasta,
anjera, bread)?
5.2. Vitamin A rich
vegetables and tubers:
Pumpkins, carrots,
orange sweet
potatoes
5.3. White tubers and
roots: White
potatoes, white yams,
cassava, or foods
made from roots
5.4 Dark green leafy
vegetables: Dark
green leafy
vegetables, including
wild ones + locally
available vitamin A rich leaves such as
cassava leaves etc.
5.5 Other vegetables
(e.g., tomatoes, egg
plant, onions)?
5.6. Vitamin A rich fruits:
+ other locally
available vitamin A
rich fruits
5.7 Other fruits

Page 58 of 61
5.8 Organ meat (iron
rich): Liver, kidney,
heart or other organ
meats or blood based
foods
5.9. Flesh meats and offals:
Meat, poultry, offal
(e.g. goat/camel meat,
beef; chicken/poultry)?
5.10 Eggs?
5.11 Fish: Fresh or
dries fish or shellfish
5.12 Pulses/legumes,
nuts (e.g. beans, lentils, green grams, cowpeas)?
5.13 Milk and milk
products (e.g.
goat/camel/ fermented
milk, milk powder)?
5.14 Oils/fats (e.g.
cooking fat or oil,
butter, ghee,
margarine)?
5.15 Sweets: Sugar,
honey, sweetened
soda or sugary foods
such as chocolates,
sweets or candies
5.16 Condiments,
spices and beverages:

Page 59 of 61
4.1 FOOD FORTIFICATION (FF)/- Please ask the respondent and indicate the appropriate number
in the space provided
1.1
Have you heard about food fortification?
1. Yes
2. No
3. Don’t know
If yes, where did you hear or learn about it? (MULTIPLE RESPONSE ARE
POSSIBLE- (Use 1 if “Yes” and 2 if “No”)
6. Radio……………………………………………………………………………
…………………………………
7. Road
show……………………………………………………………………………
…………………………...
|____|
|____|
6. COPING STRATEGIES INDEX
Frequency score:
Number of days out of the past seven (0
-7).
In the past 7 DAYS, have there been times when you did not have enough food or money to
buy food?
If No; END THE INTERVIEW AND THANK THE RESPONDENT
If YES, how often has your household had to: (INDICATE THE SCORE IN THE SPACE PROVIDED)
1 Rely on less preferred and less expensive foods?
2 Borrow food, or rely on help from a friend or relative?
3 Limit portion size at mealtimes?
4 Restrict consumption by adults in order for small children to eat?
5 Reduce number of meals eaten in a day?
TOTAL HOUSEHOLD SCORE:
END THE INTERVIEW AND THANK THE RESPONDENT

Page 60 of 61
1.1.
1
8. In a training session
attended…………………………………………………………………………
………….
9. On a TV
show……………………………………………………………………………
……….
10. Others…………………………………………………………………………
……………………………………….
|____|
|____|
|____|
1.2 Respondent’s knowledge on the food
fortification logo (Show the food
fortification logo to the respondent and
record the response). Do you know about
this sign?
1. Yes
2. No
3. Don’t know
|____|
1.3 What is the MAIN source of Maize flour
for the household NOW?
2. Bought from the shops, supermarket e.t.c
3. Maize is taken for milling at a nearby Posho
Mill
4. Bought from a nearby Posho Mill
5. Other (Please specify)
|______________________________|
1.1b Do you know if the
maize flour you consume is
fortified or not?
1. Yes
2. No
3. Don’t know
1.4 What brands of the following foods does
your household consume?
1. Maize flour
2. Wheat flour
3. Margarine
4. Oils
5. Fats
6. Sugar
|________________________
________|
|________________________
________|
|________________________
________|

Page 61 of 61
|________________________
________|
|________________________
________|
|________________________
________|