barge transportati on · pdf filebarge transportati on. 369 chapter 12: barge transportation...
TRANSCRIPT
Chap
ter
12
Barge Transportati on
369
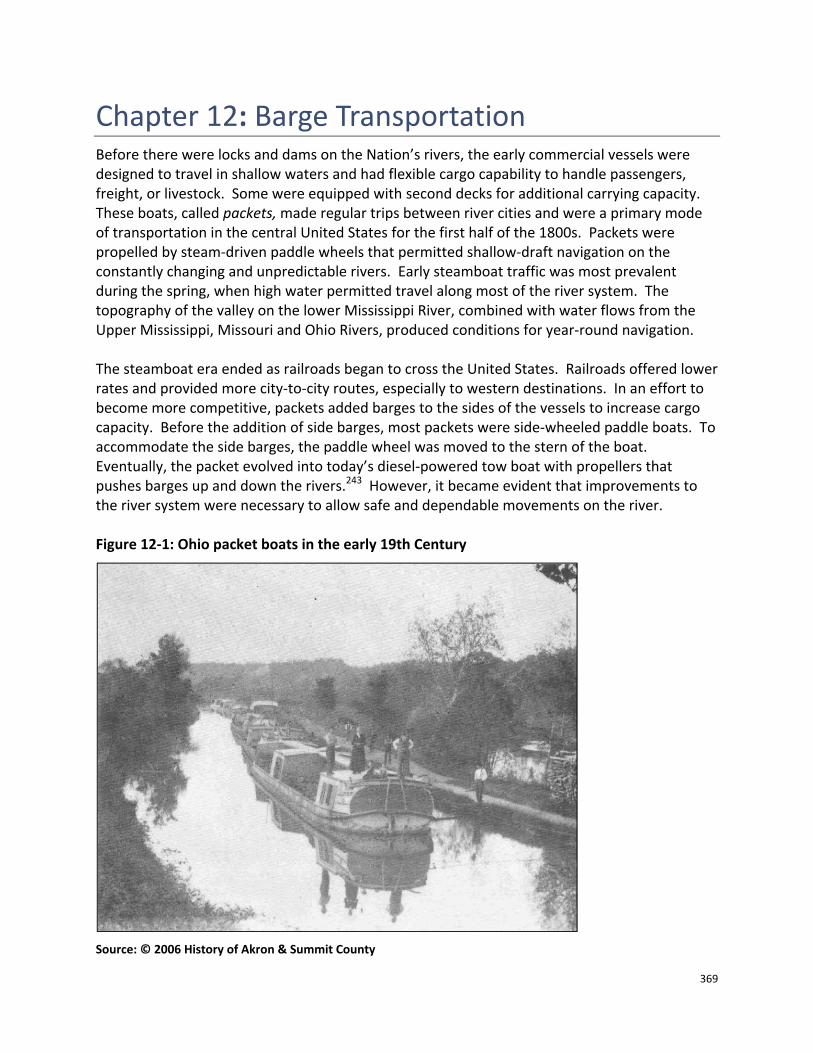
Chapter 12: Barge Transportation Before there were locks and dams on the Nation’s rivers, the early commercial vessels were designed to travel in shallow waters and had flexible cargo capability to handle passengers, freight, or livestock. Some were equipped with second decks for additional carrying capacity. These boats, called packets, made regular trips between river cities and were a primary mode of transportation in the central United States for the first half of the 1800s. Packets were propelled by steam-driven paddle wheels that permitted shallow-draft navigation on the constantly changing and unpredictable rivers. Early steamboat traffic was most prevalent during the spring, when high water permitted travel along most of the river system. The topography of the valley on the lower Mississippi River, combined with water flows from the Upper Mississippi, Missouri and Ohio Rivers, produced conditions for year-round navigation. The steamboat era ended as railroads began to cross the United States. Railroads offered lower rates and provided more city-to-city routes, especially to western destinations. In an effort to become more competitive, packets added barges to the sides of the vessels to increase cargo capacity. Before the addition of side barges, most packets were side-wheeled paddle boats. To accommodate the side barges, the paddle wheel was moved to the stern of the boat. Eventually, the packet evolved into today’s diesel-powered tow boat with propellers that pushes barges up and down the rivers.243 However, it became evident that improvements to the river system were necessary to allow safe and dependable movements on the river. Figure 12-1: Ohio packet boats in the early 19th Century
Source: © 2006 History of Akron & Summit County

370
As early as the 1830s, the Federal Government began making navigation improvements to the rivers. In the early years, improvements were limited to the removal of river hazards, such as submerged rocks, shoals, and sandbars. In 1878, Congress authorized a 4½-foot deep channel with canals and locks that allowed boats to bypass rapids and other obstructions. In 1907, Congress authorized an increase in the channel depth to 6 feet. This increase was accomplished by the construction of hundreds of wing dams that extend from the shore to force the flow of the river towards the main navigation channel during low water. Finally, in 1930, Congress authorized the U.S. Army Corps of Engineers (Corps) to construct and maintain a navigation channel 9 feet deep with a minimum width of 400 feet. Passage of this authorization marked the beginning of a massive dam-building program that built the 29 locks on the Upper Mississippi River and 8 locks on the Illinois River. The lock farthest downriver on the Mississippi is near St. Louis. There are no locks between St. Louis and New Orleans. There are also four locks on the Columbia River and four locks on the Snake River. The original purpose of the Federal involvement in inland navigation was to assist in the development of the frontier. Today, the Federal government’s role stems from an interest in helping to facilitate commercial navigation by providing safe, reliable, highly cost-effective, and environmentally sustainable waterborne transportation systems.244 The Federal agencies most directly involved in the development and operation of the Nation’s navigation system are the U.S. Army Corps of Engineers, the U.S. Department of Transportation (DOT), the Department of Homeland Security (DHS), and the Department of Commerce (DOC). The DHS, through the U.S. Coast Guard, has responsibility for vessel and navigation safety and provides navigation aids and search and rescue services. DOT’s Maritime Administration supports the development of U.S. ports, intermodal systems, and domestic shipping, and DOT’s St. Lawrence Seaway Development Corporation supports the operation of that waterway in partnership with Canadian authorities. DOC’s National Oceanic and Atmospheric Administration provides surveys, tidal information, and coastal charts.
371
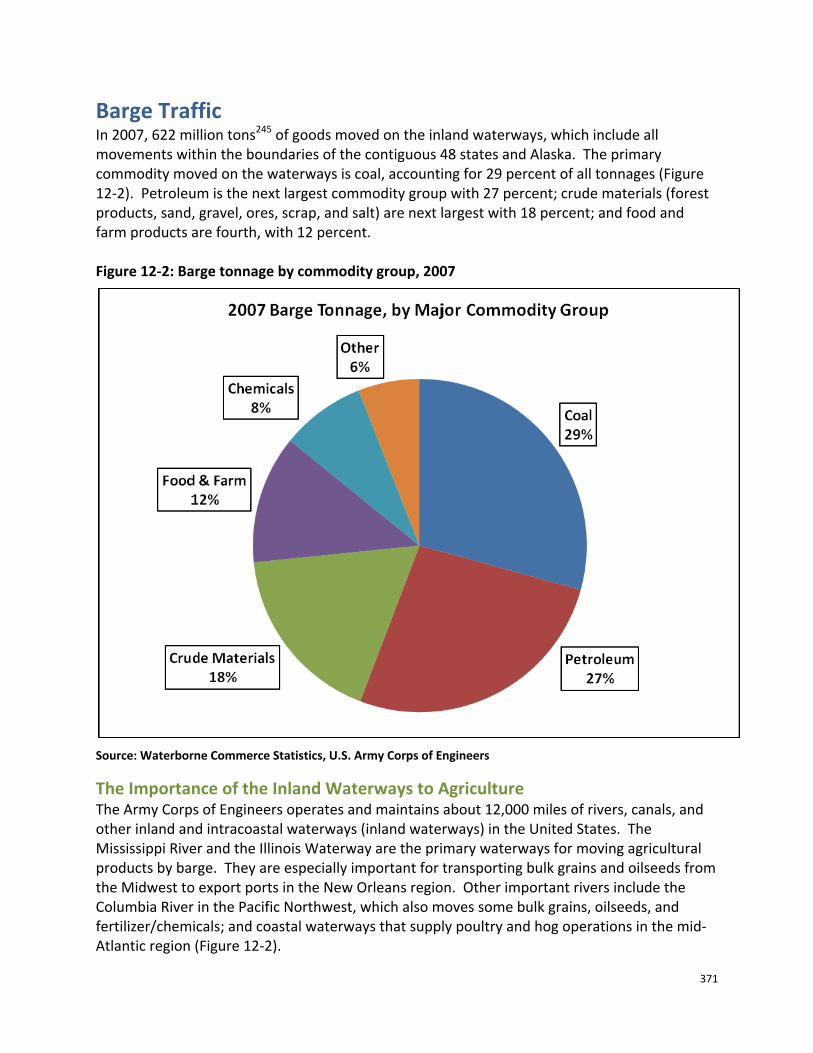
Barge Traffic In 2007, 622 million tons245 of goods moved on the inland waterways, which include all movements within the boundaries of the contiguous 48 states and Alaska. The primary commodity moved on the waterways is coal, accounting for 29 percent of all tonnages (Figure 12-2). Petroleum is the next largest commodity group with 27 percent; crude materials (forest products, sand, gravel, ores, scrap, and salt) are next largest with 18 percent; and food and farm products are fourth, with 12 percent. Figure 12-2: Barge tonnage by commodity group, 2007
Source: Waterborne Commerce Statistics, U.S. Army Corps of Engineers
The Importance of the Inland Waterways to Agriculture The Army Corps of Engineers operates and maintains about 12,000 miles of rivers, canals, and other inland and intracoastal waterways (inland waterways) in the United States. The Mississippi River and the Illinois Waterway are the primary waterways for moving agricultural products by barge. They are especially important for transporting bulk grains and oilseeds from the Midwest to export ports in the New Orleans region. Other important rivers include the Columbia River in the Pacific Northwest, which also moves some bulk grains, oilseeds, and fertilizer/chemicals; and coastal waterways that supply poultry and hog operations in the mid-Atlantic region (Figure 12-2).

372
Across the inland waterways, there are 191 active lock sites with 237 lock chambers. Some locks are equipped with more than one chamber, adding more capacity to that site. In 2006-2008 the Ohio River carried 18 percent of southbound grain barge movements through the locking portion of the river system, the Upper Mississippi River 76 percent and the Arkansas River the remaining 6 percent. Barges have a 9 percent share of agricultural tonnages and a 12 percent share of agricultural ton-miles—most of which is accounted for by movements of grain, animal feed, and fertilizers on the Mississippi River and its tributaries. A complete discussion of the importance of the inland waterways to agriculture can be found in Chapter 2: The Importance of Freight Transportation to Agriculture. Figure 12-3: Agriculturally-significant waterways
Source: AMS
373
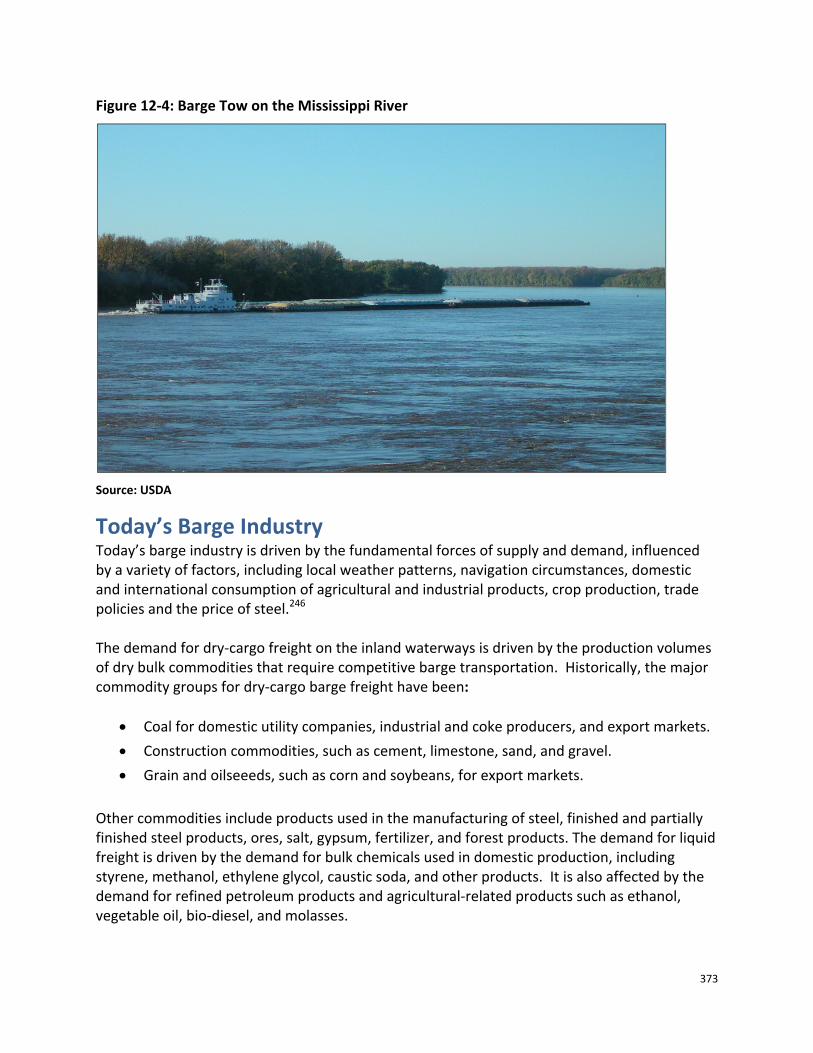
Figure 12-4: Barge Tow on the Mississippi River
Source: USDA
Today’s Barge Industry Today’s barge industry is driven by the fundamental forces of supply and demand, influenced by a variety of factors, including local weather patterns, navigation circumstances, domestic and international consumption of agricultural and industrial products, crop production, trade policies and the price of steel.246 The demand for dry-cargo freight on the inland waterways is driven by the production volumes of dry bulk commodities that require competitive barge transportation. Historically, the major commodity groups for dry-cargo barge freight have been:
• Coal for domestic utility companies, industrial and coke producers, and export markets.
• Construction commodities, such as cement, limestone, sand, and gravel.
• Grain and oilseeeds, such as corn and soybeans, for export markets.
Other commodities include products used in the manufacturing of steel, finished and partially finished steel products, ores, salt, gypsum, fertilizer, and forest products. The demand for liquid freight is driven by the demand for bulk chemicals used in domestic production, including styrene, methanol, ethylene glycol, caustic soda, and other products. It is also affected by the demand for refined petroleum products and agricultural-related products such as ethanol, vegetable oil, bio-diesel, and molasses.

374
Freight rates in both the dry and liquid freight markets are a function of the relationship between the demand for these commodities and the supply of barges available at any given point in time.
U.S. Grain and Tank Barge Fleet According to the Corps publication Waterborne Transportation Lines of the United States,247 there were 32,211 non-self propelled vessels (barges of all categories) on the inland waterways in 2006. Of this number, 13,062 were covered barges, which haul most of the grain. About 36 percent of the covered barges were greater than 25 years old. The average economic useful life of a dry cargo barge is generally estimated to be between 25 and 30 years. There were 8,673 open barges, which are mostly used for coal, and 4,250 tank barges, which carry liquids. Of all non-self propelled vessels, 86 percent operated on the Mississippi River System and connecting waterways, 14 percent in the Atlantic and Pacific regions, and less than 1 percent on the Great Lakes. Informa Economics—which annually surveys the barge industry—reports that from 1998 to 2008, the covered barge fleet size for the Mississippi River System was reduced from 12,706 to 10,727 barges, an 18 percent reduction.248 When fewer barges are available, carrying capacity is lower and competition becomes more intense for available barge transportation. Table 12-1 shows the five largest barge companies own or operate about 75 percent of the grain barges. The eight largest own or operate 88 percent of the grain barges. Informa estimates that 28 companies own or operate barges capable of hauling grain.
Barge Counts The Informa Economics annual survey of the barge fleet looks at the number of barges that are operated by individual companies; the Corps barge fleet data tracks vessel ownership. Some barge companies lease, rather than own, their equipment, so the number of barges reported differs between the Corps and Informa. Leased barges often are owned by a financial institution and not counted as belonging to a barge operator.

375
Table 12-1: Covered barges on the Mississippi River system, by operator, 2008
NumberPercent of Total Fleet
Cumulative Total
Average Age
(years)
American River Transportation Co.249
2,034 19.0% 19.0% 25.0
American Commercial Lines, LLC 1,873 17.5% 36.4% 19.4
Ingram Barge Lines 1,816 16.9% 53.4% 10.4
AEP River Operations 1,477 13.8% 67.1% 13.5
Cargill Marine and Terminal, Inc. 829 7.7% 74.8% 15.0
SCF Marine, Inc 626 5.8% 80.7% 6.8
Bunge North America 457 4.3% 84.9% 22.2
Alter Barge Line, Inc. 332 3.1% 88.0% 8.2
Total Major Operators 9,444 88.0% 16.5
All others 1,283 12.0% 11.6
Total 10,727 100.0% 15.9
Source: Barge Fleet Profile, Informa Economics, March 2009. A grain barge is typically 195 or 200 feet long by 35 feet wide, with a draft of 9 feet. An average barge holds 1,500 tons of grain. The barge is covered by removable sections that protect the cargo from damage during transit, and are removed during loading and unloading. One barge holds as much as 15 railcars or 58 semi-trailers of grain. A tow is a group of barges pushed by a towboat. On the section of the Mississippi River with locks, tows typically consist of 15 barges, grouped 3 abreast by 5 barges long. On the lower Mississippi River, where there are no locks and the river is larger, tows can consist of 30 to 40 barges pushed by one towboat. Movements on this larger scale increase the efficiency of barge movements.

376
Figure 12-5: Grain barge being loaded.
Source: USDA
Barge Rates Grain barge rates have changed significantly during the last several years. The size of the barge fleet at any given point in time can influence the rates. The number of new barges built each year reflects a response to anticipated levels of future supply and demand. After a period of sustained rate increases, the industry builds more new barges to take advantage of the strong rates. Barge building is also encouraged by investment credits that offer barge owners tax advantages. When tax advantages brought many new barges into the fleet in the early 1980’s, the surplus of barges depressed rates. Because barges are designed to last 25 to 30 years, the surplus period lasted a long time. However, as barges reached their life expectancy and were retired, they have not been replaced, causing rates to rise in recent years.
377
Barge rates can be volatile as they react to sudden increases in demand. Some shippers react to higher rates by postponing shipments until rates go down or choose to ship by an alternate mode. When there were surpluses of barges, any increase in demand was handled by the oversupply of equipment. Demand can also be boosted by crops being planted and harvested late because of bad weather, as occurred in 2008, continuing the volatility of the industry’s rate structure. However, most crops are first stored in the Midwest after harvest. Shippers generally will move the crops from there in stages over the course of the next year, by rail, barge, or truck to intermediate points and end users. As shown in Table 12-1, the barge market is highly concentrated. Barge operators are not price takers and no one company is considered a price leader. With only a few sellers of barge service for grain shippers, the market could be classified as an oligopoly, which implies imperfect competition. However, the barge industry is generally considered to be highly competitive—perhaps not as competitive as the truck industry, but more competitive than rail. Rates are determined by market conditions and no one company dominates the market. Theoretically, entry into the barge industry would require leasing or owning one barge and finding customers. However, success in the industry would likely require more than one barge and the operators would also need extensive industry knowledge and contacts to survive. In addition to the charge for freight movements, barge companies add charges for various services. For example, demurrage charges result when a barge is not loaded or unloaded within the agreed-upon time. Grain elevators typically have three days to load a barge and three days to unload it included in the contracted rate. If the grain elevator takes too long to use the barge, the barge operator requires some reimbursement because its barge is not being moved to the next customer. When this situation occurs, a demurrage charge, which is typically about $200 per day per barge, is applied to the final bill. Demurrage charges tend to be similar among barge companies across the industry. It is difficult to ascertain if this similarity is explicit or implicit among barge companies. However, past experience demonstrates that if a company raises demurrage charges too much, market dynamics kick in and bring the charges back into line with the rest of the industry. For example, in 2007, one of the major barge companies raised its demurrage charges in an effort to make more efficient use of their barge fleet. However, the immediate reaction by their customers was to avoid the higher demurrage charges by exclusively using other companies that had not raised demurrage charges. Eventually, the company dropped the increased demurrage charge to the same level as the rest of the industry. Barge operators on the Mississippi River System utilize a percent-of-tariff system to establish barge freight rates. The tariffs were originally set by the Bulk Grain and Grain Products Freight Tariff No. 7, which was issued by the Waterways Freight Bureau (WFB) of the Interstate Commerce Commission (ICC). In 1976, the United States Department of Justice entered into an agreement with the ICC that made Tariff No. 7 no longer applicable. Today, the WFB no longer exists and the ICC has become the Surface Transportation Board, which does not have jurisdiction over barge rates on the inland waterways. However, the barge industry continues to use the tariffs as benchmarks for rate units. To calculate the rate in dollars per ton, the

378
industry multiplies the percent of tariff rate by the 1976 benchmark. As an example, a 271 percent tariff for a St. Louis grain barge would equal 271 percent of the St. Louis benchmark rate of $3.99, or $10.81 per ton. Each river segment has its own bench mark, with the northernmost segments having the highest benchmarks. From 2004 to 2008, first quarter to second quarter rates decreased except for a slight increase in 2008 (Table 12-2). Rates for all years increased significantly from the second to the third quarter. For the fourth quarter, there were mixed outcomes, with decreases in 2006 and 2007. Over the past 5 years, grain barge rates have increased significantly and have trended up on a quarterly basis since 2004 (Figure 12-6). Table 12-2: Quarterly barge rates from St. Louis to New Orleans, 2004–2008250
1st Quarter
Jan–Mar 2nd Quarter
Apr–June 3rd Quarter
July–Sep 4th Quarter
Oct–Dec
2004 138 119 225 287
2005 261 186 409 474
2006 355 279 503 385
2007 240 218 557 348
2008 357 361 490 541
2009 289 198 271 -
5-year average 270 233 437 407
Source: AMS

379
Figure 12-6: Quarterly barge rates from St. Louis to New Orleans, 2004-08*
*Rates expressed as a percent of tariff. The St. Louis tariff is $3.99 per ton. Source: AMS During the 1990’s there was an ample supply of barges. Barge rates usually increase slightly in late winter and early spring when the Upper Mississippi River reopens after been closed in the winter and then dip until early summer (Figure 12-7). During the summer, rates gradually increase as old crop grain is sold to make room for the new crop. Rates peak during harvest time and then drop again toward the end of the year.
380
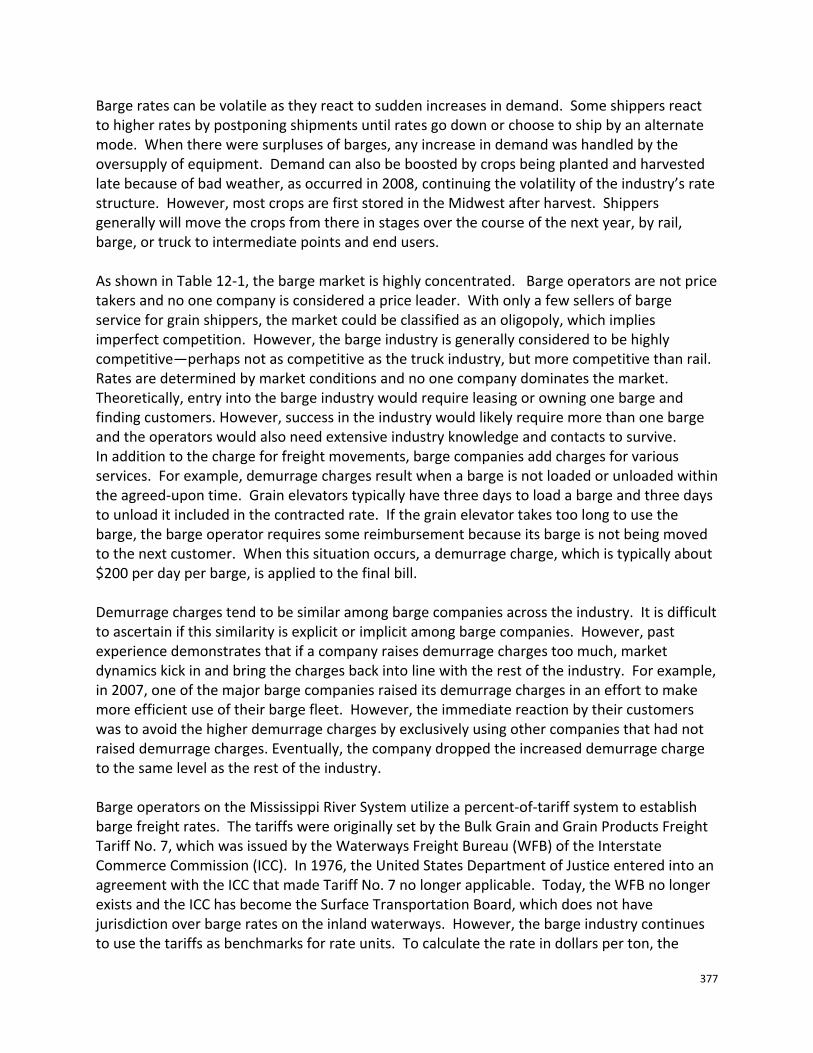
Figure 12-7: Weekly barge rates, St. Louis to New Orleans, 10-year average (1990-1999)*
*Rates expressed as a percent of tariff. The St. Louis tariff is $3.99 per ton. Source: AMS The beginning of the upward swing in barge rates started in fall 2004, due to a decrease in the barge fleet size and an increase in the demand to transport non-grain commodities on the waterways. Barge rates continued their increase the following year when Hurricane Katrina disrupted barge logistics in the third quarter of 2005. During the mid-2000s, barges began shipping large quantities of non-grain commodities, such as steel and cement. They could ship them up-river to manufacturing facilities in the interior of the country, generating additional revenue. The up-bound shipments spread the limited number of barges over a greater geographical area. With the barges out of position for loading grain, barge availability for grain shipments decreased, causing an upward pressure on barge rates. Historically, during the fourth quarter in any given year, barge rates can swing in either direction depending on export demand combined with the activity of non-grain commodities that compete with grain for barge capacity. Average quarterly grain barge rates from St. Louis to New Orleans for 2008 were consistently above the 4 year average as barge operators contended with a continuous string of navigation disruptions and pressing economic concerns (Table 12-6). Navigation was affected by flooding for much of the year, a July oil spill in New Orleans limited vessel movements, and two Gulf of Mexico hurricanes affected the industry in the third quarter. Barge shippers also had to deal with elevated commodity prices that limited economic opportunities. In addition, rates changed significantly every week. In 2008, the rate changed 100 points or more in 11 weeks. A more typical swing during a non-volatile period is 15 to 20 points per week.

381
Figure 12-8: Grain barge rates in 2008 above the 4-year average*
*Rates expressed as a percent of tariff. The St. Louis tariff is $3.99 per ton. Source: AMS Figure 12-9 shows a pattern beginning in 1994 of relatively stable rates for 10 years—fluctuating between 100 and 200 percent of tariff—and then a substantial increase from the mid-2000’s on. In the period from 2003 to 2008, at times, the barge rates exceeded 500 percent of tariff. During this period, the rates are characterized by dramatic swings from peak to valley, at times in excess of 300 percent of tariff. Since 2004, barge freight rates have been especially volatile as a reaction to high energy costs and competing uses for barge transportation. Rates began to decrease in 2009 and, by the end of second quarter, were about 200 percent of tariff, back in the upper end of the range that was prevalent in the mid-to-late 1990s. The 2009 decrease may result from the overall economic downturn affecting many industries and the smaller barge fleet adjusting to market conditions.
Figure 12-9: Quarterly barge rates from St. Louis to New Orleans, 1994-2009*
*Rates expressed as a percent of tariff. The St. Louis tariff is $3.99 per ton. Source: AMS

382
Barge Rates and Corn Basis in the Aftermath of Hurricane Katrina
The Mississippi Gulf port area depends on the Mississippi River for grain barge transportation. The cost of shipping corn increases when the river is impassable. With no barge transportation, demand for truck and rail services increases. The transportation system is fluid—when one mode is disrupted, the competitive pressure to keep the prices of other modes in line is disrupted by the high demand. When river traffic was halted by Hurricane Katrina, freight rates responded immediately—barge, rail, and truck rates surged. Barge rates spiked to more than 900 percent of tariff for grain shipped from St. Louis to New Orleans and averaged more than 500 for the remainder of 2005 (See Figure 12-10). Barge rates decreased subsequent to the recovery in the Gulf, but remained higher than the pre Katrina levels throughout most of 2006 because of higher fuel and labor costs.
High transportation costs also translated into lower farm level prices as evidenced by the drop in basis in the major production areas of the interior Midwest and a surge in the basis at the Gulf (Figure 12-11). Prior to the hurricanes, the weekly corn basis in Illinois was averaging 20 cents per bushel below the futures. It dropped to almost 40 cents per bushel after the hurricanes. At the same time, the export basis surged to almost 70 cents per bushel above the futures, indicating a strong export demand, and reflecting the higher transportation costs. By the end of 2005, transportation disruptions were resolved and both markets gradually returned to normal patterns. Figure 12-10: Spot barge rates, pre- & post-Katrina
Source: AMS Figure 12-11: Katrina corn basis impact in 2005
Source: AMS
0
200
400
600
800
1,000
1/7/
04
3/7/
04
5/7/
04
7/7/
04
9/7/
04
11/7
/04
1/7/
05
3/7/
05
5/7/
05
7/7/
05
9/7/
05
11/7
/05
1/7/
06
3/7/
06
5/7/
06
7/7/
06
Inde
x
St. Louis Spot Barge Rates (1/7/04-7/19/2006)
St. Louis Weekly Rate
St. Louis Average Rate
'04 Avg: Pre-Katrina
Last Half
'06 - Jul
-0.60
-0.40
-0.20
0.00
0.20
0.40
0.60
0.80
8/5/
05
8/12
/05
8/19
/05
8/26
/05
9/2/
05
9/9/
05
9/16
/05
9/23
/05
9/30
/05
10/7
/05
10/1
4/05
10/2
1/05
10/2
8/05
11/4
/05
11/1
1/05
11/1
8/05
11/2
5/05
12/2
/05
12/9
/05
12/1
6/05
12/2
3/05
$/bu
shel
Illinois (interior) Gulf (export)
HurricaneKatrina
8/29
Hurricane Rita9/24

383
Condition of the Nation’s Inland Waterways Commercial navigation is one of the three main missions* of the Corps civil works program.251 The Corps supports commercial navigation on the inland waterways through locks, dams, developed channels, and other features. Although much attention has been drawn to the age of the locks and dams on the system, they are generally viewed as reliable for transportation. As locks age, however, their maintenance becomes more extensive and expensive. The investment to continue to maintain the locks and dams and other features that make barge transportation possible on these waterways is facing potential financial difficulties. Many agricultural interests are concerned over the current condition of the Nation’s waterways, especially the Upper Mississippi River and Illinois Waterway (UMR-IW). It is commonly thought that these locks have exceeded their design life. For example, the American Society of Civil Engineers (ASCE), which produces an annual Report Card for America's Infrastructure, said in 2009: “The average age of all federally owned or operated locks is nearly 60 years, well past their planned design life of 50 years.” Such statements are common, but misunderstand the nature and purpose of the Corps project planning process. The Corps designs and builds its locks and dams to last much longer than 50 years. However, these structures typically require significant rehabilitation about every 25 to 30 years depending on local operating conditions, such as degree of barge impact to gates and concrete and weather-related deterioration. The Corps, following 10 years of study, produced a report on the UMR-IW which said:
… the life of existing locks and dams and their components can be extended with normal periodic rehabilitation for another 50 years and match the design life of any new construction being considered as part of the “with project”† conditions.252
The Corps uses a 50-year period in planning a project, but only for purposes of the economic evaluation of a proposed water resources investment. The time frame for this economic analysis reflects the fact that the economic benefits and costs beyond 50 years generally are negligible when expressed in net present value terms, and therefore do not significantly affect the net return to the Nation from the proposed investment. In 2007, more than a third of our Nation’s corn exports and almost 17 percent of our soybean exports were barged to New Orleans from the UMR-IW. Agricultural interests are concerned that the lock capacity on the UMR-IW may not be able to adequately handle grain traffic in the
* The other two main missions of the civil works program are flood and storm damage reduction, and aquatic
ecosystem restoration. † Corps studies begin with a description and analysis of the current condition of the water and related land
resources for a project. The Corps uses this snapshot of the current resources to forecast how the condition of the water and land resources would change in the future, both “with” and “without” the proposed federal action.
384
future. They are also concerned that congestion on the river could lead to delays, and thus adversely influence barge rates and the competitiveness of U.S. grain in international markets. The Corps evaluated these concerns in its September 2004 study of seven proposed new locks and other navigation measures for the UMR-IW and in its revaluation of these locks and measures in its March 2008 follow-on study.
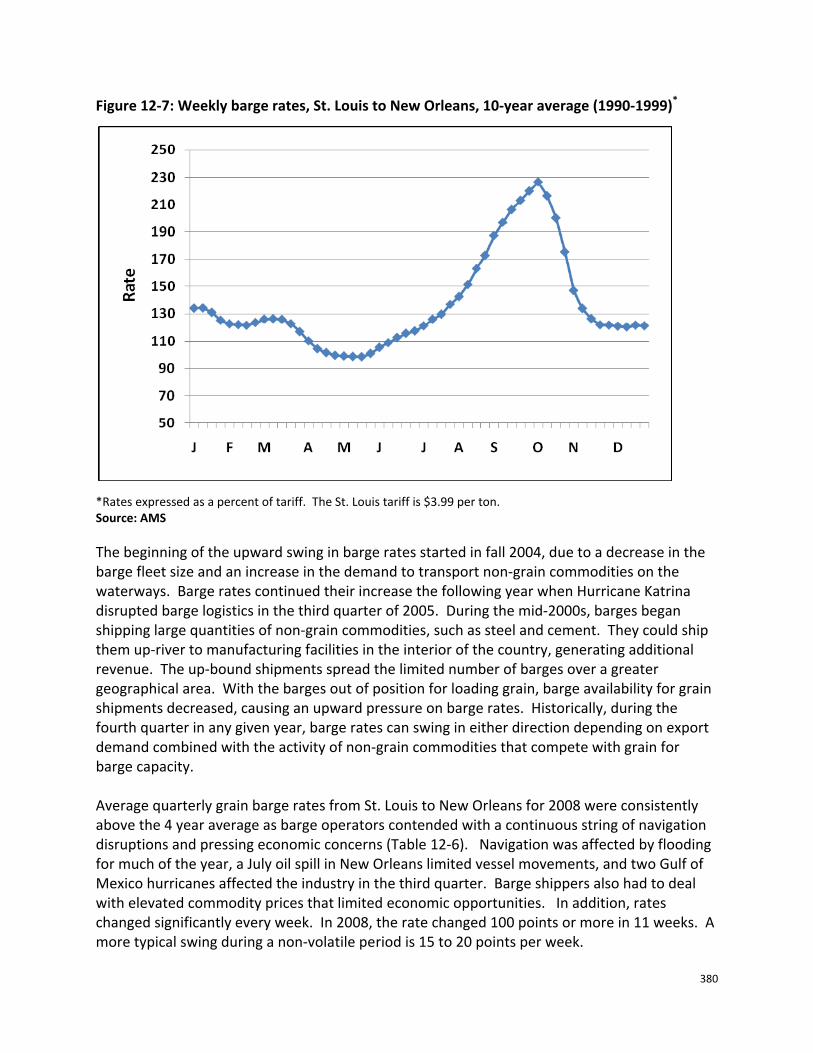
Upper Mississippi River and the Illinois Waterway The UMR consists of an 854-mile segment of the Mississippi River from the confluence with the Ohio River at Cairo, IL, through the Upper St. Anthony Falls Lock in Minneapolis-St. Paul. The southernmost set of locks (Locks 27) on the Mississippi is located in Granite City, IL (St. Louis), about 185 miles upstream of the junction of the Mississippi and Ohio Rivers (Figure 12-12). The IW is the 327-mile portion of the Illinois River from its confluence with the Mississippi River at Grafton, IL, to the T.J. O’Brien Lock in Chicago. Together, the UMR and the IW represent 1,181 miles of navigable waterways, about 10 percent of all the inland waterways. Figure 12-12: Upper Mississippi River and the Illinois Waterway
Source: U.S. Army Corps of Engineers

385
The locks on the UMR-IW were built starting in the 1930s and were designed to accommodate the size of the most common vessels used in waterways commerce on these rivers at that time. The UMR-IW locks built during that period were 600 feet long by 110 feet wide. Since then, however, more powerful and efficient towboats have been built. Modern towboats on the Upper Mississippi River can push a 1,200-foot-long tow of 15 barges. To transit a 600 foot lock, the tow is disassembled or “cut” into two sections, one of nine barges and one of six. The two sections transit the lock separately, one at a time. After passing through the lock, the tows are reassembled and continue to the next lock. In most cases, the process takes 1½ to 2 hours. Transiting a 1,200-foot lock takes only about 45 minutes. Tows originating at the same lock or at other locks can add further to the length of a trip if there are enough of them to cause congestion, especially during peak periods. The lockage time associated with splitting the tow can then produce queuing delays for other barges. Due to the reduction in traffic levels over the past 20 years, lengthy delays and long queues on the UMR-IW are now much less common.253 When they occur, however, they reduce productivity and can sometimes cause barge rates to increase. Because farmers do not have market power and are price takers, these rate increases are felt most by the farmer as higher basis* and lower margins. In addition to the lockage time associated with getting 1,200-foot tows through 600-foot locks, and the delays caused by congestion, lock maintenance and breakdowns can cause delays. To ensure reliability, locks are periodically shut down for maintenance. Because maintenance shut-downs are usually scheduled during slow traffic periods, barge companies can plan for them. Emergency repairs of locks, such as those caused by a barge hitting a lock structure, require unscheduled shut-downs. Shutdowns due to emergency repairs are more detrimental to barge operations than planned shutdowns. Delays cause the towboat to use more fuel. If they were to stretch into weeks or months, rates would go up and farmers’ net prices could shrink. The longer the delay, the greater the impact is on farmers’ incomes. The age and condition of the inland waterways infrastructure can thus have an effect on farmers’ livelihoods.
* Basis is the difference between the current cash price of a commodity and its futures price (Basis = Cash Price
less Near-Month Futures Price). The basis accounts for the difference in the supply and demand relationships in the local market relative to the futures market.
Costs of Delays A typical towboat is equipped with an engine that develops from 1,800 to 6,000 horsepower (hp).* As a rule of thumb, these vessels burn 0.75 gallons of fuel per hp per day. For example, a towboat with 4,000 hp engines may use up to 3,000 gallons of fuel per day. Costs other than fuel are also increased by delays, including barge ownership costs, leasing costs, and crew wages and benefits. * Ingram Barge Company, Transportation Research Board, 87th Annual Meeting, Washington, D.C., January 14, 2008.

386
The Corps gives priority to the maintenance of the locks and dams of the UMR-IW and to their periodic rehabilitation. It also has a good track record of responding to equipment breakdowns when they occur. Preventable causes (i.e. closures other than due to water conditions from drought or flood, and accidents) are infrequent and tend to be relatively short in duration. However, when breakdowns do occur, they increase the costs to shippers.
Wildlife Protection Areas In addition to federally created and maintained navigation projects, four parts of the UMR-IW serve as national wildlife protection areas, creating some potential conflicts among the purposes of the river. The Upper Mississippi River National Wildlife and Fish Refuge was established in 1924 by Congress to preserve the river for fish, migratory birds, other wildlife, and people. Today it consists of 200,000 acres of land and water along 260 miles of the UMR from Wabasha, MN, to near Rock Island, IL. Trempealeau National Wildlife Refuge consists of 5,900 acres on the Wisconsin side of the UMR near La Crosse, WI. Mark Twain National Wildlife and Fish Refuge is on 23,500 acres along the UMR between Davenport, IA, and St. Louis. Chautauqua National Wildlife Refuge occupies 8,000 acres along and on the Illinois River. The Mississippi River is required by law to serve both wildlife and fish protection and commercial navigation. The Federal Government is responsible for maintaining and improving environmental conditions as well as navigation on the UMR-IW.
Improvements to the Upper Mississippi River and the Illinois Waterway Since 1993, the Army Corps of Engineers has been evaluating options for developing navigation improvements on the UMR-IW. In 2001, it added an evaluation of options for environmental improvements to this study. In 2004, the Corps proposed a Navigation and Ecosystem Sustainability Program (NESP), which is a long-term program of navigation improvements and ecological restoration for the UMR-IW that is designed to be implemented in increments over a 50-year period through integrated, adaptive management. The improvements are intended to improve the flow of barge movements, among other things such as ecosystem protection, flood plain restoration, water level management, etc. Lockage times are longer as a result of barge tows that are longer than the locks, and therefore have to be split into two sections for transit. Only 3 of the 37 locks on the UMR-IW—Melvin Price Locks, Locks 27, and Lock 19—have 1,200 foot chambers. The splitting process adds time and costs to barge movements, and also causes delays for barges waiting for use of a lock that is being used by another barge. Delays can result from both traffic backups due to congestion and to a lesser extent from closures for operation and maintenance or breakdowns.
387
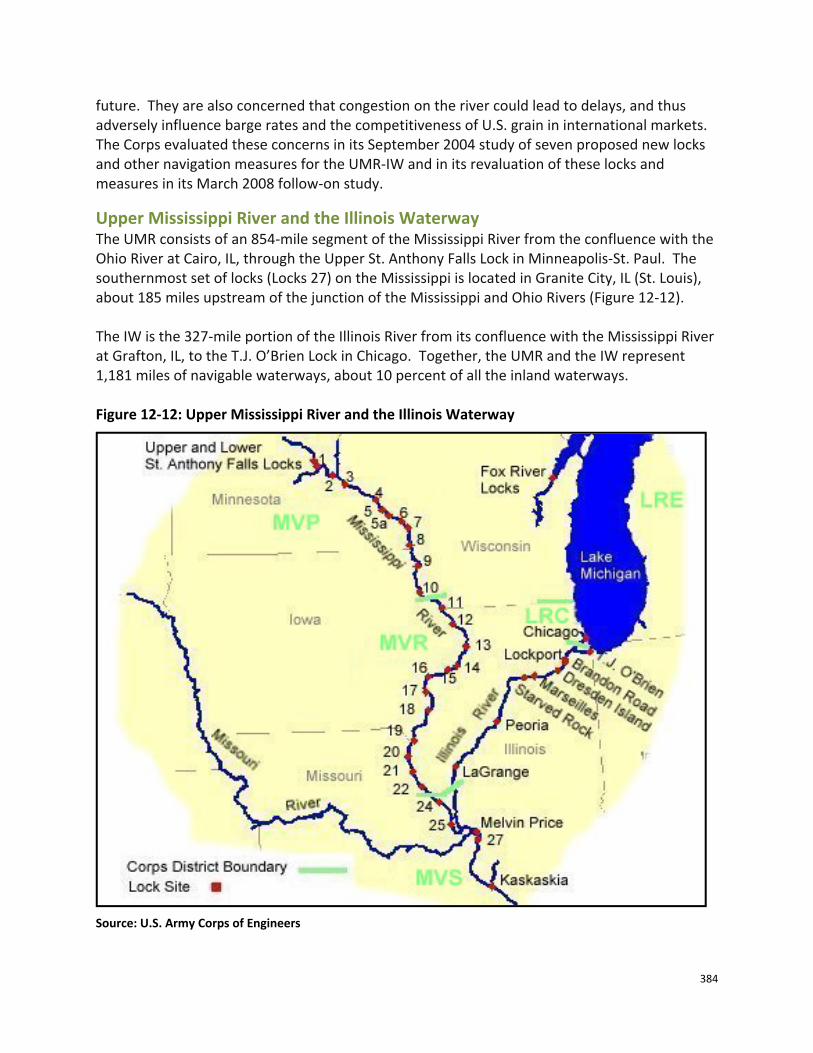
The 2004 NESP study recommended the construction of seven new locks and some small-scale improvements on the river to facilitate the movement of barge traffic. The proposal was contained in the Water Resource Development Act of 2007 (WRDA 2007), which authorizes the proposal, but does not provide funding. The proposed small-scale improvements, at Locks 12, 14, 18, 20, 22, and 24 on the UMR, and La Grange Lock on the IW, include mooring facilities and helper towboats to help barges thorough existing locks. Initial costs for the small-scale improvements are $274 million. With the proposed new 1,200-foot locks at Locks 20, 21, 22, 24, and 25 on the UMR and at La Grange and Peoria Locks on the IW, the navigation improvements would have an initial total cost of $2.1 billion. WRDA 2007 also authorizes an initial 225 ecosystem restoration projects to address the cumulative impact of the navigation operations. These programs to improve the ecological integrity will total $1.58 billion. Federal funds will pay most of the ecosystem restoration costs with cost sharing from other sources. Figure 12-13: Building Olmsted locks and dam on the Ohio River. Construction work began in 1991 and originally was scheduled to be finished by 2006. It will replace Locks and Dams 52 and 53.
Source: U.S. Corps of Engineers

388
Much of the justification for navigation improvements centers on the projected level of river traffic that will occur over a period of 50 years. Critics of the improvements believe that future traffic will not increase sufficiently to justify the investment needed to construct larger locks. Proponents believe that investments in navigation improvements on the UMR-IW will produce increases in barge traffic, making the improvements a desirable option.254 Figure 12-14 shows the commercial tonnage and lockage numbers at Mississippi River Lock 25 from 1989 to 2009. Overall, this period is characterized with a trend of declining tonnage and lockage numbers, especially since the period from 1999 to 2002, when the lockage numbers averaged about 3,338. The steep drop in traffic and tonnage in 1993 and 1994 reflects the two year effect of major and widespread flooding in the Midwest in 1993. The flooding in 1993 severely impacted barge traffic and also reduced that year’s grain production, which impacted barge movements in the following year. Traffic levels largely recovered by 1995, but have declined since 2002 and are now even below the 1993 level. In 1990 the lockage numbers were highest at 3,966. By comparison in 2009 the lockage numbers had declined to only 2,350. It is interesting to note that most of the variability of the tonnage figures over the period is from the farm and food category, which implies the other categories—that add to the total tonnage, such as coal, petroleum, chemicals, and manufacturing goods, etc.—have been relatively stable over the period. These tonnage figures also show that farm and food products are a significant part of the total tonnage on the UMR-IW. Figure 12-14: Annual commercial tonnage and lockage numbers at Lock 25, 1989-2009
Source: U.S. Army Corps of Engineers, LPMS/OMBIL
0
500
1,000
1,500
2,000
2,500
3,000
3,500
4,000
4,500
0
5
10
15
20
25
30
35
40
45
1989
1991
1993
1995
1997
1999
2001
2003
2005
2007
2009
Lock
ages
Mill
ion
Tons
All Commercial Lockages (#)
Food and Farm Products (tons)
All Commodities (tons)
389
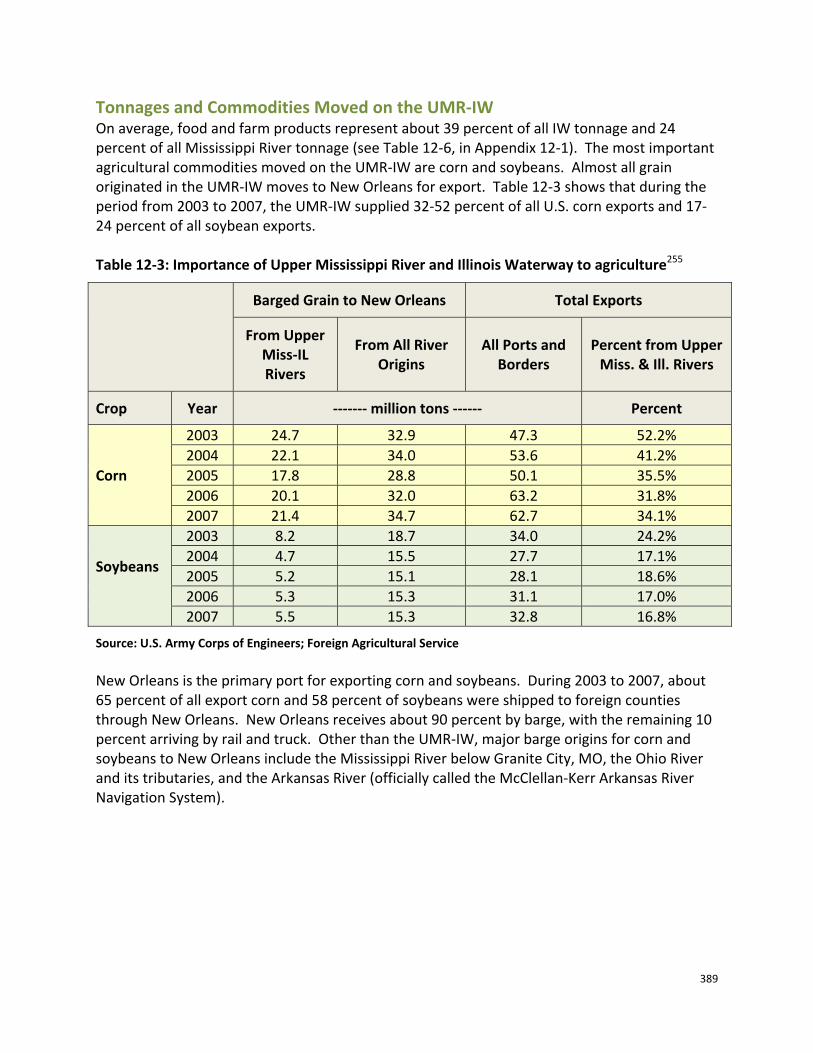
Tonnages and Commodities Moved on the UMR-IW On average, food and farm products represent about 39 percent of all IW tonnage and 24 percent of all Mississippi River tonnage (see Table 12-6, in Appendix 12-1). The most important agricultural commodities moved on the UMR-IW are corn and soybeans. Almost all grain originated in the UMR-IW moves to New Orleans for export. Table 12-3 shows that during the period from 2003 to 2007, the UMR-IW supplied 32-52 percent of all U.S. corn exports and 17-24 percent of all soybean exports. Table 12-3: Importance of Upper Mississippi River and Illinois Waterway to agriculture255
Barged Grain to New Orleans Total Exports
From Upper Miss-IL Rivers
From All River Origins
All Ports and Borders
Percent from Upper Miss. & Ill. Rivers
Crop Year ------- million tons ------ Percent
Corn
2003 24.7 32.9 47.3 52.2% 2004 22.1 34.0 53.6 41.2% 2005 17.8 28.8 50.1 35.5% 2006 20.1 32.0 63.2 31.8% 2007 21.4 34.7 62.7 34.1%
Soybeans
2003 8.2 18.7 34.0 24.2% 2004 4.7 15.5 27.7 17.1% 2005 5.2 15.1 28.1 18.6% 2006 5.3 15.3 31.1 17.0% 2007 5.5 15.3 32.8 16.8%
Source: U.S. Army Corps of Engineers; Foreign Agricultural Service New Orleans is the primary port for exporting corn and soybeans. During 2003 to 2007, about 65 percent of all export corn and 58 percent of soybeans were shipped to foreign counties through New Orleans. New Orleans receives about 90 percent by barge, with the remaining 10 percent arriving by rail and truck. Other than the UMR-IW, major barge origins for corn and soybeans to New Orleans include the Mississippi River below Granite City, MO, the Ohio River and its tributaries, and the Arkansas River (officially called the McClellan-Kerr Arkansas River Navigation System).

390
The decline in the market share of UMR-IW originations of corn and soybeans for the export market was partly due to the increase in barge rates that has occurred since 2004. When barge rates are elevated, the UMR-IW is less attractive to exporters. However, ethanol plants in the major production areas compete with export buyers of corn, so ethanol production has played a role in the decline of grain shipped by barge to New Orleans. Thus, because less grain in this area of the country now needs to be moved to distant markets, export related barge movements via the UMR-IW may continue to be at lower than historical levels, if this phenomenon continues.
Regional Competition between Barge and Alternate Transportation for Export Grain A survey conducted by the Navigation Economics Technologies (NETS) program of the Corps identified and examined the full range of alternate transportation available to agricultural shippers in the Midwest. The study found that most of the agricultural shippers surveyed have a range of alternatives, both in terms of the means of transportation and in terms of the end markets for their products. For each of these alternatives, the study surveyed the prices that shippers said they could receive for their goods, net of the cost of transportation, and concluded the economic value created by a single transportation mode is moderated by the presence of other alternatives. The Corps used the results of this NETS survey in estimating potential national economic development benefits in its March 2008 revaluation of the proposed new locks and other navigation measures for the UMR IW.256 Figure 12-15: A barge tow on the Mississippi river in St. Louis
Source: Wikemedia Commons
391
Critics argue that some of these national economic development benefits can be attributed to the fact that the operational and maintenance costs of the waterway system are covered entirely by the government through appropriations to the U.S. Army Corps of Engineers, which is responsible by law for maintaining the Nation’s inland waterways infrastructure. Further, they argue barge companies currently pay for only half of new waterway infrastructure through a fuel tax. Barge interests contend that the waterways provide benefits to other users, such as hydropower, water supply, municipalities, and recreational users, among others. In contrast, others contend that most of the benefits ascribed to other “users” of the UMR-IW and the Ohio River would have likely accrued anyway in the absence of the existing locks and dams. Competing modes, such as rail and trucks, also pay a much greater proportion of the operational and maintenance costs of the infrastructure they use, as well as the capital costs of expanding that infrastructure. For example, railroads generate from revenues almost all of the funds needed for capital improvements and maintenance of their infrastructure.
Environmental and Economic Uses of the Missouri River A divisive debate has developed over the management of water levels on the Missouri River. Recreational, environmental, hydroelectric power, navigation, and flood control uses all compete for water. The States have different interests, depending on their predominant use of the river system. Northern states such as Montana and North Dakota are keenly interested in the recreational economy generated from the impounded lakes, and in hydroelectric power. Closer to the Mississippi River, States are more concerned with navigation and flood control. The Missouri River is important to agriculture, but agricultural traffic on it is small relative to that on the Mississippi. During normal flow conditions, it is not the volume of traffic moving on the Missouri that makes it so critical to agriculture—although that is certainly important to the farmers who depend on the Missouri to move their grain—but its ability to store Missouri River water and release it later in the season to augment the supply of the Mississippi River and thereby benefit Mississippi River navigation, and by doing so, ensuring that grain can move from the Upper Mississippi River to the Gulf of Mexico. The Missouri River system is the largest reservoir system in the United States. The river is 2,341 miles long and drains one sixth of the United States, consisting of 6 dams and reservoirs (lakes) located in Montana, North Dakota, South Dakota, and Nebraska (Figure 12-16). The Corps operates the reservoir system as a project to serve congressionally authorized purposes—flood control, navigation, irrigation, hydropower, water supply, water quality, recreation, and fish and wildlife.

392
Figure 12-16: Missouri River
Source: U.S. Army Corps of Engineers Navigation is only possible on a 732-mile stretch of the Missouri River from Sioux City, IA, to St. Louis. Runoff from above the reservoir system dams is stored in the 6 lakes, where it serves the project’s many purposes. The Corps manages the system of dams and reservoirs according to the water control plan contained in its Missouri River Mainstream Reservoir System Master Water Control Manual,257 first published in 1960 and revised most recently in 2006.
One of the major concerns with the Missouri River system is that during droughts, limited water is available for the upstream and downstream users. Also, three Missouri River species (the interior least tern, piping plover, and pallid sturgeon) are listed under the federal Endangered Species Act. The Corps considered these issues in its recent changes to the Master Manual.

393
Missouri River Traffic According to a January 2009 report by the Government Accountability Office (GAO), the State of Missouri is the predominant user of Missouri River navigation.258 Missouri accounted for 83 percent of the tonnage shipped on the Missouri River between 1994 and 2006, Kansas accounted for 12 percent, Nebraska 3 percent, and Iowa 2 percent. Figure 12-17: Big Bend Dam on the Missouri River, South Dakota, one of the six reservoirs making up the Missouri River system.
Source: U.S. Army Corps of Engineers
The four States of Iowa, Nebraska, Kansas, and Missouri are adjacent to the Missouri River and are served by barge and other vessel traffic along the river. Iowa and Missouri are served by navigation on both the Missouri and Mississippi Rivers. During the 13-year period from1994 to 2006, 108 million tons of commodities were shipped on the Missouri River, or about 8.3 million tons per year. During the study period, the majority of the shipments on the Missouri River were sand and gravel—84 percent of the tonnage. Most of the sand and gravel was transported 1 mile or less. The distance traveled is so short because sand and gravel is taken from the river and shipped to nearby processing facilities. On average, about 215,385 tons of food and farm material per year were shipped to or from Missouri or Iowa on the Missouri River. In contrast, on an annual basis, about 14.5 million tons of food and farm material were shipped on the Mississippi River to or from the same States.

394
The Columbia-Snake River System The Columbia-Snake River System can be navigated from the Pacific Ocean to Lewiston, ID, 465 miles from the open sea (Figure 12-18). There are eight primary competing uses of the river system:
• Navigation • Flood control • Irrigation • Electric power generation • Fish migration • Fish and wildlife habitat • Recreation • Water supply and quality.259
Figure 12-18: Columbia–Snake River System
Source: Pacific Northwest Waterways Association. While most uses, such as irrigation, are beneficial to agriculture, some uses conflict. The best example is the need to allow anadromous fish, such as salmon, to migrate up and down the river system. Salmon live most of their lives in the ocean, and breed in fresh water. Dams were built to store water to turn turbines for electric power generation, but stopped fish from travelling up or down the river system. In an effort to meet the multiple authorized purposes of these dams, which include navigation, the Corps constructed fish ladders and other facilities and has taken other measures to help the fish to swim up and down the river.

395
Certain salmon species on the West Coast experienced dramatic declines during the past several decades as a result of human-induced and natural factors.260 Several of the species were classified as endangered or threatened, and required corrective action as mandated by the Endangered Species Act. To keep the dams operational, procedures were implemented to aid in fish migration, including adding screens to prevent the fish from entering the turbines, and the use of barges to transport the fish around the dams. The effort to balance conflicting demands for uses of the river has generated a lively controversy. For example, some environmentalists are so concerned that the construction and operation of the dams on the Snake River is damaging salmon breeding they have called for restoring the Snake to its natural flow. Figure 12-19: Barge tow on the Columbia River
Source: Wikimedia Commons
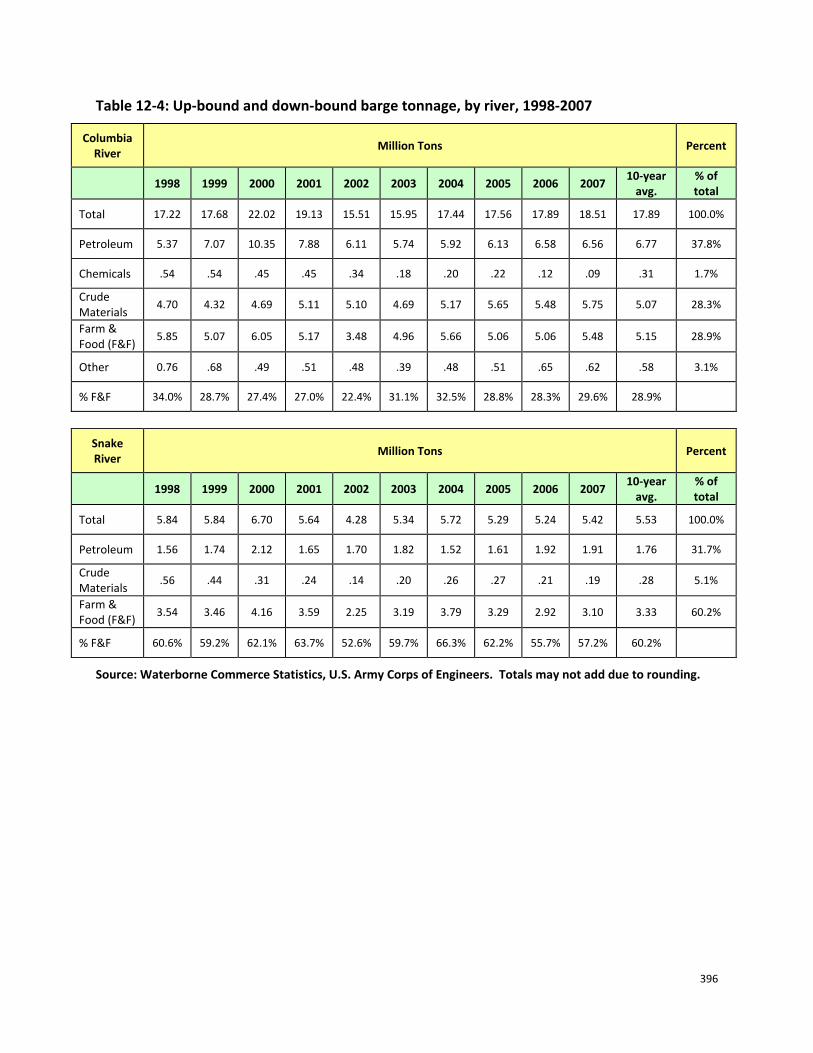
Table 12-4 shows 10 years of tonnage moved on the Columbia and Snake Rivers. About 29 percent of the tonnage on the Columbia and 60 percent on the Snake is farm and food products. The predominant commodity is wheat, making up nearly two-thirds of the farm and food traffic on the Columbia and more than 90 percent on the Snake. Other grains and oilseeds make up most of the remainder of the farm and food traffic. Because the Columbia-Snake system river is deeper than the Mississippi System, barges have a greater cargo capacity. Most barges carry 3,500 tons, whereas Mississippi River barges carry only 1,500 tons. There are eight locks and dams on the Columbia and Snake Rivers that were developed principally for hydroelectric purposes.261 The oldest facility is Bonneville Lock and Dam on the Columbia River, which went into service in 1938 and had a new and larger lock installed in 1993. The other locks and dams were constructed from the 1950s through the 1970s.
396
Table 12-4: Up-bound and down-bound barge tonnage, by river, 1998-2007
Columbia River
Million Tons Percent
1998 1999 2000 2001 2002 2003 2004 2005 2006 2007
10-year avg.
% of total
Total 17.22 17.68 22.02 19.13 15.51 15.95 17.44 17.56 17.89 18.51 17.89 100.0%
Petroleum 5.37 7.07 10.35 7.88 6.11 5.74 5.92 6.13 6.58 6.56 6.77 37.8%
Chemicals .54 .54 .45 .45 .34 .18 .20 .22 .12 .09 .31 1.7%
Crude Materials
4.70 4.32 4.69 5.11 5.10 4.69 5.17 5.65 5.48 5.75 5.07 28.3%
Farm & Food (F&F)
5.85 5.07 6.05 5.17 3.48 4.96 5.66 5.06 5.06 5.48 5.15 28.9%
Other 0.76 .68 .49 .51 .48 .39 .48 .51 .65 .62 .58 3.1%
% F&F 34.0% 28.7% 27.4% 27.0% 22.4% 31.1% 32.5% 28.8% 28.3% 29.6% 28.9%
Snake River
Million Tons Percent
1998 1999 2000 2001 2002 2003 2004 2005 2006 2007 10-year
avg. % of total
Total 5.84 5.84 6.70 5.64 4.28 5.34 5.72 5.29 5.24 5.42 5.53 100.0%
Petroleum 1.56 1.74 2.12 1.65 1.70 1.82 1.52 1.61 1.92 1.91 1.76 31.7%
Crude Materials
.56 .44 .31 .24 .14 .20 .26 .27 .21 .19 .28 5.1%
Farm & Food (F&F)
3.54 3.46 4.16 3.59 2.25 3.19 3.79 3.29 2.92 3.10 3.33 60.2%
% F&F 60.6% 59.2% 62.1% 63.7% 52.6% 59.7% 66.3% 62.2% 55.7% 57.2% 60.2%
Source: Waterborne Commerce Statistics, U.S. Army Corps of Engineers. Totals may not add due to rounding.
397
Inland Waterways Funding According to the Inland Waterways Users Board (IWUB), there is a growing gap between Congressional appropriations for capital water infrastructure projects and the needed funding levels for these projects.262 Although there has been an increase in spending over the past few years, there has not been a corresponding growth in the completion of high-priority projects. Cost overruns and delayed construction, they say, have disrupted the capability of the Corps to improve the nation’s water infrastructure. The projects are almost always multi-year projects, but Congressional appropriations are given in 1-year increments. When annual appropriations for a given project are less than the Corps estimate of the maximum amount that it can efficiently spend in a fiscal year, the completion date is considered extended. As an example, the IWUB points to Olmstead Locks and Dam, located on the Ohio near its confluence with the Mississippi River. Olmstead was authorized in 1988, funded for $775 million dollars, and was estimated to be completed in 7 years. By 2008, the project had been underway for 15 years and is now estimated to take 22 years. A recent estimate of the cost of the completed project is $2.067 billion, almost three times the original estimate. The IWUB stated, in its 22nd annual report, released in May 2008, that consistent underfunding has left annual shortfalls in the original construction needs.263 A Corps study of the history of this project reached a different conclusion. In a July 2008 report to the IWUB, the Corps found that that Olmsted costs, measured in real terms, had increased by 58.6 percent. Typical engineering and construction factors accounted for 69 percent of the increase. Specifically, design changes following the initial, rough cost estimate accounted for 30 percent; omissions and re-estimates from the initial estimate accounted for 35 percent; and site conditions that were different than expected accounted for 4 percent. Less than one-third of the increase (31 percent, or $226.5 million) involved the appropriated funding levels.264 Funding mechanisms for construction of new structures and major rehabilitation of existing navigation structures are specified by Section 102 of the Water Resource Development Act of 1986 (WRDA 86). WRDA 86 directs the cost of these inland navigation capital improvements to be paid from the general fund of the U.S. Treasury and a matching amount from the Inland Waterways Trust Fund (IWTF). The sources for the IWTF are taxes imposed on fuel for vessels engaged in commercial waterways transportation and any interest accrued by the trust fund. The current tax is 20 cents per gallon of fuel. During the late 1990’s, IWTF tax revenues were greater than expenditures, creating a surplus in the Trust Fund that peaked at $413 million in FY 2002. The balance in the trust fund has been declining since FY 2002. This occurred primarily because expenditures increased; however, revenues also decreased during this period. By the end of 2009, the balance in the IWTF was $14.3 million. At this level, the IWTF can only fund twice the amount of annual receipts because under current law the trust fund pays 50 percent of capital investments. In short, the decline in the trust fund since 2002 reflects a longer term trend, a structural imbalance between receipts and expenditures. The users of these waterways now pay a total of roughly

398
$85 million per year. By comparison, the amount financed from the trust fund, reflecting their share of the capital cost under current law, was $205 million in FY 2007 and $205 million in FY 2008. The primary question is, “how will the funding be provided?” Several sources of additional revenues have been suggested, such as a fuel tax increase, a user fee for using the locks (possibly including a congestion fee), a ton-mile charge, and expanding the list of waterways designated in law265 as “inland and intracoastal Waterways of the United States” to include all such waterways. The users have suggested instead that Congress should redefine their cost sharing responsibilities by excluding some or many types of projects from cost sharing. If the funding mechanisms are not resolved, new construction and the rehabilitation of inland navigation structures will slow down. In April 2008 and May 2009, the Army submitted legislative proposals to the Congress to resolve this issue. The Congress enacted the current cost-sharing in the landmark Water Resources Development Act of 1986. While the 2008 and 2009 legislative proposals differed in certain respects, both of these proposals aimed to raise sufficient revenue to meet the 1986 cost-sharing, in a way that would be more efficient and more equitable than the fuel tax. The Congress has not acted on these proposals. The lack of a clear path forward is of significant concern to the farmers that depend on the inland waterways to move their crops to market. However, in the short-term, the current level of annual funding is not likely to cause significant delays or closures to the UMR-IW, lead to substantially higher transportation costs, or reduce farmers’ margins or their incomes.
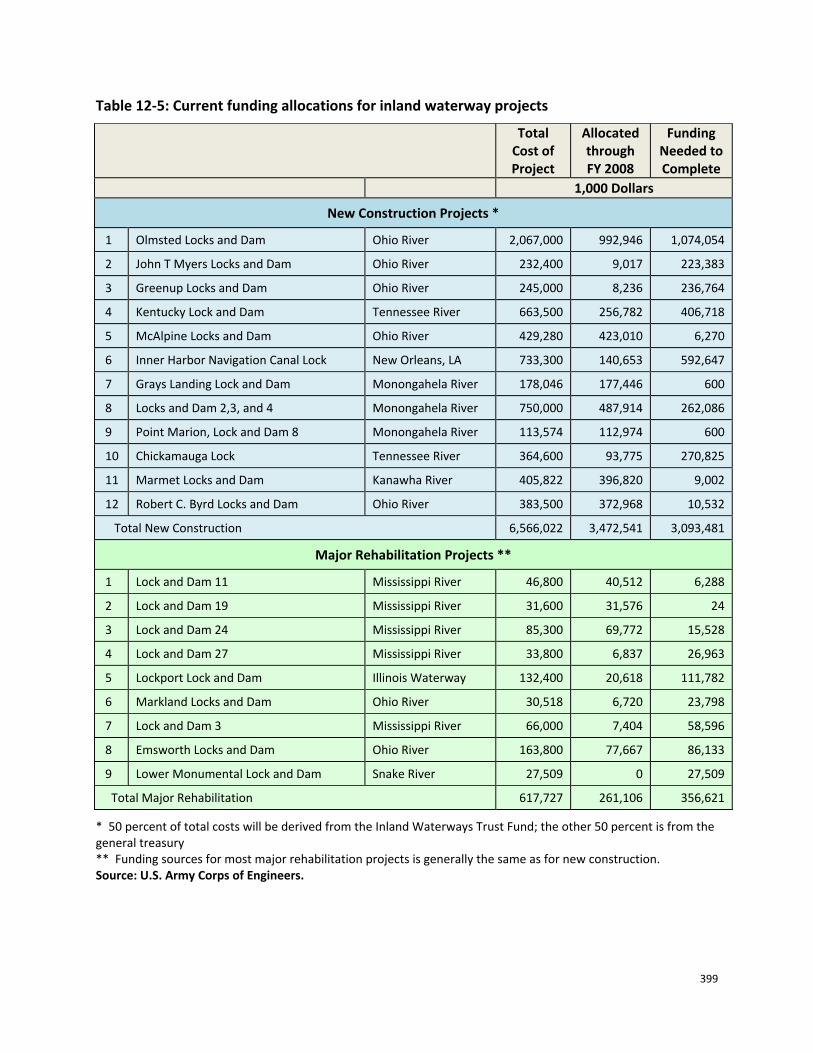
Current Investment Needs The Corps develops and maintains navigation on the inland waterways infrastructure through a system of locks, dams, channel improvements, and dredging. More than half the locks and dams operated by the Corps are over 50 years old. As facilities grow older, the need for repairs and preventative maintenance increases, and eventually some facilities need to be replaced. Table 12-5 shows current major projects on the Nation’s inland waterways that are included in the budget for the U.S. Army Corps of Engineers. Funding is broken into two categories: new construction and major rehabilitation. New construction projects are more expensive than major rehabilitation. As can be seen from the table, the total cost of new construction projects is over $6.5 billion, of which $3.4 billion had been allocated through FY 2008. This leaves $3 billion to complete these projects. The total cost for projects for major rehabilitation projects is over $617 million, of which $261 million has been allocated through FY 2008, leaving some $356 million needed to complete these rehabilitations. The most expensive project is the construction of the Olmsted Locks and Dam. Olmsted will eventually replace the last two locks on the Ohio River, where there are some of the highest traffic levels on the waterway system. Of the top twelve new construction projects, Olmsted will take about a third of the total costs of the projects for its completion.
399
Table 12-5: Current funding allocations for inland waterway projects
Total Cost of Project
Allocated through FY 2008
Funding Needed to Complete
1,000 Dollars
New Construction Projects *
1 Olmsted Locks and Dam Ohio River 2,067,000 992,946 1,074,054
2 John T Myers Locks and Dam Ohio River 232,400 9,017 223,383
3 Greenup Locks and Dam Ohio River 245,000 8,236 236,764
4 Kentucky Lock and Dam Tennessee River 663,500 256,782 406,718
5 McAlpine Locks and Dam Ohio River 429,280 423,010 6,270
6 Inner Harbor Navigation Canal Lock New Orleans, LA 733,300 140,653 592,647
7 Grays Landing Lock and Dam Monongahela River 178,046 177,446 600
8 Locks and Dam 2,3, and 4 Monongahela River 750,000 487,914 262,086
9 Point Marion, Lock and Dam 8 Monongahela River 113,574 112,974 600
10 Chickamauga Lock Tennessee River 364,600 93,775 270,825
11 Marmet Locks and Dam Kanawha River 405,822 396,820 9,002
12 Robert C. Byrd Locks and Dam Ohio River 383,500 372,968 10,532
Total New Construction 6,566,022 3,472,541 3,093,481
Major Rehabilitation Projects **
1 Lock and Dam 11 Mississippi River 46,800 40,512 6,288
2 Lock and Dam 19 Mississippi River 31,600 31,576 24
3 Lock and Dam 24 Mississippi River 85,300 69,772 15,528
4 Lock and Dam 27 Mississippi River 33,800 6,837 26,963
5 Lockport Lock and Dam Illinois Waterway 132,400 20,618 111,782
6 Markland Locks and Dam Ohio River 30,518 6,720 23,798
7 Lock and Dam 3 Mississippi River 66,000 7,404 58,596
8 Emsworth Locks and Dam Ohio River 163,800 77,667 86,133
9 Lower Monumental Lock and Dam Snake River 27,509 0 27,509
Total Major Rehabilitation 617,727 261,106 356,621
* 50 percent of total costs will be derived from the Inland Waterways Trust Fund; the other 50 percent is from the general treasury ** Funding sources for most major rehabilitation projects is generally the same as for new construction. Source: U.S. Army Corps of Engineers.

400
The cost for new construction and repairs is expected to exceed the amount of revenue that can realistically expect to be generated solely by commercial users of the waterways. Because the waterways promote other worthwhile activities that benefit the entire Nation, Congress has traditionally shared with the users the costs of funding new construction and major rehabilitation, roughly on a 50/50 basis. However, this shared funding arrangement is facing increasing criticism from interested parties. Pro-navigation groups want the government to pay a higher share of these projects. Some environmental organizations and taxpayer groups question the continued development of the Nation’s rivers for navigational purposes, particularly with regard to economically marginal investments, and would also prefer for the Congress to require the commercial users to pay more. The annual receipts from the fuel tax now cover less than 10 percent of the total cost that the Corps incurs to support commercial navigation on these waterways, when taking into account the operation and maintenance costs, all of which the general taxpayer pays. Some opponents of this approach to cost-sharing believe the general public should not pay for benefits that primarily will be enjoyed by commercial interests. In addition, some opponents contend that the decades of governmental support of navigation have caused significant harm to the environment, and that environmental priorities should take precedence over any navigation improvements. In fact, some environmental groups have called for the removal of four dams on the Snake River to reduce extinction risks to endangered or threatened fish. This action would cause the loss of navigation on the Snake River, and would thereby have impacts on other transportation systems. Overall, there seems be little consensus in determining an optimal level or mechanism for funding inland waterways. Authorized projects require years of investigative preparations to evaluate the benefits and costs, more years to obtain funding, and are may be underfunded. Agricultural waterway shippers believe significant funding should be provided, with assistance from public funds. However, others argue that despite the public expenditures on waterways over the last 20 years, traffic has declined significantly. The funds to maintain and rehabilitate the existing structures are a priority; the question is whether a substantial further public investment in new infrastructure is called for at this time.

401
Conclusions Much of U.S. agricultural production occurs in the middle of the country, far from coastal export facilities. The river system provides bulk long-haul transportation economically, keeping U.S. products competitive in the global economy. From the perspective of the shippers, barges offer a low-cost transportation alternative for bulk goods in the areas near these waterways. In some areas, they offer competition to other long-haul modes, keeping rates down. Moving more bulk commodities on barges could free capacity of other transportation modes, reducing congestion. More barges are being retired than are being constructed, shrinking the size of the barge fleet. The market is currently adjusting to the number of barges in operation. Although aging, the locks and dams on the river system are generally reliable. As locks age, however, repairs and maintenance becomes more extensive and expensive. Funding for new construction projects is nearly depleted, with the trust fund down to $14.3 million at the end of 2009. Roughly half of the funding for capital investments in the inland waterways comes from the commercial users of the system through a fuel tax; the other half comes from Congressional appropriations from the General Fund of the Treasury. There is a growing gap between the fuel tax receipts and the funding needed to meet the authorized non-Federal cost-share for ongoing capital projects. There is currently no clear path forward on the funding shortfall and this is a significant concern to farmers that depend on the inland waterways for transportation.

402
Appendix 12-1 Table 12-6: Up-bound and down-bound barge tonnage, by river, 1998-2007
Illinois Waterway
Million Tons Percent
1998 1999 2000 2001 2002 2003 2004 2005 2006 2007 10-year
avg. % of total
Total 41.80 43.72 44.22 43.49 43.03 44.99 45.23 44.02 43.58 41.11 43.52 100.0%
Coal 3.03 2.77 2.50 2.11 1.44 3.92 4.21 5.37 6.17 5.44 3.70 8.5%
Petroleum 6.22 5.69 5.79 6.59 5.18 6.19 6.35 6.31 6.40 6.76 6.15 14.1%
Chemicals 4.97 4.63 4.78 4.52 4.50 4.51 4.43 4.15 4.17 4.80 4.55 10.4%
Crude Materials
5.76 6.11 6.54 7.44 7.21 7.85 8.24 8.51 8.15 6.53 7.23 16.6%
Manufactured Goods
4.41 4.79 5.64 4.26 4.96 4.51 5.46 5.90 5.59 4.02 4.95 11.4%
Farm & Food (F&F)
17.38 19.71 18.95 18.51 19.72 17.97 16.35 13.69 13.05 13.49 16.88 38.8%
Other 0.03 0.03 0.02 0.05 0.03 0.05 0.18 0.09 0.05 0.08 0.06 0.1%
% F&F 41.6% 45.1% 42.9% 42.6% 45.8% 39.9% 36.1% 31.1% 29.9% 32.8% 38.8%
Mississippi River
Million Tons Percent
1998 1999 2000 2001 2002 2003 2004 2005 2006 2007 10-year
avg. % of total
Total 324.48 329.64 327.40 316.55 316.21 308.21 312.81 299.14 313.51 311.67 315.96 100.0%
Coal 52.24 47.28 47.65 46.46 44.09 39.08 41.31 42.20 46.30 47.00 45.36 14.4%
Petroleum 77.44 76.70 76.83 79.75 77.16 78.83 79.33 78.93 82.92 84.56 79.25 25.1%
Chemicals 38.05 37.79 37.38 34.79 35.52 37.81 37.88 37.02 35.24 38.06 36.95 11.7%
Crude Materials
54.01 55.47 53.59 50.36 51.38 52.81 55.85 51.12 55.49 48.73 52.88 16.7%
Manufactured Goods
24.36 25.93 27.97 20.45 21.02 20.00 22.76 24.40 25.28 20.97 23.31 7.4%
Farm & Food (F&F)
76.22 85.12 82.59 83.28 86.15 78.76 74.15 64.76 66.92 71.16 76.91 24.3%
Other 2.15 1.35 1.39 1.46 0.89 0.92 1.53 0.72 1.36 1.20 1.30 0.4%
% F&F 23.5% 25.8% 25.2% 26.3% 27.2% 25.6% 23.7% 21.6% 21.3% 22.8% 24.3%
Source: Waterborne Commerce Statistics, U.S. Army Corps of Engineers. Totals may not add due to rounding.