bargaining power and foreign direct investment in china
TRANSCRIPT

POLITIC
AL EC
ON
OM
YR
ESEAR
CH
INSTITU
TE
10th floor Thompson HallUniversity of MassachusettsAmherst, MA, 01003-7510Telephone: (413) 545-6355Facsimile: (413) 545-2921 Email:[email protected]
Website: http://www.umass.edu/peri/
Bargaining Power and ForeignDirect Investment in China:Can 1.3 Billion ConsumersTame the Multinationals?
Elissa Braunstein
Gerald Epstein
2002
Number 45
POLITICAL ECONOMY RESEARCH INSTITUTE
University of Massachusetts Amherst
WORKINGPAPER SERIES
Bargaining Power and Foreign Direct Investment in China:Can 1.3 Billion Consumers Tame the Multinationals?
Elissa Braunstein and Gerald Epstein
October 2002
AbstractForeign direct investment (FDI) has become a much desired commodity by nations, regions andcities throughout the world. Indeed, governments bid for FDI because it is commonly thought tobe an important engine of economic growth, job creation, and technological upgrading. ThePeople’s Republic of China (PRC), the developing world’s largest recipient of FDI and one of theworld’s fastest growing economies, is often cited as evidence for the beneficial effects of FDI.Given the PRC’s size and the huge allure of its cheap labor force and customer base, one wouldthink that if any country had the bargaining power vis a vis multinational corporations to benefitfrom FDI, it would be China. But does FDI really deliver these commonly perceived benefits? Toanswer this question, we study the impact of inward FDI on wages, job creation, investment andtax generation in the PRC from 1986-1999 by running panel regression analysis on provinciallevel data. An innovation of our analysis is to distinguish the impact of FDI inflows from that ofeconomic liberalization, per se. We find that, contrary to the conventional wisdom, inward FDIhas a relatively small positive impact on wages and employment, while having a negative impacton domestic investment and tax revenue. We suggest that the decentralization of the FDI biddingprocess in China contributes to these negative outcomes, and argue that the limitation on FDImanagement tools associated with China’s WTO entry is likely to further reduce the benefits ofFDI for Chinese workers and citizens .
Elissa Braunstein is Assistant Research Professor in the Political Economy Research Institute(PERI), University of Massachusetts, Amherst. Gerald Epstein, also at UMass Amherst, isProfessor of Economics and Co-Director of PERI. Many thanks to: Robert Feenstra for sharinghis data set on China; James Heintz, Tom Hertz, Mark Brenner, Bernie Morzuch and Will Milburgfor their help and advice; Andong Zhu for his research assistance, and Professor Yan Bin forhosting Epstein during his research visit to Xiamen University, Fujian Province, PRC. The authorsalso thank the Ford and Rockefeller Foundations for financial support. Of course, all remainingerrors are ours alone.

2
I. Introduction
Foreign direct investment (FDI) is commonly seen by economists and policy makers as apremier agent, not only of globalization, but also of economic growth and development. In fact, inlight of the Asian and South American financial crises, in which portfolio flows proved to beflighty and unreliable, FDI is now treated more than ever as the capital flow of choice. FDI hasthus become one of the most sought-after commodities in the global economy, the object ofenormous investments of time and resources by policy makers who want to attract it, and thesubject of an enormous amount of research and debate concerning its nature and impact.
It is not surprising, then, that the role of foreign direct investment in the People's Republicof China (PRC)1 provides fertile ground for studying the dynamics of FDI and globalization. ThePRC has attracted a large amount of FDI over the last decade, the most of any developing country,and in recent years, it was among the top four recipients of FDI in the world. FDI flows to thePRC have occurred in a context of intense global competition for foreign investment by manycountries, including developing countries in Asia. And the entry of China into the World TradeOrganization (WTO) may dramatically affect the types and quantity of FDI flowing to China, andthe government's ability to manage and direct it. Indeed, many competitors in Southeast Asia andelsewhere worry that the PRC's entry will lead to an acceleration of investment flows to the PRCand a corresponding reduction in flows to themselves. Hence, China provides more than just acase study of foreign investment; understanding the dynamics of FDI in China is essential tounderstanding the dynamics of FDI in the world economy as a whole.
Globalization and FDI
There are two, broad competing visions of globalization in general and the role of FDI inparticular (Crotty, Epstein and Kelly 1998). One is the “neo-liberal vision,” which treats FDI as anagent for spreading capital, technology and management skills across the globe and, therefore, as acrucial agent for economic growth and development. According to this view, any government thatwants to partake of these benefits of FDI must implement a set of policies and institutionalinnovations, including openness to investment, modest regulation, government transparency,modest tax rates, and investor guarantees.
The second vision is not as sanguine about the impact of globalization and FDI. Ratherthan envisioning a “race to the top” or a “convergence,” as forecast by neo-liberal adherents, thisgroup fears a “race to the bottom.” According to this view, global competition for FDI places anenormous amount of bargaining power in the hands of multinational corporations (MNCs) andtheir allies in the International Monetary Fund (IMF), U.S. Treasury and World Bank. Thiscompetition, in turn, forces countries to lower regulations, taxes, environmental protections, wagesand working conditions in order to attract and retain capital. The result is a leveling down of wages,social protections and government control across the globe (Barnet and Cavanaugh 1994; Greider1997). These two views – neo-liberal versus race to the bottom – have become increasinglypolarized, fought out in academic circles, policy fora and in the streets during annual meetings ofthe IMF, WTO and other global institutions.
As for policy, race to the bottom adherents argue for constraints on FDI in order to protectthe living standards of workers in the developed economies, and to restrict the alleged exploitation 1 Hong Kong’s return to Chinese rule in 1997 has not altered its status as a distinct administrative andeconomic entity, so it is treated separately from the PRC in this paper.
3
of workers and communities in the developing world. By contrast, proponents of the neo-liberalview, and many academics and policy makers from developing countries, insist that proposedconstraints on foreign investment are self-serving: they only raise the living standards of workersin the developed world at the expense of workers in developing countries.
Crucial to this policy debate is an empirical question: Does FDI in fact raise the livingstandards of communities in the developing world? If FDI does make a substantial contribution togrowth and development, as the neo-liberal advocates assume, then there may be a trade-offbetween protecting workers in the North and those in the South. However, if the race to the bottomview is correct and FDI in the current context does not help the majority of citizens in eitherdeveloping or developed countries, then regulating FDI – for example by imposing codes ofconduct or living wage legislation – might be in the common interests of workers in both Northand South.
As we have argued elsewhere, the impact of FDI will depend greatly on the institutionalcontext in which it takes place (Braunstein and Epstein 1999; Crotty, Epstein and Kelly 1998). Asin the race to the bottom view, we see bargaining power between MNCs and governments,communities and workers as an essential determinant of the ability of countries and communitiesto benefit from FDI. In principle, under the right institutional circumstances, countries or regionscould exert bargaining power over MNCs, and regulate them in such a way as to generatesignificant benefits for their communities. The questions are: what are the right circumstances? Dothe countries try do it? and, With what effect?
FDI in China
If any developing country would seem to have bargaining power relative to MNCs, itwould be the PRC. China's 1.3 billion consumers provide an enormous lure for companieswanting to get a foothold in the Chinese market. And the PRC’s almost limitless supply of cheaplabor makes it an enormously attractive location for labor-intensive, export-oriented production.Moreover, the Chinese government has a strong regulatory apparatus in place to manage andcontrol MNCs. Under these circumstances, one would expect that MNCs would be willing tomake significant concessions to Chinese communities, workers and governments. One possiblemeasure of the PRC's bargaining strength is the oft lamented “fact” that many foreign companiesfail to make profits in China, nonetheless remaining there in order to be well positioned in thelong-run to sell to the Chinese consumer.
An important question is whether the PRC government has been able to exploit itspresumptive bargaining power to capture a greater share of the benefits from FDI than havecountries with less bargaining power. If so, this would strengthen the argument that the freemovement of FDI is in the interest of Chinese workers, even if it might not be in the interest ofsome workers in the U.S. However, if China has not been able to use its potential bargainingpower to benefit substantially from FDI, that would call into question the desirability of makingsignificant concessions to attract FDI in China. And this caution would apply even more stronglyto other countries with much less bargaining power than China, which is to say, virtually everyother country in the developing world.
There are many important issues associated with this question. Has the Chinesegovernment tried to capture a significant share of the benefits and, if so, how has it tried to do so?For example, has the Chinese government attempted to achieve a high degree of technology
4
transfer from MNCs? A substantial focus on export markets? High tax revenue? An improvementin wages and working conditions for workers? If so, has it been successful in this regard? Has itbeen more successful than other developing countries?
A number of factors have potentially undermined the Chinese government's ability toexploit its presumptive bargaining power relative to MNCs. Among the most important of thesehas been the extraordinary de-centralization of China's investment management institutions. Aspart of the reforms begun in 1979, China's central government ceded significant powers toprovincial and local governments to attract and manage foreign investment. At the same time, thecentral government created significant political and economic incentives for provincial and localofficials to try to attract investment, including signaling government officials that if they attractedmore investment they would have better career prospects.
Other potential factors reducing the benefits of FDI to the PRC's general population includecorruption, which allegedly pervades government-business relations, and the relative absence ofindependent labor organizations. Taken together, these three factors imply that benefits whichcould have accrued to the Chinese populace might have been siphoned off by government officialsand shared with the MNCs themselves.
However much the PRC has been able to exploit its bargaining power in the recent past, itsentry into the WTO could dramatically reduce its bargaining power and the distribution of benefitsfrom FDI. Among other effects, WTO regulations may limit China's ability to engage in industrialpolicy, potentially compromising the PRC’s capacity to manage FDI in the interests of itseconomy.
In this paper we will elaborate on these points by investigating issues of the race to thebottom versus neo-liberal convergence in the case of FDI and China. In particular, we willconsider the nature of China's bargaining power in relation to MNCs and FDI, how it has tried tomanifest and exploit that power, what leakages have occurred as the government has tried toexploit that bargaining power, and with what impacts on the Chinese population. We will alsostudy how China's likely entry into the WTO will alter China's bargaining power with MNCs.Finally, we will discuss the policy implications of our findings. In particular, we will ask whetherthere is an inevitable conflict of interest between workers in China on the one hand and those in thedeveloped world on the other; or whether, as the race to the bottom approach implies, workers inboth the PRC and the North have a common interest in regulating MNCs and FDI.
The paper will proceed as follows. The next section will review the recent history ofChinese policy towards FDI. We emphasize that the central government closely managed theprocess of foreign investment so that it would focus on exports rather than the domestic Chinesemarket. At the same time, the decentralized nature of some aspects of the policy made it difficult tomanage all components of the FDI process. In this section, we also present some stylized factsabout the size and distribution of FDI in China in recent years. In section III we present newempirical results assessing the impact of FDI on employment growth and wage growth. We showthat its impact has been positive but rather limited in size. We then consider whether FDI hascrowded in or crowded out investment, and we find that, in fact, it has crowded it out. In sectionIV we consider the decentralized nature of FDI bidding and consider the impact of FDI on localtax revenue. We find that it is negative, suggesting that, at least at the provincial level, the socialbenefits of FDI have been dissipated. In the penultimate section we look at the impact of China’s
5
entry into the WTO on China’s ability to manage and benefit from FDI. In the final section weconsider some larger implications of our findings.
II. Stylized Facts of FDI in China
A. A Brief Review of Chinese Policy towards FDI
Introduction
The history of China’s policy toward FDI is one of careful experimentation andmanagement in an attempt to use FDI to simultaneously develop an export-led and importsubstitution strategy. The decentralized nature of Chinese administration has meant that some ofthese centrifugal tendencies have undermined certain aspects of the regulatory process. Over time,however, as the low-wage export-led strategy has run its limit, and as the Chinese government hasbroadened its liberalization strategy, China has attempted to attract a broader array of FDI,including joint ventures to serve the Chinese market. At the same time, the sources of investmenthave evolved from the Chinese Diaspora to a broader set of countries, including those in the U.S.,Europe and Japan.
History
At the second session of the Fifth National People’s Congress in July 1979, a jointventures law was passed, granting foreign investment a legal status in China (Chen 1996: 33). Inthis initial period FDI was restricted to joint ventures in China’s four special economic zones(SEZs) at the time (three in Guangdong province across the sea from Hong Kong (Shenzhen,Zhuhai (contiguous with Macao), and Shantou, and the fourth, Xiamen in Fujian Province, on theother side of the Straits of Taiwan) (World Bank 1994: 221). SEZs offered significant freedomsand advantages for foreign investors, including concessionary tax policies, exemption from exportduties and import duties for equipment, instruments, and apparatus for producing export products,and an easing of entry and exit formalities (Chen 1997b: 8). Pressure from other localities led theState Council in 1984 to extend economic freedoms similar to those of the SEZs to 14 additional“open” coastal cities, and in 1985 to the Yangtze and Pearl River Deltas as well as to a largerproportion of Fujian (World Bank 1992).
Specific encouragement of FDI really began in 1986, with passage of the Wholly Foreign-Owned Enterprise Law, which, in addition to permitting wholly foreign-owned enterprises, alsoreduced fees for labor and land use, established a limited foreign currency exchange market forjoint ventures, and extended the maximum duration of a joint-venture agreement beyond 50 years(Chen 1996; Huang 1998). These policy initiatives coincided with a broadening of the reach ofChina’s Open Door Policy to include the entire coastal zone in 1988, a shift that became known asChina’s coastal development strategy. Open policies for FDI now extended to the entire coastalregion, stressing two main goals: (1) to develop labor-intensive industry in the coastal area; (2) tobase the production of these industries in labor intensive export processing of imported rawmaterials (Chen 1997d: 12).
The next watershed came in 1992, when Deng Xiaoping gave his now famous “SpringWind” speech endorsing continued market reforms and rapid growth in the context of a post-Tiananmen conservative backlash (Shirk 1994: 39), and the size of FDI flows into China soonaccelerated, especially from industrialized countries. It was also at this time that the Chinese

6
domestic market became more open to foreign firms (Cheng and Kwan 2000: 213), certainly astrong incentive for developed source countries trying to get around China’s strict import controls.There was somewhat of a rollback on FDI liberalization in 1994, primarily to cool an overheatingeconomy and discourage FDI in real estate (Cheng and Kwan 2000: 226), but when the economycooled down liberalization continued. In recent years, FDI policy has also focused on encouragingtechnologically-intensive investment, as authorities have begun treating FDI as a means foracquiring foreign technology versus importing complete sets of advanced equipment (UNCTAD2000: 26).
Since the mid-1990s, China’s policy towards FDI can be at least partly evaluated in termsof its desire to join the World Trade Organization. This desire can help to explain the ChineseGovernment's attempt to rollback some of the special privileges for foreign investors. The idea isthat as authorities reduce tariffs, they will also reduce preferential treatment for foreign-investedenterprises (FIEs), but preferential income tax treatment is expected to continue (Chen 1996: 43).In that spirit the Chinese government announced the removal of duty-free status on capital goodsimports by FIEs to begin in April 1996, a measure that was heavily qualified by grandfatherclauses. Partly as a result, FDI fell off in 1996-97, and successful lobbying by FIEs as well asprovincial officials eager for FDI is having some effect: it has since been announced that previousexemptions, such as exemption from import duties and value-added taxes on imports ofequipment, have been restored (Henley, Kirkpatrick and Wilde 1999: 240-41; UNCTAD 1999:57).
In sum, China’s policy towards FDI was clearly designed to encourage export-orientedFDI, looking externally to draw on both inputs and markets, and granting well-defined freedomsand incentives to the FIE sector. Policymakers, by developing the coastal development strategythat afforded SEZ-like privileges to the entire coast of China, created a kind of gigantic exportprocessing zone, where free markets were defined not so much by geography but more byownership (Naughton 1996: 302). It is also important to note that these liberalizing policies werein line with the government’s own import substitution strategies, where FIEs and the limited freemarket in which they operated were largely separate from the centrally planned and inward-oriented sector (Kueh 1992). It is only recently as the size of the foreign-invested sector hascontinued to grow and sell to the domestic market that it has begun to exert important influencesthroughout the wider economy. These will be discussed more thoroughly below.
B. The Numbers
Figure 1 traces the trajectory of nominal FDI inflows into China since 1986. Theimportance of policy shifts signaled by Deng’s Spring Wind speech in 1992 are clearly visible.Since that time, China has been the largest recipient of FDI in the developing world, with theexception of 2000, when Hong Kong outstripped China by about US$ 20 billion. This surge forHong Kong is partly attributable to China, though, as many investors claimed they were “parking”investments in Hong Kong, making ready to enter China once the course of its accession to theWTO got clarified (UNCTAD 2000: 25).

7
Figure 1FDI flows into China, 1986-99
0
5
10
15
20
25
30
35
40
45
50
1986 1987 1988 1989 1990 1991 1992 1993 1994 1995 1996 1997 1998 1999
Source: China Statistical Yearbook, various years.
US
$ b
illi
on
In terms of source countries, Table 1 lays out accumulated FDI stock by source regionbetween 1983 and 1999. Hong Kong has long been the main source of FDI in China, partlybecause of its role as an entrepot. It has also been the key thoroughfare for round-tripping, wheredomestic investment gets funneled through Hong Kong and back into China to take advantage ofthe privileges afforded to FDI. Estimates of round-tripped investment range between 15 and 25percent of Hong Kong investment, a substantial amount (Harrold and Lall 1993: 24; Huang 1998:63; Wei 2000: 245).
In recent years Hong Kong investment has lost some of its dominance due to increasinginvestments by industrialized countries, especially from Western Europe. There has also been asignificant upswing in FDI from Latin America; this increase comes from developed country taxhavens in the Virgin and Cayman Islands, which together account for over 90 percent of FDIcoming from Latin America. Overall, FDI from developing countries constitutes about 75 percentof FDI stock in China, assuming that Hong Kong can be classified as a developing country. Thistype of FDI tends to be concentrated in small, labor-intensive export-oriented manufacturing firmsin China. Since the early 1990s, when flows from industrialized countries began to increase, sodid the share of larger, more capital intensive joint ventures, which are also more likely to targetChina’s domestic market (World Bank 1997; Kaiser, Kirby and Fan 1996; Zhu and Lu 1998;Henley, Kirkpatrick and Wilde 1999).
Indeed, there is some evidence of a spectrum of investment intentions, categorized bynationality of investor: investors from the Chinese Diaspora of Hong Kong and Taiwan, etc. are atone end, investing primarily in labor intensive, low wage exporting firms; firms from Japaninvesting in intermediate goods products and higher quality products for the Japanese market; andU.S. and European firms primarily investing in firms they hope will sell to the Chinese market. Ofcourse, U.S. firms are well known to hire low wage FIE firms on a contract basis to producegoods for export.

8
Table 1Accumulated FDI stock in China by source countries, 1983-1999
(1980 US$ million)
1983-91 1992-95 1996-99 1983-99
Source Countries US$million
% US$million
% US$million
% US$million
%
NIES 9920 61.75 45372 74.12 57671 61.71 112963 66.17
Hong Kong 9319 58.01 36105 58.98 41466 44.37 86890 50.89
Taiwan 422 2.62 6003 9.81 6682 7.15 13107 7.68
Singapore 179 1.12 2013 3.29 5934 6.35 8126 4.76
South Korea 0 0 1251 2.04 3588 3.84 4839 2.83
ASEAN 79 0.49 1175 1.92 1725 1.85 2979 1.74
Japan 2166 13.48 4062 6.64 7833 8.38 14061 8.24
USA 1817 11.31 4529 7.4 8048 8.61 14394 8.43
Western Europe 1047 6.51 2686 4.39 8897 9.52 12630 7.40
Other DCs 193 1.20 708 1.16 1349 1.44 2250 1.32
Other Asia 124 0.77 1170 1.91 1065 1.14 2359 1.38
East Europe 21 0.13 85 0.14 117 0.13 223 0.13
Latin America 17 0.11 321 0.52 5692 6.09 6030 3.53
Africa 2 0.01 39 0.06 245 0.26 286 0.17
Others 676 4.21 1065 1.74 811 0.87 2552 1.49
All LDCs 10840 67.48 49227 80.42 67325 72.04 127292 74.62
All DCs 5223 32.52 11986 19.58 26126 27.96 43335 25.38
Total 16063 100 61213 100 93452 100 170728 100
Notes: ASEAN includes Thailand, Malaysia, the Philippines and Indonesia. “DCs” are developed countries;“LDCs” are less developed countries.Source: Years 1983-95 from Chen (1997: Table 2); 1996-99 from authors’ calculations based on China ForeignEconomic Statistical Yearbook 2000.
It is clear from the policy section above that most FDI is concentrated in the coastalprovinces, partly as a result of the coastal development strategy and partly because of its proximityand historical linkages with the extended community of overseas Chinese in the NIEs. Between1986 and 1999, about 90 percent of FDI inflows went to China’s coastal region. But consideringthese flows as a percent of gross domestic investment qualifies this picture somewhat. Table 2
9
indicates that as a percent of gross domestic investment, FDI is becoming more important as asource of investment for inland regions.
Table 2FDI as a percent of gross investment by area
Year Coast Inland
1986 2.93% 1.06%
1992 11.07% 3.53%
1999 16.04% 6.84%Source: Authors’ calculations based on China StatisticalYearbook, various years.
Overall, FDI is strongly associated with international trade in China. In 1995, the tradeshare of FIEs was 39.1 percent of China’s total trade (Chen 1997a: 3-4). In terms of exportsalone, the share of total exports produced by FIEs went from less than one percent of China’s totalexports in 1984 to 27.5 percent in 1993 (Lardy 1994: 72). In the past few years, trade by foreignaffiliates accounted for as much as half of China’s total trade (UNCTAD 2000: 54). Much of thisincreasing share is largely a result of the transfer of production of labor-intensive manufacturedexports from Hong Kong, Taiwan, and to a lesser extent from other NIEs in East and SoutheastAsia, to obtain lower production costs (Naughton 1996: 314), as the timing of China’s FDI reformpolicies coincided with the upgrading of technology and economic restructuring of China’s higherincome neighbors (Chen 1997a). Timing was certainly not everything; vast networks of overseasChinese in countries like Hong Kong, Taiwan, Singapore and Malaysia were poised to takeadvantage of the confluence in policy and economic change.
Despite increases in industrialized country investments into China, which tend to be largerand more capital intensive than investment from developing source countries, FIEs overall tend tobe in labor intensive industries (Chen 1996, 1997b; Sun 1998). In an empirical study of inter-industry variation in FDI using data from 1995, Chunlai Chen (1997b) finds a negative andsignificant relationship between an industry’s capital-labor ratio and FDI (as measured by FIEassets). He also finds that the share of FIEs in an industry tends to be higher the more laborintensive the industry, and that the share of FIEs is also higher in fast-growing export-orientedindustries.
Using data on China’s 3,000 largest FIEs in 1994, which is biased towards larger andmore capital intensive enterprises, Chen (1997c) splits industries into labor, capital, ortechnologically-intensive categories, and counts the number of enterprises in each category.2 Even
2 He uses number of enterprises instead of reported value of capital invested to “avoid problems associatedwith differences in valuations by date of investment” (Chen 1996: 23).
Categories are as follows. Labor intensive sectors include: food processing; food manufacturing;textiles; clothing and other fibre products; leather and fur; timber processing; furniture; paper and paperproducts; printing; cultural, education and sports goods; rubber products; plastic product;, non-metal mineralproducts; metal products; and others.
Capital-intensive sectors include: beverage manufacturing; tobacco; petroleum refining and coking;chemical materials; chemical fibres; ferrous metal smelting and pressing; non-ferrous metal smelting andpressing; and transport equipment.
Technology-intensive sectors include: medical and pharmaceutical; general machinery; specialmachinery; electrical machinery and equipment; electronics and telecommunications equipment; andinstruments and meters. (Chen 1997c: 16-17)
10
with data biased towards capital intensive industries, of his sample he finds that 52 percent of FIEsare in labor intensive industries, 25 percent in capital intensive and 23 percent in technologicallyintensive sectors. Among FIEs, Hong Kong is by far dominant across almost all manufacturingindustries.
In addition to the investment patterns in manufacturing described above, the real estatesector has also been a significant recipient of FDI in China. Between 1984 and 1987, FDI into realestate increased rapidly, attracting more than a third of inward investment flows and peaking in1986 at 49 percent of all inflows, mostly at the expense of inflows into industry. This proportiondeclined in 1988 as a result of tighter macroeconomic policies, but was on the rise again beginningin 1992, the beginning of another economic boom (Chen 1996). In recent years real estate hasheld steady at around 12 percent of FDI inflows, partly as a result of central efforts to constrainspeculative FDI.
III. The Impact of FDI in China on Growth, Productivity, Wages, Employment andInvestment
The Chinese government ranks high among the world’s boosters for foreign investment.Along with many Chinese economists, the official line is that FDI has played an enormouslyimportant role in the development of the new China. Indeed, many observers believe that as FDIbegan to falter in the late 1990s, the Chinese government accelerated its efforts to join the WTOprimarily to attract more FDI, presumably because of their belief in its importance for Chineseeconomic development.
Yet, despite all the scholarly work devoted to the impact of FDI on China by Chineseeconomists and others, there is still very little hard evidence that FDI has had a large salutaryimpact on the Chinese economy, and if so, what exactly it has been. To help fill this gap, we havestudied empirically the impact on a number of key macroeconomic variables.
A. Growth and Productivity
Two of the areas where there has been a fair amount of empirical work has been on theimpact of FDI on growth and productivity. Because China has been so tremendously successful inattracting FDI, this literature is an important part of assessing the promise of foreign investment ina developing country context.
Beginning with growth, applications of the most standard type with some combination ofcapital and labor explaining GDP growth, find that FDI makes significant contributions to growth(Chen, Chang and Zhang 1995; Sun 1998). These types of studies should be treated with caution,however, because FDI could be capturing the contributions of public policy to growth andtherefore overstating its effects. We deal with this issue by constructing the policy variable“liberalization,” discussed below. Also, these studies do not address the direction of causality: it isjust as likely that GDP growth induces FDI as the other way around. In another study, Shan,Tiann, and Sun (1999) test whether industrial growth in China is Granger-caused by FDI or viceversa. They find a two-way causality between industrial growth and FDI, that both FDI-ledgrowth and growth drawing FDI are supported by the empirical evidence, indicating that therelationship between FDI and growth is more complex than simple studies would suggest.
11
More complex approaches draw on the insights of endogenous growth theory,emphasizing the indirect effects of FDI on growth through productivity spillovers and forward andbackward linkages. These analyses are based on the premise that much of the value of FDI comesin the form of ideas and technological spillovers, as multinationals bring with them managerialknow-how, international connections, and technologically advanced production processes, all ofwhich combine to enhance a locale’s overall productivity beyond what FDI directly contributes todomestic investment. Shang-Jin Wei (1996), in an analysis of Chinese city-level data covering1988-90, finds that holding the growth of inputs constant, a one percent increase in the share offoreign-invested firms in city output in 1988 is associated with a 0.32 percent higher growth rate inoutput, although he does not control for policy. In a different approach that focuses on total factorproductivity, Dees (1998) adds a policy variable by controlling for openness, and finds that FDIcontributed to Chinese growth only in the 1990s. In a similar analysis, Wei (1995) finds that FDIbecomes significant for growth beginning in the late 1980s.
Like the standard growth regression studies, these studies also fail to test for the directionof causality, so it could be that multinationals are attracted to high productivity localities. Anexception is the work of Gangti Zhu and Ding Lu (1998), who, applying a Granger causality testto a panel data set of 50 Chinese cities during 1985-95, find a causal linkage between the presenceof FDI and productivity growth (as measured by value-added per employee), though they do notdiscuss the opposite causation, from productivity growth to FDI. They also find that spilloverefficiencies from FDI are stronger at promoting labor productivity than in boosting total factorproductivity, suggesting that the benefits of FDI in China have come from improvements inhuman resource allocation efficiency versus overall technological progress.
Gordon Hanson (2001), in an UNCTAD study of the benefits of FDI for developingcountries, is not very confident about the findings of these types of studies. He argues thatalthough the early empirical literature was optimistic about the impact of MNCs on host-countryproductivity, its findings are open to the sorts of criticisms described above about the direction ofcausality as well as omitted variables, such as policy. He describes more recent and promisingwork done on the micro-level, where time series data of manufacturing plants provides solutionsto these empirical problems by showing how the productivity of domestic plants changes overtime in response to the presence of MNCs. Haddad and Harrison (1993), using data for Moroccanmanufacturing plants in 1985-89, find a weak negative correlation between plant total factorproductivity growth and the presence of MNCs in that sector. Aitken and Harrison (1999), usingdata on Venezuelan manufacturing plants for 1976-89, find productivity growth in domestic plantsis negatively correlated with foreign presence in that sector. Hanson concludes that micro-leveldata undermines empirical support for productivity spillovers from FDI, perhaps indicating thatMNCs confine competing domestic firms to less profitable segments of industry. Clearly, for thecase of China, more work needs to be done on the micro-level to assess the productivity spillovereffects of MNCs.
Lacking data at the micro level, we choose not to revisit the already large literature on FDI,growth and productivity. Instead, using the insights gained from this work on growth andproductivity, we decided to study more directly the impact that FDI has on workers andcommunities in China. We have refined our inquiry both in terms of questions asked and inaccounting for policy in a more direct way. In terms of the former, in the next sections we take upthe issue of FDI’s effects on wages, employment and domestic investment. In all the empirical
12
work we undertake, we use panel data from the 29 Chinese provinces over the period 1986-1999.3
Before discussing the regression analysis, though, we develop a new policy variable that directlymeasures economic liberalization.
B. Liberalization
One of the biggest flaws in the previous literature has been its confounding of twoprocesses occurring in China: one is liberalization and the other is openness to trade and foreigninvestment. While these have often gone hand in hand, they have not always done so.Liberalization – the freeing up of prices and the liberalization of private ownership of business andcontrol over profits – has also been an important part of the Chinese economic story. It isimportant then to distinguish these two processes and their impact on China’s economicdevelopment.
Liberalization need not be equivalent to openness. As any scholar of East Asiandevelopment will attest, high levels of trade integration can co-exist with strong industrial policiesthat actively guide development or protect particular economic sectors from the effects ofinternational integration. Empirical studies of China that do control for policy tend to use somemeasure of openness as a proxy for liberalization and reform. These measures most often reflectto what extent a geographical area has been incorporated into China’s Open Door Policy, rangingfrom SEZ status to whether a locality is situated in the coastal development zone (Dees 1998;Cheng and Kwan 1999, 2000; Wei 1996). But China has exercised a clear industrial policy wheretrade and FDI are concerned. Its increasing openness to trade and investment has co-existed withstrong administrative controls, and so a distinct measure of liberalization is necessary to control forthe effects of policy separate from openness.
For the PRC, the transition from a centrally-planned to a market economy – what we arecalling its course of liberalization – has been a gradualist and ongoing one. In the early years ofindustrial reform, the state created a “dual track system” by maintaining clear delineations betweenproduction for the central plan and production in the new and growing sphere of market-basedindustry. By actually freezing the scope of the traditional mandatory balance plan, the state’sstrategy meant the marketized sector would overwhelm the planned sector over time in terms ofeconomic significance, a process that Barry Naughton has termed “growing out of the plan”(Naughton 1995). Part of this process entailed breaking up the government monopoly in industryand easing entry by nonstate firms. Although some new firms established at this time were state-owned in the sense of being started up by local governments, most of these types of additionscame in the 1980s. The vast majority of new firms were “collectively” owned (an ownershipcategory that in practice exhibits a wide variety of attributes and is thus treated as separate from thetraditional state sector), but have become increasingly private or joint-venture in ownershipstructure as reforms have proceeded. In light of this history, a good way to capture liberalization isto use the ratio of state sector output to all industrial output.4
3 We thank Robert Feenstra for supplying some of these data.4 We also tried using the ratio of state sector workers to all employees, which performed in a similar mannerto the state output measure, but the latter was more robust overall and made more sense in the employmentregressions. Eventually we hope to improve the liberalization measure by exercising a principal componentsstrategy that combines a number of different measures of liberalization policies, such as the proportion ofoutput subject to the Plan, or the proportion of free prices.
13
The data we use for this measure and the regressions below are annual provincial-level databetween the years 1986 and 1999; 1986 was chosen as a starting point both because that is whenpolicy towards FDI undergoes a marked shift, and because of data availability. Where possible,the data we use comes from the China Statistical Yearbook published by the PRC’s StateStatistical Bureau, as it is regarded as more reliable than the alternative provincial statisticalyearbooks that we used as a backup. There is a total of 29 provinces, listed in Table 3 below.5
Table 3 shows the liberalization measure ( L2 , or state output as a percent of all industrialoutput) for the beginning and ending of the time period in question, 1986 and 1999, and thepercentage change between those two periods. Provinces are rank-ordered, from smallest absolutepercentage change in L2 to largest. In order to get a sense of whether liberalization captures policyvariables that are distinct from those that prescribe openness, we have also included average FDIas a percent of total investment (average FDI I ), as well as average trade as a percent of GDP(average T GDP ) over the same time period. If openness is equivalent to liberalization for theChinese case, one would expect the liberalization variable to simply mirror FDI and trade.
5 China is actually divided into 22 provinces, five autonomous regions (Guangxi, Tibet, Xinjiang, Inner Mongolia,and Ningxia), and three municipalities (Beijing, Tianjin and Shanghai). Autonomous regions and municipalitieshave the same administrative rights as provinces; the entire group will be referred to as “provinces.” Tibet has beenleft out of the dataset.

14
Table 3Measures of Liberalization and Openness
Province L2, 1986
(percent)L2
, 1999(percent)
change in L2,
1986-99(percent)
averageFDI I1986-99
(percent)
averageT GDP1986-99
(percent)
Xinjiang 82.9 76.2 -8.9 0.7 10.0
Qinghai 81.2 72.8 -11.5 0.16 6.0
Ningxia 78.5 67.0 -17.3 0.68 8.6
Beijing 77.8 65.7 -18.4 10.3 19.9
Jilin 73.0 57.9 -26.2 4.6 16.0
Shaanxi 72.8 55.4 -31.5 5.2 9.9
Yunnan 77.7 55.9 -39.2 1.2 9.3
Guizhou 76.0 53.3 -42.7 1.6 5.1
Heilongjiang 80.4 53.9 -49.2 3.8 11.5
Hainan 81.7 52.0 -57.1 27.7 43.8
Gansu 86.5 50.3 -72.1 1.3 5.5
Shanghai 77.1 44.3 -74.3 11.2 53.4
Jiangxi 70.6 40.1 -75.9 4.8 8.3
Jiangsu 37.0 20.1 -83.7 12.1 23.1
Inner Mongolia 79.6 42.4 -87.8 1.21 8.9
Sichuan 68.8 34.0 -102.0 2.8 6.5
Guangxi 75.7 36.9 -105.3 8.8 12.9
Shanxi 64.3 31.2 -106.5 2.1 7.7
Shandong 52.9 25.5 -107.7 8.4 16.1
Liaoning 66.1 31.5 -110.2 9.5 26.6
Henan 61.3 28.4 -115.8 2.5 5.2
Tianjin 67.0 29.7 -125.4 17.0 42.1
Hebei 56.0 23.7 -136.1 3.4 9.8
Anhui 63.7 25.3 -151.7 3.3 7.3
Hubei 67.4 25.7 -162.0 4.3 8.8
Guangdong 53.5 19.4 -176.1 26.7 88.1
Hunan 67.4 22.3 -202.3 4.6 8.4
Zhejiang 35.0 11.0 -218.1 4.3 18.5
Fujian 53.5 15.1 -255.0 28.6 39.5
M e a n 68.5 40.2 -95.5 7.3 18.5
Standard Deviation 12.7 17.8 63.3 8.0 18.3
Note: L2 is state sector output divided by all industrial output.
Source: Authors’ calculations.
15
But this is clearly not the case. The correlation coefficients between L2 and average FDI Iand T GDP are, respectively, -0.396 and –0.299; both are significant at the 95 percent level.While there is a significant relationship between these variables, there is also considerableindependence. As such, we elected to use L2 as a policy variable that measures the impact ofliberalization, independent of the impact of openness, in the regressions below.
C. The Impact of FDI on Wages
Two ways in which FDI can directly help workers is by raising wages and employment. Inthis section we analyze the impact on wages and in the next section we consider employment.
While wages are often used as an independent variable to explain FDI, it is rare to find thecausality running the other way in the empirical literature on FDI in developing countries.6 Butthere is a clear causal link. First, FDI may affect labor demand (depending on whether it isgreenfield investment or mergers and acquisitions, and on what competitive impact it has ondomestic investment), thereby affecting wages. Secondly, spillover effects from potentially higherproductivity (and paying) foreign enterprises could raise wages throughout the country. Andlastly, because capital is internationally mobile and labor is not, FDI may enhance capital’sbargaining power relative to labor, thereby lowering wages (Paus and Robinson 1998).
Turning to the Chinese case, the core model we used is based on the notion that short-term(annual) changes in wages depend on labor demand and supply. Data are panel data for China’s 29provinces between 1986 and 1999 (please see the data appendix for a fuller explanation of the dataused).7 In regression equation (1) below the average provincial wage, measured as the averageannual wage for a particular province, is a function of: total investment ( I ); foreign directinvestment (FDI ); total foreign trade ( imports+ exports = T ); the total available labor force (LF ,defined as the population fifteen and over); productivity, where GDP employment = q ; and finally
the liberalization variable, L2 , the ratio of state sector output to all industrial output. Provincialfixed effects are α ’s, a time trend has been added to control for uniform shocks, and ε is a seriallyuncorrelated random error. We use two measures of investment: gross investment ( I ) and“adjusted investment” ( adjI ), which subtracts FDI from gross investment to get a clearer sense of
6 There are of course important exceptions. Using panel data that included both developing and developedcountries, Paus and Robinson (1998) find that: FDI has a direct positive impact on real wages; that thatimpact is especially true in developing countries (but not in developed countries); and finally that this positiveimpact is true only for the period 1968-87, after which there is some evidence that the threat effect ofrelocating has had a negative effect on wage growth in industrialized countries. In a comparative study ofMexico, Venezuela, and the United States, Aitken, Harrison and Lipsey (1995) find that higher levels of FDIare associated with higher wages in all three countries, but in Mexico and Venezuela, this association waslimited to foreign-owned firms. This lack of evidence of wage spillovers to domestic firms is consistent withthe large wage differentials between foreign and domestically-owned firms in these countries.7 Unless otherwise discussed, all units are in nominal yuan. This choice was taken because we could not getreliable deflators for the full set of variables, especially trade. It should be noted, though, that when we triedthe regressions using the consumer price index on wages and the GDP deflator on everything else, the resultswere consistent with the nominal numbers. In general, our results with imperfect deflators were similar to thenominal results reported here.

16
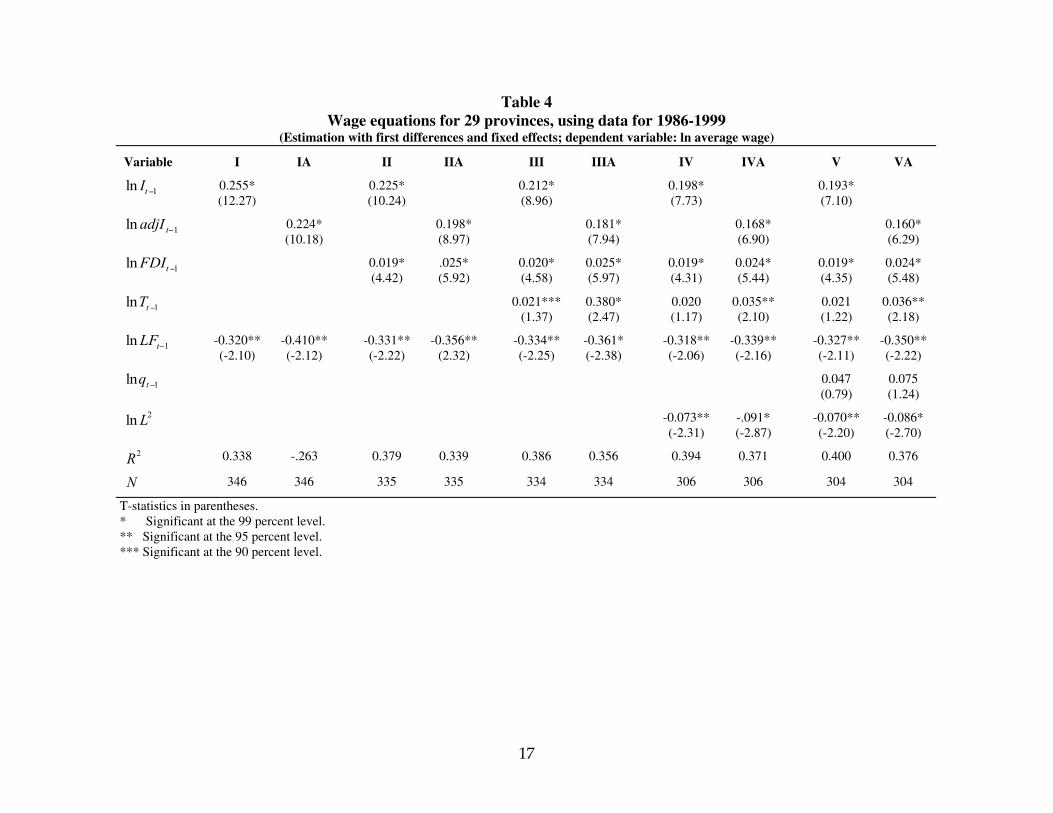
the effects of FDI on wages. The regression is run in logs to get elasticities, and first differenceswere used to address non-stationary in the variables.8 The results are detailed in Table 4.
(1) lnwit = αi + β1 ln I it + β2 lnFDIit + β3 ln Tit + β4 ln LFit + β5 ln qit + β6 ln Lit2 + timetrend + εit
8 A Levin-Lin panel unit root test, used to determine nonstationarity in panel data, was applied. The test may beviewed as an Augmented Dickey-Fuller test for panel data (Levin and Lin 1992). First differencing the variablesaddresses the fact that the variable means change over time, which could result in spurious correlations if left as is.
17
Table 4Wage equations for 29 provinces, using data for 1986-1999
(Estimation with first differences and fixed effects; dependent variable: ln average wage)
Variable I IA II IIA III IIIA IV IVA V VA
ln It−1 0.255*(12.27)
0.225*(10.24)
0.212*(8.96)
0.198*(7.73)
0.193*(7.10)
ln adjI t−1 0.224*(10.18)
0.198*(8.97)
0.181*(7.94)
0.168*(6.90)
0.160*(6.29)
lnFDIt−1 0.019*(4.42)
.025*(5.92)
0.020*(4.58)
0.025*(5.97)
0.019*(4.31)
0.024*(5.44)
0.019*(4.35)
0.024*(5.48)
lnTt−1 0.021***(1.37)
0.380*(2.47)
0.020(1.17)
0.035**(2.10)
0.021(1.22)
0.036**(2.18)
lnLFt−1 -0.320**(-2.10)
-0.410**(-2.12)
-0.331**(-2.22)
-0.356**(2.32)
-0.334**(-2.25)
-0.361*(-2.38)
-0.318**(-2.06)
-0.339**(-2.16)
-0.327**(-2.11)
-0.350**(-2.22)
lnqt−1 0.047(0.79)
0.075(1.24)
lnL2 -0.073**(-2.31)
-.091*(-2.87)
-0.070**(-2.20)
-0.086*(-2.70)
R2 0.338 -.263 0.379 0.339 0.386 0.356 0.394 0.371 0.400 0.376
N 346 346 335 335 334 334 306 306 304 304
T-statistics in parentheses.* Significant at the 99 percent level.** Significant at the 95 percent level.*** Significant at the 90 percent level.

18
Table 4 above presents a series of regressions that build up to the full model inregressions V and VA. Regressions I-V use the gross investment measure; regressions IA-VAuse the adjusted investment measure. The potential for simultaneity – FDI, investment or tradecould just as reasonably be argued to be the result of wage changes as the source of them –induced us to do some Granger causality testing. The results, which indicated mutual causationbetween these variables and wages, were not really satisfactory owing to the short time seriesand limited degrees of freedom. But the exercise did prompt us to use some lagged values on theright-hand side to partially address this problem.
The regression results indicate that FDI has a statistically significant and positive impacton wages that is not significantly affected by the model’s other variables. Looking at the fullmodel with gross investment (regression V), a one percent increase in FDI increases wages byabout 0.02 percent. Put another way, if FDI increases by one standard deviation from its mean,wages will increase by 1.32 percent. In regression VA, the coefficient increases slightly so that aone percent increase in FDI increases wages by about .025 percent. The actual effect probablylies somewhere between these two figures, as some small proportion of FDI is comprised offinancial flows that are not counted as a part of gross investment.
Gross investment packs a lot more punch: in regression V a one percent increase ininvestment raises wages by 0.19 percent - an investment increase of one standard deviation fromthe mean raises wages by about 22 percent. Looking at the adjusted investment measure in VAlowers this estimate: a one percent increase in domestic investment raises wages by 0.16 percent.But it is still a much larger impact than FDI.
Looking at the rest of the variables, we will confine the discussion to the regressions thatuse adjusted investment, keeping in mind that the true results are somewhere in between theregressions that use the gross and adjusted investment measures. Trade has increased the overalldemand for labor in China, thereby raising wages: in regression VA, a one percent increase intrade raises wages by .036 percent. Put in terms of standard deviations, an increase of onestandard deviation raises wages by 2.9 percent. The labor force variable, reflecting a reservearmy effect where greater supplies of labor drive down wages, has the expected effect, and it isnotably sizeable, suggesting that creating ample employment for China’s growing population is avalidly key concern for policy makers. Productivity has the correct sign but is not statisticallysignificant, probably due to noise in the measure.
The results on liberalization are interesting for a couple of reasons. First, includingliberalization does not affect the other variables that one might posit are picking up liberalizationeffects: neither FDI nor trade, sometimes treated as proxies for liberalization, are alteredsignificantly by the inclusion of the liberalization variable. At least for the Chinese case, then,these openness measures are not picking up the effects of liberalization on the Chinese economy.Secondly, there is a consistently positive and statistically significant relationship betweenliberalization and wages. If the proportion of state sector output to all industrial output decreasesby one percent, wages will increase by 0.086 percent; if L2 declines by one standard deviationfrom the mean, wages will increase by 3.06 percent.

19
This result suggests that the freedom from wage controls, and the overall increase inincomes (especially rural) that came with liberalization, were important positive benefits of theeconomic reform program begun in 1979. But it is important to recall that we are onlymeasuring money wages. The substantial non-cash benefits that can come along with a statesector job, such as housing allowances, still render these jobs among the most prized, at least forless educated or lower-skilled workers who would otherwise have trouble accessing workplacebenefits. Some interesting work on the impact of FDI on relative wages in China illustrates thispoint. In a study that compares state and FIE sector wages for unskilled workers, it was foundthat after including non-wage benefits like pensions, housing and medical care, state sector jobswere much better for unskilled workers who had been assigned or expected to receive publichousing (Zhao and Xu 2000).1 The same estimate was not done for the college-educated, but itwas hypothesized that wages between the state and foreign sectors for skilled workers would bemuch smaller since FIEs offer good benefits packages to the college-educated.
The work of Yaohui Zhao (2000) bears on this issue. He argues that because of thesegmented nature of labor markets in China, FDI does indeed raise the relative wages of skilledworkers, but not because FIEs demand more skilled workers. Using urban household surveydata in 1996, Zhao finds that education is used to access the privileged state sector. Unskilledworkers are thus more abundant in the unprivileged or informal sectors, giving FIEs easy accessto unskilled workers. Conversely, FIEs must compete with the state sector for skilled workers,bidding up the relative wages of skilled workers in the foreign sector. He also finds that theproportion of skilled to unskilled workers is similar in the state and foreign sectors, suggestingthat FIEs do not employ more skilled labor than state firms, casting doubt on the notion thatrelative wage increases are a result of FIEs enjoying higher productivity. While FIEs do payhigher wages (including bonuses and cash subsidies) than state firms, these higher wages areunevenly distributed among workers of different educational levels. Including noncash benefitssuch as housing, less educated workers earn less in FIEs than in state enterprises, but moreeducated workers earn more.
Summary
In sum, then, we do find empirical evidence that over the last decade and a half, FDI hasraised wages in China, but the impact is small in relation to the effects of domestic investmentand to a lesser extent liberalization. The impact of foreign trade on wages is also significant, bothstatistically and economically. In fact, this latter variable might be picking up some of the impactof FDI on wages, since, as we discussed above, a great deal of FDI was directed toward theexport sector. Even if one adds up the effects of these two variables, implicitly attributing all theexport effect to FDI, the sum of the coefficients on FDI and trade is about 0.06, which is about1/3 of the impact of investment on wages (0.16). Of course, this is an overestimate of the FDIeffect because not all trade is due to FDI and foreign invested enterprises (though a significantamount is, perhaps as much as 60 percent).
D. Employment
1 Yaohui Zhao and Jianguo Xu. 2000. “Earnings Differentials Between State and Non-State Enterprises in UrbanChina,” mimeo, cited in Zhao (2000: 8).

20
One of the key reasons that local officials are so interested in attracting FDI in China isemployment creation. With economic reforms, a growing population, and the rising incidence oflayoffs in the state sector, there is tremendous pressure on local authorities to stave off the socialunrest that will result from an increasingly serious unemployment problem, particularly in urbanareas. While official urban unemployment rates stand at about five percent, scholars estimatethat the true unemployment rate could be two to five times that (Jiang 2002; Minqi 2001).2
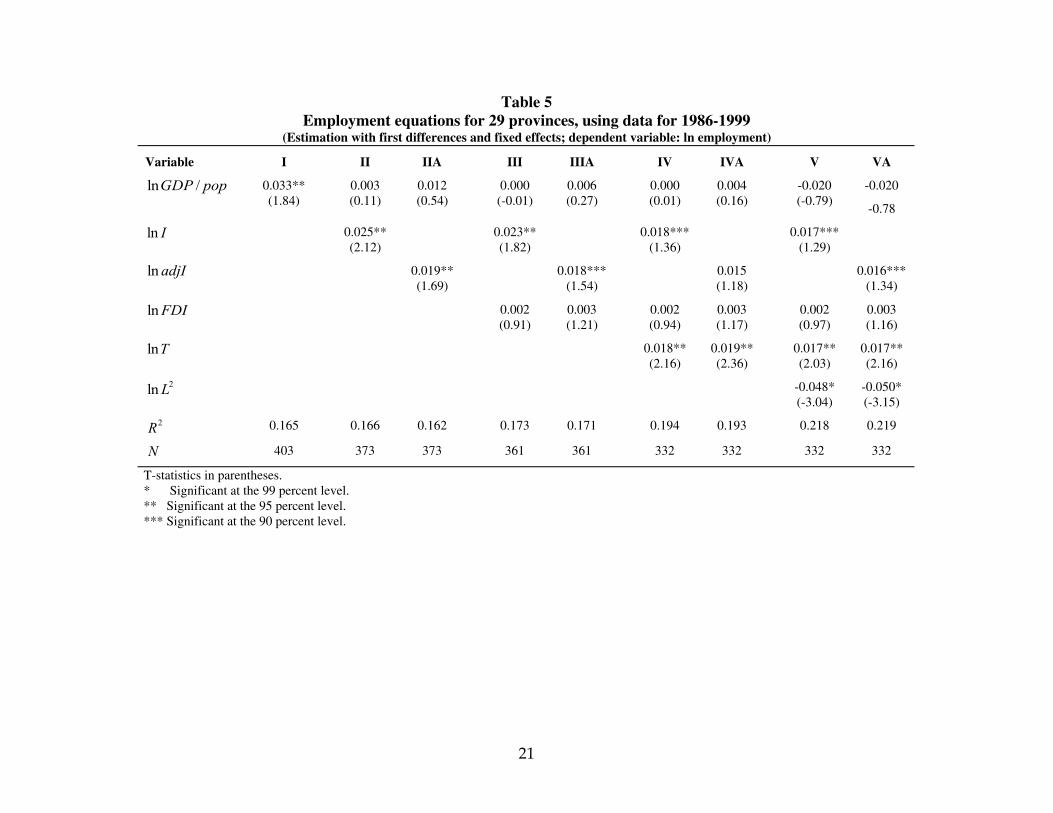
Whether FDI has actually contributed to employment creation in China is an openquestion, and so we take up this issue empirically here. The regression model is presented inequation (2), and, as in the section above, data are panel data for China’s 29 provinces between1986 and 1999. Employment, measured as the total number of remunerated jobs (including theself-employed) at year-end in a particular province, is a function of: per capita output,GDP pop ; investment, I (here again we use two measures of investment, gross and adjustedinvestment, which subtracts FDI from gross investment); foreign direct investment, FDI ; totalforeign trade ( imports+ exports = T ); and liberalization, L2 , the ratio of state sector output to allindustrial output. As in the wage regressions, provincial fixed effects are α ’s, a time trend hasbeen added to control for uniform shocks, and ε is a serially uncorrelated random error. Theregression is run in logs to get elasticities, and first differences were used to address non-stationarity in the variables. The results are detailed in Table 5 below.
(2) lnempit = αi + ln GDP / pop( )it
+ ln I it + lnFDIit + lnTit + ln Lit2 + timetrend + εit
2 Herein lies the reason that we did not incorporate measures of unemployment in any of our econometric work.Official rates are widely believed to be significant underestimates.
21
Table 5Employment equations for 29 provinces, using data for 1986-1999
(Estimation with first differences and fixed effects; dependent variable: ln employment)
Variable I II IIA III IIIA IV IVA V VA
lnGDP / pop 0.033**(1.84)
0.003(0.11)
0.012(0.54)
0.000(-0.01)
0.006(0.27)
0.000(0.01)
0.004(0.16)
-0.020(-0.79)
-0.020
-0.78
ln I 0.025**(2.12)
0.023**(1.82)
0.018***(1.36)
0.017***(1.29)
ln adjI 0.019**(1.69)
0.018***(1.54)
0.015(1.18)
0.016***(1.34)
lnFDI 0.002(0.91)
0.003(1.21)
0.002(0.94)
0.003(1.17)
0.002(0.97)
0.003(1.16)
lnT 0.018**(2.16)
0.019**(2.36)
0.017**(2.03)
0.017**(2.16)
lnL2 -0.048*(-3.04)
-0.050*(-3.15)
R2 0.165 0.166 0.162 0.173 0.171 0.194 0.193 0.218 0.219
N 403 373 373 361 361 332 332 332 332
T-statistics in parentheses.* Significant at the 99 percent level.** Significant at the 95 percent level.*** Significant at the 90 percent level.

22
Based on these regression results, whether one uses gross or adjusted investment, FDI hasno independent effect on employment. And even though using the adjusted investment measuredoes improve FDI’s significance somewhat, the potential impact of FDI on employment isnonetheless very small. The force of gross and adjusted investment declines across regressions I-VA, and once again, we believe that the actual coefficient lies somewhere in between the twoestimates of investment. Looking at the full model in VA, a one percent increase in adjustedinvestment will increase employment .016 percent, meaning that an increase of one standarddeviation from the mean raises employment by 1.7 percent. A one percent increase in trade has asimilar impact on employment as adjusted investment, about .017 percent, but an increase in tradeof one standard deviation from its mean increases employment by less than investment: 1.4percent. Still, this finding is a very significant one: trade has had a significant and positive impacton employment in China, much more so than FDI.
The results on the liberalization variable are consistent with the notion that all else equal,nonstate enterprises have generated more employment than state enterprises since reforms began.According to the regression results in VA, a one percent (standard deviation) increase in stateoutput as a percent of all industrial output will decrease employment by 0.05 percent (1.8 percent).This result reflects two things: that state firms tend to be more capital-intensive than other forms ofownership that have come about as a result of market reforms, and that state firms have beenshedding workers in recent years in response to the widespread impression that these firms areoverstaffed (the state sector shed nearly one-quarter of its workforce between 1995 and 1999(Zhao 2001: 2)). An important caveat must be noted before this result can be taken as a basis formaking predictions about liberalization and the future of employment. First, that liberalization hasbeen associated with job creation says nothing about the relative quality of jobs. Although there isclear evidence that liberalization is associated with higher wages (as is FDI), there is also evidencethat other measures of job quality such as security and benefits are better in the state sector, at leastfor less educated workers (Zhao 2000, 2001). That said, there is no evidence that FDI has been agood source of employment creation, except, perhaps in so far as it has led to exports.
The Role Of FDI In Exports
The importance of FDI in employment generation through exports, however, is worthy offurther scrutiny. It is true that the share of FIE's in exports has been growing rapidly: their exportsincreased from less than two percent of total Chinese exports in 1986 to 48 percent in 2000(UNCTAD 2002: 155). However, it is important to note that their share of imports rose during thesame period from six percent to 52 percent (Ibid). As we noted above, since FIE's are more capitalintensive than local firms, their role in job creation is modest. For example, in 1996, these firmsemployed only 5.4 million workers, or about 0.8 percent of the total labor force (Ibid). Thus,taking into account the role of exports in employment creation is not likely to modify our overallconclusion that FDI has not generated as much employment as other activities.
When combined with the analysis of its impact on investment in the next section, theoverall employment generating effect of FDI is placed in further doubt.
E. Crowding In/Crowding Out
In both the wage and employment regressions, FDI is included on its own as well as partof gross investment in order to separate the effects of FDI as a distinctive form of investment –
23
one that may tend to pay higher wages or create more (or less) employment than other forms. Butin order to fully appreciate its role, the relationship between FDI and domestic investment must beinvestigated, as it is not necessarily the case that FDI merely adds to labor demand as a part ofgross investment. FDI might encourage or crowd in domestic investment, as when there arestrong backward or forward linkages created by new foreign firms. Or, FDI could crowd outdomestic investment, as when foreign firms compete with domestic firms and drive them out ofbusiness.
Using panel data for the period 1970-96 in three developing regions, Asia, Africa and LatinAmerica, Manuel Agosin and Ricardo Mayer (2000) did an econometric study of whether foreigninvestment crowds in domestic investment. Their results indicate that in Asia, and to a lesserextent in Africa, there has been strong crowding in of domestic investment by FDI. In LatinAmerica, FDI has had a strong crowding out effect. China is one of the countries in their study,and they find that FDI has had a “neutral” effect on domestic investment; that is, it has neithercrowded in nor crowded out domestic investment. One problem with this study for China is thetime period under consideration. China did not allow FDI until 1979, and even then policyrestrictions were strict until the mid-1980s, so the China results deserve closer analysis.
In terms of this type of work on China, Haishun Sun (1998) does a simple regressionanalysis of the determinants of domestic investment in ten coastal provinces between 1983 and1995, when about 90 percent of FDI targeted China’s coastal region. Using income per capita (asa proxy for domestic savings), FDI, and other forms of foreign capital, he finds a strongsignificant positive correlation between FDI and domestic investment. Such a simple approach isunconvincing, however, as the problem of omitted variables (such as measures of policy) throwsthe causal link between FDI and domestic investment into serious question.
Among qualitative studies of the relationship between FDI and domestic investment inChina, the sentiment is less sanguine than Sun’s. Yasheng Huang (1998) argues that FDIprobably crowds out domestic investment because FIEs tend to be highly leveraged and competewith local firms for domestic financing. This leveraging is a direct result of policy incentives thatgrant preferred status to FIEs – Chinese partners are more motivated to qualify for FIE status thanto ensure adequate financial contributions from foreign partners. Thus the equity contribution byforeign investors often falls short of what is specified in the contract, and Chinese partners end upborrowing to cover the shortfall (Huang 1998).
Nicholas Lardy, in a classic analysis of China’s economic reform process, claims thatrather than financing increased levels of investment, China’s substantial capital inflows have beenused for three other purposes: (1) to increase the foreign exchange holdings of China’s CentralBank, which in the three years between 1994 and 1996 increased by US$83.3 billion, and in 1997by US$35 billion; (2) to provide funds for capital flight;11 and (3) to a much lesser extent, tofinance investment abroad by Chinese firms (Lardy 1998: 191-92). Lardy concludes that, despiteChina’s tremendous success in attracting FDI, it cannot be counted on to fulfill China’s substantialinvestment financing needs.
11 Lardy notes that the World Bank believes that large unexplained errors and omissions in China’s Balance ofPayments, almost US$18 billion in 1995 and almost US$15 billion in 1996, are a sign of large unrecordedcapital outflows (Lardy 1998: 191). Frank Gunter (1996) estimates capital flight from China during 1984-94,and his middle estimate is that over the sample period, total accumulated capital flight was somewherebetween US$50 billion and US$175 billion. In 1994, his estimate was US$20-US$35 billion, indicating therehas been an upward trend (Gunter 1996: 93).

24
We decided to test these conclusions by rerunning Agosin and Mayer’s (2000)econometric study on China, using our province-level panel data set for the years 1986-99. Theinvestment equation is as follows:
(3) Iit =α i + β1FDIit + β2FDIi,t−1 + β3FDIi,t− 2 + β4I i,t−1 + β 5Ii,t−2 + β6Gi,t−1 + β7Gi,t− 2 + YD + εit
where: I = gross investment/GDP; FDI = FDI/GDP; G = GDP growth; YD = year dummies;α ’s are provincial fixed effects; and ε is a serially uncorrelated random error. Since we areinterested in the long-term effects of FDI on investment, the formula for the relevant coefficient(beta hat long-term):
(4) ˆ β LT =
ˆ β jj=1
3
∑
1− ˆ β jj= 4
5
∑
If we cannot reject that ˆ β LT = 1 , there is no crowding in or out: an increase in FDI raises total
investment exactly by the same amount. If ˆ β LT > 1 , there is evidence for crowding in. Likewise, ifˆ β LT < 1 , there is evidence for crowding out. Table 6 below lists the results.

25
Table 6Investment equations for 29 provinces, using data for 1986-1999
(Estimation with fixed effects; dependent variable: gross investment, I)
Variable
FDI 0.523*(3.69)
FDIt−1 -0.212(-1.14)
FDIt− 2 -0.234**(-1.67)
It−1 0.878*(15.70)
It−2 -0.294*(-5.24)
Gt−1 0.109*(4.03)
Gt− 2 -0.003(-0.12)
Adjusted R-square 0.771
Observations 343
ˆ β LT 0.185(0.30)
T-statistics in parentheses.* Significant at the 99 percent level.** Significant at the 95 percent level.
Using a bootstrap method12 to assess the statistical significance of ˆ β LT , we found that wecould not reject the hypothesis that it was statistically equivalent to zero; the 95 percent confidenceinterval for of ˆ β LT is (-0.445, 0.696), and therefore does not include 1. We therefore conclude thatthere is evidence that FDI had a negative impact on Chinese domestic investment. There is strongevidence that FDI crowded out domestic investment during the late 1980s and 1990s in China, afinding consistent with that of Huang (1998) and Lardy (1998).
This is a very significant conclusion for assessing the overall promise of FDI to positivelyaffect China’s economy. Although it has contributed to wage increases its tendency to crowd outdomestic investment confirms its role in employment creation has not been a positive one.
12 Bootstrapping is a Monte Carlo method designed to produce estimates of the bias and variance of an estimator by
taking repeated random subsamples of the data, accumulating estimates of the quotient ˆ β LT , and using the standarddeviations of those estimates to get the overall variance of the bootstrap estimate (Kennedy 1993; Peters andFreedman 1984).
26
IV. Bidding for Investment
Bidding for investment is certainly not unique to China. For a number of years, economistsand policy makers have studied and even decried the so-called “War Between the States,” apopular name given to the U.S. inter-state competition for investment and jobs (Federal ReserveBank of Minneapolis 1994; Burke and Epstein 2001). Moreover, an enormous amount has beenwritten about tax competition in the European Union as well as internationally among nations. Butthe level to which this “War Between the Provinces” has risen in China is, perhaps, surprising,even to those well-schooled in the many paths of capital mobility.
This point was brought home to us rather starkly when one of us interviewed a Chineseofficial in a Northeastern coastal city, Dalian, about foreign investment.13 This official is theassociate director of one Dalian’s special economic zones, in this case, a high tech exportprocessing zone. We asked him, “Who is your greatest competitor when it comes to trying toattract foreign investment?” expecting the answer to be Vietnam, or Malaysia or, perhaps, Beijing.But his answer startled us: “Our biggest competitor is the export processing zone down thestreet.”14 Not only does one province or one town compete with another; but in China, there arenumerous zones – export processing zones, high tech zones, industrial zones – all of whichcompete for foreign investment. The result is cut throat competition.
The nature of this competition takes a number of forms even while the central governmenttries to limit and regulate it, primarily in order to preserve its tax revenue and also to promote itsindustrial policies. The central government determines the tax rates that foreign invested enterprisesmust pay. The various special zones established with the central government’s permission at thelocal level offer preferential tax rates, especially for desired types of investments, but these rates areset by the central government. Despite this central government control, holding constant theamount of investment, government tax revenue will fall as there is more foreign investment gettingpreferential rates. While much of this revenue goes to the central government, there is a complexrevenue sharing mechanism which sends some of it back to the provinces (Wong 2000).Presumably, provincial governments therefore receive a diminished amount of tax revenue to theextent that the amount going to the central government falls. (Wong 2000).
But there are other, indirect and potentially costly ways in which this inter-zone, inter-cityand inter-provincial competition occurs out of the reach of the central government’s control.According to an official whose job it is to attract foreign investment to a city in SoutheasternChina, “Under the general policies, the local and municipal governments can do some [things toattract companies]. For example, the local and municipal governments can reduce or return thetaxes enjoyed by local governments to the enterprises which [the] city [is] eager to attract,including the income tax and value added tax [which] belong to local and municipal governments(25 percent of the total VAT).”15 This potential decline in VAT revenue can be significant.
In addition, perhaps the most widely used incentive under the control of local andmunicipal governments is the provision of free or highly subsidized land, subsidies for electricityand other utilities, and sometimes, the building of roads and other infrastructure projectssupporting the factory sites. According to this same official, “Subsidies for the land are the mostused policies by municipal and local governments. Nearly for all projects, governments give the 13 These interviews were carried out in the PRC by Gerald Epstein between August, 2000 and July, 2001.14 Interview, August, 2000, Dalian, PRC.15 Interview with Foreign Investment Officer, Fujian Province, May, 2001.
27
subsidies for the land. The selling price of land is lower than the development cost. And for thelocal government encouraged projects, the price is cheap, [sometimes close] to zero.” The officialadds that “Local governments [have] less control over [the] price of water and energy. But theycan reduce or exempt some fees charged by governments.”16
Secondary literature confirms this interview information. The so-called “five connectionsand one leveling” (wutong yipping) – connecting roads, telecommunications, water, electricity andports and leveling of sites – were the main methods used to attract foreign investment to Shenzen,an SEZ near Hong Kong (Yeh 2000: 52). These methods have been used in many other parts ofthe country as well. Once again, these can cost the government significant amounts of money.They can also lead to enormous waste. Literally hundreds of economic and technical developmentzones (ETDZs) have been set up around the country to attract foreign investment. Many areestablished in small towns and villages. Evidently, while some are successful, “most are left idlebecause the flow of foreign investment does not materialize, leading to much waste of valuableland resources” (Yeh 2000: 56).
The other ways in which competition occurs is by promising good political connections sothat companies will be able to cut through the various types of red tape that the government throwsat them. It is not uncommon for foreign investors to be wined and dined by top governmentofficials or their children with the implicit promise that these connections, or guanxi, will help pavethe way to an easier corporate life.17
Why are these government officials so anxious to attract FDI? One reason must surely bethe fact that they believe it has a positive impact on their communities. But another is that localofficials who attract high levels of FDI have a much greater possibility of being promoted in thegovernment and/or party.18 Furthermore, and not to be underestimated for its appeal, is thatattracting foreign investment with an offer to give large subsidies and streamlined regulatorytreatment create enormous opportunities for graft and corruption (see more on this below).
One result of this competition may be an erosion of provincial government revenue, at leastin the short run. As we have seen, this loss can result from lower tax rates officially offered toinvestors investing in an economic zone, as well as the loss of fees and other income from theland and other assets.
To assess the impact of FDI on tax revenues, we returned to our panel and studied theevolution of provincial government revenue using regression methods.
16 Ibid.17 Interview with FIE business manager, Xiamen, Fujian, PRC, April, 2001. In another interview, a foreigninvestment official reports: “[We] reduced the regulations and procedures to improve the efficiency of governments;this is an important policy. Xiamen’s municipal government set up the Xiamen foreign investment executivecommittee to examine and approve the foreign investment projects. Then the enterprises only need to apply to thecommittee and not more departments.” Interview, May, 2001.18 Interview with Xiamen official, May, 2001.

28
Table 7Government revenue equations for 29 provinces, using data for 1986-1999
(Estimation with first differences and fixed effects; dependent variable: log of provincial tax revenue)
Variable I II III IV V VI VII VIII
lnGDP 0.114(0.99)
-0.013(-0.09)
lnGDPt−1 -0.069(-0.57)
0.071(0.47)
0.1661.06
0.026(0.16)
0.01(0.06)
0.066(0.35)
ln adjI 0.117***(1.64)
ln adjIt−1 -0.175**(-2.34)
-0.167**(-2.18)
0.210*(-2.76)
-0.209*(-2.73)
-.209*(-2.49)
ln FDIt−1 -0.036*(-2.75)
-0.036*(-2.76)
-0.036*(-2.75)
-0.035*(-2.49)
lnTt −1 0.172*(3.44)
0.171*(3.42)
0.175*(3.24)
lnL2 0.091(0.88)
ln L2t−1 -0.028
(-0.29)
R2 0.006 0.004 0.011 0.020 0.045 0.082 0.082 0.082
N 396 396 366 338 327 326 326 326
T-statistics in parentheses.* Significant at the 99 percent level.** Significant at the 95 percent level.*** Significant at the 90 percent level.
Table 7 estimates the impact of domestic (adjusted) investment, foreign direct investment,trade and liberalization on the provincial government revenue. All variables are in logs and aremeasured in first differences. The regressions show that government revenue is negativelyassociated with both domestic and foreign direct investment. On the other hand, trade is positivelyassociated with government revenue. These results are certainly consistent with the argument thatbidding for investment – both foreign and domestic – appears to reduce provincial governmentrevenue. This seems to be a significant cost of the de-centralized nature of the investment biddingprocess. As with the other regression results we have presented, however, this conclusion istempered to some extent by the positive impact of trade. To the extent that FDI contributes to trade,then, indirectly it might be contributing to tax revenue. But, these results suggest that in order tomeasure the positive impact of trade, one might need to subtract the bidding costs associated withattracting investment. It also suggests that as foreign investment becomes less and less exportoriented, as we discuss below, these trade related gains are likely to be significantly eroded.
Corruption
We suggested in the introduction that one way in which the possible social gains from FDIcan get dissipated is through graft and corruption. It is certainly the case that most Chinese peoplebelieve that corruption is a very large problem. Moreover, there have been some very large and

29
well publicized corruption scandals in China in recent years, including one in Xiamen, Fujianprovince in which dozens of local officials were convicted of smuggling, and more than ten weregiven the death penalty.
But, as far as we know, there have been no publicized arrests of officials for corruption inthe bidding process for foreign investment. However, there is little doubt that such corruption iswidespread. Daniel H. Rosen interviewed almost 100 expatriate managers of MNCs in China inthe late 1990s. Rosen reports that many managers complained of bribery and bribery relatedpayments to achieve approval of investments or win contracts (Rosen 1999: 218-26). Hesuggests, moreover, that having an effective and well connected patron in China, to help firmsnavigate around the maze of regulations, was perhaps the most important determinant of businesssuccess (ibid.).
Shang Jin-Wei (2000), in his provocatively titled paper, “Why Does China Attract SoLittle Foreign Investment,” claims that given China’s income and population, the amount offoreign investment it attracts falls well below the cross-country regression line which wouldpredict the quantity that ‘ought’ to flow there. He argues the difference is even greater if oneconsiders that a significant amount of investment is not really foreign: it is Chinese investment,round-tripped through Hong-Kong (see the discussion above). He attributes the low level offoreign investment to corruption and other government induced barriers to foreign investment.
Either way, it does seem that corruption may well be a costly institution which is reducingthe benefits of foreign investment for the Chinese population. Indeed, to the extent that thiscorruption is an integral part of the bidding process for FDI in this decentralized environment, itshould be seen as a further cost of FDI itself.
IV. China's Entry into the WTO
In November 1999, the Chinese and U.S. governments agreed to accession terms bywhich China could join the WTO. This agreement set the tone for agreements that China madewith other countries over the ensuing year and a half. In the fall of this year, after further intensenegotiations, China finally was admitted into the WTO. The basic terms of the agreement are asfollows (Lardy 2002; U.S. Trade Representative):
• Agricultural tariffs fall to an average of 17.5 percent by 2004, liberalization of imports of majoragricultural commodities, import and distribution rights granted to foreigners;
• Average tariff on industrial products falls to 9.4 percent by 2005, including elimination of alltariffs on high-technology products; auto tariffs fall from 80-100 percent to 25 percent by2006;
• Eliminates import quotas and licensing requirements by 2005;• Grants import and distribution rights to foreign corporations, allows them to set up wholly-
owned distribution, sales (including retail), shipping, and service networks over a three yearphase-in period;
• Financial services - banking, insurance, and securities - increased access phased in over fiveyears, culminating in full market access in all activities and regions, and national treatment forforeign banks; minority ownership in domestic securities firms and most insurance business;
• Telecom - ends ban on foreign investment, allows 50 percent ownership in value added(internet) and paging services within two years after accession; 49 percent ownership in mobiletelecom, domestic and international services phased in over five to six years;
30
• Other services - increased market access for professional services, including accounting,consulting, engineering, medical, and information technology;
• Commits China to implement and enforce international standards on protection of intellectualproperty; provides for increased access and distribution rights for motion pictures, music, andsoftware;
• United States agrees to extend China PNTR as a WTO member, phase out quotas on importsof Chinese textiles and apparel by 2004 (all other sectors already are fully open as a part ofannual extension of NTR).
Safeguards and Protections for the United States• Allows the United States to continue to treat China as a non-market economy in anti-dumping
cases for 15 years after accession; this methodology generally results in the application oflarger anti-dumping margins against Chinese imports;
• Permits the United States to implement a product-specific safeguard to prevent large importsurges from China; this safeguard, which allows the United States to impose restrictions onimports from China more easily than imports from other WTO members, would remain ineffect for 12 years after China’s WTO accession;
• Allows the continuation of a safeguard mechanism to prevent textile import surges until theend of 2008.
As these last points make clear, the Chinese government made many concessions to jointhe WTO, and indeed, made more concessions than virtually all other countries that joined (Lardy,2002). Why were the Chinese leaders so anxious to join? Many have argued that the principlereason was because they believed that joining would accelerate the flow of foreign investment intoChina and that foreign investment has been the engine of growth. This certainly seems to be truefor some of the policy makers.
But, another view is more compelling. As an official of the Ministry of Foreign Trade andCooperation (MOFTEC), perhaps the most active supporter of WTO admission in thegovernment, pointed out in an interview, the most important reason to join the WTO is to keep theprocess of liberalization moving forward.19 China is entering a difficult period as it tries to movefurther down the capitalist road. As state-owned enterprises continue to lay off workers, socialunrest and political pressure to reverse the liberalization process is certainly bound to increase.Having signed an international agreement to liberalize further, it will be difficult for these politicalforces to block further liberalization. Foreign investment is an important aspect of this process, butit is not the main goal of joining.
WTO, FDI and Employment Generation
As we indicated above, one of the motivations for joining the WTO is to attract more FDI,partly to counterbalance increasing unemployment, especially in the state sector, as liberalizationproceeds and state firms face increasing competition both from domestic and foreign firms.However, as we have shown, the past role of FDI in employment generation does not bode wellfor this strategy.
Some have argued, though, that WTO entry will increase FDI’s impact on employmentbecause China will have greater access to export markets. But as is shown in UNCTAD (2002)
19 Interview with MOFTEC official, Beijing, April, 2001.
31
and other studies, the role of exports in providing alternative employment is severely constrainedby the sheer size of the Chinese labor force. To absorb a large amount of Chinese labor, theChinese world export share would have to climb to politically unsustainable levels in a number ofindustries.
Moreover, the role of FDI in the balance of payments may also be a constraint on thesuccess of this strategy. UNCTAD (2002) reports that profits earned by FIE's in China exceedtheir export surpluses by a wide margin (UNCTAD, 2002). If these profits are exported back tothe home country, then the inflows of new FDI, over the long term, may significantly harm thebalance of payments.
Finally, FDI not only generates exports; it also generates a great deal of imports. China’slabor-intensive exports are also import-intensive. As a result, this foreign-invested export sector isnot a high value-added sector (UNCTAD, 2002, p. 155-156). The key, then, for FDI to play asubstantial role in improving labor outcomes would have to involve upgrading FDI – to producemore domestic capital goods and to generate more inputs and value added at home.
However, it is precisely this ability to restrict FDI to higher value added channels whichwill be constrained. WTO's rule of national treatment means that China will have to eliminateperformance requirements over FIE's unless it can extend them to domestic firms as well.Moreover, there will be pressure on the Chinese government to extend tax breaks and other specialtreatment from FIE enterprises to local ones, further undermining the Chinese government's abilityto conduct industrial policy and generate the upgrading of FDI and domestic investment as well.Of course, such upgrading will occur to some extent through general market forces. But theChinese government will not be able to accelerate and channel this process as it has done relativelysuccessfully for the last several decades.
V. Conclusion: Conflict, Cooperation and the Role of FDI in China’s Future
Our econometric results suggest that the direct impacts of FDI in China on employmentand wages are relatively modest, certainly much less powerful than the impact of domesticinvestment and exports. We also provide strong evidence that FDI crowds out domesticinvestment, and is associated with a decline in provincial tax revenue. In combination with thequestionable results on economic growth and productivity that we discussed earlier in the paper,these findings should certainly temper any unqualified cheerleading for FDI.
In addition, these lackluster findings on the benefits of FDI are not what one would expectif China’s vast potential consumer market afforded it significant bargaining power relative toMNCs. One would expect results indicating that FDI leads to at least some of the following:higher domestic tax revenue; higher wages and/or significantly more employment; or greatertechnology and productivity spillovers. Instead, our results suggest the bargaining power providedby China’s 1.3 billion consumers, in the context of a highly decentralized political system that isrife with corruption, is far from being realized. The lesson for other developing countries, mostwith only a fraction of China’s potential bargaining power, is that FDI does not proffer theautomatic boost to development that its proponents claim.
Our results also suggest that liberalization and exports have had a positive impact onwages and employment in China. So, it does appear that China’s policy of managed opening,combined with industrial policy and an export orientation, have generated economic growth. In
32
terms of exports, FDI has undoubtedly played an important role, but this impact has beentempered by the growth of imports and the low level of value added in these industries. Still,supported by periodic expansionary macroeconomic policies and controls of speculative capitalflows, these policies resulted in significant successes in promoting economic growth in China.
In terms of global conflict and cooperation, this low wage, labor intensive exportorientation, to a significant extent funded and organized by foreign investment, is also reaching itseconomic and political limits. Politically, there is opposition from countries in the developed worldto continued huge trade surpluses with China. Economically, these low wage platforms hold littlepromise for generating high wage, high value added jobs.
China’s entry into the WTO was an attempt by China’s leaders to sustain economic growthby locking in and expanding its policy of economic liberalization, thereby making it difficult foropposition forces within the country to block the next, more difficult stages as China travels downthe capitalist road. As part of this plan, the leadership attempted to maintain high levels of FDI, thistime with investment that would generate more technology transfer and higher value added jobs.
But, in return, China has had to promise to give full access to its market to foreign firms, totie its hands in its ability to carry out industrial policy, and finally to pay huge costs in terms ofintellectual property rights. This will severely limit China's ability to generate the technologicalupgrading required to generate more value added and employment. Moreover, with the financialliberalization that is very likely to follow the entry of foreign financial firms, the dismantling ofcredit allocation and capital controls is almost certain to follow. In short, the major tools which theChinese government has been able to use to manage its economy will be compromised once theWTO agreements are fully implemented.
This appears to be highly problematic for the Chinese people. What about for the nature ofconflict versus cooperation for workers in other parts of the globe?
China’s opening and entry into the WTO, to the extent that it will enhance the value ofChina as a location for foreign investment, might severely reduce investment elsewhere in Asia,and thereby increase the already intense competition for investment there. However, given the lowtariffs on Chinese goods, this result is far from certain. It still might be cheaper for firms to locatein Vietnam, for example, and export to Southwest China. This will depend on how investmentfriendly the Vietnamese are compared with the local party officials across the border. It will alsodepend on the intricacies of the Multi Fiber Agreement and where quotas are available.
It also will depend on the relative labor costs: China has lower wages than most developingand developed countries, but its labor costs, taking into account productivity, is not necessarilylower. In manufacturing, for example, they are lower than many, but not all developing countries.For example, its costs are higher than Singapore, but lower than Bolivia, Chile and Mexico(UNCTAD, 2002: 158). Hence, the impact of China's joining the WTO will depend not only onthe evolution of China’s wages relative to the rest of the world, but also the evolution ofproductivity and regulations. There are many uncertainties in this regard. Still, there is no doubtthat China will provide enormous competition for many developing countries.
As for cooperation versus conflict with workers in the industrialized countries, this too issomewhat unclear. The export orientation of China’s development so far has certainly led toenormous potential conflicts with workers in the North. If the next phase of Chinese development
33
involves a substantial further export push to generate more employment, the conflict level willincrease, possibly to the boiling point.
But if the next phase of China’s development includes more domestically-orientedinvestment, it is possible that some of the conflict could be reduced. Although Northern FDI intoChina might be very large, it will probably be for the most part be aimed at the Chinese market.While U.S. workers are unlikely to benefit from this foreign investment, the level of tradecompetition in the U.S. market could level off.
The best outcome for both China and workers in the rest of the world, however, would befor the Chinese government to abandon its obsession with FDI and to re-orient its economic policyto economic development at home, focused first and foremost on domestic resources:expansionary macroeconomic policy, control of the financial sector, upgrading of domesticinvestment and production, environmental protection and the enhancement of labor's role in theeconomy. And unifying more democratic control over bargaining with MNC's and reducingcorruption will do much to harness the enormous potential bargaining power of the Chinese peoplevis a vis international capital.
34
References
Aitken, Brian and Ann Harrison. 1999. “Do domestic firms benefit from foreign investment?Evidence from Venezuela.” American Economic Review 89: 605-18.
Aitken, Brian, Ann Harrison, and Robert E. Lipsey. 1995. “Wages and Foreign Ownership: aComparative Study of Mexico, Venezuela, and the United States.” NBER Working Paper5102. (A later cite is 1996. Journal of International Economics (40): 345-371.)
Agosin, Manuel R. and Ricardo Mayer. 2000. “Foreign Investment in Developing Countries:Does it Crowd in Domestic Investment?” UNCTAD Discussion Paper No. 146.
Barnet, Richard and John Cavanaugh. 1994. Global Dreams: Imperial Corporations and the NewWorld Order. New York: Simon and Schuster.
Branstetter, Lee G. and Robert C. Feenstra. 1999. “Trade and Foreign Direct Investment in China:A Political Economy Approach.” NBER Working Paper 7100.
Braunstein, Elissa and Gerald Epstein. 1999. “Creating International Credit Rules and theMultilateral Agreement on Investment: What are the Alternatives?” in Jonathan Michie andJohn Grieve Smiths (eds.) Global Instability: The Political Economy of World EconomicGovernance. London and New York: Routledge Press.
Burke, James and Gerald Epstein, 2001. "Threat Effects and the Internationalization ofProduction", http://www.umass.edu/peri
Chen, Chunlai. 1996. “Recent Developments in Foreign Direct Investment in China.” TheUniversity of Adelaide Chinese Economy Research Unit Working Paper No. 96/3.
Chen, Chunlai. 1997a. “Foreign Direct Investment and Trade: An Empirical Investigation of theEvidence from China.” The University of Adelaide Chinese Economics Research CentreWorking Paper No. 97/11.
Chen, Chunlai. 1997b. “The Composition and Location Determinants of Foreign DirectInvestment in China’s Manufacturing.” The University of Adelaide Chinese EconomicsResearch Centre Working Paper No. 97/13.
Chen, Chunlai. 1997c. “Comparison of Investment Behaviour of Source Countries in China.” TheUniversity of Adelaide Chinese Economics Research Centre Working Paper No. 97/14
Chen, Chunlai. 1997d. “The Evolution and Main Features of China’s Foreign Direct InvestmentPolicies.” The University of Adelaide Chinese Economics Research Centre Working PaperNo. 97/15.
Chen, Chung, Lawrence Chang and Yimin Zhang. 1995. “The Role of Foreign Direct Investmentin China’s Post-1978 Economic Development.” World Development 23(4): 691-73.
35
Cheng, Leonard K. and Yum K. Kwan. 1999. “Foreign Capital Stock and Its Determinants,” inYanrui Wu (ed.) Foreign Direct Investment and Economic Growth in China.Chelthenham, UK and Northampton, MA: Edward Elgar.
Cheng, Leonard K. and Yum K. Kwan. 2000. “The Location of Foreign Direct Investment inChinese Regions. Further Analysis of Labor Quality,” in Takatoshi Ito and Anne O.Krueger (eds.) The Role of Foreign Direct Investment in East Asian EconomicDevelopment. Chicago and London: University of Chicago Press.
Chi Peter S.K. and Chang Kao. 1995. “Foreign Investment in China: A New Data Set.” ChinaEconomic Review 6(1): 149-55.
Chiu, Lee-in Chen. 1995. “The Pattern and Impact of Taiwan’s Investment in Mainland China,”in Sumner J. La Croix, Michael Plummer and Keun Lee (eds.) Emerging Patterns of EastAsian Investment in China From Korea, Taiwan and Hong Kong. Armonk, New York:M.E. Sharpe.
Coughlin, Cletus C. and Eran Segev. 2000. “Foreign Direct Investment in China: A SpatialEconometric Study.” World Economy 23(1): 1-23.
Crotty, James, Gerald Epstein and Trish Kelly. 1998. “Multinational Corporations and the Neo-Liberal Regime,” in Dean Baker, Gerald Epstein and Robert Pollin (eds.) Globalizationand Progressive Economic Policy. Cambridge, UK: Cambridge University Press.
Dees, Stèphane. 1998. “Foreign Direct Investment in China: Determinants and Effects.”Economics of Planning 31: 175-94.
Federal Reserve Bank of Minneapolis, 1994. “Congress Should End the Economic War Amongthe States,” Annual Report
Feenstra, Robert C. and Gordon H. Hanson. 1997. “Foreign direct investment in Mexico andrelative wages: Evidence from Mexico’s maquiladoras.” Journal of InternationalEconomics 42: 371-93.
Fung, K.C. 1996. “Accounting for Chinese Trade: Some National and Regional Considerations.”NBER Working Paper 5595.
Greider, William. 1997. One World, Ready or Not: The Manic Logic of Global Capitalism. NewYork: Simon & Schuster.
Gunter, Frank R. 1996. “Capital Flight from the People’s Republic of China: 1984-1994.” ChinaEconomic Review 7(1): 77-96.
Haddad M. and A. Harrison. 1993. “Are there positive spillovers from direct foreign investment?”Journal of Development Economics 42: 51-74.
Hanson, Gordon H. 2001. “Should Countries Promote Foreign Direct Investment?” UNCTADG-24 Discussion Paper Series No. 9.
36
Hanson, Gordon H. and Ann Harrison. 1995. “Trade, Technology and Wage Inequality.” NBERWorking Paper No. 5110.
Harrold, Peter and Rajiv Lall. 1993. “China reform and development in 1992-93.” World BankDiscussion Paper No. 215. Washington, D.C.: The World Bank. P. 24.
Head, K. and J. Ries. 1994. “Inter-city competition for foreign investment: Static and dynamiceffects of China’s incentive areas.” Mimeo, Faculty of Commerce, University of BritishColumbia.
Henley, John, Colin Kirkpatrick and Georgina Wilde. 1999. “Foreign Direct Investment in China:Recent Trends and Current Policy Issues.” The World Economy 22(2): 223-43.
Huang, Fanzhang. 1995. “China’s Utilization of Foreign Capital and the Related Policies.” Journalof Asian Economics 6(2): 217-32.
Huang, Yasheng. 1998. FDI in China: An Asian Perspective. Singapore: The Institute ofSoutheast Asian Studies.
Huang, Yasheng. 1999. “The Institutional Foundation of Foreign-Invested Enterprises (FIEs) inChina.” The Davidson Institute Working Paper Series, Working Paper No. 264.
International Monetary Fund. Various years. Yearbook of International Financial Statistics.Washington, D.C.: IMF.
Jiang, Xueqin. 2002. “Letter from China.” The Nation 274(8): 23-25.
Kaiser, Stefan, David A. Kirby and Ying Fan. 1996. “Foreign Direct Investment in China: AnExamination of the Literature.” Asia Pacific Business Review 2(3): 44-65.
Kamath, Shyam. 1990. “Foreign Direct Investment in a Centrally Planned Developing Economy:The Chinese Case.” Economic Development and Cultural Change.
Kennedy, Peter. 1993. A Guide to Econometrics, Third Edition. Cambridge, MA: MIT Press.
Kim, Si Joong. 1995. “Korean Direct Investment in China: Perspectives of Korean Investors,” inSumner J. La Croix, Michael Plummer and Keun Lee (eds.) Emerging Patterns of EastAsian Investment in China From Korea, Taiwan and Hong Kong. Armonk, New York:M.E. Sharpe.
Kueh, Y. Y. 1992. “Foreign Investment and Economic Change in China.” China Quarterly 131:637-90.
Kwok, Reginald Yin-Wang. 1995. “Hong Kong Investment in South China,” in Sumner J. LaCroix, Michael Plummer and Keun Lee (eds.) Emerging Patterns of East AsianInvestment in China From Korea, Taiwan and Hong Kong. Armonk, New York: M.E.Sharpe.

37
La Croix, Sumner J. and Yibo Xu. 1995. “Political Uncertainty and Taiwan’s Investment inXiamen’s Special Economic Zone,” in Sumner J. La Croix, Michael Plummer and KeunLee (eds.) Emerging Patterns of East Asian Investment in China From Korea, Taiwanand Hong Kong. Armonk, New York: M.E. Sharpe.
Lardy, Nicholas R. 1994. China in the World Economy. Washington, D.C.: Institute forInternational Economics.
Lardy, Nicholas R. 1998. China’s Unfinished Economic Revolution. Washington, D.C.:Brookings Institution Press.
Lardy, Nicholas R. 2002. Integrating China into the Global Economy. Washington, D.C:Brookings Institution Press.
Lee, Keun “Structural Changes in the Korean Economy and Korean Investment in China andASEAN,” in Sumner J. La Croix, Michael Plummer and Keun Lee (eds.) EmergingPatterns of East Asian Investment in China From Korea, Taiwan and Hong Kong.Armonk, New York: M.E. Sharpe.
Levin, Andrew and Lin, Chien-Fu. 1992. “Unit Root Tests in Panel Data: Asymptotic and FiniteSample Properities.” University of California at San Diego Discussion Paper No. 92-93.
Lipsey, Robert E. 2000. “Affiliates of U.S. and Japanese Multinationals in East Asian Productionand Trade,” in Takatoshi Ito and Anne O. Krueger (eds.) The Role of Foreign DirectInvestment in East Asian Economic Development. Chicago and London: The University ofChicago Press.
Liu, X., H. Song, Y. Wei and P. Romilly. 1996. “Country characteristics and foreign directinvestment in China: A panel data analysis.” Weltwirschaftliches Archiv 133(2): 313-29.
Li, Minqi. 2001. “China’s Urban Unemployment: Exposed ‘Disguised Unemployment’ orInsufficient Aggregate Demand?” PERI Working Paper Number 22.
National Bureau of Statistics, People’s Republic of China. Various years. China StatisticalYearbook. Beijing: China Statistics Press.
Naughton, Barry. 1995. Growing out of the plan. Chinese economic reform, 1978-1993.Cambridge and New York: Cambridge University Press.
Naughton, Barry. 1996. “China’s Emergence and Prospects as a Trading Nation.” BrookingsPapers on Economic Activity 2: 273 – 344.
Paus, Eva A. and Michael Robinson. 1998. “Globalization and Labor: The Impact of DirectForeign Investment on Real Wage Developments, 1968-1993.” Paper prepared for theXXI International Congress of the Latin American Studies Association, Chicago, Sept. 24-26.
Peters, S.C. and D.A. Freedman. 1984. “Some Notes on the Bootstrap in Regression Problems.”Journal of Business and Economic Statistics 2: 406-9.

38
Rosen, Daniel H. 1999. Behind the Open Door; Foreign Enterprises in the Chinese Marketplace.Washington, D.C.: Institute for International Economics.
Rozelle, S., Y. Ying and M. Barlow. Undated. “Targeting transaction costs: An evaluation ofinvestment policies in China’s foreign trade zones.” Mimeo, Food Research Institute,Stanford University.
Shan, Jordan, Gary Tiann and Fiona Sun. 1999. “Causality Between FDI and Economic Growth,”in Yanrui Wu (ed.) Foreign Direct Investment and Economic Growth in China.Chelthenham, UK and Northampton, MA: Edward Elgar.
Shirk, Susan L. How China Opened its Door: The Political Success of the PRC’s Foreign Tradeand Investment Reforms. Washington D.C.: The Brookings Institution, 1994.
Sun, Haishun. 1998. “Macroeconomic Impact of Direct Foreign Investment in China: 1979-96.”The World Economy 21(5): 675-94.
Sun, Haishun. 1999. “FDI, Trade and Transfer Pricing,” in Yanrui Wu (ed.) Foreign DirectInvestment and Economic Growth in China. Chelthenham, UK and Northampton, MA:Edward Elgar.
UNCTAD, China's Accession to WTO: Managing Integration and Industrialization, in UNCTAD,2002.
UNCTAD. Various years. World Investment Report. New York: UNCTAD.
UNCTAD. 2002. Trade and Development Report, 2002. New York: UNCTAD.
United States Trade Representative. 2002. “China’s Accession to the WTO.”http://www.ustr.gov/regions/china-hk-mongolia-taiwan/accession.shtml.
Wei, Shang-Jin. 1995. “The Open Door Policy and China’s Rapid Growth: Evidence from City-Level Data,” in Takatoshi Ito and Anne O. Krueger (eds.) Growth Theories in Light of theEast Asian Experience. Chicago: The University of Chicago Press.
Wei, Shang-Jin. 1996. “Foreign Direct Investment in China: Sources and Consequences,” inTakatoshi Ito and Anne O. Krueger (eds.) Financial Deregulation and Integration in EastAsia. Chicago: The University of Chicago Press.
Wei, Shang-Jin. 2000. “Why Does China Attract so Little Foreign Direct Investment?” inTakatoshi Ito and Anne O. Krueger (eds.) The Role of Foreign Direct Investment in EastAsian Economic Development. Chicago and London: University of Chicago Press.
Wei, Sung Shou and Lishui Zhu. 1995. “Growth of Investment in Xiamen,” in Sumner J. LaCroix, Michael Plummer and Keun Lee (eds.) Emerging Patterns of East AsianInvestment in China From Korea, Taiwan and Hong Kong. Armonk, New York: M.E.Sharpe.

39
Wong, Christine P.W. 2000. "Central-local Relations Revisited: The 1994 Tax Sharing Reformand Public Expenditure Management in China", mimeo World Bank Office, China.
World Bank. 1992. China Strategies for Reducing Poverty in the 1990s. Washington D.C.:World Bank.
World Bank. 1994. China Foreign Trade Reform. Washington D.C.: World Bank.
World Bank. 1997. China Engaged: Integration with the Global Economy. Washington, D.C.:The World Bank.
Yeh, Anthony Gar-on. 2000. "Foreign Investment and Urban Development in China", in Si-mingLi and Wing-shing Tang, eds. China's Regions, Polity and Economy: A Study of SpatialTransformation in the Post-Reform Era. Hong Kong: The Chinese University Press,2000, pp. 35-65.
Yong, Wang. 2000. China's Domestic WTO Debate" China Business Review, January-February,2000.
Young, Alwyn. 2000. “The Razor’s Edge: Distortions and Incremental Reform in the People’sRepublic of China.” The Quarterly Journal of Economics 115(4): 1091-135.
Young, Stephen, and Ping Lan. 1997. “Technology transfer to China through foreign directinvestment.” Regional Studies 31(7): 669-79.
Zhao, Yaohui. 2000. “Foreign Direct Investment and Relative Wages: The Case of China.” ChinaCenter for Economic Research Working Paper No. E2000013.
Zhao, Yaohui. 2001. “Earnings Differentials between State and Non-State Enterprises in UrbanChina.” China Center for Economic Research Working Paper No. E2001001.
Zhu, Gangti and Ding Lu. 1998. “Evidence of Spill-over Efficiency: Implication on IndustrialPolicies Towards Foreign Direct Investment in China.” The Singapore Economic Review43(1): 57-73.

40
Appendix A: Data Appendix
Unless otherwise indicated, the data discussed below are a compendium of two keysources: a provincial-level data set generously given by Robert Feenstra that covered the years1980-95, originally culled from the statistical yearbooks of individual provinces and regions inChina, supplemented by data taken from the China Statistical Yearbook, published annually by thePRC’s National Bureau of Statistics. Because the latter is generally considered a more reliablesource, where possible we have relied on these statistics.
Current vs. Constant Dollars. Unless otherwise discussed, all units are in nominalyuan. This choice was taken as a result of our inability to get reliable deflators for the full set ofvariables, especially trade. It should be noted, though, that when we tried the regressions using theconsumer price index on wages and the GDP deflator on everything else, the results wereconsistent with the nominal numbers.
Wages are figured as the average annual wage for staff and workers, which includes thosewho work for wages and salaries with the exception of: teachers in schools run locally andforeigners and persons coming from Hong Kong Macao, and Taiwan and working in state-ownedeconomic firms. Wages are calculated based on the total remuneration paid to staff and workers,regardless of source or category.
Employment is the total number of jobs held in a province during a particular year. Itincorporates all individuals working for remuneration and earning business income, including: allstaff and workers, re-employed retirees, self-employed workers, and employed rural workers.
Labor Force is figured as the total population fifteen and over by province. This is distinctfrom the concept of “economically active population” in that the latter includes only those alreadyin the paid labor force or looking for remunerative work. We chose the wider definition to takeaccount of those too discouraged to look for work (a potentially sizeable number in light ofChina’s employment problems), as well as to incorporate the potential labor of individuals thatmove in and out of the workforce on a regular basis (in particular married women).
Investment. This category, termed “total investment in fixed assets” in Chinese statisticalrecords, refers to the total volume of activities in construction and the purchase of fixed assets inmonetary terms, regardless of the source of funds (including state enterprises and FDI, but notgovernment spending). It is classified into four parts: capital construction, innovation, real estate,and other.
Foreign Direct Investment includes all investments inside China by foreign enterprisesand economic organizations or individuals (including those from Hong Kong, Macao, andTaiwan). It includes re-invested earnings as well as funds that enterprises borrow from abroad.Our measure of FDI includes only actual (as opposed to contracted) investments. FDI is recordedin U.S. dollars; we transformed these into yuan using the relevant exchange rate published in theIMF’s Yearbook of International Financial Statistics.
Trade includes all goods imported and exported outside the boundary of China to andfrom the relevant province. Imports are calculated at CIF, while exports are calculated at FOB.This data was taken from the Almanac of Foreign Economic Relations and Trade (various years),
41
and we transformed these figures from US$ into yuan using the relevant exchange rate publishedin the IMF’s Yearbook of International Financial Statistics.
Government Revenue includes the following: tax revenue, special revenues (includingspecial fees such as for education); other revenues, including revenue from repayment of loans,donations and grants; and planned subsidies for the losses of state-owned enterprises (a negativerevenue).
Industrial Output is the total volume of industrial products sold or available for sale in agiven year. State industrial output is a subset of this category, and reflects all industrial outputproduced by state enterprises.