bannister - stifel nicolaus mid-2011 macro outlook
TRANSCRIPT
8/6/2019 Bannister - Stifel Nicolaus Mid-2011 Macro Outlook
http://slidepdf.com/reader/full/bannister-stifel-nicolaus-mid-2011-macro-outlook 1/59
All relevant disclosures and certifications appear on pages 58 - 59 of this report.
July 11, 2011
Stifel Nicolaus Mid-2011 Macro Outlook Slide
DeckBarry B. Bannister, CFA (443) 224-1317 [email protected]
Context - Interlocking structural challenges: U.S. needs traction, the EU a unified bond market, and Chinarebalancing. Favored Sectors: Technology, Communications, Health Tech., Finance (i.e., growth stocks and depressed rate sensitive) and Source of Funds: Non-Energy Minerals, Energy Minerals, and Mineral feeder industries(ex., Machinery, Oil Service).
In our view:
TRACTION: The U.S. structural challenge is to transfer private housing liabilities to the public sector while levitatingasset values until nominal GDP growth offsets “missing” housing investment.
Outlook: U.S. succeeds in 2H11 GDP traction, U.S. dollar stabilizes, commodities roll over April-December 2011,2H11 corporate investment improves, and the S&P 500 rises, bounded at the low end by 1,200 and high end at 1,400fair value (~5% over-shoot either side of 200dma).
UNITY: The EU structural challenge is a transfer of fiscal sovereignty to a single bond market while preservingsolvency, despite a stubbornly hawkish and increasingly vulnerable ECB.
Outlook: EUR/USD down to ~1.35 as peripheral debt situation is far from over. European central bank balance sheetsmay be the next in focus. Portuguese public and Spanish private debt require restructuring, possibly along the lines of the Greek debt swaps and maturity extensions.
REBALANCE: The Chinese structural challenge is to achieve the first “soft landing” in Emerging Market historyfollowing years of rapid credit growth, while rebalancing growth to bottom-up consumption despite such a directivecoming from top-down authority.
Outlook: Despite Chinese inflation peaking we see Chinese GDP weakening sharply in 2H11 with a traditional lag tomonetary tightness, thereby significantly weakening construction-dependent commodities. Top-down authority canorder fixed investment, but not consumption.
Sections
• Since 4/4/11 we have said the Hard Asset vs. Paper Asset trade, a defining trade for leadership since 2002,is over (page 5-13)
• Favored Sectors: Technology, Communications, Health Tech., Finance (i.e., growth stocks and depressedrate sensitive) (page 14)
• Source of Funds: Non-Energy Minerals, Energy Minerals, Mineral feeder industries (ex., Machinery, Oil
Service) (page 15-16)
• We see S&P 500 bouncing off the 200 day average in 2011, especially weak in summer, then 1,400 by theend of year (page 17-26)
• We see WTI Oil ~$75/bbl.in a year (more supply, less demand), but not without Asia slowing and Libyareturning (page 27-34)
Macro & Portfolio Strategy
Stifel Nicolaus does and seeks to do business with companies covered in its research reports. As a result,investors should be aware that the firm may have a conflict of interest that could affect the objectivity of thisreport. Investors should consider this report as only a single factor in making their investment decision.
8/6/2019 Bannister - Stifel Nicolaus Mid-2011 Macro Outlook
http://slidepdf.com/reader/full/bannister-stifel-nicolaus-mid-2011-macro-outlook 2/59
• Since commodities have become a financial asset, they should be subject to/pressured by a monetaryrelationship (page 35-38)
• The frightening scenario – is the commodity market signaling a 20% S&P 500 bear market betweenApril-August 2011? (page 39-45)
• Fed & Treasury are brilliantly converting a “Depression” into debt a work-out; we see the 10-year near 4%within a year (page 46-53)
• U.S. fiscal deficits are desirable, inflation should average about 3% to 2015, and debt deflation is a far greater risk (page 54-57)
Page 2
Macro & Portfolio Strategy July 11, 2011

8/6/2019 Bannister - Stifel Nicolaus Mid-2011 Macro Outlook
http://slidepdf.com/reader/full/bannister-stifel-nicolaus-mid-2011-macro-outlook 3/59
Stifel Nicolaus Mid-2011 Macro Outlook Slide
Interlocking Structural Challenges: Traction, Unity anAs of July 2011 S&P 500 1,353 (7/7/11) 10-Yr. 3.14% / 10/2yr. 267bps WTI Oil $99/bbl. / CRB-CCI 642
In our view:
(1) Context - Interlocking structural challenges: U.S. needs traction, the EU a single bond market, a
(2) Since 4/4/11 we have said the Hard Asset vs. Paper Asset trade, a defining trade for leadership s
(3) Favored Sectors: Technology, Communications, Health Tech., Finance (i.e., growth stocks, depr
(4) Source of Funds: Non-Energy Minerals, Energy Minerals, Mineral feeder industries (ex., Machine
(5) We see S&P 500 bouncing off the 200 day average in 2011, especially weak in summer, then 1,40(6) We see WTI Oil ~$75/bbl. in a year (more supply, less demand), but not without Asia slowing and
(7) Since commodities have become a financial asset, they should be subject to/pressured by a mo
(8) The frightening scenario – is the commodity market signaling a 20% S&P 500 bear market betwe
(9) Fed & Treasury are brilliantly converting a “Depression” into debt a work-out; we see the 10-yea
(10) U.S. fiscal deficits are desirable, inflation should average about 3% to 2015, and debt deflation i
Barry B. Bannister, CFAManaging Director, Equity Research - Macro & Sector Strategy
Stifel Nicolaus & Co. [email protected] 443-224-1317
Stifel Nicolaus does and seeks to do business with companies covered in its research reports. As a result, the firm may have a conflict of interest that could affect the objectivity of this report. Investors should cons
factor in making their investment decision.
All relevant disclosures and certifications can be found on page 58-59 of this report and on the rese
Macro & Portfolio Strategy
8/6/2019 Bannister - Stifel Nicolaus Mid-2011 Macro Outlook
http://slidepdf.com/reader/full/bannister-stifel-nicolaus-mid-2011-macro-outlook 4/59
Structural Challenges: Traction (U.S.), Unity (EU), Re
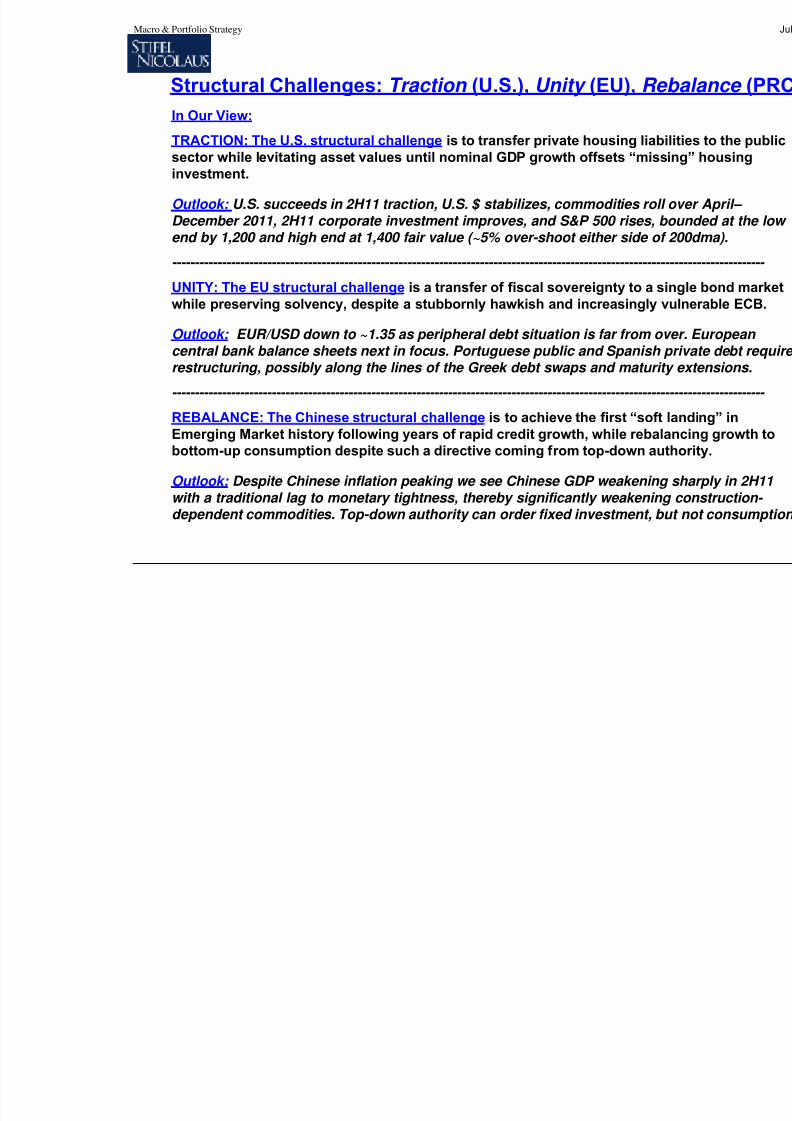
In Our View:
TRACTION: The U.S. structural challenge is to transfer private housing liabsector while levitating asset values until nominal GDP growth offsets “missinvestment.
Outlook: U.S. succeeds in 2H11 traction, U.S. $ stabilizes, commodities rolDecember 2011, 2H11 corporate investment improves, and S&P 500 rises, bend by 1,200 and high end at 1,400 fair value (~5% over-shoot either side o
-----------------------------------------------------------------------------------------------------------
UNITY: The EU structural challenge is a transfer of fiscal sovereignty to a s
while preserving solvency, despite a stubbornly hawkish and increasingly
Outlook: EUR/USD down to ~1.35 as peripheral debt situation is far from ocentral bank balance sheets next in focus. Portuguese public and Spanish restructuring, possibly along the lines of the Greek debt swaps and maturi
-----------------------------------------------------------------------------------------------------------
REBALANCE: The Chinese structural challenge is to achieve the first “softEmerging Market history following years of rapid credit growth, while rebal
bottom-up consumption despite such a directive coming from top-down au
Outlook: Despite Chinese inflation peaking we see Chinese GDP weakeningwith a traditional lag to monetary tightness, thereby significantly weakenindependent commodities. Top-down authority can order fixed investment, b
Macro & Portfolio Strategy
8/6/2019 Bannister - Stifel Nicolaus Mid-2011 Macro Outlook
http://slidepdf.com/reader/full/bannister-stifel-nicolaus-mid-2011-macro-outlook 5/59
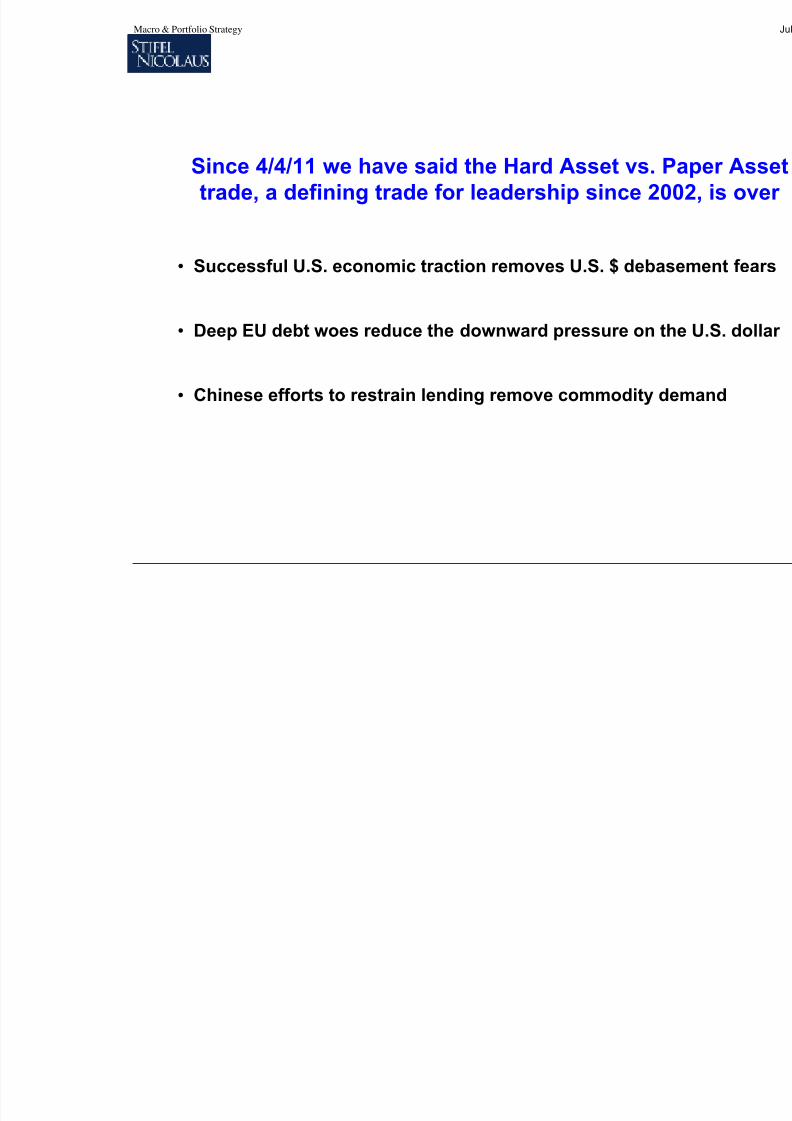
Since 4/4/11 we have said the Hard Asset vs. trade, a defining trade for leadership since 20
• Successful U.S. economic traction removes U.S. $ deba
• Deep EU debt woes reduce the downward pressure on t
• Chinese efforts to restrain lending remove commodity d
Macro & Portfolio Strategy
8/6/2019 Bannister - Stifel Nicolaus Mid-2011 Macro Outlook
http://slidepdf.com/reader/full/bannister-stifel-nicolaus-mid-2011-macro-outlook 6/59
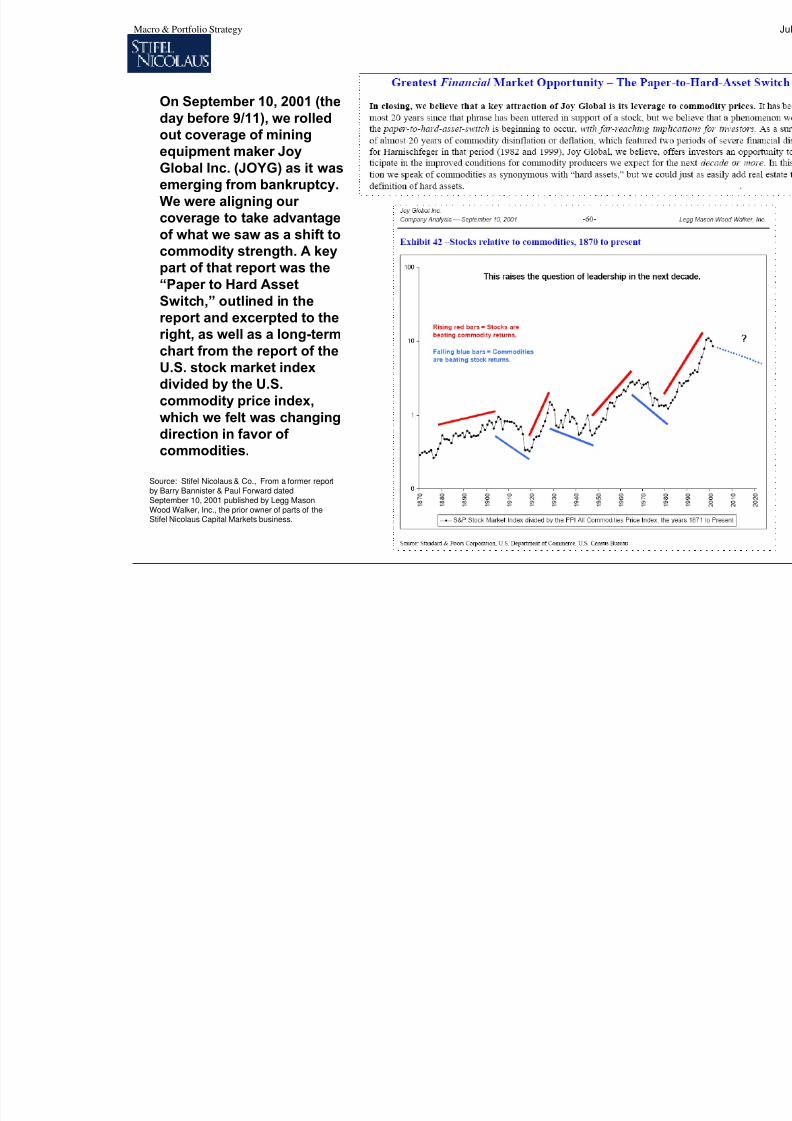
On September 10, 2001 (theday before 9/11), we rolledout coverage of mining
equipment maker JoyGlobal Inc. (JOYG) as it wasemerging from bankruptcy.We were aligning our coverage to take advantageof what we saw as a shift tocommodity strength. A keypart of that report was the“Paper to Hard Asset
Switch,” outlined in thereport and excerpted to theright, as well as a long-termchart from the report of theU.S. stock market indexdivided by the U.S.commodity price index,which we felt was changingdirection in favor of
commodities.
Source: Stifel Nicolaus & Co., From a former reportby Barry Bannister & Paul Forward datedSeptember 10, 2001 published by Legg MasonWood Walker, Inc., the prior owner of parts of theStifel Nicolaus Capital Markets business.
Macro & Portfolio Strategy
8/6/2019 Bannister - Stifel Nicolaus Mid-2011 Macro Outlook
http://slidepdf.com/reader/full/bannister-stifel-nicolaus-mid-2011-macro-outlook 7/59
0.1
1.0
10.0
100.0
1 8 7 0
1 8 7 5
1 8 8 0
1 8 8 5
1 8 9 0
1 8 9 5
1 9 0 0
1 9 0 5
1 9 1 0
1 9 1 5
1 9 2 0
1 9 2 5
1 9 3 0
1 9 3 5
1 9 4 0
1 9 4 5
1 9 5 0
1 9 5 5
1 9 6 0
R e l a t i v e p r i c e s t r e n g t h , s
t o c k s v s . c o m m o d i t i e s , l o g s c a l e
U.S. stock market composite relative to the U.S. comm
Key: When the line is rising, the S&P stock market index b
index and when the line is falling the oppos
U.S. Stock Market relative to the Commodity Mar
Post-Civil War
Reconstruction ends
in 1877, gold
standard begins
1879, deflationary
boom, stocks ra lly.
WW2
1939-45
'29
Crash,
Gold
siezed
U.S.$
devalued
in 1933.
Post-WW 1
commodity
bubble bursts,
bull market
begins.
WW1
1914 to
1918
Post-W.W. 2/Kore
commodity inflatio
bubble bursts,
disinflation ensue
1950s bull marke
begins.
Populism in
U.S. politics.
Panic of 1907,
a banking
crisis & stock
market crash.
Source: Standard & Poor’s (Cowles Composite joined to S&P 500), U.S. PPI All Co(rebased).
Note: While this is the time for cyclical (over) investment in commodity capacity thaproducers for a generation, the underlying equities respond to commodity prices, wh
Note: Excludes dividends for simplicity of
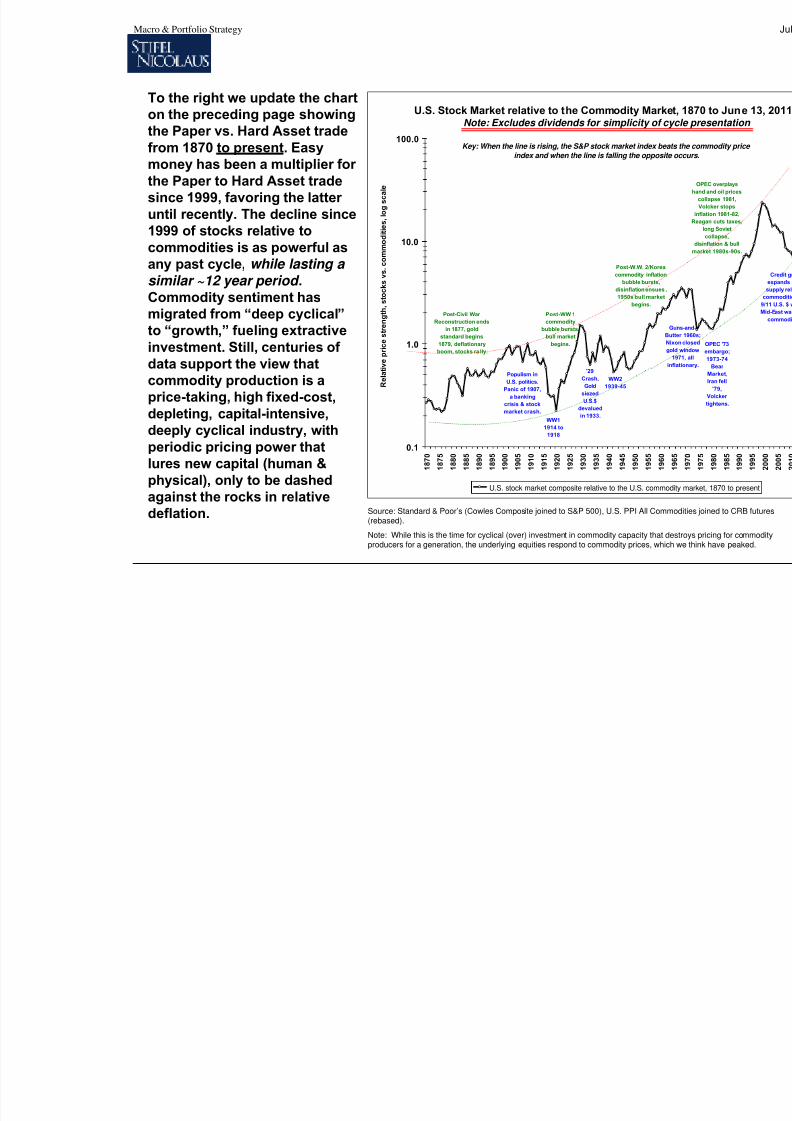
To the right we update the charton the preceding page showingthe Paper vs. Hard Asset trade
from 1870 to present. Easymoney has been a multiplier for the Paper to Hard Asset tradesince 1999, favoring the latter until recently. The decline since1999 of stocks relative tocommodities is as powerful asany past cycle, while lasting a similar ~12 year period .
Commodity sentiment hasmigrated from “deep cyclical”to “growth,” fueling extractiveinvestment. Still, centuries of data support the view thatcommodity production is aprice-taking, high fixed-cost,depleting, capital-intensive,deeply cyclical industry, with
periodic pricing power thatlures new capital (human &physical), only to be dashedagainst the rocks in relativedeflation.
Macro & Portfolio Strategy
8/6/2019 Bannister - Stifel Nicolaus Mid-2011 Macro Outlook
http://slidepdf.com/reader/full/bannister-stifel-nicolaus-mid-2011-macro-outlook 8/59
1.50
2.00
2.50
3.00
3.50
4.00
4.50
5.00
5.50
6.00
6.50
7.00
7.50
8.00
O c t - 9 8
A p r - 9 9
O c t - 9 9
A p r - 0 0
O c t - 0 0
A p r - 0 1
O c t - 0 1
A p r - 0 2
O c t - 0 2
A p r - 0 3
O c t - 0 3
A p r - 0 4
O c t - 0 4
A p r - 0 5
O c t - 0 5
A p r - 0 6
O c t - 0 6
A p r - 0 7
O c t - 0 7
A p r - 0 8
O c t - 0 8
A p r - 0 9
O c t - 0 9
A p r - 1 0
O c t - 1 0
A p r - 1 1
The Ratio of U.S. Stock Prices (S&P 500) to Commodity Prices (CRB Futures)Daily prices 10/1/1998 to latest
Peak July 16,1999
1.75
2.00
2.25
2.50
2.75
J u l - 0 8
A u g - 0
8
S e p - 0
8
O c t - 0 8
N o v - 0
8
D e c - 0
8
J a n - 0
9
F e b - 0
9
M a r - 0 9
A p r - 0 9
M a y - 0
9
J u n - 0
9
J u l - 0 9
A u g - 0
9
S e p - 0
9
O c t - 0 9
The Ratio of U.S. Stock Prices (Futures) Daily pr
Low Mar-9,'091.94115
Source: Factset prices.
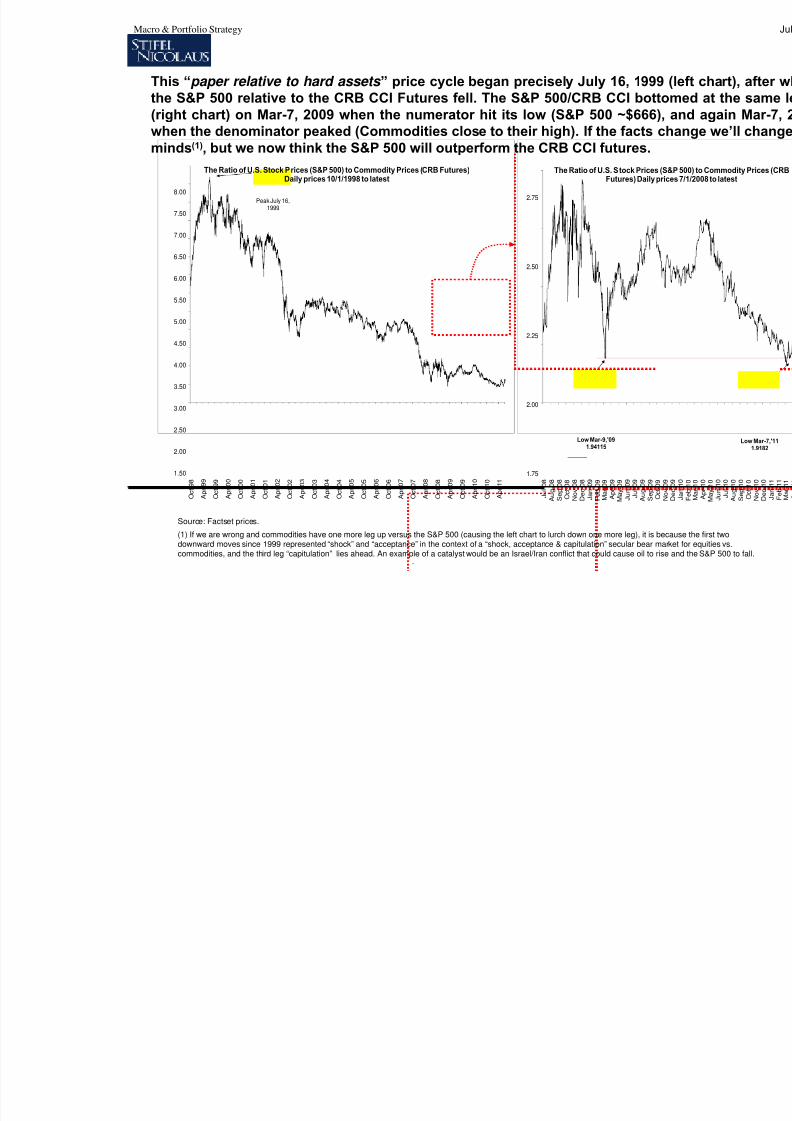
(1) If we are wrong and commodities have one more leg up versus the S&P 500 (causing the left chart to lurch down one more leg), it is bdownward moves since 1999 represented “shock” and “acceptance” in the context of a “shock, acceptance & capitulation” secular bear mcommodities, and the third leg “capitulation” lies ahead. An example of a catalyst would be an Israel/Iran conflict that could cause oil to ri
This “paper relative to hard assets ” price cycle began precisely July 16, 1999the S&P 500 relative to the CRB CCI Futures fell. The S&P 500/CRB CCI bott(right chart) on Mar-7, 2009 when the numerator hit its low (S&P 500 ~$666)when the denominator peaked (Commodities close to their high). If the facts c
minds(1)
, but we now think the S&P 500 will outperform the CRB CCI futures.
Macro & Portfolio Strategy
8/6/2019 Bannister - Stifel Nicolaus Mid-2011 Macro Outlook
http://slidepdf.com/reader/full/bannister-stifel-nicolaus-mid-2011-macro-outlook 9/59
-2.5%
0.0%
2.5%
5.0%
7.5%
10.0%
12.5%
15.0%
17.5%
20.0%
22.5%
1 8 3 5
1 8 4 5
1 8 5 5
1 8 6 5
1 8 7 5
1 8 8 5
1 8 9 5
1 9 0 5
1 9 1 5
1 9 2 5
S&P Stock Market Composite 10-YeReturn (Incl. Reinvest
Data from 1825 to
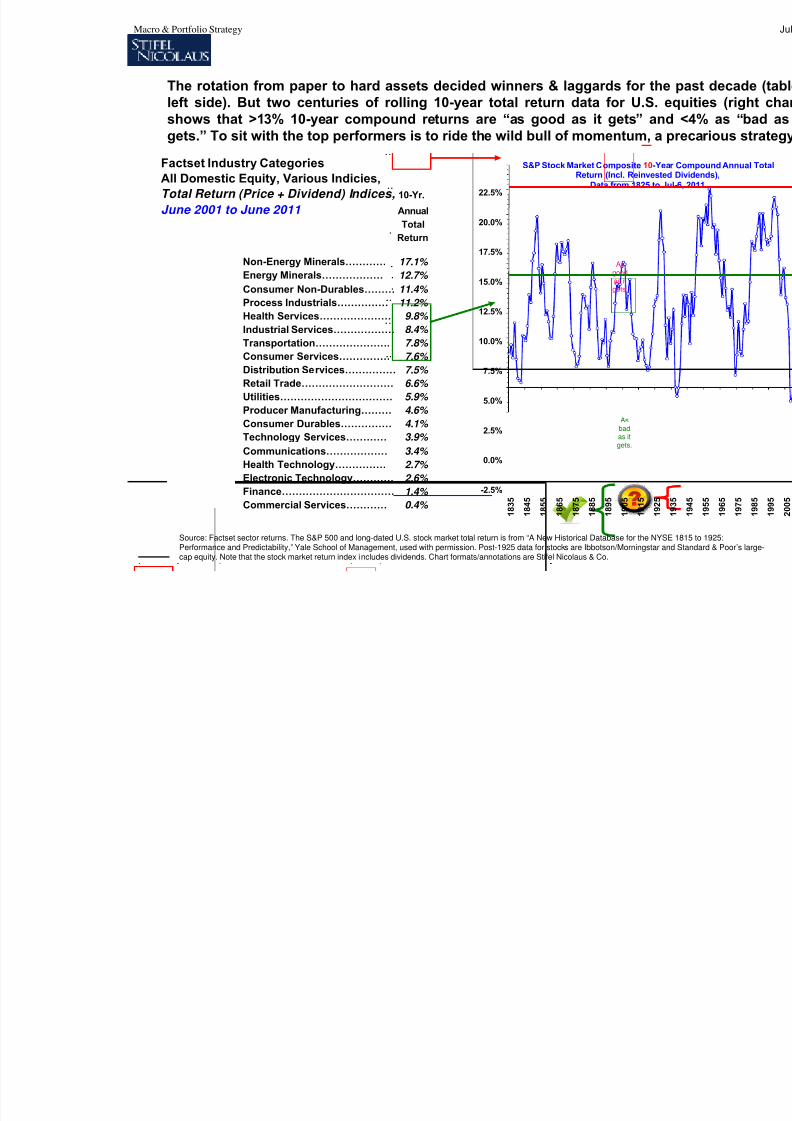
Factset Industry Categories
All Domestic Equity, Various Indicies,
Total Return (Price + Dividend) Indices, 10-Yr.
June 2001 to June 2011 Annual
Total
Return
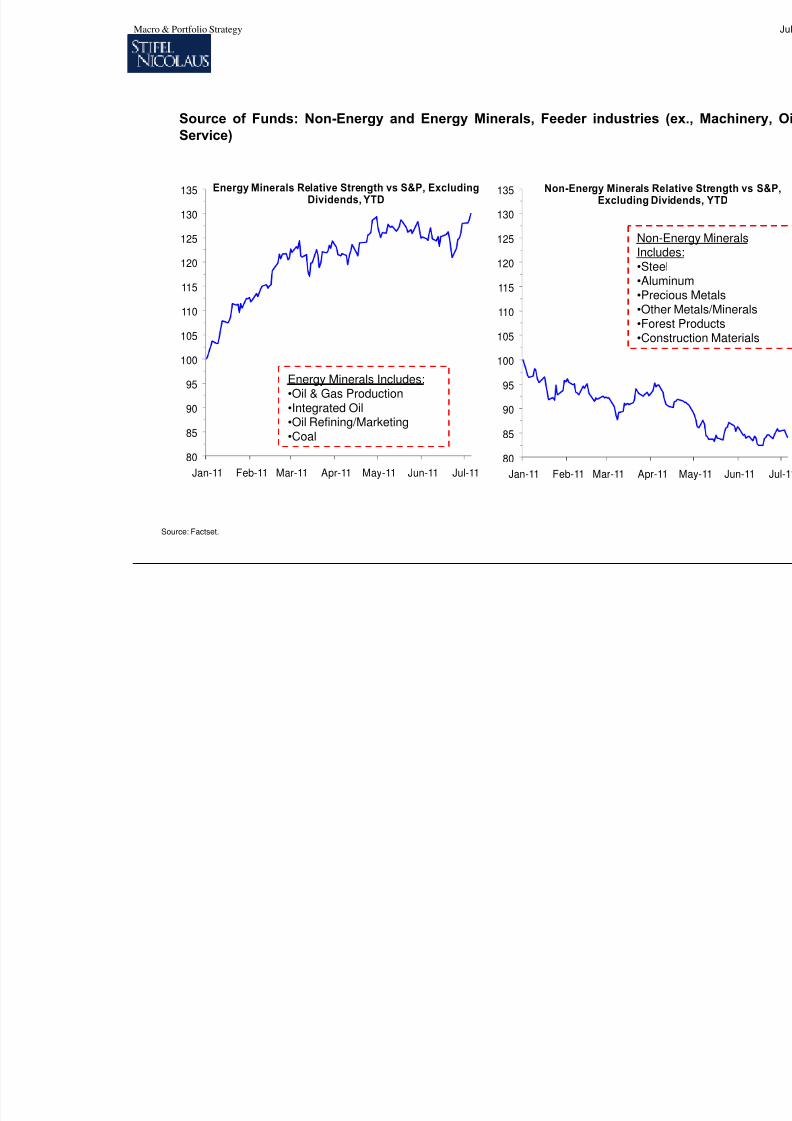
Non-Energy Minerals………… 17.1%
Energy Minerals……………… 12.7%
Consumer Non-Durables……… 11.4%
Process Industrials…………… 11.2% Health Services………………… 9.8%
Industrial Services……………… 8.4%
Transportation…………………. 7.8%
Consumer Services…………… 7.6%
Distribution Services…………… 7.5%
Retail Trade……………………… 6.6%
Utilities…………………………… 5.9%
Producer Manufacturing……… 4.6%
Consumer Durables…………… 4.1%
Technology Services………… 3.9%
Communications……………… 3.4% Health Technology…………… 2.7%
Electronic Technology………… 2.6%
Finance…………………………… 1.4%
Commercial Services………… 0.4%
Source: Factset sector returns. The S&P 500 and long-dated U.S. stock market total return is from “A New Historical Database for the NYPerformance and Predictability,” Yale School of Management, used with permission. Post-1925 data for stocks are Ibbotson/Morningstar cap equity. Note that the stock market return index includes dividends. Chart formats/annotations are Stifel Nicolaus & Co.
The rotation from paper to hard assets decided winners & laggards for thleft side). But two centuries of rolling 10-year total return data for U.S. shows that >13% 10-year compound returns are “as good as it gets” angets.” To sit with the top performers is to ride the wild bull of momentum, a
Asgoodas itgets.
Asbadas itgets.
Macro & Portfolio Strategy
8/6/2019 Bannister - Stifel Nicolaus Mid-2011 Macro Outlook
http://slidepdf.com/reader/full/bannister-stifel-nicolaus-mid-2011-macro-outlook 10/59
The Cycle of Investor Psycholo
Disdain
Doubt &Trepidation
Greed & Conviction
Enthusiasm
Confidence
Caution
P
Dread
Denial
Dismissal
Indifference
Source: Stifel Nicolaus adaptation.
S&P500
EM /Commodity
(Same trade)
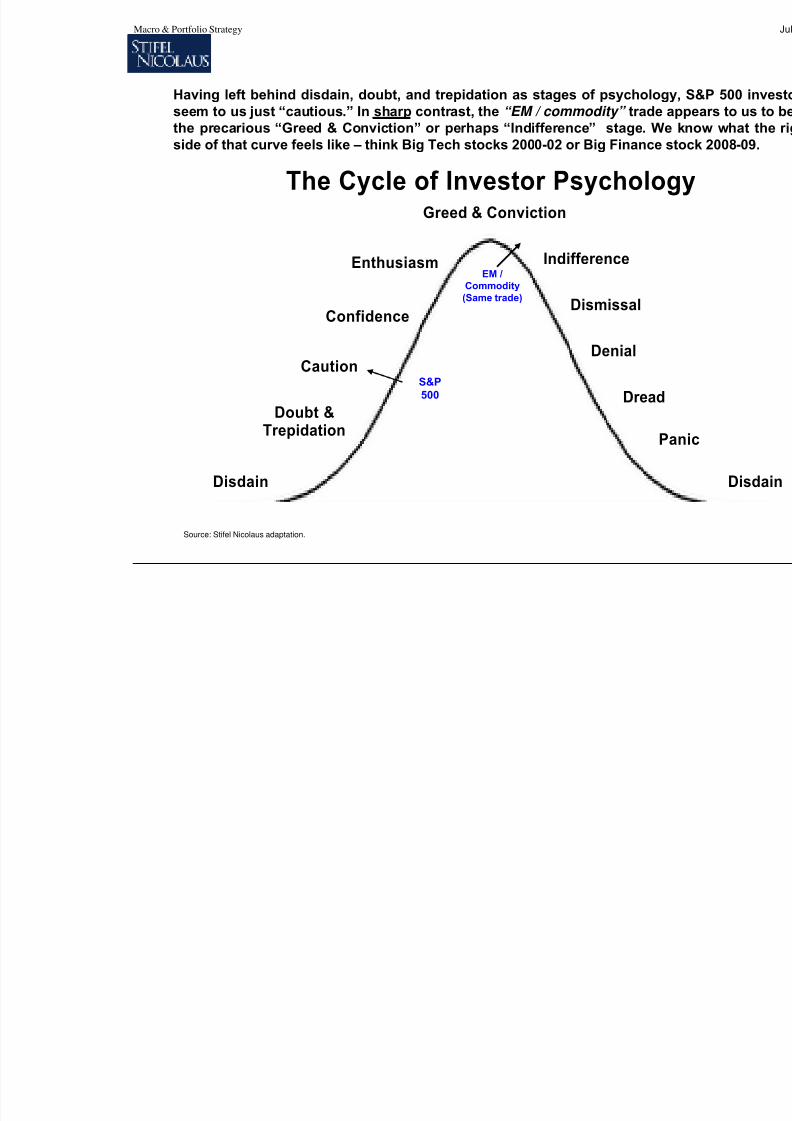
Having left behind disdain, doubt, and trepidation as stages of psycholoseem to us just “cautious.” In sharp contrast, the “EM / commodity” tradethe precarious “Greed & Conviction” or perhaps “Indifference” stage. W
side of that curve feels like – think Big Tech stocks 2000-02 or Big Finance
Macro & Portfolio Strategy
8/6/2019 Bannister - Stifel Nicolaus Mid-2011 Macro Outlook
http://slidepdf.com/reader/full/bannister-stifel-nicolaus-mid-2011-macro-outlook 11/59
$0.01
$1.00
$100.00
$10,000.00
$1,000,000.00
1 8 2 5
1 8 3 5
1 8 4 5
1 8 5 5
1 8 6 5
1 8 7 5
1 8 8 5
1 8 9 5
U.S. S&P Stock Market(Includes Rei
Data from 18
With exponenta
1.00
10.00
100.00
1 8 0 5
1 8 1 5
1 8 2 5
1 8 3 5
1 8 4 5
1 8 5 5
1 8 6 5
1 8 7 5
1 8 8 5
1 8 9 5
1 9 0 5
1 9 1 5
1 9 2 5
1 9 3 5
1 9 4 5
1 9 5 5
1 9 6 5
1 9 7 5
1 9 8 5
1 9 9 5
2 0 0 5
2 0 1 5 E
2 0 2 5 E
PPI All Commo dities (Up to 1956) an d CRB Commod ity Futures (1957-now) Linked Commod ity PricesY/Y % Change, 10-Yr. Moving Average
War of 1812& NapoleonicWars (1814
peak) U.S.Civil War(1864 peak)
Wor ld War1 (1920peak)
ColdWar(1980peak)
U.S.$debasement,EM gro wth
Commodity Price Index, Log ScaleData 1805 to July 7, 2011
WorldWar 2,KoreanConflict
1897(low)
Source: Commodity prices are described in the next exhibit. The last data point is April 29, 2011. The S&P 500 and long-dated U.S. stock market Historical Database for the NYSE 1815 to 1925: Performance and Predictability,” Yale School of Management, used with permission. Post-1925 dIbbotson/Morningstar and Standard & Poor’s large-cap equity. Note that the stock market return index includes dividends. Chart formats/annotatio
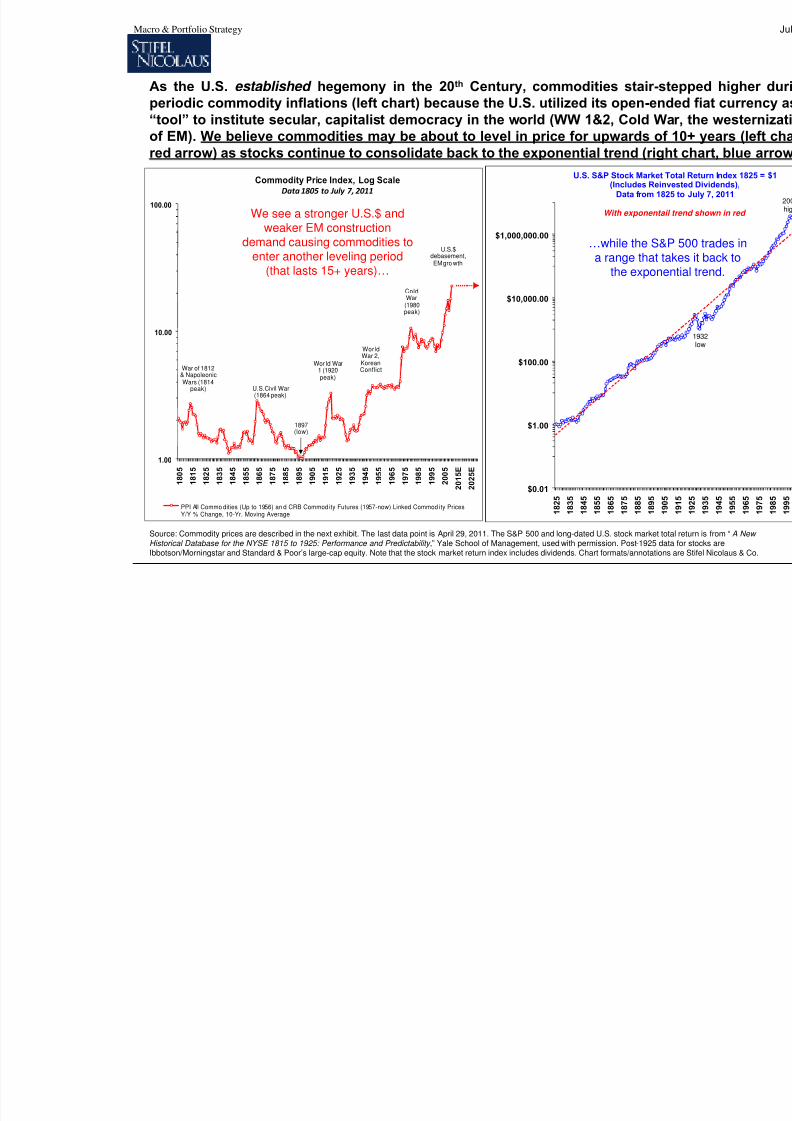
We see a stronger U.S.$ andweaker EM construction
demand causing commodities toenter another leveling period
(that lasts 15+ years)…
…while the S&a range that t
the expon
As the U.S. established hegemony in the 20th Century, commodities stair-speriodic commodity inflations (left chart) because the U.S. utilized its open-en“tool” to institute secular, capitalist democracy in the world (WW 1&2, Cold Wof EM). We believe commodities may be about to level in price for upwards o
red arrow) as stocks continue to consolidate back to the exponential trend (rig
Macro & Portfolio Strategy
8/6/2019 Bannister - Stifel Nicolaus Mid-2011 Macro Outlook
http://slidepdf.com/reader/full/bannister-stifel-nicolaus-mid-2011-macro-outlook 12/59
-6%
-5%
-4%
-3%
-2%
-1%
0%
1%
2%
3%
4%5%
6%
7%
8%
9%
10%
11%
12%
13%
14%
15%
1 8
0 5
1 8
1 5
1 8
2 5
1 8
3 5
1 8
4 5
1 8
5 5
1 8
6 5
1 8
7 5
1 8
8 5
1 8
9 5
1 9
0 5
1 9
1 5
1 9
2 5
1 9
3 5
1 9
4 5
1 9
5 5
1 9
6 5
1 9
7 5
1 9
8 5
1 9
9 5
2 0
0 5
2 0 1
5 E
2 0 2
5 E
PPI All Co mmodities (Up to 1956) and CRB Commod ity Futures (1957-now) Linked Commod ity PricesY/Y % Chang e, 10-Yr. Moving Average
War of 1812& NapoleonicWars (1814
peak)
U.S.Civil War(1864 peak)
Worl d War 1(1920 peak)
Cold War(1980 peak)
U.S.$debasement,EM growth
10-year smoothed commodity price growth maybe peaking within widening amplitude
Data 1795 to July 7, 2011, 10 ‐yr. M.A.
Worl d War 2,Korean Conflict
-2.5%
0.0%
2.5%
5.0%
7.5%
10.0%
12.5%
15.0%
17.5%
20.0%
22.5%
1 8 3 5
1 8 4 5
1 8 5 5
1 8 6 5
1 8 7 5
1 8 8 5
1 8 9 5
1 9 0 5
1 9 1 5
S&P Stock Market CompositeReturn (Incl. Rein
Data from 182
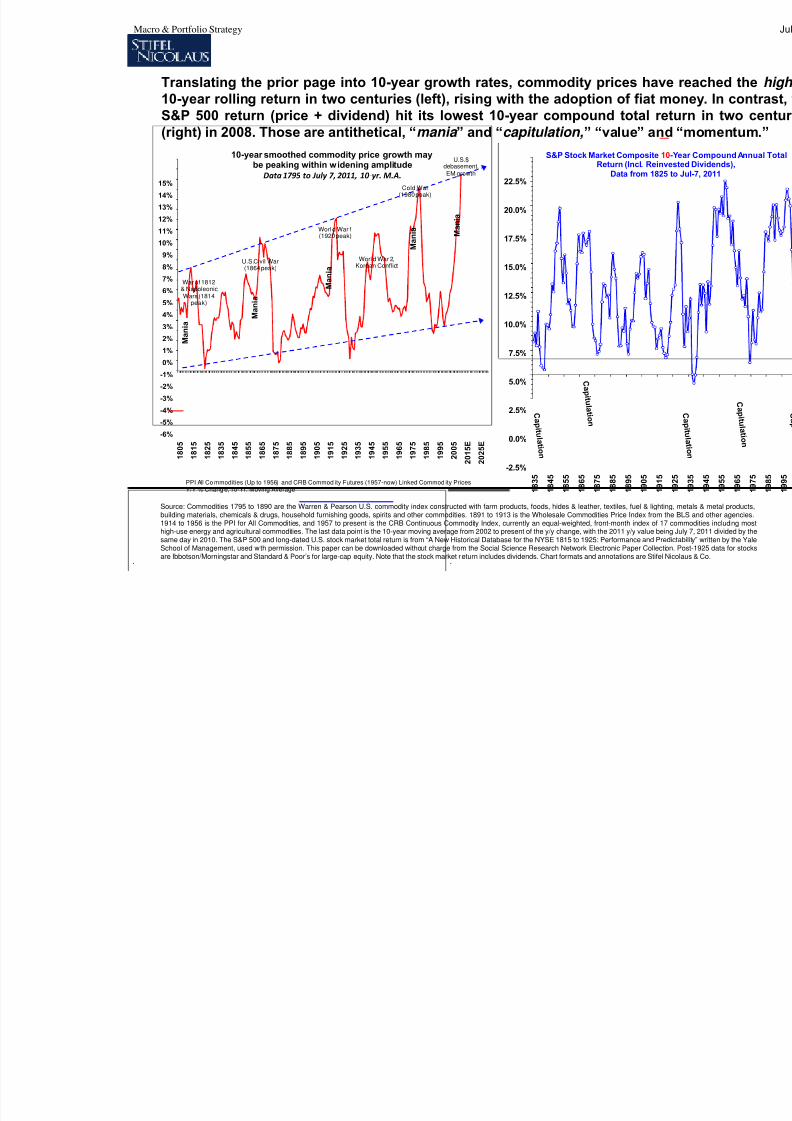
Translating the prior page into 10-year growth rates, commodity prices hav10-year rolling return in two centuries (left), rising with the adoption of fiat mS&P 500 return (price + dividend) hit its lowest 10-year compound total r(right) in 2008. Those are antithetical, “mania ” and “capitulation,” “value” an
M a n i a
M a n i a
M a n i a
M a n i a M
a n i a
Source: Commodities 1795 to 1890 are the Warren & Pearson U.S. commodity index constructed with farm products, foods, hides & leather, textiles, fuel & lighbuilding materials, chemicals & drugs, household furnishing goods, spirits and other commodities. 1891 to 1913 is the Wholesale Commodities Price Index from1914 to 1956 is the PPI for All Commodities, and 1957 to present is the CRB Continuous Commodity Index, currently an equal-weighted, front-month index of 1high-use energy and agricultural commodities. The last data point is the 10-year moving average from 2002 to present of the y/y change, with the 2011 y/y value besame day in 2010. The S&P 500 and long-dated U.S. stock market total return is from “A New Historical Database for the NYSE 1815 to 1925: Performance and PrSchool of Management, used with permission. This paper can be downloaded without charge from the Social Science Research Network Electronic Paper Collecare Ibbotson/Morningstar and Standard & Poor’s for large-cap equity. Note that the stock market return includes dividends. Chart formats and annotations are Stife
C a
p i t u
l a t i
o n
C a
p i t u
l a t i o
n
Macro & Portfolio Strategy
8/6/2019 Bannister - Stifel Nicolaus Mid-2011 Macro Outlook
http://slidepdf.com/reader/full/bannister-stifel-nicolaus-mid-2011-macro-outlook 13/59
0%1%
2%
3%
4%
5%
6%
7%
8%
9%
10%
11%
12%
13%
14%
15%
1 9 8 2
1 9 8 4
1 9 8 6
1 9 8 8
1 9 9 0
1 9 9 2
1 9 9 4
1 9 9 6
1 9 9 8
2 0 0 0
2 0 0 2
2 0 0 4
2 0 0 6
2 0 0 8
2 0 1 0
Fed Funds Rate
Markets adjust to level, so momentum matters.
Each decade has featured a ~400bps
Fed Funds rate hike...
-100%
-80%
-60%
-40%
-20%
0%
20%
40%
60%
80%
100%120%
140%
160%
180%
200%
220%
1 9 8 2
1 9 8 4
1 9 8 6
1 9 8 8
1 9 9 0
1 9 9 2
1 9 9 4
1 9 9 6
1 9 9 8
2 0 0 0
Fed Funds Rate y/y%
…but each 400bps rate cycle w
percentage change in rates fr
base, causing ever larger finan
A
B
A = Mar-89 peak, Drexel Burn. fails Feb-90
B = Dec-94 peak, Mexico Dec-94, EM 1997
C = May-05 peak, housing peaks the next
Source: U.S. Fed and government data, Stifel Nicolaus format.
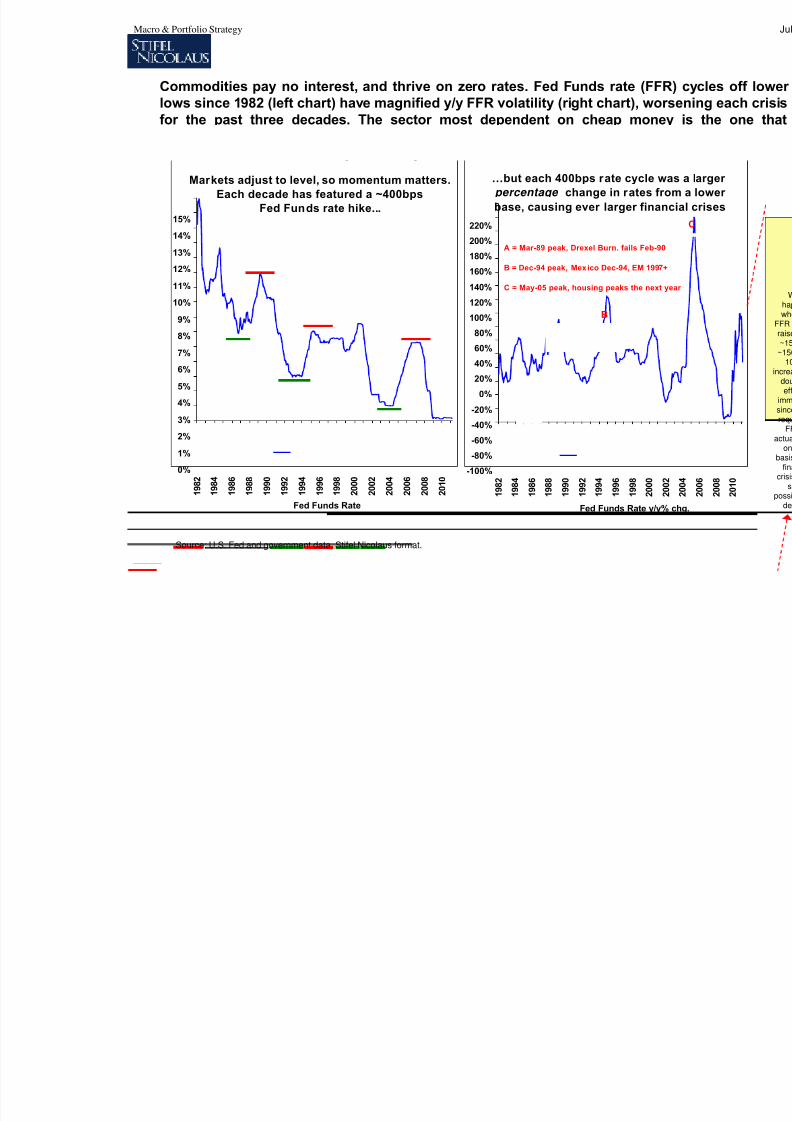
Commodities pay no interest, and thrive on zero rates. Fed Funds rate (FFlows since 1982 (left chart) have magnified y/y FFR volatility (right chart), wofor the past three decades. The sector most dependent on cheap monecollapses shortly after the y/y change in the FFR peaks. We t
EM/Commodities/Commodity FX this cycle.
Macro & Portfolio Strategy
8/6/2019 Bannister - Stifel Nicolaus Mid-2011 Macro Outlook
http://slidepdf.com/reader/full/bannister-stifel-nicolaus-mid-2011-macro-outlook 14/59
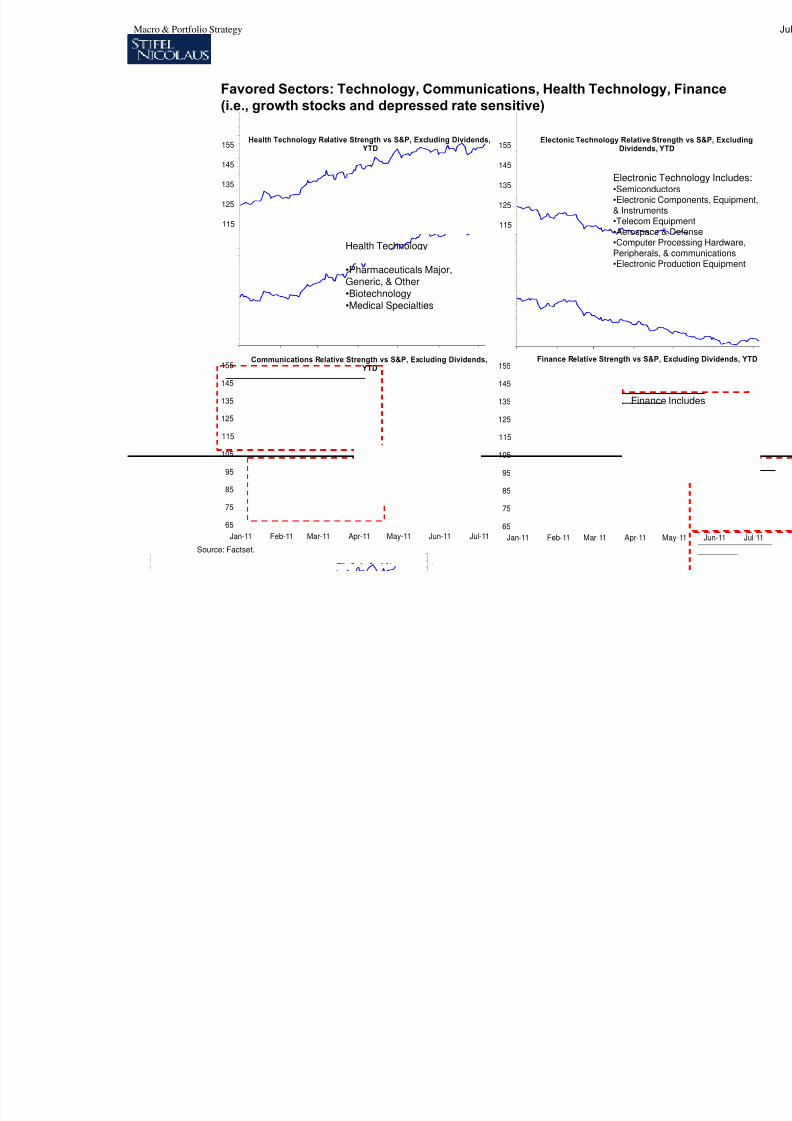
Favored Sectors: Technology, Communications, Health Technology(i.e., growth stocks and depressed rate sensitive)
Source: Factset.
65
75
85
95
105
115
125
135
145
155Health Technology Relative Strength vs S&P, Excluding Dividends,
YTD
65
75
85
95
105
115
125
135
145
155Electonic Technology Relative Str
Dividends, Y
65
75
85
95
105
115
125
135
145
155
Jan-11 Feb-11 Mar-11 Apr-11 May-11 Jun-11 Jul-11
Communications Relative Strength vs S&P, Excluding Dividends, YTD
65
75
85
95
105
115
125
135
145
155
Jan-11 Feb-11 Mar-11 Apr-11
Finance Relative Strength vs S&P,
Health TechnologyIncludes:•Pharmaceuticals Major,Generic, & Other•Biotechnology
•Medical Specialties
Electronic T•Semiconduc•Electronic C& Instrument•Telecom Eq•Aerospace •Computer PPeripherals, •Electronic P
Finance•Banks•Invest•Insura•Real Eas well Communications
Includes:•Major, Specialty, &Wireless Telecom
Macro & Portfolio Strategy
8/6/2019 Bannister - Stifel Nicolaus Mid-2011 Macro Outlook
http://slidepdf.com/reader/full/bannister-stifel-nicolaus-mid-2011-macro-outlook 15/59
8/6/2019 Bannister - Stifel Nicolaus Mid-2011 Macro Outlook
http://slidepdf.com/reader/full/bannister-stifel-nicolaus-mid-2011-macro-outlook 16/59
Source: Stifel Nicolaus & Co.
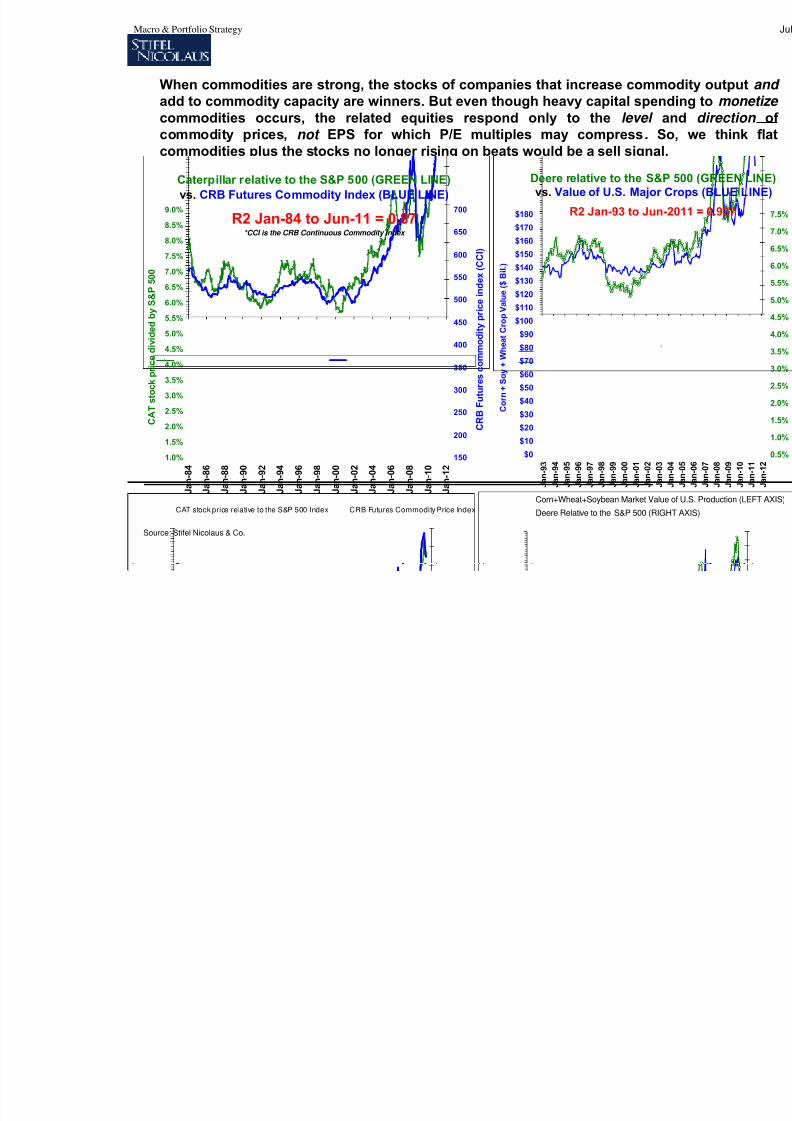
When commodities are strong, the stocks of companies that increase commadd to commodity capacity are winners. But even though heavy capital spencommodities occurs, the related equities respond only to the level commodity prices, not EPS for which P/E multiples may compress. S
commodities plus the stocks no longer rising on beats would be a sell signa
Caterpillar relative to the S&P 500 (GREEN LINE)
vs. CRB Futures Commodity Index (BLUE LINE)
1.0%
1.5%
2.0%
2.5%
3.0%
3.5%
4.0%
4.5%
5.0%
5.5%
6.0%
6.5%
7.0%
7.5%
8.0%
8.5%
9.0%
J a n - 8 4
J a n - 8 6
J a n - 8 8
J a n - 9 0
J a n - 9 2
J a n - 9 4
J a n - 9 6
J a n - 9 8
J a n - 0 0
J a n - 0 2
J a n - 0 4
J a n - 0 6
J a n - 0 8
J a n - 1 0
J a n - 1 2
C A T s t o c k p r i c e d i v i d e d b y S
& P 5 0 0
150
200
250
300
350
400
450
500
550
600
650
700
C R B F u t u r e s c o m m o d i t y p r i c e
i n d e x ( C C I )
CAT stock price relative to the S&P 500 Index CRB Futures Commodity Price Index
R2 Jan-84 to Jun-11 = 0.87*CCI is the CRB Continuous Commodity Index
$0
$10
$20
$30
$40
$50
$60
$70
$80
$90
$100
$110
$120
$130
$140
$150
$160
$170
$180
J a n - 9 3
J a n - 9 4
J a n - 9 5
J a n - 9 6
J a n - 9 7
J a n - 9 8
J a n - 9 9
J a n - 0 0
J a n - 0 1
J a n - 0 2
J a n - 0 3
C o r n + S o y + W h e a t C r o p V a l u e ( $ B i l . )
Deere relative to the S&vs. Value of U.S. Major
R2 Jan-93 to Jun
Corn+Wheat+Soybean Market Valu
Deere Relative to the S&P 500 (RIG
`
Macro & Portfolio Strategy

8/6/2019 Bannister - Stifel Nicolaus Mid-2011 Macro Outlook
http://slidepdf.com/reader/full/bannister-stifel-nicolaus-mid-2011-macro-outlook 17/59
We see the S&P 500 bouncing off 200 dma iespecially weak through summer, then 1,4
the end of year
Macro & Portfolio Strategy
8/6/2019 Bannister - Stifel Nicolaus Mid-2011 Macro Outlook
http://slidepdf.com/reader/full/bannister-stifel-nicolaus-mid-2011-macro-outlook 18/59
600
700
800
900
1000
1100
1200
1300
1400
1500
1600
1 / 3 / 0 0
5 / 1 1 / 0 0
9 / 1 9 / 0 0
1 / 2 9 / 0 1
6 / 7 / 0 1
1 0 / 1 9 / 0 1
3 / 1 / 0 2
7 / 1 0 / 0 2
1 1 / 1 4 / 0 2
3 / 2 7 / 0 3
8 / 0 5 / 0 3
1 2 / 1 1 / 0 3
4 / 2 2 / 0 4
8 / 3 1 / 0 4
1 / 0 7 / 0 5
5 / 1 8 / 0 5
9 / 2 6 / 0 5
2 / 0 3 / 0 6
6 / 1 4 / 0 6
1 0 / 2 0 / 0 6
3 / 0 5 / 0 7
7 / 1 2 / 0 7
1 1 / 1 6 / 0 7
3 / 3 1 / 0 8
8 / 0 6 / 0 8
1 2 / 1 2 / 0 8
4 / 2 4 / 0 9
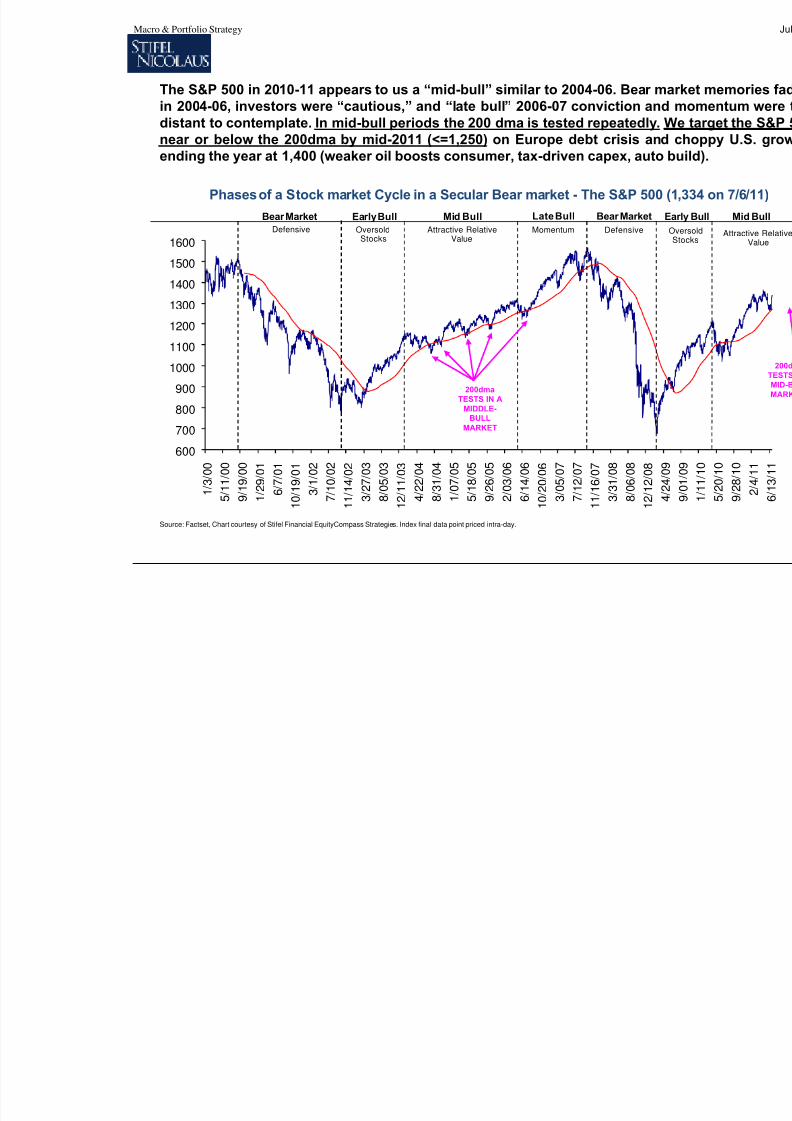
Phases of a Stock market Cycle in a Secular Bear market - The S&P 500
Bear Market Mid BullEarlyBull LateBull Bear Market
Defensive OversoldStocks
Attractive RelativeValue
Momentum Defensive
The S&P 500 in 2010-11 appears to us a “mid-bull” similar to 2004-06. Bear min 2004-06, investors were “cautious,” and “late bull” 2006-07 conviction andistant to contemplate. In mid-bull periods the 200 dma is tested repeatedly.near or below the 200dma by mid-2011 (<=1,250) on Europe debt crisis an
ending the year at 1,400 (weaker oil boosts consumer, tax-driven capex, auto
200dmaTESTS IN A
MIDDLE-BULL
MARKET
Source: Factset, Chart courtesy of Stifel Financial EquityCompass Strategies. Index final data point priced intra-day.
Macro & Portfolio Strategy
8/6/2019 Bannister - Stifel Nicolaus Mid-2011 Macro Outlook
http://slidepdf.com/reader/full/bannister-stifel-nicolaus-mid-2011-macro-outlook 19/59
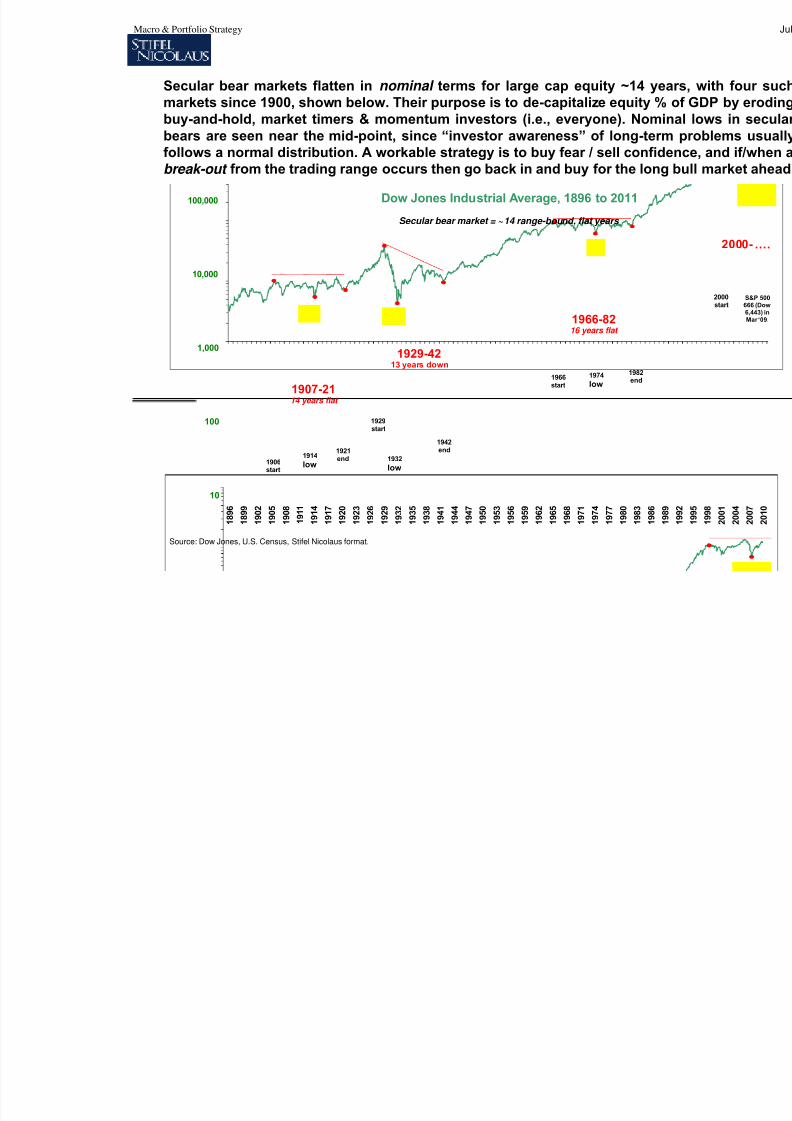
Secular bear markets flatten in nominal terms for large cap equity ~14 yemarkets since 1900, shown below. Their purpose is to de-capitalize equity %buy-and-hold, market timers & momentum investors (i.e., everyone). Nombears are seen near the mid-point, since “investor awareness” of long-ter
follows a normal distribution. A workable strategy is to buy fear / sell confidbreak-out from the trading range occurs then go back in and buy for the long
Source: Dow Jones, U.S. Census, Stifel Nicolaus format.
10
100
1,000
10,000
100,000
1 8 9 6
1 8 9 9
1 9 0 2
1 9 0 5
1 9 0 8
1 9 1 1
1 9 1 4
1 9 1 7
1 9 2 0
1 9 2 3
1 9 2 6
1 9 2 9
1 9 3 2
1 9 3 5
1 9 3 8
1 9 4 1
1 9 4 4
1 9 4 7
1 9 5 0
1 9 5 3
1 9 5 6
1 9 5 9
1 9 6 2
1 9 6 5
1 9 6 8
1 9 7 1
1 9 7 4
1 9 7 7
1 9 8 0
1 9 8 3
1 9 8 6
Dow Jones Industrial Average, 1896 to 2011
Secular bear market = ~14 range-bound, flat years
1907-2114 years flat
1929-4213 years down
1966-8216 years flat
1914low
1921end 1932
low
1942end
1974
low
1982end
1906start
1929start
1966start
Macro & Portfolio Strategy
8/6/2019 Bannister - Stifel Nicolaus Mid-2011 Macro Outlook
http://slidepdf.com/reader/full/bannister-stifel-nicolaus-mid-2011-macro-outlook 20/59
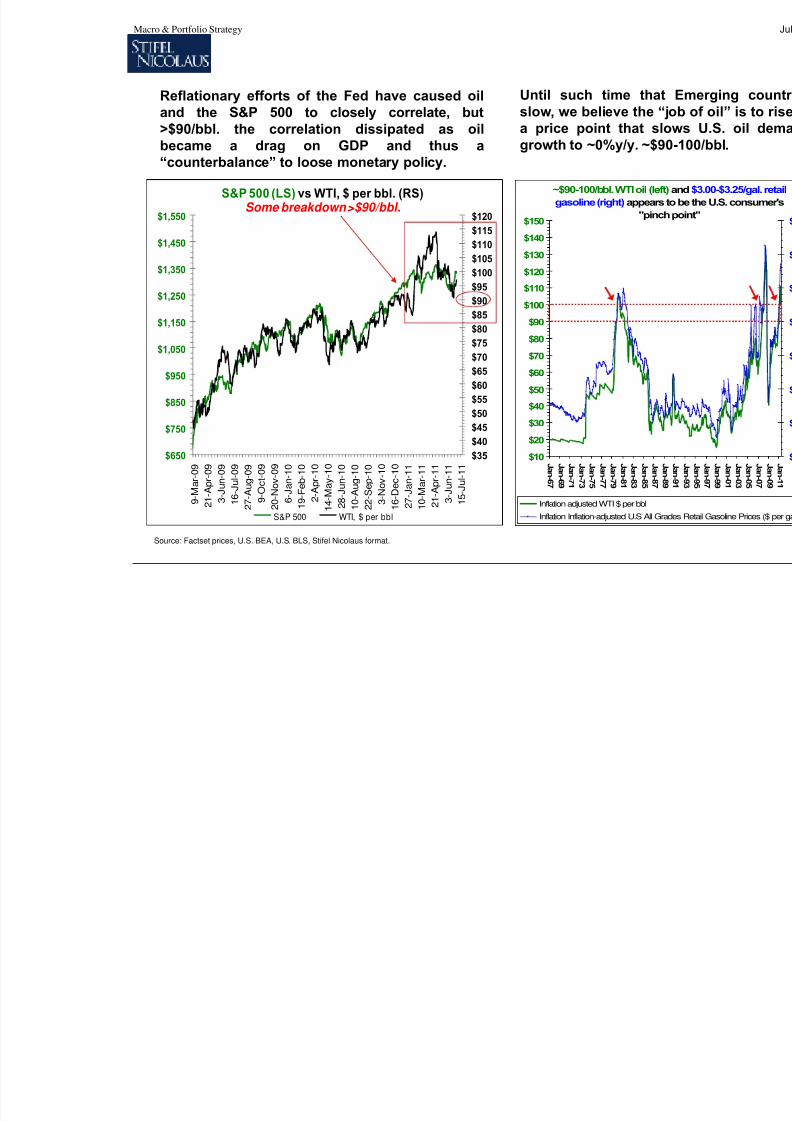
Reflationary efforts of the Fed have caused oiland the S&P 500 to closely correlate, but>$90/bbl. the correlation dissipated as oil
became a drag on GDP and thus a“counterbalance” to loose monetary policy.
Source: Factset prices, U.S. BEA, U.S. BLS, Stifel Nicolaus format.
$35
$40
$45
$50
$55
$60
$65
$70
$75
$80
$85$90
$95
$100
$105
$110
$115
$120
$650
$750
$850
$950
$1,050
$1,150
$1,250
$1,350
$1,450
$1,550
9 - M
a r - 0 9
2 1 - A
p r - 0 9
3 - J
u n - 0
9
1 6 - J
u l - 0 9
2 7 - A
u g - 0
9
9 - O
c t - 0 9
2 0 - N
o v - 0
9
6 - J
a n - 1
0
1 9 - F
e b - 1
0
2 - A
p r - 1 0
1 4 - M
a y - 1
0
2 8 - J
u n - 1
0
1 0 - A
u g - 1
0
2 2 - S
e p - 1
0
3 - N
o v - 1
0
1 6 - D
e c - 1
0
2 7 - J
a n - 1
1
1 0 - M
a r - 1 1
2 1 - A
p r - 1 1
3 - J
u n - 1
1
1 5 - J
u l - 1 1
S&P 500 (LS) vs WTI, $ per bbl. (RS)Some breakdown >$90/bbl.
S&P 500 WTI, $ per bbl
Until such time thatslow, we believe the “a price point that sl
growth to ~0%y/y. ~$9
~$90-100/bbl. WTI oil (lef
gasoline (right)appears
"pinc
$10
$20
$30
$40
$50
$60
$70
$80
$90
$100
$110
$120
$130
$140
$150
J an- 6 7
J an- 6 9
J an-7 1
J an-7 3
J an-7 5
J an-7 7
J an-7 9
J an- 8 1
J an- 8 3
J an- 8 5
J an- 8 7
Inflation adjusted WTI $ per bbl
Inflation Inflation-adjusted U.S All G
Macro & Portfolio Strategy
8/6/2019 Bannister - Stifel Nicolaus Mid-2011 Macro Outlook
http://slidepdf.com/reader/full/bannister-stifel-nicolaus-mid-2011-macro-outlook 21/59
-50%
-40%
-30%
-20%
-10%
0%
10%
20%
30%
40%
50%
60%
J u l - 9 8
J a n - 9 9
J u l - 9 9
J a n - 0 0
J u l - 0 0
J a n - 0 1
J u l - 0 1
J a n - 0 2
J u l - 0 2
J a n - 0 3
J u l - 0 3
J a n - 0 4
J u l - 0 4
J a n - 0 5
J u l - 0 5
J a n - 0 6
J u l - 0 6
J a n - 0 7
J u l - 0 7
J a n - 0 8
J u l - 0 8
J a n - 0 9
The ISM Manufacturing New Orders minus Inventories Diffusion IAxis) Impacts the S&P 500 Total Return (Blue, Left
S&P 500 Real Annual Total Return
Manuf. New Orders Index Minus Inventory Index
Left axis
Right axis
Source: ISM, Factset.
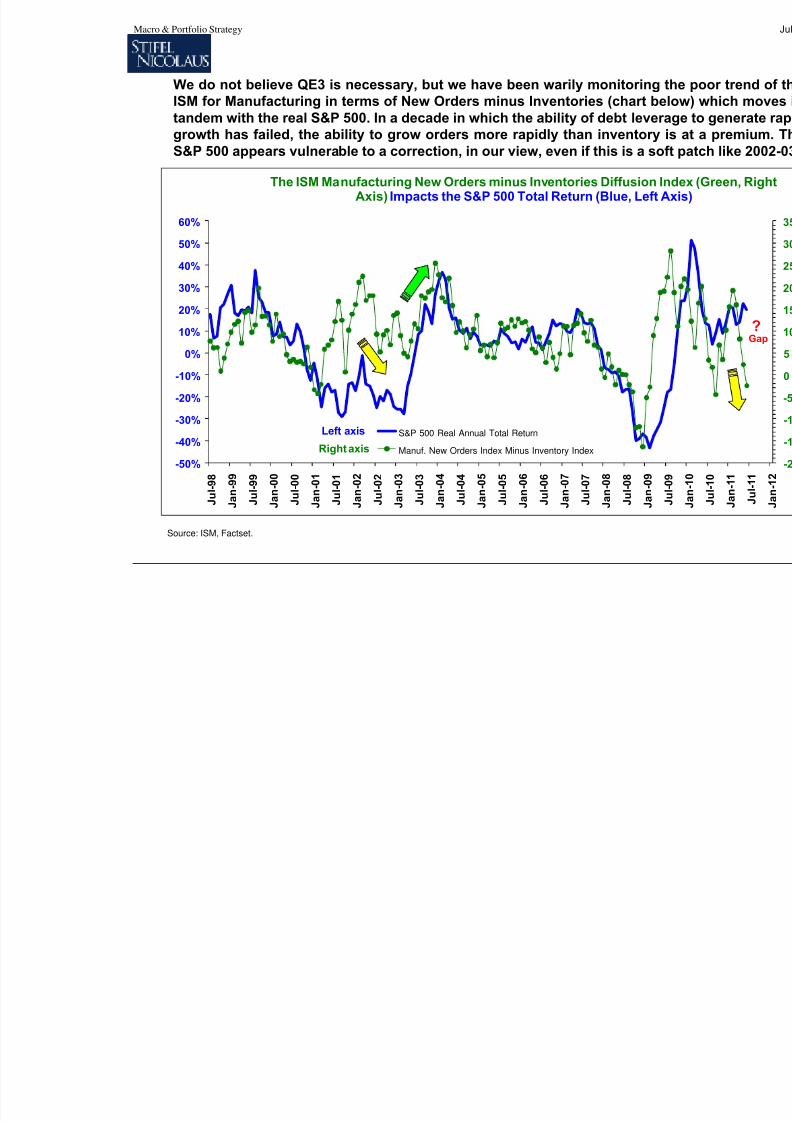
We do not believe QE3 is necessary, but we have been warily monitoring ISM for Manufacturing in terms of New Orders minus Inventories (chart betandem with the real S&P 500. In a decade in which the ability of debt levergrowth has failed, the ability to grow orders more rapidly than inventory
S&P 500 appears vulnerable to a correction, in our view, even if this is a so
Macro & Portfolio Strategy
8/6/2019 Bannister - Stifel Nicolaus Mid-2011 Macro Outlook
http://slidepdf.com/reader/full/bannister-stifel-nicolaus-mid-2011-macro-outlook 22/59
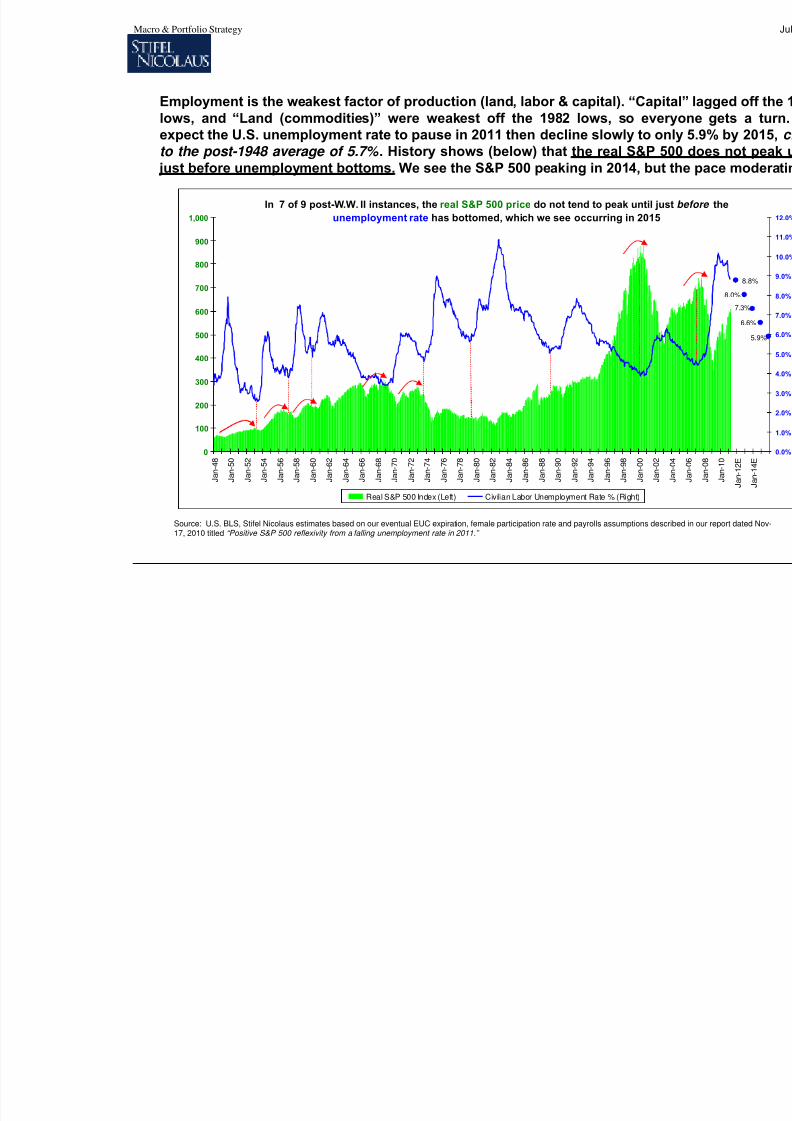
In 7 of 9 post-W.W. II instances, the real S&P 500 price do not tend to peak until ju
unemployment rate has bottomed, which we see occurring in 2015
0
100
200
300
400
500
600
700
800
900
1,000
J a n - 4
8
J a n - 5
0
J a n - 5
2
J a n - 5
4
J a n - 5
6
J a n - 5
8
J a n - 6
0
J a n - 6
2
J a n - 6
4
J a n - 6
6
J a n - 6
8
J a n - 7
0
J a n - 7
2
J a n - 7
4
J a n - 7
6
J a n - 7
8
J a n - 8
0
J a n - 8
2
J a n - 8
4
J a n - 8
6
J a n - 8
8
J a n - 9
0
J a n - 9
2
J a n - 9
4
J a n - 9
6
J a n - 9
8
J a n - 0
0
J a n - 0
2
Real S&P 500 Index (Left) Civilian Labor Unemployment Rate % (Right)
Employment is the weakest factor of production (land, labor & capital). “Caplows, and “Land (commodities)” were weakest off the 1982 lows, so eveexpect the U.S. unemployment rate to pause in 2011 then decline slowly to o
to the post-1948 average of 5.7% . History shows (below) that the real S&P 5 just before unemployment bottoms. We see the S&P 500 peaking in 2014, bu
Source: U.S. BLS, Stifel Nicolaus estimates based on our eventual EUC expiration, female participation rate and payrolls assumptions des17, 2010 titled “Positive S&P 500 reflexivity from a falling unemployment rate in 2011.”
Macro & Portfolio Strategy
8/6/2019 Bannister - Stifel Nicolaus Mid-2011 Macro Outlook
http://slidepdf.com/reader/full/bannister-stifel-nicolaus-mid-2011-macro-outlook 23/59
Foreign Inflows to Government & Agency
Securities vs. U.S. Corporate Stocks & Bonds,
% of Total Inflows/Outflows to U.S. Markets
-35%
-10%
15%
40%
65%
90%
115%
140%
3 Q1 9 9 0
1 Q1 9 9 2
3 Q1 9 9 3
1 Q1 9 9 5
3 Q1 9 9 6
1 Q1 9 9 8
3 Q1 9 9 9
1 Q2 0 0 1
3 Q2 0 0 2
1 Q2 0 0 4
3 Q2 0 0 5
1 Q2 0 0 7
3 Q2 0 0 8
1 Q2 0 1 0
3 Q2 0 1 1
4-qtr. sum
Source: U.S. Federal Reserve.
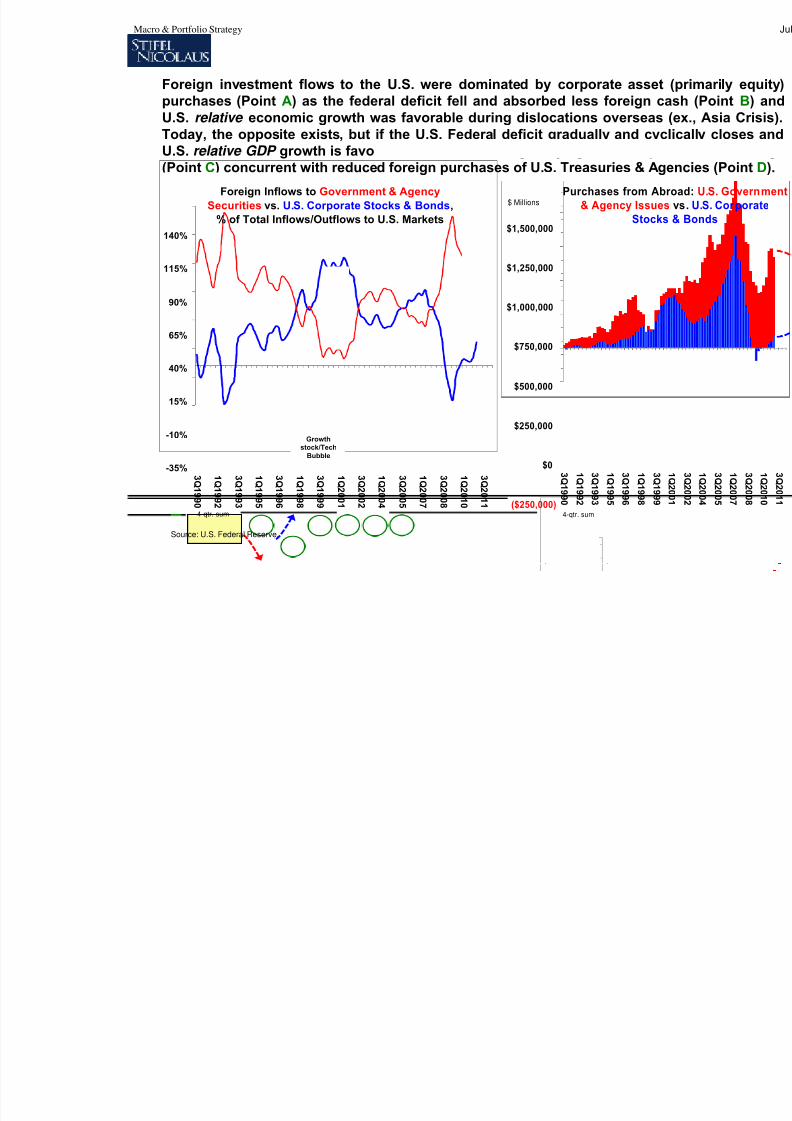
Foreign investment flows to the U.S. were dominated by corporate assetpurchases (Point A) as the federal deficit fell and absorbed less foreign cU.S. relative economic growth was favorable during dislocations overseasToday, the opposite exists, but if the U.S. Federal deficit gradually and cyc
U.S. relative GDP growth is favorable, we believe foreign buying of U.S. equ(Point C) concurrent with reduced foreign purchases of U.S. Treasuries & Ag
A
B
D
CGrowthstock/Tech
Bubble
Purchases from Ab& Agency Issue
Stock
($250,000)
$0
$250,000
$500,000
$750,000
$1,000,000
$1,250,000
$1,500,000
3 Q1 9 9 0
1 Q1 9 9 2
3 Q1 9 9 3
1 Q1 9 9 5
3 Q1 9 9 6
1 Q1 9 9 8
3 Q1 9 9 9
$ Millions
4-qtr. sum
Macro & Portfolio Strategy
8/6/2019 Bannister - Stifel Nicolaus Mid-2011 Macro Outlook
http://slidepdf.com/reader/full/bannister-stifel-nicolaus-mid-2011-macro-outlook 24/59
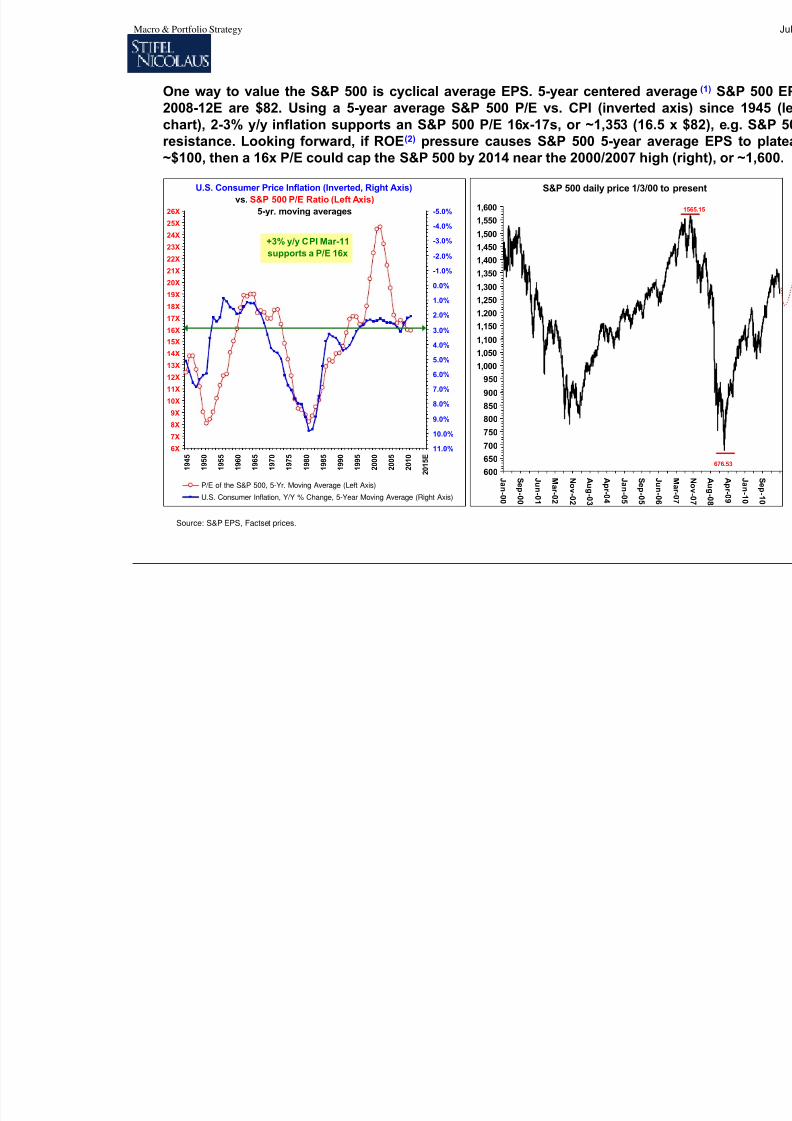
One way to value the S&P 500 is cyclical average EPS. 5-year centered av2008-12E are $82. Using a 5-year average S&P 500 P/E vs. CPI (inverted chart), 2-3% y/y inflation supports an S&P 500 P/E 16x-17s, or ~1,353 (16.5resistance. Looking forward, if ROE(2) pressure causes S&P 500 5-year av~$100, then a 16x P/E could cap the S&P 500 by 2014 near the 2000/2007 hig
6X
7X
8X
9X
10X
11X
12X
13X
14X
15X
16X
17X
18X
19X
20X
21X
22X
23X
24X
25X
26X
1 9 4 5
1 9 5 0
1 9 5 5
1 9 6 0
1 9 6 5
1 9 7 0
1 9 7 5
1 9 8 0
1 9 8 5
1 9 9 0
1 9 9 5
2 0 0 0
2 0 0 5
2 0 1 0
2 0 1 5 E
-5.0%
-4.0%
-3.0%
-2.0%
-1.0%
0.0%
1.0%
2.0%
3.0%
4.0%
5.0%
6.0%
7.0%
8.0%
9.0%
10.0%
11.0%
P/E of the S&P 500, 5-Yr. Moving Average (Left Axis)
U.S. Consumer Inflation, Y/Y % Change, 5-Year Moving Average (Right Axis)
U.S. Consumer Price Inflation (Inverted, Right Axis)
vs. S&P 500 P/E Ratio (Left Axis)
5-yr. moving averages
+3% y/y CPI Mar-11
supports a P/E 16x
S&P 500 daily price 1/3/00 t
600
650
700
750
800
850
900
950
1,000
1,050
1,100
1,150
1,2001,250
1,300
1,350
1,400
1,450
1,500
1,550
1,600
J an- 0 0
S e p- 0 0
J un- 0 1
M ar - 0 2
N ov- 0 2
A u g- 0 3
A pr - 0 4
J an- 0 5
S e p- 0 5
J un- 0 6
Source: S&P EPS, Factset prices.
Macro & Portfolio Strategy
8/6/2019 Bannister - Stifel Nicolaus Mid-2011 Macro Outlook
http://slidepdf.com/reader/full/bannister-stifel-nicolaus-mid-2011-macro-outlook 25/59
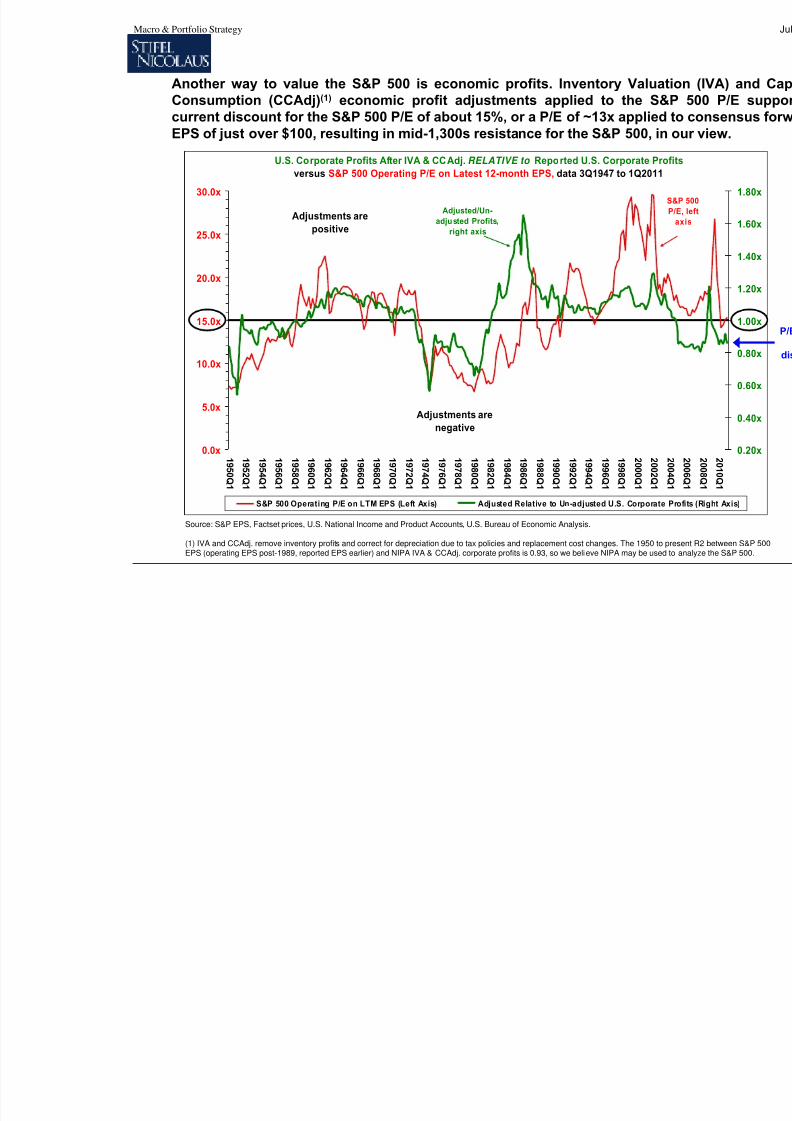
Another way to value the S&P 500 is economic profits. Inventory ValuaConsumption (CCAdj)(1) economic profit adjustments applied to the S¤t discount for the S&P 500 P/E of about 15%, or a P/E of ~13x appliedEPS of just over $100, resulting in mid-1,300s resistance for the S&P 500, i
Source: S&P EPS, Factset prices, U.S. National Income and Product Accounts, U.S. Bureau of Economic Analysis.
(1) IVA and CCAdj. remove inventory profits and correct for depreciation due to tax policies and replacement cost changes. The 1950 toEPS (operating EPS post-1989, reported EPS earlier) and NIPA IVA & CCAdj. corporate profits is 0.93, so we believe NIPA may be use
U.S. Corporate Profits After IVA & CCAdj. RELATIVE to Reported U.S. Corporate Pr
versus S&P 500 Operating P/E on Latest 12-month EPS, data 3Q1947 to 1Q2011
0.0x
5.0x
10.0x
15.0x
20.0x
25.0x
30.0x
1 9 5 0 Q1
1 9 5 2 Q1
1 9 5 4 Q1
1 9 5 6 Q1
1 9 5 8 Q1
1 9 6 0 Q1
1 9 6 2 Q1
1 9 6 4 Q1
1 9 6 6 Q1
1 9 6 8 Q1
1 9 7 0 Q1
1 9 7 2 Q1
1 9 7 4 Q1
1 9 7 6 Q1
1 9 7 8 Q1
1 9 8 0 Q1
1 9 8 2 Q1
1 9 8 4 Q1
1 9 8 6 Q1
1 9 8 8 Q1
1 9 9 0 Q1
1 9 9 2 Q1
1 9 9 4 Q1
1 9 9 6 Q1
1 9 9 8 Q1
2 0 0 0 Q1
2 0 0 2 Q1
S&P 500 Operating P/E on LTM EPS (Left Axis) Adjusted Relative to Un-adjusted U.S. Corporate
Adjustments are
negative
Adjustments are
positive
Adjusted/Un-
adjusted Profits,
right axis
Macro & Portfolio Strategy
8/6/2019 Bannister - Stifel Nicolaus Mid-2011 Macro Outlook
http://slidepdf.com/reader/full/bannister-stifel-nicolaus-mid-2011-macro-outlook 26/59
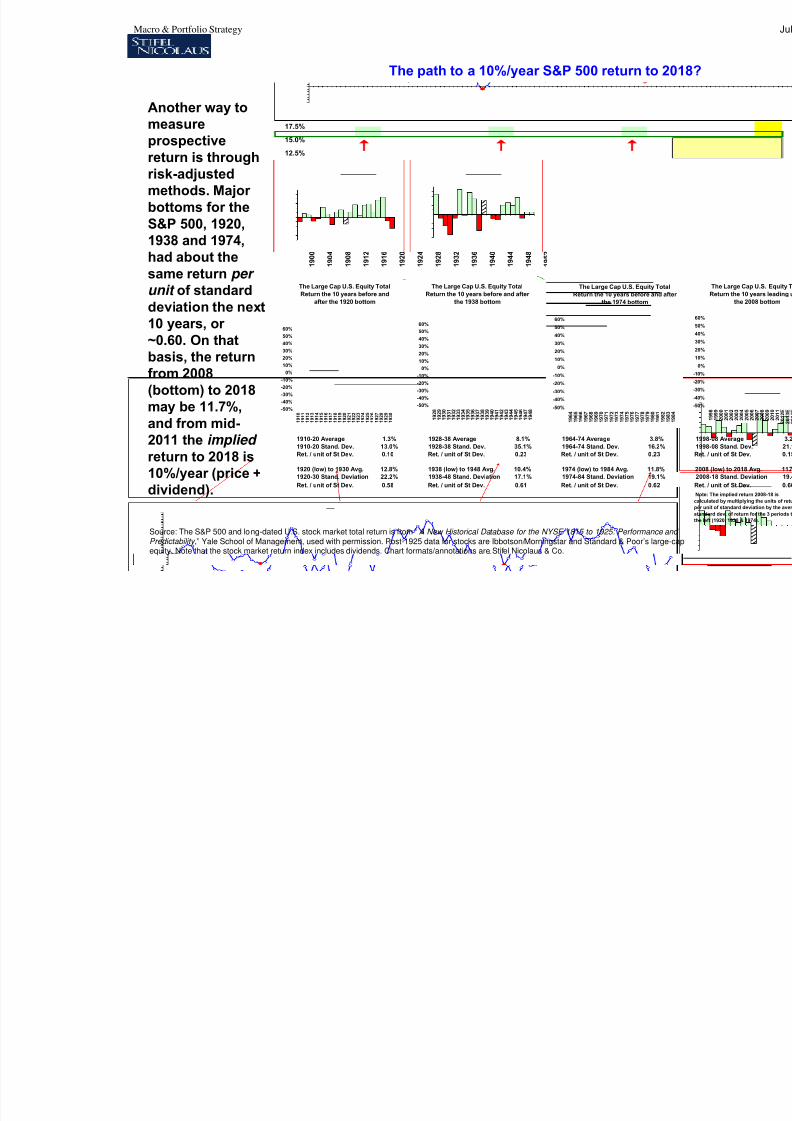
Another way tomeasureprospectivereturn is throughrisk-adjustedmethods. Major bottoms for theS&P 500, 1920,1938 and 1974,had about thesame return per unit of standard
deviation the next10 years, or ~0.60. On thatbasis, the returnfrom 2008(bottom) to 2018may be 11.7%,and from mid-2011 the implied
return to 2018 is10%/year (price +dividend).
1910-20 Average 1.3% 1928-38 Average 8.1% 1964-74 Average 3.8%
1910-20 Stand. Dev. 13.0% 1928-38 Stand. Dev. 35.1% 1964-74 Stand. Dev. 16.2%
Ret. / unit of St Dev. 0.10 Ret. / unit of St Dev. 0.23 Ret. / unit of St Dev. 0.23
1920 (low) to 1930 Avg. 12.8% 1938 (low) to 1948 Avg. 10.4% 1974 (low) to 1984 Avg. 11.8%1920-30 Stand. Deviation 22.2% 1938-48 Stand. Deviation 17.1% 1974-84 Stand. Deviation 19.1%
Ret. / unit of St Dev. 0.58 Ret. / unit of St Dev. 0.61 Ret. / unit of St Dev. 0.62
S&P Stock Market Composite 10-Year Compound Annual Total Return (Including Re
Data 1900 to Apr-28, 2011
-5.0%
-2.5%
0.0%
2.5%
5.0%
7.5%
10.0%
12.5%
15.0%
17.5%
20.0%
22.5%
1 9 0 0
1 9 0 4
1 9 0 8
1 9 1 2
1 9 1 6
1 9 2 0
1 9 2 4
1 9 2 8
1 9 3 2
1 9 3 6
1 9 4 0
1 9 4 4
1 9 4 8
1 9 5 2
1 9 5 6
1 9 6 0
1 9 6 4
1 9 6 8
1 9 7 2
1 9 7 6
The Large Cap U.S. Equity Total
Return the 10 years before and after
the 1938 bottom
-50%
-40%
-30%
-20%
-10%
0%
10%
20%
30%
40%
50%
60%
1 9 2 8
1 9 2 9
1 9 3 0
1 9 3 1
1 9 3 2
1 9 3 3
1 9 3 4
1 9 3 5
1 9 3 6
1 9 3 7
1 9 3 8
1 9 3 9
1 9 4 0
1 9 4 1
1 9 4 2
1 9 4 3
1 9 4 4
1 9 4 5
1 9 4 6
1 9 4 7
1 9 4 8
The Large Cap U.S. Equity ToReturn the 10 years before and
the 1974 bottom
-50%
-40%
-30%
-20%
-10%
0%
10%
20%
30%
40%
50%
60%
1 9 6 4
1 9 6 5
1 9 6 6
1 9 6 7
1 9 6 8
1 9 6 9
1 9 7 0
1 9 7 1
1 9 7 2
1 9 7 3
1 9 7 4
1 9 7 5
1 9 7 6
1 9 7 7
1 9 7 8
1 9 7 9
1 9 8 0
1 9 8 1
1 9 8 2
The Large Cap U.S. Equity Total
Return the 10 years before and
after the 1920 bottom
-50%
-40%
-30%
-20%
-10%
0%
10%
20%
30%
40%
50%
60%
1 9 1 0
1 9 1 1
1 9 1 2
1 9 1 3
1 9 1 4
1 9 1 5
1 9 1 6
1 9 1 7
1 9 1 8
1 9 1 9
1 9 2 0
1 9 2 1
1 9 2 2
1 9 2 3
1 9 2 4
1 9 2 5
1 9 2 6
1 9 2 7
1 9 2 8
1 9 2 9
1 9 3 0
Source: The S&P 500 and long-dated U.S. stock market total return is from “A New Historical Database for the NYSE 1815 to 1925: PerformancePredictability,” Yale School of Management, used with permission. Post-1925 data for stocks are Ibbotson/Morningstar and Standard & Poor’s larequity. Note that the stock market return index includes dividends. Chart formats/annotations are Stifel Nicolaus & Co.
The path to a 10%/year S&P 500 return to
Macro & Portfolio Strategy

8/6/2019 Bannister - Stifel Nicolaus Mid-2011 Macro Outlook
http://slidepdf.com/reader/full/bannister-stifel-nicolaus-mid-2011-macro-outlook 27/59
We see WTI Oil ~$75/bbl. in a year (more less demand), but not without Asia slowi
Libya returning
Macro & Portfolio Strategy
8/6/2019 Bannister - Stifel Nicolaus Mid-2011 Macro Outlook
http://slidepdf.com/reader/full/bannister-stifel-nicolaus-mid-2011-macro-outlook 28/59
G7 (U.S., U.K., Ger, Fr, It, Jap, Can)
Oil Demand, 1970-2010 (000s bbl.)
38% of world oil demand growing
at an average 0.4% y/y growth rate
15,000
20,000
25,000
30,000
35,000
40,000
45,000
50,000
55,000
1 9 7 0
1 9 7 3
1 9 7 6
1 9 7 9
1 9 8 2
1 9 8 5
1 9 8 8
1 9 9 1
1 9 9 4
1 9 9 7
2 0 0 0
2 0 0 3
2 0 0 6
2 0 0 9
bbl. 000s/day
Non-G7 Country O
1970-2010 (000
62% of world oil dem
at an average 3.0% g
15,000
20,000
25,000
30,000
35,000
40,000
45,000
50,000
55,000
1 9 7 0
1 9 7 3
1 9 7 6
1 9 7 9
1 9 8 2
1 9 8 5
1 9 8 8
1 9 91
bbl. 000s/day
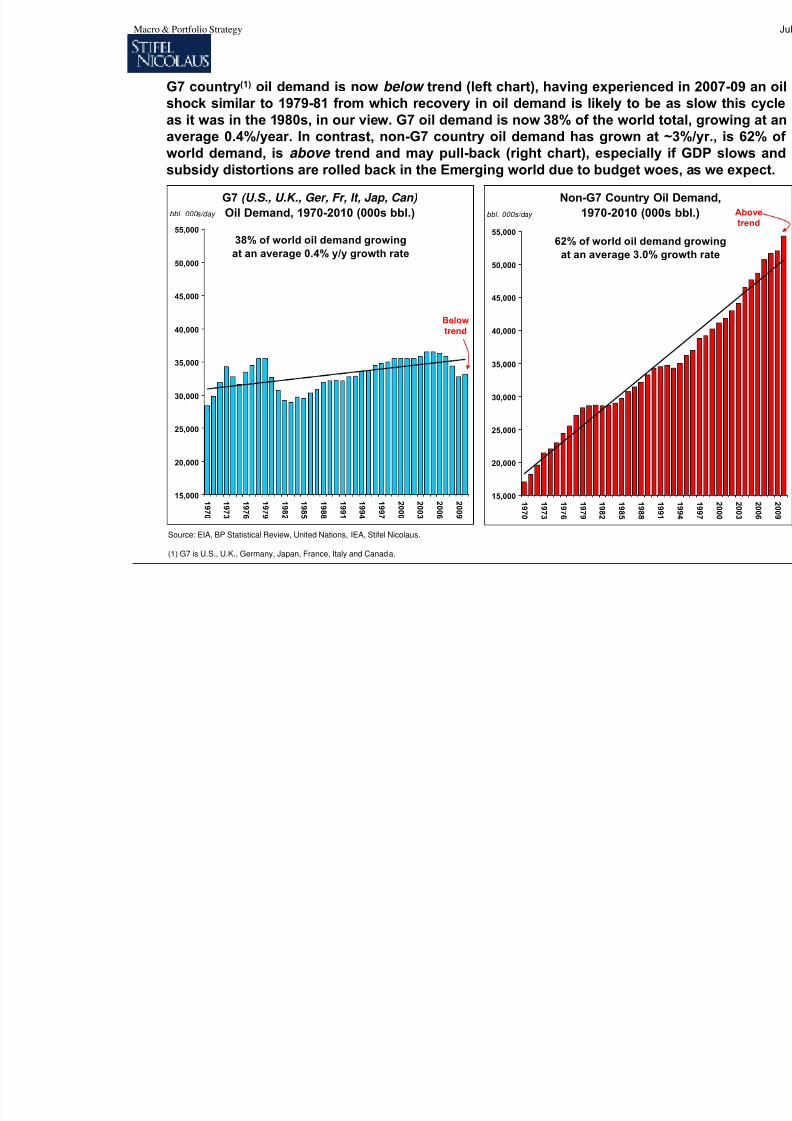
G7 country(1) oil demand is now below trend (left chart), having experienceshock similar to 1979-81 from which recovery in oil demand is likely to beas it was in the 1980s, in our view. G7 oil demand is now 38% of the world taverage 0.4%/year. In contrast, non-G7 country oil demand has grown at
world demand, is above trend and may pull-back (right chart), especiallysubsidy distortions are rolled back in the Emerging world due to budget wo
Source: EIA, BP Statistical Review, United Nations, IEA, Stifel Nicolaus.
(1) G7 is U.S., U.K., Germany, Japan, France, Italy and Canada.
Belowtrend
Macro & Portfolio Strategy
8/6/2019 Bannister - Stifel Nicolaus Mid-2011 Macro Outlook
http://slidepdf.com/reader/full/bannister-stifel-nicolaus-mid-2011-macro-outlook 29/59
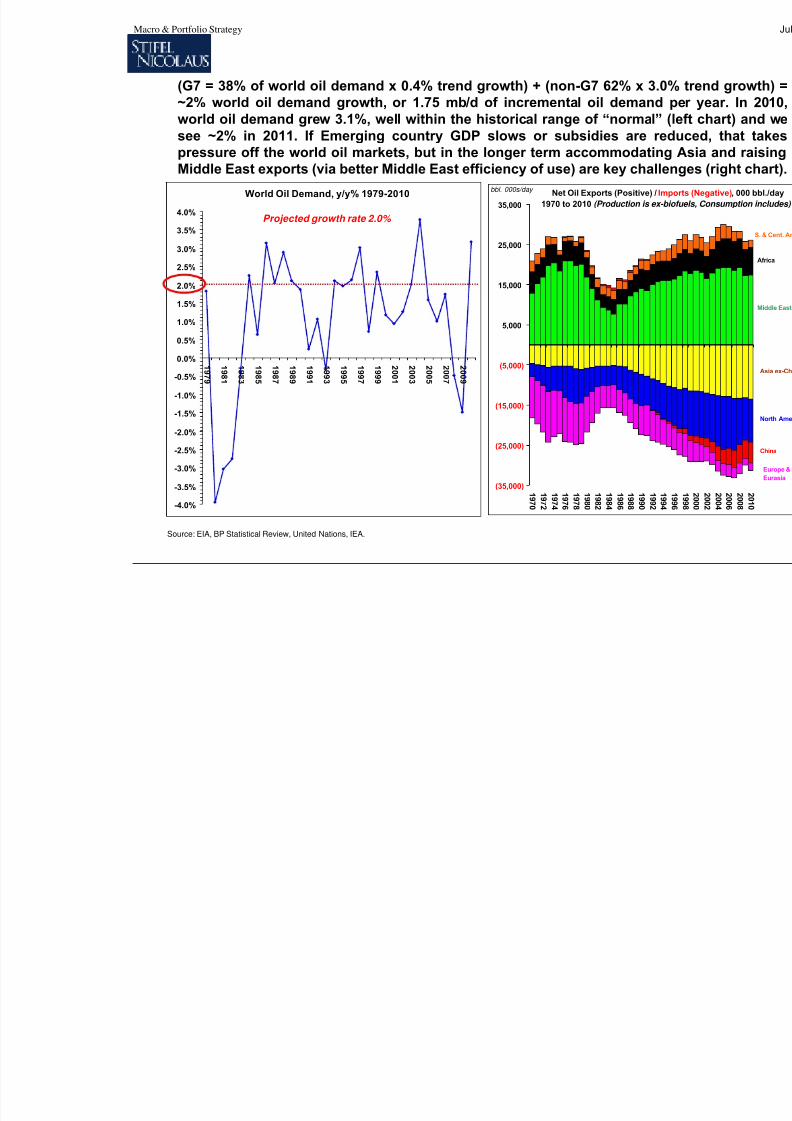
(G7 = 38% of world oil demand x 0.4% trend growth) + (non-G7 62% x 3.0~2% world oil demand growth, or 1.75 mb/d of incremental oil demandworld oil demand grew 3.1%, well within the historical range of “normal”see ~2% in 2011. If Emerging country GDP slows or subsidies are re
pressure off the world oil markets, but in the longer term accommodatinMiddle East exports (via better Middle East efficiency of use) are key chall
Source: EIA, BP Statistical Review, United Nations, IEA.
World Oil Demand, y/y% 1979-2010
Projected growth rate 2.0%
-4.0%
-3.5%
-3.0%
-2.5%
-2.0%
-1.5%
-1.0%
-0.5%
0.0%
0.5%
1.0%
1.5%
2.0%
2.5%
3.0%
3.5%
4.0%
1 9 7 9
1 9 8 1
1 9 8 3
1 9 8 5
1 9 8 7
1 9 8 9
1 9 9 1
1 9 9 3
1 9 9 5
1 9 9 7
1 9 9 9
2 0 0 1
2 0 0 3
2 0 0 5
2 0 0 7
2 0 0 9
Net Oil Exports (Positive) / Im
1970 to 2010 (Production is ex-
(35,000)
(25,000)
(15,000)
(5,000)
5,000
15,000
25,000
35,000
1 9 7 0
1 9 7 2
1 9 7 4
1 9 7 6
1 9 7 8
1 9 8 0
1 9 8 2
1 9 8 4
1 9 8 6
1 9 8 8
1 9 9 0
1 9 9 2
1 9 94
bbl. 000s/day
Macro & Portfolio Strategy
8/6/2019 Bannister - Stifel Nicolaus Mid-2011 Macro Outlook
http://slidepdf.com/reader/full/bannister-stifel-nicolaus-mid-2011-macro-outlook 30/59
8/6/2019 Bannister - Stifel Nicolaus Mid-2011 Macro Outlook
http://slidepdf.com/reader/full/bannister-stifel-nicolaus-mid-2011-macro-outlook 31/59
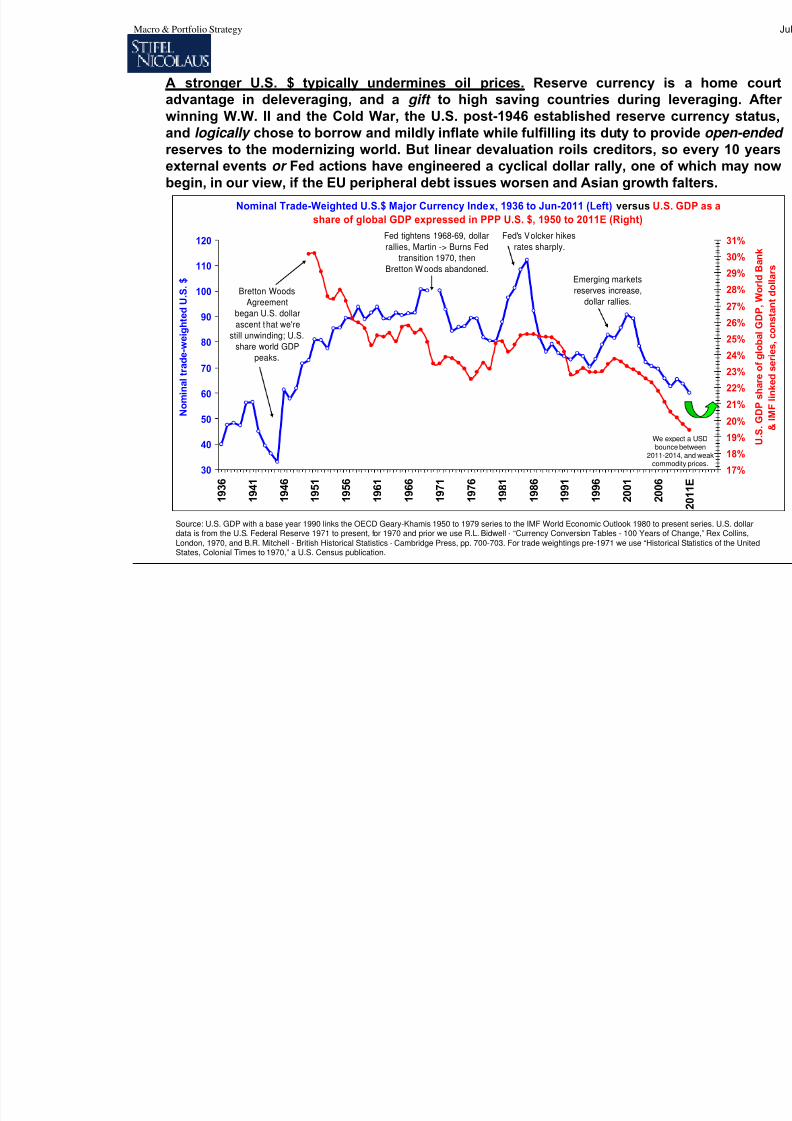
Nominal Trade-Weighted U.S.$ Major Currency Index, 1936 to Jun-2011 (Left) versus U.
share of global GDP expressed in PPP U.S. $, 1950 to 2011E (Right)
30
40
50
60
70
80
90
100
110
120
1 9 3 6
1 9 4 1
1 9 4 6
1 9 5 1
1 9 5 6
1 9 6 1
1 9 6 6
1 9 7 1
1 9 7 6
1 9 8 1
1 9 8 6
1 9 9 1
1 9 9 6
2 0 0 1
2 0 0 6
N o m i n a l t r a d e - w e i g h t e d U
. S . $
Bretton Woods
Agreementbegan U.S. dollar
ascent that we're
still unwinding; U.S.
share world GDP
peaks.
Emerging markets
reserves increase,
dollar rallies.
Fed tightens 1968-69, dollar
rallies, Martin -> Burns Fed
transition 1970, then
Bretton W oods abandoned.
Fed's Volcker hikes
rates sharply.
Source: U.S. GDP with a base year 1990 links the OECD Geary-Khamis 1950 to 1979 series to the IMF World Economic Outlook 1980 to data is from the U.S. Federal Reserve 1971 to present, for 1970 and prior we use R.L. Bidwell - “Currency Conversion Tables - 100 Years London, 1970, and B.R. Mitchell - British Historical Statistics - Cambridge Press, pp. 700-703. For trade weightings pre-1971 we use “HistStates, Colonial Times to 1970,” a U.S. Census publication.
A stronger U.S. $ typically undermines oil prices. Reserve currency advantage in deleveraging, and a gift to high saving countries during winning W.W. II and the Cold War, the U.S. post-1946 established reserveand logically chose to borrow and mildly inflate while fulfilling its duty to pr
reserves to the modernizing world. But linear devaluation roils creditors, external events or Fed actions have engineered a cyclical dollar rally, one begin, in our view, if the EU peripheral debt issues worsen and Asian growt
Webo
2011com
Macro & Portfolio Strategy
8/6/2019 Bannister - Stifel Nicolaus Mid-2011 Macro Outlook
http://slidepdf.com/reader/full/bannister-stifel-nicolaus-mid-2011-macro-outlook 32/59
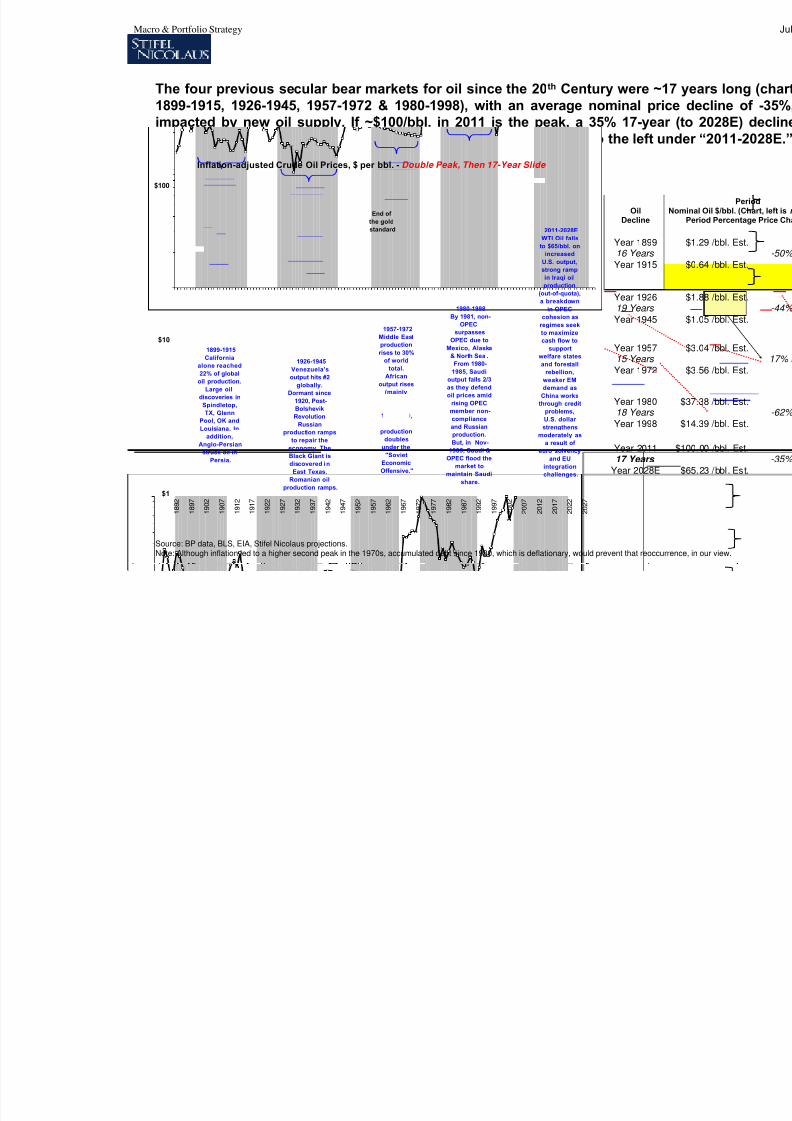
The four previous secular bear markets for oil since the 20th Century were ~1899-1915, 1926-1945, 1957-1972 & 1980-1998), with an average nominal primpacted by new oil supply. If ~$100/bbl. in 2011 is the peak, a 35% 17-yeawould take oil prices to $65/bbl for the reasons we list in the chart to the left u
Source: BP data, BLS, EIA, Stifel Nicolaus projections.Note: Although inflation led to a higher second peak in the 1970s, accumulated debt since 1980, which is deflationary, would prevent that reoccu
Inflation-adjusted Crude Oil Prices, $ per bbl. - Double Peak, Then 17-Year Slide
$1
$10
$100
1 8 9 2
1 8 9 7
1 9 0 2
1 9 0 7
1 9 1 2
1 9 1 7
1 9 2 2
1 9 2 7
1 9 3 2
1 9 3 7
1 9 4 2
1 9 4 7
1 9 5 2
1 9 5 7
1 9 6 2
1 9 6 7
1 9 7 2
1 9 7 7
1 9 8 2
1 9 8 7
1 9 9 2
1 9 9 7
2 0 0 2
2 0 0 7
2 0 1 2
2 0 1 7
2 0 2 2
2 0 2 7
1899-1915
California
alone reached
22% of global
oil production.
Large oil
discoveries in
Spindletop,
TX, Glenn
Pool, OK and
Louisiana. In
addition,
Anglo-Persian
struck oil inPersia.
1926-1945
Venezuela's
output hits #2
globally.
Dormant since
1920, Post-
Bolshevik
Revolution
Russian
production ramps
to repair the
economy. The
Black Giant isdiscovered i n
East Texas.
Romanian oil
production ramps.
1957-1972
Middle East
production
rises to 30%
of world
total.
African
output rises
(mainly
Libya).
Between
1955-1960,
Russian
production
doubles
under the
"SovietEconomic
Offensive."
1980-1998
By 1981, non-
OPEC
surpasses
OPEC due to
Mexico, Alaska
& North Sea .
From 1980-
1985, Saudi
output falls 2/3
as they defend
oil prices amid
rising OPEC
member non-
compliance
and Russian
production.
But, in Nov-
1985, Saudi &
OPEC flood the
market to
maintain Saudi
share.
End of
the gold
standard 2011-2028E
WTI Oil falls
to $65/bbl. on
increased
U.S. output,
strong ramp
in Iraqi oil
production
(out-of-quota),
a breakdownin OPEC
cohesion as
regimes seek
to maximize
cash flow to
support
welfare states
and forestall
rebellion,
weaker EM
demand as
China works
through credit
problems,
U.S. dollar
strengthens
moderately as
a result of
euro solvency
and EU
integration
challenges.
OilDecline
Year 189916 Years
Year 1915
Year 192619 Years
Year 1945
Year 195715 Years
Year 1972
Year 198018 Years
Year 1998
Year 201117 Years
Year 2028E
Macro & Portfolio Strategy
8/6/2019 Bannister - Stifel Nicolaus Mid-2011 Macro Outlook
http://slidepdf.com/reader/full/bannister-stifel-nicolaus-mid-2011-macro-outlook 33/59
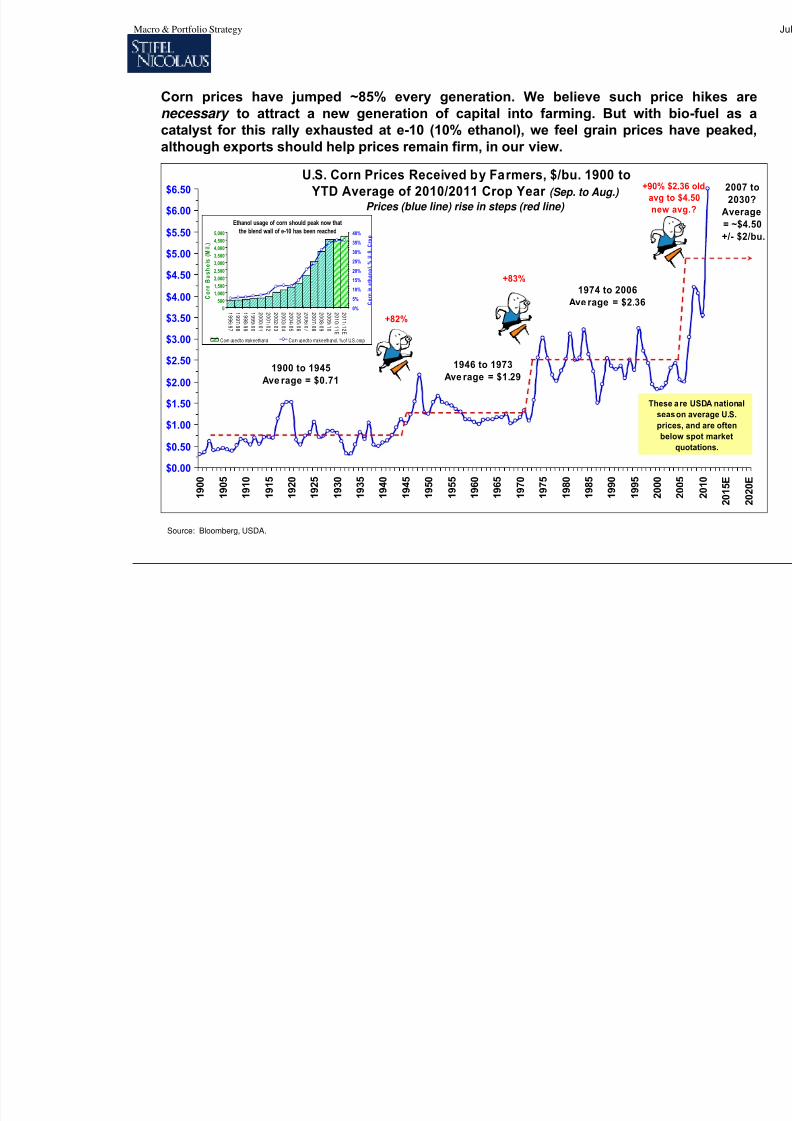
Corn prices have jumped ~85% every generation. We believe such prnecessary to attract a new generation of capital into farming. But with catalyst for this rally exhausted at e-10 (10% ethanol), we feel grain prices
although exports should help prices remain firm, in our view.
Source: Bloomberg, USDA.
U.S. Corn Prices Received by Farmers, $/bu. 1900 to YTD Average of 2010/2011 Crop Year (Sep. to Aug.)
Prices (blue line) rise in steps (red line)
$0.00
$0.50
$1.00
$1.50
$2.00
$2.50
$3.00
$3.50$4.00
$4.50
$5.00
$5.50
$6.00
$6.50
1 9 0 0
1 9 0 5
1 9 1 0
1 9 1 5
1 9 2 0
1 9 2 5
1 9 3 0
1 9 3 5
1 9 4 0
1 9 4 5
1 9 5 0
1 9 5 5
1 9 6 0
1 9 6 5
1 9 7 0
1 9 7 5
1 9 8 0
1 9 8 5
1 9 9 0
1 9 9 5
2 0 0 0
1900 to 1945
Ave rage = $0.71
1946 to 1973Ave rage = $1.29
1974 to 2006
Ave rage = $2.36
The
s
p
b
+82%
+83%
+90%
avg
ne
Ethanol usage of corn should peak now that
the blend wall of e-10 has been reached
0500
1,000
1,500
2,000
2,500
3,000
3,500
4,000
4,500
5,000
1 9 9 6 / 9 7
1 9 9 7 / 9 8
1 9 9 8 / 9 9
1 9 9 9 / 0 0
2 0 0 0 / 0 1
2 0 0 1 / 0 2
2 0 0 2 / 0 3
2 0 0 3 / 0 4
2 0 0 4 / 0 5
2 0 0 5 / 0 6
2 0 0 6 / 0 7
2 0 0 7 / 0 8
2 0 0 8 / 0 9
2 0 0 9 / 1 0
2 0 1 0 / 1 1 E
2 0 1 1 / 1 2 E
C o r n
B u s h e l s ( M i l . )
0%
5%
10%
15%
20%
25%
30%
35%
40%
C o r n
i n
e t h a n o l , %
U . S .
C r o p
Corn used to make ethanol Corn used to make ethanol, % of U.S. crop
Macro & Portfolio Strategy
8/6/2019 Bannister - Stifel Nicolaus Mid-2011 Macro Outlook
http://slidepdf.com/reader/full/bannister-stifel-nicolaus-mid-2011-macro-outlook 34/59
100
1000
10000
1 9 0 4
1 9 0 7
1 9 1 0
1 9 1 3
1 9 1 6
1 9 1 9
1 9 2 2
1 9 2 5
1 9 2 8
1 9 3 1
1 9 3 4
1 9 3 7
1 9 4 0
1 9 4 3
1 9 4 6
1 9 4 9
1 9 5 2
1 9 5 5
1 9 5 8
1 9 6 1
1 9 6 4
1 9 6 7
1 9 7 0
1 9 7 3
1 9 7 6
1 9 7 9
1 9 8 2
1 9 8 5
I r o n o r e p r o d u c e d ,
m i l . m e t r i c t o n n e s
World iron ore production, left axis World per capita iron ore pr
World Annual Production of Iron Ore
Absolute and Per Capita, 1904-2010E
100
1000
1 9 4 5
1 9 4 7
1 9 4 9
1 9 5 1
1 9 5 3
1 9 5 5
1 9 5 7
1 9 5 9
1 9 6 1
1 9 6 3
1 9 6 5
1 9 6 7
1 9 6 9
1 9 7 1
1 9 7 3
1 9 7 5
I r o n o r e p r o d u c e d , m i l . m e t r i c t o n n e s
0.05
0.07
0.09
0.11
0.13
0.15
0.17
0.19
0.21
0.23
0.25
T on s p er c a pi t a pr o d u c t i on
World iron ore production, left axis
World per capita iron ore production, right axis
World Annual Production of Iron Ore
Absolute and Per Capita, 1945-1975
1000
10000
2 0 0 2
2 0 0 4
2 0 0 6
2 0 0 8
2 0 1 0 E
2 0 1 2 E
2 0 1 4 E
I r o n o r e p r o d u c e d , m i l . m e t r i c t o n n e s
World iron ore p
World per ca pita
World Annual P
Absolute and P
1 9 4 6 - 5 4 C A G R
1 3 %
2 0 0 2 - 1 0
C A G R
1 0 %
1 9 5 4
- 7 5 C A G R
4 %
Post-WW2 were8 strong years
for infrastructure,followed by
cyclical growth.
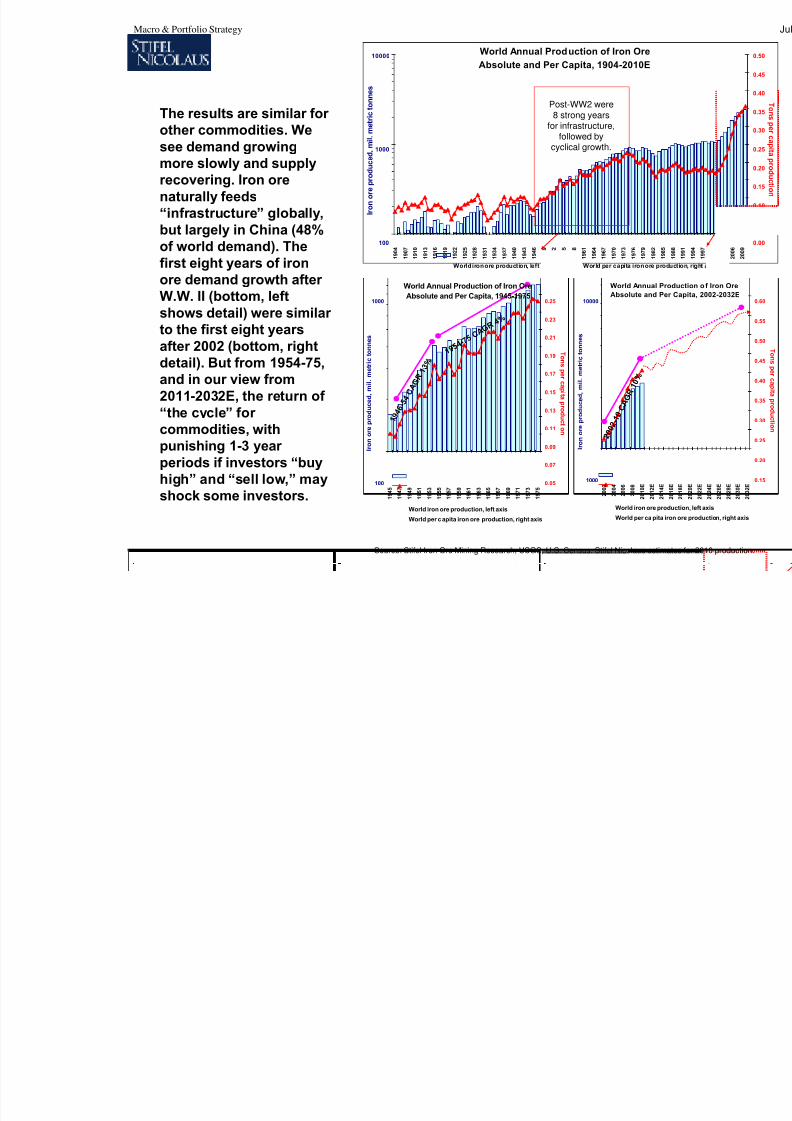
The results are similar for other commodities. We
see demand growingmore slowly and supplyrecovering. Iron orenaturally feeds“infrastructure” globally,but largely in China (48%of world demand). Thefirst eight years of ironore demand growth after
W.W. II (bottom, leftshows detail) were similar to the first eight yearsafter 2002 (bottom, rightdetail). But from 1954-75,and in our view from2011-2032E, the return of “the cycle” for commodities, withpunishing 1-3 year periods if investors “buyhigh” and “sell low,” mayshock some investors.
Source: Stifel Iron Ore Mining Research, USGS, U.S. Census. Stifel Nicolaus estim
Macro & Portfolio Strategy

8/6/2019 Bannister - Stifel Nicolaus Mid-2011 Macro Outlook
http://slidepdf.com/reader/full/bannister-stifel-nicolaus-mid-2011-macro-outlook 35/59
Since commodities have become a financial should be subject to/pressured by a monetary
Macro & Portfolio Strategy
8/6/2019 Bannister - Stifel Nicolaus Mid-2011 Macro Outlook
http://slidepdf.com/reader/full/bannister-stifel-nicolaus-mid-2011-macro-outlook 36/59
150
200
250
300
350
400
450
500
550
600
650
700
750
A u g - 9
8
F e b - 9
9
A u g - 9
9
F e b - 0
0
A u g - 0
0
F e b - 0
1
A u g - 0
1
F e b - 0
2
A u g - 0
2
F e b - 0
3
A u g - 0
3
F e b - 0
4
A u g - 0
4
F e b 0 5
Commodity Prices (CRB FCommodity
Daily prices 10/14/19
Cg
$0
$1,000
$2,000
$3,000
$4,000
$5,000
$6,000
$7,000
$8,000
$9,000
$10,000
$11,000
$12,000
$13,000
$14,000
$15,000
J a n - 8 1
J a n - 8 2
J a n - 8 3
J a n - 8 4
J a n - 8 5
J a n - 8 6
J a n - 8 7
J a n - 8 8
J a n - 8 9
J a n - 9 0
J a n - 9 1
J a n - 9 2
J a n - 9 3
J a n - 9 4
J a n - 9 5
J a n - 9 6
J a n - 9 7
J a n - 9 8
J a n - 9 9
J a n - 0 0
J a n - 0 1
J a n - 0 2
J a n - 0 3
J a n - 0 4
J a n - 0 5
J a n - 0 6
J a n - 0 7
J a n - 0 8
J a n - 0 9
J a n - 1 0
J a n - 1 1
Growth of Components of U.S. M3 Money Supply ($ bil.)
Institutional Mone yFunds
Eurodollars
Repos
Large-Time Deposits
Retail Money Funds
Small Denom. TimeDeposits
Savings Deposits
Demand & Other
Check Deposits
Currency & TravelersChecks
M2 = Below
Sum = M3
M1 = Below
Deng currencyreforms in China,Mexican Peso &
Asian debt crises.
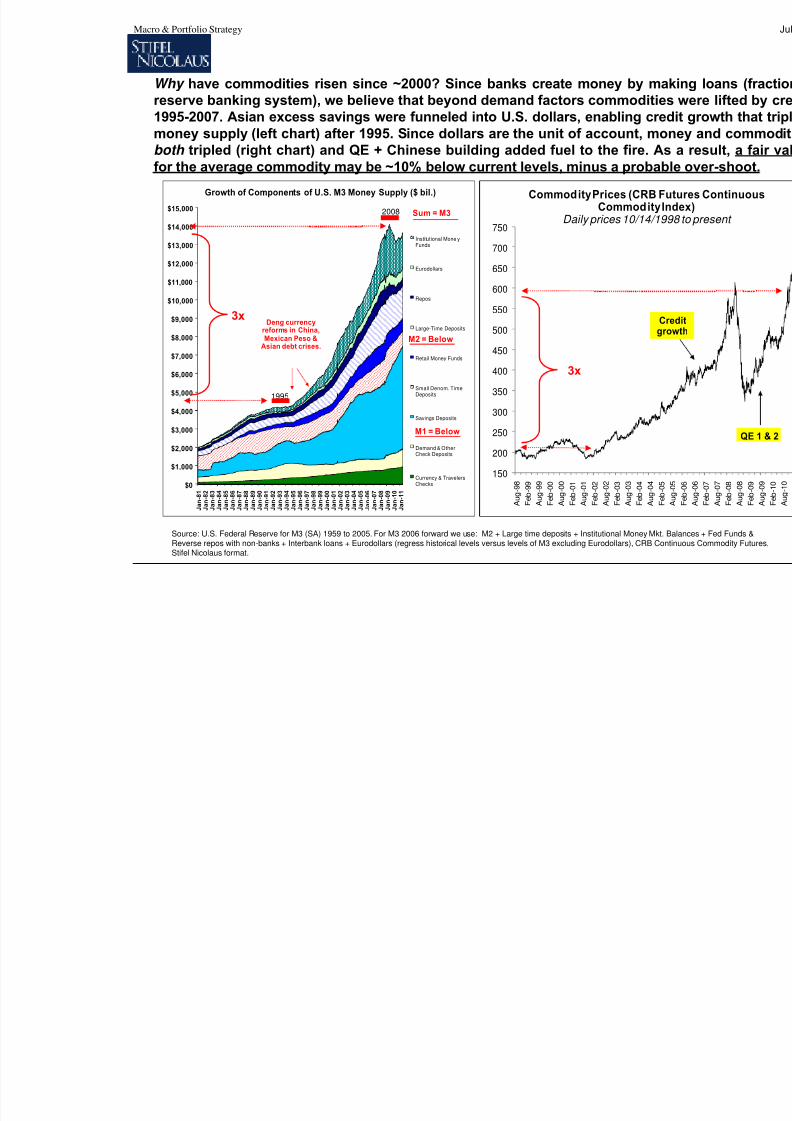
Why have commodities risen since ~2000? Since banks create money by mreserve banking system), we believe that beyond demand factors commoditie1995-2007. Asian excess savings were funneled into U.S. dollars, enabling cremoney supply (left chart) after 1995. Since dollars are the unit of account, mo
both tripled (right chart) and QE + Chinese building added fuel to the fire. Afor the average commodity may be ~10% below current levels, minus a proba
Source: U.S. Federal Reserve for M3 (SA) 1959 to 2005. For M3 2006 forward we use: M2 + Large time deposits + Institutional Money MktReverse repos with non-banks + Interbank loans + Eurodollars (regress historical levels versus levels of M3 excluding Eurodollars), CRB CoStifel Nicolaus format.
3x
1995
3x
2008
Macro & Portfolio Strategy
8/6/2019 Bannister - Stifel Nicolaus Mid-2011 Macro Outlook
http://slidepdf.com/reader/full/bannister-stifel-nicolaus-mid-2011-macro-outlook 37/59
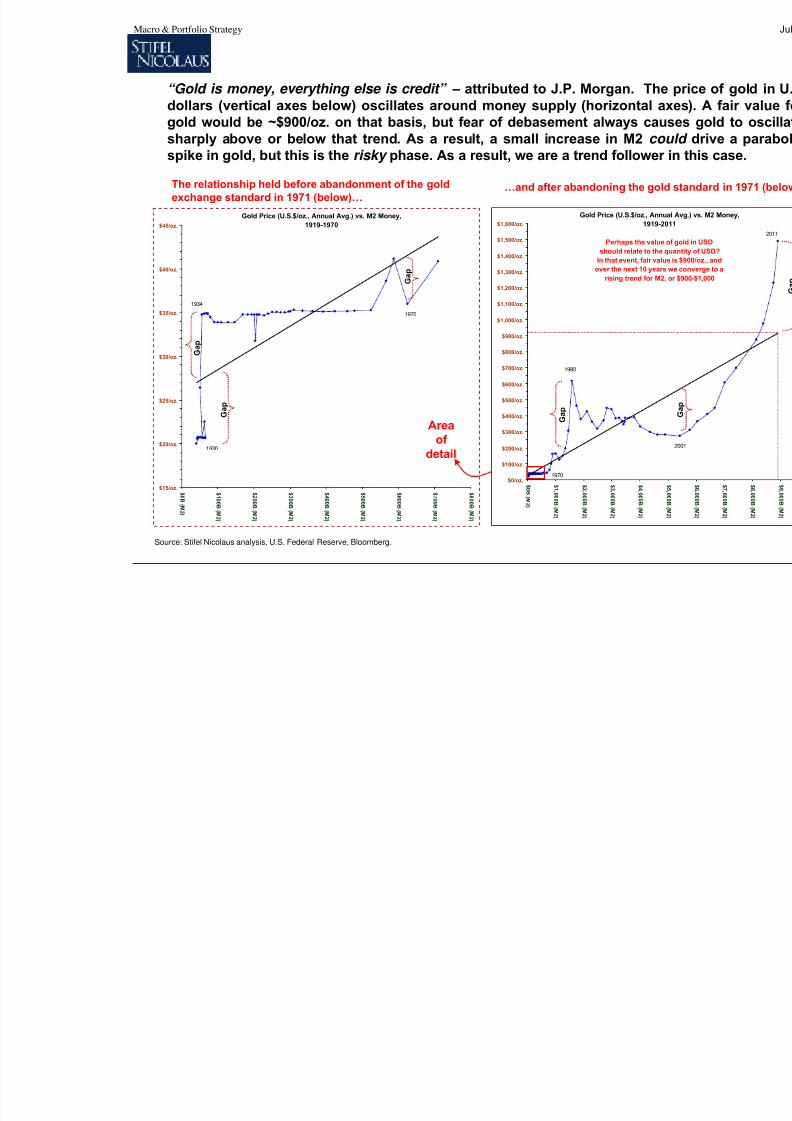
“Gold is money, everything else is credit” – attributed to J.P. Morgan. Thedollars (vertical axes below) oscillates around money supply (horizontal agold would be ~$900/oz. on that basis, but fear of debasement always causharply above or below that trend. As a result, a small increase in M2 co
spike in gold, but this is the risky phase. As a result, we are a trend follower
Source: Stifel Nicolaus analysis, U.S. Federal Reserve, Bloomberg.
Gold Price (U.S.$/oz., Ann
1919-2
Perhaps the value
should relate to the
In that event, fair val
over the next 10 year
rising trend for M2
$0/oz.
$100/oz.
$200/oz.
$300/oz.
$400/oz.
$500/oz.
$600/oz.
$700/oz.
$800/oz.
$900/oz.
$1,000/oz.
$1,100/oz.
$1,200/oz.
$1,300/oz.
$1,400/oz.
$1,500/oz.
$1,600/oz.
$ 0 B
( M2 )
$ 1 , 0 0 0 B
( M2 )
$ 2 , 0 0 0 B
( M2 )
$ 3 , 0 0 0 B
( M2 )
$ 4 , 0 0 0 B
( M2 )
1980
1970
Gold Price (U.S.$/oz., Annual Avg.) vs. M2 Money,
1919-1970
$15/oz.
$20/oz.
$25/oz.
$30/oz.
$35/oz.
$40/oz.
$45/oz.
$ 0 B
( M2 )
$ 1 0 0 B
( M2 )
$ 2 0 0 B
( M2 )
$ 3 0 0 B
( M2 )
$ 4 0 0 B
( M2 )
$ 5 0 0 B
( M2 )
$ 6 0 0 B
( M2 )
$ 7 0 0 B
( M2 )
$ 8 0 0 B
( M2 )
1934
1970
1930
Areaof
detail
G a p
G a p
G a p
G a p
The relationship held before abandonment of the goldexchange standard in 1971 (below)…
…and after abandoning the go
Macro & Portfolio Strategy
8/6/2019 Bannister - Stifel Nicolaus Mid-2011 Macro Outlook
http://slidepdf.com/reader/full/bannister-stifel-nicolaus-mid-2011-macro-outlook 38/59
$0/bbl.
$1/bbl.
$1/bbl.
$2/bbl.
$2/bbl.
$3/bbl.
$3/bbl.
$4/bbl.
$4/bbl.
$5/bbl.
$ 0 B ( M2 )
$ 1 0 0 B ( M2 )
$ 2 0 0 B ( M2 )
$ 3 0 0 B ( M2 )
$ 4 0 0 B ( M2 )
$ 5 0 0 B ( M2 )
$ 6 0 0 B ( M2 )
$ 7 0 0 B ( M2 )
Oil Price (U.S.$/bbl., Annual Avg.) vs. M2 Money,1919-1970
1968
1949
1960
1945
1920
1931
$0/bbl.
$10/bbl.
$20/bbl.
$30/bbl.
$40/bbl.
$50/bbl.
$60/bbl.
$70/bbl.
$80/bbl.
$90/bbl.
$100/bbl.
$110/bbl.
$ 0 B ( M2 )
$ 1 , 0 0 0 B ( M2 )
$ 2 , 0 0 0 B ( M2 )
$ 3 , 0 0 0 B ( M2 )
$ 4 , 0 0 0 B ( M2 )
Oil Price (U.S.$/Bbl., Annua1919-20
1998
1980
Area of detail
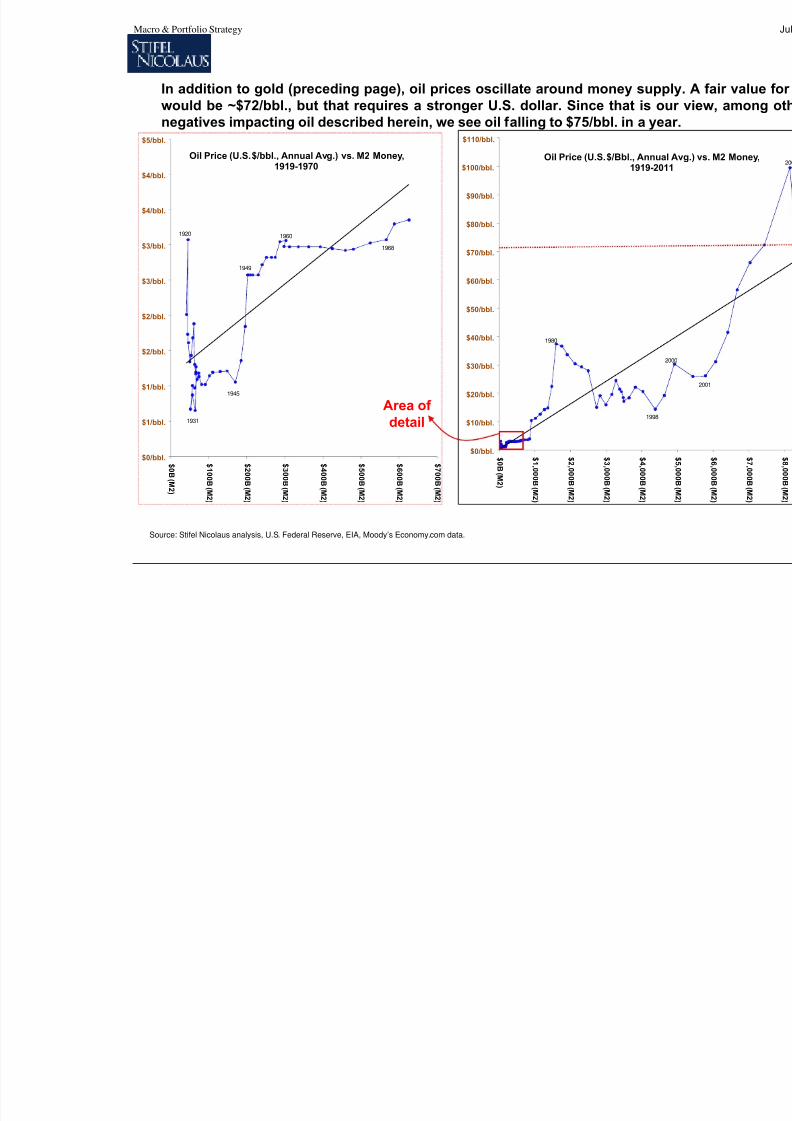
In addition to gold (preceding page), oil prices oscillate around money supwould be ~$72/bbl., but that requires a stronger U.S. dollar. Since that is onegatives impacting oil described herein, we see oil falling to $75/bbl. in a ye
Source: Stifel Nicolaus analysis, U.S. Federal Reserve, EIA, Moody’s Economy.com data.
Macro & Portfolio Strategy

8/6/2019 Bannister - Stifel Nicolaus Mid-2011 Macro Outlook
http://slidepdf.com/reader/full/bannister-stifel-nicolaus-mid-2011-macro-outlook 39/59
The frightening scenario – is the commmarket signaling a 20% S&P 500 bear m
April-August 2011?
Macro & Portfolio Strategy
8/6/2019 Bannister - Stifel Nicolaus Mid-2011 Macro Outlook
http://slidepdf.com/reader/full/bannister-stifel-nicolaus-mid-2011-macro-outlook 40/59
$0
$50
$100
$150
$200
$250
$300
$350
$400
1 / 3 / 1 9
2 1
1 / 3 / 1 9
2 2
1 / 3 / 1 9
2 3
1 / 3 / 1 9
2 4
1 / 3 / 1 9
2 5
1 / 3 / 1 9
2 6
1 / 3 / 1 9
2 7
1 / 3 / 1 9
2 8
1 / 3 / 1 9
2 9
1 / 3 / 1 9
3 0
1 / 3 / 1 9
3 1
1 / 3 / 1 9
3 2
1 / 3 / 1 9
3 3
1 / 3 / 1 9
3 4
1 / 3 / 1 9
3 5
1 / 3 / 1 9
3 6
Dow Jones Industrial Average,1/3/1921-12/31/1936
2
1
3
Fail
$10,000
$15,000
$20,000
$25,000
$30,000
$35,000
$40,000
1 / 2 / 1 9
8 5
1 / 2 / 1 9
8 6
1 / 2 / 1 9
8 7
1 / 2 / 1 9
8 8
1 / 2 / 1 9
8 9
1 / 2 / 1 9
9 0
1 / 2 / 1 9
9 1
1 / 2 / 1 9
9 2
1 / 2 / 1 9
9 3
1 / 2 / 1 9
9 4
1 / 2 / 1 9
9 5
1 / 2 / 1 9
9 6
Nikkei 225,1/2/1985 - 12/30/1996
2
1
3
Fail
$500
$1,000
$1,500
$2,000
$2,500
$3,000
$3,500
$4,000
$4,500
$5,000
1 2 / 1 / 9 4
1 2 / 1 / 9 5
1 2 / 1 / 9 6
1
$0
$20
$40
$60
$80
$100
$120
$140
$160
1 / 2 / 1 9 9 7
1 / 2 / 1 9 9 8
1 / 2 / 1 9 9 9
1 / 2 / 2 0 0 0
1 / 2 / 2 0 0 1
1 / 2 / 2 0 0 2
1 / 2 / 2 0 0 3
1 / 2 / 2 0 0 4
1 / 2 / 2 0 0 5
1 / 2 / 2 0 0 6
1 / 2 / 2 0 0 7
1 / 2 / 2 0 0 8
1 / 2 / 2 0 0 9
1 / 2 / 2 0 1 0
WTI Oil,1/2/1998 - 12/31/2010
2
1
3Fail
$0
$500
$1,000
$1,500
$2,000
$2,500
$3,000
$3,500
$4,000
$4,500
$5,000
1 2 / 3 0
1 2 / 3 0
1 2 / 3 0
1 2 / 3 0
$100
$200
$300
$400
$500
$600
$700
$800
$900
0 1 / 2 6 / 7 8
0 5 / 2 6 / 7 8
0 9 / 2 6 / 7 8
0 1 / 2 6 / 7 9
0 5 / 2 6 / 7 9
0 9 / 2 6 / 7 9
0 1 / 2 6 / 8 0
0 5 / 2 6 / 8 0
0 9 / 2 6 / 8 0
0 1 / 2 6 / 8 1
0 5 / 2 6 / 8 1
0 9 / 2 6 / 8 1
Gold Price $/oz. 1980 Bubble
2/1/78 - 1/31/82
2
1
3Fail
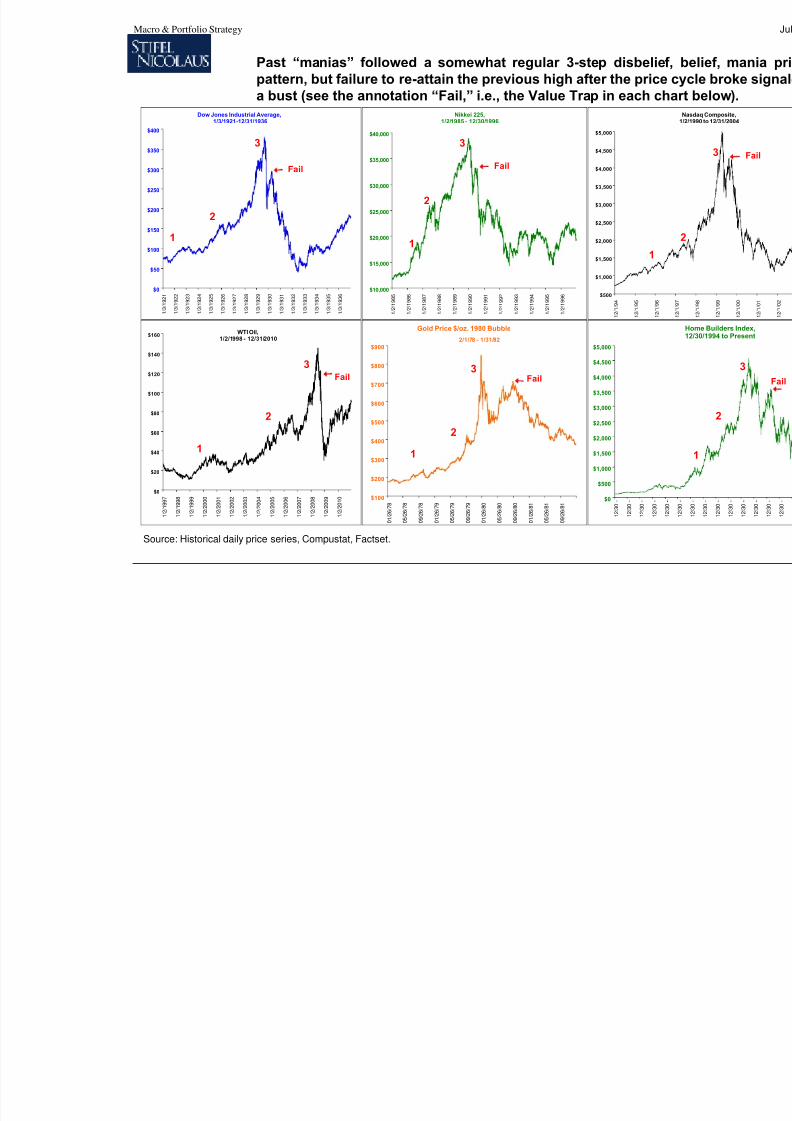
Past “manias” followed a somewhat regular 3-step disbeliepattern, but failure to re-attain the previous high after the pricea bust (see the annotation “Fail,” i.e., the Value Trap in each c
Source: Historical daily price series, Compustat, Factset.
Macro & Portfolio Strategy
8/6/2019 Bannister - Stifel Nicolaus Mid-2011 Macro Outlook
http://slidepdf.com/reader/full/bannister-stifel-nicolaus-mid-2011-macro-outlook 41/59
100
150
200
250
300
350
400
450
500
550
600
650
700
A u g - 9 8
F e b - 9 9
A u g - 9 9
F e b - 0 0
A u g - 0 0
F e b - 0 1
A u g - 0 1
F e b - 0 2
A u g - 0 2
F e b - 0 3
A u g - 0 3
F e b - 0 4
A u g - 0 4
F e b - 0 5
Commodity Prices (CRB FuCommodity In
Daily prices 10/14/19
D I S B
E L I E F
B E L I E F
G
R E E D
I N E V I T A B L E B U S T
D I M I N I S H I N G R E T U R N S B O T T O M T O T O P
“SECULAR” BULLMARKET STAGES
Source: Stifel Nicolaus, CRB Futures from Factset.
B E A
R
T R A P
B U L L
T R A P
V A L U
E
T R A P
D I S B
E L I E F
B E L I E F
B E A
R
T R A P
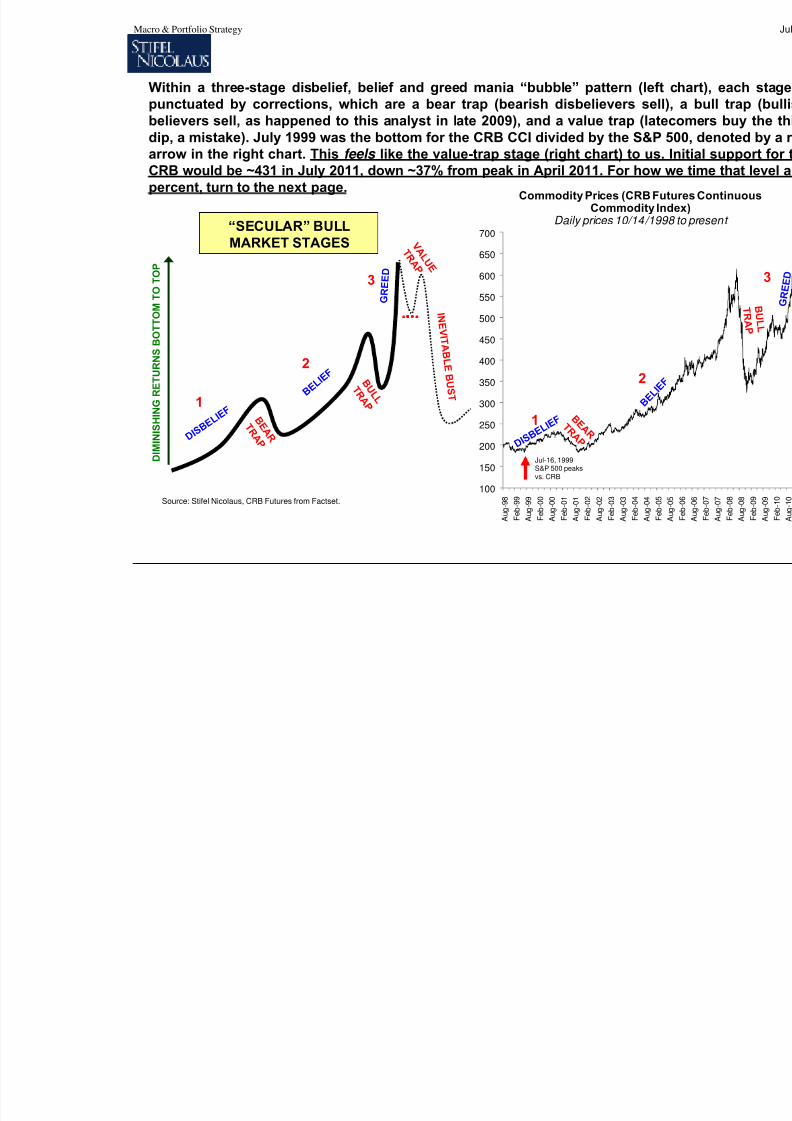
Within a three-stage disbelief, belief and greed mania “bubble” pattern (leftpunctuated by corrections, which are a bear trap (bearish disbelievers selbelievers sell, as happened to this analyst in late 2009), and a value trap (latdip, a mistake). July 1999 was the bottom for the CRB CCI divided by the S&P
arrow in the right chart. This feels like the value-trap stage (right chart) to usCRB would be ~431 in July 2011, down ~37% from peak in April 2011. For howpercent, turn to the next page.
Jul-16, 1999S&P 500 peaksvs. CRB
1
2
3
1
2
Macro & Portfolio Strategy
8/6/2019 Bannister - Stifel Nicolaus Mid-2011 Macro Outlook
http://slidepdf.com/reader/full/bannister-stifel-nicolaus-mid-2011-macro-outlook 42/59
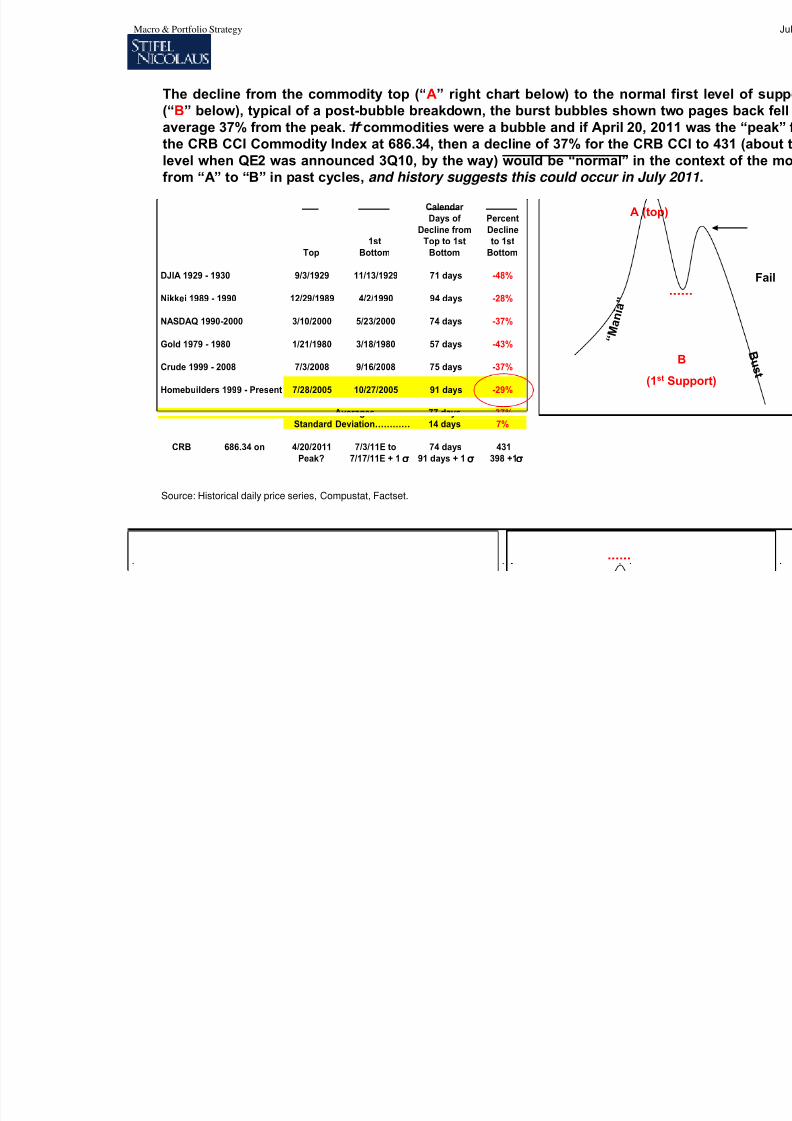
The decline from the commodity top (“A” right chart below) to the norma(“B” below), typical of a post-bubble breakdown, the burst bubbles shown taverage 37% from the peak. If commodities were a bubble and if April 20, 20the CRB CCI Commodity Index at 686.34, then a decline of 37% for the CRBlevel when QE2 was announced 3Q10, by the way) would be “normal” in thfrom “A” to “B” in past cycles, and history suggests this could occur in July
Source: Historical daily price series, Compustat, Factset.
Calendar Days of Percent
Decline from Decline1st Top to 1st to 1st
Top Bottom Bottom Bottom
DJIA 1929 - 1930 9/3/1929 11/13/1929 71 days -48%
Nikkei 1989 - 1990 12/29/1989 4/2/1990 94 days -28%
NASDAQ 1990-2000 3/10/2000 5/23/2000 74 days -37%
Gold 1979 - 1980 1/21/1980 3/18/1980 57 days -43%
Crude 1999 - 2008 7/3/2008 9/16/2008 75 days -37%
Homebuilders 1999 - Present 7/28/2005 10/27/2005 91 days -29%
77 days -37%14 days 7%
CRB 686.34 on 4/20/2011 7/3/11E to 74 days 431
Peak? 7/17/11E + 1 91 days + 1 398 +1
Averages…………Standard Deviation…………
σ σ σ
A (top
(1st
“ M
a n i a ”
Macro & Portfolio Strategy
8/6/2019 Bannister - Stifel Nicolaus Mid-2011 Macro Outlook
http://slidepdf.com/reader/full/bannister-stifel-nicolaus-mid-2011-macro-outlook 43/59
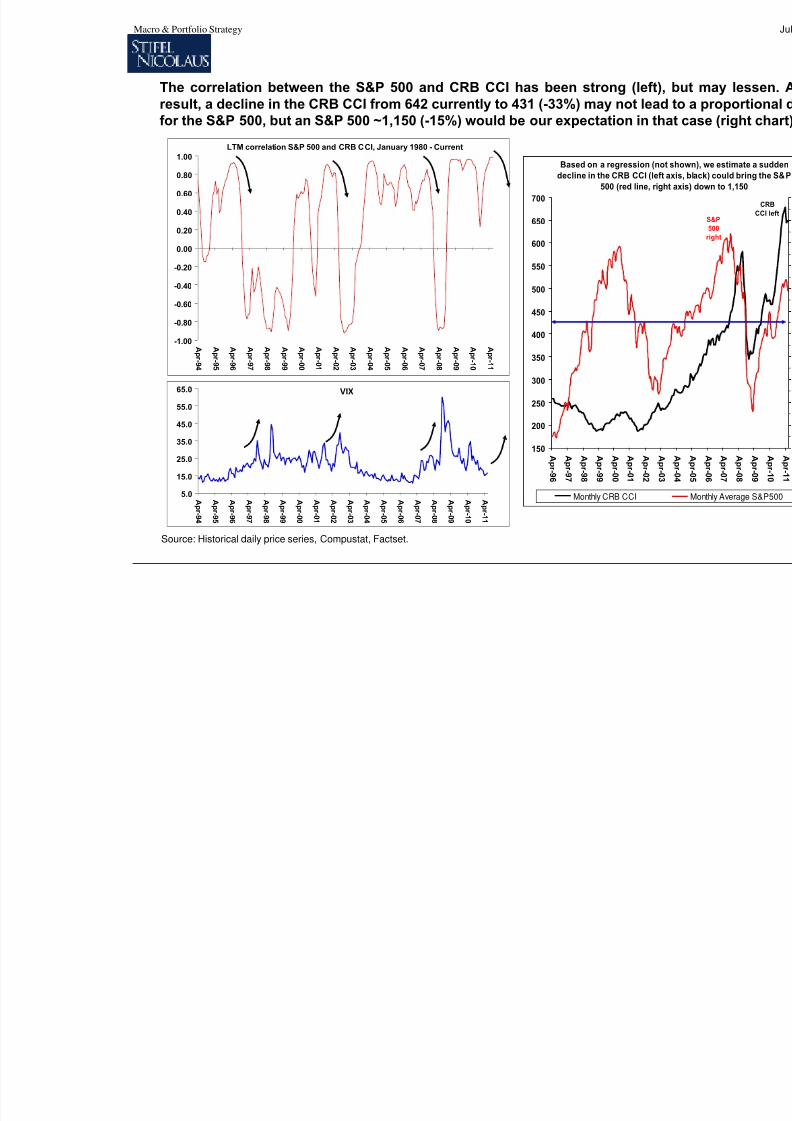
The correlation between the S&P 500 and CRB CCI has been strong (left)result, a decline in the CRB CCI from 642 currently to 431 (-33%) may not leafor the S&P 500, but an S&P 500 ~1,150 (-15%) would be our expectation in th
Source: Historical daily price series, Compustat, Factset.
LTM correlation S&P 500 and CRB CCI, January 1980 - Current
-1.00
-0.80
-0.60
-0.40
-0.20
0.00
0.20
0.40
0.60
0.80
1.00
A pr - 9 4
A pr - 9 5
A pr - 9 6
A pr - 9 7
A pr - 9 8
A pr - 9 9
A pr - 0 0
A pr - 0 1
A pr - 0 2
A pr - 0 3
A pr - 0 4
A pr - 0 5
A pr - 0 6
A pr - 0 7
A pr - 0 8
A pr - 0 9
A pr -1 0
A pr -1 1
VIX
5.0
15.0
25.0
35.0
45.0
55.0
65.0
A pr - 9 4
A pr - 9 5
A pr - 9 6
A pr - 9 7
A pr - 9 8
A pr - 9 9
A pr - 0 0
A pr - 0 1
A pr - 0 2
A pr - 0 3
A pr - 0 4
A pr - 0 5
A pr - 0 6
A pr - 0 7
A pr - 0 8
A pr - 0 9
A pr -1 0
A pr -1 1
Based on a regression (no
decline in the CRB CCI (lef
500 (red line, rig
150
200
250
300
350
400
450
500
550
600
650
700
A pr - 9 6
A pr - 9 7
A pr - 9 8
A pr - 9 9
A pr - 0 0
A pr - 0 1
A pr - 0 2
A pr- 0 3
Monthly CRB CCI
Macro & Portfolio Strategy
8/6/2019 Bannister - Stifel Nicolaus Mid-2011 Macro Outlook
http://slidepdf.com/reader/full/bannister-stifel-nicolaus-mid-2011-macro-outlook 44/59
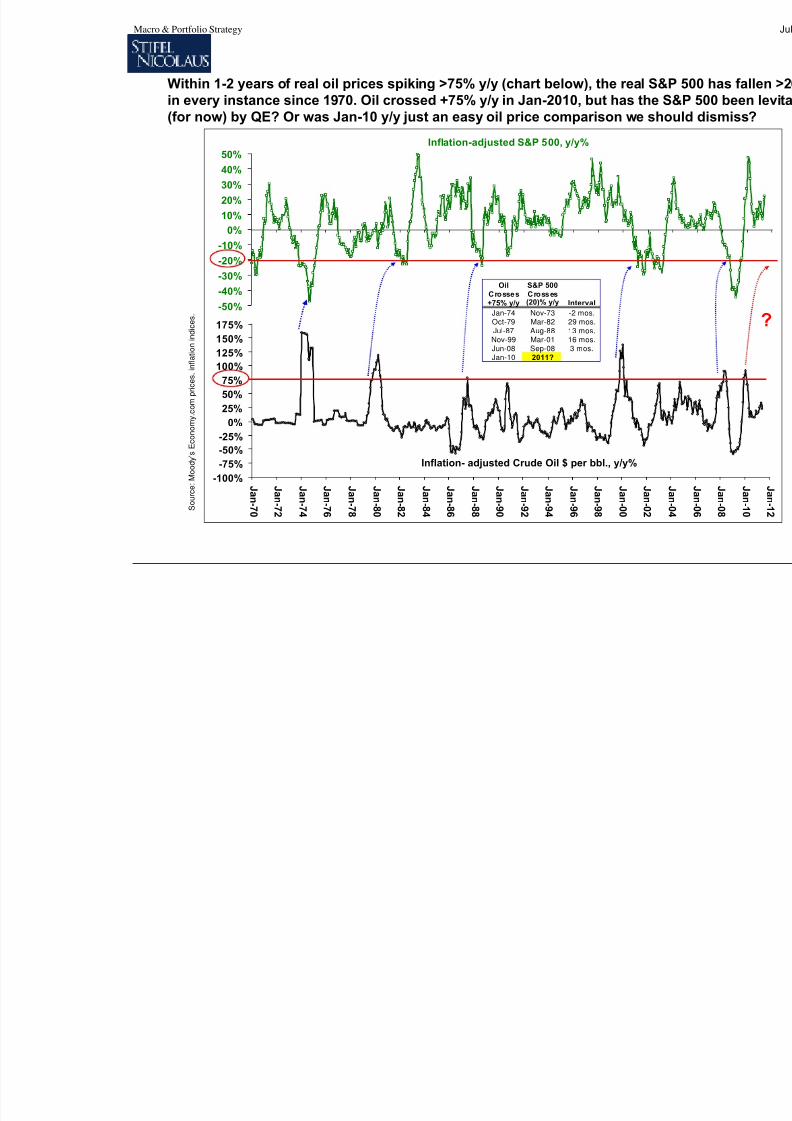
Within 1-2 years of real oil prices spiking >75% y/y (chart below), the real S&in every instance since 1970. Oil crossed +75% y/y in Jan-2010, but has the (for now) by QE? Or was Jan-10 y/y just an easy oil price comparison we sh
S o u r c e :
M o o
d y ’ s
E c o n o m y . c
o m
p r i c e s ,
i n f l a t i o n
i n d i c e s .
Inflation-adjusted S&P 500, y/y%
-50%
-40%
-30%
-20%
-10%
0%
10%
20%
30%
40%
50%
Inflation- adjusted Crude Oil $ per bbl., y/y%
-100%
-75%-50%
-25%
0%
25%
50%
75%
100%
125%
150%
175%
J an-7 0
J an-7 2
J an-7 4
J an-7 6
J an-7 8
J an- 8 0
J an- 8 2
J an- 8 4
J an- 8 6
J an- 8 8
J an- 9 0
J an- 9 2
J an- 9 4
J an- 9 6
J an- 9 8
J an- 0 0
J an- 0 2
Oil S&P 500Crosses Crosses
+75% y/y (20)% y/y IntervalJan-74 Nov-73 -2 mos.Oct-79 Mar-82 29 mos.Jul-87 Aug-88 13 mos.Nov-99 Mar-01 16 mos.Jun-08 Sep-08 3 mos.Jan-10 2011?
Macro & Portfolio Strategy
8/6/2019 Bannister - Stifel Nicolaus Mid-2011 Macro Outlook
http://slidepdf.com/reader/full/bannister-stifel-nicolaus-mid-2011-macro-outlook 45/59
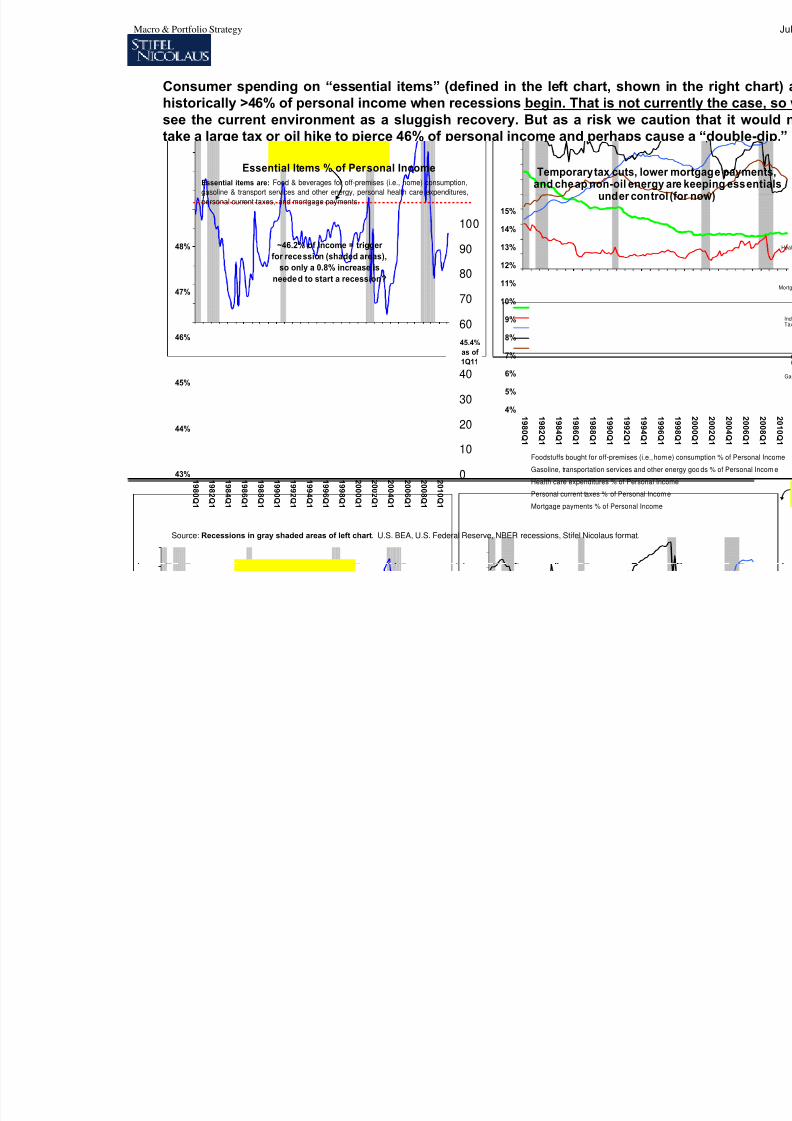
Consumer spending on “essential items” (defined in the left chart, shown historically >46% of personal income when recessions begin. That is not cusee the current environment as a sluggish recovery. But as a risk we cautake a large tax or oil hike to pierce 46% of personal income and perhaps ca
Source: Recessions in gray shaded areas of left chart. U.S. BEA, U.S. Federal Reserve, NBER recessions, Stifel Nicolaus format.
4%
5%
6%
7%
8%
9%
10%
11%
12%
13%
14%
15%
1 9 8 0 Q1
1 9 8 2 Q1
1 9 8 4 Q1
1 9 8 6 Q1
1 9 8 8 Q1
1 9 9 0 Q1
1 9 9 2 Q1
1 9 9 4 Q1
1 9 9 6 Q1
Temporary tax cuts, loweand cheap non-oil energy
under contro
Foodstuffs bought for off-premises (i.e., ho
Gasoline, transportation services and othe
Health care expenditures % of Personal In
Personal current taxes % of Personal Inco
Mortgage payments % of Personal Income
Essential Items % of Personal Income
43%
44%
45%
46%
47%
48%
1 9 8 0 Q1
1 9 8 2 Q1
1 9 8 4 Q1
1 9 8 6 Q1
1 9 8 8 Q1
1 9 9 0 Q1
1 9 9 2 Q1
1 9 9 4 Q1
1 9 9 6 Q1
1 9 9 8 Q1
2 0 0 0 Q1
2 0 0 2 Q1
2 0 0 4 Q1
2 0 0 6 Q1
2 0 0 8 Q1
2 0 1 0 Q1
010
20
30
40
50
60
70
80
90
100
Essential items are: Food & beverages for off-premises (i.e., home) consumption,
gasoline & transport services and other energy, personal health care expenditures,
personal current taxes, and mortgage payments.
~46.2% of Income = trigger
for recession (shaded areas),
so only a 0.8% increase is
needed to start a recession?
45.4%
as of
1Q11
Macro & Portfolio Strategy
8/6/2019 Bannister - Stifel Nicolaus Mid-2011 Macro Outlook
http://slidepdf.com/reader/full/bannister-stifel-nicolaus-mid-2011-macro-outlook 46/59
Fed & Treasury are brilliantly converting a “Depr
debt work-out; we see the 10-year near 4% wi
Faced with the same debt deflation issues as 1929-33 the in 2008-11 responded with every tool not available in 1929
(a) a fiat reserve currency,
(b) unused federal debt capacity,(c) relatively open global labor markets (d) knowledge the democratic U.S. could survive unemplo(e) …knowledge that the Communist Chinese regime coul
U.S. policymakers have chosen to let the air debt out of thborrowing GDP from the future to avoid uncontrolled liqui
Macro & Portfolio Strategy
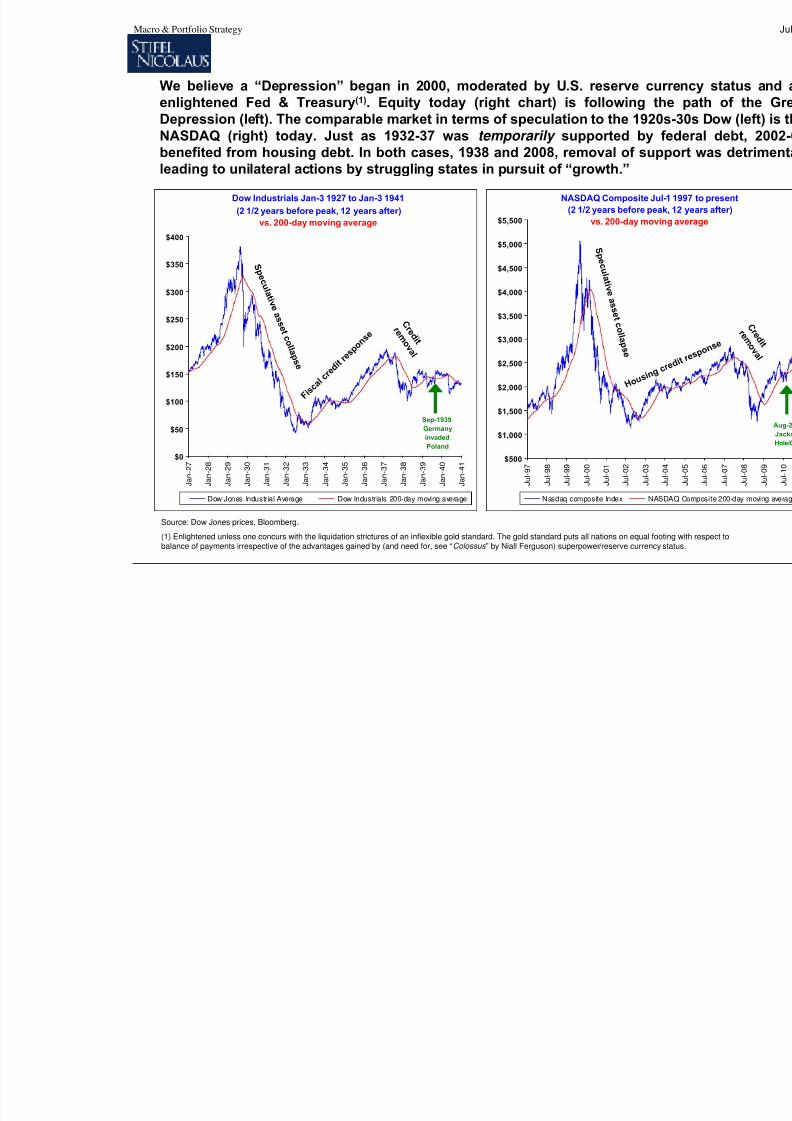
8/6/2019 Bannister - Stifel Nicolaus Mid-2011 Macro Outlook
http://slidepdf.com/reader/full/bannister-stifel-nicolaus-mid-2011-macro-outlook 47/59
Dow Industrials Jan-3 1927 to Jan-3 1941
(2 1/2 years before peak, 12 years after)
vs. 200-day moving average
$0
$50
$100
$150
$200
$250
$300
$350
$400
J a n - 2
7
J a n - 2
8
J a n - 2
9
J a n - 3
0
J a n - 3
1
J a n - 3
2
J a n - 3
3
J a n - 3
4
J a n - 3
5
J a n - 3
6
J a n - 3
7
J a n - 3
8
J a n - 3
9
J a n - 4
0
J a n - 4
1
Dow Jones Industrial Average Dow Industrials 200-day moving average
Sep-1939
Germany
invaded
Poland
NASDAQ Composite Jul
(2 1/2 years before pea
vs. 200-day movi
$500
$1,000
$1,500
$2,000
$2,500
$3,000
$3,500
$4,000
$4,500
$5,000
$5,500
J u l - 9 7
J u l - 9 8
J u l - 9 9
J u l - 0 0
J u l - 0 1
J u l - 0 2
J u l - 0 3
Nasdaq composite Index NAS
We believe a “Depression” began in 2000, moderated by U.S. reserve cuenlightened Fed & Treasury(1). Equity today (right chart) is following thDepression (left). The comparable market in terms of speculation to the 1920NASDAQ (right) today. Just as 1932-37 was temporarily supported by f
benefited from housing debt. In both cases, 1938 and 2008, removal of supleading to unilateral actions by struggling states in pursuit of “growth.”
Source: Dow Jones prices, Bloomberg.
(1) Enlightened unless one concurs with the liquidation strictures of an inflexible gold standard. The gold standard puts all nations on equal foobalance of payments irrespective of the advantages gained by (and need for, see “Colossus ” by Niall Ferguson) superpower/reserve currency
S p
e c u l a t i v e
a s s e t c
o l l a p
s e
S p
e c u l a t i v
e
a s s e t c o l l a p
s e
F i s c
a l c r e d i t r
e s p o
n s e
C r e d i t
r e m o v a l
H o u s i n
g c
Macro & Portfolio Strategy
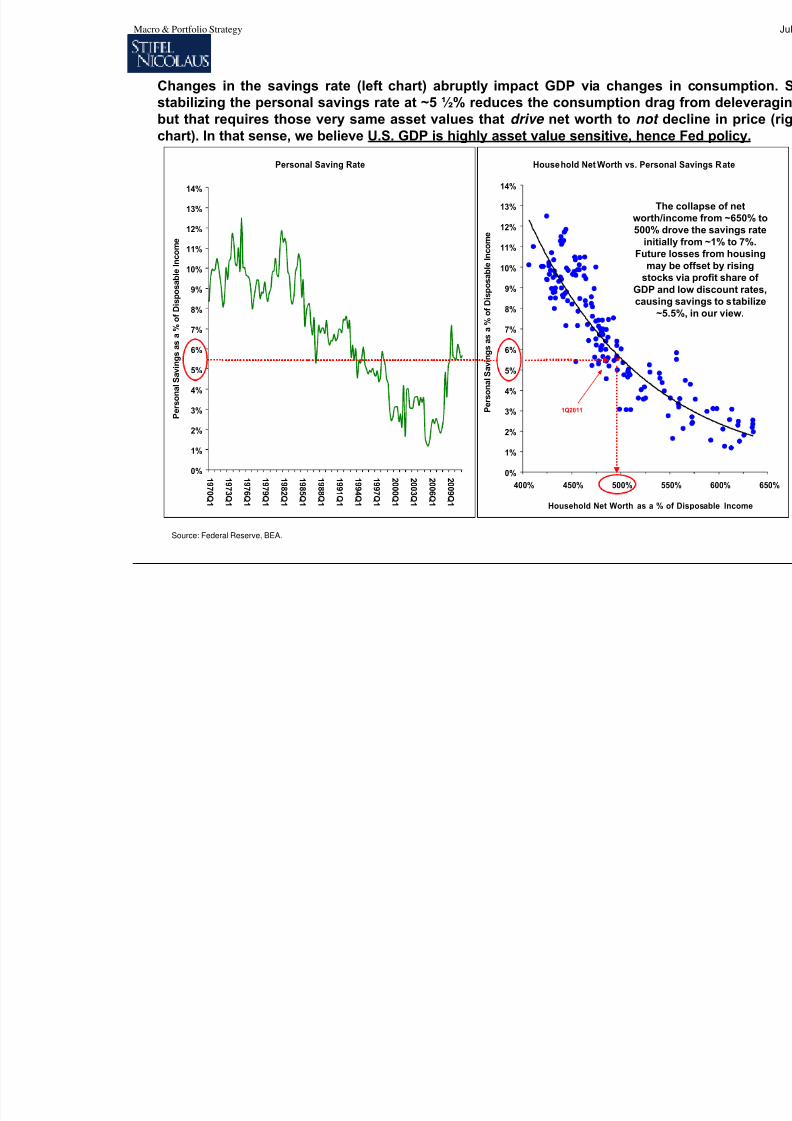
8/6/2019 Bannister - Stifel Nicolaus Mid-2011 Macro Outlook
http://slidepdf.com/reader/full/bannister-stifel-nicolaus-mid-2011-macro-outlook 48/59
0%
1%
2%
3%
4%
5%
6%
7%
8%
9%
10%
11%
12%
13%
14%
1 9 7 0 Q1
1 9 7 3 Q1
1 9 7 6 Q1
1 9 7 9 Q1
1 9 8 2 Q1
1 9 8 5 Q1
1 9 8 8 Q1
1 9 9 1 Q1
1 9 9 4 Q1
1 9 9 7 Q1
2 0 0 0 Q1
2 0 0 3 Q1
2 0 0 6 Q1
2 0 0 9 Q1
P e r s o n a l S a v i n g s a s a % o
f D i s
p o s a b l e I n c o m e
Personal Saving Rate
0%
1%
2%
3%
4%
5%
6%
7%
8%
9%
10%
11%
12%
13%
14%
400% 450% 500% 5
P e r s o n a l S a v i n g s a s a % o
f D
i s p o s a b l e I n c o m e
Household Net Worth as a %
Household Net Worth vs. Perso
1Q2011
Source: Federal Reserve, BEA.
Changes in the savings rate (left chart) abruptly impact GDP via changesstabilizing the personal savings rate at ~5 ½% reduces the consumption drabut that requires those very same asset values that drive net worth to not chart). In that sense, we believe U.S. GDP is highly asset value sensitive, hen
Tworth/500%
initiFuture
maystoc
GDP a
causin~
Macro & Portfolio Strategy
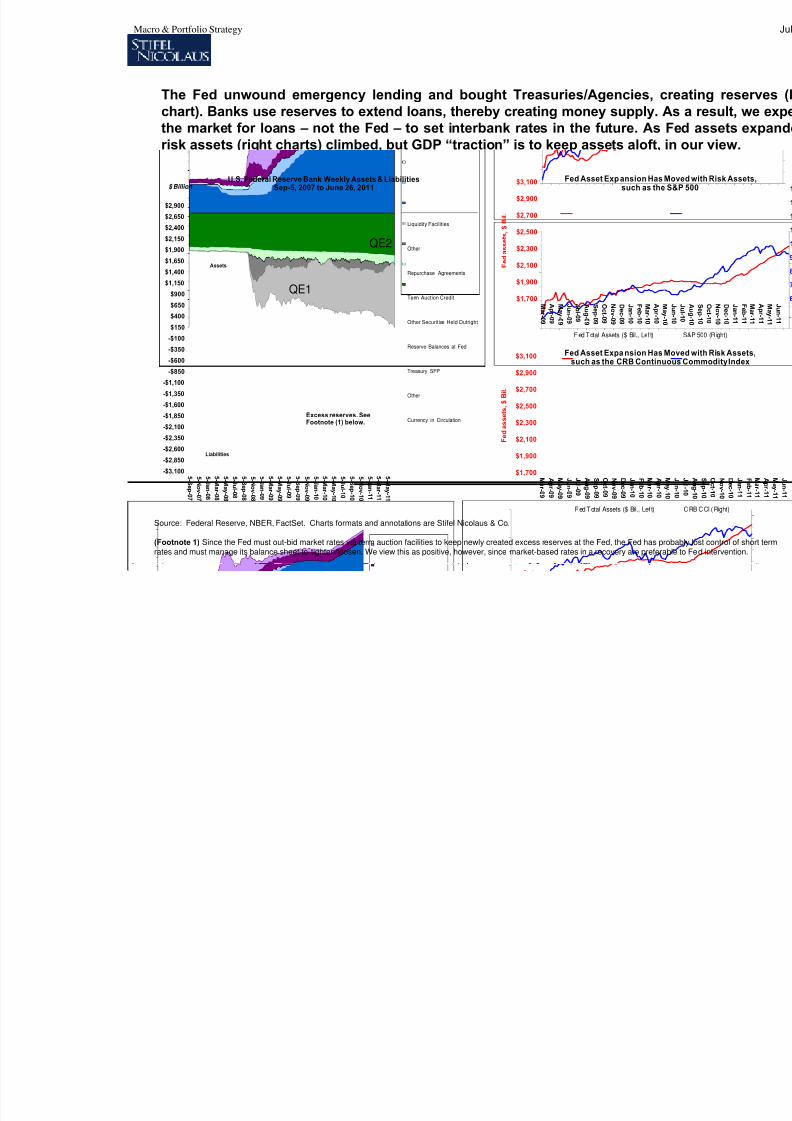
8/6/2019 Bannister - Stifel Nicolaus Mid-2011 Macro Outlook
http://slidepdf.com/reader/full/bannister-stifel-nicolaus-mid-2011-macro-outlook 49/59
Source: Federal Reserve, NBER, FactSet. Charts formats and annotations are Stifel Nicolaus & Co.
(Footnote 1) Since the Fed must out-bid market rates via term auction facilities to keep newly created excess reserves at the Fed, the Fed has prates and must manage its balance sheet to tighten/loosen. We view this as positive, however, since market-based rates in a recovery are prefe
The Fed unwound emergency lending and bought Treasuries/Agencies, cchart). Banks use reserves to extend loans, thereby creating money supply. the market for loans – not the Fed – to set interbank rates in the future. As
risk assets (right charts) climbed, but GDP “traction” is to keep assets aloft,
$1,700
$1,900
$2,100
$2,300
$2,500
$2,700
$2,900
$3,100
M ar - 0 9
A pr - 0 9
M a y- 0 9
J un- 0 9
J ul - 0 9
A u g- 0 9
S e p- 0 9
O c t - 0 9
N ov- 0 9
D e c- 0 9
J an-1 0
F e b -1 0
M ar -1 0
A pr -1 0
y
F e d a s s e t s , $ B i l .
Fed Asset Expansion Hassuch as the
Fed Total Assets ($ Bil., Lef t)
$1,700
$1,900
$2,100
$2,300
$2,500
$2,700
$2,900
$3,100
M ar - 0 9
A pr - 0 9
M a y- 0 9
J un- 0 9
J ul - 0 9
A u g- 0 9
S e p- 0 9
O c t - 0 9
N ov- 0 9
D e c- 0 9
J an-1 0
F e b -1 0
M ar -1 0
A pr -1 0
F e d a s s e t s , $ B i l .
Fed Asset Expansion Hassuch as the CRB Contin
Fed Total Assets ($ Bil., Lef t)
-$3,100
-$2,850
-$2,600
-$2,350
-$2,100
-$1,850
-$1,600
-$1,350
-$1,100
-$850
-$600
-$350
-$100
$150
$400
$650
$900
$1,150
$1,400
$1,650
$1,900
$2,150
$2,400
$2,650
$2,900
5 - S e p- 0 7
5 -N ov- 0 7
5 - J an- 0 8
5 -M ar - 0 8
5 -M a y- 0 8
5 - J ul - 0 8
5 - S e p- 0 8
5 -N ov- 0 8
5 - J an- 0 9
5 -M ar - 0 9
5 -M a y- 0 9
5 - J ul - 0 9
5 - S e p- 0 9
5 -N ov- 0 9
5 - J an-1 0
5 -M ar -1 0
5 -M a y-1 0
5 - J ul -1 0
5 - S e p-1 0
5 -N ov-1 0
5 - J an-1 1
5 -M ar -1 1
5 -M a y-1 1
U.S. Federal Reserve Bank Weekly Assets & LiabilitiesSep-5, 2007 to June 26, 2011
Liquidity Facilities
Other
Repurchase Agreements
Term Auction Credit
Other Securities Held Outright
Reserve Balances at Fed
Treasury SFP
Other
Currency in Circulation
Assets
Liabilities
$ Billion
Excess reserves. SeeFootnote (1) below.
QE1
QE2
Macro & Portfolio Strategy
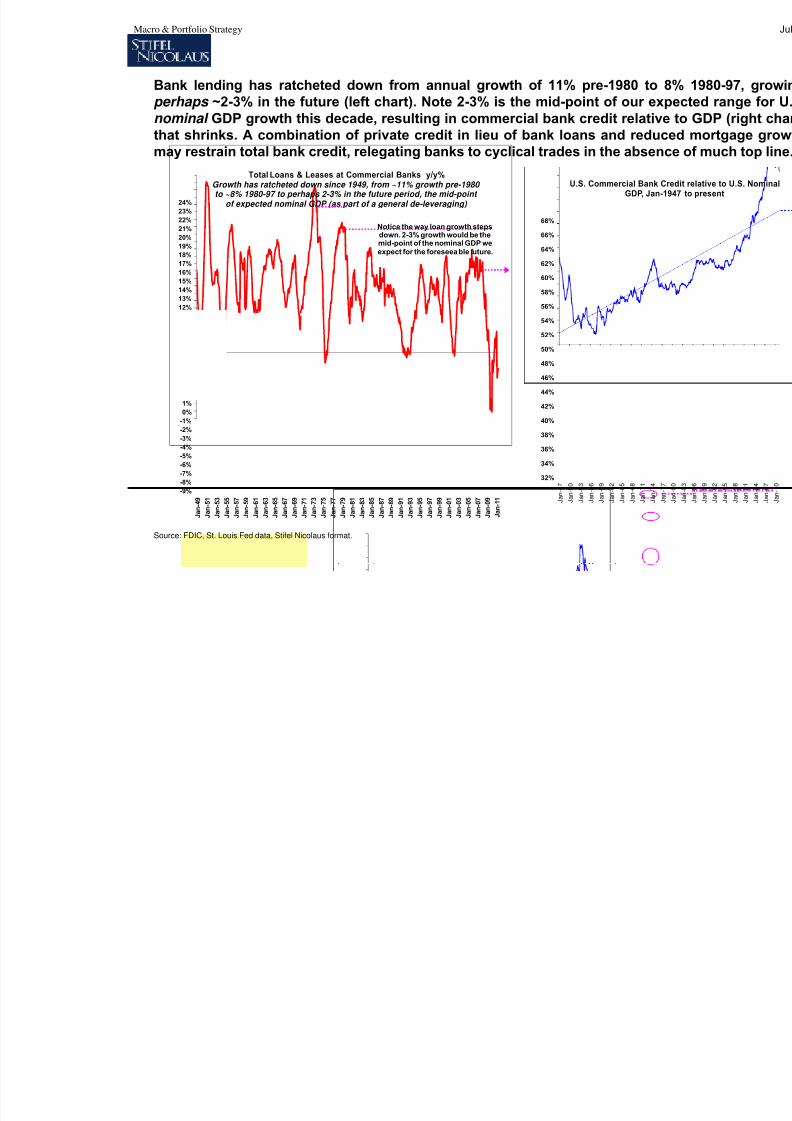
8/6/2019 Bannister - Stifel Nicolaus Mid-2011 Macro Outlook
http://slidepdf.com/reader/full/bannister-stifel-nicolaus-mid-2011-macro-outlook 50/59
-9%
-8%
-7%
-6%-5%
-4%
-3%
-2%
-1%
0%
1%
2%
3%
4%
5%
6%
7%
8%
9%
10%
11%
12%
13%
14%
15%
16%
17%
18%
19%
20%
21%
22%
23%
24%
J a n - 4 9
J a n - 5 1
J a n - 5 3
J a n - 5 5
J a n - 5 7
J a n - 5 9
J a n - 6 1
J a n - 6 3
J a n - 6 5
J a n - 6 7
J a n - 6 9
J a n - 7 1
J a n - 7 3
J a n - 7 5
J a n - 7 7
J a n - 7 9
J a n - 8 1
J a n - 8 3
J a n - 8 5
J a n - 8 7
J a n - 8 9
J a n - 9 1
J a n - 9 3
J a n - 9 5
J a n - 9 7
J a n - 9 9
J a n - 0 1
J a n - 0 3
J a n - 0 5
J a n - 0 7
J a n - 0 9
J a n - 1 1
Total Loans & Leases at Commercial Banks y/y%Growth has ratcheted down since 1949, from ~11% growth pre-1980 to ~8% 1980-97 to perhaps 2-3% in the future period, the mid-point
of expected nominal GDP (as part of a general de-leveraging)
Notice the way loan growth stepsdown. 2-3% growth would be themid-point of the nominal GDP weexpect for the foreseeable future.
32%
34%
36%
38%
40%
42%
44%
46%
48%
50%
52%
54%
56%
58%
60%
62%
64%
66%
68%
J a n - 4
7
J a n - 5
0
J a n - 5
3
J a n - 5
6
J a n - 5
9
J a n - 6
2
J a n - 6
5
J a n - 6
8
J a n - 7
1
J a n - 7
4
J
7 7
U.S. Commercial Bank CGDP, Jan-
Source: FDIC, St. Louis Fed data, Stifel Nicolaus format.
Bank lending has ratcheted down from annual growth of 11% pre-1980 to perhaps ~2-3% in the future (left chart). Note 2-3% is the mid-point of our exnominal GDP growth this decade, resulting in commercial bank credit relativthat shrinks. A combination of private credit in lieu of bank loans and redu
may restrain total bank credit, relegating banks to cyclical trades in the absen
Macro & Portfolio Strategy
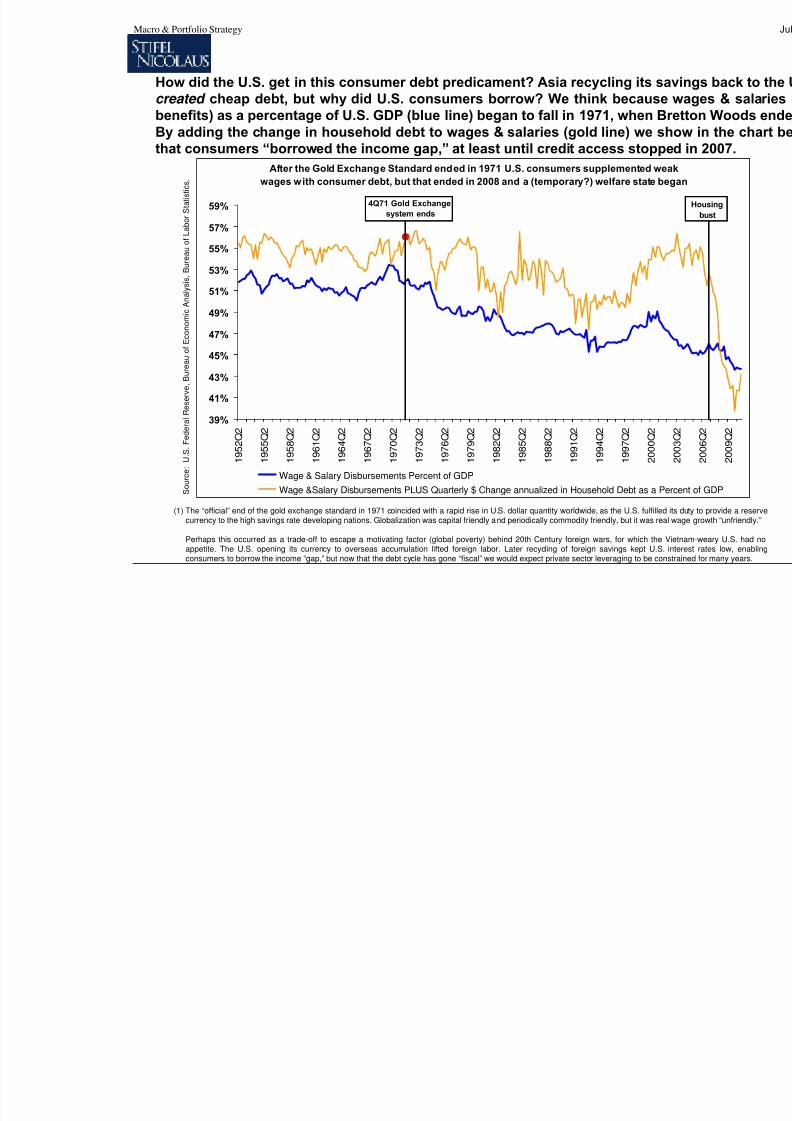
8/6/2019 Bannister - Stifel Nicolaus Mid-2011 Macro Outlook
http://slidepdf.com/reader/full/bannister-stifel-nicolaus-mid-2011-macro-outlook 51/59
How did the U.S. get in this consumer debt predicament? Asia recycling its screated cheap debt, but why did U.S. consumers borrow? We think becausebenefits) as a percentage of U.S. GDP (blue line) began to fall in 1971, when BBy adding the change in household debt to wages & salaries (gold line) we s
that consumers “borrowed the income gap,” at least until credit access stopp
S o u r c e :
U . S
. F e
d e r a
l R e s e r v e ,
B u r e a u o
f E c o n o m
i c A n a
l y s
i s ,
B u r e a u o
f L a
b o r
S t a t i s t i c s .
After the Gold Exchange Standard ended in 1971 U.S. consumers supplemented w
wages with consumer debt, but that ended in 2008 and a (temporary?) welfare state b
39%
41%
43%
45%
47%
49%
51%
53%
55%
57%
59%
1 9 5 2 Q 2
1 9 5 5 Q 2
1 9 5 8 Q 2
1 9 6 1 Q 2
1 9 6 4 Q 2
1 9 6 7 Q 2
1 9 7 0 Q 2
1 9 7 3 Q 2
1 9 7 6 Q 2
1 9 7 9 Q 2
1 9 8 2 Q 2
1 9 8 5 Q 2
1 9 8 8 Q 2
1 9 9 1 Q 2
1 9 9 4 Q 2
1 9 9 7 Q 2
2 0 0 0 Q 2
Wage & Salary Disbursements Percent of GDP
Wage &Salary Disbursements PLUS Quarterly $ Change annualized in Household Debt as a P
4Q71 Gold Exchange
system ends
(1) The “official” end of the gold exchange standard in 1971 coincided with a rapid rise in U.S. dollar quantity worldwide, as the U.S. fulfillecurrency to the high savings rate developing nations. Globalization was capital friendly and periodically commodity friendly, but it was re
Perhaps this occurred as a trade-off to escape a motivating factor (global poverty) behind 20th Century foreign wars, for which theappetite. The U.S. opening its currency to overseas accumulation lifted foreign labor. Later recycling of foreign savings kept U.Sconsumers to borrow the income “gap,” but now that the debt cycle has gone “fiscal” we would expect private sector leveraging to be co
Macro & Portfolio Strategy
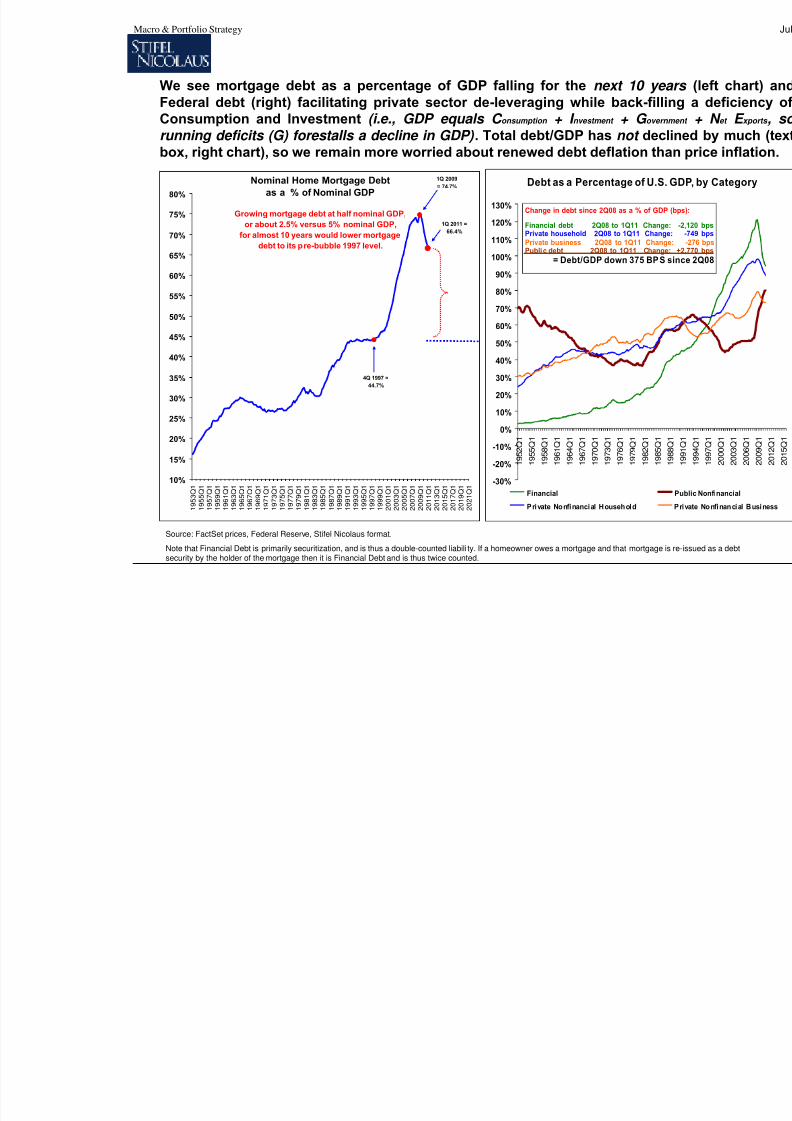
8/6/2019 Bannister - Stifel Nicolaus Mid-2011 Macro Outlook
http://slidepdf.com/reader/full/bannister-stifel-nicolaus-mid-2011-macro-outlook 52/59
Nominal Home Mortgage Debt
as a % of Nominal GDP
Growing mortgage debt at half nominal GDP,
or about 2.5% versus 5% nominal GDP,
for almost 10 years would lower mortgage
debt to its pre-bubble 1997 level.
10%
15%
20%
25%
30%
35%
40%
45%
50%
55%
60%
65%
70%
75%
80%
1 9 5 3 Q 1
1 9 5 5 Q 1
1 9 5 7 Q 1
1 9 5 9 Q 1
1 9 6 1 Q 1
1 9 6 3 Q 1
1 9 6 5 Q 1
1 9 6 7 Q 1
1 9 6 9 Q 1
1 9 7 1 Q 1
1 9 7 3 Q 1
1 9 7 5 Q 1
1 9 7 7 Q 1
1 9 7 9 Q 1
1 9 8 1 Q 1
1 9 8 3 Q 1
1 9 8 5 Q 1
1 9 8 7 Q 1
1 9 8 9 Q 1
1 9 9 1 Q 1
1 9 9 3 Q 1
1 9 9 5 Q 1
1 9 9 7 Q 1
1 9 9 9 Q 1
2 0 0 1 Q 1
2 0 0 3 Q 1
2 0 0 5 Q 1
2 0 0 7 Q 1
2 0 0 9 Q 1
2 0 1 1 Q 1
2 0 1 3 Q 1
2 0 1 5 Q 1
2 0 1 7 Q 1
2 0 1 9 Q 1
2 0 2 1 Q 1
4Q 1997 =
44.7%
1Q 2009
= 74.7%
1Q 2011 =
66.4%
Source: FactSet prices, Federal Reserve, Stifel Nicolaus format.
Note that Financial Debt is primarily securitization, and is thus a double-counted liabili ty. If a homeowner owes a mortgage and that mortgagesecurity by the holder of the mortgage then it is Financial Debt and is thus twice counted.
We see mortgage debt as a percentage of GDP falling for the next 10 yeFederal debt (right) facilitating private sector de-leveraging while back-fillConsumption and Investment (i.e., GDP equals C onsumption + I nvestment + G over
running deficits (G) forestalls a decline in GDP) . Total debt/GDP has not dec
box, right chart), so we remain more worried about renewed debt deflation th
-30%
-20%
-10%
0%
10%
20%
30%
40%
50%
60%
70%
80%
90%
100%
110%
120%
130%
1 9 5 2 Q 1
1 9 5 5 Q 1
1 9 5 8 Q 1
1 9 6 1 Q 1
1 9 6 4 Q 1
1 9 6 7 Q 1
1 9 7 0 Q 1
1 9 7 3 Q 1
1 9 7 6 Q 1
1 9 7 9 Q 1
1 9 8 2 Q 1
1 9 8 5 Q 1
Debt as a Percentage of U.S
Financial
Private Nonfinancial Household
Change in debt since 2Q08 as a % of GD
Financial debt 2Q08 to 1Q11 ChanPrivate household 2Q08 to 1Q11 ChanPrivate business 2Q08 to 1Q11 ChanPublic debt 2Q08 to 1Q11 Chang
= Debt/GDP down 375 BPS
Macro & Portfolio Strategy
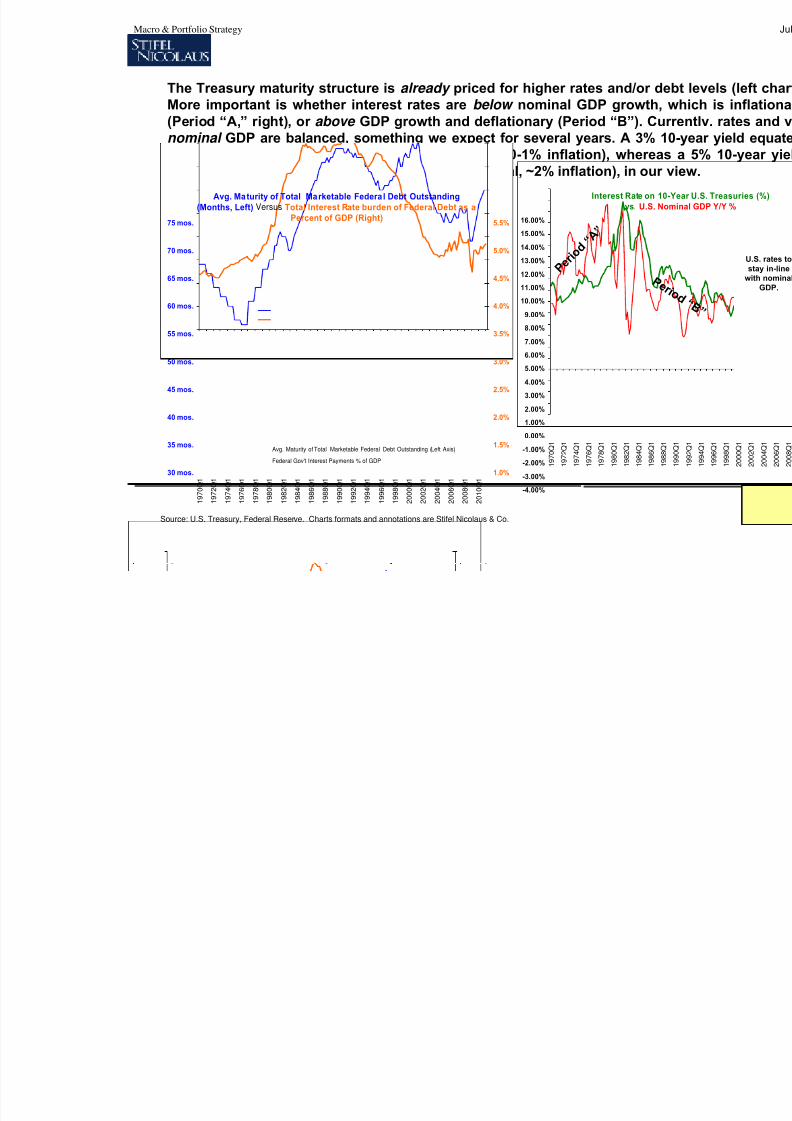
8/6/2019 Bannister - Stifel Nicolaus Mid-2011 Macro Outlook
http://slidepdf.com/reader/full/bannister-stifel-nicolaus-mid-2011-macro-outlook 53/59
Interest Rate on 1vs. U.S. N
-4.00%
-3.00%
-2.00%
-1.00%
0.00%
1.00%
2.00%
3.00%
4.00%
5.00%
6.00%
7.00%
8.00%
9.00%10.00%
11.00%
12.00%
13.00%
14.00%
15.00%
16.00%
1 9 7 0
Q 1
1 9 7 2
Q 1
1 9 7 4
Q 1
1 9 7 6
Q 1
1 9 7 8
Q 1
1 9 8 0
Q 1
1 9 8 2
Q 1
1 9 8 4
Q 1
1 9 8 6
Q 1
1 9 8 8
Q 1
Source: U.S. Treasury, Federal Reserve. Charts formats and annotations are Stifel Nicolaus & Co.
The Treasury maturity structure is already priced for higher rates and/or dMore important is whether interest rates are below nominal GDP growth,(Period “A,” right), or above GDP growth and deflationary (Period “B”). Cunominal GDP are balanced, something we expect for several years. A 3%
to 3% 10-year nominal GDP growth (~2-3% real, ~0-1% inflation), whereaequates to 5% 10-year nominal GDP growth (~3% real, ~2% inflation), in our
P e r i o
d “ A
”
P e
Avg. Maturity of Total Marketable Federal Debt Outstanding(Months, Left) Versus Total Interest Rate burden of Federal Debt as a
Percent of GDP (Right)
30 mos.
35 mos.
40 mos.
45 mos.
50 mos.
55 mos.
60 mos.
65 mos.
70 mos.
75 mos.
1 9 7 0 Q 1
1 9 7 2 Q 1
1 9 7 4 Q 1
1 9 7 6 Q 1
1 9 7 8 Q 1
1 9 8 0 Q 1
1 9 8 2 Q 1
1 9 8 4 Q 1
1 9 8 6 Q 1
1 9 8 8 Q 1
1 9 9 0 Q 1
1 9 9 2 Q 1
1 9 9 4 Q 1
1 9 9 6 Q 1
1 9 9 8 Q 1
2 0 0 0 Q 1
2 0 0 2 Q 1
2 0 0 4 Q 1
2 0 0 6 Q 1
2 0 0 8 Q 1
2 0 1 0 Q 1
1.0%
1.5%
2.0%
2.5%
3.0%
3.5%
4.0%
4.5%
5.0%
5.5%
Avg. Maturity of Total Marketable Federal Debt Outstanding (Left Axis)
Federal Gov't Interest Payments % of GDP
Macro & Portfolio Strategy
8/6/2019 Bannister - Stifel Nicolaus Mid-2011 Macro Outlook
http://slidepdf.com/reader/full/bannister-stifel-nicolaus-mid-2011-macro-outlook 54/59
U.S. fiscal deficits are desirable, inflation average about 3% to 2015, and debt deflat
far greater risk
Macro & Portfolio Strategy
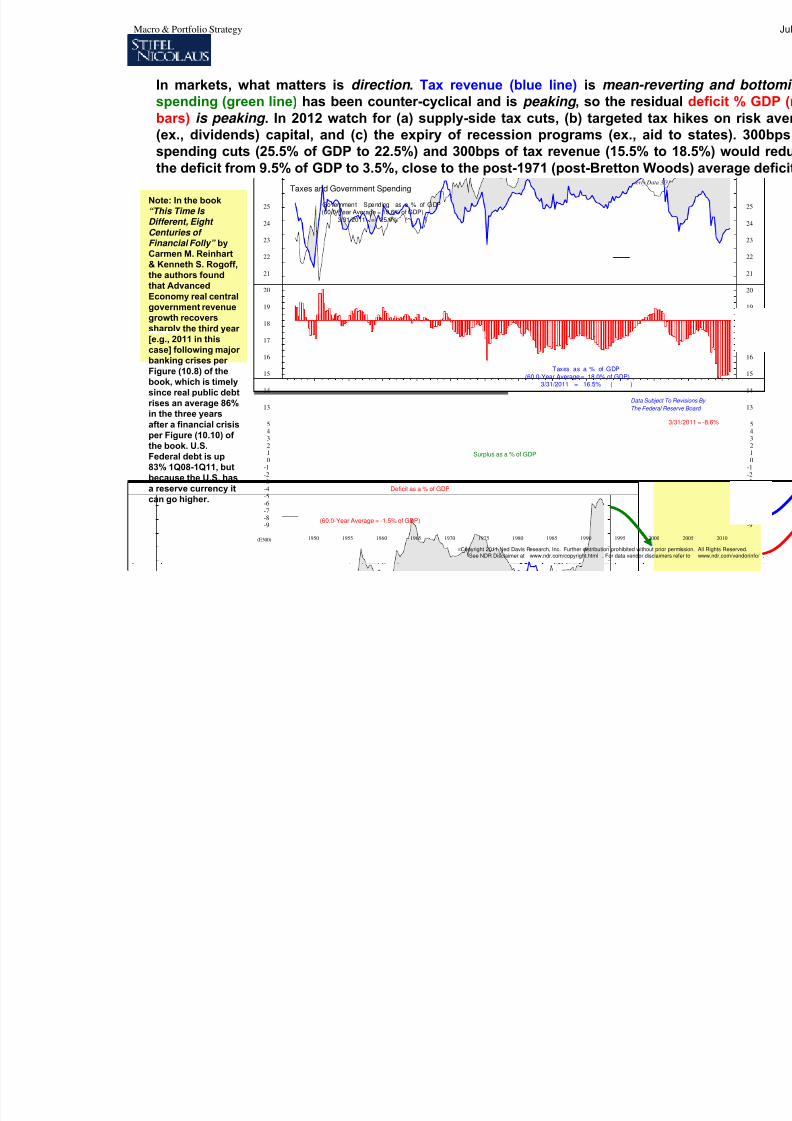
8/6/2019 Bannister - Stifel Nicolaus Mid-2011 Macro Outlook
http://slidepdf.com/reader/full/bannister-stifel-nicolaus-mid-2011-macro-outlook 55/59
In markets, what matters is direction . Tax revenue (blue line) is mean-revspending (green line) has been counter-cyclical and is peaking , so the residbars) is peaking . In 2012 watch for (a) supply-side tax cuts, (b) targeted tax(ex., dividends) capital, and (c) the expiry of recession programs (ex., aid
spending cuts (25.5% of GDP to 22.5%) and 300bps of tax revenue (15.5% tothe deficit from 9.5% of GDP to 3.5%, close to the post-1971 (post-Bretton Wo
Note: In the book“This Time Is Different, Eight Centuries of Financial Folly” byCarmen M. Reinhart& Kenneth S. Rogoff,the authors foundthat AdvancedEconomy real centralgovernment revenuegrowth recoverssharply the third year [e.g., 2011 in thiscase] following major banking crises per Figure (10.8) of thebook, which is timelysince real public debtrises an average 86%in the three yearsafter a financial crisisper Figure (10.10) of the book. U.S.
Federal debt is up83% 1Q08-1Q11, butbecause the U.S. hasa reserve currency itcan go higher.
Quarterly Data 3
(E300)
Government Spending as a % of GDP(60.0-Year Average = 19.6% of GDP)
3/31/2011 = 25.0% ( )
Taxes as a % of GDP(60.0-Year Average = 18.0% of GDP)
3/31/2011 = 16.5% ( )
Data Subjec
The Federal13
14
15
16
17
18
19
20
21
22
23
24
25
Surplus as a % of GDP
Deficit as a % of GDP
(60.0-Year Average = -1.5% of GDP)-9-8
-7
-6-5
-4-3
-2
-101
2
34
5
1950 1955 1960 1965 1970 1975 1980 1985 1990 1995 2000
Taxes and Government Spending
Copyright 2011 Ned Davis Research, Inc. Further distribution prohibited without prior. For data vendor disclaimwww.ndr.com/copyright.htmlSee NDR Disclaimer at
©
Macro & Portfolio Strategy
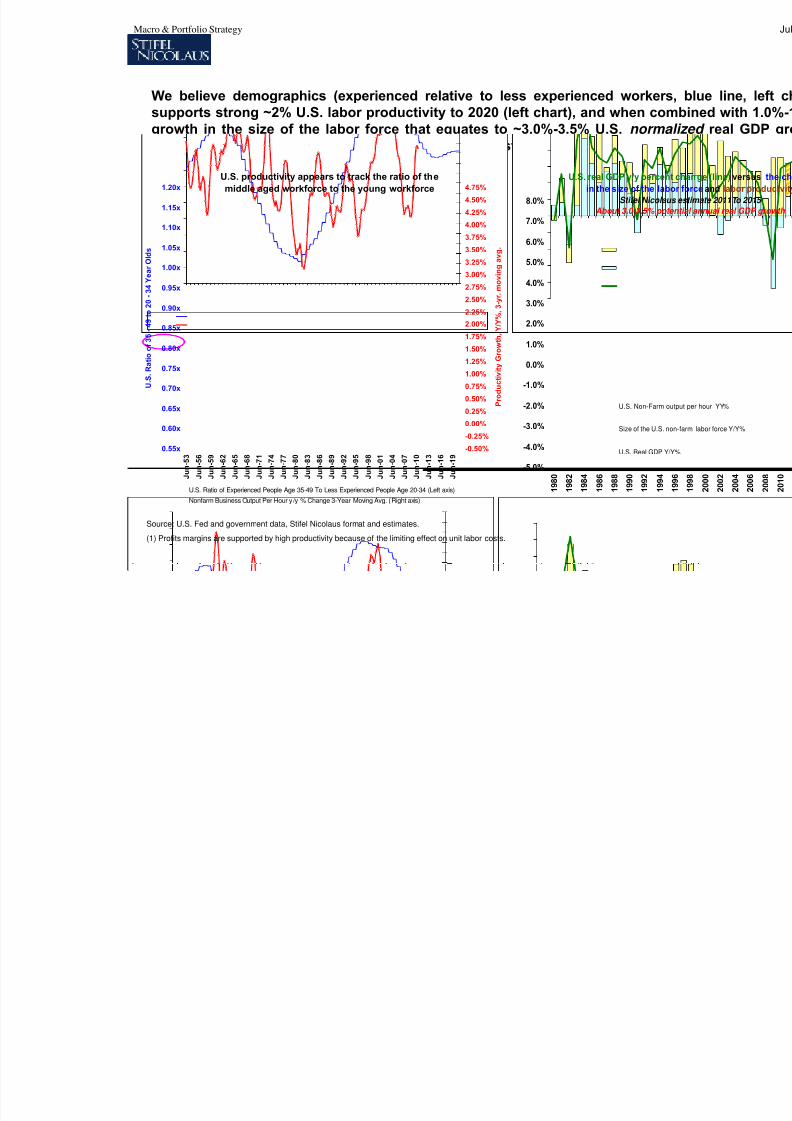
8/6/2019 Bannister - Stifel Nicolaus Mid-2011 Macro Outlook
http://slidepdf.com/reader/full/bannister-stifel-nicolaus-mid-2011-macro-outlook 56/59
Source: U.S. Fed and government data, Stifel Nicolaus format and estimates.
(1) Profits margins are supported by high productivity because of the limiting effect on unit labor costs.
We believe demographics (experienced relative to less experienced workesupports strong ~2% U.S. labor productivity to 2020 (left chart), and when cogrowth in the size of the labor force that equates to ~3.0%-3.5% U.S. norm
(right chart), in our view. Though 2% productivity constrains job growth, it sup
U.S. real GDP y/y perce
in the size of the laStifel Nicol
About 3.0-3.5% p
-5.0%
-4.0%
-3.0%
-2.0%
-1.0%
0.0%
1.0%
2.0%
3.0%
4.0%
5.0%
6.0%
7.0%
8.0%
1 9 8 0
1 9 8 2
1 9 8 4
1 9 8 6
1 9 8 8
1 9 9 0
1 9 9 2
1 9 9 4
U.S. Non-Farm
Size of the U.S
U.S. Real GDP
0.55x
0.60x
0.65x
0.70x
0.75x
0.80x
0.85x
0.90x
0.95x
1.00x
1.05x
1.10x
1.15x
1.20x
J u n - 5 3
J u n - 5 6
J u n - 5 9
J u n - 6 2
J u n - 6 5
J u n - 6 8
J u n - 7 1
J u n - 7 4
J u n - 7 7
J u n - 8 0
J u n - 8 3
J u n - 8 6
J u n - 8 9
J u n - 9 2
J u n - 9 5
J u n - 9 8
J u n - 0 1
J u n - 0 4
J u n - 0 7
J u n - 1 0
J u n - 1 3
J u n - 1 6
J u n - 1 9
U . S . R a t i o o f 3 5 - 4 9 t o 2 0
- 3 4 Y e a r O l d s
-0.50%
-0.25%
0.00%
0.25%
0.50%
0.75%
1.00%
1.25%
1.50%
1.75%
2.00%
2.25%2.50%
2.75%
3.00%
3.25%
3.50%
3.75%
4.00%
4.25%
4.50%
4.75%
P r o d u c t i v i t y G r o w t h , Y / Y % , 3 - y r . m o v i n g a v g .
U.S. Ratio of Experienced People Age 35-49 To Less Experienced People Age 20-34 (Left axis)
Nonfarm Business Output Per Hour y /y % Change 3-Year Moving Avg. (Right axis)
U.S. productivity appears to track the ratio of the
middle aged workforce to the young workforce
Macro & Portfolio Strategy
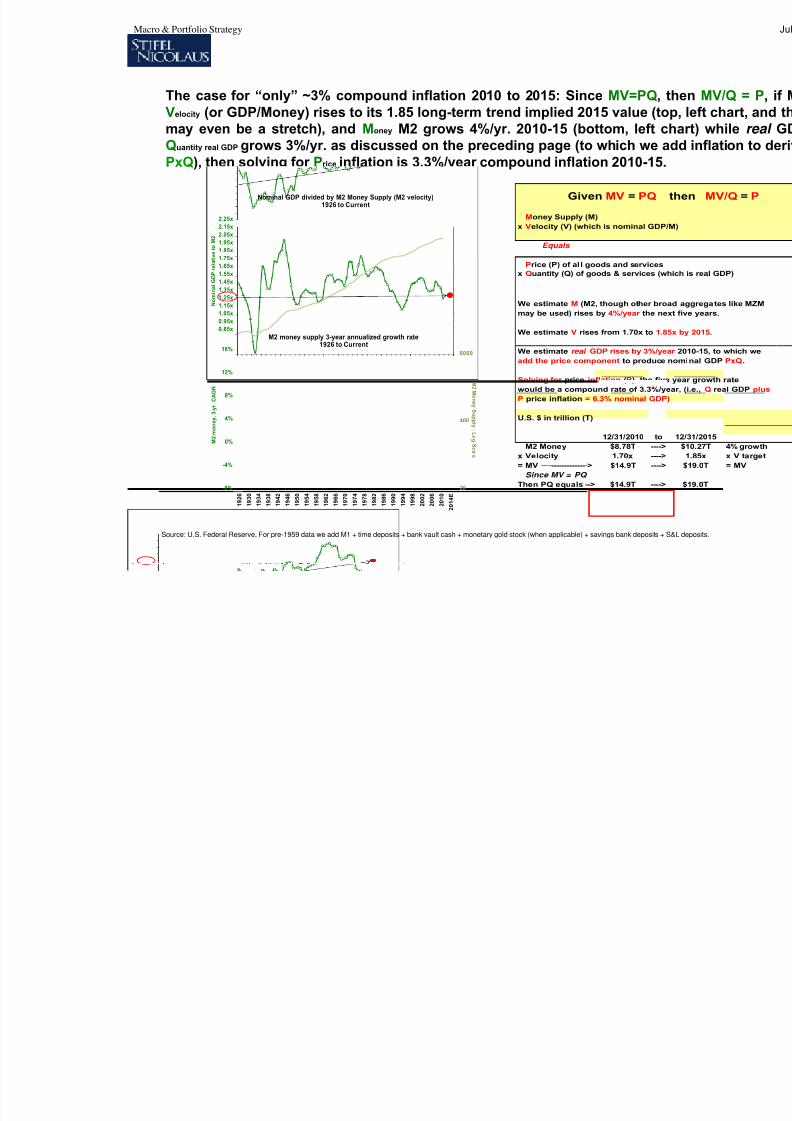
8/6/2019 Bannister - Stifel Nicolaus Mid-2011 Macro Outlook
http://slidepdf.com/reader/full/bannister-stifel-nicolaus-mid-2011-macro-outlook 57/59
Money Supply (M)
x Velocity (V) (which is nominal GDP
Equals
Price (P) of al l goods and services
x Quantity (Q) of goods & services (w
We estimate M (M2, though other brmay be used) rises by 4%/year the n
We estimate V rises from 1.70x to 1.
We estimate real GDP rises by 3%/y
add the price component to produce
Solving for price inflation (P), the fiv
would be a compound rate of 3.3%/
P price inflation = 6.3% nominal GD
U.S. $ in trillion (T)
12/31/2010 to
M2 Money $8.78T ---->
x Velocity 1.70x ---->= MV ------------------> $14.9T ---->
Since MV = PQ
Then PQ equals --> $14.9T ---->
Given MV = PQ
Source: U.S. Federal Reserve, For pre-1959 data we add M1 + time deposits + bank vault cash + monetary gold stock (when applicable) + savings bank deposits +
The case for “only” ~3% compound inflation 2010 to 2015: Since MV=PQ, Velocity (or GDP/Money) rises to its 1.85 long-term trend implied 2015 value (tmay even be a stretch), and Money M2 grows 4%/yr. 2010-15 (bottom, left c
Quantity real GDP grows 3%/yr. as discussed on the preceding page (to which we PxQ), then solving for Price inflation is 3.3%/year compound inflation 2010-15
0.85x
0.95x
1.05x
1.15x
1.25x
1.35x
1.45x
1.55x
1.65x
1.75x
1.85x
1.95x
2.05x
2.15x
2.25x
N o m i n a l G D P r e l a t i v e t o M 2
Nominal GDP divided by M2 Money Supply (M2 velocity)1926 to Current
20
400
8000
-8%
-4%
0%
4%
8%
12%
16%
1 9 2 6
1 9 3 0
1 9 3 4
1 9 3 8
1 9 4 2
1 9 4 6
1 9 5 0
1 9 5 4
1 9 5 8
1 9 6 2
1 9 6 6
1 9 7 0
1 9 7 4
1 9 7 8
1 9 8 2
1 9 8 6
1 9 9 0
1 9 9 4
1 9 9 8
2 0 0 2
2 0 0 6
2 0 1 0
2 0 1 4 E
M 2 m o n e y , 3 - y r . C A G R
M2 money supply 3-year annualized growth rate1926 to Current
M2 M on e y S u p pl y-L o g S c al e
Macro & Portfolio Strategy
8/6/2019 Bannister - Stifel Nicolaus Mid-2011 Macro Outlook
http://slidepdf.com/reader/full/bannister-stifel-nicolaus-mid-2011-macro-outlook 58/59
Important Disclosures and Certifications
I, Barry B. Bannister, certify that the views expressed in this research report accurately reflect my personalviews about the subject securities or issuers; and I, Barry B. Bannister, certify that no part of mycompensation was, is, or will be directly or indirectly related to the specific recommendation or viewscontained in this research report. For our European Conflicts Management Policy go to the research page atwww.stifel.com.
Stifel, Nicolaus & Company, Inc.'s research analysts receive compensation that is based upon (among other factors)Stifel Nicolaus' overall investment banking revenues.
Our investment rating system is three tiered, defined as follows:
BUY -For U.S. securities we expect the stock to outperform the S&P 500 by more than 10% over the next 12 months.For Canadian securities we expect the stock to outperform the S&P/TSX Composite Index by more than 10% over thenext 12 months. For other non-U.S. securities we expect the stock to outperform the MSCI World Index by more than10% over the next 12 months. For yield-sensitive securities, we expect a total return in excess of 12% over the next 12months for U.S. securities as compared to the S&P 500, for Canadian securities as compared to the S&P/TSXComposite Index, and for other non-U.S. securities as compared to the MSCI World Index.
HOLD -For U.S. securities we expect the stock to perform within 10% (plus or minus) of the S&P 500 over the next 12months. For Canadian securities we expect the stock to perform within 10% (plus or minus) of the S&P/TSX CompositeIndex. For other non-U.S. securities we expect the stock to perform within 10% (plus or minus) of the MSCI World
Index. A Hold rating is also used for yield-sensitive securities where we are comfortable with the safety of the dividend,but believe that upside in the share price is limited.
SELL -For U.S. securities we expect the stock to underperform the S&P 500 by more than 10% over the next 12months and believe the stock could decline in value. For Canadian securities we expect the stock to underperform theS&P/TSX Composite Index by more than 10% over the next 12 months and believe the stock could decline in value.For other non-U.S. securities we expect the stock to underperform the MSCI World Index by more than 10% over thenext 12 months and believe the stock could decline in value.
Of the securities we rate, 50% are rated Buy, 48% are rated Hold, and 2% are rated Sell.
Within the last 12 months, Stifel, Nicolaus & Company, Inc. or an affiliate has provided investment banking services for 34%, 20% and 0% of the companies whose shares are rated Buy, Hold and Sell, respectively.
Additional Disclosures
Please visit the Research Page at www.stifel.com f or the current research disclosures applicable to the companiesmentioned in this publication that are within Stifel Nicolaus' coverage universe. For a discussion of risks to target priceplease see our stand-alone company reports and notes for all Buy-rated stocks.
The information contained herein has been prepared from sources believed to be reliable but is not guaranteed by usand is not a complete summary or statement of all available data, nor is it considered an offer to buy or sell anysecurities referred to herein. Opinions expressed are subject to change without notice and do not take into account theparticular investment objectives, financial situation or needs of individual investors. Employees of Stifel, Nicolaus &Company, Inc. or its affiliates may, at times, release written or oral commentary, technical analysis or trading strategiesthat differ from the opinions expressed within. Past performance should not and cannot be viewed as an indicator of future performance.
Stifel, Nicolaus & Company, Inc. is a multi-disciplined financial services firm that regularly seeks investment bankingassignments and compensation from issuers for services including, but not limited to, acting as an underwriter in anoffering or financial advisor in a merger or acquisition, or serving as a placement agent in private transactions.Moreover, Stifel Nicolaus and its affiliates and their respective shareholders, directors, officers and/or employees, mayfrom time to time have long or short positions in such securities or in options or other derivative instruments basedthereon.
These materials have been approved by Stifel Nicolaus Limited and/or Thomas Weisel Partners International Ltd.,authorized and regulated by the Financial Services Authority (UK), in connection with its distribution to professionalclients and eligible counterparties in the European Economic Area. (Stifel Nicolaus Limited home office: London +44 207557 6030.) No investments or services mentioned are available in the European Economic Area to retail clients or toanyone in Canada other than a Designated Institution. This investment research report is classified as objective for the
Page 58
Macro & Portfolio Strategy July 11, 2011
8/6/2019 Bannister - Stifel Nicolaus Mid-2011 Macro Outlook
http://slidepdf.com/reader/full/bannister-stifel-nicolaus-mid-2011-macro-outlook 59/59
purposes of the FSA rules. Please contact a Stifel Nicolaus entity in your jurisdiction if you require additionalinformation.
The use of information or data in this research report provided by or derived from Standard & Poor’s FinancialServices, LLC is © 2011, Standard & Poor’s Financial Services, LLC (“S&P”). Reproduction of Compustat data and/or information in any form is prohibited except with the prior written permission of S&P. Because of the possibility of human or mechanical error by S&P’s sources, S&P or others, S&P does not guarantee the accuracy, adequacy,completeness or availability of any information and is not responsible for any errors or omissions or for the resultsobtained from the use of such information. S&P GIVES NO EXPRESS OR IMPLIED WARRANTIES, INCLUDING, BUTNOT LIMITED TO, ANY WARRANTIES OF MERCHANTABILITY OR FITNESS FOR A PARTICULAR PURPOSE ORUSE. In no event shall S&P be liable for any indirect, special or consequential damages in connection with subscriber’sor others’ use of Compustat data and/or information. For recipient’s internal use only.
Additional Information Is Available Upon Request
© 2011 Stifel, Nicolaus & Company, Inc. One South Street Baltimore, MD 21202. All rights reserved.
Macro & Portfolio Strategy July 11, 2011