banks and aggregate credit: what is new? · banks and aggregate credit: what is new? ... europe and...
TRANSCRIPT

BIS Papers No 28 11
Banks and aggregate credit: what is new?
M S Mohanty, Gert Schnabel and Pablo Garcia-Luna1
Introduction
A major revival of bank lending in emerging market economies is under way. Following years of weak or declining lending growth, bank credit to the private sector, in real terms, was rising at a rate between 10 and 40% in a number of countries by 2005. Such a recovery, reflecting in many countries a strong expansion of credit to households, has arrested the decline in the share of private sector bank credit in GDP, especially in Asia and Latin America, where it had remained a special feature for some years (Graph 1). Indeed, several factors have been favourable to bank lending in emerging economies over the past few years: strong growth, excess liquidity in banking systems reflecting easier global and domestic monetary conditions, and substantial bank restructuring.2 Such developments raise several questions: what has been the role of banks in the overall financial system in the economy? Have the factors driving bank lending growth changed recently and how sustainable might they prove in the future?
Graph 1
Bank credit to the private sector1 As a percentage of GDP
Asia2
30
40
50
60
70
80
90
1985 1990 1995 2000 2005
Latin America3,4
15.0
17.5
20.0
22.5
25.0
27.5
30.0
1985 1990 1995 2000 2005 1 Simple average of country data. 2 Hong Kong (SAR), India, Indonesia, Korea, Malaysia, Philippines, Singapore and Thailand. 3 Argentina, Brazil, Chile, Colombia, Mexico, Peru and Venezuela. 4 Moving average of current and previous year private credit levels to current year GDP. Sources: IMF; BIS calculations.
The objective of this paper is to address some of these issues in the context of developments over the past five years. The rest of the paper is organised as follows. Section 1 discusses recent trends of bank lending with a focus on the role of commercial banks in financial intermediation. While Section 2
1 The paper draws on information provided by the central banks of emerging market economies in response to a survey
questionnaire and has benefited from their comments. We are thankful to David Archer, Dubravko Mihaljek, Ramon Moreno, Richhild Moessner, Endang Saputra, Philip Turner, Agustin Villar, William White and Seong-Hun Yun for useful comments and to Monica Mauron, Clare Batts, Choon Choon Blanchard and Lisa Ireland for excellent secretarial assistance. Errors that remain are solely ours.
2 See Mihaljek in this volume.

12 BIS Papers No 28
reviews the role of possible factors in explaining recent credit growth, Section 3 provides some empirical evidence on their relative importance. The last section examines the sustainability of the current developments.
1. Recent trends
The role of commercial banks
As Table 1 shows, commercial banks remain the most important source of credit supply in emerging market economies (see Annex Table A1 for further country details). The dominant role of commercial banks has changed very little over the past decade. However, this is truer for Asia than for central Europe and Latin America. There, non-bank financial intermediaries (particularly development financial institutions) not only account for a substantial part of the outstanding credit by all financial institutions but also their relative importance has been rising over the past decade. In contrast, in the United States, financial intermediaries other than commercial banks play a more important role.
Table 1
Real aggregate credit1
Share in aggregate credit
Average growth rate
Commercial banks Other banks and
non-bank financial institutions
1995-99
2000-04 1994 1999 2004 1994 1999 2004
Latin America2 3.6 4.5 78 69 68 22 31 32
China 17.1 13.3 100 100 100 0 0 0
India 6.1 14.6 97 3
Hong Kong SAR, Singapore 1.4 3.4 97 3
Other Asia3 –0.3 4.7 62 70 74 38 30 26
Central Europe4 9.6 8.1 96 83 4 17
Total5 7.8 9.6 86 88 88 11 12 12
Memo: United States 10.1 3.3 23 17 18 77 83 82 1 Referring to domestic credit by commercial banks, other banks (excl central banks) and non-financial institutions (questionnaire). In cases where data are not available from the questionnaire, they have been taken from the IMF, IFS; deflated using annual percentage changes of the consumer price index; regional averages calculated using 2000 GDP PPP weights. 2 Argentina, Brazil, Chile, Mexico, Peru and Venezuela. 3 Indonesia, Korea, Malaysia, the Philippines and Thailand (columns 3 to 8 except Indonesia). 4 Czech Republic, Hungary and Poland. 5 Countries shown plus Israel, Russia, Saudi Arabia, South Africa and Turkey (columns 3 to 8 except Indonesia, Israel and Russia). Sources: IMF; national data.
Reasons for shifts in the market shares of banks and non-banks vary. For example, in India an important reason for the rising share of banks in total credit has been the recent conversion of several non-banking financial institutions into banks. In Korea, such a trend has been driven by a return of public confidence in the banking system following substantial restructuring in the aftermath of the 1997-98 financial crisis. In Indonesia, bank intermediation has started to recover from the crisis, and its role could potentially rise in the future. In Chile, the rise in banks’ market share is due to increased mergers and acquisitions leading to greater financial innovation in the banking industry. In contrast, in Thailand, non-bank financial institutions, particularly specialising in credit card lending, have recently gained market share. This also is the trend in Mexico, where specialised mortgage institutions

BIS Papers No 28 13
dominate low-income mortgage lending. In central Europe (the Czech Republic and Poland) leasing and factoring business, in particular, is rising.
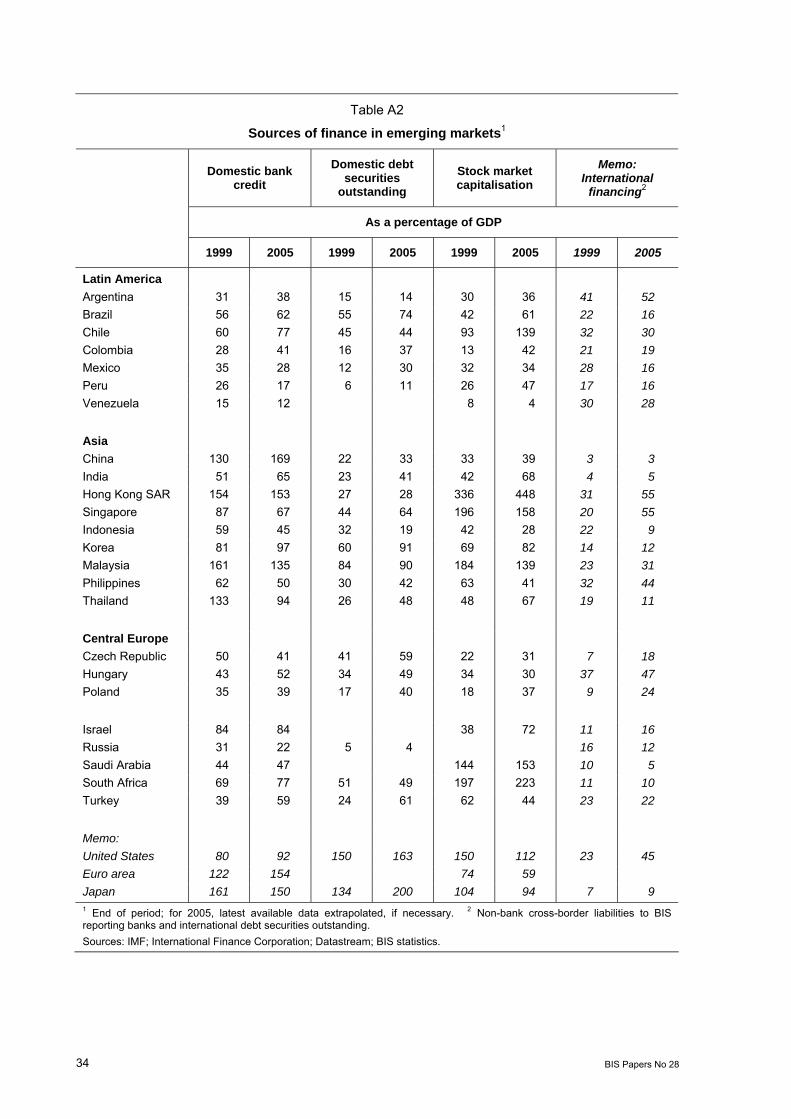
At the same time, the use of capital market finance has increased (Table 2). There is some evidence to suggest that the role of bond financing in emerging markets has been rising over the past five years. Issuance of government bonds - particularly in local currency - has been strong in many countries over the past five years or so. The corporate sector in emerging markets is also issuing large amounts of bonds - in both domestic and international markets - reflecting perhaps its attempts to diversify financing sources (see Section 2). But the scale of bond and equity financing remains relatively small compared with that in mature markets. The average stock market capitalisation in emerging markets was about 60% of GDP in 2005 compared with over 100% and 90%, respectively, in the United States and Japan. Nevertheless, there are notable exceptions such as Singapore, Hong Kong, Chile, Malaysia, Saudi Arabia and South Africa where the importance of capital market financing is much greater than in other emerging markets (Annex Table A2).
Table 2
Sources of finance in emerging markets1
Domestic credit Domestic debt
securities outstanding2
Stock market capitalisation
Memo: International
financing3
As a percentage of GDP
1999 2005 1999 2005 1999 2005 1999 2005
Latin America4,5 42 45 31 46 36 49 27 22
China 130 169 22 33 33 39 3 3
India 51 65 23 41 42 68 4 5
Hong Kong SAR, Singapore4 130 122 33 41 286 344 27 55
Other Asia4,6 89 80 45 58 68 65 20 17
Central Europe4,7 40 42 26 46 22 34 14 27
Total4,8 78 92 27 40 52 62 13 12
Memo: United States 80 92 150 163 150 112 23 45 Euro area 122 154 74 59 Japan 161 150 134 200 104 94 7 9 1 End of period; for 2005, latest available data extrapolated, if necessary. 2 Excepting Israel, Saudi Arabia and Venezuela. 3 Non-bank cross-border liabilities to BIS reporting banks and international debt securities outstanding. 4 Weighted average of the economies listed based on 2000 GDP and PPP exchange rates. 5 Argentina, Brazil, Chile, Colombia, Mexico, Peru and Venezuela. 6 Indonesia, Korea, Malaysia, the Philippines and Thailand. 7 The Czech Republic, Hungary and Poland. 8 Countries shown plus Israel, Russia (except for stock market capitalisation), Saudi Arabia, South Africa and Turkey. Sources: IMF; International Finance Corporation; Datastream; BIS statistics.
Table 3 focuses on the trends in real bank credit to the private sector, which is the most critical component of domestic credit from the viewpoint of both growth and financial stability. Many countries witnessed sharp increases in bank lending to the private sector during the first half of the 1990s followed by a major slowdown or collapse in the second half.3 Nevertheless, a major revival has set in
3 Some of the major turning points in the emerging market credit cycle during the past one and half decades have been
associated with the Mexican crisis in 1994, the end of high and hyperinflation in Latin America in the 1990s, the 1997-98 Asian financial crises, the collapse of capital inflows during the early and late 1990s, and the global economic slowdown in 2001.

14 BIS Papers No 28
over the past two years. During 2005, for instance, bank credit to the private sector, in nominal terms, rose rapidly in several countries in Latin America. Such credit expansion in the face of low or moderate inflation has meant equally sharp increases in real bank credit (Annex Table A3). A similar trend has also been visible in central Europe, Russia, Saudi Arabia and Turkey.
Table 3
Real bank credit to the private sector1
1990-94 1995-99 2000 2001 2002 2003 2004 2000-04 20052
Latin America3 21.8 –0.2 –1.2 –4.9 –1.4 –2.9 7.7 –1.1 18.4
India 3.9 6.9 15.9 3.9 17.8 5.7 25.8 13.5 30.0
Hong Kong SAR, Singapore 6.9 0.6 –1.5 5.2 –1.1 3.9 5.5 2.2 –3.2
Other Asia4 11.6 4.0 5.0 1.4 10.4 6.8 7.4 5.9 8.2
Central Europe5 8.8 5.7 –1.8 6 1.6 9.9 5.0 3.8 6 8.0
Total7 11.3 6.9 8.7 4.2 10.2 10.1 13.2 8.9 15.8
Memo: G3 1.1 4.7 6.4 3.1 1.0 3.8 4.2 3.7 8.1 China8 10.6 16.0 9.8 9.7 17.7 17.0 8.6 12.5 9.4 1 Annual changes, in per cent; referring to commercial banks (questionnaire) or, if not available, IMF, deposit money banks. Regional averages using 2000 GDP PPP weights. 2 Latest available data extrapolated until end-2005, if necessary. 3 Argentina, Brazil, Chile, Mexico, Peru and Venezuela. 4 Indonesia, Korea, Malaysia, the Philippines and Thailand; first column: except Malaysia. 5 The Czech Republic, Hungary and Poland. 6 Affected by bank restructuring in the Czech Republic (the Czech Consolidation Bank was removed from the banking system). 7 Countries plus Israel, Russia, Saudi Arabia, South Africa and Turkey; first column: except the Czech Republic, Malaysia, Poland, Russia, Saudi Arabia and Taiwan, China. 8 Credit to the non-government sector. Sources: IMF; national data.
In Asia the picture has been somewhat mixed. In China, data on private sector credit are not available. However, bank credit to the domestic non-financial sector, excluding the central government decelerated during 2004 and 2005, particularly in the wake of 2003 monetary tightening measures. India and Korea saw sharp acceleration of credit growth in 2005. In contrast, domestic credit growth remained depressed or fell further in the past two years in Hong Kong, the Philippines, Singapore and Thailand.
Composition of bank credit
The recent surge in bank lending has been associated with important changes on the assets side of banks’ balance sheets. First, credit to the business sector - historically the most important component of banks’ assets - has been weak or contracted, with its share in domestic assets falling over the past five years in the countries covered by Table 4. In contrast, the share of the household sector has increased sharply in several countries during this period. While banks have been expanding their retail business through increased mortgage and credit card lending, households have been more willing to finance their consumption and residential investment through bank credit.
Central Europe has witnessed sharp household credit expansion in the past five years. Russia, South Africa and Saudi Arabia have recently witnessed a similar trend, although it is important to bear in mind that household credit in these countries is rising from a low base. This also remains true for China, India and Indonesia. The share of household credit has been rising rapidly in Korea, Malaysia and Thailand during the past five years, particularly following the 1997-98 Asian financial crises. In Latin America, residential mortgage lending remains strong in Chile and Colombia while Mexico has seen a sharp increase in the share of consumer credit in total domestic credit.

BIS Papers No 28 15
Table 4
Composition of bank credit1
Housing credit Consumer credit Business credit
1994 1999 2004 1994 1999 2004 1994 1999 2004
Latin America Argentina 18 7 15 7 38 17 Chile 13 17 21 8 9 12 79 74 67 Colombia 7 11 15 14 56 39 Mexico 17 16 9 7 4 13 62 36 28 Venezuela 4 1 18 7 44 55 47
Asia India 10 12 7 7 Hong Kong SAR 7 15 15 2 3 3 86 76 73 Singapore 14 20 26 13 12 15 60 51 39 Indonesia 5 6 7 18 60 37 Korea 9 33 18 17 69 47 Malaysia 10 18 28 8 16 64 45 Thailand 9 7 10 4 3 6 64 71 68
Central Europe Czech Republic2 10 16 4 5 41 37 Hungary 3 17 6 8 62 46 Poland 2 10 21 23 44 35
Israel 0 0 8 15 10 9 Turkey 0 0 2 2 3 6 76 58 39 1 Of commercial banks. As a percentage of total domestic credit of commercial banks. 2 The data in the middle columns refer to 2002. Source: National data (questionnaire).
A second development has been the sharp rise in banks’ investment in government securities. As a result, commercial banks have come to hold a very large part of their domestic assets in the form of government securities - a process that seems to have begun in the mid-1990s (Graph 2).4
There is both a demand and supply side explanation to this phenomenon. One demand side factor is that weak corporate demand for credit has led banks to seek alternative investment opportunities, particularly as they were awash with liquidity in an easy monetary environment (see Section 3). Another common factor has been the increased risk aversion and the associated tendency among banks to hold liquid assets. In Korea and Thailand, for instance, banks raised their holding of government securities particularly in the aftermath of the 1997-98 financial crises. In India, investment by banks in government securities increased rapidly even as the mandatory investment requirement on banks was substantially reduced in the 1990s. In Latin America, increased demand for dollar-indexed government securities as a hedge against exchange rate risk may have played a role. In Chile, for instance, among the important factors driving demand for such securities are the recent “nominalisation” of interest rates - whereby the central bank shifted from an indexed interest rate operating system to a nominal one - and higher exchange rate volatility. A similar trend has also been
4 A similar trend has been witnessed in countries where central bank securities rather than government bonds constitute the
main source of supply of treasury securities. An important difference, however, is that such investments have been reflected in a rise in commercial banks’ claims on the central bank and not a rise in the overall credit supply in the economy.

16 BIS Papers No 28
seen in Venezuela, where the government issued dollar-denominated bonds for local currency, providing banks with an opportunity to hedge their currency risk exposures.
Graph 2
Government securities held by commercial banks As a percentage of total domestic credit1
0
10
20
30
40
50
60
70
80
HK IN2 ID3 KR4 MY SG TH CO MX VE4 CZ5 HU5 PL3 IL4 SA TR
End-1994Mid-2005
1 Of commercial banks. 2 The first column refers to end-1997. 3 The first column refers to end-1996. 4 The second column refers to end-2004. 5 The first column refers to end-1999. Source: National data (questionnaire).
From the supply side, securities issuance was increased through various channels: large government borrowing in countries where fiscal deficits remain high (for instance Colombia, Hungary, India, Malaysia, the Philippines, Poland and Turkey); an increased trend towards local currency financing of fiscal deficits as a strategy to reduce governments’ exposure to foreign currency risks (particularly in Latin America5); and issuance of more government debt either to develop the domestic bond market (for instance Singapore) or facilitate central banks’ sterilised intervention (for instance India). Yet another factor (for instance Indonesia and Turkey) has been the recent effort to recapitalise banks or restructure their bad debts by issuing government securities. This has transferred a large part of banks’ non-performing claims on the private sector to the government sector.
It is unclear whether the rapid accumulation of government securities by banks has “crowded out” some private firms needing finance from the credit market. As noted above, the corporate demand for credit remains weak, banks appear to be willingly investing in government securities (as opposed to mandatory lending to governments), and large fiscal deficits have not so far pushed up interest rates significantly (see Section 3). Moreover, some securities holdings by banks may represent precautionary liquidity balances, and thus could be temporary in character. On the other hand, there could eventually be an adverse impact if there has been a structural shift towards banks’ holding more risk-free assets. Moreover, the impact could potentially rise as interest rates go up and fiscal deficits stay high. To the extent that a large stock of government or central bank securities pushes up the risk premium on sovereign debt, it could also lead to a sharp increase in the interest rate charged to private sector borrowers.
5 See Jeanneau and Verdia (2005) and Tovar (2005) for recent developments in local currency bond markets in Latin
America.
BIS Papers No 28 17
2. The underlying factors
This section first briefly reviews the reasons usually associated with bank lending fluctuations in emerging economies before addressing what is special about the current cycle. The next section examines the quantitative significance of some of the demand and supply factors in the current cycle.
What causes bank lending fluctuations?
There are competing views about what causes bank credit fluctuations in emerging economies: one focuses on demand side elements and the other on the supply of credit. In practice, it is hard to prove the dominance of either side, and both might well be in play at many times.
According to one view, changes in bank credit reflect firms’ and households’ demand for bank loans. Under this hypothesis, credit supply is relatively elastic, and adjusts to prevailing demand conditions. For example, Ghosh and Ghosh (1999) show that the collapse of bank lending in East Asia following the 1997-98 financial crises was led by a decline in the demand for bank loans rather than banks’ withdrawal from the credit market. Cottarelli et al (2003) argue that conceptually the recent lending boom in central and eastern Europe reflects an upward shift in the IS curve in the region following macroeconomic deregulation.6
Such a view is also reflected in the real business cycle literature, which shows that the demand for bank credit is highly procyclical.7 Thus credit growth will rise during an upswing and fall during the downswing, reflecting real factors that drive investment and consumption in the economy. One propagation mechanism could be a positive shock to the terms of trade that boosts private wealth expectations and the demand for credit in the economy. Montiel (2000) examines several episodes of consumption boom in industrial and developing economies between 1960 and 1995. He concludes that in the majority of countries it was the consumption boom originating in terms-of-trade improvements that led to subsequent sharp increases in bank credit. Another mechanism could be a perceived positive technological shock that raises investment and credit demand in the economy to a high level. Such a mechanism was believed to have played a major role in the buildup of an investment bubble in Southeast Asia prior to the 1997-98 financial crises.8
An alternative view is that fluctuations in bank credit reflect supply side developments such as changes in banks’ capacity and willingness to lend.9 To the extent that some firms face a high external premium in accessing the capital market, or such markets are not well developed, they are heavily dependent on bank lending. Others have argued that bank credit is, indeed, special because it could trigger innovation, particularly in industries that did not have access to external financing; see Rajan and Zingales (1998). Thus any shock that relaxes banks’ lending capacity - a rise in capital inflows or an easier monetary policy - could lead to increased credit supply in the economy. Moreover, such shocks could affect asset prices and balance sheets, exerting an indirect influence on banks’ capacity to lend.10
Many have argued that financial liberalisation in the face of poorly regulated and supervised banks and inappropriate incentive structures have led to increased boom and bust credit cycles in emerging economies; see Hernández and Landerretche (2002) and Barth et al (2002).11 For example, a sharp rise in capital inflows can lead to excessive growth in bank lending and overheating of asset prices.
6 Their empirical results show that the recent acceleration in the private sector credit to GDP ratio primarily reflects the overall
financial deepening process as well as “crowding-in” of private spending by the recent reduction of government deficits, the privatisation of state-owned enterprises and, more generally, the progress of these countries towards market institutions.
7 See Mendoza (1995) and Gourinchas et al (2001). 8 Moreover, to the extent that the net worth of firms varies with the business cycle, affecting their external financing premium,
their demand for credit could vary procyclically with output. 9 The so-called “credit view” is a typical example of this; see Bernanke and Gertler (1995). 10 See Agénor et al (2000) and other papers reviewed therein for evidence on the supply side view of bank credit in East Asia.
Braun and Hausmann (2001), Barajas and Steiner (2002) and Singh et al (2005) provide similar evidence for Latin America. 11 See also Allen et al (2002), Calvo (1998), Cespedes et al (2000), Tornell and Westermann (2002) and IMF (2004a) for
discussions of mechanisms of boom and bust credit cycles in emerging economies.

18 BIS Papers No 28
This is followed by a “credit crunch” as asset prices collapse and banks’ non-performing assets rise. Banks become more risk-averse and repair their balance sheets by cutting back loan supply and maintaining high liquid assets to liabilities ratios. Several recent studies show that access to bank credit improves when the banking system is less concentrated, more open to foreign participation and well regulated; see Beck et al (2003). By contrast, banking crises have often resulted in a prolonged period of credit crunch and a substantial loss of output.12
Banks’ willingness to lend could also be affected by the regulatory regime in place, and by whether they hold enough capital to support all new profitable loan proposals; see Bernanke and Lown (1991). More recently, an institutional view has emerged which stresses the role of creditors’ rights and improved information sharing among lenders in removing supply-led credit constraints in emerging economies.13 The basic argument is that countries with better private property rights and credit risk screening mechanisms (particularly well functioning credit bureaus or credit register systems) are able to achieve a higher credit to GDP ratio than those that lack such institutions.
What has changed?
Changes in bank credit to the private sector and output gaps have been closely related in emerging economies (Graph 3). In Latin America, for instance, a sharp decline in bank lending towards the end of the 1990s was associated with a narrowing (or negative) output gap, while the subsequent recovery in credit growth has been closely accompanied by strong output growth. This appears to be a general phenomenon in many commodity-exporting countries (for instance Russia, Saudi Arabia and South Africa) in the current cycle as large terms-of-trade improvements have been associated with higher demand for bank credit. A similar trend has also been observed in Africa. In Asia, too, the covariance of credit growth and the output gap appears strong, although this relationship seems to have weakened over the past few years.
Graph 3
Credit growth and output cycle1
–6
0
6
12
18
–3
0
3
6
9
1990 1992 1994 1996 1998 2000 2002 2004
Asia2
Real credit growth (lhs)4
–12
0
12
24
36
–3
0
3
6
9
1990 1992 1994 1996 1998 2000 2002 2004
Latin America3
Output gap (rhs)5
1 Weighted average of country data, using 2000 PPP GDP weights. 2 China, Hong Kong SAR, India, Korea, Indonesia, Malaysia, Philippines, Singapore and Thailand. 3 Argentina, Brazil, Chile, Colombia, Mexico, Peru and Venezuela. 4 Private credit deflated by consumer prices; annual change, in per cent. 5 Deviation of actual GDP from trend GDP, in per cent. Trend based on an HP filter applied to annual data (standard specification). Source: National data.
Increased corporate financial diversification?
Important changes also seem to be taking place affecting the demand for credit by both firms and households. As noted, in many countries, the corporate sector appears to have reduced its demand
12 For a recent review, see Demirgüç-Kunt and Detragiache (2005) and also Dell’Ariccia et al (2005). 13 See Jappelli and Pagano (2002) and Djankov et al (2005).

BIS Papers No 28 19
for bank credit over the past few years. In Asia, for instance, outstanding corporate loans from the banking system (excluding China and India) fell by 20 percentage points of GDP between 1997 and 2003; see IMF (2005). In Latin America the decline has been of the order of 10 percentage points of GDP during the same period. In the recent cycle, corporate debt accumulation through bank borrowing remains strong only in central and eastern Europe.
One explanation for weak demand for corporate credit is that overly indebted firms sought to reduce their excess leverage as part of the restructuring process to improve their balance sheets. This was particularly evident in Asia in the aftermath of the 1997-98 financial crises. Such a trend was later seen across many emerging economies, as firms in non-crisis countries also became more cautious borrowers.14 Nevertheless, some recent estimates suggest that leverage ratios in the corporate sector are falling, which should have improved firms’ appetite for new bank loans. For example, in Asia (excluding China and India) the debt-to-asset ratio in the corporate sector stood at 35% in 2003 compared to over 50% in 1997; see IMF (2005).15 In Korea, the debt-to-asset ratio more than halved to 24% between 1997 and 2004. The ratio also remains well contained in Latin America and central Europe (between 20 and 35%).
Another explanation is that firms have been diversifying their financing sources by issuing bonds and equities. There is some evidence in support of this hypothesis. In Asia, for instance, the amount of outstanding corporate bonds (excluding China and India) increased from less than 20% of GDP in 1995 to 30% by 2003; see IMF (2005). Corporate bond financing remains particularly strong in Hong Kong, Korea and Malaysia, where bond markets are relatively well developed.16 In India, a similar diversification seems to be taking place through increased borrowing from abroad and equity financing. Moreover, with corporate profits rising, firms have been financing a large part of their investment through retained earnings. In Latin America, easier external financing conditions have instead encouraged firms to access the international syndicated loan and bond market. In some cases (eg Mexico), firms have been increasingly accessing domestic bond markets.
This trend towards increased capital market financing may well lead to financial disintermediation of the type witnessed by many mature markets over the past two decades. From a longer-term perspective, it could, however, be argued that corporate demand for bank credit may be temporarily low in Asia, and could eventually rise as investment rates recover from their post-crises lows. Strong growth, increased investors’ confidence and the large public infrastructure projects recently announced by several countries (for instance Indonesia, Malaysia and Thailand) could potentially facilitate such a recovery.
Another outstanding question is how much of the recent reduction in business credit growth may actually reflect constraints on supply rather than demand. For example, several recent studies in the context of Latin America show that firms - especially in the small and medium-scale sector - continue to face severe collateral constraints in accessing bank finance; see Galindo and Shiantarelli (2003).
However, as discussed in the overview paper by Turner in this volume, one important finding emerging from the discussion was that the reduction of corporate credit demand does not necessarily imply an adverse development for either the overall economy or the banking system. With the corporate sector’s access to capital market rising, it will increasingly switch between various sources of financing depending on the relative cost of funds. In any case, only large firms are able to reap this diversification opportunity. In some countries (eg Korea), commercial banks have been able to fill this gap by increasing lending to small profitable firms; see Lim (2003). Banks might ultimately gain as they change their business strategies in response to increased corporate diversification. For instance, in Singapore, intense competition and tightening profit margins have shifted the focus of banks towards
14 See IMF (2004b). 15 However, using firm-level data Rath et al (2003) show that the leverage ratio in emerging market corporate sectors
remained significantly high at the end of 2001, adversely affecting their profitability and capacity to absorb new debt. Glen and Singh (2003) reach a similar conclusion by comparing leverage ratios of emerging market firms with those of industrial countries.
16 According to the estimates by Gyntelberg et al (2005), outstanding corporate bonds relative to GDP stood at 49%, 39%, and 36%, respectively, in Korea, Malaysia and Hong Kong at the end of 2004 compared to 10 to 20% in China, Singapore and Thailand.

20 BIS Papers No 28
fee-based income to improve profitability. A similar trend is also seen in the Philippines, where banks have increased lending to microfinance institutions.
Strong household credit demand
Household sector credit demand has been unusually strong in most countries. Several demand and supply forces are probably at work. First, strong growth has not only boosted household current income but may also have countered pessimistic expectations of higher future income that prevailed in the late 1990s. As predicted by the life-cycle model, such a shift would be accompanied by a rise in the share of household expenditure in current income and increased demand for bank credit. Moreover, in many countries (especially in Asia) recent financial liberalisation involved the removal or substantial dilution of restrictions on bank lending to housing and consumer sectors. With household borrowing constraints thus relaxed, latent demand materialised.17
In China, for example, home mortgage and consumer durable loans (particularly automobile hire purchase) rose at a rapid rate following the relaxation of controls on household lending in 1999; see Liping and Gang (2002). India has seen similar household credit expansion during the past few years. As noted by Pruski and Żochowski in this volume, in Poland household credit demand has been boosted by increased income expectation following its entry into the European Union, the population boom of the 1970s and the 1980s, increased net migration to the cities and expected increases in house prices. In the Czech Republic, some of the major factors have been an initially low level of household debt and a change in the lifestyle of people towards “living off bank credit”. In Turkey, the recent reduction of inflation, increased consumer confidence and prospects of EU convergence have played a similar role.18 Similarly in Saudi Arabia, a rapidly growing young population, as well as the fact that banks can recover their debts by channelling wage payments through the interbank market, has been driving consumer credit.19
A second factor has been the role of policy. In many countries, the authorities have taken steps to encourage residential investment and borrowing-led household consumption as part of the strategy to revive domestic demand. Such incentives have taken several forms: preferential tax treatment of mortgage interest payments and capital gains from property transactions; temporarily increasing loan-to-value ratios; the establishment of various housing subsidy schemes to promote low-cost dwelling units; and, in some cases, the promotion of a population-wide credit card culture (for example, through a temporary relaxation of income criteria). Reinforcing these changes have been far-reaching financial innovations such as flexible mortgage contracts to meet the cash flow requirements of people within different income brackets, variable rate mortgages and other sophisticated mortgage and credit card products, which have attracted increasing numbers of households to the retail loan market.
A third factor has been the recent sharp reduction in the interest rate charged to households. This is driven by several reinforcing developments. With inflation declining and becoming more stable in recent years, inflation expectations as well as the inflation risk premium have fallen, bringing down both nominal and real interest rates. This has attracted potential home owners to the mortgage market not only by reducing initial debt servicing payments relative to income,20 but also by increasing the affordability of housing for low-income segments of the population more generally. To the extent that a reduction in long-run real rates increases equilibrium asset prices and household wealth, it may have played an added role in boosting household demand for bank credit.
17 Industrial countries had witnessed a similar surge in demand for consumer and residential credit following financial
liberalisation in the 1980s and 1990s leading to substantial relaxation of credit constraints facing households; see Bacchetta and Gerlach (1997).
18 See Başçi in this volume. 19 See the paper by the Saudi Arabian Monetary Authority in this volume. 20 This is technically called “front-end loading”. The idea is that high inflation, by keeping the nominal interest rate at a high
level, increases interest payments as a share of income in the first few years but reduces them later as nominal income rises and the real value of the principal falls with inflation. By contrast, low inflation reduces the upfront debt servicing costs relative to income but raises them later as nominal income rises less rapidly and the real value of debt falls more slowly; see Stevens (1997) and Debelle (2004).

BIS Papers No 28 21
At the same time, monetary policy has been eased significantly in a number of countries, bringing down short-term real interest rates. As Graph 4 shows, short-term real rates have been very low or zero in several economies in Asia and central Europe over the past four years. In Latin America, real rates also remain low by historical standards. As a result, real mortgage rates have reached historical lows over the past few years in many countries (1 to 5%, for instance, in Chile, Hong Kong, Singapore and Taiwan (China) in 2004).
Graph 4
Real short-term interest rates1
–10
–5
0
5
10
15
20
1996 1998 2000 2002 2004
China
India
Hong Kong SAR
Korea
Indonesia2
Thailand
1996 1998 2000 2002 2004
Brazil3
Chile
Mexico
–10
–5
0
5
10
15
20
1996 1998 2000 2002 2004
Czech Republic
Hungary
Poland
Saudi Arabia
Asia Latin America Others
1 Three-month annual interest rates deflated by annual consumer price inflation. Definitions may differ across countries. 2 Trough values close to –20% in 1998 Q3. 3 Peak values close to 35% in 1998 Q4 and 1999 Q1. Sources: Bloomberg; Datastream; national data.
Has banks’ capacity to lend improved?
An important question is to what extent the recent increase in private sector credit reflects improvements in banks’ capacity to lend. To get a measure of banks’ lending capacity, Table 5 presents a simple balance sheet identity of the banking system. Although the asset and liability positions of banks are not mutually independent (as a change in one may well affect the other via the credit multiplier or other equilibrium processes), the table can be conveniently used to decompose the sources of credit growth. The idea is that banks can finance their credit expansion in five major ways: (i) expanding deposits (D in Table 5); (ii) borrowing from abroad (ie changes in foreign liabilities over foreign assets (F)); (iii) drawing down reserves with the monetary authority (ie changes in net assets held with the monetary authority (CB)); (iv) reducing their net lending to governments (G); and (v) increasing their borrowing from other sources (including non-banking sources (O)).
Table 5
Simplified aggregate balance sheet of deposit money banks
Assets Liabilities
Domestic credit to the private sector (DPR) Deposits (D)
Net foreign assets (F) Other financing (eg bonds, credit from other financial institutions, capital accounts, other net items) (O)
Net credit to the public sector (including government securities) (G)
Net assets held with the central bank (CB)
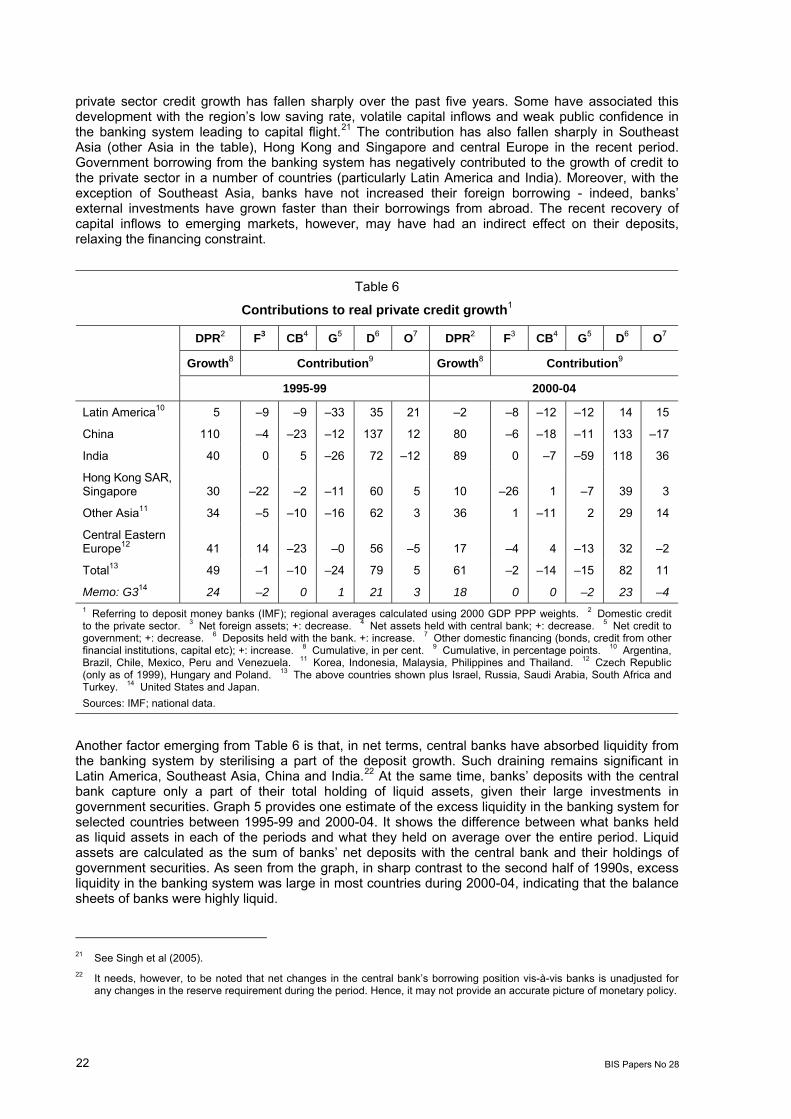
Table 6 presents sources of cumulative changes in private sector credit between 1995-99 and 2000-04. The table shows that factors affecting banks’ deposit base - including growth in income, household saving preferences, interest rates, public confidence in the banking system and capital inflows - have a large impact on their lending capacity. In Latin America, the contribution of deposits to
22 BIS Papers No 28
private sector credit growth has fallen sharply over the past five years. Some have associated this development with the region’s low saving rate, volatile capital inflows and weak public confidence in the banking system leading to capital flight.21 The contribution has also fallen sharply in Southeast Asia (other Asia in the table), Hong Kong and Singapore and central Europe in the recent period. Government borrowing from the banking system has negatively contributed to the growth of credit to the private sector in a number of countries (particularly Latin America and India). Moreover, with the exception of Southeast Asia, banks have not increased their foreign borrowing - indeed, banks’ external investments have grown faster than their borrowings from abroad. The recent recovery of capital inflows to emerging markets, however, may have had an indirect effect on their deposits, relaxing the financing constraint.
Table 6
Contributions to real private credit growth1
DPR2 F3 CB4 G5 D6 O7 DPR2 F3 CB4 G5 D6 O7
Growth8 Contribution9 Growth8 Contribution9
1995-99 2000-04
Latin America10 5 –9 –9 –33 35 21 –2 –8 –12 –12 14 15
China 110 –4 –23 –12 137 12 80 –6 –18 –11 133 –17
India 40 0 5 –26 72 –12 89 0 –7 –59 118 36
Hong Kong SAR, Singapore 30 –22 –2 –11 60 5 10 –26 1 –7 39 3
Other Asia11 34 –5 –10 –16 62 3 36 1 –11 2 29 14
Central Eastern Europe12 41 14 –23 –0 56 –5 17 –4 4 –13 32 –2
Total13 49 –1 –10 –24 79 5 61 –2 –14 –15 82 11
Memo: G314 24 –2 0 1 21 3 18 0 0 –2 23 –4 1 Referring to deposit money banks (IMF); regional averages calculated using 2000 GDP PPP weights. 2 Domestic credit to the private sector. 3 Net foreign assets; +: decrease. 4 Net assets held with central bank; +: decrease. 5 Net credit to government; +: decrease. 6 Deposits held with the bank. +: increase. 7 Other domestic financing (bonds, credit from other financial institutions, capital etc); +: increase. 8 Cumulative, in per cent. 9 Cumulative, in percentage points. 10 Argentina, Brazil, Chile, Mexico, Peru and Venezuela. 11 Korea, Indonesia, Malaysia, Philippines and Thailand. 12 Czech Republic (only as of 1999), Hungary and Poland. 13 The above countries shown plus Israel, Russia, Saudi Arabia, South Africa and Turkey. 14 United States and Japan. Sources: IMF; national data.
Another factor emerging from Table 6 is that, in net terms, central banks have absorbed liquidity from the banking system by sterilising a part of the deposit growth. Such draining remains significant in Latin America, Southeast Asia, China and India.22 At the same time, banks’ deposits with the central bank capture only a part of their total holding of liquid assets, given their large investments in government securities. Graph 5 provides one estimate of the excess liquidity in the banking system for selected countries between 1995-99 and 2000-04. It shows the difference between what banks held as liquid assets in each of the periods and what they held on average over the entire period. Liquid assets are calculated as the sum of banks’ net deposits with the central bank and their holdings of government securities. As seen from the graph, in sharp contrast to the second half of 1990s, excess liquidity in the banking system was large in most countries during 2000-04, indicating that the balance sheets of banks were highly liquid.
21 See Singh et al (2005). 22 It needs, however, to be noted that net changes in the central bank’s borrowing position vis-à-vis banks is unadjusted for
any changes in the reserve requirement during the period. Hence, it may not provide an accurate picture of monetary policy.

BIS Papers No 28 23
Graph 5
Excess liquidity of banks1
As a percentage of total domestic credit2
–20
–10
0
10
20
30
40
HK KR IN4 MY SG TH CL4CO MX VE PL IL SA TR–20
–10
0
10
20
30
40
HK KR IN MY SG TH CL CO MX VE HU PL IL SA TR
Average 1995-993 Average 2000-043
1 Defined as deviation of deposit money banks’ reserves and other claims on monetary authorities (IFS, I.20, 20..) less credit from monetary authorities (IFS, I.26g) plus government securities held by commercial banks (questionnaire) from long-term average; in per cent. 2 Of deposit money banks (IFS, I.32). 3 Simple average of end-year observations. 4 Refers to 1997-99. Sources: IMF; national data (questionnaire).
Banks’ willingness to lend
What about banks’ willingness to lend? As this is not a measurable concept (survey data are few and far between), many have used proxies to represent it. Annex Table A4 presents three relevant variables - the risk-weighted capital ratio of the banking system, non-performing loans and operating costs as a percentage of total assets - across a number of emerging economies. The median capital ratio of the banking system in emerging economies exceeded 14% in 2004 compared to 13% in 1999. This suggests that the low rate of credit growth noted previously was not primarily due to banks’ low capital base. On the other hand, capital ratios are partly endogenous to the extent that they are raised by reducing lending. A more relevant variable in this case is the non-performing loan ratio of the banking system - a high ratio leads to risk-averse lending behaviour as weak banks cut new loan supply to improve their balance sheet and vice versa. As Annex Table A4 shows, non-performing loans have fallen in several countries over the past five years, but remain high in a number of others: ranging between 6 and 9% of total assets in China, Malaysia, the Philippines, Poland and Thailand.
Another variable with implications for bank credit is banks’ operating costs. High operating costs could indicate significant inefficiencies in the banking system and a rigid lending rate structure. This could reduce the accessibility of potential borrowers to the banking system. The median operating cost in the emerging economies’ banking system was 3.5% of assets in 2003-04, higher than say 1% in Japan and Germany and 3% in the United States. Despite some reduction over the past five years, operating costs remain higher in Latin America than in Asia. In Brazil, estimates reported by Goldfajn et al (2004) show that about 45% of the banking spread (the difference between lending rate and funding cost) is accounted for by banks’ perceived risks and 40% by administrative costs and taxes. Belaisch (2003) attributes such costs to the high degree of concentration of the Brazilian banking system. Mohan (2002) highlights a similar challenge in the Indian context by pointing out that real lending rates of banks have been sticky downwards despite a significant reduction in nominal rates.
Can foreign ownership of banks improve credit availability conditions in emerging economies? The share of foreign-owned banks in total banking assets has grown rapidly in many countries, particularly central Europe and Latin America, over the past decade.23 Foreign banks are expected to enhance credit supply in host countries, not only by intensifying competition and thereby reducing
23 The share of foreign banks in total banking sector assets in central Europe and Latin America had, for instance, risen rapidly
from 5-20% in 1990 to 80-90% and 30-80%, respectively, by 2004. In Asia, excepting Hong Kong and Singapore, the ratio has been generally low, but rising sharply in Malaysia and Thailand over the past decade; see Domanski (2005) for a recent review.

24 BIS Papers No 28
intermediation costs, but also by transferring better technology and risk management skills. Moreover, foreign banks have developed niche banking, such as consumer and mortgage lending, where they tend to have comparative advantages. Their better access to external credit lines (particularly from parent companies), greater ability to disperse risk through globally diversified portfolios, and less reliance on host country financial support could help improve the resilience of credit flows during a crisis. On the opposite side, some have argued that foreign bank subsidiaries may “cherry-pick” business lines, increase losses for domestic banks, transfer global financial shocks to the host country, and exacerbate a crisis by leaving the country in the moments of greatest need. Empirical evidence has been generally supportive of foreign banks’ positive role in relaxing credit constraints in emerging economies, particularly in countries with a weak banking system; see Mihaljek in this volume.24
3. Some empirical evidence
This section examines the empirical significance of some of the factors discussed above. The following questions were asked: does bank credit growth vary procyclically in emerging economies? Is the demand for credit sensitive to changes in growth rates possibly reflecting the wealth effect? How strong is the impact of monetary policy on bank credit? Does asset quality matter for bank lending?
To answer these questions a reduced form cross-country panel regression was conducted.25 Changes in real credit to the private sector were regressed on six major demand and supply variables: (i) an estimate of the output gap; (ii) per capita income in the previous period; (iii) non-performing loan ratios of banks; (iv) the real short-term interest rate; (v) an estimate of the banking system’s loanable funds; and (vi) the operating costs of banks. The model is augmented in subsequent estimation by including the terms of trade and real bank credit to the government sector. Appendix 1 at the end of the paper provides details about the estimation method and results.
The major findings are as follows:
• Overall, the results show that both demand and supply factors have an important influence on private sector credit growth in emerging economies.
• Bank credit to the private sector appears to vary procyclically with output. A coefficient above unity on the output gap indicates that bank credit grows more than proportionally with output recovery, which is not surprising given the high degree of dependence of emerging economies’ firms and households on bank credit. At the same time, the coefficient on lagged per capita income growth is significantly positive in most specifications, indicating that strong growth leads to higher expected future income and demand for bank credit.
• Bank credit is highly sensitive to the NPL ratio. Moreover, bank credit is stimulated by a reduction in operating costs, implying that countries with lower operating costs in the banking system are able to achieve higher bank credit growth.
• Changes in the deposit base of the banking system have a major impact on its capacity to lend. Nevertheless, bank credit growth falls (rises) by less than one third of a given decline (rise) in loanable funds, highlighting the importance of other offsetting factors. This indicates that, in the event of an adverse shock to their deposit base, banks may liquidate a part of their other assets to maintain a reasonable line of credit to the private sector.
24 For instance, Dages et al (2000) and IDB (2002) note the key role of foreign bank subsidiaries in maintaining stable credit
supply in Latin America during crisis times. Detragiache and Gupta (2004) report similar findings for Malaysia but show that Asia-oriented foreign banks (primarily focusing their business in Asia) were relatively less stabilising than non-Asia-oriented banks because they tended to demonstrate the same herding behaviour as domestic banks.
25 One caveat generally associated with the reduced form specification is that the parameters are not easily interpretable, notably because of simultaneous interaction of demand for and supply of bank credit with interest rates. Although this could be corrected by choosing a suitable estimation method (for instance, the instrumental variable method), the short data sample, in our case, constrains its use.

BIS Papers No 28 25
• Higher interest rates tend to reduce bank credit. This goes to support the view that an easier monetary policy adopted by several countries since 2001 has had a significant expansionary impact on bank credit.
• Surprisingly, however, changes in the terms of trade do not seem to matter for bank credit when considered with other major variables in the baseline model. It becomes significant only when considered with bank credit to the government sector (model M4 in the appendix). One interpretation of this result is that since changes in the terms of trade are already partly captured by the demand side variables, they do not seem to have an independent effect of their own. But as pointed out by Braun and Hausmann (2001) the significance of the terms of trade is probably greater as a supply variable: an increase seems to relax banks’ financing constraints by raising the probability of currency appreciation and boosting collateral for the international provision of credit, particularly when the government is running a large budget deficit.
• The results are somewhat sympathetic to the “crowding-out” theory. The coefficient on government credit is significantly negative in some specifications. The low value of the coefficient on changes in government credit might also suggest that this may not have been a major constraint on bank lending to the private sector in the current cycle.
4. Sustainability of current trends
Can the recent rapid pace of lending growth led primarily by household borrowing be sustained? There are reasons to believe that household borrowing can continue to grow at a fast rate in many emerging economies. For example, growing household income and several recent structural changes can be expected to sustain demand for residential and consumer credit at a high level. Such a trend could also be helped by the fact that, by the standards of industrial economies, household debt relative to income in several emerging economies remains fairly low (Graph 6).
Graph 6
Household debt1 As a percentage of disposable income
0
40
80
120
160
200
SG2 AU JP KR US TH3 CL HU PL CO ID MX 1 The first column refers to end-1999, the second to end-2003. 2 The first column refers to end-2000. 3 The second column refers to end-2002. Source: National data.
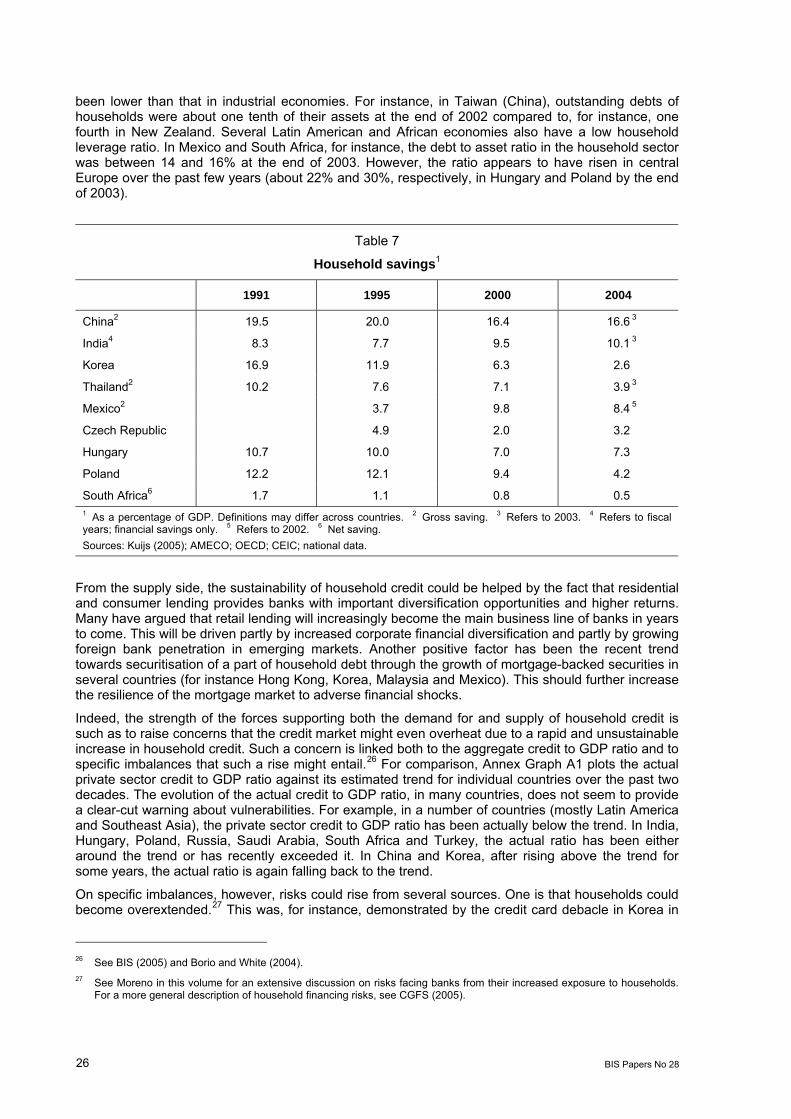
Moreover, households are net savers in many emerging economies, and own large financial assets. This is seen from the relatively high household saving ratio in several countries reported in Table 7. From this perspective, emerging economies’ households may have a higher debt absorption capacity with respect to their income than, for instance, industrial economies where the low household saving rate increases the burden of current borrowing on future income.
Data on household leverage ratios are scant in emerging economies. Nevertheless, there is some evidence to suggest that the overall household debt to asset ratio in several emerging economies has
26 BIS Papers No 28
been lower than that in industrial economies. For instance, in Taiwan (China), outstanding debts of households were about one tenth of their assets at the end of 2002 compared to, for instance, one fourth in New Zealand. Several Latin American and African economies also have a low household leverage ratio. In Mexico and South Africa, for instance, the debt to asset ratio in the household sector was between 14 and 16% at the end of 2003. However, the ratio appears to have risen in central Europe over the past few years (about 22% and 30%, respectively, in Hungary and Poland by the end of 2003).
Table 7
Household savings1
1991 1995 2000 2004
China2 19.5 20.0 16.4 16.6 3
India4 8.3 7.7 9.5 10.1 3
Korea 16.9 11.9 6.3 2.6
Thailand2 10.2 7.6 7.1 3.9 3
Mexico2 3.7 9.8 8.4 5
Czech Republic 4.9 2.0 3.2
Hungary 10.7 10.0 7.0 7.3
Poland 12.2 12.1 9.4 4.2
South Africa6 1.7 1.1 0.8 0.5 1 As a percentage of GDP. Definitions may differ across countries. 2 Gross saving. 3 Refers to 2003. 4 Refers to fiscal years; financial savings only. 5 Refers to 2002. 6 Net saving. Sources: Kuijs (2005); AMECO; OECD; CEIC; national data.
From the supply side, the sustainability of household credit could be helped by the fact that residential and consumer lending provides banks with important diversification opportunities and higher returns. Many have argued that retail lending will increasingly become the main business line of banks in years to come. This will be driven partly by increased corporate financial diversification and partly by growing foreign bank penetration in emerging markets. Another positive factor has been the recent trend towards securitisation of a part of household debt through the growth of mortgage-backed securities in several countries (for instance Hong Kong, Korea, Malaysia and Mexico). This should further increase the resilience of the mortgage market to adverse financial shocks.
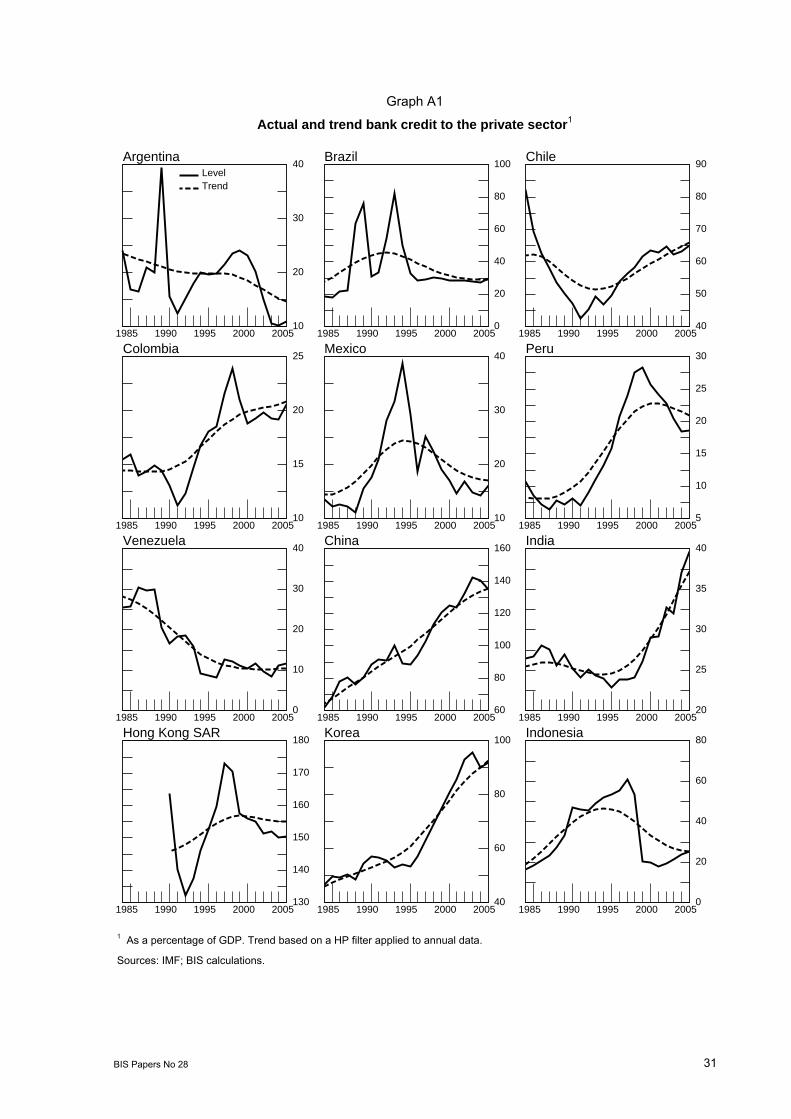
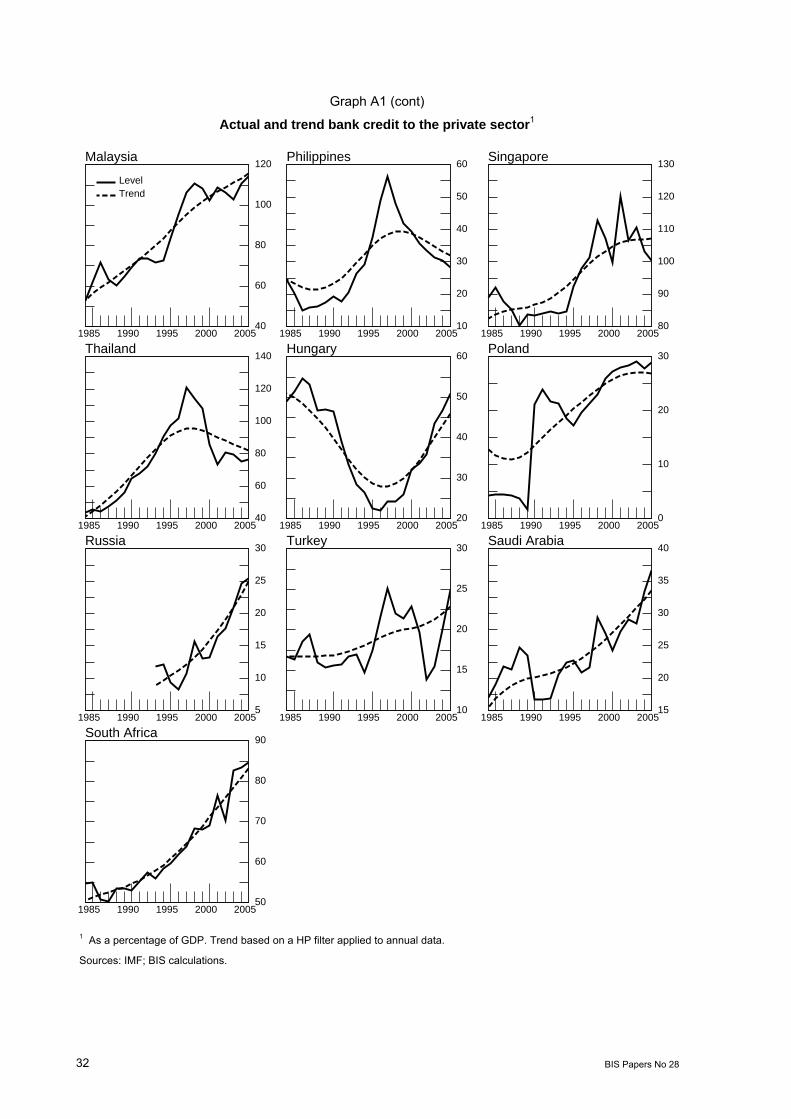
Indeed, the strength of the forces supporting both the demand for and supply of household credit is such as to raise concerns that the credit market might even overheat due to a rapid and unsustainable increase in household credit. Such a concern is linked both to the aggregate credit to GDP ratio and to specific imbalances that such a rise might entail.26 For comparison, Annex Graph A1 plots the actual private sector credit to GDP ratio against its estimated trend for individual countries over the past two decades. The evolution of the actual credit to GDP ratio, in many countries, does not seem to provide a clear-cut warning about vulnerabilities. For example, in a number of countries (mostly Latin America and Southeast Asia), the private sector credit to GDP ratio has been actually below the trend. In India, Hungary, Poland, Russia, Saudi Arabia, South Africa and Turkey, the actual ratio has been either around the trend or has recently exceeded it. In China and Korea, after rising above the trend for some years, the actual ratio is again falling back to the trend.
On specific imbalances, however, risks could rise from several sources. One is that households could become overextended.27 This was, for instance, demonstrated by the credit card debacle in Korea in
26 See BIS (2005) and Borio and White (2004). 27 See Moreno in this volume for an extensive discussion on risks facing banks from their increased exposure to households.
For a more general description of household financing risks, see CGFS (2005).

BIS Papers No 28 27
2003. Household debt rose rapidly in a span of two to three years, leading to a sharp increase in the delinquency rate and a subsequent collapse of household lending (Box 1). There are several channels through which a large accumulation of debt by households could lead to widespread financial distress. Low interest rates might prompt households to borrow too much, increasing their sensitivity to future income and interest rate shocks. Another important channel could be a highly skewed income distribution, which may mean that the debt burden falls unevenly across the population. If financial liberalisation, by improving the access of the low-income population to bank credit, encourages them to rely disproportionately on debt-financed consumption, this could become a significant problem.
Box 1
Credit cards in Korea - the boom and bust cycle
The Korean credit card industry expanded rapidly from 1999 to 2002 as a result of aggressive marketing by lenders and official support via fiscal incentives to credit card holders. During this period the number of credit cards grew from 39 million to over 100 million, an average of four cards per Korean adult. Credit cards were used extensively, with total transactions reaching 114% of GDP in 2002. Initially the credit card business was highly profitable. Returns on equity reached 55% in the first half of 2001, and net profits grew by 175% from 2000 to 2001. Despite the rapid growth, supervisors saw only limited risks because of low estimated future default rates (based on past experience), high profitability and high capitalisation rates among lenders.
During 2002 and 2003 this picture changed dramatically. The average credit card delinquency ratio rose to 14% at the end of 2003 from around 6% a year earlier. Over the same period, the eight local credit card companies saw a 170% increase in loss provisioning and a 55% fall in outstanding cash advance balances. As a result, credit card companies’ capital adequacy ratios fell from 13.0% to –5.5%, despite significant additions to capital.
Starting in September 2002, credit bureaus enabled financial firms to begin sharing information about borrowers’ total debts, thereby improving lenders’ ability to manage credit risks. Before this, a key element in risk management by individual credit card companies was that customers were required to settle their balance in full every month. However, insufficient information sharing between credit card companies meant that card holders could hold multiple cards and thereby effectively obtain revolving credit lines by shifting debt between cards. It is believed that government regulation restricting the entry of new firms led to an oligopolistic credit card market structure, increasing the market power of the existing credit card companies; see Yun (2004).
As the situation worsened, regulation was tightened, leading to cuts in credit lines and the selling of impaired assets. The regulatory changes included limits on cash advances, an increase in capital adequacy requirements, a ban on the issuance of new cards if delinquency rates were above 15% for a given month, the introduction of minimum loss provisioning, a ban on aggressive marketing, and requirements to verify the identify and incomes of all new customers. The impact of the increasing delinquencies and regulatory tightening was that consumption, after growing by close to 7% in 2002, declined by 1.4% in 2003. The authorities also set up several channels to deal with the debts of delinquent borrowers, including debt restructuring by financial institutions of credit card holders without multiple debts and the setting-up of a “bad bank” (Hanmaeum) to help those with debts to more than one institution. There has been a decline in delinquency rates as well as in the number of credit cards over the past two years. By 2005 credit card companies had again started to make large profits.
Moral hazard problems are a challenge. For example, the lack of established credit bureaus with sufficiently long data on household credit history means banks do not have adequate information about potential defaulters. Weak contractual rights of bank creditors make matters worse by reducing banks’ ability to recover their debt and encouraging delinquent behaviour among borrowers. Many countries are trying to establish credit bureaus and so enhance information-sharing among banks. In Korea, for instance, increased information-sharing among the credit card companies following the recent crisis has led to a reduction in the ratio of delinquent borrowers. In India, the recent legislation empowering banks to seize assets of defaulters appears to have had a similar effect. In Mexico, private credit bureaus have recently been set up to share information among firms that contribute to the database, thus removing a major constraint associated with the public register system, which was primarily used for research by financial institutions rather than for selection of debtors.28
28 See Sidaoui in this volume.
28 BIS Papers No 28
In addition, banks have transferred a large part of their market risk to households. In countries with predominantly variable rate mortgage debts, households may have become highly exposed to future fluctuations in interest rates. In some countries, mortgage loans have been primarily short to medium-term (less than three years), as banks have reduced the maturity gap between their assets and liabilities. A similar risk transfer is taking place in central Europe, where a large part of household debt is denominated in foreign currency (for instance, 25 to 30% in Hungary and Poland at the end of 2004). Low foreign interest rates and expected currency appreciation have increased household demand for foreign currency loans by reducing future loan liability.At the same time, a large buildup of foreign currency positions exposes households to future losses were the exchange rate to depreciate sharply. As discussed by Turner in this volume, a major policy concern is whether households are fully aware of the risks they are assuming and whether they can withstand large unexpected shocks that can quickly pile up their debt burden.
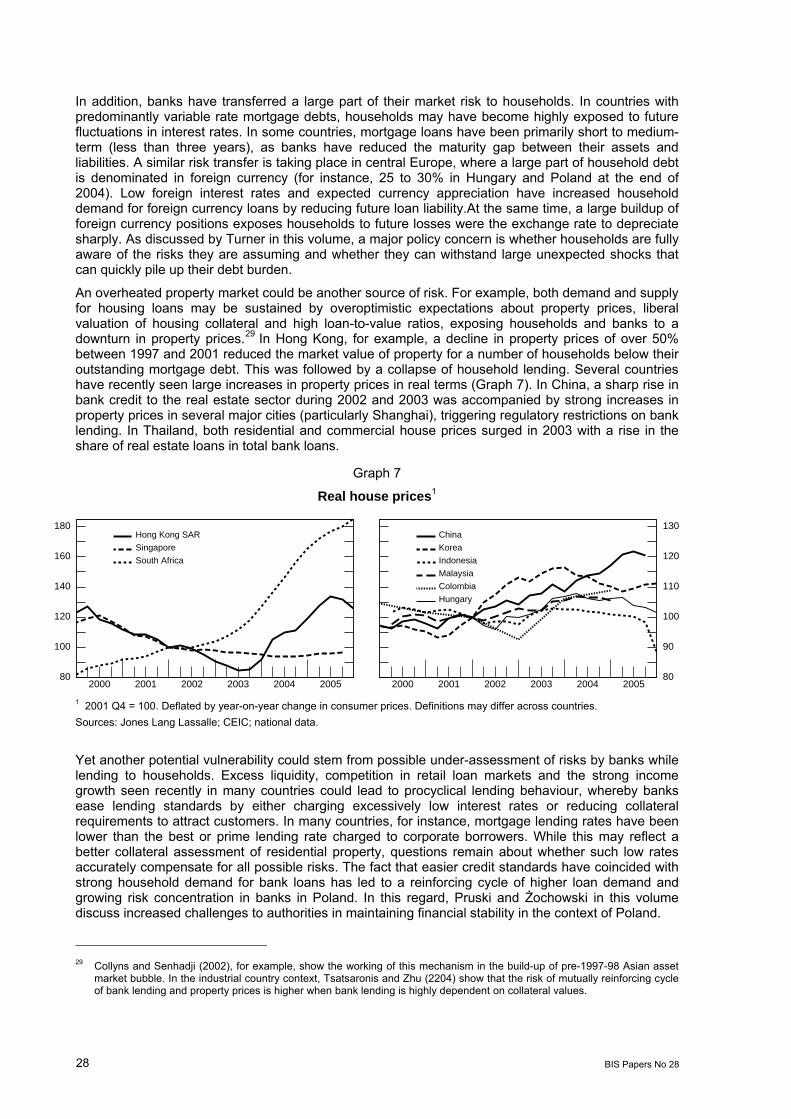
An overheated property market could be another source of risk. For example, both demand and supply for housing loans may be sustained by overoptimistic expectations about property prices, liberal valuation of housing collateral and high loan-to-value ratios, exposing households and banks to a downturn in property prices.29 In Hong Kong, for example, a decline in property prices of over 50% between 1997 and 2001 reduced the market value of property for a number of households below their outstanding mortgage debt. This was followed by a collapse of household lending. Several countries have recently seen large increases in property prices in real terms (Graph 7). In China, a sharp rise in bank credit to the real estate sector during 2002 and 2003 was accompanied by strong increases in property prices in several major cities (particularly Shanghai), triggering regulatory restrictions on bank lending. In Thailand, both residential and commercial house prices surged in 2003 with a rise in the share of real estate loans in total bank loans.
Graph 7
Real house prices1
80
100
120
140
160
180
2000 2001 2002 2003 2004 2005
Hong Kong SAR
Singapore
South Africa
80
90
100
110
120
130
2000 2001 2002 2003 2004 2005
China
Korea
Indonesia
Malaysia
Colombia
Hungary
1 2001 Q4 = 100. Deflated by year-on-year change in consumer prices. Definitions may differ across countries. Sources: Jones Lang Lassalle; CEIC; national data.
Yet another potential vulnerability could stem from possible under-assessment of risks by banks while lending to households. Excess liquidity, competition in retail loan markets and the strong income growth seen recently in many countries could lead to procyclical lending behaviour, whereby banks ease lending standards by either charging excessively low interest rates or reducing collateral requirements to attract customers. In many countries, for instance, mortgage lending rates have been lower than the best or prime lending rate charged to corporate borrowers. While this may reflect a better collateral assessment of residential property, questions remain about whether such low rates accurately compensate for all possible risks. The fact that easier credit standards have coincided with strong household demand for bank loans has led to a reinforcing cycle of higher loan demand and growing risk concentration in banks in Poland. In this regard, Pruski and Żochowski in this volume discuss increased challenges to authorities in maintaining financial stability in the context of Poland.
29 Collyns and Senhadji (2002), for example, show the working of this mechanism in the build-up of pre-1997-98 Asian asset
market bubble. In the industrial country context, Tsatsaronis and Zhu (2204) show that the risk of mutually reinforcing cycle of bank lending and property prices is higher when bank lending is highly dependent on collateral values.

BIS Papers No 28 29
Appendix 1 Panel model for private sector credit
The panel is estimated using data for 21 countries from 1999 to 2004. The countries are Argentina, Brazil, Chile, China, Colombia, the Czech Republic, Hungary, India, Indonesia, Israel, Korea, Malaysia, Mexico, Peru, the Philippines, Poland, Russia, South Africa, Thailand, Turkey and Venezuela. The model is initially estimated using linear least squares for the entire pool of countries. The starting model is M0, which regresses changes in private bank credit on: (i) the output gap (GAP), (ii) changes in real per capita income (PPPYHEAD) in the previous period (a proxy for expected future income); (iii) non-performing loans of banks as a percentage of total assets (NPL), (iv) the real short-term interest rate (MR-PCH), (v) changes in the banking system’s loanable funds defined as banks’ total liabilities minus their capital and reserves, 30 and (vi) operating costs as a percentage of total assets. Excepting the output gap, the non-performing loan ratio, the real interest rate and operating costs, all variables are measured in the first difference logarithmic terms.
Table A Impact on bank credit1
With
constant and no CFE2
With CFE
Variable M0 M1 M2 M3 M4
GAP 1.28 (5.37)**
1.17 (6.99)**
1.15 (6.84)**
1.05 (5.91)**
1.04 (5.92)**
DLOG(PPPYHEAD(−1))*100
0.76 (5.13)**
0.35 (2.72)**
0.37 (2.93)**
0.19 (1.51)
0.27 (2.26)*
LOG(NPL(–1)) –3.67 (–6.36)**
–3.93 (–4.27)**
–3.78 (–4.12)**
–3.88 (–4.49)**
–3.79 (–4.31)**
DLOG(LF/CPI)*100 0.29 (4.39)**
0.26 (4.00)**
0.27 (4.38)**
0.32 (5.80)**
0.32 (7.41)**
(MR–@PCH(CPI)) –0.06 (–0.90)
–0.25 (–3.07)**
–0.25 (–3.21)**
–0.16 (–1.96)
–0.17 (–2.22)*
D(OC(–1)) –1.24 (–1.69)
–2.12 (–2.56)*
–1.88 (–2.30)*
–3.27 (–4.20)**
–2.75 (–3.58)**
DLOG(TTD(–1))*100 0.09 (1.62)
0.09 (3.28)**
DLOG(CG/CPI)*100 –0.06 (–2.27)*
–0.05 (–2.03)*
R2 0.68 0.85 0.85 0.87 0.89 DW 1.16 2.04 2.02 2.02 1.97 1 The dependent variable is the percentage change in real bank credit to the private sector. The model is estimated through panel regression allowing for heteroscedasticity across countries. 2 CFE = country-specific fixed effect. *,** denote coefficients significantly different from zero at the 5% and 1% level, respectively. In parenthesis, t-statistics. Source: BIS estimates.
However, the individual residual means and variances revealed a great degree of heterogeneity across countries. To capture differences across countries we estimated the same model with country-specific fixed effects allowing for group-wise heteroscedasticity in model M1. In functional form: yi = Xiβ + iα i + ε i where i is a column of ones and where the off diagonal terms of the general covariance matrix are restricted to zero. In the estimated model, all coefficients are significantly different from zero with
30 This follows the concept used by Ghosh and Ghosh (1999).

30 BIS Papers No 28
unbiased residuals across countries (see the attached graph). Hence model M1 becomes the benchmark model for further analyses. To test the significance of other variables the model is augmented in subsequent estimation by including changes in the terms of trade (TTD) and real bank credit to the government sector (CG).
-4
-2
0
2
4
6
8
1999 2000 2001 2002 2003 2004
AR
-2.0
-1.5
-1.0
-0.5
0.0
0.5
1.0
1.5
1999 2000 2001 2002 2003 2004
BR
-3
-2
-1
0
1
2
3
1999 2000 2001 2002 2003 2004
CL
-6
-4
-2
0
2
4
6
1999 2000 2001 2002 2003 2004
CN
-4
-2
0
2
4
6
8
1999 2000 2001 2002 2003 2004
CO
-40
-30
-20
-10
0
10
20
1999 2000 2001 2002 2003 2004
CZ
-4
0
4
8
12
1999 2000 2001 2002 2003 2004
HU
-40
-30
-20
-10
0
10
20
1999 2000 2001 2002 2003 2004
ID
-3
-2
-1
0
1
2
3
4
1999 2000 2001 2002 2003 2004
IL
-3
-2
-1
0
1
2
1999 2000 2001 2002 2003 2004
IN
-8
-6
-4
-2
0
2
4
6
8
1999 2000 2001 2002 2003 2004
KR
-4
-2
0
2
4
6
1999 2000 2001 2002 2003 2004
MX
-6
-4
-2
0
2
4
1999 2000 2001 2002 2003 2004
MY
-8
-4
0
4
8
12
1999 2000 2001 2002 2003 2004
PE
-6
-5
-4
-3
-2
-1
0
1
2
3
1999 2000 2001 2002 2003 2004
PH
-6
-4
-2
0
2
4
6
1999 2000 2001 2002 2003 2004
PL
-8
-4
0
4
8
12
1999 2000 2001 2002 2003 2004
RU
-15
-10
-5
0
5
10
15
1999 2000 2001 2002 2003 2004
TH
-25
-20
-15
-10
-5
0
5
10
15
1999 2000 2001 2002 2003 2004
TR
-10
-5
0
5
10
15
20
1999 2000 2001 2002 2003 2004
VE
-8
-4
0
4
8
12
16
1999 2000 2001 2002 2003 2004
ZA
RESID
BIS Papers No 28 31
Graph A1
Actual and trend bank credit to the private sector1
10
20
30
40
1985 1990 1995 2000 2005
ArgentinaLevelTrend
0
20
40
60
80
100
1985 1990 1995 2000 2005
Brazil
40
50
60
70
80
90
1985 1990 1995 2000 2005
Chile
10
15
20
25
1985 1990 1995 2000 2005
Colombia
10
20
30
40
1985 1990 1995 2000 2005
Mexico
5
10
15
20
25
30
1985 1990 1995 2000 2005
Peru
0
10
20
30
40
1985 1990 1995 2000 2005
Venezuela
60
80
100
120
140
160
1985 1990 1995 2000 2005
China
20
25
30
35
40
1985 1990 1995 2000 2005
India
130
140
150
160
170
180
1985 1990 1995 2000 2005
Hong Kong SAR
40
60
80
100
1985 1990 1995 2000 2005
Korea
0
20
40
60
80
1985 1990 1995 2000 2005
Indonesia
1 As a percentage of GDP. Trend based on a HP filter applied to annual data.
Sources: IMF; BIS calculations.
32 BIS Papers No 28
Graph A1 (cont)
Actual and trend bank credit to the private sector1
40
60
80
100
120
1985 1990 1995 2000 2005
Malaysia
LevelTrend
10
20
30
40
50
60
1985 1990 1995 2000 2005
Philippines
80
90
100
110
120
130
1985 1990 1995 2000 2005
Singapore
40
60
80
100
120
140
1985 1990 1995 2000 2005
Thailand
20
30
40
50
60
1985 1990 1995 2000 2005
Hungary
0
10
20
30
1985 1990 1995 2000 2005
Poland
5
10
15
20
25
30
1985 1990 1995 2000 2005
Russia
10
15
20
25
30
1985 1990 1995 2000 2005
Turkey
15
20
25
30
35
40
1985 1990 1995 2000 2005
Saudi Arabia
50
60
70
80
90
1985 1990 1995 2000 2005
South Africa
1 As a percentage of GDP. Trend based on a HP filter applied to annual data.
Sources: IMF; BIS calculations.

BIS Papers No 28 33
Table A1
Real aggregate credit1
Share in aggregate credit Average growth
rate Commercial banks Other banks and non-bank
financial institutions
1995-99 2000-04 1994 1999 2004 1994 1999 2004
Latin America Argentina 8.5 –2.7 93 94 97 5 6 3 Brazil 12.3 4.6 86 71 61 14 29 39 Chile 9.3 5.3 96 99 100 4 1 0 Colombia 3.5 1.5 50 55 88 50 45 12 Mexico –13.1 9.2 58 47 43 42 53 57 Peru 19.8 –4.1 95 99 99 5 1 1 Venezuela –5.2 10.6 89 87 99 11 13 1
Asia China 17.1 13.3 100 100 100 0 0 0 India 6.1 14.6 97 3 Hong Kong SAR –4.1 2.2 100 0 Singapore 11.3 5.7 92 8 Indonesia –15.8 5.8 Korea 4.4 7.2 49 57 62 51 43 38 Malaysia 10.4 4.6 69 75 87 31 25 13 Philippines 9.7 3.2 84 92 92 16 8 8 Thailand 1.8 –0.5 70 79 76 30 21 24
Central Europe Czech Republic 100 98 0 2 Hungary 0.0 15.1 92 92 93 0 8 7 Poland 12.6 9.2 96 74 4 26
Israel 5.7 4.2 Russia 1.5 16.8 Saudi Arabia 4.9 8.1 52 58 70 48 42 30 South Africa 6.9 6.1 46 48 56 54 52 44 Turkey 11.0 8.8 90 95 97 10 5 3
Memo: United States 10.1 3.4 23 17 18 77 83 82 Japan –12.7 0.5 47 Euro area 7.3 3.0 1 Referring to domestic credit to non-banks of commercial banks, other banks (excl central banks) and non-financial institutions (questionnaire) or, if not available, IMF, deposit money banks, (l.22, IFS) and other banking and non-bank financial institutions (l.42, IFS); deflated using annual percentage changes of the consumer price index. Sources: IMF; national data.
34 BIS Papers No 28
Table A2
Sources of finance in emerging markets1
Domestic bank credit
Domestic debt securities
outstanding Stock market capitalisation
Memo: International
financing2
As a percentage of GDP
1999 2005 1999 2005 1999 2005 1999 2005
Latin America Argentina 31 38 15 14 30 36 41 52 Brazil 56 62 55 74 42 61 22 16 Chile 60 77 45 44 93 139 32 30 Colombia 28 41 16 37 13 42 21 19 Mexico 35 28 12 30 32 34 28 16 Peru 26 17 6 11 26 47 17 16 Venezuela 15 12 8 4 30 28
Asia China 130 169 22 33 33 39 3 3 India 51 65 23 41 42 68 4 5 Hong Kong SAR 154 153 27 28 336 448 31 55 Singapore 87 67 44 64 196 158 20 55 Indonesia 59 45 32 19 42 28 22 9 Korea 81 97 60 91 69 82 14 12 Malaysia 161 135 84 90 184 139 23 31 Philippines 62 50 30 42 63 41 32 44 Thailand 133 94 26 48 48 67 19 11
Central Europe Czech Republic 50 41 41 59 22 31 7 18 Hungary 43 52 34 49 34 30 37 47 Poland 35 39 17 40 18 37 9 24
Israel 84 84 38 72 11 16 Russia 31 22 5 4 16 12 Saudi Arabia 44 47 144 153 10 5 South Africa 69 77 51 49 197 223 11 10 Turkey 39 59 24 61 62 44 23 22
Memo: United States 80 92 150 163 150 112 23 45 Euro area 122 154 74 59 Japan 161 150 134 200 104 94 7 9 1 End of period; for 2005, latest available data extrapolated, if necessary. 2 Non-bank cross-border liabilities to BIS reporting banks and international debt securities outstanding. Sources: IMF; International Finance Corporation; Datastream; BIS statistics.

BIS Papers No 28 35
Table A3
Real bank credit to the private sector1
1990-94 1995-99 2000 2001 2002 2003 2004 2000-04 20052
Latin America Argentina 18.8 5.7 –3.1 –16.5 –38.1 –18.5 8.8 –15.0 20.4 Brazil 24.3 0.9 –1.8 1.3 –0.8 4.1 4.4 1.4 19.7 Chile 10.4 8.8 8.0 4.8 6.1 4.5 11.2 6.9 15.1 Colombia 10.0 5.2 –4.3 3.4 4.4 2.3 6.2 2.3 13.3 Mexico 27.6 –11.7 –1.4 –13.6 17.7 –5.7 3.0 –0.5 12.0 Peru 49.3 21.1 –6.8 –4.3 –2.0 –7.0 –3.7 –4.8 9.7 Venezuela –18.9 6.0 11.7 6.4 –25.9 –12.3 75.1 6.2 61.5
Asia India 3.9 6.9 15.9 3.9 17.8 5.7 25.8 13.5 30.0 Hong Kong SAR 5.0 –4.5 –4.5 –1.4 3.4 3.4 6.9 1.5 –6.3 Singapore 10.3 9.6 3.8 17.0 –9.0 4.7 3.1 3.6 2.4 Indonesia 9.7 12.3 15.4 10.8 16.3 5.3 –1.6 9.0 1.5 Korea 9.0 –12.9 8.3 –2.0 8.1 13.1 19.0 9.1 24.5 Malaysia 12.6 4.6 5.2 3.0 3.1 25.0 7.9 12.2 Philippines 12.2 12.3 –0.5 –3.7 –0.7 2.8 0.4 –0.4 –1.3 Thailand 19.2 3.5 –16.9 –10.2 14.4 4.7 2.7 –1.7 0.6
Central Europe Czech Republic –1.2 –10.5 –24.3 3 –9.2 7.1 13.0 –5.7 3 19.8 Hungary –15.6 2.9 19.4 9.1 12.4 24.5 11.9 15.3 2.0 Poland 14.6 7.9 3.7 2.5 6.4 –0.4 4.0 5.1
Israel 9.1 0.8 12.4 9.1 –5.3 –1.4 –9.5 0.7 –7.8 Russia –6.6 27.7 25.2 13.8 27.7 31.3 25.0 31.3 Saudi Arabia 4.0 6.5 7.8 9.3 16.3 34.1 14.4 24.4 South Africa 4.5 7.6 7.7 17.0 –6.6 26.0 7.0 9.7 11.7 Turkey –0.8 8.2 15.7 –31.1 –0.4 15.7 40.4 5.2 20.3
Memo: United States 0.4 5.6 7.8 2.5 2.4 6.4 6.5 5.1 10.9 Japan 0.2 0.5 –1.2 –1.1 –4.7 –3.6 –2.4 –2.6 –0.8 Euro area 2.4 5.5 7.9 5.8 1.7 3.6 4.1 4.6 8.5 China4 10.6 16.0 9.8 9.7 17.7 17.0 8.6 12.5 9.4 1 Annual changes, in per cent; referring to commercial banks (questionnaire). Where data were not available from the questionnaire, they have been taken from IMF, deposit money banks, l.22c+d. 2 Latest available data extrapolated until end-2005, if necessary. 3 Affected by bank restructuring (the Czech Consolidation Bank was removed from the banking system). 4 Credit to the non-government sector. Sources: IMF; national data.

36 BIS Papers No 28
Table A4
Structural bank indicators
Non-performing loans1 Capital asset ratio2 Operating costs3
1999 2004 1999 2004 1999 2004
Latin America Argentina 14.1 18.9 19.7 12.3 4.9 4.5 Brazil 2.7 15.5 18.2 7.4 6.1 Colombia 10.0 3.0 10.8 14.0 10.3 6.0 Mexico 7.7 2.0 16.0 14.1 5.6 4.4 Peru 5.5 1.8 12.0 14.2 5.8 4.7 Venezuela 2.8 0.6 13.3 12.5 10.2 6.3
Asia China 19.0 6.0 1.3 1.1 India 6.1 3.3 11.3 12.9 2.4 2.3 Hong Kong SAR 7.2 2.1 17.8 15.4 Singapore 7.2 2.6 20.9 16.1 Korea 9.2 1.8 12.0 11.8 1.6 1.5 Indonesia 6.6 1.8 –6.7 20.9 2.8 3.2 Malaysia 8.5 6.4 12.8 14.3 1.7 1.5 Philippines 12.3 12.7 15.74 18.4 3.3 3.1 Thailand 32.4 8.5 12.4 13.1 2.1 2.0
Central Europe Czech Republic 14.4 1.4 13.6 12.6 3.6 2.4 Hungary 2.0 2.4 15.0 13.2 5.7 4.3 Poland 6.0 7.7 13.2 15.4 4.3 3.7
Israel 1.0 1.0 9.4 10.8 2.2 2.4 Russia 2.2 0.9 18.1 17.0 6.8 3.9 Saudi Arabia 9.15 3.0 21.2 18.0 Turkey 3.3 2.1 7.0 26.2 5.8 4.1 1 Of commercial banks; as a percentage of total commercial bank assets; for Argentina, as a percentage of total financing; for Brazil, Peru, China, Indonesia, the Czech Republic, Poland and Russia, referring to the major banks, and, for the Philippines and Saudi Arabia, banks’ non-performing loans as a percentage of total bank loans. 2 Bank regulatory capital as a percentage of risk-weighted assets. 3 As a percentage of total assets. 4 Referring to 2001. 5 Referring to 2000. Sources: Fitch; IMF, Global Financial Stability Reports; national data (questionnaire).

BIS Papers No 28 37
References
Agénor, Pierre-Richard, Joshua Aizenman and Alexander Hoffmaister (2000): “The credit crunch in East Asia: what can bank excess liquid assets tell us?”, Policy Research Working Paper, 2483, The World Bank.
Allen, Mark, Christoph Rosenberg, Christian Keller, Brad Setser and Nouriel Roubini (2002): “A balance sheet approach to financial crisis”, IMF Working Paper, wp/02/210.
Bacchetta, Philippe and Stefan Gerlach (1997): “Consumption and credit constraints: international evidence”, Journal of Monetary Economics, 40, 207-38.
Bank for International Settlements (2005): 75th Annual Report.
Barajas, Adolfo and Roberto Steiner (2002): “Credit stagnation in Latin America”, IMF Working Paper, wp/02/53.
Barth, James R, Gerard Caprio Jr and Ross Levin (2002): “Financial regulation and performance: cross-country evidence”, in Leonardo Hernández and Klaus Schmidt-Hebbel (eds), Banking, financial integration, and international crisis, Central Bank of Chile, Santiago, 113-41.
Beck, Thorsten, Asli Demirgüç-Kunt and Vojislav Maksimovic (2003): ”Bank competition, financing obstacles and access to credit”, Policy Research Working Paper, 2996, The World Bank.
Belaisch, Agnes (2003): “Do Brazilian banks compete?”, IMF Working Paper, wp/03/113.
Bernanke, Ben S and Mark Gertler (1995): “Inside the black box: the credit channel of monetary policy transmission”, Journal of Economic Perspectives, 9 (4), 27-48.
Bernanke, Ben S and Cara S Lown (1991): ”The credit crunch”, Brookings Papers on Economic Activity, 2, 205-46.
Borio, Claudio and William White (2004): “Whither monetary and financial stability? The implications of evolving policy regimes”, BIS Working Paper, no 147.
Braun, Mátias and Ricardo Hausmann (2001): “Financial development and credit crunches: Latin America and the World”, mimeo, Harvard University.
Calvo, Guillermo A (1998): “Capital flows and capital-market crises: the simple economics of sudden stop”, Journal of Applied Economics, 1, 35-54.
Cespedes, Luis, Roberto Chang and Andres Velasco (2000): “Balance sheets and exchange rate policy”, NBER Working Paper, 7840.
Colllyns, Charles and Abdelhak Senhadji (2002): ”Lending booms, real estate bubbles and the Asian crises”, IMF Working Paper, wp/02/20.
Committee on the Global Financial System (2005): “Housing finance in the global financial market”, CGFS publication No. 26 (January), Bank for International Settlements, Basel.
Cottarelli, Carlo, Giovanni Dell’Ariccia and Ivanna Valdkova-Hollar (2003): “Early birds, late risers, and sleeping beauties: bank credit growth to the private sector in central and eastern Europe and the Balkans”, IMF Working Paper, wp/03/213.
Dages, B, Linda Goldberg and Daniel Kinney (2000): “Foreign and domestic bank participation in emerging markets: lessons from Mexico and Argentina”, Economic Policy Review, September, Federal Reserve Bank of New York, 17-36.
Debelle, Guy (2004): “Household debt and the macroeconomy”, BIS Quarterly Review, March.
Dell’Ariccia, Giovanni, Enrica Detragiache and Raghuram Rajan (2005): “The real effects of banking crises”, IMF Working Paper, wp/05/63.
Demirgüç-Kunt, Asli and Enrica Detragiache (2005): “Cross-country empirical studies of systemic bank distress”, Policy Research Working Paper, 3719, The World Bank.
Detragiache, Enrica and Poonam Gupta (2004) : “Foreign banks in emerging market crises: evidence from Malaysia”, IMF Working Paper, wp/04/129.
Djankov, Simeon, Caralee McLiesh and Andrei Shleifer (2005): “Private credit in 129 countries”, NBER working Paper, 11078, January.
38 BIS Papers No 28
Domanski, Dietrich (2005): “Foreign banks in emerging market economies: changing players, changing issues”, BIS Quarterly Review, December.
Galindo, Arturo and Fabio Schiantarelli (2003): “Determinants and consequences of financial constraints facing firms in Latin America: an overview”, in Arturo Galinda and Fabio Schiantarelli (eds), Credit constraints and investment in Latin America, Inter-American Development Bank, Washington DC.
Ghosh, Swati R and Atish R Ghosh (1999): “East Asia in the aftermath: was there a crunch?”, IMF Working Paper, wp/99/38.
Glen, Jack and Ajit Singh (2003): “Capital structure, rates of return, and financing corporate growth: comparing developed and emerging markets, 1994-2000”, in Robert Litan, Michale Pomerleano and V Sunderarajan (eds), The future of capital markets in developing countries, Brookings Institutions Press, Washington DC, 373-415.
Goldfajn, Ilan, Ketherine Hennings and Helio Mori (2004): “Brazil’s financial system: resilience to shocks, no currency substitution, but struggling to promote growth”, Working Paper Series, 75, Banco Central do Brasil.
Gourinchas, Pierre-Olivier, Rodrigo Valdés and Oscar Landerretche (2001): “Lending booms: Latin America and the world”, NBER Working Paper, 8249, April.
Gyntelberg, Jacob, Guonan Ma and Eli M Remolona (2005): “Corporate bond markets in Asia”, BIS Quarterly Review, December, 83-93.
Hernández, Leonardo and Oscar Landerretche (2002): “Capital inflows, credit boom and macroeconomic vulnerability: the cross-country experience”, in Hernández and Schmidt-Hebbel (eds), Banking, financial integration and international crises, Central Bank of Chile, 199-233.
Inter-American Development Bank (2002), “Unlocking credit: the quest for deep and stable bank lending”, Chapter 10, Washington DC.
International Monetary Fund (2004a): “Are credit booms in emerging markets a concern?”, World Economic Outlook, Chapter IV, April, 147-65.
——— (2004b): “Emerging markets as net capital exporters”, Global Financial Stability Report, Chapter IV, September, 121-59.
——— (2005): “Corporate finance in emerging markets”, Global Financial Stability Report, April, 92-132.
Jappelli, Tullio and Marco Pagano (2002): “Information sharing, lending and defaults: cross-country evidence”, Journal of Banking and Finance, 26, 2017-45.
Jeanneau, Serge and Carlos Pérez Verdia (2005): “Reducing financial vulnerability: the development of the domestic government bond market in Mexico”, BIS Quarterly Review, December, pp 95-107.
Kuijs, Louis (2005): “Investment and saving in China”, Policy Research Working Paper, 3633, The World Bank.
Lim, Youngjae (2003): “Sources of corporate financing and economic crisis in Korea: a micro-evidence”, NBER Working Paper, 9575, March.
Liping, He and Fan Gang (2002): “Consumer finance in China: recent development trends”, China and World Economy, 6, 12-17.
Mendoza, Enrique G (1995): “The terms of trade, the real exchange rate, and economic fluctuations”, International Economic Review, 36 (1), 101-37.
Mohan, Rakesh (2002): “Transforming Indian banking: in search of a better tomorrow”, valedictory address delivered at Bank Economists’ Conference, Bangalore, December 29, www.rbi.org.
Montiel, Peter J (2000): “What drives consumption booms?”, World Bank Economic Review, 14(3), September, 457-80.
Rajan, Raghuram and Luigi Zingales (1998): “Financial dependence and growth”, American Economic Review, 88 (3), 559-86.
BIS Papers No 28 39
Rath, Dilip, Philip Suttle and Sanket Mohapatra (2003): “Corporate financing patterns and performance in emerging markets”, in Robert Litan, Michale Pomerleano and V Sunderarajan (eds), The Future of Capital Markets in Developing Countries, Brookings Institutions Press, Washington DC, 417-55.
Singh, Anoop, Agnes Belaish, Chares Collyns, Paula de Masi, Reva Kriger, Guy Meredith, and Robert Rennhack (2005): “Stabilisation and reforms in Latin America: a macroeconomc perspective on the experience since the early 1990s”, Occasional Paper, 238, International Monetary Fund.
Stevens, G.R (1997): “Some observations on low inflation and household finances”, Reserve Bank of Australia Bulletin, October, 38-47.
Tovar, Camilo E (2005): “International government debt denominated in local currency: recent developments in Latin America”, BIS Quarterly Review, December, pp 109-18.
Tornell, Aaron and Frank Westermann (2002): “Boom-bust cycles in middle-income countries: facts and explanation”, IMF Staff Papers, 49, 111-55.
Tsatsaronis, Kostas and Haibin Zhu (2004): “What drives housing price dynamics: cross country evidence”, BIS Quarterly Review, March.
Yun, Seong-Hun (2004): “Impact of direct regulations on the Korean credit card market and consumer welfare”, Economic Papers, 7 (1), Bank of Korea, 141-59.