banking on nature 2004: - law professor blogs...
TRANSCRIPT

BANKING ON NATURE 2004:BANKING ON NATURE 2004:
The Economic Benefits to The Economic Benefits to Local Communities Local Communities
ofofNational Wildlife Refuge VisitationNational Wildlife Refuge Visitation
In a world where money counts, the land needs value to give it a voice.─ Frances Cairncross, Costing the Earth
James Caudill, Ph.D.and
Erin Henderson
Division of EconomicsU.S. Fish and Wildlife Service
Washington, DC
September 2005

Table of Contents
Executive Summary...................................................................................................................... iIntroduction................................................................................................................................. 1Glossary..................................................................................................................................... 11Region 1..................................................................................................................................... 13
Ash Meadows National Wildlife Refuge............................................................................14Bandon Marsh National Wildlife Refuge...........................................................................18Columbia National Wildlife Refuge...................................................................................22Deer Flat National Wildlife Refuge.................................................................................... 27Grays Harbor National Wildlife Refuge.............................................................................31Guadalupe-Nipomo Dunes National Wildlife Refuge.........................................................35Humboldt National Wildlife Refuge................................................................................... 40Kealia Pond National Wildlife Refuge...............................................................................44Kern National Wildlife Refuge........................................................................................... 48Kootenai National Wildlife Refuge....................................................................................52Little Pend Oreille National Wildlife Refuge.....................................................................56Lower Klamath National Wildlife Refuge..........................................................................60Malheur National Wildlife Refuge.....................................................................................64Nisqually National Wildlife Refuge...................................................................................68Ridgefield National Wildlife Refuge..................................................................................72Ruby Lake National Wildlife Refuge.................................................................................76Sacramento National Wildlife Refuge................................................................................80Saddle Mountain National Wildlife Refuge........................................................................84Sonny Bono Salton Sea National Wildlife Refuge..............................................................88Stillwater National Wildlife Refuge...................................................................................92Tijuana Slough National Wildlife Refuge..........................................................................96
Region 2................................................................................................................................... 100Balcones Canyonlands National Wildlife Refuge.............................................................101Bill Williams National Wildlife Refuge...........................................................................105Bitter Lake National Wildlife Refuge...............................................................................109Bosque del Apache National Wildlife Refuge..................................................................113Buffalo Lake National Wildlife Refuge............................................................................117Cibola National Wildlife Refuge......................................................................................121Kofa National Wildlife Refuge......................................................................................... 126Maxwell National Wildlife Refuge...................................................................................130Santa Ana National Wildlife Refuge................................................................................134Sequoyah National Wildlife Refuge.................................................................................138Tishomingo National Wildlife Refuge..............................................................................143Washita National Wildlife Refuge.................................................................................... 147
Region 3................................................................................................................................... 151Big Stone National Wildlife Refuge.................................................................................152Crane Meadows National Wildlife Refuge.......................................................................156Mingo National Wildlife Refuge......................................................................................160Neal Smith National Wildlife Refuge...............................................................................164Necedah National Wildlife Refuge...................................................................................168

Ottawa National Wildlife Refuge.....................................................................................172Patoka National Wildlife Refuge...................................................................................... 176Rice Lake National Wildlife Refuge.................................................................................180Seney National Wildlife Refuge.......................................................................................184Sherburne National Wildlife Refuge................................................................................188Squaw Creek National Wildlife Refuge............................................................................192Tamarac National Wildlife Refuge...................................................................................197
Region 4................................................................................................................................... 201Black Bayou Lake National Wildlife Refuge....................................................................202Bon Secour National Wildlife Refuge..............................................................................206Cache River National Wildlife Refuge.............................................................................210Cape Romain National Wildlife Refuge...........................................................................214Chassahowitzka National Wildlife Refuge.......................................................................218Clarks River National Wildlife Refuge.............................................................................222Felsenthal National Wildlife Refuge................................................................................226J. N. Ding Darling National Wildlife Refuge...................................................................230Lower Suwannee National Wildlife Refuge.....................................................................234Okefenokee National Wildlife Refuge..............................................................................238Pea Island National Wildlife Refuge................................................................................243Pee Dee National Wildlife Refuge.................................................................................... 247Piedmont National Wildlife Refuge.................................................................................251Sabine National Wildlife Refuge...................................................................................... 256St. Marks National Wildlife Refuge.................................................................................260Tennessee National Wildlife Refuge................................................................................265Theodore Roosevelt National Wildlife Refuge Complex..................................................270West Tennessee Refuge Complex..................................................................................... 275White River National Wildlife Refuge.............................................................................280
Region 5................................................................................................................................... 284Back Bay National Wildlife Refuge.................................................................................285Blackwater National Wildlife Refuge...............................................................................289Bombay Hook National Wildlife Refuge..........................................................................293Canaan Valley National Wildlife Refuge..........................................................................297Cape May National Wildlife Refuge................................................................................301Edwin B. Forsythe National Wildlife Refuge...................................................................305Erie National Wildlife Refuge..........................................................................................310Great Dismal Swamp National Wildlife Refuge...............................................................314Great Swamp National Wildlife Refuge...........................................................................319Monomoy National Wildlife Refuge................................................................................324Montezuma National Wildlife Refuge..............................................................................328Moosehorn National Wildlife Refuge...............................................................................333Parker River National Wildlife Refuge.............................................................................337Patuxent Research Refuge................................................................................................ 341Prime Hook National Wildlife Refuge.............................................................................345Rachel Carson National Wildlife Refuge..........................................................................349
Region 6................................................................................................................................... 353Arrowwood National Wildlife Refuge..............................................................................354

Audubon National Wildlife Refuge..................................................................................358Bowdoin National Wildlife Refuge..................................................................................362Boyer Chute National Wildlife Refuge.............................................................................366Fort Niobrara National Wildlife Refuge...........................................................................370Lacreek National Wildlife Refuge....................................................................................374Lee Metcalf National Wildlife Refuge..............................................................................378Medicine Lake National Wildlife Refuge.........................................................................382
Region 7................................................................................................................................... 386Alaska Peninsula National Wildlife Refuge......................................................................387Izembek National Wildlife Refuge...................................................................................391Kenai National Wildlife Refuge.......................................................................................395Kodiak National Wildlife Refuge.....................................................................................399Togiak National Wildlife Refuge.....................................................................................403
An Overview of Sample Refuges............................................................................................. 407A National View...................................................................................................................... 411References............................................................................................................................... 413Appendix 1.............................................................................................................................. 416Appendix 2.............................................................................................................................. 422Appendix 3.............................................................................................................................. 429

EXECUTIVE SUMMARY
Banking on Nature 2004: The Economic Benefits of National Wildlife Refuge Visitation to Local Communities
An enormous molten ball shoulders its way up over the edge of the sea, illuminating a golden pathway from the horizon to a lonely beach. The only witnesses are a young couple with an infant who have come to gaze in awe at a piece of the world that still looks much as it did 10,000 years ago. In a small pond behind the sand dunes, a great blue heron patiently stalks a small green frog. A mile inland, two waterfowlers tense in their thatched blind as a small band of surf scoters appear in the distance. And at the opposite end of the sprawling salt marsh, a group of students and teachers gather for a class on wetlands ecology.
National wildlife refuges enrich people in a great variety of ways. Some benefits are relatively easy to quantify─to attach a value to─and some are not. How much does that young couple value their beachfront sunrise? Or the duck hunters their excitement? Can a dollar figure─a price tag, if you will─be attached to people’s dawning understanding of the marvelous workings of the natural world? What’s it worth to maintain and preserve the habitat vital to the survival of the endangered jaguarundi, or any of the other endangered or threatened creatures nurtured by refuges? In today’s increasingly complex society, it is important to be able to discover and clearly express the economic values of things, even such things as human experiences and “existence values” that benefit society as a whole.
The U.S. Fish and Wildlife Service has revised the 1997 report, Banking on Nature: The Economic Benefits to Local Communities of National Wildlife Refuge Visitation to reflect changes in economic and recreational use data used in estimating the economic impacts of refuge recreational use.
This report focuses on final demand, employment, income and tax revenue effects recreational visitors to refuges have on the economies of local regions. In addition to the economic effects of refuge hunting and fishing programs in local communities, it measures the economic impact of “ecotourism,” the relatively recent phenomenon of large numbers of people traveling substantial distances to take part in non-consumptive uses of the natural environment.
Ecotourism is one method to derive economic benefits from the conservation of wildlife and habitat. Many refuges were established to protect waterfowl-hunting opportunities, but as public interests have expanded beyond consuming wildlife to emphasize watching and photographing wildlife, the role of refuges has also evolved. The economic effects of ecotourism are determined to assist refuge planning and to facilitate the interaction of refuges and local communities.
This report has four main sections. An Introduction details the study’s overall rationale, outlines its economic concepts, and describes the methods and data sources used. The second section presents 93 sample refuge descriptions, highlighting the recreational activities enjoyed at each refuge, analyzing the regional economic factors involved, and putting the results of this analysis into perspective. A National View section discusses the overall results for the sample refuges and extrapolates them to a nationwide estimate. Finally, Appendices provide background detail on the economic models used for the refuge estimates and the nationwide aggregation.
i

Banking on Nature: The Economic Benefits to Local Communities of National Wildlife Refuge Visitation
One way to understand the economics of national wildlife refuges is to ask the questions: “If a given refuge did not exist, what would the region’s economy be like? What would life there be like?” The answers involve how people come to acquire things they need or want. For the purposes of this study, those needs/wants are recreational opportunities. There are two elements in the value of any commodity: what you pay for it and the additional benefit you derive from it over and above what you pay for it. Surveys show people are almost always willing to pay more for recreation than they actually spend. Economists call this additional value consumer surplus or net economic value.
Refuge visitors pay for recreation through entrance fees, lodging near the refuge, and purchases from local businesses for items to pursue their recreational experience. This spending generates economic activity throughout the local economy. Some of that money “leaks” out of the local area (thus called “leakage”), and some is recycled through the local economy (the “multiplier effect”). Spending by non-residents must be separated from spending by local refuge visitors. In this study, total visitor spending is evaluated to show its significance to the local economy.
There are two major sources for the information presented in this report: the Fish and Wildlife Service’s National Survey of Fishing, Hunting, and Wildlife-Associated Recreation (NSFHWR) (2002), and the Division of Refuge’s Refuge Management Information System (RMIS) (2004 data). Combining data from these sources creates a profile of refuge visitors’ spending in local communities. Daily visitor expenditures for both residents and non-residents were developed in four categories (food, lodging, transportation, and other expenses) for six activities (freshwater fishing, saltwater fishing, migratory bird hunting, small game hunting, big game hunting, and non-consumptive activities). Visitor days were factored in, and the total expenditures by category of spending for each activity were determined. These expenditures were allocated to industries, and IMPLAN calculated the final effects of these expenditures on the local economies.
This report spotlights each of the sample refuges, giving a brief overview of each refuges' main mission, wildlife, uses, and activity levels. The economy of the local surrounding area is characterized by population growth, employment, and per-capita income. The Regional Economic Analysis section presents findings of 1) Visitor Recreation-Related Expenditures, 2) Economic Effects Associated with Refuge Visitation, and 3) Summary of Economic Effects of Refuge Visitation.
Executive Summary
The National View section concludes by examining how the findings for the 93 sample refuges apply to six of seven U.S. Fish and Wildlife Service geographical regions (Alaska, Hawaii and refuges with less than 1,500 visitors are excluded from the national estimate). The economic analysis of the 93 sample refuges facilitates a look at the big picture: an estimate of the national impact of wildlife refuges on their regional economies. Regression analysis is used to progress from 93 individual refuges to their national implications. It is a statistical procedure that depicts relationships among characteristics of data points. In any group of people, for example, there is a relationship between their heights and their weights. If you know someone’s height, you can use a regression equation to estimate or predict his or her weight. Using the 93 refuges as data points, and factoring in visitation information, refuge location, and other variables, regression analysis yields equations that predict total final demand for all goods, employment income, and jobs generated by visits to each refuge. Many variables affect a refuge’s impact on its local economy. Some relate to the refuge and its public-use program, others to the size of the region’s economy. This report’s National View section reviews the detailed refuge case studies to highlight the differences among the sample refuges.
So, in the final analysis, how important is wildlife refuge-based recreation in the mix of federal outdoor opportunities? The following are some of this study’s findings:
* Recreational visits to national wildlife refuges generate substantial economic activity. In FY 2004, more than 36.7 million people visited refuges for recreation. Their spending generated $1.37 billion of sales in regional economies. As this spending flowed through the economy, nearly 24,000 people were employed and $453.9 million in employment income was generated.
* About 68 percent of total expenditures are generated by non-consumptive activities on refuges. Fishing accounted for 27 percent and hunting 5 percent. Local residents accounted for 17 percent of expenditures while visitors coming from outside the local area accounted for 83 percent.
* Refuge recreational spending generated about $150.7 million in tax revenue at the local, county, state and Federal level.
* Surveys show refuge visitors would have been willing to pay more for their visit than it actually cost them. The difference between what they were willing to pay and what they actually paid is their net economic value or consumer surplus. Visitors enjoyed a consumer surplus of more than $1.1 billion in 2004. Over $680 million of this amount (63 percent of total net economic value) accrued to non-consumptive visitors.
The above results include refuge visitation in the contiguous United States. The case-study results were expanded to encompass the Refuge System in 48 states. Spending and employment by the refuges themselves, payments in lieu of taxes, commercial activities on refuges, and many other economic effects of refuges on local economies were not considered in this analysis.
iii

Introduction
National wildlife refuges provide many services to people. A complete economic analysis of the refuge system would include not only the value of all the forms of recreation enjoyed but also the payrolls of refuge employees and the values of maintaining endangered species, preserving wetlands, educating future generations, and adding stability to our ecosystem. All of these services are of value to society, whether or not they result in some form of market transaction. To understand the economics of refuges, we need to ask not only “What would a region’s economy be like if the refuge did not exist?” but also “What would life be like if the refuge did not exist?”
The last question refers to many aspects of wildlife refuges. As land is preserved in its natural state, a refuge provides services to the ecosystem of which it is a part. Wetlands mitigate flooding, improve water quality, and provide nursery habitat. Trees provide nesting and roosting sites for birds. Many refuges maintain habitat critical for the survival of endangered species. An economic value may be placed on these ecosystem services by considering the cost of providing substitutes for them, such as building diversion dams, artificial settling ponds, and nest sites. However, such an approach can provide only a partial value assessment because it does not account for the value people place on the ecosystem in its natural state. Endangered species are especially valued because of the possibility of their permanent loss. Some people gain value simply from knowing that wild places and unique species still exist. These existence values are difficult to measure empirically.
This report focuses on only one of the values generated by national wildlife refuges: how recreational visitors impact local income and employment. Travel to participate in non-consumptive uses of the natural environment has been called “ecotourism.” It has been promoted as a way to derive economic benefits from the preservation of wildlife and habitat. Many refuges were established to protect waterfowl-hunting opportunities. Ecotourism broadens the mission of refuges.
Because natural sites are drawing increasingly more recreationists, there has been a growing interest in quantifying their impact. Such information can help in refuge planning and decision-making, and facilitate the interaction between refuges and local communities. However, refuge benefits other than recreation also exist (such as habitat preservation) and are more relevant to the National Wildlife Refuge System’s mission. It would be a mistake, for example, to increase recreational opportunities at a refuge at the expense of resource preservation goals just because the added benefits could be measured by the methods used here. This analysis should be seen as only one part of the benefits that the National Wildlife Refuge System provides.
This part of the larger study analyzes the visitation records of 93 sample refuges around the country to estimate the economic role that refuge visitors play in regional economies. The sample refuges are also used to estimate the impact of refuge visitors on regional economies nationwide. Readers interested in a particular refuge not among the samples should be able to find one of these 93 case studies that is comparable to their favorite.
The next section of this Introduction explains some of the economic theory behind benefit estimation and regional impact analysis. The concepts of consumer surplus, household production, leakage, and multipliers are addressed in plain English. Also, a Glossary is included at the end of the Introduction.
1

Banking on Nature: The Economic Benefits to Local Communities of National Wildlife Refuge Visitation
The following section of the Introduction explains the details of how data were collected for this study. It covers selection of sample refuges, gathering of visitation information, data cleaning, and expenditure estimation.
The last section explains how the data are combined to generate estimates of economic activity. The assumptions and limitations of the results are emphasized.
Following the Introduction are 93 Sample Refuge Descriptions, highlighting the activities enjoyed at each one, analyzing the regional economic factors involved, and putting the results of this analysis into perspective. The report’s final section, titled National View, describes how the results for the sample refuges may be used to estimate nationwide effects from refuge visitation and discusses the nationwide estimates. Technical appendices are available that provide background detail on the economic models used for the refuge estimates and the nationwide aggregation.
Recreational Economics
Recreation as a Good
Economics is about the distribution of resources. How do people come to acquire the things they need or want? Be it World Cup soccer tickets or a new species for their life lists of birds, anything people desire can be characterized economically with a dollar value. By knowing the economic cost and value of things, we can compare individuals' choices in one area with their choices in another. Knowing the cost of a home-cooked meal (cost of ingredients, preparation time, etc.) may help explain how to price restaurant meals. Knowing how much people spend on home-cooked meals also tells us about choices in the community. What will people do if food prices rise? If restaurants must pay the minimum wage, what will happen to meal prices, and how high can prices increase before people will choose to eat at home instead? It might be interesting to know the amount of economic activity in a community generated by home cooking. The same can be said about other things such as wildlife refuge recreation.
There are two components to the value of any commodity─what you pay for the commodity and the additional benefit you derive over and above what you paid. If there were no additional benefit, you would most likely not buy it since you could spend your money on an alternative good that would give some additional benefit. Surveys of the general population bear this out: Almost always, respondents are willing to pay more than they are currently paying for recreational opportunities. Economists call the additional benefit consumer surplus (or net economic value) and illustrate it with an individual's demand curve, as shown in Figure 1. The curve shows the price a person would pay for an additional unit of a given good. The person would be willing to pay price R for the first unit of the commodity. Once he has one unit, he would probably be willing to pay somewhat less for the second unit, even less for the third, etc. If he were able to actually buy the good at price P, the person would save the amount ─ the difference between what he’d have been willing to pay and what he actually paid for the first unit. is his consumer surplus for the first unit. Figure 1 shows that at price P, the person would buy 4 units of this good, and would have to pay 4 times P dollars. P times 4 is the area of rectangle A. The commodity’s benefit that the person does not pay for is represented by stepped triangle C. Triangle C is the total consumer surplus for this good.
2
Introduction
The ultimate good consumed is produced by individuals combining their time with purchased inputs to produce something else. A home-cooked meal, for example, requires food bought at the grocery store, gas for the stove, kitchen space, and time. The economic cost of the meal includes all of these inputs to its production. This is called the household production approach. To find the total cost of a meal, an economist must add up the price times the quantity of each input. For inputs that are not traded in markets, such as the time needed to prepare the meal, prices are not available. Prices paid for similar inputs, like a hired maid, may be substituted, or the price for the next best use of the unpriced input (the opportunity cost), like the wage the homemaker could have earned outside the home, can be used to approximate the unknown price.
Recreation is a special kind of good. Recreationists at a refuge pay for their recreation not only in entrance fees but in the costs of traveling and staying near the refuge and taking time away from other activities. In Figure 1, all of the recreationist's costs to obtain recreation compose rectangle A. His recreational enjoyment that is over and above what he pays is triangle C, his consumer surplus.
Time is an unusual good. Spending it, outside of paid work, does not result in a flow of money from one person to another. No one pays you to watch television, for example. Similarly, refuge visitors’ opportunity cost of time, although it is an important component in the cost of recreation, has little to do with the impact of recreation on the local economy. For this reason, the costs of time will not be estimated in this analysis.
Visitors’ spending generates economic activity throughout the local economy. This is only a small part of the benefits visitors receive from traveling to a given area, but it is relatively easy to quantify and important to the regional economy. This analysis will also estimate the consumer surplus derived from refuge recreation to find the total benefits derived from visits to the refuge.
Expenditures and the Regional Economy
It is hard to do anything without spending money and thereby affecting economic activity. Whether it is gas to drive somewhere, feathers with which to tie flies, shotgun ammunition, or movie tickets, something is purchased to pursue the recreational experience. For the regional economy, it matters where the spending comes from. If the expenditure is from outside the region, it generates increased economic
3

Banking on Nature: The Economic Benefits to Local Communities of National Wildlife Refuge Visitation
Thus it is important to separate spending by people from outside the refuge's economic region from spending by those who live locally. Local residents would probably have spent their recreation money in the local economy with or without the refuge. If they couldn't go birding, they might go bowling. In contrast, non-residents may have been attracted to the area by the refuge. They would have gone elsewhere except for its presence, and their spending is a stimulus to the economy. Non-resident spending generates new income and new jobs. It has an economic impact on the region. We evaluate it
Leakage and Multipliers
The one-store town also illustrates the idea of “multipliers” and “leakage” from a regional economy. Each time the employee is paid and spends his income, new income is generated. Whatever the amount of the first purchase, the subsequent purchases add to the employee’s income again. To the employee, it seem like his income is several times his income from the first purchase. This recycling through the local economy is called “the multiplier effect.” The multiplier is the sum of the employee’s income stream divided by his income from the original purchase. In Figure 2, the multiplier is then the total area of the green “Regional Income” rectangles in cycle 2 and later, divided by the area of the Regional Income rectangle in cycle 1. It shows how much local income each dollar of new spending generates as it circulates through the economy.
4
Introduction
Leakage is the local spending that leaves, or leaks out of, the region. In the example, the stock bought from an out-of-town wholesaler is a leakage from the region’s economy. Less leakage implies that more spending stays in the local economy. If there were no leakage at all, the economy would be self-perpetuating and could stay in a steady-state forever. Let’s say the cost of restocking the store in the example was only 1 percent of sales. From $100 in sales, the employee would receive $99. He could spend his income and receive about $98 in wages from his second round of purchases. The original $100 purchase would recycle many times before it all left the economy. Alternatively, say the leakage is large and restocking costs 80 percent of sales. The employee would receive only $20 from the first-round purchase and only $4 in the second round. The multiplier would be very small. Figure 2 illustrates high and low leakage processes.
Leakage and the size of the multiplier depend on the degree to which the local economy provides for its own needs. Different industries have different needs, and so they import varying amounts of inputs from other regions. Thus it is important to identify the commodities that new spending will buy and know where they are manufactured. Most small or rural regions import many products and so have a great deal
of leakage and small multipliers.
Economists use statistics on employment, production, and earnings in the region, as well as information about flows of goods between industries nationwide, to develop estimates of the degree of integration of a regional economy. County-level data is used in this report. Information on larger regions can be assembled by aggregating data from several counties.
Data and Assumptions
Data Sources
Data for this study are compiled from the FWS National Survey of Fishing, Hunting, and Wildlife-Associated Recreation (NSFHWR) and the FWS Refuge Management Information System (RMIS). By combining information from these two sources, a profile of refuge visitors' spending in local communities may be developed. The data are further enhanced with information from refuge staff, regional tourism agencies, and other recreation providers. Refuge officials estimated the average lengths of stay from the activities available and the typical behavior pattern of visitors. This information is used to tally the number of hours visitors spend on a given refuge (usually expressed in recreation visitor days or RVDs) and on the activities in which they participate.
5

Banking on Nature: The Economic Benefits to Local Communities of National Wildlife Refuge Visitation
Every 5 years the Fish and Wildlife Service conducts the NSFHWR, which gathers nationwide information about recreationists, their activities, and their expenses. This Survey is the data source for daily visitor expenditures, which are generated for four categories: food, lodging, transportation, and other expenses (including guide fees, land-use fees, equipment rental, etc.). An input-output computer model called IMPLAN was used to generate the effect of visitors’ spending on the sample 93 refuges’ local economies. (For purposes of this study, a region is defined as the area within 30 miles of a refuge.)
The National Wildlife Refuge System maintains extensive data on public visitation. Nearly all the visitation data used in this study is derived from the RMIS information, which is reported by personnel at each refuge and varies with each refuge’s unique situation. The methods used to collect data vary with each refuge’s unique situation, location, and activities offered. For example, many refuges have tightly controlled hunts. At Las Vegas NWR, for example, goose hunters must register when they arrive and check out when they leave their assigned pit blind. Some refuges collect fees at main entrances. There is only one road into Chincoteague NWR, for example, so virtually everyone who enters can be counted and included in the RMIS data. Refuges with multiple access points or highways through refuge lands cannot count each visitor, so other methods must be adopted to estimate the number of visitors. Three common methods are car counts, foot counts, and parking-lot audits.
Car counts involve counting automobiles that pass some point on refuge roadways. A pneumatic tube attached to a counting device is placed across the road. Sophisticated counters record the time each vehicle crosses, and information is saved in a computer file to be downloaded later. This system facilitates analysis of the time of day of refuge use. Other counters simply record the number of axles crossing the tube and must be read periodically. It is easy to derive the number of vehicles crossing the tube. Observations at each refuge allow estimates to be made of the number of people entering. If a car counter is installed on an auto tour route, clear estimates can be made of the number of people using the route. If the car counter is placed at a foot-trail parking lot, the estimate may represent trail users. If several uses are available at the site, some observation of how many people do each activity may allow the refuge staff to estimate visitation for each use. Foot counters follow the same idea as car counters. Usually they record the number of times a light beam is blocked. These devices are often used at visitor centers and may be used at trail heads.
Many refuges are accessible from public highways. Often visitors simply pull off the roadway to enter the refuge. Refuge personnel know the favorite pull-off points in their area and the activities people may pursue from that location. In hunting season, for example, hunters park along the side of Route 49 at Horicon NWR. Counting these cars and knowing that hunters usually visit in pairs or threes allows the public-use officers to estimate the number of hunters on the refuge. Anglers also have favorite parking spots around the refuge and usually fish alone or in pairs.
Although these methods are somewhat ad hoc they provide the best visitation information available without extensive additional data collection. The raw RMIS figures may provide the only estimate available of total refuge visitation. Because of collection efforts used, the data are not an exact count. However, we believe data-collection bias is small and have used several techniques to generate the most conservative estimates possible.
Sample Selection
The Division of Economics does not have the resources to thoroughly study all 542 refuges. Refuges included in the study were selected by Regional Office refuge supervisors.
6

Introduction
RMIS Data Adjustments
Because RMIS visitor counts are based on several different counting methods, one visitor may be counted several times. If he drives an auto tour route, he may be counted by a car counter. If he stops to walk a trail, a trail counter may count him again. If he goes into the visitor center, a third counter may count him yet again. It is useful for management to understand how many people are using each refuge service, but for economic purposes we would do not want to overestimate a visitor’s impact to the local economy. Thus, each visitor should be counted only once for his or her primary activity.
People pursue many different activities while traveling. Their visit to a national wildlife refuge may be part of a longer trip or just a stop on their way to somewhere else. Urban refuges, such as Don Edwards San Francisco Bay NWR, and refuges along major tourist routes, such as the National Elk Refuge, are particularly likely to have many visitors spending short periods of time on the refuge. Counting these brief visits as full recreation days would vastly overestimate the visitor spending attributable to the refuge. In this study, a full recreational day is considered as eight hours1. Thus, a visitor who spends 4 hours at a refuge has spent half of an RVD, and half of their expenditures for the day will be attributed to the refuge. The average length of time visitors participate in each activity is used to determine the number of RVDs for that activity. If a typical non-consumptive wildlife use day is 4 hours at a particular refuge, the number of RVDs for the refuge would be the number of non-consumptive use visits multiplied by 4/8. Refuge public-use officers estimate the average lengths of stay for each activity available on the refuge and the typical behavior pattern of visitors.
Expenditure and Consumer Surplus Data
Daily expenditure information for this study was extracted from the NSFHWR trip expenditure database (U.S. Department of the Interior et al. 2002). Each respondent who said she or he had participated in an activity was asked about the trips she had taken to pursue the activity in the reporting period. A migratory bird hunter, for example, would be asked in what states he had hunted. For each state a series of questions would reveal how many days he had hunted chiefly for migratory birds and how much he had spent or his share of spending during those days in that state. Respondents were asked to determine expenditures in nine categories which were then aggregated to four categories for analysis. To convert this individual state total to expenditures per day per trip, the total was divided by the number of days the respondent said he had pursued chiefly that activity.
Four CategoriesFood: Food, drink, and refreshmentsLodging: At motels, cabins, lodges, or campgroundsTransportation: Public transportation, including airplanes, buses, and car rentals Round-trip cost of transportation by private vehicleOther: Guide fees Pack trip or package fees Public land-use or access fees
1The U.S. Forest Service considers a recreation day as 12 hours long. However, unlike National Forest activities, almost all refuge uses are daylight activities.
7
Banking on Nature: The Economic Benefits to Local Communities of National Wildlife Refuge Visitation
Private land-use or access fees, not including leases Equipment rental
Respondents were classified as non-residents if their state of residence differed from the state where the activity occurred. Average daily expenditures were calculated for each Fish and Wildlife Service region. Smaller geographic breakdowns left too few respondents in some categories for reliable averages. These expenditure estimates are shown in Appendix 3.
Lodging expenditures appear very low in this data, ranging from $0.47 per day to $36 per day (in the lower 48 states). Often, lodging expenditures are only a few dollars per day. In the NSFHWR, a trip does not necessarily begin at the respondent's residence. If someone were visiting relatives, for example, and spent a day of that visit hunting at a refuge, only the expenditures related to the time spent hunting is included. The trip would be a one day trip from the relatives’ home and would have no lodging costs associated with it, even though the hunter had made an extensive trip away from his home. Hunting would be the primary purpose of the side trip but not of the entire trip away from home. Many people also camp or own recreational vehicles or own hunting cabins and so have minimal lodging costs that may be spread among several individuals.
Estimating the benefits people derive from recreation over and above what they spend─called consumer surplus or net economic value, area C in Figure 1 ─is very difficult. Consumer surplus estimates were derived from a valuation question in the NSFHWR. Bass anglers, for example, were asked this question: “Fishing expenses change over time. For example, gas prices rose dramatically during the 1970s, fell somewhat during the early 1980s, and rose again in the late 1980s. Would you have taken any trips to fish primarily for bass during 1991 if your total bass fishing costs were X dollars more than the amount you just reported?” X was a different random amount for different respondents. The responses were analyzed statistically to estimate values. Though controversial, such methods are often used to derive individuals' willingness to pay for some good that, as explained above, is the heart of consumers' surplus. The aggregate consumer surplus estimates for this study were derived by multiplying the number of RVDs for each activity by the net economic value per day found by the NSFHWR for that activity (Aiken and LaRouche, 2003).
Economic Modeling
Input-Output
Input-output modeling is a statistically and arithmetically demanding task that was not routinely undertaken before the wide availability of computers. In addition to balancing and inverting matrices of numbers, the basic statistics for each area of analysis must be discovered and made consistent. Regional impact analysis has been greatly facilitated by the development of integrated modeling software that contains both consistent databases and appropriate generalized algorithms for computing multipliers and impacts. One of these software tools is IMPLAN (Minnesota IMPLAN Group, Inc., 1998). IMPLAN was developed for the U.S. Forest Service by the University of Minnesota to aid in the forest planning process. It uses regional information to modify a standard input-output framework of the U. S., developed by the Department of Commerce, Bureau of Economic Analysis, to describe local conditions. This study uses IMPLAN to generate the local economic effects from visitors’ spending.
A region (and its economy) is defined as the area within 30 miles of a refuge. IMPLAN is based on county data, so the region is stretched or shrunk to fit the available data. It is important that the region include most of the day-to-day economic activities of nearby residents and likely shopping places of
8

Introduction
refuge visitors. With the counties to be included defined, IMPLAN can calculate the multipliers for each industry.
From the NSFHWR data, daily expenditures were developed in four object categories for six activities for residents and non-residents in each Fish and Wildlife Service region. That provides 12 separate budgets for each region. (These budgets are shown in Appendix 3). Multiplying each budget by the number of visitor days for that activity from the adjusted RMIS data yields the total expenditures by category of spending for each activity. These are totaled and the expenditures are allocated to industries. Food, for example, is allocated 35 percent to restaurants and 65 percent to grocery stores for residents, and 65 percent to restaurants and 35 percent to groceries for non-residents. Transportation is allocated to gas and oil, car repairs, and airline tickets. Total expenditure for each commodity is the input to the IMPLAN model. IMPLAN then works out the amount of leakage and the implied multipliers, direct expenditures, earnings, employment, and output. IMPLAN calculates the direct, indirect, and induced effects of the new expenditure. Direct effects are a measure of leakage─the net amount of the expenditure that stays in the region after the first round of spending. Indirect effects estimate the impact of the expenditures as they cycle through the local economy. Induced effects are a result of changes in employment, population, and income from the new spending. These effects can be summed to show the total effect. In each refuge summary in this study, we report the total effects on final demand, jobs, and job income in thousands of 2004 dollars.
“Final demand” is simply the total spending by the final consumers of all goods. The amount reported is the change in spending by all final consumers in the region attributable to refuge visitation.
IMPLAN’s definition of “jobs” is very broad. For each industry, there is some proportion of output that goes to employee earnings (i.e., job income). In turn, there is some amount of earnings that represents one job. Dividing earnings by the job-cost constant yields an estimate of the number of jobs stimulated by visitors’ spending. In the restaurant industry, for example, 75 percent of sales may go to employee earnings and $15,000 may be equivalent to one job. So $20,000 in sales implies $15,000 in job income, and one job. IMPLAN counts full-time, part-time, temporary, and seasonal jobs equally. Therefore, job income is a better indicator of the employment effects of new spending than the jobs figure IMPLAN generates.
Generating National Estimates
Economic Significance
One goal of this research is to generate estimates of the national impact of refuges on their regional economies. Ideally, an IMPLAN model and the necessary visitation information would be developed for each refuge and the results summed to produce a national estimate. Such a process would be prohibitively expensive. As an alternative, the IMPLAN results from the 93 case studies can be treated as data points. Regression analysis is a statistical procedure that depicts relationships among characteristics of data points. Taking individual people as data points, for example, there is a relationship between their height and their weight. Regression analysis finds an equation that quantifies such relationships. If you know someone’s height, you can use the regression equation to predict his or her weight. Using the 93 sample refuges as data points, and factoring in visitation information and characteristics of the refuge location, regression analysis yields equations that predict (1) final demand, (2) employment income, and (3) jobs generated by visits to each refuge. The total of these refuge estimates is a national estimate. The process is explained in more detail in Appendix 2.
9

Banking on Nature: The Economic Benefits to Local Communities of National Wildlife Refuge Visitation
Several adjustments were made to the data to ensure consistency. The regression equation did not adequately handle refuges that had low visitation or were far from urban areas. To avoid adding these errors to the national results, all refuges with fewer than 1,500 visits and those not located in the continental U.S. were deleted from the calculations. This eliminated about 180 refuges but relatively few visits.
The regression technique produced estimates of final demand, employment income, and jobs created by all visitor spending. Just as predicting someone’s weight from his or her height may not be very reliable, comparison of these predictions with the case-study results showed that the estimates could be very wide of the mark. However, the predicted values were both too high and too low, so it appeared that the deviations would balance each other when applied to groups of refuges. For this reason, only regional and national aggregates are reported.
Net Economic Value
Net Economic Value (consumer surplus) was estimated for the sample refuges by multiplying recreational visitor days by the net economic value for that activity in that state or region. Essentially the same process was followed for the refuges outside the sample. Outside the sample, detailed information was not available on the amount of time spent in each activity on a refuge. This was not a problem for hunting and fishing, as it had been assumed that these were full-day activities for the most part. Non-consumptive use was adjusted to recreational visitor days using the average length of time such visitors stayed at the sample refuges─about 2.8 hours. For states with too few observations to measure the net economic value, the national mean was substituted.
The national estimates and refuge case studies provide a rough scale of the economic significance of refuge recreation to local communities. Whenever other studies were available, we compared those results with our results. In general, our results agree with previous estimates fairly well. These results are broadly descriptive. They are not intended to provide policy direction or performance measures. Refuge management is an imperfect balancing of multiple goals. This report highlights only one component.
10

Glossary
Activity: What visitors do at a refuge. In this study, visitor activities are grouped into hunting, fishing, and non-consumptive uses.
Consumer Surplus: The difference between the total value people receive from the consumption of a particular good and the total amount they pay for the good.
Employment Income (see Job Income)
Final Consumers: The people who finally use the product. Contrast final consumers with intermediate consumers who buy goods in order to sell them again.
Final Demand: The total spending by final consumers on all goods. The amount reported in this study is the change in spending by final consumers in the region attributable to refuge visitation. Final demand includes spending by people who earn income from refuge visitors’ activities as well as spending by refuge visitors themselves.
FWS: U.S. Fish and Wildlife Service
FY: Fiscal Year. The fiscal year is from October 1 to September 30.
Impact: The new economic activity generated in a region as a refuge attracts non-residents to the area. This figure represents economic activity that would be lost if the refuge were not there.
IMPLAN: An economic modeling software package that applies input-output analysis techniques to regional economies.
Job Income: Income to households from labor including wages and salaries. Job income excludes returns to property and proprietorship income.
Leakage: Money lost from a regional economy by payments to suppliers outside the region.
Multiplier: Multipliers show the regional economic effects resulting from changes in final demand for a commodity or group of commodities.
Net Economic Value (see Consumer Surplus)
Non-Consumptive Use: Recreational activities that enjoy wildlife without consuming it, such as birding, photography, picnicking, etc. Non-consumptive use contrasts with consumptive uses such as hunting, trapping, and fishing.
NSFHWR: National Survey of Fishing, Hunting, and Wildlife-Associated Recreation
NWR: National Wildlife Refuge
11

Banking on Nature: The Economic Benefits to Local Communities of National Wildlife Refuge Visitation
Recreational Visitor Day: A unit of measure equal to 1 person spending 1 full day (in this study, 8 hours) recreating at a particular site. RVDs allow comparisons between visitors who stay for only short periods of time and those who stay longer.
Resident/Non-Resident: People living more than 30 miles from the refuges were considered non-residents for this study.
RMIS: Refuge Management Information System
Significance: The total economic activity in a region that is related to a refuge. Significance shows a refuge’s role in the regional economy. The portion of this activity attributable to residents most likely would have occurred in the region anyway and so does not represent an incremental contribution to the regional economy. Contrast significance with impact.
Tax Revenue: Local, county and state taxes: sales tax, property tax, and income tax. Federal taxes: Social Security taxes, excise tax, income tax, corporate profits tax. Note: some taxes may not be applicable in any given region or area.
Visitors: A visitor is someone who comes to the refuge and participates in one or more of the activities available at the refuge.
Visits (visitation): A visit is not the same as a visitor. One visitor could be responsible for several visits on a refuge. For example, if a family of four went fishing in the morning and hiked a short nature trail in the afternoon, they would have contributed 8 activity visits to the refuge; yet, they are only four visitors.
12

Sample Refuges Descriptions
Region 1
Region 1 for the U.S. Fish & Wildlife Service includes California, Hawaii, Nevada, Oregon, and Washington. Sample refuges selected within this region include:
Ash Meadows NWR (Nevada)Bandon Marsh NWR (Oregon)Columbia NWR (Washington)
Deer Flat NWR (Idaho)Grays Harbor NWR (Washington)
Guadalupe-Nipomo Dunes NWR (California)Humboldt NWR (California)Kealia Pond NWR (Hawaii)
Kern NWR (California)Kootenai NWR (Idaho)
Little Pend Oreille NWR (Washington)Lower Klamath NWR (Oregon)
Malheur NWR (Oregon)Nisqually NWR (Washington)Ridgefield NWR (Washington)
Ruby Lake NWR (Nevada)Sacramento NWR (California)
Saddle Mountain NWR (Washington)Sonny Bono Salton Sea NWR (California)
Stillwater NWR (Nevada)Tijuana Slough (California)
13

Banking on Nature: The Economic Benefits to Local Communities of National Wildlife Refuge Visitation
Ash Meadows National Wildlife Refuge
Description
Ash Meadows National Wildlife Refuge is located in southern Nevada 90 miles northwest of Las Vegas. Encompassing over 23,000 acres of wetlands, Ash Meadows is a desert wetland ecosystem providing habitat for at least 25 species found nowhere else in the world.
Thirteen species are endangered or threatened and most depend on the isolated springs and wetlands found here. This concentration of native species is considered to be the greatest of any local area in the United States. Ash Meadows refuge is a unit of the Desert Refuge Complex.
Area Economy
The Ash Meadows NWR is located in Clark and Nye counties in southern Nevada. The area had a population of 1.6 million in 2003, an increase of 74.5 percent from 1993 compared with a 59 percent for the state of Nevada and a 12 percent increase for the U.S. Total area employment increased by 81.7 percent from 1993 to 2003 compared with a 63 percent increase in Nevada and a 18 percent increase in the U.S.
Per capita personal income increased in the area by 9.3 percent from 1993 to 2003. This compares with a 9.8 percent increase in Nevada and a 15.6 percent increase in the U.S.
Table 1-1. Ash Meadows NWR:Summary of Area Economy, 2003
(Population & Employment in 000’s; Per Capita Income in 2004 dollars)
Population Employment Per Capita Income
County 2003
Percent change
1993-2003 2003
Percent change
1993-2003 2003
Percent change
1993-2003
Clark, NV 1,575.4 74.6% 934.6 82.9% $31,797 9.2%
Nye, NV 35.8 72.6% 14.3 27.7% $26,447 12.6%
Area Total 1,611.2 74.5% 948.9 81.7% $31,678 9.3%
Nevada 2,242.2 58.9% 1,347.5 62.6% $32,772 9.8%
United States 290,789.0 11.9% 167,174.4 17.9% $32,322 15.6%
Source: U.S. Department of Commerce 2003.
14

Sample Refuges Descriptions
Activity Levels
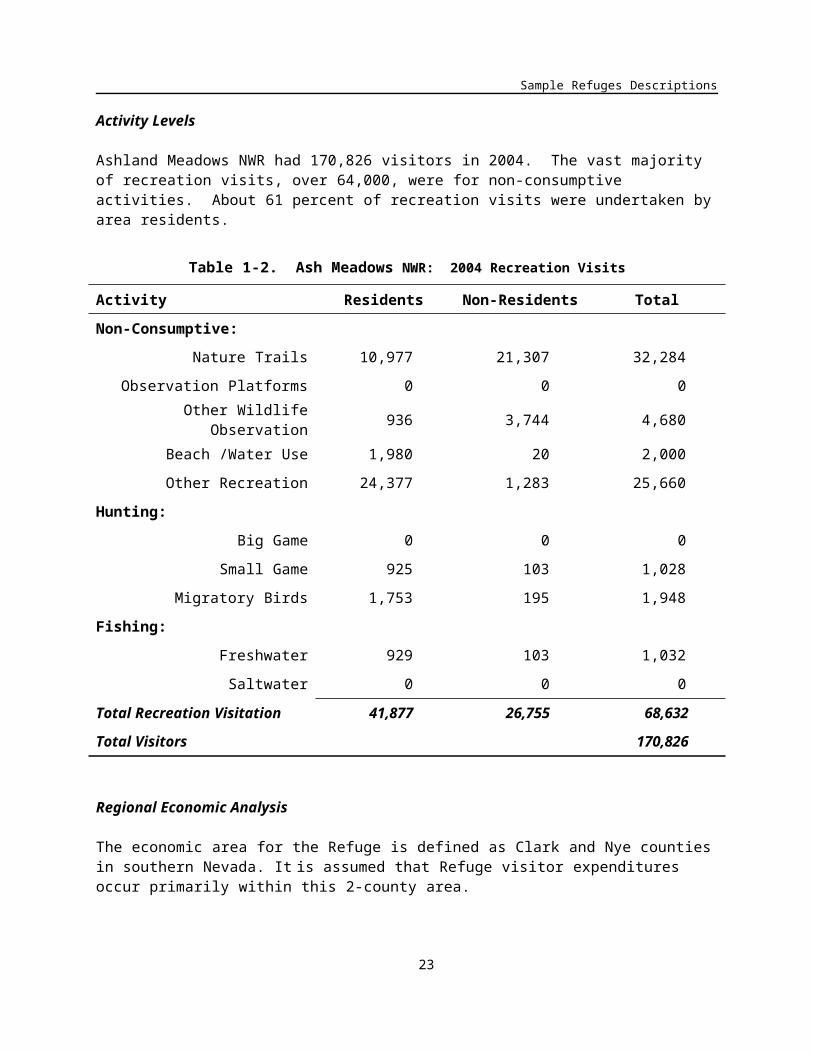
Ashland Meadows NWR had 170,826 visitors in 2004. The vast majority of recreation visits, over 64,000, were for non-consumptive activities. About 61 percent of recreation visits were undertaken by area residents.
Table 1-2. Ash Meadows NWR: 2004 Recreation Visits
Activity Residents Non-Residents Total
Non-Consumptive:
Nature Trails 10,977 21,307 32,284
Observation Platforms 0 0 0
Other Wildlife Observation 936 3,744 4,680
Beach /Water Use 1,980 20 2,000
Other Recreation 24,377 1,283 25,660
Hunting:
Big Game 0 0 0
Small Game 925 103 1,028
Migratory Birds 1,753 195 1,948
Fishing:
Freshwater 929 103 1,032
Saltwater 0 0 0
Total Recreation Visitation 41,877 26,755 68,632
Total Visitors 170,826
Regional Economic Analysis
The economic area for the Refuge is defined as Clark and Nye counties in southern Nevada. It is assumed that Refuge visitor expenditures occur primarily within this 2-county area.
Table 1-3 shows visitor recreation expenditures for the Refuge in 2004. Total expenditures were $2.2 million with non-residents accounting for $1.6 million (72 percent of total expenditures). Expenditures on non-consumptive activities accounted for 93 percent of the total, hunting 4 percent and fishing 3 percent.
15

Banking on Nature: The Economic Benefits to Local Communities of National Wildlife Refuge Visitation
Table 1-3. Ash Meadows NWR: Visitor Recreation Expenditures (2004 $,000)
Activity Residents Non-Residents Total
Non-Consumptive: 551.1 1,536.5 2,087.7
Hunting:
Big Game ─ ─ ─
Small Game 25.1 8.4 33.5
Migratory Birds 39.3 23.7 63.0
Total Hunting 64.4 32.1 96.5
Fishing:
Freshwater 21.5 45.9 67.5
Saltwater ─ ─ ─
Total Fishing 21.5 45.9 67.5
Total Expenditures 637.1 1,614.6 2,251.7
Table 1-4 summarizes the total economic impacts associated with refuge visitor spending. Total final demand was $3,296,500. This is the total monetary value of economic activity generated in the 3-county area by refuge visitor spending. In turn, this final demand generated 28 jobs (both full-time and part-time) with total job income of $915,600. Total tax revenue generated (county, state and Federal) amounted to $399,300.
Table 1-4. Ash Meadows NWR: Local Economic Effects Associated with Recreation Visits (2004 $,000)
Residents Non-Residents Total
Final Demand $931.5 $2,365.0 $3,296.5
Jobs 7.8 19.8 27.6
Job Income $257.9 $657.7 $915.6
Total Tax Revenue $112.0 $287.3 $399.3
Table 1-5 shows total economic effects (total recreation expenditures plus net economic value) compared with the refuge budget for 2004. For an individual, net economic value is that person's total willingness to pay for a particular recreation activity minus his or her actual expenditures for that activity. The figure for economic value is derived by multiplying net economic values for hunting, fishing, and non-consumptive recreation use (on a per-day basis) by estimated refuge visitor days for that activity. This figure is combined with the estimate of total expenditures and divided by the refuge budget for 2004. The $20.75 means that for every $1 of budget expenditures, $20.75 of total economic effects are associated with these budget expenditures. This ratio is provided only for the purpose of broadly
16

Sample Refuges Descriptions
comparing the magnitude of economic effects resulting from refuge visitation to budget expenditures and should not be interpreted as a benefit-cost ratio.
Table 1-5. Ash Meadows NWR: Summary of Local Economic Effects of Recreation Visits (2004 $,000)
FY 2004 Budget
RecreationExpenditures
Net Economic Value
Total economic effects per $1 budget expenditure
Ash Meadows NWR
$180.5 $2,251.7 $1,495.3 $20.75
17

Banking on Nature: The Economic Benefits to Local Communities of National Wildlife Refuge Visitation
Bandon Marsh National Wildlife Refuge
Description
Bandon Marsh Refuge is located along the picturesque southern Oregon coast near the mouth of the Coquille River, and the city of Bandon. There are two units to the Bandon Marsh NWR: Bandon Marsh Unit and Ni-les'tun Unit.
The Bandon Marsh Unit protects the largest remaining tract of salt marsh within the Coquille River estuary. Major habitats include undisturbed salt marsh, mudflat, and Sitka spruce and alder river bank communities. These provide resting and feeding areas for migratory waterfowl, shorebirds, wading birds, neotropical migrants, and raptors. The lower Coquille River estuary provides important habitat for juvenile and adult forms of anadromous fish species found in the lower Coquille River estuary including Coho and Chinook salmon, steelhead, and cutthroat trout. Wildlife observation and study, photography, hunting, fishing, and clamming are permitted public uses.
The Ni-les'tun Unit of the Bandon Marsh NWR was named by Coquille Indian Tribe. Ni-les'tun means "small fish dam in the river," and refers to the numerous fish weirs located on, and adjacent to the site, which were used by Coquille ancestors for capturing fish. This refuge unit is managed as a natural area with no habitat manipulation. Most of the land in the Ni-les'tun Unit is diked lowland pasture and will eventually be restored to tidal marsh, making history as the largest tidal marsh restoration project ever attempted in Oregon. Other habitats of the Ni-les'tun Unit include intertidal marsh, forested wetlands, grasslands, and upland forest.
Area Economy
Bandon Marsh NWR’s economic base includes Coos County, Oregon (Table 1-6). From 1993 to 2003, Coos County’s population increased slightly by 0.2 percent to 63,100. During the same time period, employment increased more rapidly (12.9 percent). The County’s average per capita income ($25,029) is slightly lower than Oregon ($29,499) and the United States ($32,310).
Table 1-6. Bandon Marsh NWR:Summary of Area Economy, 2003
(Population & Employment in 000’s; Per Capita Income in 2004 dollars)
Population Employment Per Capita Income
County 2003
Percent change
1993-2003 2003
Percent change
1993-2003 2003
Percent change
1993-2003
Coos, OR 63.1 0.2% 32.0 12.9% $25,029 13.3%
Area Total 63.1 0.2% 32.0 12.9% $25,029 13.3%
Oregon 3,564.3 16.5% 2,094.7 22.6% $29,499 12.6%
United States 290,789.0 11.9% 167,174.4 17.9% $32,310 15.8%
Source: U.S. Department of Commerce 2003.
18

Sample Refuges Descriptions
Activity Levels
Table 1-7 shows the recreation visits to Bandon Marsh NWR in FY 2004. Refuge visitors enjoyed using the observation platforms (1,689 visits) and hunting migratory birds (180 visits). Visitation was evenly distributed between residents and non-residents.
Table 1-7. Bandon Marsh NWR: 2004 Recreation Visits
Activity Residents Non-Residents Total
Non-Consumptive:
Nature Trails 0 0 0
Observation Platforms 845 845 1,689
Other Wildlife Observation 0 0 0
Beach /Water Use 0 0 0
Other Recreation 0 0 0
Hunting:
Big Game 0 0 0
Small Game 0 0 0
Migratory Birds 90 90 180
Fishing:
Freshwater 0 0 0
Saltwater 0 0 0
Total Visitation 935 935 1,869
Total Visitors 1,470
Regional Economic Analysis
Visitor recreation expenditures totaled $24,700 in FY 2004 (Table1-8). Eighty-four percent of these expenditures ($20,800) are generated by non-residents visiting the refuge.
19

Banking on Nature: The Economic Benefits to Local Communities of National Wildlife Refuge Visitation
Table 1-8. Bandon Marsh NWR: Visitor Recreation Expenditures(2004 $,000)
Activity Residents Non-Residents Total
Non-Consumptive $2.3 $11.8 $14.1
Hunting:
Big Game ─ ─ ─
Small Game ─ ─ ─
Migratory Birds $1.6 $9.0 $10.6
Total Hunting $1.6 $9.0 $10.6
Fishing:
Freshwater ─ ─ ─
Saltwater ─ ─ ─
Total Fishing ─ ─ ─
Total Expenditures $3.9 $20.8 $24.7
Table 1-9 summarizes the total economic effects associated with refuge visitor spending. Total final demand associated with recreational expenditures was about $32,500. This is the total monetary value of economic activity generated in the area economy by recreational visitor spending. In turn, this final demand generated 2 jobs (both full-time and part-time), $11,600 in job income, and $5,700 in tax revenue.
Table 1-9. Bandon Marsh NWR: Local Economic Effects Associated with Recreation Visits (2004 $,000)
Residents Non-Residents Total
Final Demand $5.2 $27.3 $32.5
Jobs 1 1 $2.0
Job Income $1.9 $9.8 $11.6
Total Tax Revenue $0.8 $4.8 $5.7
Table 1-10 summarizes the local economic effects and refuge budget. In FY 2004, recreational benefits totaled $38,100 (recreation-related expenditures plus net economic value). The ratio shows that for every $1 of budget expenditure, $0.09 in recreational benefits are accrued. This ratio is only for the purpose of broadly comparing the magnitude of recreational values and the refuge budget and should not be used as a benefit-cost ratio. In addition to public use, national wildlife refuges provide a variety of goods and services such as providing habitat for wildlife.
20
Sample Refuges Descriptions
Table 1-10. Bandon Marsh NWR: Summary of Local Economic Effects of Recreation Visits (2004 $,000)
FY 2004 Budget
RecreationExpenditure
sNet Economic
ValueTotal economic effects per
$1 budget expenditure
Bandon Marsh NWR
$446.5 $24.7 $13.4 $0.09
21

Banking on Nature: The Economic Benefits to Local Communities of National Wildlife Refuge Visitation
Columbia National Wildlife Refuge
Description
Located in the spectacular Columbia Basin in eastern Washington, Columbia National Wildlife Refuge is a scenic mixture of rugged cliffs, canyons, lakes, and arid sagebrush grasslands that attract migrating and wintering waterfowl, sandhill crane, neotropical migrants, and nesting birds.
The refuge's setting is the geological area known as the Channeled Scablands - an area formed when great glacial floods gouged through basalt layers, leaving distinctive canyons or "channels", rocky buttes, and cliffs. This area, known as the Drumheller Channels, was designated a National Natural Landmark in 1986.
The public use program supports wildlife-oriented activities such as hiking, wildlife viewing/photography, hunting, fishing, boating, and environmental education. The Washington Department of Fish and Wildlife manages the refuge’s fisheries under an approved management plan. In addition, the refuge has an annual spring sandhill crane festival.
Area Economy
Table 1-11 depicts the area economy for Columbia NWR. The refuge is located in Adams, Grant, and Okanogan Counties. Major communities near the refuge include Moses Lake (Grant County), Othello (Adams County), and the Tri-Cities (Benton and Franklin Counties).
From 1993 to 2003, the area population increased 23.1 percent, which was above Washington (16.1 percent) and the United States (11.9 percent). During the same time period, area employment increased 19.4 percent to 185,000. This employment increase was comparable with Washington (19.9 percent) and the United States (19.9 percent). Per capita income decreased in some counties (Adams, Franklin, Grant, and Okanogan), but increased slightly on average (0.7 percent).
22

Sample Refuges Descriptions
Table 1-11. Columbia NWR:Summary of Area Economy, 2003
(Population & Employment in 000’s; Per Capita Income in 2004 dollars)
Population Employment Per Capita Income
County 2003
Percent change
1993-2003 2003
Percent change
1993-2003 2003
Percent change
1993-2003Adams, WA 16.6 11.4% 9.1 11.7% $22,688 -12.3%Benton, WA 153.9 22.9% 85.2 17.7% $30,480 6.5%
Franklin, WA 56.3 31.4% 27.7 23.3% $21,310 -3.2%
Grant, WA 78.8 28.2% 40.0 28.2% $22,335 -6.2%
Okanogan, WA 39.1 10.1% 23.0 11.1% $23,710 -0.6%
Area Total 344.8 23.1% 185.0 19.4% $25,975 0.7%WA 6,131.3 16.1% 3,562.5 19.9% $34,140 17.6%
United States 290,789.0 11.9% 167,174.4 17.9% $32,310 15.8%
Source: U.S. Department of Commerce 2003.
Activity Levels
Recreation visits to Columbia NWR totaled 65,426 in FY 2004 (Table 1-12). Refuge visitors enjoyed a variety of non-consumptive activities, hunting, and fishing. For non-consumptive activities, “other recreation” includes visitors viewing the geology and birds, and “other wildlife observation” includes observing deer, coyotes, and others.
The most popular activities on the refuge were freshwater fishing (33,000 visits) and hiking along the nature trails (21,350 visits). Sixty-nine percent of visits were by people living outside the local area.
23

Banking on Nature: The Economic Benefits to Local Communities of National Wildlife Refuge Visitation
Table 1-12. Columbia NWR: 2004 Recreation Visits
Activity Residents Non-Residents Total
Non-Consumptive:
Nature Trails 5,338 16,013 21,350
Observation Platforms 0 0 0
Other Wildlife Observation 700 6,300 7,000
Beach /Water Use 0 0 0
Other Recreation 239 957 1,196
Hunting:
Big Game 40 40 80
Small Game 150 450 600
Migratory Birds 440 1,760 2,200
Fishing:
Freshwater 13,200 19,800 33,000
Saltwater 0 0 0
Total Visitation 20,107 45,319 65,426
Total Visitors 67,971
Regional Economic Analysis
Expenditures associated with visitor recreation on the refuge totaled nearly $3.8 million (Table 1-13). Non-consumptive activities accounted for 47 percent; fishing activities accounted for 45 percent; and hunting accounted for 8 percent of all expenditures. Expenditures by non-residents totaled $1.6 million
24

Sample Refuges Descriptions
Table 1-13. Columbia NWR: Visitor Recreation Expenditures (2004 $,000)
Activity Residents Non-Residents Total
Non-Consumptive: $95.29 $1,685.63 $1,780.92
Hunting:
Big Game $0.7 $1.8 $2.6
Small Game $4.0 $36.0 $40.0
Migratory Birds $11.3 $245.4 $256.6
Total Hunting $16.0 $283.2 $299.2
Fishing:
Freshwater $400.5 $1,281.5 $1,682.0
Saltwater ─ ─ ─
Total Fishing $400.5 $1,281.5 $1,682.0
Total Expenditures $416.5 $1,564.7 $3,762.2
Table 1-14 summarizes the local economic effects associated with recreation visits at Columbia NWR. Final demand totaled $5.1 million and generated 72 jobs and $1.8 million in job income. Non-residents provided a $4.4 million stimulus to the local economy. These effects represent the monetary value of recreational visitors.
Table 1-14. Columbia NWR: Local Economic Effects Associated with Recreation Visits (2004 $,000)
Residents Non-Residents Total
Final Demand $703.0 $4,446.8 $5,149.8
Jobs 11 61 72
Job Income $250.2 $1,566.7 $1,816.8
Total Tax Revenue $107.0 $727.2 $834.3
Table 1-15 compares the refuge budget for FY 2004 with the total economic effects associated with recreation visits. Government spending for the refuge in FY 2004 was $763,800. Over $6 million in benefits were derived from public use on the refuge. The ratio ($7.97) is only for broadly comparing the magnitude of recreational benefits and the refuge budget and should not be used as a benefit-cost ratio.
25
Banking on Nature: The Economic Benefits to Local Communities of National Wildlife Refuge Visitation
Table 1-15. Columbia NWR: Summary of Local Economic Effects of Recreation Visits (2004 $,000)
FY 2004 Budget
RecreationExpenditures
Net Economic Value
Total economic effects per $1 budget expenditure
Columbia NWR
$763.8 $3,762.2 $2,322.3 $7.97
26

Sample Refuges Descriptions
Deer Flat National Wildlife Refuge
Description
Deer Flat National Wildlife Refuge, established in 1909, is one of the nation's oldest refuges. Located southwest of Boise, Idaho, the refuge includes the Lake Lowell sector (10,588 acres) and the Snake River Islands sector (about 800 acres). Lake Lowell is an irrigation project reservoir that provides an oasis for wildlife in this arid region.
The late-summer drawdown of the lake reveals mud flats that provide food for a variety of resident and migratory wildlife. Historic wintering waterfowl populations averaged over 300,000 birds. This number has now declined to near 100,000. The Snake River Islands (101 islands along 113 miles of river) provide a diversity of habitats from small wetlands to sagebrush uplands. Several islands house heron rookeries and gull colonies, and provide feeding and resting spots for migratory birds. The refuge is popular with the public. Each year, more than 100,000 people visit to hunt, fish, photograph and view wildlife, learn about natural resources through displays and programs at the visitor center, and walk the nature trail.
Area Economy
The area economy for Deer Flat NWR spans a 6-county area covering both Idaho and Oregon. The refuge is located in Canyon, Owyhee, Payette, and Malheur counties, with the economic hub including Ada and Washington counties. Table 1-16 summarizes the area economy in 2003. From 1993 to 2003, the area’s population increased by 37.2 percent while employment increased 40.4 percent. This growth outpaced the increase in Idaho, Oregon, and the United States. With the exception of Ada County, the area’s per capita income is below the average per capita income for the United States.
Table 1-16. Deer Flat NWR:Summary of Area Economy, 2003
(Population & Employment in 000’s; Per Capita Income in 2004 dollars)
Population Employment Per Capita Income
County 2003
Percent change
1993-2003 2003
Percent change
1993-2003 2003
Percent change
1993-2003Ada, ID 325.5 37.6% 237.2 45.5% $36,265 17.5%Canyon, ID 152.0 50.4% 67.7 40.1% $19,818 -3.6%Owyhee, ID 11.1 24.9% 4.1 12.9% $20,170 2.4%
Payette, ID 21.5 19.5% 9.0 22.6% $21,482 16.5%Washington, ID 10.0 10.8% 4.8 12.4% $20,763 6.4%
Malheur, OR 31.4 10.7% 18.0 11.8% $19,359 -8.9%
Area Total 551.5 37.2% 340.7 40.4% $29,588 11.5%Idaho 1,367.0 23.3% 809.6 31.5% $26,592 12.4%Oregon 3,564.3 16.5% 2,094.7 22.6% $29,499 12.6%
United States 290,789.0 11.9% 167,174.4 17.9% $32,310 15.8%Source: U.S. Department of Commerce 2003.
27

Banking on Nature: The Economic Benefits to Local Communities of National Wildlife Refuge Visitation
Activity Levels
Table 1-17 shows the recreation visits to Deer Flat NWR in 2004. For non-consumptive activities, “other recreation” includes picnicking, jogging, biking, boating, water-skiing, and swimming. On the whole, non-consumptive activities were the most popular, with 100,325 visits (79 percent). Visitors also enjoyed hunting (11,280 visits) and freshwater fishing (14,800 visits).
Table 1-17. Deer Flat NWR: 2004 Recreation Visits
Activity Residents Non-Residents Total
Non-Consumptive:
Nature Trails 1,403 122 1,525
Observation Platforms 0 0 0
Other Wildlife Observation 0 0 0
Beach /Water Use 13,580 420 14,000
Other Recreation 76,320 8,480 84,800
Hunting:
Big Game 392 8 400
Small Game 2,548 52 2,600
Migratory Birds 8,032 248 8,280
Fishing:
Freshwater 13,764 1,036 14,800
Saltwater 0 0 0
Total Visitation 116,039 10,366 126,405
Total Visitors 100,193
Regional Economic Analysis
Visitor recreation expenditures are generated from non-consumptive, hunting, and fishing activities. Table 1-18 shows that recreation expenditures for FY 2004 were $2.2 million. The majority of expenditures are attributed to resident expenditures related to non-consumptive activities ($1.2 million).
28

Sample Refuges Descriptions
Table 1-18. Deer Flat NWR: Visitor Recreation Expenditures (2004 $,000)
Activity Residents Non-Residents Total
Non-Consumptive: $1,171.89 $617.22 $1,789.11
Hunting:
Big Game $7.3 $0.4 $7.7
Small Game $25.5 $1.6 $27.0
Migratory Birds $176.5 $29.7 $206.2
Total Hunting $209.3 $31.6 $240.9
Fishing:
Freshwater $156.6 $25.1 $181.8
Saltwater ─ ─ ─
Total Fishing
Total Expenditures
$156.6 $25.1 $181.8
$1,537.8 $674.0 $2,211.8
Table 1-19 summarizes the total economic impacts associated with refuge visitor spending. Total final demand associated with recreational visitor spending was about $3.6 million. This is the total monetary value of economic activity generated in the six county area by recreational visitors. In turn, this final demand generated 50 jobs, nearly $1.2 million in employment income, and $539,000 in total tax revenue for the state and the United States.
Table 1-19. Deer Flat NWR: Local Economic Effects Associated with Recreation Visits (2004 $,000)
Residents Non-Residents Total
Final Demand $2,492.3 $1,058.6 $3,550.9
Jobs 36 14 50
Job Income $842.9 $354.4 $1,197.3
Total Tax Revenue $371.9 $167.6 $539.4
Table 1-20 shows the total economic effects (recreation-related expenditures plus net economic value) compared with the refuge budget. As noted in the introduction, people derive benefits in addition to what they pay for recreation. This consumer surplus for recreational visitors to Deer Flat NWR is estimated to be $2.7 million. For every $1 spent for the refuge, $9.06 in recreational benefits accrued. Thus, this ratio broadly compares the magnitude of public use values and the refuge budget and should not be used as a benefit-cost ratio. All other benefits for the refuge (habitat preservation, etc.) are in addition to this amount.
29

Banking on Nature: The Economic Benefits to Local Communities of National Wildlife Refuge Visitation
Table 1-20. Deer Flat NWR: Summary of Local Economic Effects of Recreation Visits (2004 $,000)
FY 2004 Budget
RecreationExpenditures
Net Economic Value
Total economic effects per $1 budget expenditure
Deer Flat NWR $544.2 $2,211.8 $2,718.4 $9.06
30

Sample Refuges Descriptions
Grays Harbor National Wildlife Refuge
Description
Grays Harbor National Wildlife Refuge is located within Grays Harbor Estuary, at the mouth of the Chehalis River, which makes up the second largest watershed in Washington. It is one of four major staging areas for migrating shorebirds in the Pacific Flyway. Up to one million shorebirds gather here in spring and fall to feed and rest.
Grays Harbor is designated as a Western Hemisphere Shorebird Reserve Network Site, recognizing this internationally-significant shorebird habitat. Although the refuge occupies only two percent of the intertidal habitat of Grays Harbor, it hosts up to 50 percent of the shorebirds that stage in the estuary.
As many as 24 species of shorebirds use Grays Harbor Refuge, with the most abundant species being western sandpiper and dunlin. Semi-palmated plover, least sandpiper, red knot, and black bellied plover are also common during migration. The refuge is also used by peregrine falcon, bald eagle, northern harrier, Caspian tern, great blue heron, songbirds, and a variety of waterfowl.
The accessible boardwalk offers a means to develop and implement interpretation and education programs for the more than one million travelers that pass by each year on their way through the gateway to the Olympic Peninsula.
Area Economy
Table 1-21 shows the area economy for Grays Harbor NWR. Along with the cities of Hoquiam, Aberdeen, and Ocean Shores, the refuge is located in Grays Harbor County, Washington. From 1993 to 2003, the area population increased 5.2 percent to 69,400 people. Area employment increased slightly faster (6.5 percent). In 2003, average per capita income for Grays Harbor was $24,092, which was lower than both Washington State ($34,140) and the United States ($32,310).
Table 1-21. Grays Harbor NWR:Summary of Area Economy, 2003
(Population & Employment in 000’s; Per Capita Income in 2004 dollars)
Population Employment Per Capita Income
County 2003
Percent change
1993-2003 2003
Percent change
1993-2003 2003
Percent change
1993-2003
Grays Harbor, WA 69.4 5.2% 32.3 6.5% $24,092 4.5%
Area Total 69.4 5.2% 32.3 6.5% $24,092 4.5%Washington 6,131.3 16.1% 3,562.5 19.9% $34,140 17.6%
United States 290,789.0 11.9% 167,174.4 17.9% $32,310 15.8%
Source: U.S. Department of Commerce 2003.
Activity Levels
31

Banking on Nature: The Economic Benefits to Local Communities of National Wildlife Refuge Visitation
In FY 2004, there were 21,900 recreation visits to Grays Harbor NWR (Table 1-22). Visitation was equally distributed between visitors enjoying the nature trails and the observation platforms. Sixty percent of visits (13,140) were by people from the local area.
Table 1-22. Grays Harbor NWR: 2004 Recreation Visits
Activity Residents Non-Residents Total
Non-Consumptive:
Nature Trails 6,570 4,380 10,950
Observation Platforms 6,570 4,380 10,950
Other Wildlife Observation 0 0 0
Beach /Water Use 0 0 0
Other Recreation 0 0 0
Hunting:
Big Game 0 0 0
Small Game 0 0 0
Migratory Birds 0 0 0
Fishing:
Freshwater 0 0 0
Saltwater 0 0 0
Total Visitation 13,140 8,760 21,900
Total Visitors 13,450
Regional Economic Analysis
All visitor recreation expenditures were associated with non-consumptive activities (Table 1-23). In FY 2004, expenditures totaled $315,100. Resident expenditures accounted for $70,400, and non-resident expenditures accounted for $244,600.
Table 1-23. Grays Harbor NWR: Visitor Recreation Expenditures (2004 $,000)
Activity Residents Non-Residents Total
32

Sample Refuges Descriptions
Non-Consumptive: $70.4 $244.6 $315.1
Hunting:
Big Game─ ─ ─
Small Game ─ ─ ─
Migratory Birds ─ ─ ─
Total Hunting ─ ─ ─
Fishing:
Freshwater ─ ─ ─
Saltwater ─ ─ ─
Total Fishing ─ ─ ─
Total Expenditures $70.4 $244.6 $315.1
Table 1-24 summarizes the local economic effects associated with recreation visits. In FY 2004, final demand totaled $406,500, which generated 5 jobs and $139,700 in job income. Non-resident expenditures provided a $314,600 stimulus to the local economy.
Table 1-24. Grays Harbor NWR: Local Economic Effects Associated with Recreation Visits (2004 $,000)
Residents Non-Residents Total
Final Demand $91.9 $314.6 $406.5
Jobs 1 4 5
Job Income $31.6 $108.1 $139.7
Total Tax Revenue $14.0 $51.3 $65.3
33

Banking on Nature: The Economic Benefits to Local Communities of National Wildlife Refuge Visitation
In FY 2004, recreational benefits (recreation expenditures plus net economic value) totaled approximately $502,000 for Grays Harbor NWR (Table 1-25). The Fish and Wildlife Service spent $82,400 to operate and maintain the refuge in FY 2003. For every $1 of the refuge budget, $6.09 in recreational benefits were accrued. This ratio broadly compares the magnitude of recreational benefits and the refuge budget and should not be used as a benefit-cost ratio.
Table 1-25. Grays Harbor NWR: Summary of Local Economic Effects of Recreation Visits (2004 $,000)
FY 2004 Budget
RecreationExpenditures
Net Economic Value
Total economic effects per $1 budget expenditure
Grays Harbor NWR
$82.4 $315.1 $186.9 $6.09
34

Sample Refuges Descriptions
Guadalupe-Nipomo Dunes National Wildlife Refuge
Description
The Guadalupe-Nipomo Dunes Refuge is located along the central coast of California, in San Luis Obispo and Santa Barbara Counties. Bordered by the Pacific Ocean to the west and farmland to the east, the refuge encompasses one of the largest coastal dune systems remaining in California.
The refuge is situated in the heart of the Guadalupe-Nipomo Dunes Preserve, a partnership program among Federal, State, and private landowners for the cooperative management of coastal resources. This cooperative effort enables all partners to share limited resources to meet common goals, such as endangered species management and the removal of invasive species that threaten this fragile habitat.
The refuge was established to protect breeding habitat for the endangered California least tern and the threatened western snowy plover. The refuge also provides habitat for other endangered species, including the California tiger salamander (recently listed for protection under the Endangered Species Act), California red-legged frog, Morro blue butterfly, shoulder band dune snail, and 16 rare or endangered plant species.
Other recovering endangered species that use the refuge include large flocks of brown pelicans and a pair of peregrine falcons. The refuge contains healthy populations of mule deer, bobcat, and mountain lion, as well as large flocks of wintering shore birds and waterfowl.
Area Economy
The Guadalupe-Nipomo Dunes NWR is located in San Louis Obispo and Santa Barbara counties along the California coast north of Los Angeles. The area had a population of 656,000 in 2003, an increase of 8.7 percent from 1993. This compares with a 13.4 percent for the state of California and a 12 percent increase for the U.S. Total area employment increased by 22.4 percent from 1993 to 2003 compared with a 19.8 percent increase in California and an 18 percent increase in the U.S.
Per capita personal income increased in the area by 13.7 percent from 1993 to 2003. This compares with a 15.7 percent increase in California and a 15.6 percent increase in the U.S.
35

Banking on Nature: The Economic Benefits to Local Communities of National Wildlife Refuge Visitation
Table 1-26. Guadalupe-Nipomo Dunes NWR:Summary of Area Economy, 2003
(Population & Employment in 000’s; Per Capita Income in 2004 dollars)
Population Employment Per Capita Income
County 2003
Percent change
1993-2003 2003
Percent change
1993-2003 2003
Percent change
1993-2003
Santa Barbara, CA 402.8 6.0% 254.5 17.4% $34,532 9.5%San Louis Obispo, CA 253.1 13.3% 145.9 32.0% $31,044 23.4%Area Total 655.9 8.7% 400.4 22.4% $33,186 13.7%
California 35,462.7 13.4% 19,746.2 19.8% $34,317 15.7%
United States 290,789.0 11.9% 167,174.4 17.9% $32,322 15.6%
Source: U.S. Department of Commerce 2003.
36

Sample Refuges Descriptions
Activity Levels
Guadalupe-Nipomo Dunes NWR had 13,000 total visitors in 2004. Non-consumptive activities accounted for 58 percent of refuge visits while saltwater fishing accounted for 42 percent. Residents accounted for 56 percent of total refuge recreation visits while non-residents accounted for 44 percent.
Table 1-27. Guadalupe-Nipomo Dunes NWR: 2004 Recreation Visits
Activity Residents Non-Residents Total
Non-Consumptive:
Nature Trails 2,450 4,550 7,000
Observation Platforms 0 0 0
Other Wildlife Observation 0 0 0
Beach /Water Use 0 0 0
Other Recreation 0 0 0
Hunting: 0 0 0
Big Game 0 0 0
Small Game 0 0 0
Migratory Birds 0 0 0
Fishing: 0 0 0
Freshwater 0 0 0
Saltwater 4,300 700 5,000
Total Visitation 6,750 5,250 12,000
Total Visitors 13,000
Regional Economic Analysis
The economic area for the Refuge is defined as San Louis Obispo and Santa Barbara counties in California. It is assumed that Refuge visitor expenditures occur primarily within this 2-county area.
Table 1-28 shows visitor recreation expenditures for the Refuge in 2004. Total expenditures were $718,100 with non-residents accounting for $527,300 (73 percent of total expenditures). Expenditures on non-consumptive activities accounted for 40 percent of the total and saltwater fishing accounted for 60 percent.
37

Banking on Nature: The Economic Benefits to Local Communities of National Wildlife Refuge Visitation
Table 1-28. Guadalupe-Nipomo Dunes NWR: Visitor Recreation Expenditures (2004 $,000)
Activity Residents Non-Residents Total
Non-Consumptive: 26.8 259.0 285.7
Hunting:
Big Game ─ ─ ─
Small Game ─ ─ ─
Migratory Birds ─ ─ ─
Total Hunting ─ ─ ─
Fishing: ─ ─ ─
Freshwater ─ ─ ─
Saltwater 164.0 268.3 432.3
Total Fishing 164.0 268.3 432.3
Total Expenditures 190.8 527.3 718.1
Table 1-29 summarizes the total economic impacts associated with refuge visitor spending. Total final demand was $1,138,000. This is the total monetary value of economic activity generated in the 2-county area by refuge visitor spending. In turn, this final demand generated 10 jobs (both full-time and part-time) with total job income of $301,600. Total tax revenue generated (county, state and Federal) amounted to $143,400.
Table 1-29. Guadalupe-Nipomo Dunes NWR: Local Economic Effects Associated with Recreation Visits
(2004 $,000)Residents Non-Residents Total
Final Demand $302.1 $836.0 $1,138.0
Jobs 2.8 7.0 9.9
Job Income $83.0 $218.5 $301.6
Total Tax Revenue $38.0 $105.4 $143.4
38

Sample Refuges Descriptions
Table 1-30 shows total economic effects (total recreation expenditures plus net economic value) compared with the refuge budget for 2004. For an individual, net economic value is that person's total willingness to pay for a particular recreation activity minus his or her actual expenditures for that activity. The figure for economic value is derived by multiplying net economic values for hunting, fishing, and non-consumptive recreation use (on a per-day basis) by estimated refuge visitor days for that activity. This figure is combined with the estimate of total expenditures and divided by the refuge budget for 2004. The $7.99 means that for every $1 of budget expenditures, $7.99 of total economic effects are associated with these budget expenditures. This ratio is provided only for the purpose of broadly comparing the magnitude of economic effects resulting from refuge visitation to budget expenditures and should not be interpreted as a benefit-cost ratio.
Table 1-30. Guadalupe-Nipomo Dunes NWR: Summary of Local Economic Effects of Recreation Visits
(2004 $,000)
FY 2004 Budget
RecreationExpenditures
Net Economic Value
Total economic effects per $1 budget expenditure
Guadalupe-Nipomo Dunes NWR $126.3 $718.0 $291.4 $7.99
39

Banking on Nature: The Economic Benefits to Local Communities of National Wildlife Refuge Visitation
40

Sample Refuges Descriptions
Humboldt National Wildlife Refuge
Description
Humboldt Bay National Wildlife Refuge is located on Humboldt Bay, on the coast of northwestern California. The refuge exists primarily to protect and enhance wetland habitats for migratory water birds using the bay area, including tens of thousands of shorebirds, ducks, geese, swans, and black brant.
During the spring, the bay's eelgrass beds are a key staging area for brant prior to their return to Arctic nesting grounds; and the refuge grasslands provide important habitat for thousands of Aleutian Canada geese. Like many of the refuges in the system, this one was established to preserve habitats recognized to be instrumental to the perpetual survival of migratory birds and other wildlife.
Humboldt Bay NWR, along with other public and private lands around Humboldt Bay, helps this area remain one of the key points for the millions of migratory birds that rely on the Pacific Flyway. More than 200 bird species, including 80 kinds of water birds and four endangered species, regularly feed, rest, or nest on the refuge or other areas around the bay.
The bay provides habitat for approximately 100 species of fish, many of which contribute to sport or commercial fisheries, and provides habitat for steelhead, Coho, and Chinook salmon. The refuge also administers the Lanphere Dunes Unit and Castle Rock National Wildlife Refuge.
Area Economy
The economic base for the refuge is defined as Humboldt County in northern California. It is assumed that most of the visitor expenditures take place within this area. Table 1-31 summarizes the area economy in 2003. From 1993 to 2003, total population increased 3.0 percent while employment increased 14.3 percent. Humboldt County is increasing at a slower rate than both California and the United States. Furthermore, the per capita income for Humboldt County is $25,558 while per capita income for the United States is $32,310.
Table 1-31. Humboldt NWR:
Summary of Area Economy, 2003(Population & Employment in 000’s; Per Capita Income in 2004 dollars)
Population Employment Per Capita Income
County 2003
Percent change
1993-2003 2003
Percent change
1993-2003 2003
Percent change
1993-2003Humboldt, CA 127.9 3.0% 70.8 14.3% $25,558 11.6%Area Total 127.9 3.0% 70.8 14.3% $25,558 11.6%California 35,462.7 13.4% 19,746.2 19.8% $34,305 15.9%United States 290,789.0 11.9% 167,174.4 17.9% $32,310 15.8%
Source: U.S. Department of Commerce 2003.
41

Banking on Nature: The Economic Benefits to Local Communities of National Wildlife Refuge Visitation
Activity Levels
Table 1-32 shows the recreation visits at Humboldt NWR in FY 2004. Refuge visitors enjoyed a variety of non-consumptive activities, migratory bird hunting, and saltwater fishing. For non-consumptive activities, “other recreation” includes wildlife photography. Visits totaled 21,845, with residents accounting for 60 percent of the visits (13,082 visits).
Table 1-32. Humboldt NWR: 2004 Recreation Visits
Activity Residents Non-Residents Total
Non-Consumptive:Nature Trails 10,797 7,198 17,995
Observation Platforms 600 400 1,000
Other Wildlife Observation 0 0 0
Beach /Water Use 0 0 0
Other Recreation 1,100 1,100 2,200
Hunting:Big Game 0 0 0
Small Game 0 0 0
Migratory Birds 540 60 600
Fishing:Freshwater 0 0 0
Saltwater 45 5 50
Total Visitation 13,082 8,763 21,845
Total Visitors 28,995
Regional Economic Analysis
Table 1-33 shows recreation-related expenditures at Humboldt NWR in 2004. Resident expenditures were $75,400 while non-resident expenditures were $247,800. Non-consumptive expenditures accounted for 96 percent of expenditures ($309,900).
42

Sample Refuges Descriptions
Table 1-33. Humboldt NWR: Visitor Recreation Expenditures (2004 $,000)
Activity Residents Non-Residents Total
Non-Consumptive: $67.0 $242.9 $309.9
Hunting:
Big Game 0 0 0
Small Game 0 0 0
Migratory Birds $7.9 $4.8 $12.7
Total Hunting $7.9 $4.8 $12.7
Fishing:
Freshwater 0 0 0
Saltwater $0.6 $0.1 $0.7
Total Fishing $0.6 $0.1 $0.7
Total Expenditures $75.4 $247.8 $323.2
Table 1-34 shows the economic effects associated with recreation visits and refuge visitor spending in 2004. While total final demand was about $480,000, non-resident visitor spending provided a $367,000 stimulus to the local economy. The non-resident visitor spending generated 5 jobs, and resident visitor spending generated 2 jobs.
Table 1-34. Humboldt NWR: Local Economic Effects Associated with Recreation Visits (2004 $,000)
Residents Non-Residents Total
Final Demand $113.4 $367.0 $480.4
Jobs 2 5 7
Job Income $37.7 $121.8 $159.5
Total Tax Revenue $16.1 $55.8 $71.9
Table 1-35 summarizes the local economic effects compared with the refuge budget. In FY 2004, recreational benefits totaled $521,300. While the ratio of economic value to budget is small ($0.61), the refuge provides additional benefits such as providing important habitat for migratory birds and fish. This ratio broadly compares the recreational benefits to the refuge budget and should not be used as a benefit-cost ratio.
43
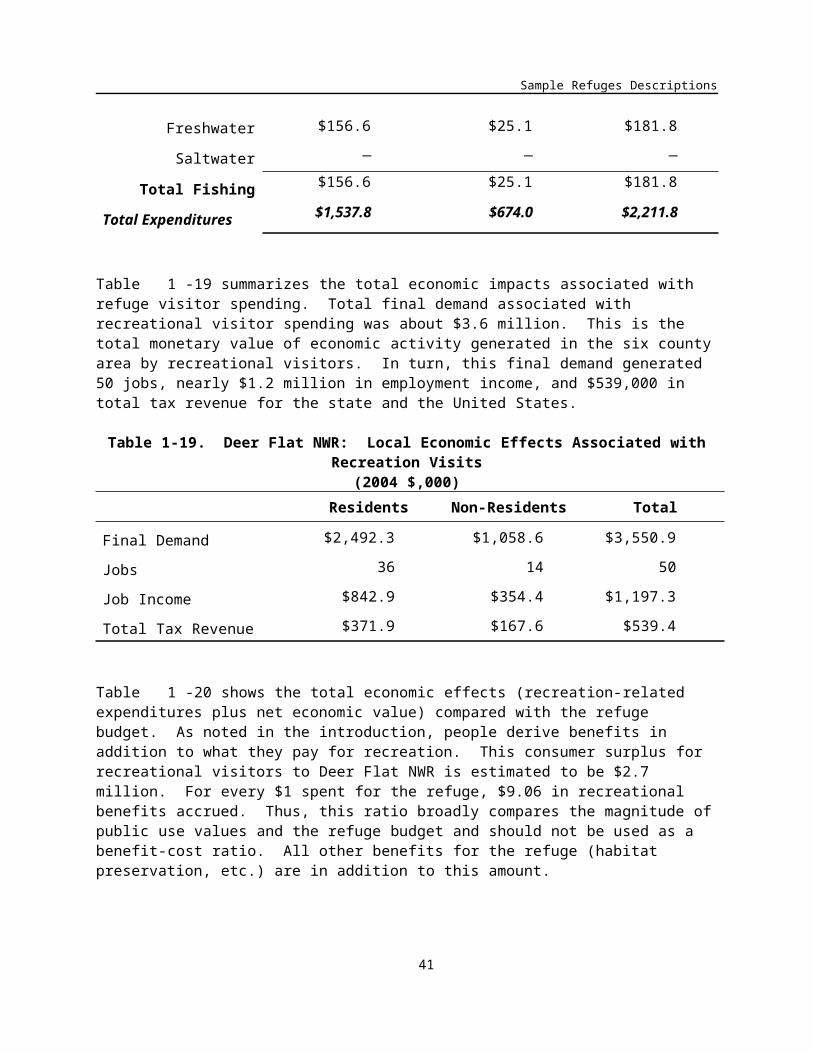
Banking on Nature: The Economic Benefits to Local Communities of National Wildlife Refuge Visitation
Table 1-35. Humboldt NWR: Summary of Local Economic Effects of Recreation Visits (2004 $,000)
FY 2004 Budget
RecreationExpenditures
Net Economic Value
Total economic effects per $1 budget expenditure
Humboldt NWR
$859.5 $323.2 $198.1 $0.61
44

Sample Refuges Descriptions
Kealia Pond National Wildlife Refuge
Description
Kealia Pond National Wildlife Refuge is one of the few natural wetlands remaining in the Hawaiian Islands. Located along the south central coast of the island of Maui between the towns of Kihei and Ma'alaea, this 691-acre wetland is home to the endangered Hawaiian coot (ae'o) and Hawaiian coot ('alae ke oke'o). The refuge is adjacent to Kealia Beach, which is a nesting ground for the endangered hawksbill turtle.
Kealia Pond serves as a settling basin a 56-square mile watershed that results in seasonal intermittent flooding during winter months and dryer conditions during late summer months. This creates open water (200 acres) and shallow mud flat areas interspersed with vegetation, which provide suitable resting, feeding, and nesting habitat for endangered water birds. During certain times of the year, the refuge supports at least half of the Hawaiian stilt population.
The pond also supports a diverse assemblage of migratory birds from late summer to early spring. It is one of the most important areas in the state for wintering migratory waterfowl. Migratory shorebirds also congregate here to take advantage of the food resources along the water's edge. As water recedes, fish are crowded into the remaining water, making them easy prey for 'auku'u (black-crowned night herons).
Approximately 2,700 people visit the refuge each year to engage in various wildlife-oriented activities, including bird watching, photography, environmental education, habitat restoration projects that involve removal of exotic species, and outplanting with Hawaii's native vegetation.
Area Economy
Table 1-36 depicts the area economy for Kealia Pond NWR. The area population increased by 21.4 percent from 1993 to 2003. During the same time period, the Hawaii population increased by 6.5 percent and the U.S. population increased by 11.9 percent. Maui County’s per capita income ($28,037) is slightly below the per capita incomes for Hawaii ($31,252) and the United States ($32,310).
Activity Levels
Table 1-37 shows the recreation visits to Kealia Pond NWR in 2004. Visitors enjoyed the nature trails offered at the refuge (2,358 visits). The majority of visitors (1,721) were non-residents, mainly from the contiguous United States.
45

Banking on Nature: The Economic Benefits to Local Communities of National Wildlife Refuge Visitation
Table 1-36. Kealia Pond:Summary of Area Economy, 2003
(Population & Employment in 000’s; Per Capita Income in 2004 dollars)
Population Employment Per Capita Income
County 2003
Percent change
1993-2003 2003
Percent change
1993-2003 2003
Percent change
1993-2003
Maui, HI 135.9 21.4% 89.1 20.9% $28,037 -0.8%
Area Total 135.9 21.4% 89.1 20.9% $28,037 -0.8%
Hawaii 1,248.8 6.5% 789.7 5.5% $31,252 -2.6%
United States 290,789.0 11.9% 167,174.4 17.9% $32,310 15.8%
Source: U.S. Department of Commerce 2003.
Table 1-37. Kealia Pond NWR: 2004 Recreation Visits
Activity Residents Non-Residents Total
Non-Consumptive:
Nature Trails 637 1,721 2,358
Observation Platforms 0 0 0
Other Wildlife Observation 0 0 0
Beach /Water Use 0 0 0
Other Recreation 0 0 0
Hunting:
Big Game 0 0 0
Small Game 0 0 0
Migratory Birds 0 0 0
Fishing:
Freshwater 0 0 0
Saltwater 0 0 0
Total Visitation 637 1,721 2,358
Total Visitors 2,418
46

Sample Refuges Descriptions
Regional Economic Analysis
Table 1-38 shows visitor recreation expenditures for the refuge during FY 2004. All expenditures are related to non-consumptive activities. Non-residents contributed $72,100, and residents contributed $5,100 to the area economy.
Table 1-38. Kealia Pond NWR: Visitor Recreation Expenditures (2004 $,000)
Activity Residents Non-Residents Total
Non-Consumptive: $5.1 $72.1 $77.2
Hunting:
Big Game ─ ─
Small Game ─ ─ ─
Migratory Birds ─ ─ ─
Total Hunting ─ ─ ─
Fishing:
Freshwater ─ ─ ─
Saltwater ─ ─ ─
Total Fishing ─ ─ ─
Total Expenditures $5.1 $72.1 $77.2
Table 1-39 summarizes the economic effects due to recreation visits at Kealia Pond NWR in FY 2004. Total final demand associated with recreation visits is approximately $103,000. Non-resident expenditures provided a $96,000 stimulus to the region’s economy.
Table 1-39. Kealia Pond NWR: Local Economic Effects Associated with Recreation Visits (2004 $,000)
Residents Non-Residents Total
Final Demand $6.9 $95.8 $102.7
Jobs 1 1 2
Job Income $2.4 $32.4 $34.8
Total Tax Revenue $1.6 $22.0 $23.6
Table 1-40 compares the total recreational benefits with Kealia Pond NWR’s budget. For every $1 of budget expenditures, about $0.23 is derived in recreational benefits (both expenditures and net economic value). This ratio is provided only for the purpose of broadly comparing the magnitude of the economic effects from recreational visitation to budget expenditures and should not be used as a benefit-cost ratio.
47

Banking on Nature: The Economic Benefits to Local Communities of National Wildlife Refuge Visitation
In addition to recreational benefits, the refuge also provides other benefits such as habitat preservation for endangered birds. Furthermore, the refuge budget also contributes to the regional economy as both payrolls and other expenses.
Table 1-40. Kealia Pond NWR: Summary of Local Economic Effects of Recreation Visits (2004 $,000)
FY 2004 Budget
RecreationExpenditures
Net Economic Value
Total economic effects per $1 budget expenditure
Kealia Pond NWR
$466.2 $77.2 $30.2 $0.23
48
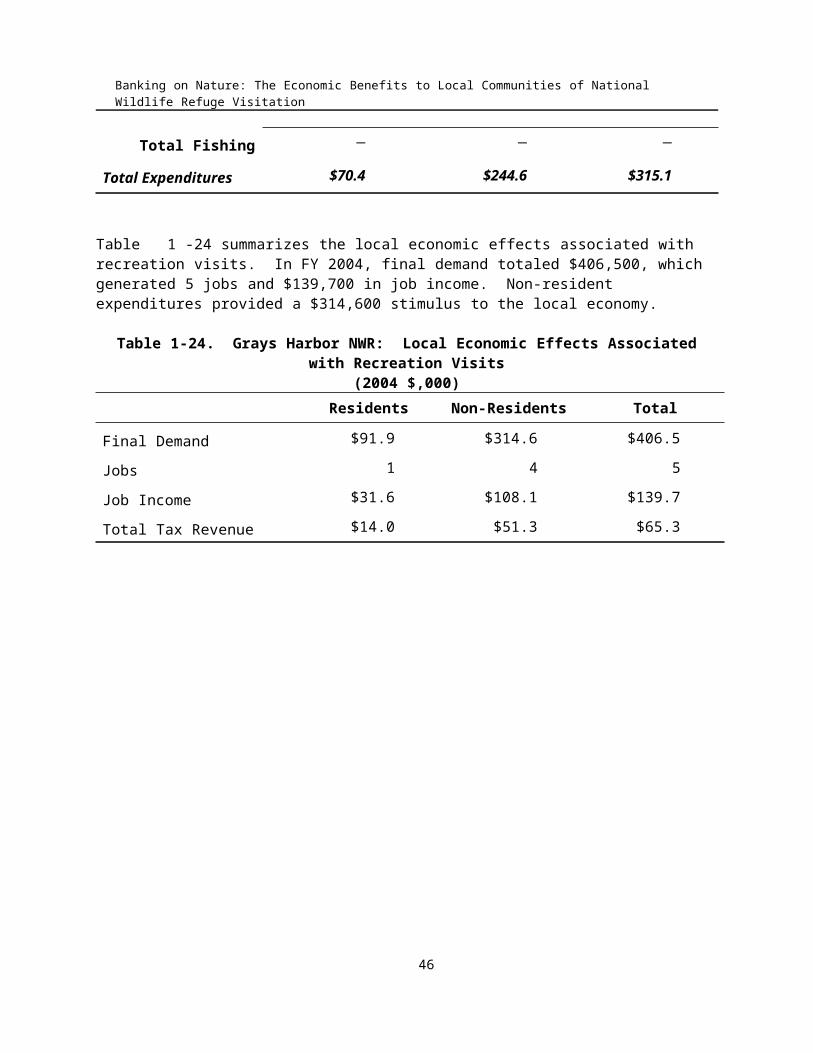
Sample Refuges Descriptions
Kern National Wildlife Refuge
Description
Kern National Wildlife Refuge is located in the southern portion of California's San Joaquin Valley, 20 miles west of the city of Delano. Situated on the southern margin of what was once the largest freshwater wetland complex in the western United States, Kern Refuge provides optimum wintering habitat for migratory birds with an emphasis on waterfowl and water birds.
Through restoration and maintenance of native habitat diversity, the refuge also provides suitable habitat for several endangered species as well as preserving a remnant example of the historic valley uplands in the San Joaquin Desert.
Area Economy
The Kern NWR is located in Kern County in east-central California. Tulare County is a major economic hub adjacent to Kern County. The area had a population of 1.1 million in 2003, an increase of 17.6 percent from 1993 compared with a 13.4 percent for the state of California and a 12 percent increase for the U.S. Total area employment increased by 22.7 percent from 1993 to 2003 compared with a 19.8 percent increase in California and an 17.9 percent increase in the U.S.
Per capita personal income increased in the area by 4.4 percent from 1993 to 2003. This compares with a 15.7 percent increase in California and a 15.6 percent increase in the U.S.
Table 1-41. Kern NWR:Summary of Area Economy, 2003
(Population & Employment in 000’s; Per Capita Income in 2004 dollars)
Population Employment Per Capita Income
County 2003
Percent change
1993-2003 2003
Percent change
1993-2003 2003
Percent change
1993-2003
Kern, CA 713.4 18.9% 329.8 24.4% $23,600 3.5%
Tulare, CA 391.1 15.3% 181.0 19.6% $22,000 6.2%
Area Total 1,104.5 17.6% 510.8 22.7% $23,000 4.4%
California 35,462.7 13.4% 19,746.2 19.8% $34,317 15.7%
United States 290,789.0 11.9% 167,174.4 17.9% $32,322 15.6%
Source: U.S. Department of Commerce 2003.
Activity Levels
Kern NWR had 7,600 visitors in 2004. Migratory bird hunting accounted for 54 percent of total visits while non-consumptive activities accounted for 46 percent. About 61 percent of recreation visits were undertaken by area residents. Residents accounted for 52 percent of total refuge recreation visits and non-residents accounted for 48 percent.
49

Banking on Nature: The Economic Benefits to Local Communities of National Wildlife Refuge Visitation
Table 1-42. Kern NWR: 2004 Recreation Visits
Activity Residents Non-Residents Total
Non-Consumptive:
Nature Trails 1,540 660 2,200
Observation Platforms 0 0 0
Other Wildlife Observation 0 0 0
Beach /Water Use 0 0 0
Other Recreation 288 72 360
Hunting:
Big Game 0 0 0
Small Game 0 0 0
Migratory Birds 1,037 1,926 2,963
Fishing:
Freshwater 0 0 0
Saltwater 0 0 0
Total Visitation 2,865 2,658 5,523
Total Visitors 7,600
Regional Economic Analysis
The economic area for the Refuge is defined as Kern and Tulare counties in California. It is assumed that Refuge visitor expenditures occur primarily within this 2-county area.
Table 1-43 shows visitor recreation expenditures for the Refuge in 2004. Total expenditures were $475,800 with non-residents accounting for $422,100 (89 percent of total expenditures). Expenditures on non-consumptive activities accounted for 10 percent of the total and hunting 90 percent.
50

Sample Refuges Descriptions
Table 1-43. Kern NWR: Visitor Recreation Expenditures (2004 $,000)
Activity Residents Non-Residents Total
Non-Consumptive: 15.0 31.2 46.2
Hunting:
Big Game ─ ─ ─
Small Game ─ ─ ─
Migratory Birds 38.7 390.8 429.5
Total Hunting 38.7 390.8 429.5
Fishing:
Freshwater ─ ─ ─
Saltwater ─ ─ ─
Total Fishing ─ ─ ─
Total Expenditures 53.7 422.1 475.8
Table 1-44 summarizes the total economic impacts associated with refuge visitor spending. Total final demand was $739,400. This is the total monetary value of economic activity generated in the 3-county area by refuge visitor spending. In turn, this final demand generated 6 jobs (both full-time and part-time) with total job income of $184,200. Total tax revenue generated (county, state and Federal) amounted to $98,900.
Table 1-44. Kern NWR: Local Economic Effects Associated with Recreation Visits (2004 $,000)
Residents Non-Residents Total
Final Demand $81.8 $657.6 $739.4
Jobs 0.8 5.6 6.4
Job Income $21.3 $162.9 $184.2
Total Tax Revenue $10.3 $88.6 $98.9
51

Banking on Nature: The Economic Benefits to Local Communities of National Wildlife Refuge Visitation
Table 1-45 shows total economic effects (total recreation expenditures plus net economic value) compared with the refuge budget for 2004. For an individual, net economic value is that person's total willingness to pay for a particular recreation activity minus his or her actual expenditures for that activity. The figure for economic value is derived by multiplying net economic values for hunting, fishing, and non-consumptive recreation use (on a per-day basis) by estimated refuge visitor days for that activity. This figure is combined with the estimate of total expenditures and divided by the refuge budget for 2004. The $0.77 means that for every $1 of budget expenditures, $0.77 of total economic effects are associated with these budget expenditures. This ratio is provided only for the purpose of broadly comparing the magnitude of economic effects resulting from refuge visitation to budget expenditures and should not be interpreted as a benefit-cost ratio.
Table 1-45. Kern NWR: Summary of Local Economic Effects of Recreation Visits (2004 $,000)
FY 2004 Budget
RecreationExpenditures
Net Economic Value
Total economic effects per $1 budget expenditure
Kern NWR $926.7 $475.8 $238.2 $0.77
52

Sample Refuges Descriptions
Kootenai National Wildlife Refuge
Description
Kootenai National Wildlife Refuge is located in Idaho's Panhandle approximately 20 miles south of the Canadian border and 5 miles west of Bonners Ferry, Idaho. This 2,774 acre refuge was established in 1965, primarily to provide important habitat and a resting area for migrating waterfowl. The Refuge is comprised of a wide variety of habitat types. Wetlands, meadows, riparian forests and cultivated agricultural fields (for producing valuable wildlife food crops) are interspersed in the valley bottom adjacent to the west banks of the Kootenai River. Wetlands include open-water ponds, seasonal cattail-bulrush marshes, tree-lined ponds and rushing creeks. The western portion of the refuge ascends the foothills of the scenic Selkirk Mountains which consists of dense stands of coniferous trees and tranquil riparian forests.
Over 300 different species of wildlife can be found on Kootenai National Wildlife Refuge, indicating the richness and diversity this area holds. The refuge not only serves as valuable habitat for resident and migratory wildlife, but provides a nice stopping point for visitors to get out and enjoy some of the vast natural beauty Boundary County has to offer. The refuge receives approximately 20,000 visitors annually; bringing together people from all nationalities and different backgrounds for the enjoyment of our Nation's natural wildlife resources.
Area Economy
Table 1-46 summarizes the area economy for Kootenai NWR. In addition to being where the refuge is located, Boundary County also includes the economic hub of the area, Bonners Ferry. From 1993 to 2003, the county’s population increased 14.1 percent to 10,200 people. While this rate of increase is slightly higher than the United States (11.9 percent), it is below Idaho (23.3 percent). During the same time period, area employment increased 26.4 percent compared with Idaho (31.5 percent) and the United States (17.9 percent). In 2003, the average per capita income for Boundary County was $19,036.
Table 1-46. Kootenai NWR:Summary of Area Economy, 2003
(Population & Employment in 000’s; Per Capita Income in 2004 dollars)
Population Employment Per Capita Income
County 2003
Percent change
1993-2003 2003
Percent change
1993-2003 2003
Percent change
1993-2003Boundary, ID 10.2 14.1% 5.2 26.4% $19,036 8.2%Area Total 10.2 14.1% 5.2 26.4% $19,036 8.2%Idaho 1,367.0 23.3% 809.6 31.5% $26,592 12.4%
United States 290,789.0 11.9% 167,174.4 17.9% $32,310 15.8%
Source: U.S. Department of Commerce 2003.
53
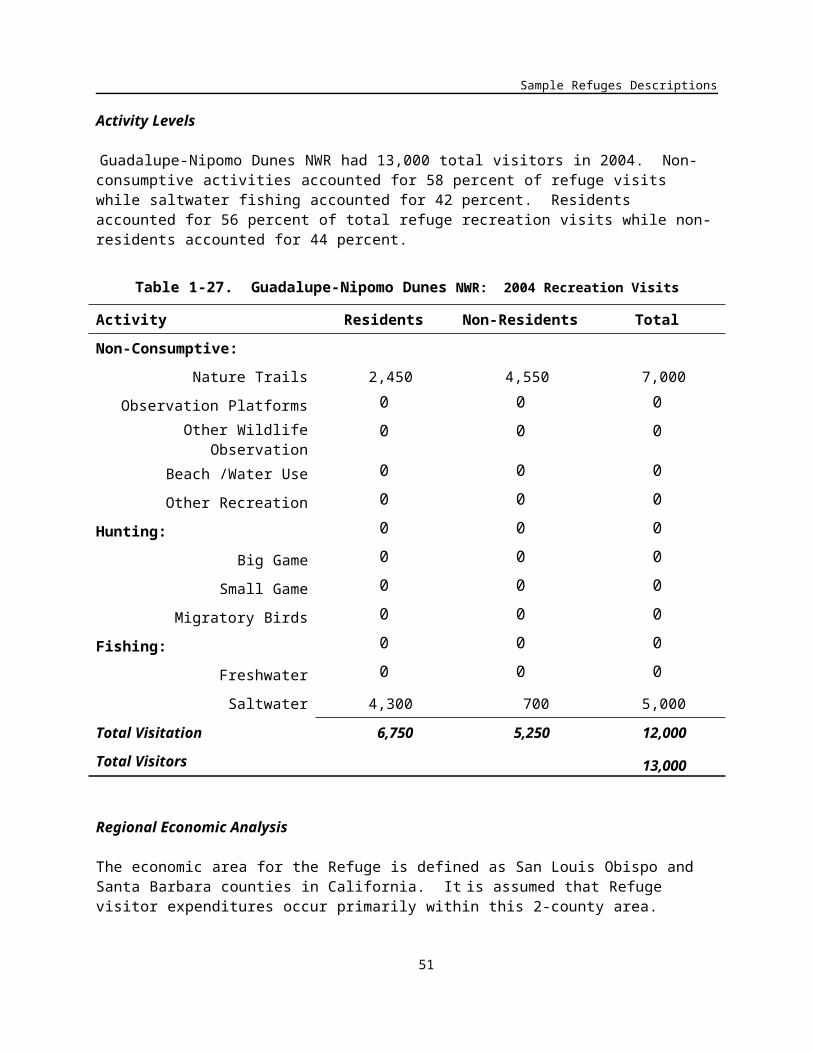
Banking on Nature: The Economic Benefits to Local Communities of National Wildlife Refuge Visitation
Activity Levels
Recreation visits to Kootenai NWR totaled 92,819 in FY 2004 (Table 1-47). The total number of visits is larger than the total number of visitors (21,523 people) because some visitors chose to partake in more than one activity. For example, a visitor may fish in the morning and hike along the nature trails in the afternoon (1 visitor, 2 visits). Refuge visitors enjoyed non-consumptive activities, hunting, and fishing while on the refuge. For non-consumptive activities, “other recreation” includes walking and jogging, and “other wildlife observation” includes photography. Non-residents accounted for approximately two-thirds of all recreation visits.
Table 1-47. Kootenai NWR: 2004 Recreation Visits
Activity Residents Non-Residents Total
Non-Consumptive:
Nature Trails 10,437 24,353 34,790
Observation Platforms 0 0 0
Other Wildlife Observation 12,125 36,375 48,500
Beach /Water Use 0 0 0
Other Recreation 617 1,439 2,056
Hunting:
Big Game 1,507 502 2,009
Small Game 483 161 644
Migratory Birds 3,610 401 4,011
Fishing:
Freshwater 405 405 809
Saltwater 0 0 0
Total Visitation 29,183 63,636 92,819
Total Visitors 21,523
Regional Economic Analysis
Table 1-48 shows the visitor recreation expenditures associated with visiting Kootenai NWR. In FY 2004, visitor recreation expenditures totaled $1.7 million, with non-resident expenditures accounting for 90 percent of all expenditures. Non-consumptive activities accounted for nearly $1.6 million of recreation expenditures.
54

Sample Refuges Descriptions
Table 1-48. Kootenai NWR: Visitor Recreation Expenditures (2004 $,000)
Activity Residents Non-Residents Total
Non-Consumptive: $110.12 $1,477.77 $1,587.89
Hunting:
Big Game $23.1 $18.8 $41.9
Small Game $5.3 $5.3 $10.6
Migratory Birds $37.9 $22.9 $60.9
Total Hunting $66.3 $47.0 $113.3
Fishing:
Freshwater $2.5 $5.4 $7.9
Saltwater ─ ─ ─
Total Fishing $2.5 $5.4 $7.9
Total Expenditures $178.9 $1,530.2 $1,709.1
The local economic effects associated with recreation visits are summarizes in Table 1-49. Refuge visitors generated nearly $2.2 million in final demand, 43 jobs, and $748,400 in job income. Over 90 percent of this impact was associated with non-resident visits.
Table 1-49. Kootenai NWR: Local Economic Effects Associated with Recreation Visits (2004 $,000)
Residents Non-Residents Total
Final Demand $223.2 $1,962.2 $2,185.3
Jobs 5 38 43
Job Income $75.3 $673.1 $748.4
Total Tax Revenue $34.3 $317.5 $351.8
For Kootenai NWR, about $2.5 million in recreational benefits (recreation expenditures plus net economic value) accrued in FY 2004 (Table 1-50). These benefits include expenditures and net economic value of recreational visitors. (For an individual, net economic value is the person’s total willingness to pay for a particular recreation activity minus the actual expenditures related to that activity.) For every $1 of budget expenditures, $4.29 in recreational benefits are generated. This ratio broadly compares the magnitude of recreational benefits and the refuge budget and should not be used as a benefit-cost ratio. In addition to recreational benefits, the refuge also provides important habitat for migratory waterfowl. Furthermore, the refuge budget also contributes to the regional economy as both payrolls and other expenses.
55
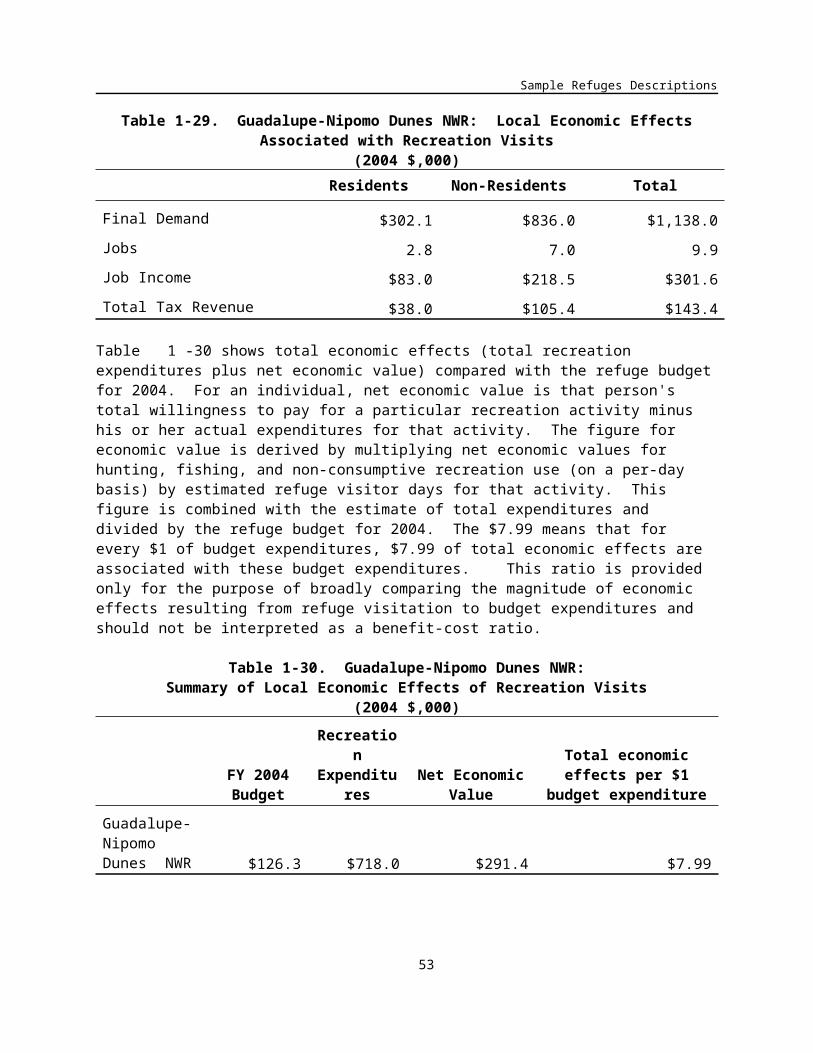
Banking on Nature: The Economic Benefits to Local Communities of National Wildlife Refuge Visitation
Table 1-50. Kootenai NWR: Summary of Local Economic Effects of Recreation Visits (2004 $,000)
FY 2004 Budget
RecreationExpenditures
Net Economic Value
Total economic effects per $1 budget expenditure
Kootenai NWR
$578.3 $1,709.1 $774.6 $4.29
56

Sample Refuges Descriptions
Little Pend Oreille National Wildlife Refuge
Description
Located on the west slope of the Selkirk Mountain Range in northeastern Washington, Little Pend Oreille National Wildlife Refuge is the only mountainous, mixed-conifer forest refuge outside of Alaska. The refuge's 40,198 acres protect a wide range of forest types from low elevation ponderosa pine to high elevation subalpine fir.
These forests provide important habitats for hundreds of species of birds, mammals, reptiles, and amphibians, including songbirds, forest carnivores, and the bald eagle. Refuge lands provide protection for wide-ranging species that require large tracts of forest habitat and provide critical winter range for white-tailed deer.
Refuge lakes and marshes provide stopover points for migratory waterfowl and shorebirds. Three other units of Little Pend Oreille Refuge, including Cusick Flats (255 acres), Springdale (54 acres) and Kaniksu (716 acres), are managed from this station. More than 50,000 visitors enjoy the refuge each year. Hunting, fishing, wildlife viewing, hiking, camping, and horseback riding are the most popular recreational activities.
Area Economy
The economic base area for Little Pend Oreille NWR includes Spokane and Stevens Counties, Washington. Most of the visitor expenditures occur within this two-county area. In 2003, population was 472,2000 and employment was 267,500. While the area’s average per capita income is $27,398, the per capita income for Stevens County (where the refuge is located) is $21,651. Both of these per capita incomes are lower than Washington State and the United States.
Table 1-51. Little Pend Oreille NWR:Summary of Area Economy, 2003
(Population & Employment in 000’s; Per Capita Income in 2004 dollars)
Population Employment Per Capita Income
County 2003
Percent change
1993-2003 2003
Percent change
1993-2003 2003
Percent change
1993-2003
Spokane, WA 431.2 9.8% 251.5 17.5% $27,943 12.8%
Stevens, WA* 40.9 18.0% 16.0 15.6% $21,651 8.4%
Area Total 472.2 10.5% 267.5 17.4% $27,398 12.4%
Washington 6,131.3 16.1% 3,562.5 19.9% $34,140 17.6%
United States 290,789.0 11.9% 167,174.4 17.9% $32,310 15.8%
Source: U.S. Department of Commerce 2003.
57

Banking on Nature: The Economic Benefits to Local Communities of National Wildlife Refuge Visitation
Activity Levels
Table 1-52 shows the recreation visits to Little Pend Oreille NWR in FY 2004. The total number of visitors (41,000) is larger than the total number of visits (59,700) because visitors may choose to partake in more than one activity when the come to the refuge.
Visitors to the refuge enjoyed non-consumptive activities (47,450 visits), hunting (9,750 visits), and freshwater fishing (2,500 visits). Refuge visitors were relatively equally distributed between residents (31,913 visits) and non residents (27,788 visits).
Table 1-52. Little Pend Oreille NWR: 2004 Recreation Visits
Activity Residents Non-Residents Total
Non-Consumptive:
Nature Trails 0 0 0
Observation Platforms 0 0 0
Other Wildlife Observation 9,900 8,100 18,000
Beach /Water Use 0 0 0
Other Recreation 16,198 13,253 29,450
Hunting:
Big Game 2,040 3,960 6,000
Small Game 2,800 700 3,500
Migratory Birds 225 25 250
Fishing:
Freshwater 750 1,750 2,500
Saltwater 0 0 0
Total Visitation 31,913 27,788 59,700
Total Visitors 41,000
Regional Economic Analysis
Visitor recreation expenditures at Little Pend Oreille NWR totaled $2.4 million in FY 2004 (Table 1-53). Non-consumptive activities generated $1.9 million (79 percent of all expenditures). Non-resident visitors spent $1.9 million while resident visitors spent $474,900.
58

Sample Refuges Descriptions
Table 1-53. Little Pend Oreille NWR: Visitor Recreation Expenditures (2004 $,000)
Activity Residents Non-Residents Total
Non-Consumptive: $366.54 $1,562.74 $1,929.28
Hunting:
Big Game $57.2 $271.5 $328.7
Small Game $37.3 $28.0 $65.4
Migratory Birds $2.5 $1.5 $4.0
Total Hunting $97.0 $301.0 $398.0
Fishing:
Freshwater $11.4 $56.6 $68.0
Saltwater ─ ─ ─
Total Fishing $11.4 $56.6 $68.0
Total Expenditures $474.9 $1,920.4 $2,395.3
Table 1-54 summarizes the monetary value of recreation visitor expenditures at Little Pend Oreille NWR. In FY 2004, final demand summed to nearly $3.7 million, which generated 42 jobs, $1.2 million in job income, and $545,900 in tax revenue. Visitors from outside the local area provided a $2.9 million stimulus to the local area economy.
Table 1-54. Little Pend Oreille NWR: Local Economic Effects Associated with Recreation Visits (2004 $,000)
Residents Non-Residents Total
Final Demand $737.3 $2,921.1 $3,658.4
Jobs 9 33 42
Job Income $245.8 $965.6 $1,211.4
Total Tax Revenue $105.5 $440.4 $545.9
The refuge’s budget and the economic effects related to recreation visits are compared in Table 1-55. In FY 2004, recreational benefits (recreation expenditures plus net economic value) summed to approximately $3.9 million. When compared to the refuge budget, there was $3.82 of recreational benefits for every $1 of refuge expenditures. This ratio broadly compares the magnitude of recreational benefits and the refuge budget and should not be used as a benefit-cost ratio. In addition to recreational benefits, the refuge provides important habitat for wildlife and migratory birds. Furthermore, the refuge budget contributes to the regional economy through its payroll, maintenance, and operating expenses.
59

Banking on Nature: The Economic Benefits to Local Communities of National Wildlife Refuge Visitation
Table 1-55. Little Pend Oreille NWR: Summary of Local Economic Effects of Recreation Visits (2004 $,000)
FY 2004 Budget
RecreationExpenditures
Net Economic Value
Total economic effects per $1 budget expenditure
Little Pend Oreille NWR
$1,012.6 $2,395.3 $1,470.2 $3.82
60

Sample Refuges Descriptions
Lower Klamath National Wildlife Refuge
Description
The Lower Klamath National Wildlife Refuge, located in rural northeastern California and southern Oregon, was established by President Theodore Roosevelt in 1908 as the nation's first waterfowl refuge. The refuge, with a backdrop of 14,000-foot Mount Shasta to the southwest, is listed in the National Register of Historic Places as both a National Historic Landmark and a National Natural Landmark.
The 50,092-acre refuge is a varied mix of intensively managed shallow marshes, open water, grassy uplands, and croplands that provide feeding, resting, nesting, and brood-rearing habitat for waterfowl and other water birds. This refuge is one of the most biologically productive refuges within the Pacific Flyway. Approximately 80 percent of the flyway's migrating waterfowl pass through the Klamath Basin on both spring and fall migrations, with 50 percent using the refuge. Peak waterfowl populations can reach 1.8 million birds, which represent 15 to 45 percent of the total birds wintering in California. The refuge produces between 30,000 and 60,000 waterfowl annually.
The refuge is also a fall staging area for 20 to 30 percent of the central valley population of sandhill crane. From 20,000 to 100,000 shorebirds use refuge wetlands during the spring migration. Wintering wildlife populations include 500 bald eagle and 30,000 tundra swan. Spring and summer nesting wildlife include many colonial water birds, such as white-faced ibis, heron, egret, cormorant, grebe, white pelican, and gulls.
A marked 10-mile auto tour allows visitors year round access to great wildlife viewing opportunities. The Refuge also has a number of photoblinds which are strategically situated for great early-morning photography.
Area Economy
The Lower Klamath NWR’s area economy includes Klamath County, Oregon and Siskiyou County, California (Table 1-56). In 2003, the area’s total population was 109,700 and the area’s employment was 54,600. From 1993 to 2003, population increased by 5.7 percent and employment increased 11.9 percent These rates of increase are lower than Oregon, California, and the United States. The area’s average per capita income ($24,081) is also slightly lower than the United States.
Activity Levels
Table 1-57 shows the recreation visits to Lower Klamath NWR in FY 2004. Visitors to the refuge enjoyed a variety of non-consumptive activities (nature trails, wildlife observation, etc.), small game hunting, and migratory bird hunting. “Other wildlife observation” includes photographing wildlife, observing wildlife in short stops along the Highway that runs through the Refuge, and observing wildlife while not on the designated auto tour route. Recreation visits totaled 240,563. Non-consumptive activities totaled 231,111 visits.
61

Banking on Nature: The Economic Benefits to Local Communities of National Wildlife Refuge Visitation
Table 1-56. Lower Klamath NWR:Summary of Area Economy, 2003
(Population & Employment in 000’s; Per Capita Income in 2004 dollars)
Population Employment Per Capita Income
County 2003
Percent change
1993-2003 2003
Percent change
1993-2003 2003
Percent change
1993-2003Klamath, OR 65.0 9.1% 32.1 12.1% $23,834 12.1%Siskiyou, CA 44.6 1.1% 22.5 11.7% $24,441 9.0%Area Total 109.7 5.7% 54.6 11.9% $24,081 10.7%Oregon 3,564.3 16.5% 2,094.7 22.6% $29,499 12.6%
California 35,462.7 13.4% 19,746.2 19.8% $34,305 15.9%
United States 290,789.0 11.9% 167,174.4 17.9% $32,310 15.8%
Source: U.S. Department of Commerce 2003.
Table 1-57. Lower Klamath NWR: 2004 Recreation Visits
Activity Residents Non-Residents Total
Non-Consumptive:
Nature Trails 24,210 16,140 40,350
Observation Platforms 11,945 7,963 19,908
Other Wildlife Observation 101,443 67,628 169,071
Beach /Water Use 0 0 0
Other Recreation 1,069 713 1,782
Hunting:
Big Game 0 0 0
Small Game 318 742 1,060
Migratory Birds 2,518 5,874 8,392
Fishing:
Freshwater 0 0 0
Saltwater 0 0 0
Total Visitation 141,502 99,061 240,563
Total Visitors 204,626
Regional Economic Analysis
62

Sample Refuges Descriptions
Visitor recreation expenditures for Lower Klamath NWR are shown in Table 1-58. Non-residents spent nearly $1.8 million (81 percent), while residents spend about $413,000. Non-consumptive activities accounted for 76 percent ($1.7 million) of expenditures.
Table 1-58. Lower Klamath NWR: Visitor Recreation Expenditures (2004 $,000)
Activity Residents Non-Residents Total
Non-Consumptive: $371.58 $1,290.86 $1,662.44
Hunting:
Big Game ─ ─ ─
Small Game $4.2 $29.7 $33.9
Migratory Birds $36.9 $468.0 $504.8
Total Hunting $41.1 $497.7 $538.8
Fishing:
Freshwater ─ ─ ─
Saltwater ─ ─ ─
Total Fishing ─ ─ ─
Total Expenditures $412.7 $1,788.5 $2,201.2
Table 1-59 summarizes the total economic impacts associated with refuge visitor spending. Total final demand associated with recreation visitors is nearly $3.2 million. Non-resident visitor spending provided a $2.6 million stimulus to the area economy, generated 34 jobs (both full- and part-time jobs).
Table 1-59. Lower Klamath NWR: Local Economic Effects Associated with Recreation Visits (2004 $,000)
Residents Non-Residents Total
Final Demand $585.8 $2,612.1 $3,197.9
Jobs 9 34 43
Job Income $204.2 $915.7 $1,119.9
Total Tax Revenue $87.1 $416.2 $503.3
Table 1-60 shows the total economic effects (recreational expenditures plus net economic value) compared with the refuge budget for FY 2003. For every $1 of budget expenditures, $2.91 of economic effects are generated. This ratio is provided only for the purpose of broadly comparing the magnitude of the economic effects resulting from recreational visitation and should not be interpreted as a benefit-cost ratio. In addition to recreational benefits, the refuge provides important habitat for migratory birds. Furthermore, the refuge budget contributes to the local economy through its payroll, maintenance, and
63

Banking on Nature: The Economic Benefits to Local Communities of National Wildlife Refuge Visitation
operating expenses.
Table 1-60. Lower Klamath NWR: Summary of Local Economic Effects of Recreation Visits (2004 $,000)
FY 2004 Budget
RecreationExpenditures
Net Economic Value
Total economic effects per $1 budget expenditure
Lower Klamath NWR
$1,185.7 $2,201.2 $1,248.1 $2.91
64

Sample Refuges Descriptions
Malheur National Wildlife Refuge
Description
Malheur National Wildlife Refuge, established in 1908, is located in southeastern Oregon on the northern edge of the Great Basin. It is adjacent to the newly established Steens Mountain Wilderness, with the Wild and Scenic Donner and Blitzen (thunder and lightning) River flowing into the refuge at its southern boundary.
Malheur Refuge consists of more than 185,000 acres of prime wildlife habitat, including 120,000 acres of a wetland wonder in a sea of sagebrush. Malheur is a mecca for birdwatchers and wildlife enthusiasts. More than 320 species of birds, 58 species of mammals, 10 species of native fish, and a number of reptiles can be found on the refuge.
Spring is the most spectacular season at Malheur. More than 130 species of birds nest on the refuge, while other waterfowl using the Pacific Flyway stop at the refuge to refuel for their journey northward. In February, northern pintail and tundra swan begin to arrive, followed by large flocks of lesser and greater sandhill crane, and flocks of snow goose and Ross' goose.
With more than 320 species of birds and 58 species of mammals, the refuge offers prime wildlife viewing, hunting, and fishing.
Area Economy
Table 1-61 summarizes the area economy for Malheur NWR in 2003. The economic base for the refuge includes Harney County, Oregon. It is assumed that the majority of visitor expenditures occur within this County. From 1993 to 2003, the County’s population increased 10.7 percent to 31,400 people. During the same time period, employment increased by 11.8 percent but average per capita income decreased 8.9 percent. Harney County’s average per capita income is 35 percent less than Oregon ($29,499) and the United States ($32,310).
Table 1-61. Malheur NWR:Summary of Area Economy, 2003
(Population & Employment in 000’s; Per Capita Income in 2004 dollars)
Population Employment Per Capita Income
County 2003
Percent change
1993-2003 2003
Percent change
1993-2003 2003
Percent change
1993-2003
Harney, OR 31.4 10.7% 18.0 11.8% $19,359 -8.9%
Area Total 31.4 10.7% 18.0 11.8% $19,359 -8.9%
Oregon 3,564.3 16.5% 2,094.7 22.6% $29,499 12.6%
United States 290,789.0 11.9% 167,174.4 17.9% $32,310 15.8%
Source: U.S. Department of Commerce 2003.
65

Banking on Nature: The Economic Benefits to Local Communities of National Wildlife Refuge Visitation
Activity Levels
Table 1-62 shows the recreation visits to Malheur NWR in FY 2004. Recreation Visitation totaled 88,432 visits. “Other recreation” consists of bicycling and hiking, and “other wildlife observation” includes incidental observation while accessing other recreational sites. The majority of visits were by non-residents (79,156 visits).
Table 1-62. Malheur NWR: 2004 Recreation Visits
Activity Residents Non-Residents Total
Non-Consumptive:
Nature Trails 7,100 63,900 71,000
Observation Platforms 0 0 0
Other Wildlife Observation 750 4,250 5,000
Beach /Water Use 0 0 0
Other Recreation 697 3,951 4,648
Hunting:
Big Game 0 0 0
Small Game 49 935 984
Migratory Birds 0 0 0
Fishing:
Freshwater 680 6,120 6,800
Saltwater 0 0 0
Total Visitation 9,276 79,156 88,432
Total Visitors 65,000
Regional Economic Analysis
Table 1-63 depicts the visitor recreation expenditures at Malheur NWR in FY 2004. Total visitor expenditures were $2.2 million, with non-residents accounting for $2.1 million of the expenditures. Non-consumptive visits, migratory bird hunting, and freshwater fishing accounted for $1.9 million, $38,100, and $208,400, respectively.
66

Sample Refuges Descriptions
Table 1-63. Malheur NWR: Visitor Recreation Expenditures (2004 $,000)
Activity Residents Non-Residents Total
Non-Consumptive: $41.93 $1,899.07 $1,941.00
Hunting:
Big Game ─ ─ ─
Small Game $0.7 $37.4 $38.1
Migratory Birds ─ ─ ─
Total Hunting $0.7 $37.4 $38.1
Fishing:
Freshwater $10.3 $198.1 $208.4
Saltwater ─ ─ ─
Total Fishing $10.3 $198.1 $208.4
Total Expenditures $52.9 $2,134.5 $2,187.4
Table 1-64 summarizes the economic effects associated with recreation visits. Total final demand associated with recreational visitor spending summed to $2.6 million. This is the total monetary value of economic activity generated in the area economy, which was generated by recreational visitors. In turn, this final demand generated 49 jobs, $927,100 in job income, and $446,300 in total tax revenue. Non-resident visitors provided a $2.6 million stimulus to the local economy.
Table 1-64. Malheur NWR: Local Economic Effects Associated with Recreation Visits (2004 $,000)
Residents Non-Residents Total
Final Demand $64.6 $2,557.7 $2,622.3
Jobs 1 48 49
Job Income $22.5 $904.6 $927.1
Total Tax Revenue $9.9 $436.4 $446.3
Table 1-65 compares the refuge budget and recreation-related economic effects for Malheur NWR. In FY 2004, recreational benefits (recreation expenditures plus net economic value) summed to $3.0 million compared to $1.9 million in budget expenditures. Thus, for every $1 of budget expenditure, $1.62 in recreational benefits were accrued. This ratio is provided to broadly compare the magnitude of recreational benefits to the refuge budget and should not be used as a benefit-cost ratio. In addition to these recreational benefits, the refuge has other benefits including (but not limited to) protecting habitat that supports wildlife and migratory birds. Furthermore, the refuge budget contributes to the local economy through both its payroll and other maintenance and operating expenses.
67

Banking on Nature: The Economic Benefits to Local Communities of National Wildlife Refuge Visitation
Table 1-65. Malheur NWR: Summary of Local Economic Effects of Recreation Visits (2004 $,000)
FY 2004 Budget
RecreationExpenditures
Net Economic Value
Total economic effects per $1 budget expenditure
Malheur NWR
$1,858.9 $2,187.4 $830.2 $1.62
68

Sample Refuges Descriptions
Nisqually National Wildlife Refuge
Description
Nisqually National Wildlife Refuge is located where the freshwater of the Nisqually River meets the saltwater of south Puget Sound, creating the Nisqually River Delta. The delta is a biologically-rich and diverse area that supports a variety of habitats including the estuary, freshwater wetlands and riparian woodlands. It is considered the last unspoiled major estuary in Puget Sound. The Nisqually Delta has been designated as a National Natural Landmark because of its national significance as one of the best examples of this kind of coastal salt marsh system remaining in the North Pacific.
Nisqually Refuge is famous for the more than 275 migratory bird species that use the refuge for migration, wintering, or breeding. The refuge provides rearing and migration habitat for steelhead trout and several salmon species, and habitat for a variety of threatened and endangered species. The Black River Unit, southwest of Olympia, provides high quality habitat for Coho and Chinook salmon, steelhead trout, migratory birds, and a diversity of other species.
The Black River is one of the largest undisturbed freshwater wetland systems remaining in western Washington. Situated between Olympia and Seattle and within 100 miles of more than 4 million people, Nisqually Refuge is visited each year by more than 100,000 people who come to enjoy and learn about these sensitive natural resources. The refuge provides environmental education programs for 8,000 school children every year.
Area Economy
Nisqually NWR’s area economy includes Pierce and Thurston Counties in Washington State (Table 1-66). In 2003, the area’s population was 961,000 – an 18.2 percent increase from 1993. Employment totaled 463,300 people and per capita income was $31,107 in 2003. From 1993 to 2003, the area’s population, employment, and per capita income increased at a faster rate than both Washington State and the United States.
Table 1-66. Nisqually NWR:Summary of Area Economy, 2003
(Population & Employment in 000’s; Per Capita Income in 2004 dollars)
Population Employment Per Capita Income
County 2003
Percent change
1993-2003 2003
Percent change
1993-2003 2003
Percent change
1993-2003Pierce, WA 740.5 17.5% 345.4 19.6% $30,788 19.2%Thurston, WA 221.0 20.7% 118.0 27.0% $32,178 17.1%
Area Total 961.4 18.2% 463.3 21.4% $31,107 18.7%Washington 6,131.3 16.1% 3,562.5 19.9% $34,140 17.6%
United States 290,789.0 11.9% 167,174.4 17.9% $32,310 15.8%
Source: U.S. Department of Commerce 2003.
69

Banking on Nature: The Economic Benefits to Local Communities of National Wildlife Refuge Visitation
Activity Levels
Recreation visits to Nisqually NWR totaled 259,946 in FY 2004 (Table 1-67). The total number of visitors (137,000) is less than the total number of visits because some visitors choose to participate in more than one activity. Except for 3,748 saltwater fishing visits, all visits were associated with non-consumptive activities. The majority of visits (201,409 visits) were by visitors from the local area.
Table 1-67. Nisqually NWR: 2004 Recreation Visits
Activity Residents Non-Residents Total
Non-Consumptive:
Nature Trails 92,246 27,554 119,800
Observation Platforms 92,246 27,554 119,800
Other Wildlife Observation 3,038 160 3,198
Beach /Water Use 0 0 0
Other Recreation 10,318 3,082 13,400
Hunting:
Big Game 0 0 0
Small Game 0 0 0
Migratory Birds 0 0 0
Fishing:
Freshwater 0 0 0
Saltwater 3,561 187 3,748
Total Visitation 201,409 58,537 259,946
Total Visitors 137,000
Regional Economic Analysis
Expenditures related to visitor recreation totaled $2.9 million in FY 2004 (Table 1-68). Ninety-seven percent of the total expenditures were attributable to non-consumptive activities ($2.8 million). Saltwater fishing accounted for the remaining 3 percent ($96,500). Resident expenditures accounted for $1.2 million while non-resident expenditures accounted for $1.7 million.
70

Sample Refuges Descriptions
Table 1-68. Nisqually NWR: Visitor Recreation Expenditures (2004 $,000)
Activity Residents Non-Residents Total
Non-Consumptive: $1,104.27 $1,677.06 $2,781.33
Hunting:
Big Game ─ ─ ─
Small Game ─ ─ ─
Migratory Birds ─ ─ ─
Total Hunting ─ ─ ─
Fishing:
Freshwater ─ ─ ─
Saltwater $88.8 $7.6 $96.5
Total Fishing $88.8 $7.6 $96.5
Total Expenditures $1,193.1 $1,684.7 $2,877.8
As noted in Table 1-66, the area’s economy includes Pierce and Thurston Counties in Washington State. It is assumed that the majority of visitor expenditures occur within this area. Therefore, local economic effects (final demand, job income, etc.) would also accrue within these two counties. Table 1-69 shows the local effects that are generated by visitors to Nisqually NWR. Total final demand associated with visitor spending was $4.1 million. In turn, this final demand generated 51 jobs (both full-time and part-time) with total employment income of $1.4 million.
Table 1-69. Nisqually NWR: Local Economic Effects Associated with Recreation Visits (2004 $,000)
Residents Non-Residents Total
Final Demand $1,741.0 $2,408.2 $4,149.1
Jobs 23 28 51
Job Income $590.5 $807.6 $1,398.0
Total Tax Revenue $255.1 $375.9 $631.0
71

Banking on Nature: The Economic Benefits to Local Communities of National Wildlife Refuge Visitation
Nisqually NWR’s budget and recreational benefits are shown in Table 1-70. In FY 2004, recreational benefits (recreation-related expenditures plus net economic value) summed to $5.2 million. The budget ($1.0 million) represents the expenditures for refuge staff, maintenance, and operations. The ratio ($5.20) is provided to broadly compare the magnitude of recreational benefits to the refuge budget and should not be used as a benefit-cost ratio. In addition to these recreational benefits, the refuge has other benefits including (but not limited to) protecting habitat that supports wildlife and migratory birds and providing educational opportunities. Furthermore, the refuge budget contributes to the regional economy through both its payroll and other maintenance and operating expenses.
Table 1-70. Nisqually NWR: Summary of Local Economic Effects of Recreation Visits (2004 $,000)
FY 2004 Budget
RecreationExpenditures
Net Economic Value
Total economic effects per $1 budget expenditure
Nisqually NWR
$1,006.8 $2,877.8 $2,356.4 $5.20
72

Sample Refuges Descriptions
Ridgefield National Wildlife Refuge
Description
Ridgefield National Wildlife Refuge is located on the shore of the Lower Columbia River, 10 miles downstream from the Portland/Vancouver metropolitan area. This 5,217 acre refuge contains a mosaic of riverine flood plain habitat, intensively managed seasonal and permanent wetlands, and agricultural lands.
The refuge contains the historic Cathlapotle townsite, which was visited by the Lewis and Clark expedition in 1806, and today is one of the best-preserved Native American sites in the Northwest United States. Ridgefield NWR provides high quality wintering habitat for a variety of waterfowl, particularly dusky Canada goose and lesser sandhill cranes.
Currently hosting approximately 140,000 visitors annually, the refuge provides excellent wildlife viewing opportunities via a 4-mile auto tour route and two developed hiking trails. It also provides excellent outdoor classroom opportunities for Portland/Vancouver area schools, including natural resource, cultural, and historic information.
Area Economy
Table 1-71 shows the area economy for Ridgefield NWR in 2003. From 1993 to 2003, the area’s population increased by 19.0 percent to 1.1 million people and employment increased by 19.2 percent to 698,100. The average per capita income in 2003 was $33,204. Rates of increase from 1993 to 2003 for the area’s population, employment, and per capita income are comparable with Washington, Oregon, and the United States.
Table 1-71. Ridgefield NWR:Summary of Area Economy, 2003
(Population & Employment in 000’s; Per Capita Income in 2004 dollars)
Population Employment Per Capita Income
County 2003
Percent change
1993-2003 2003
Percent change
1993-2003 2003
Percent change
1993-2003Clark, WA 380.0 39.6% 163.8 39.1% $30,139 11.3%Multnomah, OR 677.8 9.9% 534.3 14.2% $34,923 17.7%
Area Total 1,057.8 19.0% 698.1 19.2% $33,204 15.0%Washington 6,131.3 16.1% 3,562.5 19.9% $34,140 17.6%
Oregon 3,564.3 16.5% 2,094.7 22.6% $29,499 12.6%
United States 290,789.0 11.9% 167,174.4 17.9% $32,310 15.8%
Source: U.S. Department of Commerce 2003.
73

Banking on Nature: The Economic Benefits to Local Communities of National Wildlife Refuge Visitation
Activity Levels
Recreation visits to Ridgefield NWR totaled 135,548 in FY 2004 (Table 1-72). Non-consumptive activities accounted for 133,088 visits, migratory bird hunting accounted for 1,758 visits, and freshwater fishing accounted for 702 visits. The majority of visits (80 percent) were by visitors from the local area.
Table 1-72. Ridgefield NWR: 2004 Recreation Visits
Activity Residents Non-Residents Total
Non-Consumptive:
Nature Trails 103,818 25,955 129,773
Observation Platforms 0 0 0
Other Wildlife Observation 2,652 663 3,315
Beach /Water Use 0 0 0
Other Recreation 0 0 0
Hunting:
Big Game 0 0 0
Small Game 0 0 0
Migratory Birds 1,406 352 1,758
Fishing:
Freshwater 702 0 702
Saltwater 0 0 0
Total Visitation 108,579 26,969 135,548
Total Visitors 138,959
Regional Economic Analysis
Table 1-73 shows the visitor recreation expenditures in the refuge region during FY 2004. Visitor expenditures totaled $1.4 million, with the majority ($1.3 million) being attributed to non-consumptive activities. Migratory bird hunting generated $60,800 and freshwater fishing generated $5,300.
74

Sample Refuges Descriptions
Table 1-73. Ridgefield NWR: Visitor Recreation Expenditures (2004 $,000)
Activity Residents Non-Residents Total
Non-Consumptive: $570.61 $743.36 $1,313.97
Hunting:
Big Game ─ ─ ─
Small Game ─ ─ ─
Migratory Birds $25.8 $35.0 $60.8
Total Hunting $25.8 $35.0 $60.8
Fishing:
Freshwater $5.3 ─ $5.3
Saltwater ─ ─ ─
Total Fishing $5.3 ─ $5.3
Total Expenditures $601.7 $778.4 $1,380.1
Table 1-74 shows the economic impacts associated with recreation visitor spending at Ridgefield NWR. Final demand totaled $2.2 million. This is the total monetary value of economic activity generated in the local area by recreational visitors. In turn, this final demand generated 25 jobs and $748,100 in job income. Non-resident expenditures resulted in $1.2 million, generating 13 jobs and $415,000 in job income.
Table 1-74. Ridgefield NWR: Local Economic Effects Associated with Recreation Visits (2004 $,000)
Residents Non-Residents Total
Final Demand $954.3 $1,214.8 $2,169.1
Jobs 12 13 25
Job Income $332.9 $415.2 $748.1
Total Tax Revenue $141.0 $187.9 $328.9
In FY 2004, recreational benefits (recreation expenditures plus net economic value) totaled $2.6 million for Ridgefield NWR (Table 1-75). Recreational benefits sum recreation-related expenditures and net economic value. For every $1 of budget expenditure, there is $2.80 in recreational benefits. This ratio broadly compares the magnitude of recreational benefits and the refuge budget. It does not represent a benefit-cost ratio because the refuge has many other benefits in addition to public use such as ecological values. Furthermore, the refuge budget also contributes to the regional economy through both its payroll and other maintenance and operating expenses.
75

Banking on Nature: The Economic Benefits to Local Communities of National Wildlife Refuge Visitation
Table 1-75. Ridgefield NWR: Summary of Local Economic Effects of Recreation Visits (2004 $,000)
FY 2004 Budget
RecreationExpenditures
Net Economic Value
Total economic effects per $1 budget expenditure
Ridgefield NWR
$922.7 $1,380.1 $1,204.6 $2.80
76

Sample Refuges Descriptions
Ruby Lake National Wildlife RefugeDescription
Ruby Lake National Wildlife Refuge lies at the southern end of the Ruby Valley in northeast Nevada. Located at an elevation of 6,000 feet and flanked on the west by the rugged and scenic Ruby Mountains, it is one of the most remote refuges in the lower 48 states. The refuge encompasses 39,928 acres and consists of a marsh bordered by meadows, grasslands, and brush-covered uplands.
It serves as a magnet for a wide diversity of wildlife species and is strategically located along migration corridors serving both the Pacific and Central Flyways. The refuge has been identified as one of 500 Globally Important Bird Areas by the American Bird Conservancy.
The National Park Service designated the South Marsh a National Natural Landmark because of the biological diversity and pristine condition of the habitat. The refuge is one of the most important waterfowl nesting areas in the Great Basin and intermountain West.
The South Marsh supports the largest population of nesting canvasback ducks west of the Mississippi River (outside Alaska), and holds the highest concentration of nesting canvasbacks in North America. Due to habitat loss elsewhere in the Great Basin, the refuge has become increasingly important to resident wildlife, including mule deer, pronghorn antelope, and sage grouse. Refuge visitors enjoy wildlife observation, the auto tour, boating, hunting and fishing. Area Economy
Table 1-76 shows the area economy for Ruby Lake NWR. The economic base for the refuge includes Elko and White Pine Counties, Nevada. It is assumed that most of the visitor expenditures take place within this area. From 1993 to 2003, population and employment increased in Elko County but decreased in White Pine County. Overall, the area’s population increased by 9.7 percent and employment increased by 7.0 percent. Per capita income increased slightly by 1.1 percent to $26,959. This rate of increase is less than both Nevada and the United States.
Table 1-76. Ruby Lake NWR:Summary of Area Economy, 2003
(Population & Employment in 000’s; Per Capita Income in 2004 dollars)
Population Employment Per Capita Income
County 2003
Percent change
1993-2003 2003
Percent change
1993-2003 2003
Percent change
1993-2003Elko, NV 44.2 14.1% 22.5 9.0% $26,925 -3.0%White Pine, NV 8.6 -8.3% 4.0 -2.7% $27,133 22.4%
Area Total 52.7 9.7% 26.5 7.0% $26,959 1.1%
Nevada 2,242.2 58.9% 1,347.5 62.6% $32,760 10.0%
United States 290,789.0 11.9% 167,174.4 17.9% $32,310 15.8%
Source: U.S. Department of Commerce 2003.
77
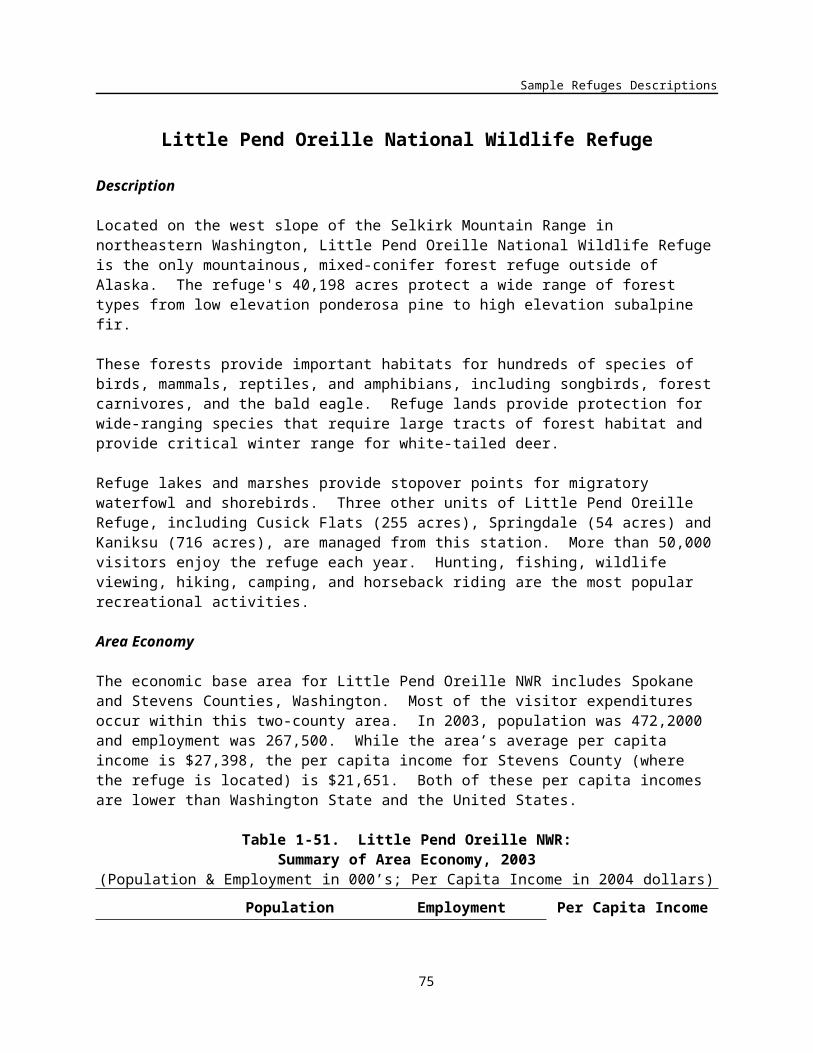
Banking on Nature: The Economic Benefits to Local Communities of National Wildlife Refuge Visitation
Activity Levels
Recreation visits to Ruby Lake NWR totaled 14,976 visits in FY 2004 (Table 1-77). Refuge visitors enjoyed non-consumptive activities, migratory bird hunting, and freshwater fishing. For non-consumptive activities, “other wildlife observation" includes photography and interpretation/education and “other recreation" includes picnicking, mountain biking, ice skating, and cross-country skiing. Visits were fairly evenly distributed between residents (7,701 visits) and non-residents (7,275 visits).
Table 1-77. Ruby Lake NWR: 2004 Recreation Visits
Activity Residents Non-Residents Total
Non-Consumptive:
Nature Trails 136 1,226 1,362
Observation Platforms 0 0 0
Other Wildlife Observation 322 2,894 3,216
Beach /Water Use 0 0 0
Other Recreation 18 158 176
Hunting:
Big Game 0 0 0
Small Game 0 0 0
Migratory Birds 314 35 349
Fishing:
Freshwater 6,911 2,962 9,873
Saltwater 0 0 0
Total Visitation 7,701 7,275 14,976
Total Visitors 16,576
Regional Economic Analysis
Visitor recreation expenditures summed to $652,000 during FY 2004 (Table 1-78). Expenditures related to freshwater fishing accounted for 61 percent of all expenditures ($401,400). Overall, non-residents spent $430,400 while residents spent $221,600.
78

Sample Refuges Descriptions
Table 1-78. Ruby Lake NWR: Visitor Recreation Expenditures (2004 $,000)
Activity Residents Non-Residents Total
Non-Consumptive: $5.00 $234.56 $239.56
Hunting:
Big Game ─ ─ ─
Small Game ─ ─ ─
Migratory Birds $6.9 $4.2 $11.1
Total Hunting $6.9 $4.2 $11.1
Fishing:
Freshwater $209.7 $191.7 $401.4
Saltwater ─ ─ ─
Total Fishing $209.7 $191.7 $401.4
Total Expenditures $221.6 $430.4 $652.0
Table 1-79 shows the economic effects associated with recreational visitors to Ruby Lake NWR. Final demand totaled $833,900, which generated 12 jobs (both part-time and full-time) and $281,700 in job income.
Table 1-79. Ruby Lake NWR: Local Economic Effects Associated with Recreation Visits (2004 $,000)
Residents Non-Residents Total
Final Demand $288.7 $545.1 $833.9
Jobs 5 7 12
Job Income $99.4 $182.4 $281.7
Total Tax Revenue $39.5 $80.2 $119.6
Table 1-80 compares the recreation-related benefits and the refuge budget. In FY 2004, recreation benefits (recreation expenditures plus net economic value) totaled $1.2 million while refuge expenditures were just under $1.0 million. Using a ratio to broadly compare the magnitude of the two estimates, the table below shows there is $1.24 of recreation-related benefits for each $1 spent by the refuge. The ratio is provided to broadly compare the magnitude of recreational benefits to the refuge budget and should not be used as a benefit-cost ratio. In addition to these recreational benefits, the refuge has other benefits including (but not limited to) ecological values such as providing important waterfowl nesting areas. Furthermore, the refuge budget also contributes to the regional economy through both its payroll and other maintenance and operating expenses.
79

Banking on Nature: The Economic Benefits to Local Communities of National Wildlife Refuge Visitation
Table 1-80. Ruby Lake NWR: Summary of Local Economic Effects of Recreation Visits (2004 $,000)
FY 2004 Budget
RecreationExpenditures
Net Economic Value
Total economic effects per $1 budget expenditure
Ruby Lake NWR
$967.1 $652.0 $546.9 $1.24
80

Sample Refuges Descriptions
Sacramento National Wildlife Refuge
Description
The Sacramento National Wildlife Refuge is the headquarters for the Sacramento National Wildlife Refuge Complex and is one of six refuges located in the Sacramento Valley of north-central California. The refuge is approximately 90 miles north of Sacramento.
The 10,783-acre refuge consists of about 7,600 acres of managed wetlands, uplands, riparian habitat, and vernal pools. It typically supports wintering populations of more than 600,000 ducks and 200,000 geese. More than 95 percent of the wetlands of the central valley have been lost in the last 100 years, and waterfowl have become increasingly dependent upon the refuges of the Sacramento Valley.
The refuge supports several endangered plants and animals, including transplanted colonies of palmate-bracted bird’s-beak, several species of fairy shrimp, vernal pool tadpole shrimp, giant garter snake, wintering peregrine falcon, bald eagle, and breeding tricolored blackbird. Resident wildlife includes grebe, heron, blackbird, golden eagle, beaver, muskrat, black-tailed deer, and other species typical of upland and wetland habitats.
Area Economy
The area economy for Sacramento NWR is shown in Table 1-81. While located in Colusa and Glenn Counties, the economic hub for the area includes the counties of Sacramento and San Francisco. From 1993 to 2003, area population increased 11.5 percent with the highest increase being in Sacramento County (18.0 percent). During the same time period, area employment increased 13.8 percent, which was lower than both California and the United States. However, the counties of Colusa and Sacramento had employment increases of 23.1 percent and 26.3 percent, respectively. In 2003, the area’s average per capita income was $40,050. This average was weighted heavily by San Francisco's per capita income ($57,204).
Activity Levels
Recreational visitors to Sacramento NWR enjoy a variety of activities such as hiking, observing wildlife, and hunting migratory birds (Table 1-82). The most popular options include the nature trails (59,710 visits) and observation platforms (41,337 visits). Visitors from the local area accounted for the majority of recreational refuge visits (80 percent).
81

Banking on Nature: The Economic Benefits to Local Communities of National Wildlife Refuge Visitation
Table 1-81. Sacramento NWR:Summary of Area Economy, 2003
(Population & Employment in 000’s; Per Capita Income in 2004 dollars)
Population Employment Per Capita Income
County 2003
Percent change
1993-2003 2003
Percent change
1993-2003 2003
Percent change
1993-2003Colusa, CA 19.8 16.2% 10.6 23.1% $27,422 -0.2%Glenn, CA 27.2 6.1% 11.8 7.2% $21,191 -3.2%Sacramento, CA 1,330.7 18.0% 759.0 26.3% $30,931 14.2%San Francisco, CA 751.9 1.6% 693.7 2.6% $57,204 34.4%Area Total 2,129.6 11.5% 1,475.1 13.8% $40,050 21.3%California 35,462.7 13.4% 19,746.2 19.8% $34,305 15.9%
United States 290,789.0 11.9% 167,174.4 17.9% $32,310 15.8%
Source: U.S. Department of Commerce 2003.
Table 1-82. Sacramento NWR: 2004 Recreation Visits
Activity Residents Non-Residents Total
Non-Consumptive:
Nature Trails 47,171 12,539 59,710
Observation Platforms 32,656 8,681 41,337
Other Wildlife Observation 418 111 529
Beach /Water Use 0 0 0
Other Recreation 0 0 0
Hunting:
Big Game 0 0 0
Small Game 659 7 666
Migratory Birds 6,785 69 6,854
Fishing:
Freshwater 0 0 0
Saltwater 0 0 0
Total Visitation 87,690 21,406 109,096
Total Visitors 71,617Regional Economic Analysis
82

Sample Refuges Descriptions
In FY 2004, visitor recreation expenditures totaled $1.6 million of which resident and non-resident expenditures were fairly evenly distributed. Non-consumptive activities accounted for the majority of expenditures (87 percent, $1.4 million).
Table 1-83. Sacramento NWR: Visitor Recreation Expenditures (2004 $,000)
Activity Residents Non-Residents Total
Non-Consumptive: $595.36 $824.68 $1,420.05
Hunting:
Big Game ─ ─ ─
Small Game $8.8 $0.3 $9.1
Migratory Birds $198.8 $10.9 $209.7
Total Hunting $207.6 $11.2 $218.8
Fishing:
Freshwater ─ ─ ─
Saltwater ─ ─ ─
Total Fishing ─ ─ ─
Total Expenditures $802.9 $835.9 $1,638.8
Table 1-84 summarizes the economic impacts associated with recreation visits. The total monetary value of economic activity generated in the local area was $2.4 million. This final demand generated 22 jobs and $856,400 in job income. Non-residents provided a $1.2 million stimulus to the local area economy.
Table 1-84. Sacramento NWR: Local Economic Effects Associated with Recreation Visits (2004 $,000)
Residents Non-Residents Total
Final Demand $1,187.6 $1,210.8 $2,398.4
Jobs 12 10 22
Job Income $431.0 $425.4 $856.4
Total Tax Revenue $167.6 $183.1 $350.6
Total economic effects (recreation-related expenditures plus net economic value) totaled $2.2 million. Using a ratio to broadly compare the magnitude of total economic effects and the refuge budget shows that $1.21 of recreation-related benefits are derived from every $1 of budget expenditure. The ratio is provided to broadly compare the magnitude of recreational benefits to the refuge budget and should not be used as a benefit-cost ratio. In addition to these recreational benefits, the refuge has other benefits including (but not limited to) providing important habitat for a variety of wildlife. Furthermore, the refuge budget also contributes to the regional economy through both its payroll and other maintenance
83

Banking on Nature: The Economic Benefits to Local Communities of National Wildlife Refuge Visitation
and operating expenses.
Table 1-85. Sacramento NWR: Summary of Local Economic Effects of Recreation Visits (2004 $,000)
FY 2004 Budget
RecreationExpenditures
Net Economic Value
Total economic effects per $1 budget expenditure
Sacramento NWR
$2,682.4 $1,638.8 $1,598.4 $1.21
84

Sample Refuges Descriptions
Saddle Mountain National Wildlife Refuge
Description
Spectacular shrub-steppe habitat, a rich cultural history, and the free-flowing Hanford Reach of the Columbia River characterize Saddle Mountain National Wildlife Refuge, which is located in south-central Washington State. The 195,000-acre Hanford Reach National Monument/Saddle Mountain National Wildlife Refuge was created when President Bill Clinton signed Proclamation 7319 on June 9, 2000. The Monument/Refuge is the first of its kind under U. S. Fish and Wildlife Service management within the lower 48 states and managed as a unit of the National Wildlife Refuge System.
The Monument/Refuge is comprised of the Fitzner-Eberhardt Arid Lands Ecology Reserve and the Saddle Mountain and Wahluke Units. These units encompass important riparian, aquatic, riverine and upland shrub-steppe habitats that are declining throughout the American west.
Numerous wildlife species depend upon these intact ecosystems; 43 species of fish, including threatened and endangered salmon and trout; 40 mammals; 246 birds; 4 amphibians; 9 reptiles and over 1500 invertebrates.
Area Economy
The economic base area for the refuge is defined as the five-county area identified in Table 1-86. The refuge is located in Adams, Benton, Franklin, and Grant Counties in Washington. The economic hub for the area includes the cities of Richland, Pasco, and Kennewick.
From 1993 to 2003, the area population increased 18.7 percent to 532,500 people. Total employment was 281,100 – an increase of 17.6 percent. Grant County had the highest employment increase (28.2 percent), while Adams County had the lowest employment increase (11.7 percent). During this time period, the area’s per capita income increased 2.8 percent. This increase was below Washington (17.6 percent) and the United States (15.8 percent).
Table 1-86. Saddle Mountain NWR:Summary of Area Economy, 2003
(Population & Employment in 000’s; Per Capita Income in 2004 dollars)
Population Employment Per Capita Income
County 2003
Percent change
1993-2003 2003
Percent change
1993-2003 2003
Percent change
1993-2003Adams, WA 16.6 11.4% 9.1 11.7% $22,688 -12.3%Benton, WA 153.9 22.9% 85.2 17.7% $30,480 6.5%Franklin, WA 56.3 31.4% 27.7 23.3% $21,310 -3.2%Grant, WA 78.8 28.2% 40.0 28.2% $22,335 -6.2%Yakima, WA 226.9 11.1% 119.2 13.7% $24,553 5.2%Area Total 532.5 18.7% 281.1 17.6% $25,536 2.8%Washington 6,131.3 16.1% 3,562.5 19.9% $34,140 17.6%
United States 290,789.0 11.9% 167,174.4 17.9% $32,310 15.8%
Source: U.S. Department of Commerce 2003.
85

Banking on Nature: The Economic Benefits to Local Communities of National Wildlife Refuge Visitation
Activity Levels
Table 1-87 shows the recreation visits to Saddle Mountain NWR. In FY 2004, recreation visits totaled 16,400, with non-consumptive activities accounting for 65 percent of visits. For non-consumptive activities, “other wildlife observation" includes birdwatchers and visitors pulled off along the highway to observe elk while ‘other recreation" includes kayaking, canoeing, rafting, motorboating, equestrian use, hiking, sightseeing, observatory visits, photography, and commercial river trips.
Table 1-87. Saddle Mountain NWR: 2004 Recreation Visits
Activity Residents Non-Residents Total
Non-Consumptive:
Nature Trails 350 150 500
Observation Platforms 0 0 0
Other Wildlife Observation 2,000 500 2,500
Beach /Water Use 0 0 0
Other Recreation 5,390 2,310 7,700
Hunting:
Big Game 480 120 600
Small Game 540 60 600
Migratory Birds 1,125 375 1,500
Fishing:
Freshwater 2,100 900 3,000
Saltwater 0 0 0
Total Visitation 11,985 4,415 16,400
Total Visitors 49,000
Regional Economic Analysis
Recreation visits resulted in $663,600 in visitor recreation expenditures (Table 1-88). While non-residents accounted for 27 percent of recreation visits, they accounted for 62 percent of recreation expenditures. Residents and non-residents do not have the same impact on expenditures because non-residents tend to spend more per visit (i.e., more travel expenses).
86

Sample Refuges Descriptions
Table 1-88. Saddle Mountain NWR: Visitor Recreation Expenditures (2004 $,000)
Activity Residents Non-Residents Total
Non-Consumptive: $130.02 $280.39 $410.41
Hunting:
Big Game $17.9 $11.0 $28.9
Small Game $7.2 $2.4 $9.6
Migratory Birds $33.0 $59.7 $92.7
Total Hunting $58.1 $73.1 $131.2
Fishing:
Freshwater $63.7 $58.3 $122.0
Saltwater ─ ─ ─
Total Fishing $63.7 $58.3 $122.0
Total Expenditures $251.8 $411.8 $663.6
Table 1-89 depicts the economic effects associated with recreation expenditures. Expenditures resulted in $926,500 in final demand, which generated 13 jobs and $329,400 in job income. Non-residents expenditures provided a $571,000 stimulus to the local area economy.
Table 1-89. Saddle Mountain NWR: Local Economic Effects Associated with Recreation Visits (2004 $,000)
Residents Non-Residents Total
Final Demand $355.5 $571.0 $926.5
Jobs 5 8 13
Job Income $126.6 $202.8 $329.4
Total Tax Revenue $54.1 $94.0 $148.0
Table 1-90 compares the refuge budget and the total economic effects (recreation-related expenditures plus net economic value). For every $1 of budget expenditures, $0.85 in recreation-related benefits are accrued. This ratio broadly compares the magnitude of the budget and recreation-related benefits and should not be used as a benefit-cost ratio. The refuge provides a variety of benefits including recreational benefits, ecological benefits, and educational benefits. In addition, the refuge budget also contributes to the local economy through its payroll and other maintenance and operating expenses.
87

Banking on Nature: The Economic Benefits to Local Communities of National Wildlife Refuge Visitation
Table 1-90. Saddle Mountain NWR: Summary of Local Economic Effects of Recreation Visits (2004 $,000)
FY 2004 Budget
RecreationExpenditures
Net Economic Value
Total economic effects per $1 budget expenditure
Saddle Mountain NWR
$1,442.0 $663.6 $563.3 $0.85
88

Sample Refuges Descriptions
Sonny Bono Salton Sea National Wildlife Refuge
Description
Sonny Bono Salton Sea Refuge management programs maintain and improve habitat for wintering waterfowl and shorebirds. Waterfowl programs are designed to limit waterfowl depredations to adjacent croplands. The refuge provides habitat for over 375 bird species for many as a critical wintering or migration stopover area.
The refuge winters up to 30,000 snow, Ross's, and Canada geese, and 60,000 ducks from November through February. Marsh birds and shorebirds account for more than 6,000,000 use-days each year. Endangered species observed on the refuge include the southern bald eagle, peregrine falcon, California brown pelican, Yuma clapper rail, and desert pupfish.
A significant Yuma clapper rail population nests on the refuge. Sensitive species using the refuge include the fulvous whistling-duck, wood stork, long-billed curlew, mountain plover, western snowy plover, burrowing owl, and white-faced ibis.
Area Economy
The Sonny Bono Salton Sea NWR is located in Imperial County in southern California. The county had a population of 148,900 in 2003, an increase of 12.2 percent from 1993 compared with a 13.4 percent increase for the state of California and a 12 percent increase for the U.S. Total area employment increased by 19.3 percent from 1993 to 2003 compared with a 19.8 percent increase in California and a 18 percent increase in the U.S.
Per capita personal income decreased in the area by 0.5 percent from 1993 to 2003. This compares with a 15.7 percent increase in California and a 15.6 percent increase in the U.S.
Table 1-91. Sonny Bono Salton Sea NWR:Summary of Area Economy, 2003
(Population & Employment in 000’s; Per Capita Income in 2004 dollars)
Population Employment Per Capita Income
County 2003
Percent change
1993-2003 2003
Percent change
1993-2003 2003
Percent change
1993-2003
Imperial, CA 148.9 12.2% 66.7 19.3% 21,232 -0.5%
California 35,462.7 13.4% 19,746.2 19.8% $34,317 15.7%
United States 290,789.0 11.9% 167,174.4 17.9% $32,322 15.6%
Source: U.S. Department of Commerce 2003.
89

Banking on Nature: The Economic Benefits to Local Communities of National Wildlife Refuge Visitation
Activity Levels
Sonny Bono Salton Sea NWR had 24,728 visitors in 2004. The vast majority of recreation visits, over 18,000 were for non-consumptive activities. About 73 percent of recreation visits were undertaken by non-residents.
Table 1-92. Sonny Bono Salton Sea NWR: 2004 Recreation Visits
Activity Residents Non-Residents Total
Non-Consumptive:
Nature Trails 1,848 5,543 7,391
Observation Platforms 3,184 7,428 10,612
Other Wildlife Observation 12 107 119
Beach /Water Use 0 0 0
Other Recreation 0 0
Hunting:
Big Game 0 0 0
Small Game 0 0 0
Migratory Birds 174 697 871
Fishing:
Freshwater 0 0 0
Saltwater 0 0 0
Total Visitation 5,217 13,776 18,993
Total Visitors 24,728
Regional Economic Analysis
The economic area for the Refuge is defined as Imperial County in California. It is assumed that Refuge visitor expenditures occur primarily within this county.
Table 1-93 shows visitor recreation expenditures for the Refuge in 2004. Total expenditures were $489,200 with non-residents accounting for $460,000 (94 percent of total expenditures). Expenditures on non-consumptive activities accounted for 76 percent of the total and hunting 24 percent.
90

Sample Refuges Descriptions
Table 1-93. Sonny Bono Salton Sea NWR: Visitor Recreation Expenditures (2004 $,000)
Activity Residents Non-Residents Total
Non-Consumptive: 23.9 346.9 370.8
Hunting:
Big Game ─ ─ ─
Small Game ─ ─ ─
Migratory Birds 5.2 113.1 118.3
Total Hunting 5.2 113.1 118.3
Fishing:
Freshwater ─ ─ ─
Saltwater ─ ─ ─
Total Fishing ─ ─ ─
Total Expenditures 29.1 460.0 489.2
Table 1-94 summarizes the total economic impacts associated with refuge visitor spending. Total final demand was $622,700. This is the total monetary value of economic activity generated in the county by refuge visitor spending. In turn, this final demand generated 7 jobs (both full-time and part-time) with total job income of $182,200. Total tax revenue generated (county, state and Federal) amounted to $73,200.
Table 1-94. Sonny Bono Salton Sea NWR: Local Economic Effects Associated with Recreation Visits
(2004 $,000)Residents Non-Residents Total
Final Demand $37.8 $584.8 $622.7
Jobs 0.5 6.8 7.3
Job Income $10.5 $171.6 $182.2
Total Tax Revenue $4.5 $68.7 $73.2
91

Banking on Nature: The Economic Benefits to Local Communities of National Wildlife Refuge Visitation
Table 1-5 shows total economic effects (total recreation expenditures plus net economic value) compared with the refuge budget for 2004. For an individual, net economic value is that person's total willingness to pay for a particular recreation activity minus his or her actual expenditures for that activity. The figure for economic value is derived by multiplying net economic values for hunting, fishing, and non-consumptive recreation use (on a per-day basis) by estimated refuge visitor days for that activity. This figure is combined with the estimate of total expenditures and divided by the refuge budget for 2004. The $0.77 means that for every $1 of budget expenditures, $0.77 of total economic effects are associated with these budget expenditures. This ratio is provided only for the purpose of broadly comparing the magnitude of economic effects resulting from refuge visitation to budget expenditures and should not be interpreted as a benefit-cost ratio.
Table 1-95. Sonny Bono Salton Sea NWR: Summary of Local Economic Effects of Recreation Visits
(2004 $,000)
FY 2004 Budget
RecreationExpenditures
Net Economic Value
Total economic effects per $1 budget expenditure
Sonny Bono Salton Sea NWR
$880.4 $489.2 $189.7 $0.77
92

Sample Refuges Descriptions
Stillwater National Wildlife Refuge
Description
The Stillwater National Wildlife Refuge Complex consists of Stillwater Refuge, Fallon Refuge, and Anaho Island Refuge in western Nevada. Together, these refuges encompass approximately 163,000 acres of wetland and upland habitats, freshwater and brackish water marshes, cottonwood and willow riparian areas, alkali playas, salt desert shrub lands, sand dunes, and a 500-acre rocky island in a desert lake.
Nearly 400 wildlife species, including more than 260 bird species rely on these habitats. The refuges provide important migration, breeding, and wintering habitat for up to 1 million migratory birds, including waterfowl, shorebirds, colonial nesting water birds, and neotropical migratory birds. Stillwater and Fallon Refuges are part of the Lahontan Valley Shorebird Reserve, one of only 16 sites recognized for their international importance by the Western Hemispheric Shorebird Reserve Network.
Recreational opportunities abound on Stillwater NWR. From waterfowl hunting to bird watching and wildlife observation, diverse habitats offer a variety of opportunities.
Area Economy
The area economy for Stillwater NWR is comprised of Churchill, Lyon, Storey, and Washoe Counties in Nevada (Table 1-96). From 1993 to 2003, the area’s population increased by 35.3 percent to 439,300, and the area’s employment increased a comparable 37.6 percent to 280,300. With the exception of Washoe County, each county’s per capita income is lower than the average per capita income for Nevada ($32,760) and the United States ($32,310).
Table 1-96. Stillwater NWR:Summary of Area Economy, 2003
(Population & Employment in 000’s; Per Capita Income in 2004 dollars)
Population Employment Per Capita Income
County 2003
Percent change
1993-2003 2003
Percent change
1993-2003 2003
Percent change
1993-2003Churchill, NV 24.3 23.0% 17.2 68.3% $29,276 18.1%Lyon, NV 40.3 71.0% 15.6 76.5% $23,884 -3.0%Storey, NV 3.5 32.8% 1.4 48.4% $29,880 11.1%Washoe, NV 371.2 33.2% 246.1 33.9% $39,259 16.9%
Area Total 439.3 35.3% 280.3 37.6% $37,222 15.1%Nevada 2,242.2 58.9% 1,347.5 62.6% $32,760 10.0%
93

Banking on Nature: The Economic Benefits to Local Communities of National Wildlife Refuge Visitation
United States 290,789.0 11.9% 167,174.4 17.9% $32,310 15.8%
Source: U.S. Department of Commerce 2003.
94

Sample Refuges Descriptions
Activity Levels
Recreation visits to Stillwater NWR totaled 35,720 in FY 2004 (Table 1-97). The number of visitors (21,163) is larger than the total number of visits because some visitors choose to partake in more than one activity. For example, a visitor may hike along the nature trails in the morning and enjoy the beach in the afternoon (1 visitor, 2 visits).
Refuge visitors enjoyed non-consumptive activities and hunting. The majority of visits (89 percent) were associated with non-consumptive activities. Eighty-four percent of visits (29,846) were by visitors from the local area.
Table 1-97. Stillwater NWR: 2004 Recreation Visits
Activity Residents Non-Residents Total
Non-Consumptive:
Nature Trails 2,384 2,201 4,585
Observation Platforms 0 0 0
Other Wildlife Observation 0 0 0
Beach /Water Use 4,750 250 5,000
Other Recreation 19,845 2,205 22,050
Hunting:
Big Game 20 5 25
Small Game 40 10 50
Migratory Birds 2,807 1,203 4,010
Fishing:
Freshwater 0 0 0
Saltwater 0 0 0
Total Visitation 29,846 5,874 35,720
Total Visitors 21,163
95

Banking on Nature: The Economic Benefits to Local Communities of National Wildlife Refuge Visitation
Regional Economic Analysis
Table 1-98 shows the visitor recreation expenditures for Stillwater NWR in FY 2004. Expenditures totaled nearly $636,000, with about two-thirds being associated with non-consumptive activities.
Table 1-98. Stillwater NWR: Visitor Recreation Expenditures (2004 $,000)
Activity Residents Non-Residents Total
Non-Consumptive: $229.62 $198.53 $428.14
Hunting:
Big Game $0.5 $0.3 $0.8
Small Game $0.7 $0.5 $1.2
Migratory Birds $61.7 $143.7 $205.4
Total Hunting $62.8 $144.5 $207.3
Fishing:
Freshwater ─ ─ ─
Saltwater ─ ─ ─
Total Fishing ─ ─ ─
Total Expenditures $292.4 $343.1 $635.5
Table 1-99 summarizes the economic effects associated with recreation visits to Stillwater NWR. The total monetary value of recreational visits (final demand) totaled $979,0000 in FY 2004. In turn, this final demand generated 11 jobs and $345,400 in job income.
Table 1-99. Stillwater NWR: Local Economic Effects Associated with Recreation Visits (2004 $,000)
Residents Non-Residents Total
Final Demand $451.9 $527.0 $979.0
Jobs 5 6 11
Job Income $161.7 $183.7 $345.4
Total Tax Revenue $60.8 $72.4 $133.2
Table 1-100 shows the recreation-related benefits (visitor expenditures plus net economic value) compared with the refuge budget. The budget for staff funding, operations, and maintenance was $1.6 million in FY 2004. Recreational benefits (recreation-related expenditures plus net economic value) summed to $1.2 million. The ratio ($0.79) is provided to broadly compare the magnitude of recreational benefits to the refuge budget and should not be used as a benefit-cost ratio. In addition to these recreational benefits, the refuge has other benefits including (but not limited to) protecting habitat that
96

Sample Refuges Descriptions
supports wildlife and migratory birds. Furthermore, the refuge budget is an additional stimulus to the local economy through both its payroll and other maintenance and operating expenses.
Table 1-100. Stillwater NWR: Summary of Local Economic Effects of Recreation Visits (2004 $,000)
FY 2004 Budget
RecreationExpenditures
Net Economic Value
Total economic effects per $1 budget expenditure
Stillwater NWR
$1,579.8 $635.5 $607.8 $0.79
97

Banking on Nature: The Economic Benefits to Local Communities of National Wildlife Refuge Visitation
Tijuana Slough National Wildlife Refuge
Description
Tijuana Slough Refuge is located in the most southwestern corner of the contiguous United States. It is one of southern California's largest remaining salt marshes without a road or railroad trestle running through it. This important salt marsh is surrounded by San Diego County and Tijuana, Mexico, with a population of 4.3 million people. Within this international bioregion, the refuge maintains essential habitats for many migrating shorebirds and waterfowl along the Pacific Flyway.
Tijuana Slough provides critical habitat for the Federally-listed endangered California least tern, light-footed clapper rail, least Bell's vireo, and salt marsh bird's-beak, an endangered plant species. Designated as a Globally Important Bird Area by the American Bird Conservancy, over 370 species of birds have been sighted on the refuge.
The refuge's habitat and wildlife management programs focus on the recovery of endangered species through research, habitat restoration, and environmental education.
Area Economy
The Tijuana Slough NWR is located in San Diego County in southern California. The area had a population of 2.9 million in 2003, an increase of 12.3 percent from 1993 compared with a 13.4 percent increase for the state of California and a 12 percent increase for the U.S. Total area employment increased by 28.3 percent from 1993 to 2003 compared with a 19.8 percent increase in California and a 18 percent increase in the U.S.
Per capita personal income increased in the area by 26.8 percent from 1993 to 2003. This compares with a 15.7 percent increase in California and a 15.6 percent increase in the U.S. .
Table 1-101. Tijuana Slough NWR:Summary of Area Economy, 2003
(Population & Employment in 000’s; Per Capita Income in 2004 dollars)
Population Employment Per Capita Income
County 2003
Percent change
1993-2003 2003
Percent change
1993-2003 2003
Percent change
1993-2003
San Diego, CA 2,918.8 12.3% 1,816.5 28.3% $36,809 26.8%
California 35,462.7 13.4% 19,746.2 19.8% $34,317 15.7%
United States 290,789.0 11.9% 167,174.4 17.9% $32,322 15.6%
Source: U.S. Department of Commerce 2003.
98

Sample Refuges Descriptions
Activity Levels
Tijuana Slough NWR had 65,000 visitors in 2004. All recreation visits were for non-consumptive activities. About 76 percent of all recreation visits were undertaken by area residents.
Table 1-102. Tijuana Slough NWR: 2004 Recreation Visits
Activity Residents Non-Residents Total
Non-Consumptive:
Nature Trails 48,000 12,000 60,000
Observation Platforms 20,000 5,000 25,000
Other Wildlife Observation 40,000 10,000 50,000
Beach /Water Use 0 0 0
Other Recreation 51,800 22,200 74,000
Hunting:
Big Game 0 0 0
Small Game 0 0 0
Migratory Birds 0 0 0
Fishing:
Freshwater 0 0 0
Saltwater 0 0 0
Total Visitation 159,800 49,200 209,000
Total Visitors 65,000
Regional Economic Analysis
The economic area for the Refuge is defined as San Diego County in California. It is assumed that Refuge visitor expenditures occur primarily within this county.
Table 1-103 shows visitor recreation expenditures for the Refuge in 2004. Total expenditures were $1,388,000 with non-residents accounting for $842,400 (61 percent of total expenditures). Expenditures on non-consumptive activities accounted for 100 percent of the total.
99

Banking on Nature: The Economic Benefits to Local Communities of National Wildlife Refuge Visitation
Table 1-103. Tijuana Slough NWR: Visitor Recreation Expenditures (2004 $,000)
Activity Residents Non-Residents Total
Non-Consumptive: 545.6 842.4 1,388.0
Hunting:
Big Game ─ ─ ─
Small Game ─ ─ ─
Migratory Birds ─ ─ ─
Total Hunting ─ ─ ─
Fishing: ─ ─ ─
Freshwater ─ ─ ─
Saltwater ─ ─ ─
Total Fishing ─ ─ ─
Total Expenditures 545.6 842.4 1,388.0
Table 1-104 summarizes the total economic impacts associated with refuge visitor spending. Total final demand was $2,221,100. This is the total monetary value of economic activity generated in the county by refuge visitor spending. In turn, this final demand generated 18 jobs (both full-time and part-time) with total job income of $614,900. Total tax revenue generated (county, state and Federal) amounted to $143,400.
Table 1-104. Tijuana Slough NWR: Local Economic Effects Associated with Recreation Visits (2004 $,000)
Residents Non-Residents Total
Final Demand $870.5 $1,350.6 $2,221.1
Jobs 7.1 10.9 18.0
Job Income $239.5 $375.4 $614.9
Total Tax Revenue $38.0 $105.4 $143.4
Table 1-105 shows total economic effects (total recreation expenditures plus net economic value) compared with the refuge budget for 2004. For an individual, net economic value is that person's total willingness to pay for a particular recreation activity minus his or her actual expenditures for that activity. The figure for economic value is derived by multiplying net economic values for hunting, fishing, and non-consumptive recreation use (on a per-day basis) by estimated refuge visitor days for that activity. This figure is combined with the estimate of total expenditures and divided by the refuge budget for 2004. The $8.79 means that for every $1 of budget expenditures, $8.79 of total economic effects are associated with these budget expenditures. This ratio is provided only for the purpose of broadly
100
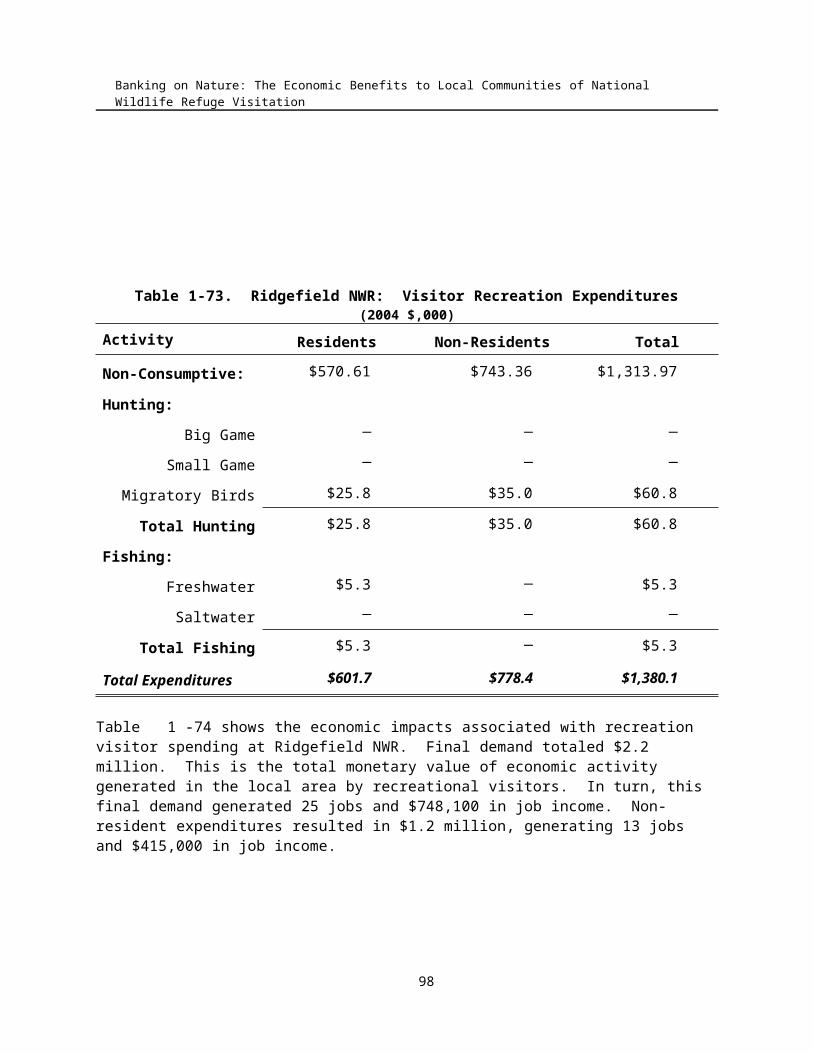
Sample Refuges Descriptions
comparing the magnitude of economic effects resulting from refuge visitation to budget expenditures and should not be interpreted as a benefit-cost ratio.
Table 1-105. Tijuana Slough NWR: Summary of Local Economic Effects of Recreation Visits (2004 $,000)
FY 2004 Budget
RecreationExpenditures
Net Economic Value
Total economic effects per $1 budget expenditure
Tijuana Slough NWR
$283.6 $1,388.0 $1,105.0 $8.79
101

Banking on Nature: The Economic Benefits to Local Communities of National Wildlife Refuge Visitation
Region 2
Region 2 for the U.S. Fish & Wildlife Service includes Arizona, New Mexico, Oklahoma, and Texas. Sample refuges selected within this region include:
Balcones Canyonlands NWR (Texas)Bill Williams NWR (Arizona)
Bitter Lake NWR (New Mexico)Bosque del Apache NWR (New Mexico)
Buffalo Lake NWR (Texas)Cibola NWR (Arizona)Kofa NWR (Arizona)
Maxwell NWR (New Mexico)Santa Ana NWR (Texas)
Sequoyah NWR (Oklahoma)Tishomingo NWR (Oklahoma)
Washita NWR (Oklahoma)
102

Sample Refuges Descriptions
Balcones Canyonlands National Wildlife Refuge
Description
The primary purpose of the Refuge is to conserve the nesting habitat of the endangered Golden-cheeked Warbler and Black-capped Vireo. The vegetation found in this area, known as the Texas Hill Country, includes various oaks, elm, and Ashe juniper trees (commonly called cedar). The Golden-cheeked Warbler and Black-capped Vireo depend on different successional stages of this vegetation. Both of these birds nest in central Texas, the warbler exclusively
The Edwards Plateau of central and West-Central Texas is an elevated expanse of land over 35,000 square miles in area. It is bordered on the south and east by the Balcones Escarpment, also known as Balcones Canyonlands or as the Texas Hill Country. This deeply dissected region of the Plateau contains many steep-banked streams and canyons.
Beneath the surface of the Plateau lies the karst habitat, an underground honeycomb of caves, sinkholes and springs. Various spiders, beetles, and other creatures inhabit this below-ground world and are unique to this area of Texas. Even deeper below the surface lies the Edwards Aquifer, which stores billions of gallons of water that supply drinking water for the almost one million people in San Antonio area. The aquifer is also the source of many Central Texas springs and the many beautiful Hill Country rivers, which eventually flow into the marshes, estuaries, and bays along the Texas coast. Protection of the springs is vital to the plants and animals that depend on the purity of the water.
The vegetation found in the Hill Country includes various oaks, elms, and Ashe juniper trees (called cedar in Texas). The endangered Golden-cheeked Warbler and Black-capped Vireo depend of different successional stages of this vegetation. Both of these birds nest in the Edwards Plateau, the Warbler exclusively.
The more than 525 plant species include the Texabama Croton, discovered here only in 1989. At least a third of the state's threatened and endangered species live or move through the area.
Area Economy
The Balcones Canyonlands NWR is located in Travis, Williamson and Burnet counties in southeastern Texas near the city of Austin. The area had a population of 1.2 million in 2003, an increase of 43.5 percent from 1993 compared with a 21.7 percent increase for the state of Texas and a 12 percent increase for the U.S. Total area employment increased by 43.7 percent from 1993 to 2003 compared with a 25.8 percent increase in Texas and a 18 percent increase in the U.S.
Per capita personal income increased in the area by 21.5 percent from 1993 to 2003. This compares with a 16.9 percent increase in Texas and a 15.6 percent increase in the U.S.
Activity Levels
Balcones Canyonlands NWR had 6,720 visitors in 2004. The vast majority of recreation visits, over 5,900 were for non-consumptive activities. About 74 percent of recreation visits were undertaken by area residents.
103
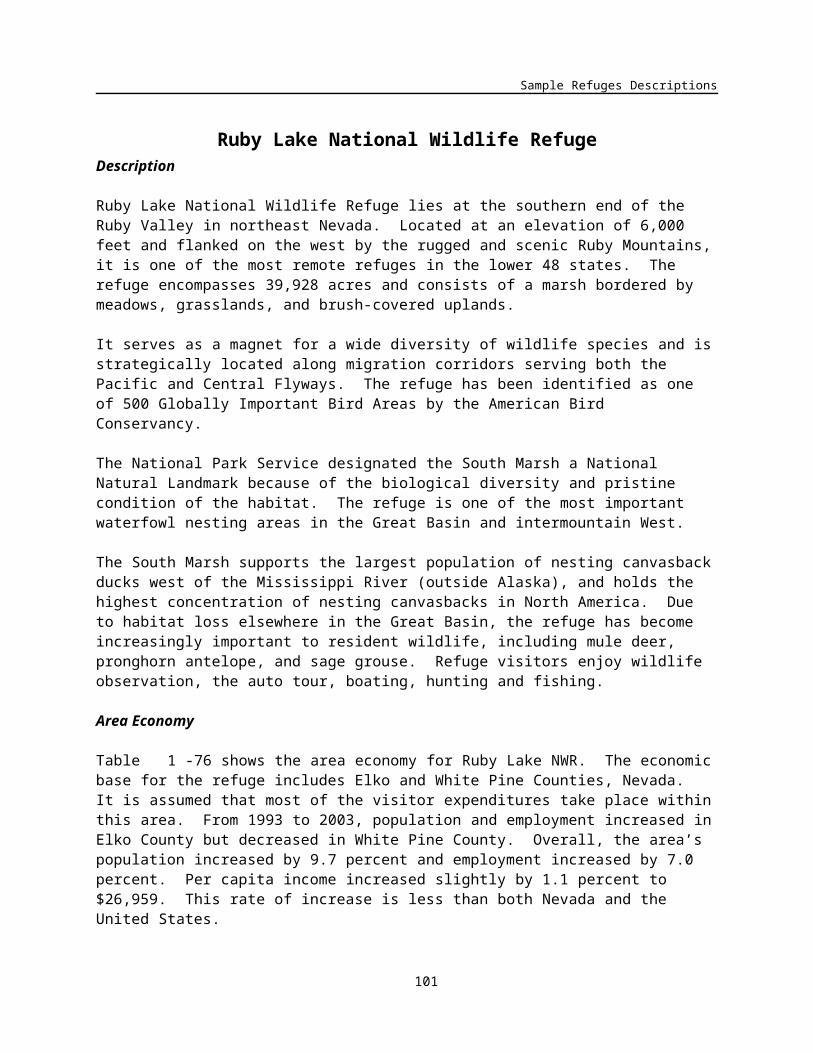
Banking on Nature: The Economic Benefits to Local Communities of National Wildlife Refuge Visitation
Table 2-106. Balcones Canyonlands NWR:Summary of Area Economy, 2003
(Population & Employment in 000’s; Per Capita Income in 2004 dollars)
Population Employment Per Capita Income
County 2003
Percent change
1993-2003 2003
Percent change
1993-2003 2003
Percent change
1993-2003
Travis, TX 854.4 31.6% 656.7 36.0% $35,369 25.6%
Williamson, TX 304.0 88.5% 112.9 100.3% $28,939 13.9%
Burnet, TX 38.8 63.4% 21.8 85.9% $26,804 8.4%
Area Total 1,197.2 43.5% 791.4 43.7% $33,458 21.5%
Texas 22,103.4 21.7% 12,383.6 25.8% $29,859 16.9%
United States 290,789.0 11.9% 167,174.4 17.9% $32,322 15.6%
Source: U.S. Department of Commerce 2003.
Table 2-107. Balcones Canyonlands NWR: 2004 Recreation Visits
Activity Residents Non-Residents Total
Non-Consumptive:
Nature Trails 3,056 764 3,820
Observation Platforms 1,373 740 2,113
Other Wildlife Observation 0 0 0
Beach /Water Use 0 0 0
Other Recreation 0 0 0
Hunting:
Big Game 269 179 448
Small Game 0 0 0
Migratory Birds 25 14 39
Fishing:
Freshwater 0 0 0
Saltwater 0 0 0
Total Visitation 4,724 1,696 6,420
Total Visitors 6,720
104

Sample Refuges Descriptions
Regional Economic Analysis
The economic area for the Refuge is defined as Travis, Williamson and Burnet counties in Texas. It is assumed that Refuge visitor expenditures occur primarily within this 3-county area.
Table 2-3 shows visitor recreation expenditures for the Refuge in 2004. Total expenditures were $84,800 with non-residents accounting for $56,000 (66 percent of total expenditures). Expenditures on non-consumptive activities accounted for 59 percent of the total and hunting 41 percent.
Table 2-108. Balcones Canyonlands NWR: Visitor Recreation Expenditures (2004 $,000)
Activity Residents Non-Residents Total
Non-Consumptive: $20.1 $29.8 $49.9
Hunting:
Big Game $8.5 $25.4 $33.8
Small Game ─ ─ ─
Migratory Birds $0.3 $0.8 $1.1
Total Hunting $8.8 $26.1 $34.9
Fishing:
Freshwater ─ ─ ─
Saltwater ─ ─ ─
Total Fishing ─ ─ ─
Total Expenditures $28.9 $56.0 $84.8
Table 2-109 summarizes the total economic impacts associated with refuge visitor spending. Total final demand was $127,000. This is the total monetary value of economic activity generated in the 3-county area by refuge visitor spending. In turn, this final demand generated two jobs with total job income of $35,800. Total tax revenue generated (county, state and Federal) amounted to $14,400.
Table 2-109. Balcones Canyonlands NWR: Local Economic Effects Associated with Recreation Visits
(2004 $,000)Residents Non-Residents Total
Final Demand $43.2 $83.8 $127.0
Jobs 0.4 0.8 2
Job Income $11.9 $23.9 $35.8
105

Banking on Nature: The Economic Benefits to Local Communities of National Wildlife Refuge Visitation
Total Tax Revenue $4.9 $9.5 $14.4
Table 1-5 shows total economic effects (total recreation expenditures plus net economic value) compared with the refuge budget for 2004. For an individual, net economic value is that person's total willingness to pay for a particular recreation activity minus his or her actual expenditures for that activity. The figure for economic value is derived by multiplying net economic values for hunting, fishing, and non-consumptive recreation use (on a per-day basis) by estimated refuge visitor days for that activity. This figure is combined with the estimate of total expenditures and divided by the refuge budget for 2004. The $0.23 means that for every $1 of budget expenditures, $0.23 of total economic effects are associated with these budget expenditures. This ratio is provided only for the purpose of broadly comparing the magnitude of economic effects resulting from refuge visitation to budget expenditures and should not be interpreted as a benefit-cost ratio.
Table 2-110. Balcones Canyonlands NWR: Summary of Local Economic Effects of Recreation Visits
(2004 $,000)
FY 2004 Budget
RecreationExpenditures
Net Economic Value
Total economic effects per $1 budget expenditure
Balcones Canyonlands NWR
$651.4 $84.8 $64.4 $0.23
106

Sample Refuges Descriptions
Bill Williams National Wildlife Refuge
Description
This 6,105-acre refuge holds one of the last stands of natural cottonwood-willow forests along the lower Colorado River, creating a unique ecosystem that provides good habitat for resident and migratory wildlife. There are few places where one can stand, look at a Saguaro cactus, a cattail stand, and a cottonwood tree together. This unique blend of upland desert, marsh, and desert riparian habitats provides for a diverse array of birds, mammals, and reptiles. This diversity of wildlife includes: the southwestern willow flycatcher, vermillion flycatcher, yellow-billed cuckoo, western tanager, Lazuli bunting, Yuma clapper rail, beaver, bobcat, mountain lion, gray fox, javelina, mule deer, desert bighorn sheep, ringtailed cat, Razorback sucker and bontail chub.
Area Economy
The Bill Williams NWR is located in Mohave and La Paz counties in western Arizona along the Colorado River. The area had a population of 191,944 in 2003, an increase of 46.6 percent from 1993 compared with a 37.2 percent for the state of Arizona and a 12 percent increase for the U.S. Total area employment increased by 49.2 percent from 1993 to 2003 compared with a 44.4 percent increase in Arizona and a 18 percent increase in the U.S.
Per capita personal income increased in the area by 6.3 percent from 1993 to 2003. This compares with a 16.7 percent increase in Arizona and a 15.6 percent increase in the U.S.
Table 2-111. Bill Williams NWR:Summary of Area Economy, 2003
(Population & Employment in 000’s; Per Capita Income in 2004 dollars)
Population Employment Per Capita Income
County 2003
Percent change
1993-2003 2003
Percent change
1993-2003 2003
Percent change
1993-2003
Mohave, AZ 172.2 48.9% 62.0 51.9% $20,876 6.5%
La Paz, AZ 19.7 29.7% 7.5 30.1% $19,157 3.7%
Area Total 191,944 46.6% 69,423 49.2% $20,699 6.3%
Arizona 5,579.2 37.2% 2,926.5 44.4% $27,967 16.7%
United States 290,789.0 11.9% 167,174.4 17.9% $32,322 15.6%
Source: U.S. Department of Commerce 2003.
107

Banking on Nature: The Economic Benefits to Local Communities of National Wildlife Refuge Visitation
Activity Levels
Bill Williams NWR had 38,563 visitors in 2004. The vast majority of recreation visits, about 74,000, were for non-consumptive activities. About 90 percent of recreation visits were undertaken by non-residents.
Table 2-112. Bill Williams NWR: 2004 Recreation Visits
Activity Residents Non-Residents Total
Non-Consumptive:
Nature Trails 1,149 10,340 11,489
Observation Platforms 625 5,628 6,253
Other Wildlife Observation 3,499 13,998 17,497
Beach /Water Use 0 0 0
Other Recreation 1,937 36,801 38,738
Hunting:
Big Game 16 0 16
Small Game 221 25 246
Migratory Birds 61 7 68
Fishing:
Freshwater 691 13,130 13,821
Saltwater 0 0 0
Total Recreation Visitation 8,200 79,928 88,128
Total Visitors 38,563
Regional Economic Analysis
The economic area for the Refuge is defined as Mohave and La Paz counties in Arizona. It is assumed that Refuge visitor expenditures occur primarily within this 2-county area.
Table 2-8 shows visitor recreation expenditures for the Refuge in 2004. Total expenditures were $2.6 million with non-residents accounting for 98 percent of total expenditures. Expenditures on non-consumptive activities accounted for about 98 percent of total expenditures.
108

Sample Refuges Descriptions
Table 2-113. Bill Williams NWR: Visitor Recreation Expenditures (2004 $,000)
Activity Residents Non-Residents Total
Non-Consumptive: $51.3 $2,496.2 $2,547.5
Hunting:
Big Game $0.6 ─ $0.6
Small Game $0.7 $0.3 $1.0
Migratory Birds $0.4 $0.2 $0.6
Total Hunting $1.7 $0.5 $2.2
Fishing:
Freshwater $11.3 $36.5 $47.9
Saltwater ─ ─ ─
Total Fishing $11.3 $36.5 $47.9
Total Expenditures $64.3 $2,533.2 $2,597.5
Table 2-114 summarizes the total economic impacts associated with refuge visitor spending. Total final demand was $3,668,900. This is the total monetary value of economic activity generated in the 2-county area by refuge visitor spending. In turn, this final demand generated 41 jobs (both full-time and part-time) with total job income of $936,700. Total tax revenue generated (county, state and Federal) amounted to $437,200.
Table 2-114. Bill Williams NWR: Local Economic Effects Associated with Recreation Visits (2004 $,000)
Residents Non-Residents Total
Final Demand $89.5 $3,579.4 $3,668.9
Jobs 1.0 40.0 41.0
Job Income $22.9 $913.9 $936.7
Total Tax Revenue $10.2 $427.0 $437.2
Table 2-115 shows total economic effects (total recreation expenditures plus net economic value) compared with the refuge budget for 2004. For an individual, net economic value is that person's total willingness to pay for a particular recreation activity minus his or her actual expenditures for that activity. The figure for economic value is derived by multiplying net economic values for hunting, fishing, and non-consumptive recreation use (on a per-day basis) by estimated refuge visitor days for that activity. This figure is combined with the estimate of total expenditures and divided by the refuge budget for 2004. The $5.37 means that for every $1 of budget expenditures, $5.37 of total economic effects are associated with these budget expenditures. This ratio is provided only for the purpose of broadly
109

Banking on Nature: The Economic Benefits to Local Communities of National Wildlife Refuge Visitation
comparing the magnitude of economic effects resulting from refuge visitation to budget expenditures and should not be interpreted as a benefit-cost ratio.
Table 2-115. Bill Williams NWR: Summary of Local Economic Effects of Recreation Visits (2004 $,000)
FY 2004 Budget
RecreationExpenditures
Net Economic Value
Total economic effects per $1 budget expenditure
Bill Williams NWR
$772.1 $2,597.5 $1,544.7 $5.37
110

Sample Refuges Descriptions
Bitter Lake National Wildlife Refuge
Description
Located where the Chihuahuan Desert meets the southern plains, Bitter Lake National Wildlife Refuge provides habitat for some of the rarest creatures in New Mexico. Established in 1937 to provide habitat for thousands of migrating sandhill cranes and waterfowl, the Refuge is becoming popular for its diverse flora and fauna.
Straddling the Pecos River, the Refuge consists of an assortment of water habitats surrounded by a harsh, dry environment. The waters support unique wildlife, such as the Pecos pupfish, Roswell spring snail, green throat darter, and Noel's amphipod, along the more than 80 species of dragonflies.
Native grasslands, sand dunes, brushy bottomlands, and re-rimmed plateaus provide a sharp contrast to the wetland habitats of the Refuge. Roadrunners, scaled quail, and horned lizards are commonly seen in these drier areas.
Area Economy
The Bitter Lake NWR is located in Chaves County in southeastern New Mexico along the Pecos River. The county had a population of 61,400 in 2003, an increase of 3.2 percent from 1993 compared with a 14.8 for the state of New Mexico and a 12 percent increase for the U.S. Total area employment increased by 6.1 percent from 1993 to 2003 compared with a 21.1 percent increase in New Mexico and a 18 percent increase in the U.S.
Per capita personal income increased in the area by 11.9 percent from 1993 to 2003. This compares with a 15.5 percent increase in New Mexico and a 15.6 percent increase in the U.S.
Table 2-116. Bitter Lake NWR:Summary of Area Economy, 2003
(Population & Employment in 000’s; Per Capita Income in 2004 dollars)
Population Employment Per Capita Income
County 2003
Percent change
1993-2003 2003
Percent change
1993-2003 2003
Percent change
1993-2003
Chaves, NM 61.4 3.2% 28.3 6.1% $22,300 11.9%
New Mexico 1,878.6 14.8% 1,006.4 21.1% $25,670 15.5%
United States 290,789.0 11.9% 167,174.4 17.9% $32,322 15.6%
Source: U.S. Department of Commerce 2003.
111

Banking on Nature: The Economic Benefits to Local Communities of National Wildlife Refuge Visitation
Activity Levels
Bitter Lake NWR had 35,000 visitors in 2004. Almost all of the recreation visits were for non-consumptive activities. About 70 percent of recreation visits were undertaken by non-residents.
Table 2-117. Bitter Lake NWR: 2004 Recreation Visits
Activity Residents Non-Residents Total
Non-Consumptive:
Nature Trails 35,867 15,371 51,238
Observation Platforms 3,236 1,387 4,623
Other Wildlife Observation 0 0 0
Beach /Water Use 0 0 0
Other Recreation 389 167 556
Hunting:
Big Game 59 7 66
Small Game 63 7 70
Migratory Birds 305 34 339
Fishing:
Freshwater 0 0 0
Saltwater 0 0 0
Total Visitation 16,973 39,919 56,891
Total Visitors 35,000
Regional Economic Analysis
The economic area for the Refuge is defined as Chaves County in New Mexico. It is assumed that Refuge visitor expenditures occur primarily within this county.
Table 2-13 shows visitor recreation expenditures for the Refuge in 2004. Total expenditures were $666,400 with non-residents accounting for $457,300 (69 percent of total expenditures). Expenditures on non-consumptive activities accounted for almost 100 percent of all recreation expenditures.
112

Sample Refuges Descriptions
Table 2-118. Bitter Lake NWR: Visitor Recreation Expenditures (2004 $,000)
Activity Residents Non-Residents Total
Non-Consumptive: $205.4 $455.3 $660.7
Hunting:
Big Game $0.8 $0.4 $1.2
Small Game $0.3 $0.1 $0.4
Migratory Birds $2.7 $1.5 $4.1
Total Hunting $3.8 $2.0 $5.8
Fishing:
Freshwater ─ ─ ─
Saltwater ─ ─ ─
Total Fishing ─ ─ ─
Total Expenditures $209.1 $457.3 $666.4
Table 2-14 summarizes the total economic impacts associated with refuge visitor spending. Total final demand was $908,000. This is the total monetary value of economic activity generated in the county by refuge visitor spending. In turn, this final demand generated 11 jobs (both full-time and part-time) with total job income of $227,000. Total tax revenue generated (county, state and Federal) amounted to $179,000.
Table 2-119. Bitter Lake NWR: Local Economic Effects Associated with Recreation Visits (2004 $,000)
Residents Non-Residents Total
Final Demand $284.6 $623.4 $908.0
Jobs 3.3 7.2 10.6
Job Income $70.2 $156.8 $227.0
Total Tax Revenue $54.1 $124.9 $179.0
Table 2-120 shows total economic effects (total recreation expenditures plus net economic value) compared with the refuge budget for 2004. For an individual, net economic value is that person's total willingness to pay for a particular recreation activity minus his or her actual expenditures for that activity. The figure for economic value is derived by multiplying net economic values for hunting, fishing, and non-consumptive recreation use (on a per-day basis) by estimated refuge visitor days for that activity. This figure is combined with the estimate of total expenditures and divided by the refuge budget for 2004. The $1.13 means that for every $1 of budget expenditures, $1.13 of total economic effects are associated with these budget expenditures. This ratio is provided only for the purpose of broadly
113

Banking on Nature: The Economic Benefits to Local Communities of National Wildlife Refuge Visitation
comparing the magnitude of economic effects resulting from refuge visitation to budget expenditures and should not be interpreted as a benefit-cost ratio.
Table 2-120. Bitter Lake NWR: Summary of Local Economic Effects of Recreation Visits (2004 $,000)
FY 2004 Budget
RecreationExpenditures
Net Economic Value
Total economic effects per $1 budget expenditure
Bitter Lake NWR
$1,004.0 $666.4 $470.3 $1.13
114

Sample Refuges Descriptions
Bosque del Apache National Wildlife Refuge
Description
Bosque del Apache, which means "woods of the Apache", was named for the people who often camped in the riverside forest. This 57,191 acre refuge straddles the Rio Grande Valley in Socorro County, New Mexico. It ranges in elevation from 4,500 to 6,272 feet above sea level. It receives approximately 7 inches of precipitation each year. Within the refuge borders lie three wilderness areas totaling approximately 30,850 acres and five research natural areas totaling 18,500 acres.
Each season at Bosque del Apache NWR offers unique wildlife viewing opportunities. Peak visitation occurs in winter, when cranes, bald eagles, and snow geese are present. During the spring and fall, visitors can see warblers, flycatchers, and shorebirds. The summer months are a good time to see nesting songbirds, waders, shorebirds, and ducks.
Area Economy
The Bosque del Apache NWR is located in Socorro County in central New Mexico along the Rio Grande River. A significant number of Refuge visitors come from Bernalillo and Sierra counties near the Refuge. The area had a population of 613,800 in 2003, an increase of 13.1 percent from 1993 compared with a 14.8 percent for the state of New Mexico and a 12 percent increase for the U.S. Total area employment increased by 18.7 percent from 1993 to 2003 compared with a 21.1 percent increase in New Mexico and a 18 percent increase in the U.S.
Per capita personal income increased in the area by 15.9 percent from 1993 to 2003. This compares with a 15.5 percent increase in New Mexico and a 15.6 percent increase in the U.S.
Table 2-121. Bosque del Apache NWR:Summary of Area Economy, 2003
(Population & Employment in 000’s; Per Capita Income in 2004 dollars)
Population Employment Per Capita Income
County 2003
Percent change
1993-2003 2003
Percent change
1993-2003 2003
Percent change
1993-2003
Bernalillo, NM 582.5 12.9% 399.4 18.7% $30,876 16.3%
Socorro, NM 18.2 15.4% 7.7 16.5% $19,200 13.9%
Sierra, NM 13.1 19.1% 4.5 21.2% $18,789 1.4%
Area Total 613.8 13.1% 411.6 18.7% $30,272 15.9%
New Mexico 1,878.6 14.8% 1,006.4 21.1% $25,670 15.5%
United States 290,789.0 11.9% 167,174.4 17.9% $32,322 15.6%
Source: U.S. Department of Commerce 2003.
115

Banking on Nature: The Economic Benefits to Local Communities of National Wildlife Refuge Visitation
Activity Levels
Bosque del Apache NWR had 106,617 visitors in 2004. The vast majority of recreation visits, over 337,000, were for non-consumptive activities. About 95 percent of recreation visits were undertaken by non-residents.
Table 2-122. Bosque del Apache NWR: 2004 Recreation Visits
Activity Residents Non-Residents Total
Non-Consumptive:
Nature Trails 8,510 161,695 170,205
Observation Platforms 5,452 103,589 109,041
Other Wildlife Observation 1,817 34,531 36,348
Beach /Water Use 0 0 0
Other Recreation 1,072 20,374 21,446
Hunting:
Big Game 53 13 66
Small Game 28 113 141
Migratory Birds 157 52 209
Fishing:
Freshwater 14 127 141
Saltwater 0 0 0
Total Visitation 17,104 320,493 337,597
Total Visitors 106,617
Regional Economic Analysis
The economic area for the Refuge is defined as Socorro, Bernalillo, and Sierra counties in New Mexico. It is assumed that Refuge visitor expenditures occur primarily within this 3-county area. Table 2-123 shows visitor recreation expenditures for the Refuge in 2004. Total expenditures were $13.9 million with non-residents accounting for $13.7 million. Expenditures on non-consumptive activities accounted for close to 100 percent of total expenditures.
116

Sample Refuges Descriptions
Table 2-123. Bosque del Apache NWR: Visitor Recreation Expenditures (2004 $,000)
Activity Residents Non-Residents Total
Non-Consumptive: $163.9 $13,703.1 $13,867.0
Hunting:
Big Game $1.4 $1.6 $3.0
Small Game $0.2 $2.8 $3.0
Migratory Birds $1.8 $3.0 $4.8
Total Hunting $3.5 $7.4 $10.9
Fishing:
Freshwater $0.3 $1.0 $1.3
Saltwater ─ ─ ─
Total Fishing 0.3 1.0 $1.3
Total Expenditures $167.7 $13,711.5 $13,879.2
Table 2-124 summarizes the total economic impacts associated with refuge visitor spending. Total final demand was $20,300,300. This is the total monetary value of economic activity generated in the 3-county area by refuge visitor spending. In turn, this final demand generated 203 jobs (both full-time and part-time) with total job income of $5,659,400. Total tax revenue generated (county, state and Federal) amounted to $4,306,200.
Table 2-124. Bosque del Apache NWR: Local Economic Effects Associated with Recreation Visits (2004 $,000)
Residents Non-Residents Total
Final Demand $244.9 $20,055.4 $20,300.3
Jobs 2.4 201.0 203.4
Job Income $67.7 $5,591.6 $5,659.4
Total Tax Revenue $51.6 $4,254.6 $4,306.2
Table 2-125 shows total economic effects (total recreation expenditures plus net economic value) compared with the refuge budget for 2004. For an individual, net economic value is that person's total willingness to pay for a particular recreation activity minus his or her actual expenditures for that activity. The figure for economic value is derived by multiplying net economic values for hunting, fishing, and non-consumptive recreation use (on a per-day basis) by estimated refuge visitor days for that activity. This figure is combined with the estimate of total expenditures and divided by the refuge budget for 2004. The $7.54 means that for every $1 of budget expenditures, $7.54 of total economic effects are associated with these budget expenditures. This ratio is provided only for the purpose of broadly
117

Banking on Nature: The Economic Benefits to Local Communities of National Wildlife Refuge Visitation
comparing the magnitude of economic effects resulting from refuge visitation to budget expenditures and should not be interpreted as a benefit-cost ratio.
Table 2-125. Bosque del Apache NWR: Summary of Local Economic Effects of Recreation Visits (2004 $,000)
FY 2004 Budget
RecreationExpenditures
Net Economic Value
Total economic effects per $1 budget expenditure
Bosque del Apache NWR
$2,589.7 $13,879.2 $5,657.7 $7.54
118

Sample Refuges Descriptions
Buffalo Lake National Wildlife Refuge
Description
A valuable wintering area for migrating waterfowl, thousands of ducks and geese over-winter on Buffalo Lake National Wildlife Refuge every year. Located in Randall County in the Texas Panhandle, the refuge is made up of 7,664 acres of shortgrass prairie, riparian, marsh, woodland and cropland habitats. Maintaining these habitats provide homes for migratory and resident wildlife species.
Riparian areas, consisting of trees and grasses adjacent the dry lake bed, provide habitat used for feeding and nesting by neotropical migratory birds, deer, and numerous other wildlife species.
Wildlife food crops are planted in the dry lake bottom by cooperative farming. The crops are used by wildlife for food and the mix of crops, stubble, and natural plants provide nesting and winter cover for migratory and resident wildlife.
Buffalo Lake NWR contains some of the best remaining shortgrass prairie in the United States, including 175 acres designated a National Natural Landmark. Shortgrass prairie ecosystems were historically maintained by annual grazing of migrating American bison. With the bison gone, this ecosystem is maintained by grazing cattle.
Waterfowl habitat is provided by a moist soil management unit located in Stewart Marsh. Flooded each spring, the unit slowly dries, promoting growth of aquatic waterfowl food plants. The unit is flooded again in fall just before the ducks arrive. The result is food and cover for water birds seeking a rest stop. Additional wildlife water is found in artificial ponds and water tanks.
Area Economy
The Buffalo Lake NWR is located in Randall County in the Texas panhandle on the Red River. Potter and Deaf Smith counties adjacent to the Refuge are sources of a significant number of Refuge visitors. The area had a population of 243,300 in 2003, an increase of 12.9 percent from 1993 compared with a 21.7 percent for the state of Texas and a 12 percent increase for the U.S. Total area employment increased by 18.1 percent from 1993 to 2003 compared with a 25.8 percent increase in Texas and a 18 percent increase in the U.S.
Per capita personal income increased in the area by 3.7 percent from 1993 to 2003. This compares with a 16.9 percent increase in Texas and a 15.6 percent increase in the U.S.
Activity Levels
Buffalo Lake NWR had 3,543 visitors in 2004. The majority of recreation visits, over 82 percent, were for non-consumptive activities. Freshwater fishing accounted for 18 percent of total visitation. Area residents accounted for 91 percent of total refuge recreation visitation.
119

Banking on Nature: The Economic Benefits to Local Communities of National Wildlife Refuge Visitation
Table 2-126. Buffalo Lake NWR:Summary of Area Economy, 2003
(Population & Employment in 000’s; Per Capita Income in 2004 dollars)
Population Employment Per Capita Income
County 2003
Percent change
1993-2003 2003
Percent change
1993-2003 2003
Percent change
1993-2003
Potter, TX 117.6 14.8% 104.0 31.0% $24,761 11.1%
Randall, TX 107.3 14.1% 28.6 -7.6% $27,560 1.4%Deaf Smith, TX 18.4 -3.0% 8.9 -5.8% $23,915 -17.5%
Area Total 243.3 12.9% 141.5 18.1% $25,931 3.7%
Texas 22,103.4 21.7% 12,383.6 25.8% $29,859 16.9%
United States 290,789.0 11.9% 167,174.4 17.9% $32,322 15.6%
Source: U.S. Department of Commerce 2003.
Table 2-127. Buffalo Lake NWR: 2004 Recreation Visits
Activity Residents Non-Residents Total
Non-Consumptive:
Nature Trails 3,435 382 3,817
Observation Platforms 1,852 206 2,058
Other Wildlife Observation 360 40 400
Beach /Water Use 0 0 0
Other Recreation 254 28 282
Hunting:
Big Game 0 0 0
Small Game 0 0 0
Migratory Birds 0 0 0
Fishing:
Freshwater 1,260 140 1,400
Saltwater 0 0 0
Total Visitation 7,161 796 7,957
Total Visitors 3,543
120

Sample Refuges Descriptions
Regional Economic Analysis
The economic area for the Refuge is defined as Randall, Potter, and Deaf Smith counties in Texas. It is assumed that Refuge visitor expenditures occur primarily within this 3-county area.
Table 2-128 shows visitor recreation expenditures for the Refuge in 2004. Total expenditures were $119,000 with residents accounting for $81,700 (69 percent of total expenditures). Expenditures on non-consumptive activities accounted for 76 percent of the total with fishing accounting for 24 percent.
Table 2-128. Buffalo Lake NWR: Visitor Recreation Expenditures (2004 $,000)
Activity Residents Non-Residents Total
Non-Consumptive: $61.1 $29.9 $90.9
Hunting:
Big Game ─ ─ ─
Small Game ─ ─ ─
Migratory Birds ─ ─ ─
Total Hunting ─ ─ ─
Fishing:
Freshwater $20.6 $7.4 $28.0
Saltwater ─ ─ ─
Total Fishing $20.6 $7.4 $28.0
Total Expenditures $81.7 $37.3 $119.0
Table 2-129 summarizes the total economic impacts associated with refuge visitor spending. Total final demand was $179,800. This is the total monetary value of economic activity generated in the 3-county area by refuge visitor spending. In turn, this final demand generated two jobs (both full-time and part-time) with total job income of $48,600. Total tax revenue generated (county, state and Federal) amounted to $21,500.
Table 2-129. Buffalo Lake NWR: Local Economic Effects Associated with Recreation Visits (2004 $,000)Residents Non-Residents Total
Final Demand $123.4 $56.4 $179.8
Jobs 1.3 0.6 1.9
Job Income $33.3 $15.3 $48.6
Total Tax Revenue $14.7 $6.8 $21.5
121

Banking on Nature: The Economic Benefits to Local Communities of National Wildlife Refuge Visitation
Table 2-130 shows total economic effects (total recreation expenditures plus net economic value) compared with the refuge budget for 2004. For an individual, net economic value is that person's total willingness to pay for a particular recreation activity minus his or her actual expenditures for that activity. The figure for economic value is derived by multiplying net economic values for hunting, fishing, and non-consumptive recreation use (on a per-day basis) by estimated refuge visitor days for that activity. This figure is combined with the estimate of total expenditures and divided by the refuge budget for 2004. The $0.58 means that for every $1 of budget expenditures, $0.58 of total economic effects are associated with these budget expenditures. This ratio is provided only for the purpose of broadly comparing the magnitude of economic effects resulting from refuge visitation to budget expenditures and should not be interpreted as a benefit-cost ratio.
Table 2-130. Buffalo Lake NWR: Summary of Local Economic Effects of Recreation Visits (2004 $,000)
FY 2004 Budget
RecreationExpenditures
Net Economic Value
Total economic effects per $1 budget expenditure
Buffalo Lake NWR
$491.6 $119.0 $164.9 $0.58
122

Sample Refuges Descriptions
Cibola National Wildlife Refuge
Description
Cibola NWR is located in the floodplain of the lower Colorado River and surrounded by a fringe of desert ridges and washes. The refuge encompasses both the historic Colorado River channel as well as a channelized portion constructed in the late 1960's. Along with these main waterbodies, several important backwaters are home to many wildlife species that reside in this portion of the Sonoran Desert. Because of the river's life sustaining water, wildlife here survive in an environment that reaches 120 degrees in the summer and receives an average of only 2 inches of rain per year.
Over 288 species of birds have been found on Cibola NWR, including many species of migratory songbirds, Gambel's quail, roadrunners, mourning and white-winged doves, phainopepla, greater sandhill cranes, Canada and snow geese, Vermillion flycatchers, grosbeaks and many more. The bald eagle, southwestern willow flycatcher and Yuma clapper rail are among the endangered birds that use Cibola NWR. Other listed species include the desert tortoise, razorback sucker, bonytail chub, and desert pupfish.
Area Economy
The Cibola NWR is located in La Paz County in southwestern Arizona along the Colorado River. A significant number of visitors come from Mohave and Yuma counties in Arizona and Imperial County in California. The area had a population of 511,500 in 2003, an increase of 31.6 percent from 1993 compared with a 37.2 percent increase for the state of Arizona, a 13.4 percent increase for the state of California, and a 12 percent increase for the U.S. Total area employment increased by 34.8 percent from 1993 to 2003 compared with a 44.4 percent increase in Arizona, a 19.8 percent increase in California, and a 18 percent increase in the U.S.
Per capita personal income increased in the area by 1.3 percent from 1993 to 2003. This compares with a 16.7 percent increase in Arizona, a 15.7 percent increase in California, and a 15.6 percent increase in the U.S.
123

Banking on Nature: The Economic Benefits to Local Communities of National Wildlife Refuge Visitation
Table 2-131. Cibola NWR:Summary of Area Economy, 2003
(Population & Employment in 000’s; Per Capita Income in 2004 dollars)
Population Employment Per Capita Income
County 2003
Percent change
1993-2003 2003
Percent change
1993-2003 2003
Percent change
1993-2003
Mohave, AZ 172.2 48.9% 62.0 51.9% $20,876 6.5%
Yuma, AZ 170.6 36.6% 77.9 38.5% $19,675 -1.2%
La Paz, AZ 19.7 29.7% 7.5 30.1% $19,157 3.7%
Imperial, CA 148.9 12.2% 66.7 19.3% $21,232 -0.5%
Area Total 511.5 31.6% 214.0 34.8% $20,513 1.3%
Arizona 5,579.2 37.2% 2,926.5 44.4% $27,967 16.7%
California 35,462.7 13.4% 19,746.2 19.8% $34,317 15.7%
United States 290,789.0 11.9% 167,174.4 17.9% $32,322 15.6%
Source: U.S. Department of Commerce 2003.
124

Sample Refuges Descriptions
Activity Levels
Cibola NWR had 55,000 visitors in 2004. The majority of recreation visits, 51 percent, were for hunting and fishing. About 70 percent of recreation visits were undertaken by area residents.
Table 2-132. Cibola NWR: 2004 Recreation Visits
Activity Residents Non-Residents Total
Non-Consumptive:
Nature Trails 240 960 1,200
Observation Platforms 240 960 1,200
Other Wildlife Observation 130 520 650
Beach /Water Use 160 640 800
Other Recreation 76 76 152
Hunting:
Big Game 54 161 215Small Game 483 483 965
Migratory Birds 530 1,590 2,120
Fishing:
Freshwater 536 179 715
Saltwater 0 0 0
Total Recreation Visitation 2,449 5,569 8,017
Total Visitors 55,000
Regional Economic Analysis
The economic area for the Refuge is defined as Mohave, Yuma, and La Paz counties in Arizona and Imperial County in California. It is assumed that Refuge visitor expenditures occur primarily within this 4-county area.
Table 2-28 shows visitor recreation expenditures for the Refuge in 2004. Total expenditures were $240,400 with non-residents accounting for $219,300 (91 percent of total expenditures). Expenditures on non-consumptive activities accounted for 34 percent of the total, hunting 55 percent and fishing 10 percent.
125

Banking on Nature: The Economic Benefits to Local Communities of National Wildlife Refuge Visitation
Table 2-133. Cibola NWR: Visitor Recreation Expenditures (2004 $,000)
Activity Residents Non-Residents Total
Non-Consumptive: $4.4 $78.2 $82.6
Hunting:
Big Game $1.5 $19.6 $21.0
Small Game $3.1 $12.1 $15.2
Migratory Birds $6.2 $90.5 $96.7
Total Hunting $10.8 $122.2 $132.9
Fishing:
Freshwater $5.9 $18.9 $24.8
Saltwater ─ ─ ─
Total Fishing $5.8 $18.9 $24.8
Total Expenditures $21.1 $219.3 $240.4
Table 2-134 summarizes the total economic impacts associated with refuge visitor spending. Total final demand was $410,700. This is the total monetary value of economic activity generated in the 4-county area by refuge visitor spending. In turn, this final demand generated 4 jobs (both full-time and part-time) with total job income of $126,100. Total tax revenue generated (county, state and Federal) amounted to $49,500.
Table 2-134. Cibola NWR: Local Economic Effects Associated with Recreation Visits (2004 $,000)
Residents Non-Residents Total
Final Demand $36.1 $374.6 $410.7
Jobs 0.1 3.4 4
Job Income $3.8 $122.3 $126.1
Total Tax Revenue $4.4 $45.1 $49.5
Table 2-135 shows total economic effects (total recreation expenditures plus net economic value) compared with the refuge budget for 2004. For an individual, net economic value is that person's total willingness to pay for a particular recreation activity minus his or her actual expenditures for that activity. The figure for economic value is derived by multiplying net economic values for hunting, fishing, and non-consumptive recreation use (on a per-day basis) by estimated refuge visitor days for that activity. This figure is combined with the estimate of total expenditures and divided by the refuge budget for 2004. The $0.45 means that for every $1 of budget expenditures, $0.45 of total economic effects are associated with these budget expenditures. This ratio is provided only for the purpose of broadly
126

Sample Refuges Descriptions
comparing the magnitude of economic effects resulting from refuge visitation to budget expenditures and should not be interpreted as a benefit-cost ratio.
Table 2-135. Cibola NWR: Summary of Local Economic Effects of Recreation Visits (2004 $,000)
FY 2004 Budget
RecreationExpenditures
Net Economic Value
Total economic effects per $1 budget expenditure
Cibola NWR $871.4 $240.1 $149.1 $0.45
127

Banking on Nature: The Economic Benefits to Local Communities of National Wildlife Refuge Visitation
Kofa National Wildlife Refuge
Description
Kofa National Wildlife Refuge was established in 1939. The refuge encompasses 665,400 acres of pristine desert that is home to the desert bighorn sheep and the California fan palm, the only native palm in Arizona.
Bighorn sheep are found chiefly in the two mountain ranges that dominate the refuge landscape - the Kofa and Castle Dom Mountains. Although these mountains are not especially high, they are extremely rugged and rise sharply from the surrounding desert plains, providing excellent bighorn sheep habitat. A wide variety of plant life is found throughout the refuge.
Area Economy
The Kofa NWR is located in La Paz and Yuma counties in southwestern Arizona. The area had a population of 190,300 in 2003, an increase of 35.9 percent from 1993, compared with a 37.2 percent increase for the state of Arizona and a 12 percent increase for the U.S. Total area employment increased by 37.7 percent from 1993 to 2003 compared with a 44.4 percent increase in Arizona and a 18 percent increase in the U.S.
Per capita personal income declined in the area by 0.7 percent from 1993 to 2003. This compares with a 16.7 percent increase in Arizona and a 15.6 percent increase in the U.S.
Table 2-136. Kofa NWR:Summary of Area Economy, 2003
(Population & Employment in 000’s; Per Capita Income in 2004 dollars)
Population Employment Per Capita Income
County 2003
Percent change
1993-2003 2003
Percent change
1993-2003 2003
Percent change
1993-2003
Yuma, AZ 170.6 36.6% 77.9 38.5% $19,675 -1.2%
La Paz, AZ 19.7 29.7% 7.5 30.1% $19,157 3.7%
Area Total 190.3 35.9% 85.3 37.7% $19,622 -0.7%
Arizona 5,579.2 37.2% 2,926.5 44.4% $27,967 16.7%
United States 290,789.0 11.9% 167,174.4 17.9% $32,322 15.6%
Source: U.S. Department of Commerce 2003.
128

Sample Refuges Descriptions
Activity Levels
Kofa NWR had 49,140 visitors in 2004. Most visits were for non-consumptive activities. About 75 percent of recreation visits were undertaken by area residents.
Table 2-137. Kofa NWR: 2004 Recreation Visits
Activity Residents Non-Residents Total
Non-Consumptive:
Nature Trails 6,495 2,165 8,660
Observation Platforms 0 0 0
Other Wildlife Observation 32,440 10,813 43,253
Beach /Water Use 0 0 0
Other Recreation 169,674 56,558 226,232
Hunting:
Big Game 1,350 150 1,500
Small Game 2,400 600 3,000
Migratory Birds 0 0 0
Fishing:
Freshwater 0 0 0
Saltwater 0 0 0
Total Visitation 212,359 70,286 282,645
Total Visitors 49,140
Regional Economic Analysis
The economic area for the Refuge is defined as La Paz and Yuma counties in Arizona. It is assumed that Refuge visitor expenditures occur primarily within this 2-county area.
Table 2-33 shows visitor recreation expenditures for the Refuge in 2004. Total expenditures were $6.7 million with non-residents accounting for $3.9 million (59 percent of total expenditures). Expenditures on non-consumptive activities accounted for 97 percent of the total, hunting about 3 percent.
129

Banking on Nature: The Economic Benefits to Local Communities of National Wildlife Refuge Visitation
Table 2-138. Kofa NWR: Visitor Recreation Expenditures (2004 $,000)
Activity Residents Non-Residents Total
Non-Consumptive: $2,651.9 $3,888.7 $6,540.6
Hunting:
Big Game $48.7 $24.3 $73.0
Small Game $31.2 $30.1 $61.3
Migratory Birds ─ ─ ─
Total Hunting $80.0 $54.3 $134.2
Fishing:
Freshwater ─ ─ ─
Saltwater ─ ─ ─
Total Fishing ─ ─ ─
Total Expenditures $2,731.8 $3,943.0 $6,674.8
Table 2-139 summarizes the total economic impacts associated with refuge visitor spending. Total final demand was $8,572,900. This is the total monetary value of economic activity generated in the 2-county area by refuge visitor spending. In turn, this final demand generated 106 jobs (both full-time and part-time) with total job income of $2,479,900. Total tax revenue generated (county, state and Federal) amounted to $890,700.
Table 2-139. Kofa NWR: Local Economic Effects Associated with Recreation Visits (2004 $,000)
Residents Non-Residents Total
Final Demand $3,500.9 $5,072.0 $8,572.9
Jobs 43.9 62.3 106.2
Job Income $1,009.0 $1,471.0 $2,479.9
Total Tax Revenue $360.0 $530.7 $890.7
Table 2-140 shows total economic effects (total recreation expenditures plus net economic value) compared with the refuge budget for 2004. For an individual, net economic value is that person's total willingness to pay for a particular recreation activity minus his or her actual expenditures for that activity. The figure for economic value is derived by multiplying net economic values for hunting, fishing, and non-consumptive recreation use (on a per-day basis) by estimated refuge visitor days for that activity. This figure is combined with the estimate of total expenditures and divided by the refuge budget for 2004. The $17.71 means that for every $1 of budget expenditures, $17.71 of total economic effects are associated with these budget expenditures. This ratio is provided only for the purpose of broadly
130

Sample Refuges Descriptions
comparing the magnitude of economic effects resulting from refuge visitation to budget expenditures and should not be interpreted as a benefit-cost ratio.
Table 2-140. Kofa NWR: Summary of Local Economic Effects of Recreation Visits (2004 $,000)
FY 2004 Budget
RecreationExpenditures
Net Economic Value
Total economic effects per $1 budget expenditure
Kofa NWR $734.5 $6,674.8 $6,330.3 $17.71
131

Banking on Nature: The Economic Benefits to Local Communities of National Wildlife Refuge Visitation
Maxwell National Wildlife Refuge
Description
Located in the high central plains of northeastern New Mexico, Maxwell National Wildlife Refuge was established in 1965 as a feeding and resting area for migratory birds. Over 350 acres of the Refuge are planted with wheat, corn, barley, and alfalfa to provide food for resident and migratory wildlife. Visitors may see bald and golden eagles, falcons, hawks, sandhill cranes, ducks, white pelicans, burrowing owls, great horned owls, black-tailed prairie dogs, coyotes, mule deer, white-tailed deer, and the occasional elk. The refuge has approximately 2200 acres of both healthy and disturbed short-grass prairie habitat, some of which is in the process of being restored.
Area Economy
The Maxwell NWR is located in Colfax County in northeastern New Mexico near the Colorado border. The county had a population of 13,900 million in 2003, an increase of 3.7 percent from 1993 compared with a 14.8 percent increase for the state of New Mexico and a 12 percent increase for the U.S. Total area employment increased by 17.5 percent from 1993 to 2003 compared with a 21.1 percent increase in New Mexico and a 18 percent increase in the U.S.
Per capita personal income increased in the area by 10.7 percent from 1993 to 2003. This compares with a 15.5 percent increase in New Mexico and a 15.6 percent increase in the U.S.
Table 2-141. Maxwell NWR:Summary of Area Economy, 2003
(Population & Employment in 000’s; Per Capita Income in 2004 dollars)
Population Employment Per Capita Income
County 2003
Percent change
1993-2003 2003
Percent change
1993-2003 2003
Percent change
1993-2003
Colfax, NM 13.9 3.7% 8.5 17.5% $23,103 10.7%
New Mexico 1,878.6 14.8% 1,006.4 21.1% $25,670 15.5%
United States 290,789.0 11.9% 167,174.4 17.9% $32,322 15.6%
Source: U.S. Department of Commerce 2003.
Activity Levels
Maxwell NWR had 4,000 visitors in 2004. Fishing accounted for 52 percent of recreation visits while non-consumptive activities accounted for 48 percent. About 52 percent of recreation visits were undertaken by area residents.
132

Sample Refuges Descriptions
Table 2-142. Maxwell NWR: 2004 Recreation Visits
Activity Residents Non-Residents Total
Non-Consumptive:
Nature Trails 91 1,724 1,815
Observation Platforms 0 0 0
Other Wildlife Observation 20 80 100
Beach /Water Use 0 0 0
Other Recreation 120 0 120
Hunting:
Big Game 0 0 0
Small Game 0 0 0
Migratory Birds 0 0 0
Fishing:
Freshwater 1,980 220 2,200
Saltwater 0 0 0
Total Visitation 2,211 2,024 4,235
Total Visitors 4,000
Regional Economic Analysis
The economic area for the Refuge is defined as Colfax County in New Mexico. It is assumed that Refuge visitor expenditures occur primarily within this county.
Table 2-38 shows visitor recreation expenditures for the Refuge in 2004. Total expenditures were $132,900 with non-residents accounting for $110,000 (83 percent of total expenditures). Expenditures on fishing accounted for 69 percent of the total, with non-consumptive activities accounting for 31 percent.
133

Banking on Nature: The Economic Benefits to Local Communities of National Wildlife Refuge Visitation
Table 2-143. Maxwell NWR: Visitor Recreation Expenditures (2004 $,000)
Activity Residents Non-Residents Total
Non-Consumptive: $1.2 $40.3 $41.5
Hunting:
Big Game ─ ─ ─
Small Game ─ ─ ─
Migratory Birds ─ ─ ─
Total Hunting ─ ─ ─
Fishing:
Freshwater $21.6 $69.8 $91.4
Saltwater ─ ─ ─
Total Fishing $21.6 $69.8 $91.4
Total Expenditures $22.8 $110.0 $132.9
Table 2-144 summarizes the total economic impacts associated with refuge visitor spending. Total final demand was $171,200. This is the total monetary value of economic activity generated in the county by refuge visitor spending. In turn, this final demand generated two jobs (both full-time and part-time) with total job income of $45,500. Total tax revenue generated (county, state and Federal) amounted to $31,800.
Table 2-144. Maxwell NWR: Local Economic Effects Associated with Recreation Visits (2004 $,000)
Residents Non-Residents Total
Final Demand $29.4 $141.7 $171.2
Jobs 0.3 1.9 2.2
Job Income $7.8 $37.7 $45.5
Total Tax Revenue $5.5 $26.3 $31.8
Table 1-5 shows total economic effects (total recreation expenditures plus net economic value) compared with the refuge budget for 2004. For an individual, net economic value is that person's total willingness to pay for a particular recreation activity minus his or her actual expenditures for that activity. The figure for economic value is derived by multiplying net economic values for hunting, fishing, and non-consumptive recreation use (on a per-day basis) by estimated refuge visitor days for that activity. This figure is combined with the estimate of total expenditures and divided by the refuge budget for 2004. The $0.56 means that for every $1 of budget expenditures, $0.56 of total economic effects are associated with these budget expenditures. This ratio is provided only for the purpose of broadly comparing the
134

Sample Refuges Descriptions
magnitude of economic effects resulting from refuge visitation to budget expenditures and should not be interpreted as a benefit-cost ratio.
Table 2-145. Maxwell NWR: Summary of Local Economic Effects of Recreation Visits (2004 $,000)
FY 2004 Budget
RecreationExpenditures
Net Economic Value
Total economic effects per $1 budget expenditure
Maxwell NWR $361.1 $132.9 $68.2 $0.56
135

Banking on Nature: The Economic Benefits to Local Communities of National Wildlife Refuge Visitation
Santa Ana National Wildlife Refuge
Description
Along the banks of the lower Rio Grande is the Santa Ana National Wildlife Refuge, a 2,088 acre refuge established in 1943 for the protection of migratory birds. Considered the ‘jewel’ of the refuge system, this essential ‘island’ of thorn forest habitat is host or home to nearly 400 different types of birds and a myriad of other species, including the indigo snake, malachite butterfly and the endangered ocelot.
At an ecological crossroad, Santa Ana is strategically located where subtropical climate, gulf coast, great plains and Chihuahuan desert meet. Thousands of birds from the Central and Mississippi flyways funnel through the area on their way to and from Central and South America. This small patch of midvalley riparian woodland is also habitat for about one half of all butterfly species found in the United States.Before dams and control structures significantly reduced the flow of the Rio Grande, periodic floods cut shifting channels into the delta creating crescent-shaped oxbow lakes, referred to as ‘resacas.’ Santa Ana’s management program mimics the historical flooding of the Rio Grande, maintaining the bottom land hardwood forest and providing crucial nesting and feeding habitat for birds, watering holes for animals, and homes for countless amphibians, reptiles, crustaceans and insects.
With over 95 percent of the original habitat in the lower Rio Grande delta cleared or altered, Santa Ana is a reminder of the semitropical thorn forest that once dominated the area.
Area Economy
The Santa Ana NWR is located in Hildalgo County in southern Texas on the Rio Grade River near the Gulf of Mexico. Cameron County is a source of a significant number of refuge visitors. The area had a population of 997,800 in 2003, an increase of 35.6 percent from 1993 compared with a 21.7 percent increase for the state of Texas and a 12 percent increase for the U.S. Total area employment increased by 51.2 percent from 1993 to 2003 compared with a 25.8 percent increase in Texas and a 18 percent increase in the U.S.
Per capita personal income increased in the area by 12.0 percent from 1993 to 2003. This compares with a 16.9 percent increase in Texas and a 15.6 percent increase in the U.S.
Activity Levels
Santa Ana NWR had 122,860 visitors in 2004. Non-consumptive activities accounted for all refuge recreation visits. About 78 percent of recreation visits were undertaken by non-residents.
136

Sample Refuges Descriptions
Table 2-146. Santa Ana NWR:Summary of Area Economy, 2003
(Population & Employment in 000’s; Per Capita Income in 2004 dollars)
Population Employment Per Capita Income
County 2003
Percent change
1993-2003 2003
Percent change
1993-2003 2003
Percent change
1993-2003
Hidalgo, TX 635.4 42.0% 241.9 62.1% $15,594 13.7%
Cameron, TX 362.4 25.7% 150.9 36.4% $16,748 10.3%
Area Total 997.8 35.6% 392.8 51.2% $16,013 12.0%
Texas 22,103.4 21.7% 12,383.6 25.8% $29,859 16.9%
United States 290,789.0 11.9% 167,174.4 17.9% $32,322 15.6%
Source: U.S. Department of Commerce 2003.
Table 2-147. Santa Ana NWR: 2004 Recreation Visits
Activity Residents Non-Residents Total
Non-Consumptive:
Nature Trails 17,930 71,722 89,652
Observation Platforms 13,097 52,387 65,484
Other Wildlife Observation 0 0 0
Beach /Water Use 0 0 0
Other Recreation 4,855 4,855 9,710
Hunting:
Big Game 0 0 0
Small Game 0 0 0
Migratory Birds 0 0 0
Fishing:
Freshwater 0 0 0
Saltwater 0 0 0
Total Visitation 35,882 128,964 164,846
Total Visitors 122,860
137

Banking on Nature: The Economic Benefits to Local Communities of National Wildlife Refuge Visitation
Regional Economic Analysis
The economic area for the Refuge is defined as Hidalgo and Cameron counties in Texas. It is assumed that Refuge visitor expenditures occur primarily within this 2-county area.
Table 2-148 shows visitor recreation expenditures for the Refuge in 2004. Total expenditures were $2,323,600 with non-residents accounting for $2,190,100 (94 percent of total expenditures).
Table 2-148. Santa Ana NWR: Visitor Recreation Expenditures (2004 $,000)
Activity Residents Non-Residents Total
Non-Consumptive: $133.5 $2,190.1 $2,323.6
Hunting:
Big Game ─ ─ ─
Small Game ─ ─ ─
Migratory Birds ─ ─ ─
Total Hunting ─ ─ ─
Fishing: ─ ─ ─
Freshwater ─ ─ ─
Saltwater ─ ─ ─
Total Fishing ─ ─ ─
Total Expenditures $133.5 $2,190.1 $2,323.6
Table 2-44 summarizes the total economic impacts associated with refuge visitor spending. Total final demand was $3,412,700. This is the total monetary value of economic activity generated in the 3-county area by refuge visitor spending. In turn, this final demand generated 40 jobs (both full-time and part-time) with total job income of $856,700. Total tax revenue generated (county, state and Federal) amounted to $380,300.
Table 2-149. Santa Ana NWR: Local Economic Effects Associated with Recreation Visits (2004 $,000)
Residents Non-Residents Total
Final Demand $195.4 $3,217.3 $3,412.7
Jobs 2.2 37.5 39.8
Job Income $48.4 $808.3 $856.7
Total Tax Revenue $21.5 $358.8 $380.3
138

Sample Refuges Descriptions
Table 2-150 shows total economic effects (total recreation expenditures plus net economic value) compared with the refuge budget for 2004. For an individual, net economic value is that person's total willingness to pay for a particular recreation activity minus his or her actual expenditures for that activity. The figure for economic value is derived by multiplying net economic values for hunting, fishing, and non-consumptive recreation use (on a per-day basis) by estimated refuge visitor days for that activity. This figure is combined with the estimate of total expenditures and divided by the refuge budget for 2004. The $3.25 means that for every $1 of budget expenditures, $3.25 of total economic effects are associated with these budget expenditures. This ratio is provided only for the purpose of broadly comparing the magnitude of economic effects resulting from refuge visitation to budget expenditures and should not be interpreted as a benefit-cost ratio.
Table 2-150. Santa Ana NWR: Summary of Local Economic Effects of Recreation Visits (2004 $,000)
FY 2004 Budget
RecreationExpenditures
Net Economic Value
Total economic effects per $1 budget expenditure
Santa Ana NWR
$1,047.8 $2,323.6 $1,085.7 $3.25
139

Banking on Nature: The Economic Benefits to Local Communities of National Wildlife Refuge Visitation
Sequoyah National Wildlife Refuge
Description
Sequoyah National Wildlife Refuge was established in 1970 to provide habitat for waterfowl and other migratory birds and to provide food and cover for resident wildlife. The refuge was named in honor of Sequoyah, a Cherokee Native American who developed an alphabet for the Cherokee language.
Wildlife found at Sequoyah NWR varies with the seasons. During fall, winter, and spring, waterfowl are numerous. Mallards are, by far, the most abundant of the wintering ducks. The refuge hosts the largest concentration of snow geese in the state, and large numbers of wading and shorebirds are common in the summer and fall.
The bottomland habitat provides a home for a variety of wildlife, including songbirds, hawks, bobwhite quail, bobcat, squirrels, muskrat, and rabbits. Reptiles, such as the green tree frog, diamondback water snake, red-eared slider, cottonmouth, and bullfrog are also common in the refuge woodlands.
The refuge is located approximately 150 miles east of Oklahoma City, and 35 miles west of Fort Smith, Arkansas, off of Interstate 40.
Area Economy
The Sequoyah NWR is located in Muskogee, Sequoyah and Haskell counties in eastern Oklahoma on the Arkansas River near the Arkansas border. Sebastian and Crawford counties in Arkansas also provide a significant number of refuge visitors. The area had a population of 295,500 in 2003, an increase of 11 percent from 1993 compared with a 7.8 percent increase for the state of Oklahoma, an 11.1 percent increase for Arkansas, and a 12 percent increase for the United States. Total area employment increased by 15.7 percent from 1993 to 2003 compared with a 14.9 percent increase in Oklahoma, a 14.8 percent increase in Arkansas and an 18 percent increase in the U.S.
Per capita personal income increased in the area by 18.2 percent from 1993 to 2003. This compares with a 17.6 percent increase in Oklahoma, a 15 percent increase in Arkansas, and a 15.6 percent increase in the U.S.
140

Sample Refuges Descriptions
Table 2-151. Sequoyah NWR:Summary of Area Economy, 2003
(Population & Employment in 000’s; Per Capita Income in 2004 dollars)
Population Employment Per Capita Income
County 2003
Percent change
1993-2003 2003
Percent change
1993-2003 2003
Percent change
1993-2003
Muskogee, OK 70.4 2.2% 38.2 14.2% $22,606 19.9%
Sequoyah, OK 40.0 13.7% 13.8 24.8% $20,516 16.5%
Haskell, OK 13.1 9.3% 6.5 46.7% $22,002 30.0%
Sebastian, AR 117.3 11.4% 86.9 7.9% $28,909 17.9%
Crawford, AR 55.7 21.4% 25.2 40.5% $20,911 15.8%
Area Total 295.5 11.0% 170.5 15.7% $24,482 18.2%
Oklahoma 3,506.5 7.8% 1,983.9 14.9% $27,440 17.6%
Arkansas 2,727.8 11.1% 1,502.1 14.8% $25,042 15.0%
United States 290,789.0 11.9% 167,174.4 17.9% $32,322 15.6%
Source: U.S. Department of Commerce 2003.
141

Banking on Nature: The Economic Benefits to Local Communities of National Wildlife Refuge Visitation
Activity Levels
Sequoyah NWR had 101,668 visitors in 2004. The vast majority of recreation visits were for fishing and hunting. About 67 percent of recreation visits were undertaken by area residents.
Table 2-152. Sequoyah NWR: 2004 Recreation Visits
Activity Residents Non-Residents Total
Non-Consumptive:
Nature Trails 1,660 3,873 5,533
Observation Platforms 260 1,040 1,300
Other Wildlife Observation 2,928 1,255 4,183
Beach /Water Use 0 0 0
Other Recreation 400 400 800
Hunting:
Big Game 122 31 153
Small Game 925 616 1541
Migratory Birds 27,393 22,412 49,805
Fishing:
Freshwater 38,497 6,794 45,290
Saltwater 0 0 0
Total Visitation 72,184 36,421 108,605
Total Visitors 101,668
Regional Economic Analysis
The economic area for the Refuge is defined as Muskogee, Sequoyah and Haskell counties in Oklahoma and Sebastian and Crawford counties in Arkansas. It is assumed that Refuge visitor expenditures occur primarily within this 5-county area.
Table 2-48 shows visitor recreation expenditures for the Refuge in 2004. Total expenditures were $3,957,100 with non-residents accounting for $3,100,100 (78 percent of total expenditures). Expenditures on non-consumptive activities accounted for 4 percent of the total, hunting 51 percent and fishing 45 percent.
142

Sample Refuges Descriptions
Table 2-153. Sequoyah NWR: Visitor Recreation Expenditures (2004 $,000)
Activity Residents Non-Residents Total
Non-Consumptive: $25.4 $132.0 $157.4
Hunting:
Big Game $4.4 $4.9 $9.4
Small Game $4.5 $11.6 $16.1
Migratory Birds $402.1 $1,595.0 $1,997.1
Total Hunting $411.0 $1,611.5 $2,022.6
Fishing:
Freshwater $420.5 $1,356.6 $1,777.1
Saltwater ─ ─ ─
Total Fishing $420.5 $1,356.6 $1,777.1
Total Expenditures $856.9 $3,100.1 $3,957.1
Table 2-154 summarizes the total economic impacts associated with refuge visitor spending. Total final demand was $5,873,900. This is the total monetary value of economic activity generated in the 5-county area by refuge visitor spending. In turn, this final demand generated 69 jobs (both full-time and part-time) with total job income of $1,516,900. Total tax revenue generated (county, state and Federal) amounted to $926,600.
Table 2-154. Sequoyah NWR: Local Economic Effects Associated with Recreation Visits (2004 $,000)
Residents Non-Residents Total
Final Demand $1,271.7 $4,602.1 $5,873.9
Jobs 15.0 54.3 69.2
Job Income $324.4 $1,192.4 $1,516.9
Total Tax Revenue $202.7 $723.9 $926.6
Table 2-155 shows total economic effects (total recreation expenditures plus net economic value) compared with the refuge budget for 2004. For an individual, net economic value is that person's total willingness to pay for a particular recreation activity minus his or her actual expenditures for that activity. The figure for economic value is derived by multiplying net economic values for hunting, fishing, and non-consumptive recreation use (on a per-day basis) by estimated refuge visitor days for that activity. This figure is combined with the estimate of total expenditures and divided by the refuge budget for 2004. The $7.87 means that for every $1 of budget expenditures, $7.87 of total economic effects are associated with these budget expenditures. This ratio is provided only for the purpose of broadly
143

Banking on Nature: The Economic Benefits to Local Communities of National Wildlife Refuge Visitation
comparing the magnitude of economic effects resulting from refuge visitation to budget expenditures and should not be interpreted as a benefit-cost ratio.
Table 2-155. Sequoyah NWR: Summary of Local Economic Effects of Recreation Visits (2004 $,000)
FY 2004 Budget
RecreationExpenditures
Net Economic Value
Total economic effects per $1 budget expenditure
Sequoyah NWR
$871.4 $3,957.1 $2,900.7 $7.87
144

Sample Refuges Descriptions
Tishomingo National Wildlife Refuge
Description
Tishomingo National Wildlife Refuge lies at the upper Washita arm of Lake Texoma and is administered for the benefit of migratory waterfowl in the Central Flyway. Most of the refuge's 16,464 acres, including the 4,500-acre Cumberland Pool, were acquired in 1946. The refuge gets its name from a famous Chickasaw Indian Chief and is shared with a nearby century-old town.
The 16,464 acre Tishomingo National Wildlife Refuge is one of more than 540 refuges throughout the United States managed by the Fish and Wildlife Service. Tishomingo National Wildlife Refuge lies at the upper Washita arm of Lake Texoma and is administered for the benefit of migratory waterfowl in the Central Flyway. Most of the refuge including the 4,500 acre Cumberland Pool was acquired in 1946.
The refuge offers a variety of aquatic habitats for wildlife. The murky water of Cumberland Pool provides abundant nutrients for innumerable microscopic plants and animals. Seasonally flooded flats and willow shallows lying at the Pool's edge also provide excellent wildlife habitat. Upland areas vary from grasslands to wild plum thickets to oak-hickory-elm woodlands. Crops, primarily wheat and corn, are grown on approximately 900 acres to provide forage and grain for waterfowl.
Area Economy
The Tishomingo NWR is located in Bryan and Marshall counties in southern Oklahoma on Lake Texoma. The area had a population of 50,100 million in 2003, an increase of 12.5 percent from 1993 compared with a 7.8 percent increase for the state of Oklahoma and a 12 percent increase for the U.S. Total area employment increased by 29.6 percent from 1993 to 2003 compared with a 14.9 percent increase in Oklahoma and a 18 percent increase in the U.S.
Per capita personal income increased in the area by 21.8 percent from 1993 to 2003. This compares with a 17.6 percent increase in Oklahoma and a 15.6 percent increase in the U.S.
Activity Levels
Tishomingo NWR had 193,926 visitors in 2004. The majority of recreation visits, over 154,000, were for non-consumptive activities. Fishing accounted for 22 percent of refuge recreation visits. About 60 percent of recreation visits were undertaken by area residents.
145

Banking on Nature: The Economic Benefits to Local Communities of National Wildlife Refuge Visitation
Table 2-156. Tishomingo NWR:Summary of Area Economy, 2003
(Population & Employment in 000’s; Per Capita Income in 2004 dollars)
Population Employment Per Capita Income
County 2003
Percent change
1993-2003 2003
Percent change
1993-2003 2003
Percent change
1993-2003
Bryan, OK 37.2 10.9% 19.9 32.8% $22,126 24.6%
Marshall, OK 13.7 17.1% 6.2 20.1% $21,036 14.1%
Area Total 50.1 12.5% 26.1 29.6% $21,833 21.8%
Oklahoma 3,506.5 7.8% 1,983.9 14.9% $27,440 17.6%
United States 290,789.0 11.9% 167,174.4 17.9% $32,322 15.6%
Source: U.S. Department of Commerce 2003.
Table 2-157. Tishomingo NWR: 2004 Recreation Visits
Activity Residents Non-Residents Total
Non-Consumptive:
Nature Trails 41,100 27,400 68,500
Observation Platforms 3,720 2,480 6,200
Other Wildlife Observation 39,000 2,600 65,000
Beach /Water Use 0 0 0
Other Recreation 8,748 5,832 14,580
Hunting:
Big Game 450 300 750
Small Game 100 25 125
Migratory Birds 72 108 180
Fishing:
Freshwater 25,620 17,080 42,700
Saltwater 0 0 0
Total Visitation 118,810 79,225 198,035
Total Visitors 193,926
146

Sample Refuges Descriptions
Regional Economic Analysis
The economic area for the Refuge is defined as Bryan and Marshall counties in Oklahoma. It is assumed that Refuge visitor expenditures occur primarily within this 2-county area. Table 2-158 shows visitor recreation expenditures for the Refuge in 2004. Total expenditures were $2,923,800 with non-residents accounting for $2,202,100 (75 percent of total expenditures). Expenditures on non-consumptive activities accounted for 58 percent of the total, hunting 2 percent and fishing 40 percent.
Table 2-158. Tishomingo NWR: Visitor Recreation Expenditures (2004 $,000)
Activity Residents Non-Residents Total
Non-Consumptive: $428.3 $1,256.2 $1,684.6
Hunting:
Big Game $12.2 $36.4 $48.6
Small Game $0.5 $0.5 $1.0
Migratory Birds $0.8 $6.1 $7.0
Total Hunting $13.5 $43.0 $56.5
Fishing:
Freshwater $279.9 $902.8 $1,182.7
Saltwater ─ ─ ─
Total Fishing $279.9 $902.8 $1,182.7
Total Expenditures $721.7 $2,202.1 $2,923.8
Table 2-159 summarizes the total economic impacts associated with refuge visitor spending. Total final demand was $4,087,400. This is the total monetary value of economic activity generated in the 2-county area by refuge visitor spending. In turn, this final demand generated 57 jobs (both full-time and part-time) with total job income of $1,104,300. Total tax revenue generated (county, state and Federal) amounted to $610,400.
Table 2-159. Tishomingo NWR: Local Economic Effects Associated with Recreation Visits (2004 $,000)
Residents Non-Residents Total
Final Demand $1,012.2 $3,075.2 $4,087.4
Jobs 14.1 43.3 57.4
Job Income $268.6 $835.7 $1,104.3
Total Tax Revenue $151.1 $459.3 $610.4
147

Banking on Nature: The Economic Benefits to Local Communities of National Wildlife Refuge Visitation
Table 2-160 shows total economic effects (total recreation expenditures plus net economic value) compared with the refuge budget for 2004. For an individual, net economic value is that person's total willingness to pay for a particular recreation activity minus his or her actual expenditures for that activity. The figure for economic value is derived by multiplying net economic values for hunting, fishing, and non-consumptive recreation use (on a per-day basis) by estimated refuge visitor days for that activity. This figure is combined with the estimate of total expenditures and divided by the refuge budget for 2004. The $10.98 means that for every $1 of budget expenditures, $10.98 of total economic effects are associated with these budget expenditures. This ratio is provided only for the purpose of broadly comparing the magnitude of economic effects resulting from refuge visitation to budget expenditures and should not be interpreted as a benefit-cost ratio.
Table 2-160. Tishomingo NWR: Summary of Local Economic Effects of Recreation Visits (2004 $,000)
FY 2004 Budget
RecreationExpenditures
Net Economic Value
Total economic effects per $1 budget expenditure
Tishomingo NWR
$471.0 $2,923.8 $2,245.6 $10.98
148

Sample Refuges Descriptions
Washita National Wildlife Refuge
Description
Established in 1961, Washita National Wildlife Refuge is lies on the upper end of Foss Reservoir and provides a feeding and resting area for migrating and wintering waterfowl and sandhill cranes.
November through February brackets the best times to see thousands of waterfowl. Snow geese lift from the waters in a blur of white wings. Canada geese are joined by smaller numbers of Ross and white-fronted geese. Mallards top the duck list, followed by common mergansers (January is their peak month) and pintails.
The refuge rests on the northwest portion of Foss Reservoir between the towns of Butler and Hammon in Custer County, Oklahoma.
Area Economy
The Washita NWR is located in Custer County in western Oklahoma. A significant number of refuge visitors come from Beckham, Dewey and Roger Mills counties in Oklahoma. The area had a population of 52,300 in 2003, a decrease of 3.9 percent from 1993 compared with a 7.8 percent increase for the state of Oklahoma and a 12 percent increase for the U.S. Total area employment increased by 7.2 percent from 1993 to 2003 compared with a 14.9 percent increase in Oklahoma and a 18 percent increase in the U.S.
Per capita personal income increased in the area by 16.3 percent from 1993 to 2003. This compares with a 17.6 percent increase in Oklahoma and a 15.6 percent increase in the U.S. .
Table 2-161. Washita NWR:Summary of Area Economy, 2003
(Population & Employment in 000’s; Per Capita Income in 2004 dollars)
Population Employment Per Capita Income
County 2003
Percent change
1993-2003 2003
Percent change
1993-2003 2003
Percent change
1993-2003
Custer, OK 25.2 -5.6% 15.4 0.4% $23,142 13.1%
Beckham 19.3 4.0% 11.4 25.6% $21,770 17.7%
Dewey 4.5 -13.0% 2.9 -6.6% $25,851 22.7%
Roger Mills 3.2 -17.9% 2.1 -1.9% $25,263 29.2%
Area Total 52.3 -3.9% 31.8 7.2% $23,002 16.3%
Oklahoma 3,506.5 7.8% 1,983.9 14.9% $27,440 17.6%
United States 290,789.0 11.9% 167,174.4 17.9% $32,322 15.6%
Source: U.S. Department of Commerce 2003.
149

Banking on Nature: The Economic Benefits to Local Communities of National Wildlife Refuge Visitation
Activity Levels
Washita NWR had 47,876 visitors in 2004. The majority of recreation visits, 100,925, were for non-consumptive activities. About 70 percent of recreation visits were undertaken by area residents.
Table 2-162. Washita NWR: 2004 Recreation Visits
Activity Residents Non-Residents Total
Non-Consumptive:
Nature Trails 22,503 9,644 32,147
Observation Platforms 2,565 1,099 3,664
Other Wildlife Observation 3,503 1,501 5,004
Beach /Water Use 0 0 0
Other Recreation 42,077 18,033 60,110
Hunting:
Big Game 45 8 53
Small Game 461 197 658
Migratory Birds 352 22 374
Fishing:
Freshwater 19,413 8,320 27,733
Saltwater 0 0 0
Total Visitation 90,917 38,826 129,743
Total Visitors 47,876
Regional Economic Analysis
The economic area for the Refuge is defined as Custer, Beckham, Dewey and Roger Mills counties in Oklahoma. It is assumed that Refuge visitor expenditures occur primarily within this 4-county area.
Table 2-58 shows visitor recreation expenditures for the Refuge in 2004. Total expenditures were $1,906,200 with non-residents accounting for $1,339,900 (70 percent of total expenditures). Expenditures on non-consumptive activities accounted for 52 percent of the total, hunting 1 percent and fishing 47 percent.
150

Sample Refuges Descriptions
Table 2-163. Washita NWR: Visitor Recreation Expenditures (2004 $,000)
Activity Residents Non-Residents Total
Non-Consumptive: $344.2 $648.9 $993.0
Hunting:
Big Game $1.6 $1.4 $3.0
Small Game $2.2 $3.7 $6.0
Migratory Birds $6.1 $1.9 $8.1
Total Hunting $10.0 $7.0 $17.0
Fishing:
Freshwater $212.1 $684.1 $896.2
Saltwater ─ ─ ─
Total Fishing $212.1 $684.1 $896.2
Total Expenditures $566.3 $1,339.9 $1,906.2
Table 2-164 summarizes the total economic impacts associated with refuge visitor spending. Total final demand was $2,554,900. This is the total monetary value of economic activity generated in the 4-county area by refuge visitor spending. In turn, this final demand generated 34 jobs (both full-time and part-time) with total job income of $666,600. Total tax revenue generated (county, state and Federal) amounted to $394,700.
Table 2-164. Washita NWR: Local Economic Effects Associated with Recreation Visits (2004 $,000)
Residents Non-Residents Total
Final Demand $758.6 $1,796.3 $2,554.9
Jobs 9.8 23.7 33.6
Job Income $195.2 $471.4 $666.6
Total Tax Revenue $116.5 $278.2 $394.7
Table 2-60 shows total economic effects (total recreation expenditures plus net economic value) compared with the refuge budget for 2004. For an individual, net economic value is that person's total willingness to pay for a particular recreation activity minus his or her actual expenditures for that activity. The figure for economic value is derived by multiplying net economic values for hunting, fishing, and non-consumptive recreation use (on a per-day basis) by estimated refuge visitor days for that activity. This figure is combined with the estimate of total expenditures and divided by the refuge budget for 2004. The $6.49 means that for every $1 of budget expenditures, $6.49 of total economic effects are associated with these budget expenditures. This ratio is provided only for the purpose of broadly
151

Banking on Nature: The Economic Benefits to Local Communities of National Wildlife Refuge Visitation
comparing the magnitude of economic effects resulting from refuge visitation to budget expenditures and should not be interpreted as a benefit-cost ratio.
Table 2-165. Washita NWR: Summary of Local Economic Effects of Recreation Visits (2004 $,000)
FY 2004 Budget
RecreationExpenditures
Net Economic Value
Total economic effects per $1 budget expenditure
Washita NWR $526.9 $1,906.2 $1,513.6 $6.49
152

Sample Refuges Descriptions
Region 3
Region 3 for the U.S. Fish & Wildlife Service includes Iowa, Illinois, Indiana, Minnesota, Missouri, Michigan, Ohio, and Wisconsin. Sample refuges selected within this region include:
Big Stone NWR (Minnesota)Crane Meadows NWR (Minnesota)
Mingo NWR (Missouri)Neal Smith NWR (Iowa)
Necedah NWR (Wisconsin)Ottawa NWR (Ohio)
Patoka NWR (Indiana)Rice Lake NWR (Minnesota)
Seney NWR (Michigan)Sherburne NWR (Minnesota)
Squaw Creek NWR (Missouri)Tamarac NWR (Minnesota)
153

Banking on Nature: The Economic Benefits to Local Communities of National Wildlife Refuge Visitation
Big Stone National Wildlife Refuge
Description
Straddling the headwaters of the Minnesota River in extreme west-central Minnesota, Big Stone Refuge is within the heart of the tallgrass prairie's historic range. Today, less than one-percent of tallgrass prairie remains.
Big Stone Refuge serves as the "keeper of the prairie" by working to maintain and restore native prairie habitat while providing optimum nesting cover for waterfowl and other grassland nesting birds. The refuge contains 11,521 acres: 1,028 acres in Big Stone County and 10,493 acres in Lac Qui Parle County. The refuge is located in Minnesota's second Congressional District.
The primary refuge purposes stated in authorizing documents are flood control, recreation, and fish and wildlife conservation. The refuge's principal objective is to provide optimum nesting cover for ground-nesting waterfowl production. Approximately 30,000 people visit the refuge annually, enjoying hiking, fishing, hunting, wildlife observation, auto tours, and environmental education.
Area Economy
Table 3-166 depicts Big Stone NWR’s area economy in 2003, which includes Big Stone, Chippewa, and Lac Qui Parle counties in Minnesota. The area population decreased 6.0 percent from 1993 to 2003. During the same time period, however, employment increased by 16.1 percent 17,400 and per capita income increased by 39.1 percent to $26,504. While the economy is improving, the average per capita income is below Minnesota ($34,937) and the United States ($32,310).
Table 3-166. Big Stone NWR:Summary of Area Economy, 2003
(Population & Employment in 000’s; Per Capita Income in 2004 dollars)
Population Employment Per Capita Income
County 2003
Percent change
1993-2003 2003
Percent change
1993-2003 2003
Percent change
1993-2003Big Stone, MN 5.7 -6.7% 3.3 9.2% $25,624 45.6%Chippewa, MN 12.8 -3.1% 9.2 22.3% $28,159 37.5%
Lac Qui Parle, MN 7.9 -10.0% 4.9 10.3% $24,451 36.6%
Area Total 26.3 -6.0% 17.4 16.1% $26,504 39.1%Minnesota 5,064.2 11.2% 3,367.6 18.8% $34,937 23.5%
United States 290,789.0 11.9% 167,174.4 17.9% $32,310 15.8%
Source: U.S. Department of Commerce 2003.
154

Sample Refuges Descriptions
Activity Levels
In FY 2004, there were 27,790 recreational visits and 27,200 visitors at Big Stone NWR (Table 3-167). It is possible to have more visits than visitors because visitors may participate in more than one activity when they visit the refuge. Visitors enjoyed nature trails, wildlife observation, hunting, and fishing on Big Stone NWR. Nature trails (20,380 visits) were, by far, the most popular activity on the refuge.
Table 3-167. Big Stone NWR: 2004 Recreation Visits
Activity Residents Non-Residents Total
Non-Consumptive:
Nature Trails 16,304 4,076 20,380
Observation Platforms 0 0 0
Other Wildlife Observation 560 140 700
Beach /Water Use 0 0 0
Other Recreation 2,930 0 2,930
Hunting:
Big Game 490 210 700
Small Game 1,631 699 2,330
Migratory Birds 0 0 0
Fishing:
Freshwater 713 38 750
Saltwater 0 0 0
Total Recreational Visitation 22,628 5,163 27,790
Total Visitors 27,200
155

Banking on Nature: The Economic Benefits to Local Communities of National Wildlife Refuge Visitation
Regional Economic Analysis
Recreational visits to Big Stone NWR generated $162,100 in expenditures in FY 2004 (Table 3-168). Of these expenditures, residents accounted for $63,600 (39 percent) and non-residents accounted for $98,500 (61 percent).
Table 3-168. Big Stone NWR: Visitor Recreation Expenditures (2004 $,000)
Activity Residents Non-Residents Total
Non-Consumptive: $40.7 $53.5 $94.2
Hunting:
Big Game $7.6 $10.5 $18.0
Small Game $12.1 $34.2 $46.3
Migratory Birds ─ ─ ─
Total Hunting $19.7 $44.6 $64.3
Fishing:
Freshwater $3.2 $0.4 $3.6
Saltwater ─ ─ ─
Total Fishing $3.2 $0.4 $3.6
Total Expenditures $63.6 $98.5 $162.1
Table 3-169 summarizes the economic effects associated with recreational visitors to Big Stone NWR. Final demand totaled $210,000, which generated 4 jobs (both part-time and full-time) and $70,000 in job income.
Table 3-169. Big Stone NWR: Local Economic Effects Associated with Recreation Visits (2004 $,000)
Residents Non-Residents Total
Final Demand $82.9 $127.2 $210.1
Jobs 2 2 4
Job Income $27.1 $42.5 $69.6
Total Tax Revenue $13.3 $21.5 $34.8
Table 3-170 shows the total economic value (recreation-related expenditures plus net economic value) compared with the refuge budget. As noted in the Introduction, people derive benefits over and above what they pay for recreation. This net economic value is estimated to be $349,200 for Big Stone NWR. The ratio ($1.45) is provided to broadly compare the magnitude of recreational benefits to the refuge budget and should not be used as a benefit-cost ratio. In addition to these recreational benefits, the refuge
156
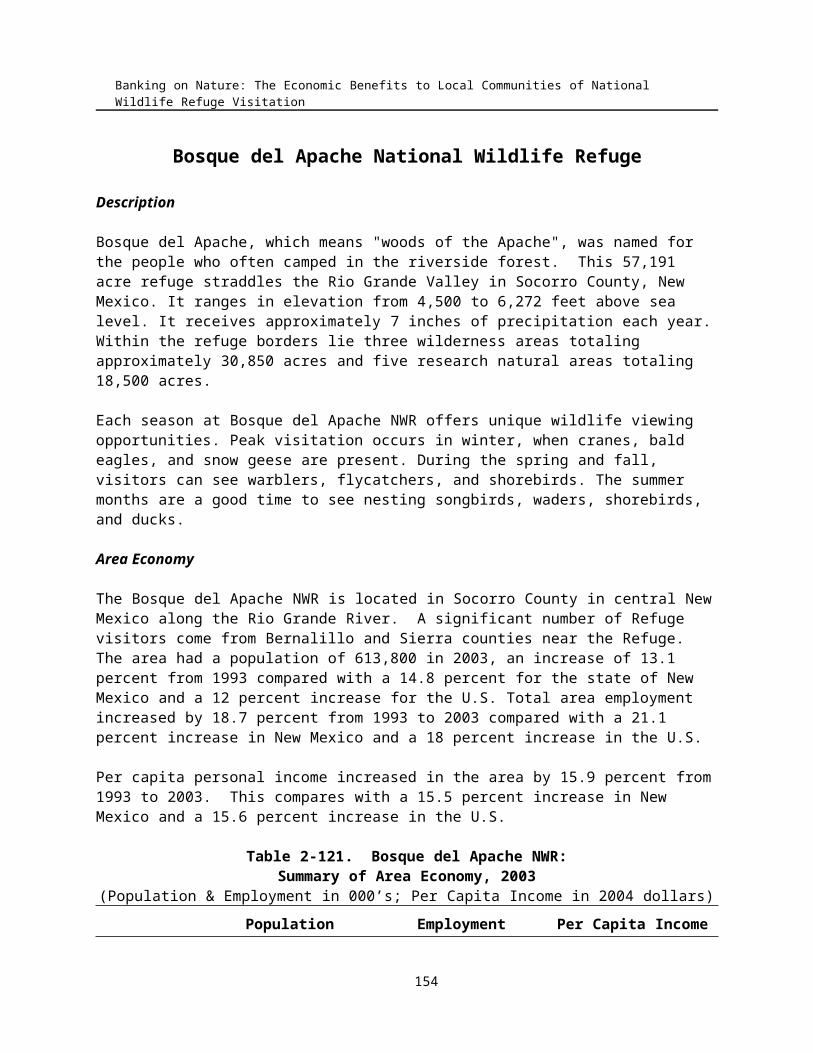
Sample Refuges Descriptions
has other benefits including (but not limited to) flood control, ecological values, and educational values. Furthermore, the refuge budget provides an additional stimulus to the local economy through payroll, maintenance, and operation expenditures..
Table 3-170. Big Stone NWR: Summary of Local Economic Effects of Recreation Visits (2004 $,000)
FY 2004 Budget
RecreationExpenditures
Net Economic Value
Total economic effects per $1 budget expenditure
Big Stone NWR
$352.3 $162.1 $349.2 $1.45
157
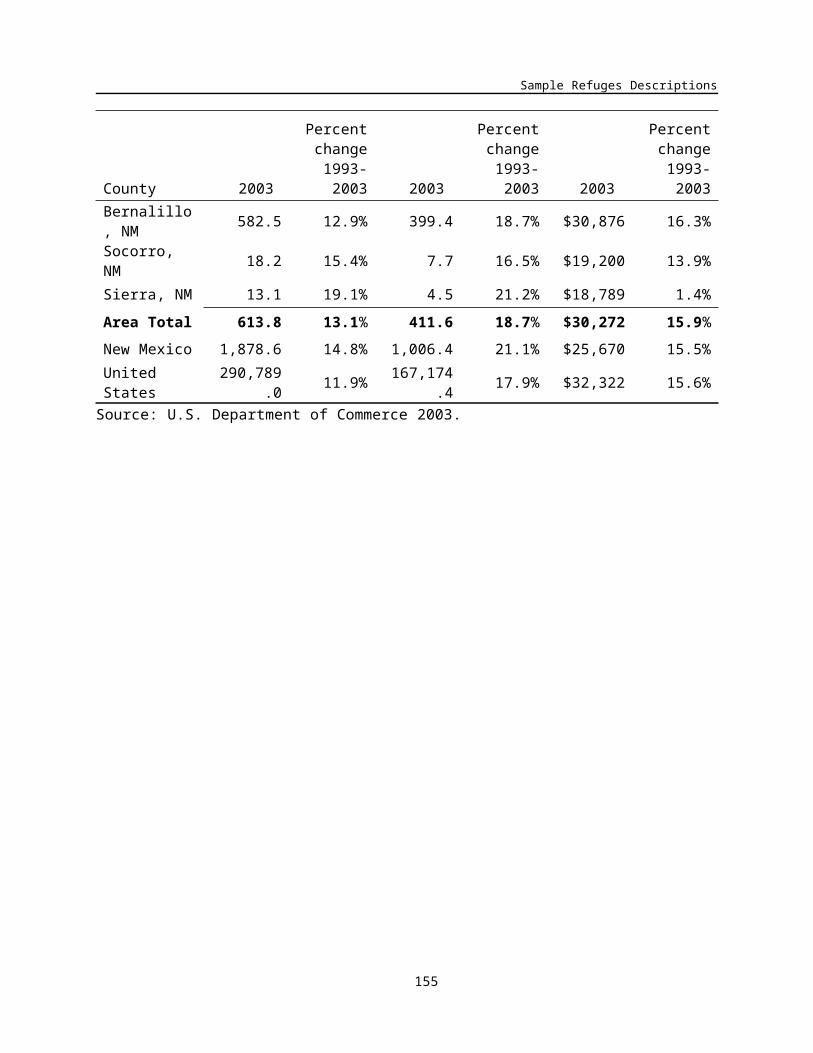
Banking on Nature: The Economic Benefits to Local Communities of National Wildlife Refuge Visitation
Crane Meadows National Wildlife Refuge
Description
Crane Meadows National Wildlife Refuge was established in 1992 to preserve a large, natural wetland complex. The 1,825-acre refuge is located in central Minnesota and serves as an important stop for many species of migrating birds. It harbors one of the largest nesting populations of greater sandhill cranes in Minnesota. Habitats include native tallgrass prairie, oak savanna, and wetlands with dense stands of wild rice.
The refuge serves as the base for the Federal private lands program in Morrison County, which focuses on restoring drained wetlands through voluntary agreements with landowners. Acquisition of land for Crane Meadows is continuing as funding is available.
The 3.5-mile Platte River Trail is available for wildlife observation and photography throughout the year. When snow has accumulated, the trail is open for cross-country skiing. Hiking and snowshoeing are also enjoyed on the refuge.
Area Economy
Crane Meadows NWR is located in Benton County, Minnesota. St. Cloud (Benton County) is the nearest largest city, and provides many services for the region. The majority of visitor expenditures are assumed to be spent within the area economy.
From 1993 to 2003, the area’s population increased by 13.2 percent to 70,100 people and employment increased by 41.7 percent to 41,600. These rates of increase are higher than Minnesota and the United States. The area’s average per capita income in 2003 was $25,796, which was lower than Minnesota ($34,937) and the United States ($32,310).
Table 3-171. Crane Meadows NWR:Summary of Area Economy, 2003
(Population & Employment in 000’s; Per Capita Income in 2004 dollars)
Population Employment Per Capita Income
County 2003
Percent change
1993-2003 2003
Percent change
1993-2003 2003
Percent change
1993-2003Benton, MN 37.6 18.4% 24.0 64.8% $28,150 28.6%Morrison, MN 32.6 7.8% 17.6 18.9% $23,078 20.9%Area Total 70.1 13.2% 41.6 41.7% $25,796 25.7%Minnesota 5,064.2 11.2% 3,367.6 18.8% $34,937 23.5%
United States 290,789.0 11.9% 167,174.4 17.9% $32,310 15.8%
Source: U.S. Department of Commerce 2003.
158

Sample Refuges Descriptions
Activity Levels
In FY 2004, Crane Meadows NWR had 4,998 recreational visits (Table 3-172). All visits were for non-consumptive activities, such as using nature trails, observation platforms, observing wildlife, and other recreation. Ninety percent of visits (4,498) were by visitors from the local area.
Table 3-172. Crane Meadows NWR: 2004 Recreation Visits
Activity Residents Non-Residents Total
Non-Consumptive:
Nature Trails 282 31 313
Observation Platforms 212 24 235
Other Wildlife Observation 3,825 425 4,250
Beach /Water Use 0 0 0
Other Recreation 180 20 200
Hunting:
Big Game 0 0 0
Small Game 0 0 0
Migratory Birds 0 0 0
Fishing:
Freshwater 0 0 0
Saltwater 0 0 0
Total Visitation 4,498 500 4,998
Total Visitors 5,507
159

Banking on Nature: The Economic Benefits to Local Communities of National Wildlife Refuge Visitation
Regional Economic Analysis
Recreational visits to Crane Meadows NWR generated nearly $16,000 in recreation-related expenditures in FY 2004 (Table 3-173). Resident spending accounted for $9,300 and non-resident spending accounted for $6,300.
Table 3-173. Crane Meadows NWR: Visitor Recreation Expenditures (2004 $,000)
Activity Residents Non-Residents Total
Non-Consumptive: $9.3 $6.3 $15.6
Hunting:
Big Game ─ ─ ─
Small Game ─ ─ ─
Migratory Birds ─ ─ ─
Total Hunting ─ ─ ─
Fishing:
Freshwater ─ ─ ─
Saltwater ─ ─ ─
Total Fishing ─ ─ ─
Total Expenditures $9.3 $6.3 $15.6
Table 3-175 summarizes the economic effects associated with recreation visits at Crane Meadows NWR. Recreational expenditures generated $21,200 in final demand and 2 jobs.
Table 3-174. Crane Meadows NWR: Local Economic Effects Associated with Recreation Visits (2004 $,000)
Residents Non-Residents Total
Final Demand $12.6 $8.6 $21.2
Jobs 1 1 2
Job Income $4.3 $2.9 $7.2
Total Tax Revenue $2.1 $1.4 $3.5
In FY 2004, recreational benefits (recreation-related expenditures plus net economic value) totaled $58,200. When compared to the refuge budget on a broad scale, the ratio shows that $0.47 in recreation benefits is derived from every $1 of budget expenditure. This ratio broadly compares the magnitude of the two estimates and should not be used as a benefit-cost ratio. The refuge provides many other benefits including environmental education and ecological values. Furthermore, the refuge budget provides an additional stimulus to the local economy through its payroll, maintenance, and operation expenditures.
160

Sample Refuges Descriptions
Table 3-175. Crane Meadows NWR: Summary of Local Economic Effects of Recreation Visits (2004 $,000)
FY 2004 Budget
RecreationExpenditures
Net Economic Value
Total economic effects per $1 budget expenditure
Crane Meadows NWR
$123.3 $15.6 $42.6 $0.47
161

Banking on Nature: The Economic Benefits to Local Communities of National Wildlife Refuge Visitation
Mingo National Wildlife Refuge
Description
Located in the upper end of the lower Mississippi River valley, Mingo National Wildlife Refuge, at 21,676 acres, is the only large remnant of bottomland hardwoods remaining out of an original 2 1/2 million acres in the Missouri boot heel. A major migration and wintering area for migratory waterfowl, populations of 125,000 mallards and 75,000 Canada geese have been recorded. Bald eagles have been successively nesting on the refuge since 1985.
The refuge contains approximately 14,000 acres of bottomland hardwoods, 1,000 acres of upland hardwoods, 1,275 acres of cropland and moist soil units (see Management Activities), 700 acres of grasslands, and 4,700 acres of marsh and water. There are seven natural areas on the refuge and over 140 identified archaeological sites. In 1976, 7,730 acres were designated as a wilderness area. The Mingo Job Corps Civilian Center is located on the southeast corner of the refuge.
Located approximately 150 miles south of St. Louis, the refuge is twenty five miles northeast of Poplar Bluff, Missouri.
Area Economy
The Mingo NWR is located in Stoddard and Wayne counties in southeastern Missouri. The area had a population of 42,900 in 2003, an increase of 3.2 percent from 1993 compared with an 8.5 percent increase for the state of Missouri and a 12 percent increase for the United States. Total area employment increased by 8.8 percent from 1993 to 2003 compared with a 13.7 percent increase in Missouri and an 18 percent increase in the United States.
Per capita personal income increased in the area by 22.5 percent from 1993 to 2003. This compares with a 16.3 percent increase in Missouri and a 15.6 percent increase in the United States.
Table 3-176. Mingo NWR:Summary of Area Economy, 2003
(Population & Employment in 000’s; Per Capita Income in 2004 dollars)
Population Employment Per Capita Income
County 2003
Percent change
1993-2003 2003
Percent change
1993-2003 2003
Percent change
1993-2003
Stoddard, MO 29.7 1.9% 15.3 11.4% $23,833 21.3%
Wayne, MO 13.1 6.2% 3.9 -0.4% $19,153 26.9%
Area Total 42.9 3.2% 19.2 8.8% $22,398 22.5%
Missouri 5,719.2 8.5% 3,479.8 13.7% $30,260 16.3%
United States 290,789.0 11.9% 167,174.4 17.9% $32,322 15.6%
Source: U.S. Department of Commerce 2003. Activity Levels
162

Sample Refuges Descriptions
Mingo NWR had 72,872 visitors in 2004. The majority of recreation visits, over 56,000, were for non-consumptive activities. Fishing accounted for 12,673 visits and hunting 3,458. About 79 percent of recreation visits were undertaken by area residents.
Table 3-177. Mingo NWR: 2004 Recreation Visits
Activity Residents Non-Residents Total
Non-Consumptive:
Nature Trails 20,571 8,816 29,387
Observation Platforms 12,758 5,468 18,225
Other Wildlife Observation 147 37 184
Beach /Water Use 0 0 0
Other Recreation 8,154 166 8,320
Hunting:
Big Game 2,280 402 2,682
Small Game 122 2 124
Migratory Birds 489 163 652
Fishing:
Freshwater 12,420 253 12,673
Saltwater 0 0 0
Total Visitation 56,939 15,308 72,247
Total Visitors 72,872
Regional Economic Analysis
The economic area for the Refuge is defined as Stoddard and Wayne counties in Missouri. It is assumed that Refuge visitor expenditures occur primarily within this 2-county area.
Table 3-178 shows visitor recreation expenditures for the Refuge in 2004. Total expenditures were $692,300 with non-residents accounting for $460,500 (67 percent of total expenditures). Expenditures on non-consumptive activities accounted for 33 percent of the total, hunting 10 percent and fishing 57 percent.
Table 3-178. Mingo NWR: Visitor Recreation Expenditures (2004 $,000)
Activity Residents Non-Residents Total
163

Banking on Nature: The Economic Benefits to Local Communities of National Wildlife Refuge Visitation
Non-Consumptive: $74.2 $152.4 $226.7
Hunting:
Big Game $35.9 $20.4 $56.3
Small Game $0.6 ─8 $0.7
Migratory Birds $7.8 $3.6 $11.4
Total Hunting $44.2 $24.1 $68.4
Fishing:
Freshwater $113.3 $284.0 $397.3
Saltwater ─ ─ ─
Total Fishing $113.3 $284.0 $397.3
Total Expenditures $231.8 $460.5 $692.3
Table 3-179 summarizes the total economic impacts associated with refuge visitor spending. Total final demand was $872,100. This is the total monetary value of economic activity generated in the 2-county area by refuge visitor spending. In turn, this final demand generated 12 jobs (both full-time and part-time) with total job income of $242,400. Total tax revenue generated (county, state and Federal) amounted to $97,900.
Table 3-179. Mingo NWR: Local Economic Effects Associated with Recreation Visits (2004 $,000)
Residents Non-Residents Total
Final Demand $291.5 $580.6 $872.1
Jobs 3.9 8.1 12.1
Job Income $80.3 $162.1 $242.4
Total Tax Revenue $32.9 $65.0 $97.9
Table 3-180 shows total economic effects (total recreation expenditures plus net economic value) compared with the refuge budget for 2004. For an individual, net economic value is that person's total willingness to pay for a particular recreation activity minus his or her actual expenditures for that activity. The figure for economic value is derived by multiplying net economic values for hunting, fishing, and non-consumptive recreation use (on a per-day basis) by estimated refuge visitor days for that activity. This figure is combined with the estimate of total expenditures and divided by the refuge budget for 2004. The $0.90 means that for every $1 of budget expenditures, $0.90 of total economic effects are associated with these budget expenditures. This ratio is provided only for the purpose of broadly comparing the magnitude of economic effects resulting from refuge visitation to budget expenditures and should not be interpreted as a benefit-cost ratio.
164
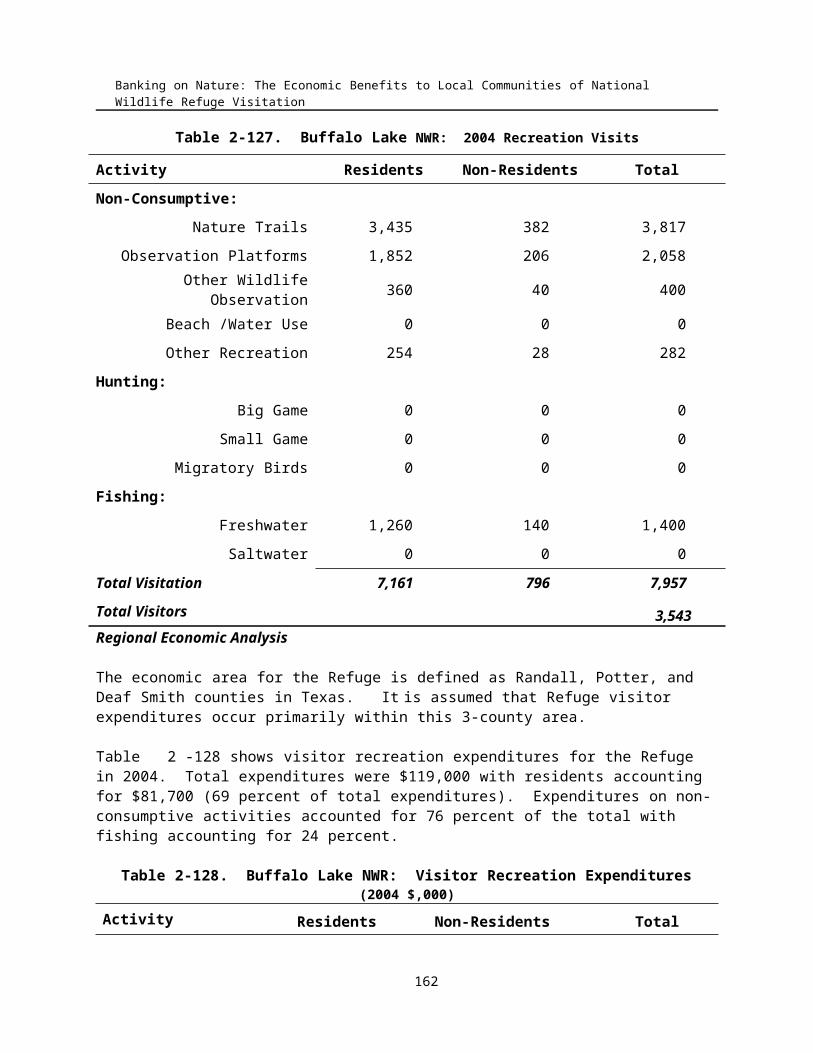
Sample Refuges Descriptions
Table 3-180. Mingo NWR: Summary of Local Economic Effects of Recreation Visits (2004 $,000)
FY 2004 Budget
RecreationExpenditures
Net Economic Value
Total economic effects per $1 budget expenditure
Mingo NWR $1,148.4 $157.1 $881.6 $0.90
165

Banking on Nature: The Economic Benefits to Local Communities of National Wildlife Refuge Visitation
Neal Smith National Wildlife Refuge
Description
Neal Smith National Wildlife Refuge, located just 25 minutes east of Des Moines, Iowa, was established in 1990. Its mission is to re-construct tallgrass prairie and restore oak savanna on 8,654 acres of the Walnut Creek watershed and to provide a major environmental education facility focusing on prairie, oak savanna, and human interaction.
The refuge has been designated a Fish and Wildlife Service Land Management and Research Demonstration Area. It facilitates development, testing, teaching, publishing, and demonstration of state-of-the-art management techniques for fish, wildlife, and plant conservation.
The Prairie Learning Center facilities include a visitor center with classrooms, exhibit area, theater, and bookstore. Miles of paved trails radiate from the center, and an auto tour through the 740-acre bison/elk enclosure is open all year. Teacher workshops, birding, hunting, and nature watching are some of the outdoor activities featured for thousands of visitors each year.
Area Economy
The area economy for Neal Smith NWR is summarized in Table 3-181. While the refuge is located in Jasper County, the economic hub for the area is Polk County. Together, these counties had a population of 426,600 people and employment of 336,900 jobs in 2003. Both population and employment increased more rapidly than the state of Iowa. From 1993 to 2003, the average per capita income increased by 16.4 percent to $35,242.
Table 3-181. Neal Smith NWR:Summary of Area Economy, 2003
(Population & Employment in 000’s; Per Capita Income in 2004 dollars)
Population Employment Per Capita Income
County 2003
Percent change
1993-2003 2003
Percent change
1993-2003 2003
Percent change
1993-2003Jasper, IA 37.7 7.4% 20.0 16.0% $27,980 12.3%Polk, IA 388.8 12.7% 316.9 17.4% $35,946 16.7%Area Total 426.6 12.2% 336.9 17.3% $35,242 16.4%Iowa 2,942.0 3.7% 1,912.4 12.4% $29,095 18.9%
United States 290,789.0 11.9% 167,174.4 17.9% $32,310 15.8%
Source: U.S. Department of Commerce 2003.
166

Sample Refuges Descriptions
Activity Levels
Table 3-182 shows the recreational visits to Neal Smith NWR in FY 2004. Recreational visitors enjoyed nature trails (82,833 visits), big game hunting (1,100 visits), and small game hunting (3,100 visits). The majority of visits were by visitors from the area.
Table 3-182. Neal Smith NWR: 2004 Recreation Visits
Activity Residents Non-Residents Total
Non-Consumptive:
Nature Trails 57,983 24,850 82,833
Observation Platforms 0 0 0
Other Wildlife Observation 0 0 0
Beach /Water Use 0 0 0
Other Recreation 0 0 0
Hunting:
Big Game 990 110 1,100
Small Game 2,480 620 3,100
Migratory Birds 0 0 0
Fishing:
Freshwater 0 0 0
Saltwater 0 0 0
Total Visitation 61,453 25,580 87,033
Total Visitors 123,965
Regional Economic Analysis
Expenditures associated with visitor recreation totaled $482,600 in FY 2004 (Table 3-183). Ninety-percent of expenditures were due to non-consumptive activities ($434,600). The majority of recreation expenditures were by non-residents (70 percent).
167

Banking on Nature: The Economic Benefits to Local Communities of National Wildlife Refuge Visitation
Table 3-183. Neal Smith NWR: Visitor Recreation Expenditures (2004 $,000)
Activity Residents Non-Residents Total
Non-Consumptive: $119.3 $315.3 $434.6
Hunting:
Big Game $11.5 $4.1 $15.6
Small Game $12.3 $20.2 $32.5
Migratory Birds ─ ─ ─
Total Hunting $23.7 $24.3 $48.1
Fishing:
Freshwater ─ ─ ─
Saltwater ─ ─ ─
Total Fishing ─ ─ ─
Total Expenditures $143.0 $339.6 $482.6
Table 3-184 summarizes the economic effects that are generated in the local area economy. Final demand totaled about $718,200, which generated 9 jobs and $234,400 in job income. Non-resident spending resulted in 6 jobs (both part-time and full-time).
Table 3-184. Neal Smith NWR: Local Economic Effects Associated with Recreation Visits (2004 $,000)
Residents Non-Residents Total
Final Demand $215.0 $503.2 $718.2
Jobs 3 6 9
Job Income $71.6 $162.9 $234.4
Total Tax Revenue $32.8 $77.6 $110.4
Neal Smith NWR’s budget and recreational benefits are shown in Table 3-185. In FY 2004, recreational benefits (recreation-related expenditures plus net economic value) summed to $1.3 million. The ratio ($1.03) is provided to broadly compare the magnitude of recreational benefits to the refuge budget and should not be used as a benefit-cost ratio. In addition to these recreational benefits, the refuge has other benefits including ecological and educational benefits. Furthermore, the refuge budget provides an additional stimulus to the local economy through its payroll, maintenance, and operating expenses.
168

Sample Refuges Descriptions
Table 3-185. Neal Smith NWR: Summary of Local Economic Effects of Recreation Visits (2004 $,000)
FY 2004 Budget
RecreationExpenditures
Net Economic Value
Total economic effects per $1 budget expenditure
Neal Smith NWR
$1,282.9 $482.6 $838.5 $1.03
169

Banking on Nature: The Economic Benefits to Local Communities of National Wildlife Refuge Visitation
Necedah National Wildlife Refuge
Description
Whooping cranes, wolves, Karner blue butterflies, and white-tailed deer call Necedah National Wildlife Refuge "home." Ringed bog hunter dragonflies live in sedge meadows, flying squirrels in upland hardwood timber. Trumpeter swans inhabit the marshes, and badgers the savanna. The habitat mosaic, maintained by prescribed burning, seasonal mowing, and timber clearing, attracts a wide range of wildlife. Each species and habitat is monitored and maintained to insure overall vigor of the ecosystem. The 43,656-acre refuge was established in 1939 as a refuge and breeding ground for migratory birds and other wildlife. In addition to hunting and fishing opportunities, spectacular opportunities to observe and photograph wildlife are also enjoyed at the refuge. Walking trails lead through oak savanna, prairie, and woodlands.
Area EconomyTable 3-186 summarizes the area economy for Necedah NWR. Necedah NWR is mostly located in Juneau County, with a small portion also located in Wood County. The economic hub of the refuge (where most visitors’ expenditures occur) includes the cities of Tomah, LaCross, Mauston, Wisconsin Rapids, and Madison.
From 1993 to 2003, the area’s population increased by 10.5 percent to 698,600 people. Wood County had the lowest increase (0.2 percent) while Dane County had the highest increase (13.5 percent). During the same time period, the area’s employment increased by 19.1 percent, which was a higher increase than both Wisconsin (15.3 percent) and the United States (17.9 percent). Average per capita income for the area was $34,133 in 2003. However, Dane County is the only county in the area with an average per capita income ($37,426) higher than Wisconsin ($31,502) and the United States ($32,310).
Table 3-186. Necedah NWR:Summary of Area Economy, 2003
(Population & Employment in 000’s; Per Capita Income in 2004 dollars)
Population Employment Per Capita Income
County 2003
Percent change
1993-2003 2003
Percent change
1993-2003 2003
Percent change
1993-2003Dane, WI 447.7 13.5% 360.5 22.6% $37,426 21.6%Juneau, WI* 25.3 11.5% 11.7 0.0% $22,978 10.4%
La Cross, WI 108.6 6.9% 81.4 16.5% $29,037 13.3%
Monroe, WI 41.7 8.9% 24.6 17.2% $24,092 17.1%Wood, WI* 75.3 0.2% 51.9 7.1% $31,211 17.3%
Area Total 698.6 10.5% 530.1 19.1% $34,133 19.9%Wisconsin 5,474.3 7.7% 3,423.9 15.3% $31,502 18.5%
United States 290,789.0 11.9% 167,174.4 17.9% $32,310 15.8%
Source: U.S. Department of Commerce 2003.
170

Sample Refuges Descriptions
Activity Levels
Recreational visits to Necedah NWR totaled 103,016 in FY 2004 (Table 3-187). Residents accounted for 23,480 visits while non-residents accounted for 79,526 visits. Visitors enjoyed non-consumptive activities (nature trails, photography, berry picking, etc), hunting, and fishing on the refuge. Anglers fish for northern pike, bullheads, black crappies, bluegills, and sunfish. Most visits were to the nature trails (76,150 visits).
Table 3-187. Necedah NWR: 2004 Recreation Visits
Activity Residents Non-Residents Total
Non-Consumptive:
Nature Trails 15,230 60,920 76,150
Observation Platforms 3,254 13,016 16,270
Other Wildlife Observation 216 324 540
Beach /Water Use 0 0 0
Other Recreation 826 206 1,032
Hunting:
Big Game 1,640 3,826 5,465
Small Game 979 420 1,399
Migratory Birds 392 588 980
Fishing:
Freshwater 944 236 1,180
Saltwater 0 0 0
Total Visitation 23,480 79,536 103,016
Total Visitors 150,190
171

Banking on Nature: The Economic Benefits to Local Communities of National Wildlife Refuge Visitation
Regional Economic Analysis
Visitor recreation expenditures totaled $1.9 million in FY 2004 (Table 3-188). Non-residents spent $1.8 million while residents spent $99,500 in the area economy. The majority of expenditures ($1.7 million) were attributable to non-consumptive activities on the refuge.
Table 3-188. Necedah NWR: Visitor Recreation Expenditures (2004 $,000)
Activity Residents Non-Residents Total
Non-Consumptive: $67.3 $1,633.9 $1,701.3
Hunting:
Big Game $15.8 $119.2 $135.0
Small Game $4.8 $13.7 $18.5
Migratory Birds $3.1 $6.3 $9.4
Total Hunting $23.7 $139.2 $162.9
Fishing:
Freshwater $8.5 $5.3 $13.7
Saltwater ─ ─ ─
Total Fishing $8.5 $5.3 $13.7
Total Expenditures $99.5 $1,778.4 $1,877.9
Table 3-189 summarizes the economic effects associated with recreation visits to Necedah NWR. Final demand totaled nearly $2.9 million in FY 2004. This is the total monetary value of recreational visits. In turn, this final demand generated 37 jobs (both part-time and full-time) and $931,500 in job income. Non-resident expenditures provided a $2.7 million stimulus to the local area economy.
Table 3-189. Necedah NWR: Local Economic Effects Associated with Recreation Visits (2004 $,000)
Residents Non-Residents Total
Final Demand $154.2 $2,716.0 $2,870.2
Jobs 2 35 37
Job Income $51.1 $880.4 $931.5
Total Tax Revenue $20.9 $377.1 $398.0
Necedah NWR’s budget and recreational benefits are shown in Table 3-190. In FY 2004, recreational benefits (recreation-related expenditures plus net economic value) summed to $2.5 million. The ratio ($2.48) is provided to broadly compare the magnitude of recreational benefits to the refuge budget and should not be used as a benefit-cost ratio. In addition to these recreational benefits, the refuge has other
172
Sample Refuges Descriptions
benefits including (but not limited to) ecological benefits. Furthermore, the refuge budget also provides a stimulus to the local economy through its payroll and other maintenance and operating expenses.
Table 3-190. Necedah NWR: Summary of Local Economic Effects of Recreation Visits (2004 $,000)
FY 2004 Budget
RecreationExpenditures
Net Economic Value
Total economic effects per $1 budget expenditure
Necedah NWR
$1,428.2 $1,877.9 $1,660.4 $2.48
173

Banking on Nature: The Economic Benefits to Local Communities of National Wildlife Refuge Visitation
Ottawa National Wildlife Refuge
Description
The Ottawa National Wildlife Refuge was established in 1961 to preserve habitat for migrating birds. The Lake Erie Marsh Region has historically been important to fish, migratory waterfowl, songbirds, and shorebirds. Up to 70 percent of the Mississippi Flyway population of black ducks can be found in the Lake Erie marshes during the fall migration. Large numbers of migrating songbirds stop in the area to rest during their spring migration. This amazing wildlife spectacle attracts a large number of visitors from across the country.
Ottawa Refuge has been designated as a site of regional significance in the Western Hemisphere Shorebird Reserve Network. In 2002, "Birders World" readers voted the refuge as one of their Top 15 favorite spots to see birds, and the American Bird Conservancy has identified the refuge as an Important Bird Area.
Area Economy
Ottawa NWR’s area economy includes Erie, Lucas, Ottawa, Sandusky, and Wood Counties in Ohio (Table 3-191). While the refuge is located in Ottawa and Lucas Counties, the economic hub of the area also includes the other counties.
From 1993 to 2003, the area economy increased 0.1 percent to 757,600 people. This increase was below Ohio (3.0 percent and the United States (11.9 percent). Both Lucas County and Sandusky County had populations that decreased during this time period. Area employment increased at a faster rate (8.2 percent) than area population. Average per capita income for the area was $30,702. Erie County had the largest increase in average per capita income (21.7 percent).
Table 3-191. Ottawa NWR:Summary of Area Economy, 2003
(Population & Employment in 000’s; Per Capita Income in 2004 dollars)
Population Employment Per Capita Income
County 2003
Percent change
1993-2003 2003
Percent change
1993-2003 2003
Percent change
1993-2003Erie, OH 78.9 0.8% 50.3 10.6% $32,904 21.7%Lucas, OH* 453.2 -1.8% 276.1 4.7% $30,974 10.9%
Ottawa, OH* 41.3 2.7% 20.3 8.5% $32,289 16.0%
Sandusky, OH 61.7 -1.3% 32.9 3.6% $26,515 9.5%
Wood, OH 122.5 7.0% 74.6 23.7% $29,847 8.1%
Area Total 757.6 0.1% 454.2 8.2% $30,702 11.7%Ohio 11,437.7 3.0% 6,674.4 11.3% $30,931 14.7%
United States 290,789.0 11.9% 167,174.4 17.9% $32,310 15.8%
174

Sample Refuges Descriptions
Source: U.S. Department of Commerce 2003.
Activity Levels
Recreational opportunities on the refuge include nature trails, observation platforms, wildlife observation, hunting, and fishing (Table 3-192). “Other wildlife observation” includes visitors driving onto the refuge to see deer, grassland birds, raptors, eagles, and shorebirds. For small game hunters, the refuge holds a lottery so these hunters have only one day to hunt.
Recreational visits in FY 2004 totaled 350,038, with most of the visits being accounted for by non-consumptive uses. Resident visits comprised about 67 percent (234,795 visits) of all recreational visits.
Table 3-192. Ottawa NWR: 2004 Recreation Visits
Activity Residents Non-Residents Total
Non-Consumptive:
Nature Trails 90,377 60,251 150,628
Observation Platforms 43,516 29,011 72,527
Other Wildlife Observation 98,851 24,713 123,564
Beach /Water Use 0 0 0
Other Recreation 1,140 760 1,900
Hunting:
Big Game 243 0 243
Small Game 231 231 462
Migratory Birds 416 278 694
Fishing:
Freshwater 20 0 20
Saltwater ─ ─ 0
Total Visitation 234,795 115,243 350,038
Total Visitors 268,168
175

Banking on Nature: The Economic Benefits to Local Communities of National Wildlife Refuge Visitation
Regional Economic Analysis
In FY 2004, visitor recreation expenditures totaled $2.9 million (Table 3-193). Nearly all expenditures are attributable to non-consumptive activities. Residents accounted for $625,200, and non-residents accounted for $2.3 million.
Table 3-193. Ottawa NWR: Visitor Recreation Expenditures (2004 $,000)
Activity Residents Non-Residents Total
Non-Consumptive: $612.5 $2,256.9 $2,869.3
Hunting:
Big Game $3.8 ─ $3.8
Small Game $2.3 $15.1 $17.3
Migratory Birds $6.5 $6.0 $12.5
Total Hunting $12.6 $21.0 $33.6
Fishing:
Freshwater $0.2 ─ $0.2
Saltwater ─ ─ ─
Total Fishing $0.2 ─ $0.2
Total Expenditures $625.2 $2,277.9 $2,903.1
Recreation visits to Ottawa NWR resulted in $4.3 million in final demand (Table 3-194). This is the total monetary value of economic activity associated with recreational visits. In turn, the final demand generated 55 jobs, $1.4 million in job income, and $550,500 in total tax revenue. Non-residents provided a 42 job stimulus to the local area economy.
Table 3-194. Ottawa NWR: Local Economic Effects Associated with Recreation Visits (2004 $,000)
Residents Non-Residents Total
Final Demand $926.4 $3,333.9 $4,260.4
Jobs 13 42 55
Job Income $303.1 $1,056.6 $1,359.7
Total Tax Revenue $119.1 $431.4 $550.5
Table 3-195 compares the recreational benefits and budget for Ottawa NWR. In FY 2004, recreational benefits (recreation-related expenditures plus net economic value) summed to $7.0 million. The budget ($1.3 million) represents the expenditures for refuge staff, maintenance, and operations. The ratio ($5.45) is provided to broadly compare the magnitude of recreational benefits to the refuge budget and
176

Sample Refuges Descriptions
should not be used as a benefit-cost ratio. In addition to these recreational benefits, the refuge has other benefits including (but not limited to) being a regionally significant habitat for shorebirds. Furthermore, the refuge budget provides an additional stimulus to the local economy through its various expenditures.
Table 3-195. Ottawa NWR: Summary of Local Economic Effects of Recreation Visits (2004 $,000)
FY 2004 Budget
RecreationExpenditures
Net Economic Value
Total economic effects per $1 budget expenditure
Ottawa NWR $1,291.6 $2,903.1 $4,135.8 $5.45
177

Banking on Nature: The Economic Benefits to Local Communities of National Wildlife Refuge Visitation
Patoka National Wildlife Refuge
Description
Patoka River National Wildlife Refuge is located in southwestern Indiana within the historically important north-south flyway of the Wabash River Basin. This river bottom refuge is strategically located to provide important resting, feeding, and nesting habitat for migratory waterfowl, shorebirds, and neotropical songbirds.
Established in 1994, as the 502nd national wildlife refuge in the country, the refuge currently contains 5,211 acres. Its proposed boundary stretches for 20 miles as the crow flies in an east-west direction along the lower third reach of the 162-mile-long Patoka River.
The refuge offers outstanding opportunities to view and photograph wildlife by driving on public roads, walking, or canoeing and boating refuge waters.
Area Economy
Table 3-196 summarizes the area economy for Patoka NWR. The refuge is located in Gibson and Pike Counties, while the economic hub for the area is Vanderburgh County where Evansville is located. From 1993 to 2003, the area’s population increased at a slower rate (2.5 percent) than Indiana (8.0 percent) and the United States (11.9 percent). During the same time period, area employment increased by 12.0 percent. The average per capita income for the area in 2003 was $31,396.
Table 3-196. Patoka NWR:Summary of Area Economy, 2003
(Population & Employment in 000’s; Per Capita Income in 2004 dollars)
Population Employment Per Capita Income
County 2003
Percent change
1993-2003 2003
Percent change
1993-2003 2003
Percent change
1993-2003Gibson, IN 33.0 3.2% 19.9 39.2% $28,767 26.1%Pike, IN 12.9 3.8% 4.5 5.5% $23,106 5.3%
Vanderburgh, IN 172.6 2.2% 128.5 8.9% $32,521 17.0%
Area Total 218.6 2.5% 152.9 12.0% $31,396 17.6%Indiana 6,199.6 8.0% 3,594.3 11.8% $29,606 14.6%
United States 290,789.0 11.9% 167,174.4 17.9% $32,310 15.8%
Source: U.S. Department of Commerce 2003.
Activity Levels
Table 3-197 shows that recreational visits to Patoka NWR in FY 2004 were fairly evenly distributed between non-consumptive activities (6,090 visits), hunting (7,610 visits), and fishing (6,300 visits). Refuge waters, including the Patoka River, South Fork, and adjacent oxbow and overflow wetlands such
178

Sample Refuges Descriptions
as Snakey Point and Buck marshes, offer excellent rod and reel fishing for bass, crappie, bluegill and red-eared sunfish. The majority of recreational visits are visitors from the local area (13,968 visits).
Table 3-197. Patoka NWR: 2004 Recreation Visits
Activity Residents Non-Residents Total
Non-Consumptive:
Nature Trails 3,438 1,852 5,290
Observation Platforms 640 160 800
Other Wildlife Observation 0 0 0
Beach /Water Use 0 0 0
Other Recreation 0 0 0
Hunting:
Big Game 1,875 625 2,500
Small Game 1,020 180 1,200
Migratory Birds 1,955 1,955 3,910
Fishing:
Freshwater 5,040 1,260 6,300
Saltwater 0 0 0
Total Visitation 13,968 6,032 20,000
Total Visitors 18,200
Regional Economic Analysis
In FY 2004, visitor recreation expenditures totaled $262,900 (Table 3-193). Over one-half of these expenditures are due to hunting expenditures $138,900. Residents spent $126,400, and non-residents spent $136,500.
The refuge is projected to increase in size from its present 5,253 acres to a possible 22,083 acres in the future. Expenditures in the local community may increase if recreational opportunities also increase.
179
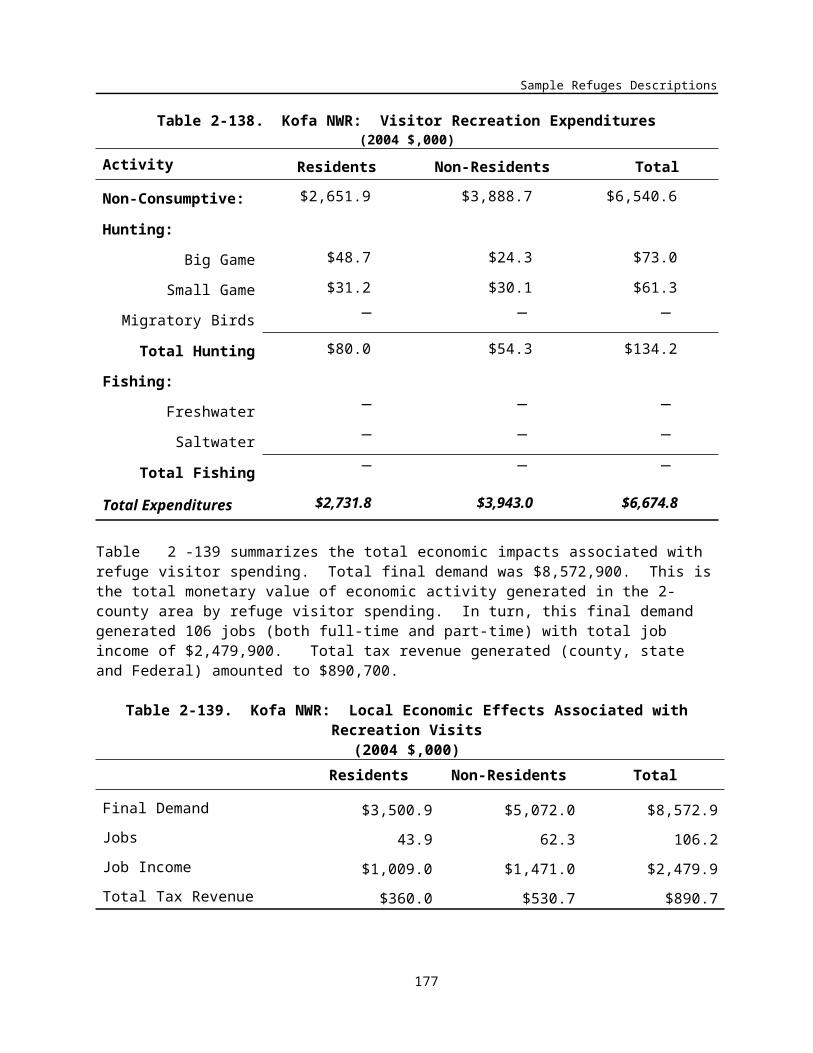
Banking on Nature: The Economic Benefits to Local Communities of National Wildlife Refuge Visitation
Table 3-198. Patoka NWR: Visitor Recreation Expenditures (2004 $,000)
Activity Residents Non-Residents Total
Non-Consumptive: $7.7 $24.5 $32.2
Hunting:
Big Game $25.3 $27.3 $52.6
Small Game $6.3 $7.3 $13.6
Migratory Birds $30.6 $42.1 $72.7
Total Hunting $62.3 $76.7 $138.9
Fishing:
Freshwater $56.4 $35.3 $91.8
Saltwater ─ ─ ─
Total Fishing $56.4 $35.3 $91.8
Total Expenditures $126.4 $136.5 $262.9
Table 3-199 shows the economic effects associated with recreation visits. Final demand totaled $384,100, and generated 6 jobs in the local area. Resident expenditures and non-resident expenditures resulted in fairly equal effects, both generated 3 jobs each.
Table 3-199. Patoka NWR: Local Economic Effects Associated with Recreation Visits (2004 $,000)
Residents Non-Residents Total
Final Demand $187.1 $197.0 $384.1
Jobs 3 3 6
Job Income $61.7 $65.6 $127.3
Total Tax Revenue $21.2 $31.3 $52.5
Patoka NWR’s budget and recreational benefits are shown in Table 3-200. In FY 2004, recreational benefits (recreation-related expenditures plus net economic value) summed to $871,800. The budget ($298,800) represents the expenditures for refuge staff, maintenance, and operations. The ratio ($2.92) is provided to broadly compare the magnitude of recreational benefits to the refuge budget and should not be used as a benefit-cost ratio. In addition to these recreational benefits, the refuge has other benefits including (but not limited to) protecting habitat that supports a variety of wildlife. Furthermore, the refuge budget also contributes to the local economy through its payroll and other maintenance and operating expenses.
180

Sample Refuges Descriptions
Table 3-200. Patoka NWR: Summary of Local Economic Effects of Recreation Visits (2004 $,000)
FY 2004 Budget
RecreationExpenditures
Net Economic Value
Total economic effects per $1 budget expenditure
Patoka NWR $298.8 $262.9 $608.9 $2.92
181

Banking on Nature: The Economic Benefits to Local Communities of National Wildlife Refuge Visitation
Rice Lake National Wildlife Refuge
Description
The 18,064-acre Rice Lake National Wildlife Refuge was established in 1935 and is located in the scenic forest and bog area of northern Minnesota. Visitors can enjoy a range of habitats, including lake, river, bog and hardwood forest.
The Refuge's history centers around the 4,500-acre Rice Lake which, for thousands of years, has supplied an abundant wild rice crop. Each fall, the bountiful rice attracts hundreds of thousands of waterfowl, as well as American Indians who harvest it using traditional methods. Rice Lake is known for its tremendous number of ring-necked ducks. Because of the high concentrations of migratory birds, Rice Lake Refuge has been designated as a Globally Important Bird Area by the American Birding Association.
The 2,045-acre Sandstone Unit of Rice Lake National Wildlife Refuge was acquired in 1970 through a land exchange with the U.S. Department of Justice. Sandstone is located in central Minnesota, in an area once known for expanses of towering white pine forests. Today, visitors enjoy a rustic and natural setting that includes a portion of the Wild and Scenic Kettle River. Birders will find plentiful neo-tropical migrants in the spring and fall. Sandstone's wildlife includes black bear, sandhill cranes, white-tailed deer and songbirds.
Area Economy
Located in Aitkin County, the refuge’s economic hub also includes Crow Wing and St. Louis Counties in Minnesota (Table 3-201). Cities where most expenditures occur include Aitkin, Brainerd, and Duluth. From 1993 to 2003, the area’s population increased by 4.4 percent to 273,500 people. Aitkin and Crow Wing Counties’ populations increased rapidly, 20.5 percent and 21.0 percent, respectively. During the same time period, area employment increased by 16.2 percent. The area’s average per capita income in 2003 was $27,926, which was lower than Minnesota ($34,937) and the United States ($32,310).
Table 3-201. Rice Lake NWR:Summary of Area Economy, 2003
(Population & Employment in 000’s; Per Capita Income in 2004 dollars)
Population Employment Per Capita Income
County 2003
Percent change
1993-2003 2003
Percent change
1993-2003 2003
Percent change
1993-2003Aitkin, MN 15.8 20.5% 7.4 34.9% $23,793 20.5%Crow Wing, MN 58.4 21.0% 33.1 29.8% $25,422 12.5%
St. Louis, MN 199.3 -0.6% 118.1 11.9% $28,987 21.0%
Area Total 273.5 4.4% 158.7 16.2% $27,926 18.9%Minnesota 5,064.2 11.2% 3,367.6 18.8% $34,937 23.5%
United States 290,789.0 11.9% 167,174.4 17.9% $32,310 15.8%
182

Sample Refuges Descriptions
Source: U.S. Department of Commerce 2003.Activity Levels
In FY 2004, recreational visits to Rice Lake NWR totaled 44,750, while the number of visitors totaled 22,500 people. Visits are higher than visitors because visitors may choose to participate in more than one activity. For example, one visitor may choose to hike on a nature trail in the morning and visit an observation platform in the afternoon. For non-consumptive activities, “other wildlife observation” includes people cross-country skiing, snowshoeing, and bicycling while observing wildlife, and “other recreation” includes the same activities without the main purpose being to see wildlife.
The majority of recreational visits are due to non-consumptive activities. Residents accounted for 21,506 visits, and non-residents accounted for 23,244 visits.
Table 3-202. Rice Lake NWR: 2004 Recreation Visits
Activity Residents Non-Residents Total
Non-Consumptive:
Nature Trails 6,200 9,300 15,500
Observation Platforms 2,320 3,480 5,800
Other Wildlife Observation 7,500 7,500 15,000
Beach /Water Use 0 0 0
Other Recreation 259 111 370
Hunting:
Big Game 135 315 450
Small Game 252 378 630
Migratory Birds 80 120 200
Fishing:
Freshwater 4,760 2,040 6,800
Saltwater 0 0 0
Total Visitation 21,506 23,244 44,750
Total Visitors 22,500
183

Banking on Nature: The Economic Benefits to Local Communities of National Wildlife Refuge Visitation
Regional Economic Analysis
Table 3-203 shows visitor recreation expenditures totaled $284,500 in FY 2004. Non-consumptive activities accounted for $212,500. Eighty-three percent of expenditures ($236,700) were by non-residents.
Table 3-203. Rice Lake NWR: Visitor Recreation Expenditures (2004 $,000)
Activity Residents Non-Residents Total
Non-Consumptive: $23.4 $189.1 $212.5
Hunting:
Big Game $1.6 $11.8 $13.3
Small Game $1.2 $12.3 $13.6
Migratory Birds $0.3 $0.6 $1.0
Total Hunting $3.1 $24.7 $27.9
Fishing:
Freshwater $21.3 $22.9 $44.2
Saltwater ─ ─ ─
Total Fishing $21.3 $22.9 $44.2
Total Expenditures $47.8 $236.7 $284.5
Table 3-204 summarizes the economic effects associated with recreation visits to Rice Lake NWR in FY 2004. Recreation visits to the refuge resulted in $413,000 in final demand and 6 jobs. The majority of the impacts were associated with non-resident expenditures.
Table 3-204. Rice Lake NWR: Local Economic Effects Associated with Recreation Visits (2004 $,000)
Residents Non-Residents Total
Final Demand $70.0 $343.0 $413.0
Jobs 1 5 6
Job Income $24.9 $119.5 $144.4
Total Tax Revenue $11.7 $58.6 $70.3
Recreational benefits and the refuge budget are compared in Table 3-205. In FY 2004, recreational benefits (recreation-related expenditures plus net economic value) totaled approximately $636,600. The ratio ($1.28) broadly compares the magnitude of recreational benefits and the refuge budget and should not be used as a benefit-cost ratio. In addition to recreational benefits, the refuge provides many ecological benefits that are not quantified in this analysis. Furthermore, the refuge budget provides an
184

Sample Refuges Descriptions
additional stimulus to the local economy through its payroll and maintenance expenditures.
Table 3-205. Rice Lake NWR: Summary of Local Economic Effects of Recreation Visits (2004 $,000)
FY 2004 Budget
RecreationExpenditures
Net Economic Value
Total economic effects per $1 budget expenditure
Rice Lake NWR
$489.3 $284.5 $341.1 $1.28
185

Banking on Nature: The Economic Benefits to Local Communities of National Wildlife Refuge Visitation
Seney National Wildlife Refuge
Description
Seney National Wildlife Refuge has been shaped by forces of nature and humans and reflects the evolving face of preservation, conservation, and restoration. Its creation story tells of features left by the glacier in the surrounding area known as the Great Manistique Swamp, and of the land's recovery from the human impact of logging and farming. Here the sun reflects off life-giving water that covers over half of the refuge, and regal pairs of trumpeter swans (part of a successful reintroduction project) glide across the refuge pools. The haunting cry of the common loon is often heard drifting across the waters of Seney Refuge, and bald eagles are often spotted along the seven-mile auto tour route.
Seney Refuge protects 95,212 acres and was established in 1935 to provide habitat for migratory birds and resident wildlife. Currently, it is home to over 200 species of birds and a variety of mammals, amphibians, reptiles, fish, and invertebrates. Its diverse wetland and upland habitats support a wide variety of wildlife, and Seney's programs, events, tours, facilities and opportunities make it "A Great Place to Watch Wildlife."
Area Economy
Seney NWR’s area economy is summarized in Table 3-206. The refuge is located in Schoolcraft County, and the remaining counties are adjacent to the refuge.
From 1993 to 2003, the area population increased 5.4 percent to 36,900 people but area employment increased by 16.2 percent to 17,900 people. The average per capita income in 2003 was $22,486. Mackinac County had the highest average per capita income in the area ($26,346). Overall, the area population, employment, and per capita income are increasing at a slower rate than the United States.
Table 3-206. Seney NWR:Summary of Area Economy, 2003
(Population & Employment in 000’s; Per Capita Income in 2004 dollars)
Population Employment Per Capita Income
County 2003
Percent change
1993-2003 2003
Percent change
1993-2003 2003
Percent change
1993-2003Alger, MI 9.8 0.3% 4.3 21.8% $20,171 12.4%Luce, MI 6.9 21.6% 3.0 5.0% $19,330 -14.4%
Mackinac, MI 11.5 4.1% 7.0 19.1% $26,346 14.9%
Schoolcraft, MI 8.8 2.1% 3.6 14.9% $22,482 11.9%Area Total 36.9 5.4% 17.9 16.2% $22,486 8.2%Michigan 10,082.4 5.7% 5,443.9 12.4% $32,008 15.9%
United States 290,789.0 11.9% 167,174.4 17.9% $32,310 15.8%
Source: U.S. Department of Commerce 2003.
186

Sample Refuges Descriptions
Activity Levels
In FY 2004, there were 57,403 recreational visits at Seney NWR. Ninety-three percent (53,153 visits) of visits were attributed to non-consumptive activities. “Other wildlife observation” includes birding at areas other than nature trails, and “other recreation” includes biking, skiing, backcountry hiking, and snowshoeing. Visitors also enjoy the Marshland Wildlife Drive, which is a 7-mile long self-guided auto tour.
There were 2,550 hunting visits and 1,700 freshwater fishing visits. Hunters hunt for ruffed grouse, woodcock, varying hare, deer, and bear. Approximately 70 percent (40,269) of all recreational visits were by non-residents.
Table 3-207. Seney NWR: 2004 Recreation Visits
Activity Residents Non-Residents Total
Non-Consumptive:
Nature Trails 11,333 26,443 37,776
Observation Platforms 2,353 9,413 11,766
Other Wildlife Observation 83 193 275
Beach /Water Use 0 0 0
Other Recreation 1,001 2,335 3,336
Hunting:
Big Game 1,000 1,000 2,000
Small Game 150 350 500
Migratory Birds 25 25 50
Fishing:
Freshwater 1,190 510 1,700
Saltwater 0 0 0
Total Visitation 17,134 40,269 57,403
Total Visitors 86,646
187

Banking on Nature: The Economic Benefits to Local Communities of National Wildlife Refuge Visitation
Regional Economic Analysis
Table 3-208 shows visitor recreation expenditures in FY 2004. Expenditures related to recreation visits at Seney NWR summed to $547,300. The majority of expenditures ($471,100) were attributable to non-consumptive activities. Residents spent $48,000 and non-residents spent $499,300.
Table 3-208. Seney NWR: Visitor Recreation Expenditures (2004 $,000)
Activity Residents Non-Residents Total
Non-Consumptive: $29.0 $442.1 $471.1
Hunting:
Big Game $9.6 $31.2 $40.8
Small Game $1.1 $17.1 $18.2
Migratory Birds $0.2 $0.3 $0.6
Total Hunting $11.0 $48.6 $59.6
Fishing:
Freshwater $8.0 $8.6 $16.6
Saltwater ─ ─ ─
Total Fishing $8.0 $8.6 $16.6
Total Expenditures $48.0 $499.3 $547.3
Table 3-209 shows the local economic effects associated with recreation visits. These visits resulted in $671,800 in final demand, 11 jobs, $235,500 in job income, and $112,600 in total tax revenue. The majority of jobs (10) were associated with non-resident expenditures.
Table 3-209. Seney NWR: Local Economic Effects Associated with Recreation Visits (2004 $,000)
Residents Non-Residents Total
Final Demand $60.0 $611.8 $671.8
Jobs 1 10 11
Job Income $21.1 $214.4 $235.5
Total Tax Revenue $9.6 $103.1 $112.6
Seney NWR’s budget and recreational benefits are shown in Table 3-210. In FY 2004, recreational benefits (recreation-related expenditures plus net economic value) summed to just over $1.0 million. The budget ($936,400) represents the expenditures for refuge staff, maintenance, and operations. The ratio ($1.16) is provided to broadly compare the magnitude of recreational benefits to the refuge budget and should not be used as a benefit-cost ratio. In addition to these recreational benefits, the refuge has other
188

Sample Refuges Descriptions
benefits including (but not limited to) providing habitat for migratory birds and resident wildlife. Furthermore, the refuge budget provides a stimulus to the local economy.
Table 3-210. Seney NWR: Summary of Local Economic Effects of Recreation Visits (2004 $,000)
FY 2004 Budget
RecreationExpenditures
Net Economic Value
Total economic effects per $1 budget expenditure
Seney NWR $936.4 $547.3 $538.7 $1.16Note: The budget is for the Seney Refuge Complex. Therefore, the ratio for Seney NWR is most likely higher.
189

Banking on Nature: The Economic Benefits to Local Communities of National Wildlife Refuge Visitation
Sherburne National Wildlife Refuge
Description
Sherburne National Wildlife Refuge is located in the east central region of the state, approximately 50 miles northwest of the Minneapolis/St. Paul metropolitan area and 30 miles southeast of St. Cloud. The refuge protects 30,665 acres of habitat for migratory birds and other wildlife.
The primary mission of the refuge is to represent a diverse biological community characteristic of the transition zone between tallgrass prairie and forest. Established in 1965 to protect and restore the habitats associated with the St. Francis River Valley, refuge management today focuses on the restoration of oak savanna, wetland and big woods habitats.
Area Economy
Sherburne County is located in south central Minnesota and contains the entirety of the Refuge lands. Major communities include Elk River, Becker, Zimmerman, and portions of Princeton and St. Cloud. The area economy is assumed to include Anoka, Benton, and Sherburne Counties in Minnesota (Table 3-211). It this area that is used to estimate the economic effects of recreational use on the refuge.
From 1993 to 2003, area population increased 25.3 percent, and area employment increased 43.1 percent. These rates of increase were more than double the rates of increase for Minnesota and the United States. During the same time period, average per capita income increased 22.3 percent to $31,835.
Table 3-211. Sherburne NWR:Summary of Area Economy, 2003
(Population & Employment in 000’s; Per Capita Income in 2004 dollars)
Population Employment Per Capita Income
County 2003
Percent change
1993-2003 2003
Percent change
1993-2003 2003
Percent change
1993-2003Anoka, MN 314.4 20.1% 152.7 36.3% $33,489 24.0%Benton, MN 37.6 18.4% 24.0 64.8% $28,150 28.6%
Sherburne, MN 75.4 57.9% 29.9 68.5% $26,779 14.3%
Area Total 427.4 25.3% 206.6 43.1% $31,835 22.3%Minnesota 5,064.2 11.2% 3,367.6 18.8% $34,937 23.5%
United States 290,789.0 11.9% 167,174.4 17.9% $32,310 15.8%
Source: U.S. Department of Commerce 2003.
190

Sample Refuges Descriptions
Activity Levels
Table 3-212 shows the recreation visits to Sherburne NWR. Recreation visits summed to 97,830 in FY2004. Approximately 69,000 visits were by residents while 28,781 visits were by non-residents.
The majority of recreation visits are attributed to non-consumptive activities. Sherburne Refuge offers a wide variety of non-consumptive activities throughout the year. Spring has mushroom and berry picking; summer brings canoeing; winter has cross country skiing and snowshoeing; and, hiking trails and the Prairie’s Edge Wildlife Drive are open all year round.
Table 3-212. Sherburne NWR: 2004 Recreation Visits
Activity Residents Non-Residents Total
Non-Consumptive:
Nature Trails 31,349 13,435 44,784
Observation Platforms 5,981 2,563 8,544
Other Wildlife Observation 16,800 7,200 24,000
Beach /Water Use 0 0 0
Other Recreation 6,350 2,722 9,072
Hunting:
Big Game 3,448 1,478 4,926
Small Game 1,805 774 2,579
Migratory Birds 1,422 610 2,032
Fishing:
Freshwater 1,893 0 1,893
Saltwater 0 0 0
Total Visitation 69,049 28,781 97,830
Total Visitors 113,038
191

Banking on Nature: The Economic Benefits to Local Communities of National Wildlife Refuge Visitation
Regional Economic Analysis
Visitor recreation expenditures totaled $869,900 in FY 2004 (Table 3-213). The majority of these expenditures are related to non-consumptive activities ($680,000). Residents spent $273,600 and non-residents spent $596,200.
Table 3-213. Sherburne NWR: Visitor Recreation Expenditures (2004 $,000)
Activity Residents Non-Residents Total
Non-Consumptive: $186.6 $493.3 $680.0
Hunting:
Big Game $39.9 $55.2 $95.2
Small Game $13.4 $37.8 $51.2
Migratory Birds $16.7 $9.8 $26.6
Total Hunting $70.0 $102.9 $172.9
Fishing:
Freshwater $17.0 ─ $17.0
Saltwater ─ ─ ─
Total Fishing $17.0 ─ $17.0
Total Expenditures $273.6 $596.2 $869.9
In FY 2004, recreation-related expenditures generated $1.2 million in final demand (Table 3-214). In turn, this final demand yielded 18 jobs, $406,800 in job income, and $210,300 in tax revenue. Non-resident expenditures provided an $830,200 stimulus to the local economy.
Table 3-214. Sherburne NWR: Local Economic Effects Associated with Recreation Visits (2004 $,000)
Residents Non-Residents Total
Final Demand $389.1 $830.2 $1,219.3
Jobs 6 12 18
Job Income $131.1 $275.7 $406.8
Total Tax Revenue $65.4 $145.0 $210.3
Table 3-215 compares the refuge budget and the local economic effects of recreation visits. In FY 2004, recreational benefits (recreation-related expenditures plus net economic value) totaled $2.4 million, and the budget expenditures summed to $993,300. The ratio shows that for every $1 of budget expenditures, $2.43 in recreational benefits are derived. This ratio is provided to broadly compare the magnitude of the two estimates and should not be used as a benefit-cost ratio. In addition to recreational benefits,
192

Sample Refuges Descriptions
Sherburne NWR provides a variety of other benefits including ecological and educational values which are not quantified in this analysis. Furthermore, the budget contributes an additional stimulus to the local economy.
Table 3-215. Sherburne NWR: Summary of Local Economic Effects of Recreation Visits (2004 $,000)
FY 2004 Budget
RecreationExpenditures
Net Economic Value
Total economic effects per $1 budget expenditure
Sherburne NWR
$993.3 $869.9 $1,545.9 $2.43
193

Banking on Nature: The Economic Benefits to Local Communities of National Wildlife Refuge Visitation
Squaw Creek National Wildlife Refuge
Description
Squaw Creek National Wildlife Refuge is located in northwestern Missouri within the historic Missouri River floodplain. The 7,350-acre refuge was established in 1935 as a resting, feeding, and breeding ground for migratory birds and other wildlife. Many of the original facilities were built by the Civilian Conservation Corps and the Works Progress Administration in the late 1930s.
The principal refuge habitats are seasonal and semipermanent wetlands, native warm and cool season grasslands, woodlands, and croplands. The refuge includes loess bluff hills, unusual geologic formations caused by wind-deposited soil, where remnants of the once-vast native prairie still exist.
Squaw Creek is best known for its large concentrations of snow geese, other waterfowl, and bald eagles. The refuge is a major stop-over for waterfowl, with more than one-half million birds in the fall and lesser, but still spectacular, numbers in the spring. The refuge is within the Mississippi Flyway.
Area Economy
Table 3-51 summarizes the area economy for Squaw Creek NWR. Holt County, Missouri encompasses the entirety of refuge lands. The remaining counties represent the economic hub for the area. It is within this 8-county area that visitor expenditures are assumed to occur.
From 1993 to 2003, the area population increased 10.9 percent to nearly 1.7 million people. Rates of change by county varied from -11.2 percent in Holt County to +26.5 percent in Johnson County. During the same time period, area employment increased 17.1 percent to 1.1 million jobs, and average per capita income increased 17.6 percent to $35,195.
194

Sample Refuges Descriptions
Table 3-216. Squaw Creek NWR:Summary of Area Economy, 2003
(Population & Employment in 000’s; Per Capita Income in 2004 dollars)
Population Employment Per Capita Income
County 2003
Percent change
1993-2003 2003
Percent change
1993-2003 2003
Percent change
1993-2003Buchanan, MO 85.0 0.3% 54.4 13.0% $26,609 16.7%Clay, MO 194.3 19.5% 114.7 27.0% $33,145 22.2%Holt, MO* 5.1 -11.2% 2.6 -6.2% $24,228 25.9%Jackson, MO 659.4 2.9% 450.7 3.0% $32,817 16.4%Platt, MO 79.4 24.6% 46.6 32.7% $36,111 16.7%
Johnson, KS 486.9 26.5% 375.1 41.9% $45,081 13.2%
Wyandotte, KS 157.0 -1.5% 89.6 0.8% $22,107 10.6%Richardson, NE 9.0 -8.8% 4.6 -12.8% $26,180 17.9%
Area Total 1,676.1 10.9% 1,138.3 17.1% $35,195 17.6%Missouri 5,719.2 8.5% 3,479.8 13.7% $30,249 16.5%
Kansas 2,724.8 6.6% 1,764.3 15.0% $30,222 14.3%
Nebraska 1,737.5 6.9% 1,184.7 15.3% $30,983 20.0%
United States 290,789.0 11.9% 167,174.4 17.9% $32,310 15.8%
Source: U.S. Department of Commerce 2003.
Activity Levels
Table 3-52 shows recreation visits to Squaw Creek NWR in FY 2004. Total visitation (259,706 visits) is greater than total visitors (121,487) because some visitors may choose to partake in more than one activity. For example, one visitor may choose to fish in the morning and use the nature trails in the afternoon (one visitor, two visits).
Many of the recreational visits are related to non-consumptive activities, especially nature trails (116,759 visits). Types of “other recreation” include picnicking and mushroom hunting. The refuge has a ten-mile, self-guided auto tour route, which provides an excellent opportunity to enjoy wildlife in a natural setting from the comfort of a vehicle. Residents accounted for 172,732 visits, and non-residents accounted for 86,974 visits.
195

Banking on Nature: The Economic Benefits to Local Communities of National Wildlife Refuge Visitation
Table 3-217. Squaw Creek NWR: 2004 Recreation Visits
Activity Residents Non-Residents Total
Non-Consumptive:
Nature Trails 70,055 46,704 116,759
Observation Platforms 11,676 7,784 19,460
Other Wildlife Observation 47,984 31,990 79,974
Beach /Water Use 0 0 0
Other Recreation 42,728 432 43,160
Hunting:
Big Game 259 65 324
Small Game 0 0 0
Migratory Birds 0 0 0
Fishing:
Freshwater 28 1 29
Saltwater 0 0 0
Total Visitation 172,732 86,974 259,706
Total Visitors 121,487
Regional Economic Analysis
Visitor recreation expenditures are shown in Table 3-53. In FY 2004, recreation expenditures totaled $1.4 million, with non-residents accounting for $1.1 million. Nearly all expenditures were associated with non-consumptive activities ($1.396 million). A small portion of expenditures are related to big game hunting and freshwater fishing.
196
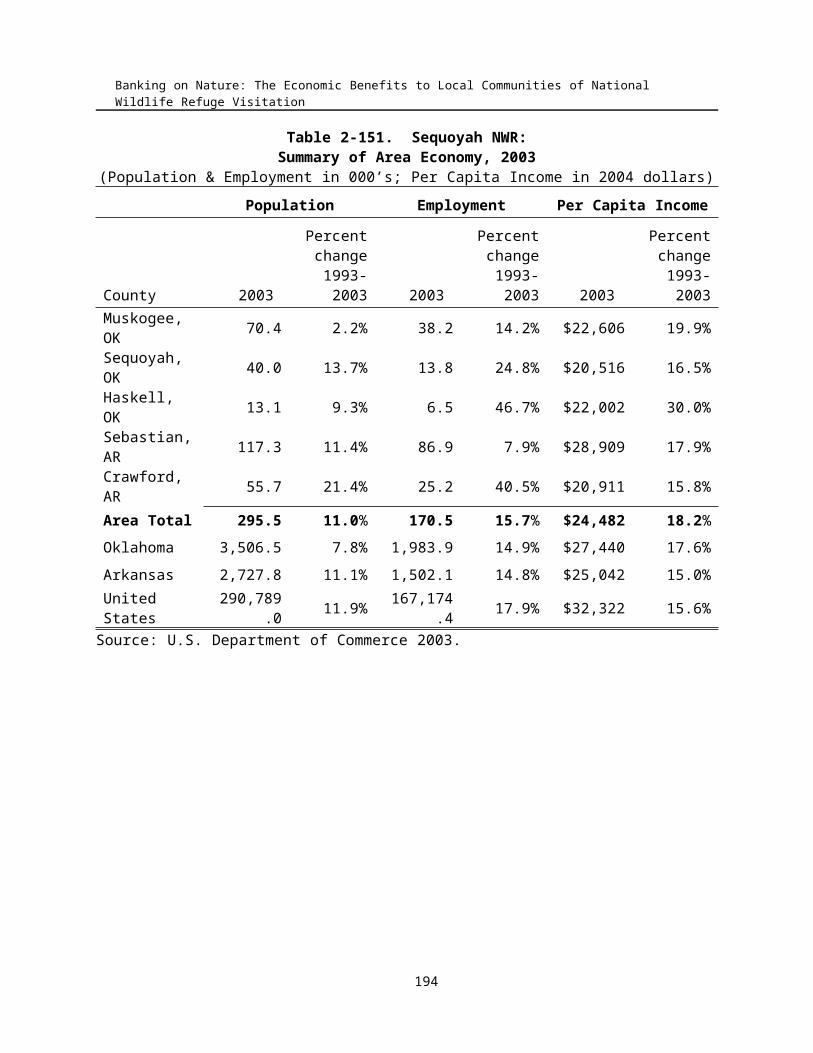
Sample Refuges Descriptions
Table 3-218. Squaw Creek NWR: Visitor Recreation Expenditures (2004 $,000)
Activity Residents Non-Residents Total
Non-Consumptive: $342.8 $1,053.3 $1,396.1
Hunting:
Big Game $3.5 $2.8 $6.3
Small Game ─ ─ ─
Migratory Birds ─ ─ ─
Total Hunting $3.5 $2.8 $6.3
Fishing:
Freshwater $0.1 ─ $0.1
Saltwater ─ ─ ─
Total Fishing $0.1 ─ $0.1
Total Expenditures $346.4 $1,056.2 $1,402.6
Recreation visits resulted in $2.3 million in final demand in the local area economy in FY 2004 (Table 3-219). This is the total monetary value of economic effect of economic activity generated in the local area by refuge recreation visitor spending. In turn, this final demand generated 26 jobs (both part-time and full-time) and $748,800 in job income.
Table 3-219. Squaw Creek NWR: Local Economic Effects Associated with Recreation Visits (2004 $,000)
Residents Non-Residents Total
Final Demand $562.1 $1,690.2 $2,252.3
Jobs 7 19 26
Job Income $191.9 $556.9 $748.8
Total Tax Revenue $74.4 $228.2 $302.6
Table 3-220 compares the refuge budget and local economic effects of recreation visits. In FY 2004, recreational benefits (recreation-related expenditures plus net economic value) totaled $3.5 million, and the refuge budget totaled $1.0 million. Comparing these two estimates shows that every $1 of budget expenditure yields $3.52 in recreational benefits. This ratio is provided to broadly compare the magnitude of recreational benefits and the refuge budget and should not be used as a benefit-cost ratio. In addition to recreational benefits, Squaw Creek NWR provides a variety of other benefits including (but not limited to) ecological values such as providing important habitat for migratory waterfowl in the Mississippi Flyway.
197

Banking on Nature: The Economic Benefits to Local Communities of National Wildlife Refuge Visitation
Table 3-220. Squaw Creek NWR: Summary of Local Economic Effects of Recreation Visits (2004 $,000)
FY 2004 Budget
RecreationExpenditures
Net Economic Value
Total economic effects per $1 budget expenditure
Squaw Creek NWR
$1,009.2 $1,402.6 $2,146.0 $3.52
198

Sample Refuges Descriptions
Tamarac National Wildlife Refuge
Description
Tamarac National Wildlife Refuge covers 42,724 acres and lies in the glacial lake country of northwestern Minnesota in Becker County, 18 miles northeast of Detroit Lakes. It was established in 1938 as a refuge breeding ground for migratory birds and other wildlife.
Refuge topography consists of rolling forested hills interspersed with lakes, rivers, marshes, bogs and shrub swamps. The token of the refuge is the tamarac tree. This unusual tree is a deciduous conifer, turning a brilliant gold before losing its needles each fall.
Tamarac lies in the heart of one of the most diverse vegetative transition zones in North America, where northern hardwood forests, coniferous forests and the tall grass prairie converge. This diversity of habitat brings with it a wealth of wildlife, both woodland and prairie species.
An attractive visitor center offers a spectacular vista of the marshes and trees that are typical of the Tamarac Refuge. A theater presentation provides orientation to the life and legends of this unique area.
Area Economy
Table 3-221 summarizes the area economy for Tamarac NWR. Located in Becker County, the main economic hub for the area includes Detroit Lakes (Becker County) and Park Rapids (Hubbard County). From 1993 to 2003, area population increased 12.7 percent, which was a higher increase than Minnesota (11.2 percent) and the United States (11.9 percent). Area employment also increased rapidly (36.7 percent) during this time period. In 2003, the area’s average per capita income was $26,088. Although the average per capita income was lower than both Minnesota and the United States, the rate of increase (31.7 percent) was higher than average.
Table 3-221. Tamarac NWR:Summary of Area Economy, 2003
(Population & Employment in 000’s; Per Capita Income in 2004 dollars)
Population Employment Per Capita Income
County 2003
Percent change
1993-2003 2003
Percent change
1993-2003 2003
Percent change
1993-2003Becker, MN 31.3 10.0% 21.2 46.6% $27,247 36.1%Hubbard, MN 18.6 17.4% 7.9 15.7% $24,140 24.1%
Area Total 49.9 12.7% 29.1 36.7% $26,088 31.7%Minnesota 5,064.2 11.2% 3,367.6 18.8% $34,937 23.5%
United States 290,789.0 11.9% 167,174.4 17.9% $32,310 15.8%
Source: U.S. Department of Commerce 2003.
Activity Levels
199

Banking on Nature: The Economic Benefits to Local Communities of National Wildlife Refuge Visitation
In FY 2004, 35,737 visitors to Tamarac NWR enjoyed a variety of recreational activities, including non-consumptive activities, hunting, and freshwater fishing (Table 3-222). Not included in this estimate are visitors that partake in special events and programs at the Visitor Center but do not participate in the recreational activities offered at the refuge.
The majority of visits (74 percent) were attributed to non-consumptive activities. A number of visitors travel to scenic parts of the refuge for bird observation (not on auto tour route or other designated trails). “Other recreation” captures visitors gathering mushrooms and berries, cross-country skiing, and snow shoeing. Eighty-seven percent of visits (31,783) were by people from the local area.
Table 3-222. Tamarac NWR: 2004 Recreation Visits
Activity Residents Non-Residents Total
Non-Consumptive:
Nature Trails 5,971 1,054 7,025
Observation Platforms 0 0 0
Other Wildlife Observation 7,500 2,500 10,000
Beach /Water Use 0 0 0
Other Recreation 9,594 196 9,790
Hunting:
Big Game 2,961 329 3,290
Small Game 1,496 79 1,575
Migratory Birds 1,710 90 1,800
Fishing:
Freshwater 2,550 450 3,000
Saltwater 0 0 0
Total Visitation 31,783 4,697 36,480
Total Visitors 35,737
Regional Economic Analysis
Visitor recreation expenditures are shown in Table 3-223. In FY 2004, recreation expenditures totaled $243,400 with non-residents accounting for 40 percent. Slightly more than half of all expenditures (59 percent) were associated with non-consumptive activities ($142,500). Hunting-related expenditures accounted for $76,200, and fishing-related expenditures accounted for $24,700.
200

Sample Refuges Descriptions
Table 3-223. Tamarac NWR: Visitor Recreation Expenditures (2004 $,000)
Activity Residents Non-Residents Total
Non-Consumptive: $71.2 $71.4 $142.5
Hunting:
Big Game $40.0 $14.3 $54.3
Small Game $5.6 $1.9 $7.5
Migratory Birds $13.4 $1.0 $14.4
Total Hunting $58.9 $17.2 $76.2
Fishing:
Freshwater $17.1 $7.6 $24.7
Saltwater -- -- ─
Total Fishing $17.1 $7.6 $24.7
Total Expenditures $147.3 $96.2 $243.4
Table 3-224 shows the local economic effects generated by recreation-related expenditures. These expenditures generated $329,800 in final demand, 6 jobs, $114,100 in job income, and $55,000 in tax revenue. Approximately two-thirds of these effects are attributable to expenditures by visitors from the local area.
Table 3-224. Tamarac NWR: Local Economic Effects Associated with Recreation Visits (2004 $,000)
Residents Non-Residents Total
Final Demand $199.4 $130.4 $329.8
Jobs 4 2 6
Job Income $68.9 $45.2 $114.1
Total Tax Revenue $32.7 $22.4 $55.0
The refuge budget and local economic effects of recreation visits are compared in Table 3-225. Recreational benefits (recreation-related expenditures plus net economic value) totaled $880,500. The ratio shows that for every $1 of budget expenditures, $0.94 in recreational benefits are derived. This ratio is provided to broadly compare the magnitude of the two estimates and should not be used as a benefit-cost ratio. In addition to recreational benefits, Tamarac NWR provides a variety of other benefits including ecological and educational values which are not quantified in this analysis. Furthermore, the budget contributes an additional stimulus to the local economy.
201

Banking on Nature: The Economic Benefits to Local Communities of National Wildlife Refuge Visitation
Table 3-225. Tamarac NWR: Summary of Local Economic Effects of Recreation Visits (2004 $,000)
FY 2004 Budget
RecreationExpenditures
Net Economic Value
Total economic effects per $1 budget expenditure
Tamarac NWR
$932.8 $243.4 $637.1 $0.94
202

Sample Refuges Descriptions
Region 4
Region 4 for the U.S. Fish & Wildlife Service includes Alabama, Arkansas, Florida, Georgia, Kentucky, Louisiana, Mississippi, North Carolina, Puerto Rico, South Carolina, and Tennessee. Sample refuges selected within this region include:
Black Bayou Lake NWR (Louisiana)Bon Secour NWR (Alabama)Cache River NWR (Arkansas)
Cape Romain NWR (South Carolina)Chassahowitzka NWR (Florida)Clarks River NWR (Kentucky)
Felsenthal NWR (Arkansas)J.N. Ding Darling NWR (Florida)Lower Suwannee NWR (Florida)
Okefenokee NWR (Georgia)Pea Island NWR (North Carolina)Pee Dee NWR (North Carolina)
Piedmont NWR (Georgia)Sabine NWR (Louisiana)St. Marks NWR (Florida)
Tennessee NWR (Tennessee)Theodore Roosevelt NWR Complex (Mississippi)
West Tennessee NWR Complex (Tennessee)White River NWR (Arkansas)
203
Banking on Nature: The Economic Benefits to Local Communities of National Wildlife Refuge Visitation
Black Bayou Lake National Wildlife Refuge
Description
Black Bayou Lake National Wildlife Refuge was established in 1997 through a unique partnership with the city of Monroe, Louisiana. The 2,000 acre scenic lake is owned by the city and serves as its secondary water source. The U.S. Fish and Wildlife Service has a free ninety-nine year management lease on the lake. The Service purchased 2,200 acres of land surrounding the lake, which expanded the refuge to 4,200 acres and protected most of the lake's watershed. The beautiful natural lake is studded with picturesque cypress and tupelo trees, and surrounded by swamps that graduate into bottomland hardwoods and then into upland mixed pine/hardwoods. The refuge supports an excellent fisheries resource and provides valuable habitat for migratory waterfowl, neotropical migratory songbirds, and many resident wildlife species.
This semi-urban refuge is ideally located to provide a place for people to connect with the natural world. It is one of four refuges managed in the North Louisiana Refuges Complex. The complex visitor center, a restored planter's house, is situated on the 40 acre Black Bayou Lake Environmental Education Center. Adjacent to the visitor center are an arboretum with over 100 native Louisiana woody plants and a prairie demonstration area with native grasses and wildflowers. Facilities also include interactive visitor center exhibits, a mile long raised asphalt/boardwalk nature trail with 400 foot wildlife pier, boat launch, amphitheater and pavilion, a raised observation deck with spotting scope and several informational kiosks. Members of Friends of Black Bayou, Inc., a refuge support group, provide thousands of hours of services for the refuge.
Area Economy
The Black Bayou NWR is located in Ouachita Parish in northeastern Louisiana. The parish had a population of 147,800 in 2003, an increase of 1.3 percent from 1993 compared with a 4.1 percent increase for the state of Louisiana and a 12 percent increase for the U.S. Total area employment increased by 19.9 percent from 1993 to 2003 compared with a 15.8 percent increase in Louisiana and a 18 percent increase in the U.S.
Per capita personal income increased in the area by 22.4 percent from 1993 to 2003. This compares with an 18.5 percent increase in Louisiana and a 15.6 percent increase in the U.S.
Activity Levels
Black Bayou NWR had 36,000 visitors in 2004. The majority of recreation visits, 15,700, were for non-consumptive activities. About 85 percent of recreation visits were undertaken by area residents.
.
204

Sample Refuges Descriptions
Table 4-226. Black Bayou Lake NWR:Summary of Area Economy, 2003
(Population & Employment in 000’s; Per Capita Income in 2004 dollars)
Population Employment Per Capita Income
County 2003
Percent change
1993-2003 2003
Percent change
1993-2003 2003
Percent change
1993-2003
Ouachita, LA 147.8 1.3% 89,198 19.9% 26,945 22.4%
Louisiana 4,493.7 4.1% 2,432,070 15.8% 27,022 18.5%
United States 290,789.0 11.9% 167,174.4 17.9% $32,322 15.6%
Source: U.S. Department of Commerce 2003.
Table 4-227. Black Bayou Lake NWR: 2004 Recreation Visits
Activity Residents Non-Residents Total
Non-Consumptive:
Nature Trails 3,927 1,173 5,100
Observation Platforms 6,930 2,070 9,000
Other Wildlife Observation 385 115 500
Beach /Water Use 0 0 0
Other Recreation 888 222 1,100
Hunting:
Big Game 500 0 500
Small Game 100 0 100
Migratory Birds 200 0 200
Fishing:
Freshwater 10,213 538 10,750
Saltwater 0 0 0
Total Visitation 23,143 4,118 27,260
Total Visitors 36,000
205

Banking on Nature: The Economic Benefits to Local Communities of National Wildlife Refuge Visitation
Regional Economic Analysis
The economic area for the Refuge is defined as Ouachita Parish in Louisiana. It is assumed that Refuge visitor expenditures occur primarily within this parish.
Table 4-228 shows visitor recreation expenditures for the Refuge in 2004. Total expenditures were $491,000 with non-residents accounting for $347,000 (71 percent of total expenditures). Expenditures on non-consumptive activities accounted for 12 percent of the total, hunting 2 percent and fishing 86 percent.
Table 4-228. Black Bayou Lake NWR: Visitor Recreation Expenditures (2004 $,000)
Activity Residents Non-Residents Total
Non-Consumptive: $22.2 $36.9 $59.1
Hunting:
Big Game $5.4 ─ $5.4
Small Game $0.6 ─ $0.6
Migratory Birds $1.8 ─ $1.8
Total Hunting $7.8 ─ $7.8
Fishing:
Freshwater $114.1 $310.1 $424.2
Saltwater ─ ─ ─
Total Fishing $114.1 $310.1 $424.2
Total Expenditures $144.0 $347.0 $491.0
Table 4-229 summarizes the total economic impacts associated with refuge visitor spending. Total final demand was $723,700. This is the total monetary value of economic activity generated in the 3-county area by refuge visitor spending. In turn, this final demand generated 8 jobs (both full-time and part-time) with total job income of $191,100. Total tax revenue generated (county, state and Federal) amounted to $86,400.
Table 4-229. Black Bayou Lake NWR: Local Economic Effects Associated with Recreation Visits (2004 $,000)
Residents Non-Residents Total
Final Demand $212.0 $511.7 $723.7
Jobs 2.4 5.8 8.1
Job Income $56.0 $135.1 $191.1
206

Sample Refuges Descriptions
Total Tax Revenue $25.2 $61.2 $86.4
Table 4-230 shows total economic effects (total recreation expenditures plus net economic value) compared with the refuge budget for 2004. For an individual, net economic value is that person's total willingness to pay for a particular recreation activity minus his or her actual expenditures for that activity. The figure for economic value is derived by multiplying net economic values for hunting, fishing, and non-consumptive recreation use (on a per-day basis) by estimated refuge visitor days for that activity. This figure is combined with the estimate of total expenditures and divided by the refuge budget for 2004. The $1.24 means that for every $1 of budget expenditures, $1.24 of total economic effects are associated with these budget expenditures. This ratio is provided only for the purpose of broadly comparing the magnitude of economic effects resulting from refuge visitation to budget expenditures and should not be interpreted as a benefit-cost ratio.
Table 4-230. Black Bayou Lake NWR: Summary of Local Economic Effects of Recreation Visits (2004 $,000)
FY 2004 Budget
RecreationExpenditures
Net Economic Value
Total economic effects per $1 budget expenditure
Black Bayou Lake NWR
$722.2 $491.0 $402.9 $1.24
207

Banking on Nature: The Economic Benefits to Local Communities of National Wildlife Refuge Visitation
Bon Secour National Wildlife Refuge
Description
The Bon Secour NWR consists of 6,700 acres of wildlife habitat lying directly west of Gulf Shores, Alabama on the Fort Morgan peninsula of south Alabama. The refuge was established by congress in 1980 to serve habitat for non-game birds migrating south in the fall and north in the spring. The migration paths from Bon Secour lead south to lower Florida, the Caribbean, Mexico and Central America
The name Bon Secour comes from the French meaning "safe harbor", very appropriate considering the sanctuary for native flora and fauna that the refuge provides. The refuge serves the additional benefit of comprising one of the largest undeveloped parcels of land on the Alabama coast. Its dunes are a reminder of the Gulf Coast, as it once existed. As a consequence, the refuge has been named as one of the 10 natural wonders of Alabama.
The Refuge is home to the endangered Alabama beach mouse, which is associated with the sand dunes and sea oats. Refuge beaches serve as nesting sites for green, loggerhead, and Kemp's Ridley sea turtles. Habitats include beaches and sand dunes, scrub forest, fresh and saltwater marshes, fresh water swamps, and uplands.
More than 400 species of birds have been identified and banded at the refuge during migratory seasons. The largest are usually ospreys and several species of herons. At the other extreme, seven species of hummingbirds have been identified. Mammals such as red fox, wild pig, coyotes, armadillos and others are also present.
Bon Secour NWR is located on the Fort Morgan peninsula, west of Gulf Shores, Alabama.
Area Economy
The Bon Secour NWR is located in Mobile and Baldwin counties in southwestern Alabama on the Gulf of Mexico. The area had a population of 551,500 in 2003, an increase of 9.2 percent from 1993 compared with a 6.9 percent increase for the state of Alabama and a 12 percent increase for the U.S. Total area employment increased by 15.6 percent from 1993 to 2003 compared with a 10.1 percent increase in Alabama and a 18 percent increase in the U.S.
Per capita personal income increased in the area by 12.8 percent from 1993 to 2003. This compares with a 17.0 percent increase in Alabama and a 15.6 percent increase in the U.S.
Activity Levels
Bon Secour NWR had 123,975 visitors in 2004. The vast majority of recreation visits, 151,840, were for non-consumptive activities. Saltwater fishing accounted for 14 percent of refuge recreation visits. About 64 percent of all recreation visits were undertaken by non-residents
208

Sample Refuges Descriptions
Table 4-231. Bon Secour NWR:Summary of Area Economy, 2003
(Population & Employment in 000’s; Per Capita Income in 2004 dollars)
Population Employment Per Capita Income
County 2003
Percent change
1993-2003 2003
Percent change
1993-2003 2003
Percent change
1993-2003
Mobile, AL 399.9 1.6% 212.4 5.7% $23,789 9.8%
Baldwin, AL 151.6 36.0% 74.8 57.3% $28,700 17.1%
Area Total 551.5 9.2% 287.2 15.6% $25,138 12.8%
Alabama 4,503.7 6.9% 2,390.2 10.1% $27,221 17.0%
United States 290,789.0 11.9% 167,174.4 17.9% $32,322 15.6%
Source: U.S. Department of Commerce 2003. .
Table 4-232. Bon Secour NWR: 2004 Recreation Visits
Activity Residents Non-Residents Total
Non-Consumptive:
Nature Trails 22,506 67,519 90,025
Observation Platforms 0 0 0
Other Wildlife Observation 9 26 35
Beach /Water Use 14,650 14,650 29,300
Other Recreation 8,120 24,360 32,480
Hunting:
Big Game 0 0 0
Small Game 0 0 0
Migratory Birds 0 0 0
Fishing:
Freshwater 169 169 338
Saltwater 18,071 6,024 24,095
Total Visitation 63,525 112,747 176,272
Total Visitors 123,975
209
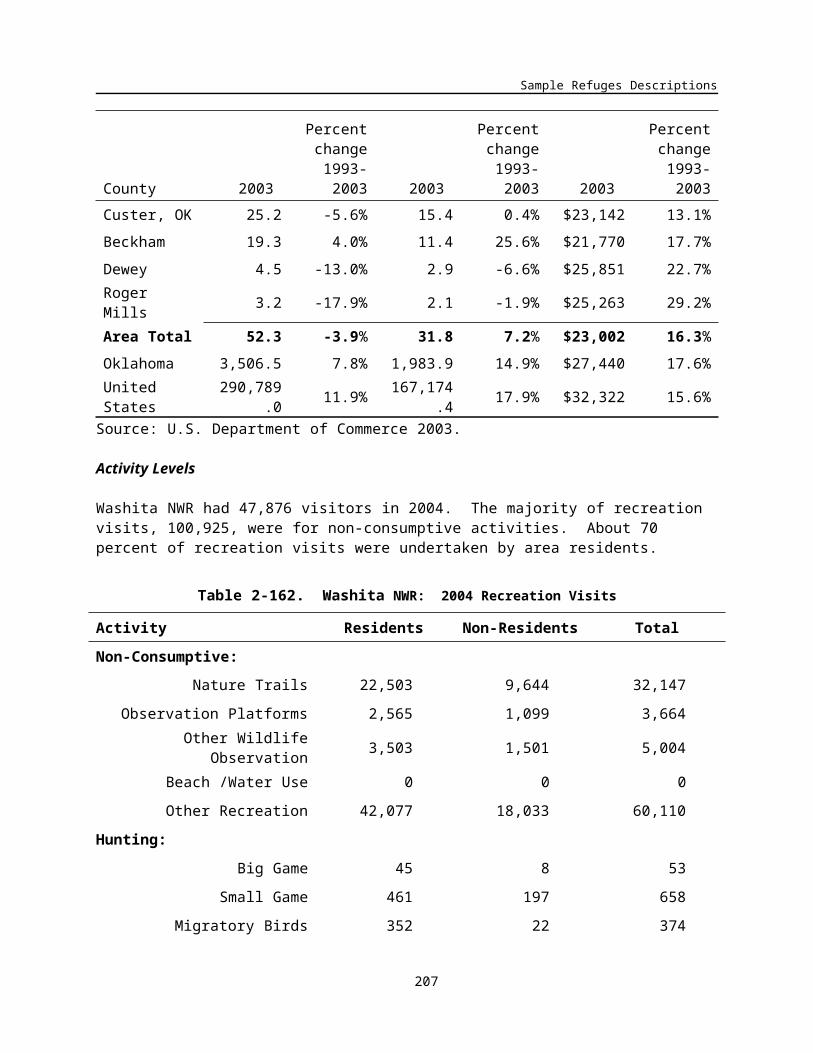
Banking on Nature: The Economic Benefits to Local Communities of National Wildlife Refuge Visitation
Regional Economic Analysis
The economic area for the Refuge is defined as Mobile and Baldwin counties in Alabama. It is assumed that Refuge visitor expenditures occur primarily within this 2-county area.
Table 4-8 shows visitor recreation expenditures for the Refuge in 2004. Total expenditures were $5,377,600 with non-residents accounting for $4,525,900 (84 percent of total expenditures). Expenditures on non-consumptive activities accounted for 55 percent of the total, fishing 45 percent.
Table 4-233. Bon Secour NWR: Visitor Recreation Expenditures (2004 $,000)
Activity Residents Non-Residents Total
Non-Consumptive: $264.2 $2,713.7 $2,977.9
Hunting:
Big Game ─ ─ ─
Small Game ─ ─ ─
Migratory Birds ─ ─ ─
Total Hunting ─ ─ ─
Fishing:
Freshwater $0.8 $2.1 $2.9
Saltwater $586.7 $1,810.2 $2,396.9
Total Fishing $587.5 $1,812.2 $2,399.7
Total Expenditures $851.7 $4,525.9 $5,377.6
Table 4-234 summarizes the total economic impacts associated with refuge visitor spending. Total final demand was $7,158,400. This is the total monetary value of economic activity generated in the 2-county area by refuge visitor spending. In turn, this final demand generated 74 jobs (both full-time and part-time) with total job income of $1,940,100. Total tax revenue generated (county, state and Federal) amounted to $2,247,900.
Table 4-234. Bon Secour NWR: Local Economic Effects Associated with Recreation Visits (2004 $,000)
Residents Non-Residents Total
Final Demand $1,128.2 $6,030.2 $7,158.4
Jobs 12.2 61.8 74.0
Job Income $311.9 $1,628.2 $1,940.1
Total Tax Revenue $356.8 $1,891.1 $2,247.9
210

Sample Refuges Descriptions
Table 4-235 shows total economic effects (total recreation expenditures plus net economic value) compared with the refuge budget for 2004. For an individual, net economic value is that person's total willingness to pay for a particular recreation activity minus his or her actual expenditures for that activity. The figure for economic value is derived by multiplying net economic values for hunting, fishing, and non-consumptive recreation use (on a per-day basis) by estimated refuge visitor days for that activity. This figure is combined with the estimate of total expenditures and divided by the refuge budget for 2004. The $20.38 means that for every $1 of budget expenditures, $20.38 of total economic effects are associated with these budget expenditures. This ratio is provided only for the purpose of broadly comparing the magnitude of economic effects resulting from refuge visitation to budget expenditures and should not be interpreted as a benefit-cost ratio.
Table 4-235. Bon Secour NWR: Summary of Local Economic Effects of Recreation Visits (2004 $,000)
FY 2004 Budget
RecreationExpenditures
Net Economic Value
Total economic effects per $1 budget expenditure
Bon Secour NWR
$392,776 $5,377,600 $2,628,191 $20.38
211
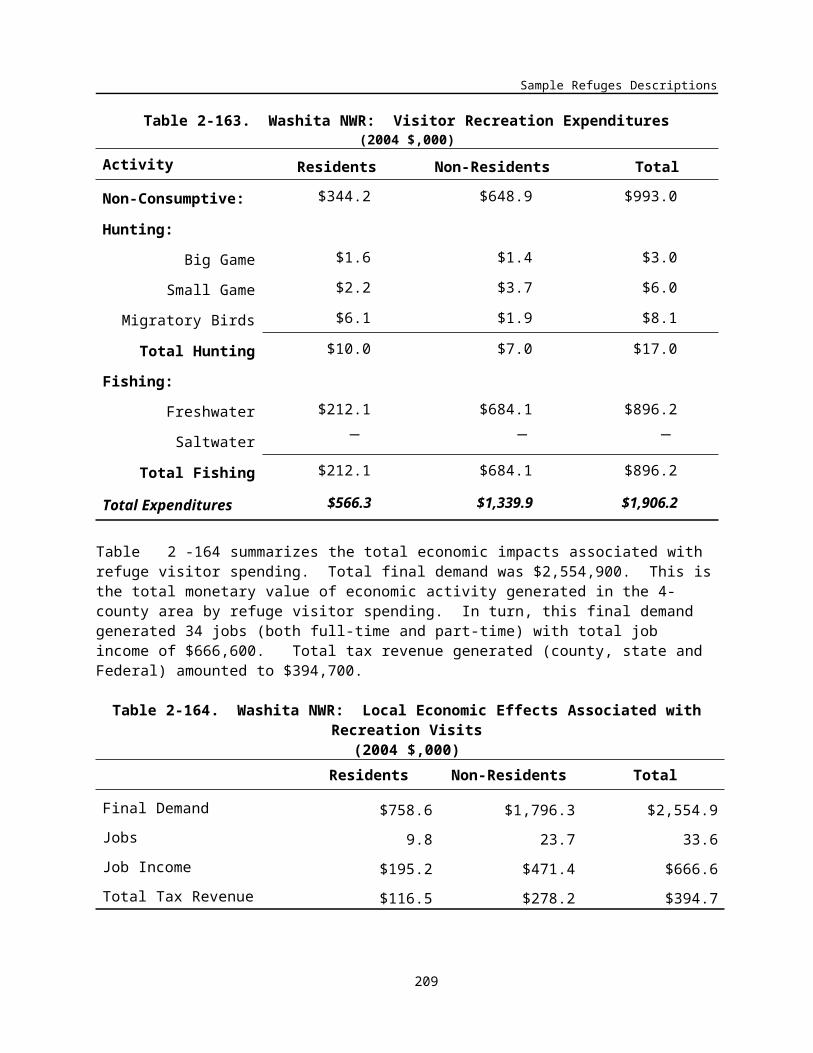
Banking on Nature: The Economic Benefits to Local Communities of National Wildlife Refuge Visitation
Cache River National Wildlife Refuge
Description
Cache River National Wildlife Refuge (NWR) was established in 1986 to protect significant wetland habitats and provide feeding and resting areas for migrating waterfowl.
As one of the few remaining areas in the Lower Mississippi River Valley not drastically altered by channelization and drainage, the Cache River basin contains a variety of wetland communities including some of the most intact and least disturbed bottomland hardwood forests in the Mississippi Valley region. These unique and valuable wetlands have been protected by the RAMSAR Convention as Wetlands of International Importance.
At present the refuge currently encompasses over 56,000 acres located in numerous non-contiguous tracts in Jackson, Woodruff, Monroe and Prairie counties in east central Arkansas. The boundary of this refuge changes frequently as land acquisition continues along the Cache River, White River and Bayou Deview.
Area Economy
Table 4-236 summarizes the area economy for Cache River NWR. From 1993 to 2003, the area population increased 7.0 percent to 114,400 people, and employment increased 13.9 percent to 53,400 jobs. In 2003, the area’s per capita income ($21,817) was below Arkansas ($25,033) and the United States ($32,310).
Table 4-236. Cache River NWR:Summary of Area Economy, 2003
(Population & Employment in 000’s; Per Capita Income in 2004 dollars)
Population Employment Per Capita Income
County 2003
Percent change
1993-2003 2003
Percent change
1993-2003 2003
Percent change
1993-2003
Jackson, AR 17.5 -7.8% 8.5 1.9% $22,740 16.0%
Monroe, AR 9.7 -11.5% 4.2 -7.8% $21,265 23.2%
Prairie, AR 9.3 -0.8% 3.3 7.3% $21,770 23.5%
White, AR 69.6 19.2% 33.8 25.1% $21,691 15.8%
Woodruff, AR 8.3 -9.6% 21,624.9 -7.8% $21,625 16.4%
Area Total 114.4 7.0% 53.4 13.9% $21,817 17.1%
Arkansas 2,727.8 11.1% 1,502.1 14.8% $25,033 15.2%
United States 290,789.0 11.9% 167,174.4 17.9% $32,310 15.8%
Source: U.S. Department of Commerce 2003.
212
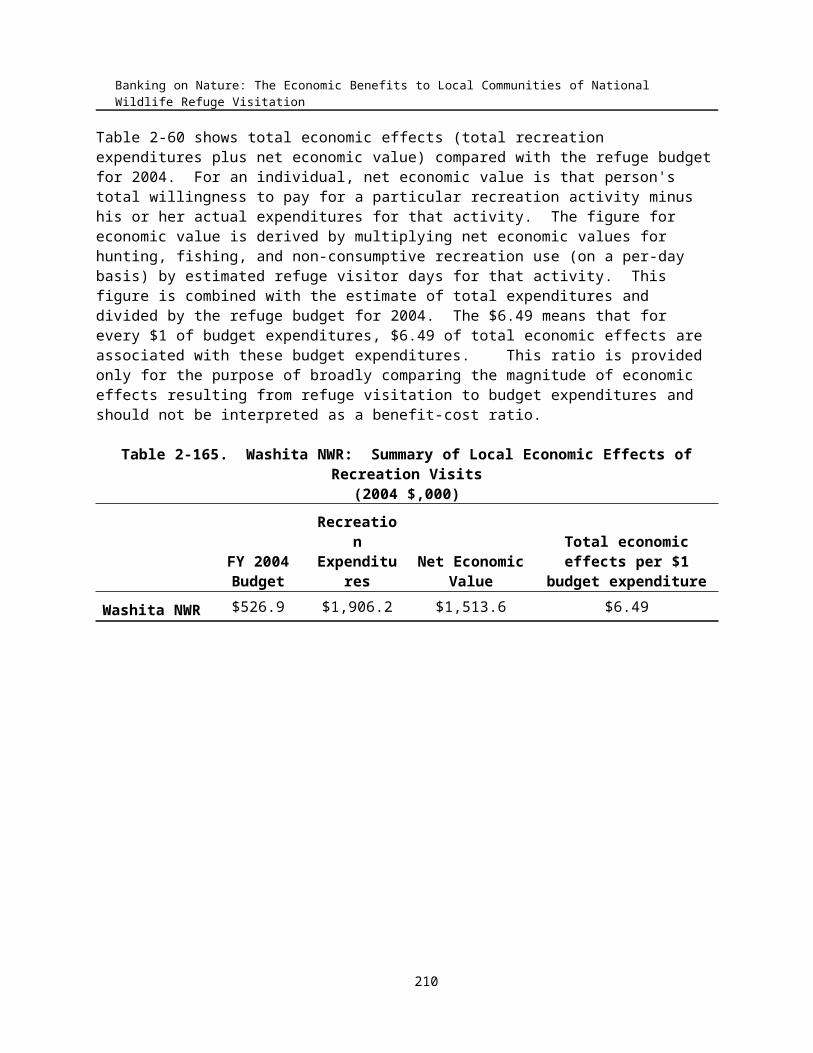
Sample Refuges Descriptions
Activity Levels
Table 4-237 shows recreation visits to Cache River NWR in FY 2004. Total visitation (255,976) is greater than total visitors (127,500) because some visitors chose to partake in more than one activity.
Visitors to the refuge enjoy a wide range of activities including hiking, birdwatching, hunting, fishing, and others. “Other recreation” and “other observation” include bird watching and nature photography. The majority of visits were for consumptive activities (hunting and fishing). Freshwater fishing had 110,370 visits, while migratory bird hunting was the most popular type of hunting with 61,607 visits. Seventy-six percent of visits (195,188) were attributable to visitors from the local area.
Table 4-237. Cache River NWR: 2004 Recreation Visits
Activity Residents Non-Residents Total
Non-Consumptive:
Nature Trails 0 0 0
Observation Platforms 0 0 0
Other Wildlife Observation 14,406 3,602 18,008
Beach /Water Use 59 7 65
Other Recreation 495 55 550
Hunting:
Big Game 32,861 14,083 46,944
Small Game 16,589 1,843 18,432
Migratory Birds 36,964 24,643 61,607
Fishing:
Freshwater 93,815 16,556 110,370
Saltwater 0 0 0
Total Visitation 195,188 60,788 255,976
Total Visitors 127,500
213

Banking on Nature: The Economic Benefits to Local Communities of National Wildlife Refuge Visitation
Regional Economic Analysis
Visitor recreation expenditures totaled nearly $3.3 million in FY 2004 (Table 4-238). Non-consumptive, hunting, and fishing expenditures summed to $131,000, $2.3 million, and $852,100, respectively. Expenditures were fairly evenly distributed between resident and non-resident visitors.
Table 4-238. Cache River NWR: Visitor Recreation Expenditures (2004 $,000)
Activity Residents Non-Residents Total
Non-Consumptive: $55.2 $75.8 $131.0
Hunting:
Big Game $343.6 $361.8 $705.4
Small Game $128.1 $53.5 $181.5
Migratory Birds $336.1 $1,085.3 $1,421.4
Total Hunting $807.7 $1,500.6 $2,308.4
Fishing:
Freshwater $575.8 $276.3 $852.1
Saltwater ─ ─ ─
Total Fishing $575.8 $276.3 $852.1
Total Expenditures $1,438.8 $1,852.7 $3,291.5
Table 4-239 shows the local economic effects associated with recreation visits and expenditures. These recreation-related expenditures generated $4.5 million in final demand, 81 jobs, $1.6 million in job income, and $770,100 in tax revenue. Expenditures associated with non-resident visits provided a $2.5 million stimulus to the local economy.
Table 4-239. Cache River NWR: Local Economic Effects Associated with Recreation Visits (2004 $,000)
Residents Non-Residents Total
Final Demand $1,972.3 $2,521.9 $4,494.2
Jobs 37 44 81
Job Income $694.6 $915.1 $1,609.7
Total Tax Revenue $320.9 $449.1 $770.1
Table 4-240 compares the refuge budget and the local economic effects of recreation visits. In FY 2004, recreational benefits (recreation-related expenditures plus net economic value) totaled $9.3 million, and FY 2003 budget expenditures summed to $430,000. Comparing these two estimates shows that for every $1 of budget expenditures, $21.71 in recreational benefits are derived. This ratio is provided to broadly
214

Sample Refuges Descriptions
compare the magnitude of the two estimates and should not be used as a benefit-cost ratio. In addition to recreational benefits, Cache River NWR provides a variety of other benefits including ecological and educational values which are not quantified in this analysis. Furthermore, the budget contributes an additional stimulus to the local economy.
Table 4-240. Cache River NWR: Summary of Local Economic Effects of Recreation Visits (2004 $,000)
FY 2004 Budget
RecreationExpenditures
Net Economic Value
Total economic effects per $1 budget expenditure
Cache River NWR
$430.0 $3,291.5 $6,044.0 $21.71
215

Banking on Nature: The Economic Benefits to Local Communities of National Wildlife Refuge Visitation
Cape Romain National Wildlife Refuge
Description
Cape Romain National Wildlife Refuge was established in 1932 to provide wintering habitat for migratory birds. Cape Romain's 64,000 acres encompass a 20-mile segment of the Atlantic coast and include barrier islands, salt marshes, coastal waterways, fresh and brackish water impoundments, and maritime forest. Of the land areas, 28,000 acres are preserved within the National Wilderness Preservation System.
The refuge aids in the recovery of the threatened loggerhead sea turtle and the endangered red wolf. It has the largest loggerhead sea turtle rookery in the U.S. outside Florida, averaging 1,000 nests per year. Bull Island is a propagation site for the red wolf. Other endangered or threatened species occurring on the refuge include the bald eagle, peregrine falcon, piping plover, least tern, wood stork, American alligator, and sea beach amaranth.
Cape Romain encompasses Bulls Bay and a number of lesser bays making up one of the least developed and most productive estuaries on the East Coast of the United States. The refuge harbors the largest wintering populations of American oystercatchers and marbled godwits in the U.S. The refuge also has one of the largest Eastern brown pelican and least tern rookeries in the State.
The Refuge headquarters and Sewee Center are located about 20 miles north of Charleston, South Carolina on U.S. Highway 17.
Area Economy
The Cape Romain NWR is located in Charleston County in South Carolina on the Atlantic Ocean. A significant number of refuge visitors come from Berkley, Dorchester, and Georgetown counties. The area had a population of 631,300 in 2003, an increase of 8.6 percent from 1993 compared with a 13.3 percent increase for the state of South Carolina and a 12 percent increase for the U.S. Total area employment increased by 21.8 percent from 1993 to 2003 compared with a 17 percent increase in South Carolina and a 18 percent increase in the U.S.
Per capita personal income increased in the area by 22.6 percent from 1993 to 2003. This compares with a 16.9 percent increase in South Carolina and a 15.6 percent increase in the U.S. .Activity Levels
Cape Romain NWR had 165,000 visitors in 2004. The majority of recreation visits, over 180,000, were for non-consumptive activities. About 85 percent of recreation visits were undertaken by area residents.
216

Sample Refuges Descriptions
Table 4-241. Cape Romain NWR:Summary of Area Economy, 2003
(Population & Employment in 000’s; Per Capita Income in 2004 dollars)
Population Employment Per Capita Income
County 2003
Percent change
1993-2003 2003
Percent change
1993-2003 2003
Percent change
1993-2003
Charleston, SC 321.1 4.7% 253.9 13.4% $31,787 25.4%
Berkeley, SC 147.2 7.7% 54.3 59.9% $24,074 24.2%
Dorchester, SC 104.1 17.6% 35.7 30.8% $24,880 12.2%Georgetown, SC 58.9 19.2% 31.5 36.1% $27,333 23.0%
Area Total 631.3 8.6% 375.5 21.8% $28,434 22.6%
South Carolina 4,148.7 13.3% 2,273.9 17.0% $26,850 16.9%
United States 290,789.0 11.9% 167,174.4 17.9% $32,322 15.6%
Source: U.S. Department of Commerce 2003.
Table 4-242. Cape Romain NWR: 2004 Recreation Visits
Activity Residents Non-Residents TotalNon-Consumptive:
Nature Trails 16,020 10,680 26,700
Observation Platforms 24,225 4,275 28,500
Other Wildlife Observation 7,770 5,180 12,950
Beach /Water Use 26,125 1,375 27,500
Other Recreation 80,180 4,220 84,400
Hunting:
Big Game 128 128 256
Small Game 0 0 0
Migratory Birds 238 13 251
Fishing:
Freshwater 0 0 0
Saltwater 68,000 12,000 80,000
Total Visitation 222,685 37,870 260,555
Total Visitors 165,000
217

Banking on Nature: The Economic Benefits to Local Communities of National Wildlife Refuge Visitation
Regional Economic Analysis
The economic area for the Refuge is defined as Charleston, Berkley, Dorchester, and Georgetown counties in South Carolina. It is assumed that Refuge visitor expenditures occur primarily within this 4-county area.
Table 4-243 shows visitor recreation expenditures for the Refuge in 2004. Total expenditures were $14,272,600 with non-residents accounting for $10,019,500 (70 percent of total expenditures). Expenditures on non-consumptive activities accounted for 16 percent of the total, hunting 1 percent and fishing 83 percent.
Table 4-243. Cape Romain NWR: Visitor Recreation Expenditures (2004 $,000)
Activity Residents Non-Residents Total
Non-Consumptive: $1,306.1 $932.9 $2,239.1
Hunting:
Big Game $1.7 $4.1 $5.8
Small Game ─ ─ ─
Migratory Birds $1.6 $0.4 $2.0
Total Hunting $3.2 $4.5 $7.7
Fishing:
Freshwater ─ ─ ─
Saltwater $2,943.7 $9,082.0 $12,025.8
Total Fishing $2,943.7 $9,082.0 $12,025.8
Total Expenditures $4,253.1 $10,019.5 $14,272.6
Table 4-244 summarizes the total economic impacts associated with refuge visitor spending. Total final demand was $20,515,300. This is the total monetary value of economic activity generated in the 4-county area by refuge visitor spending. In turn, this final demand generated 218 jobs (both full-time and part-time) with total job income of $5,729,900. Total tax revenue generated (county, state and Federal) amounted to $2,506,600.
Table 4-244. Cape Romain NWR: Local Economic Effects Associated with Recreation Visits (2004 $,000)
Residents Non-Residents Total
Final Demand $6,100.6 $14,414.7 $20,515.3
Jobs 64.8 153.5 218.4
Job Income $1,689.6 $4,040.4 $5,729.9
218

Sample Refuges Descriptions
Total Tax Revenue $740.6 $1,766.0 $2,506.6
Table 4-245 shows total economic effects (total recreation expenditures plus net economic value) compared with the refuge budget for 2004. For an individual, net economic value is that person's total willingness to pay for a particular recreation activity minus his or her actual expenditures for that activity. The figure for economic value is derived by multiplying net economic values for hunting, fishing, and non-consumptive recreation use (on a per-day basis) by estimated refuge visitor days for that activity. This figure is combined with the estimate of total expenditures and divided by the refuge budget for 2004. The $27.37 means that for every $1 of budget expenditures, $27.37 of total economic effects are associated with these budget expenditures. This ratio is provided only for the purpose of broadly comparing the magnitude of economic effects resulting from refuge visitation to budget expenditures and should not be interpreted as a benefit-cost ratio.
Table 4-245. Cape Romain NWR: Summary of Local Economic Effects of Recreation Visits (2004 $,000)
FY 2004 Budget
RecreationExpenditures
Net Economic Value
Total economic effects per $1 budget expenditure
Cape Romain NWR
$785,616 $14,272,567 $7,229,433 $27.37
219
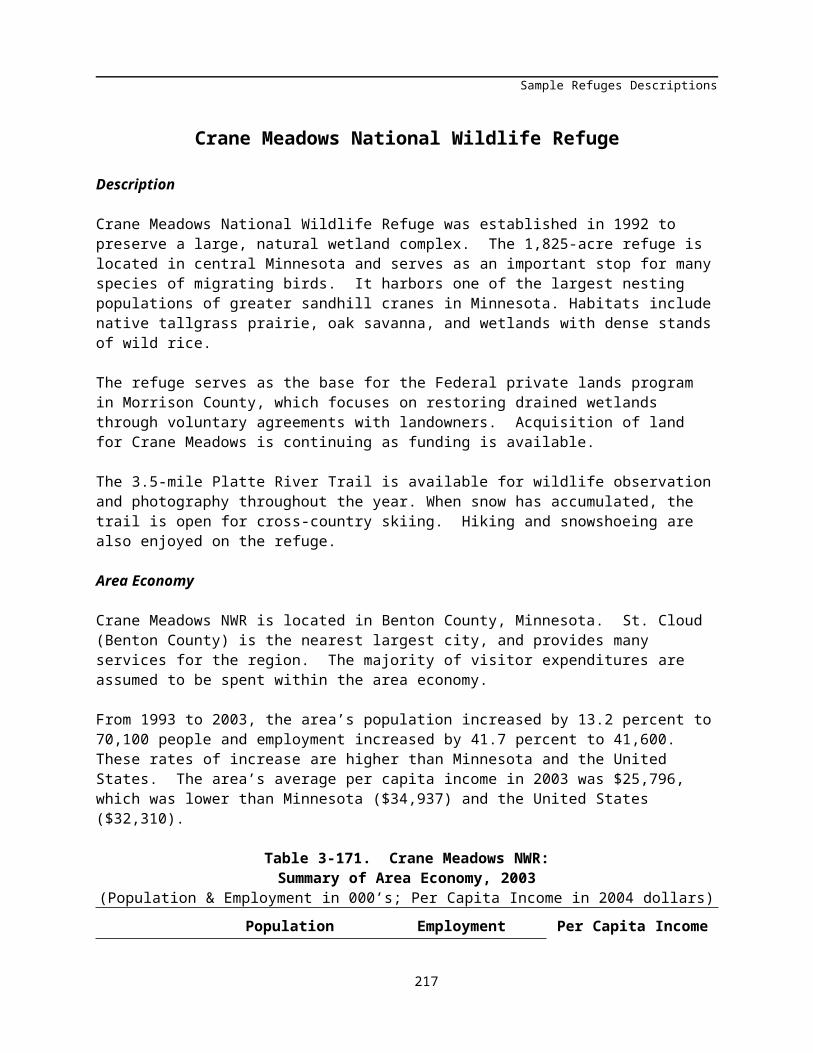
Banking on Nature: The Economic Benefits to Local Communities of National Wildlife Refuge Visitation
Chassahowitzka National Wildlife Refuge
Description
The Chassahowitzka National Wildlife Refuge, established in 1941, is comprised of over 31,000 acres of saltwater bays, estuaries and brackish marshes at the mouth of the Chassahowitzka River. The refuge, located approximately 65 miles north of St. Petersburg, FL, was established primarily to protect waterfowl habitat and is home to over 250 species of birds, over 50 species of retiles and amphibians, and at least 25 different species of mammals, including the endangered West Indian Manatee.
The refuge consists of coastal saltmarsh, shallow bays, tidal streams, and rivers, mangrove islands, and coastal maritime hammock.
The Chassahowitzka NWR is located approximately 65 miles north of St. Petersburg, FL
Area Economy
The Chassahowitzka NWR is located in Hernando and Citrus counties in western Florida on the Gulf coast. The area had a population of 270,200 in 2003, an increase of 25.4 percent from 1993 compared with a 22.1 percent for the state of Florida and a 12 percent increase for the U.S. Total area employment increased by 47.8 percent from 1993 to 2003 compared with a 32.4 percent increase in Florida and a 18 percent increase in the U.S.
Per capita personal income increased in the area by 15.6 percent from 1993 to 2003. This compares with a 12.1 percent increase in Florida and a 15.6 percent increase in the U.S.
Table 4-246. Chassahowitzka NWR:Summary of Area Economy, 2003
(Population & Employment in 000’s; Per Capita Income in 2004 dollars)
Population Employment Per Capita Income
County 2003
Percent change
1993-2003 2003
Percent change
1993-2003 2003
Percent change
1993-2003
Hernando, FL 143.5 26.4% 49.1 56.1% $25,218 17.4%
Citrus, FL 126.7 24.2% 44.7 39.7% $24,148 13.5%
Area Total 270.2 25.4% 93.8 47.8% $24,716 15.6%
Florida 16,999.2 22.1% 9,346.8 32.4% $30,911 12.1%
United States 290,789.0 11.9% 167,174.4 17.9% $32,322 15.6%
Source: U.S. Department of Commerce 2003.
220

Sample Refuges Descriptions
Activity Levels
Chassahowitzka NWR had 23,880 visitors in 2004. The majority of recreation visits, over 94,000 (82 percent), were for non-consumptive activities. Fishing accounted for 18 percent of total refuge recreation visits. About 61 percent of recreation visits were undertaken by non-residents.
Table 4-247. Chassahowitzka NWR: 2004 Recreation Visits
Activity Residents Non-Residents Total
Non-Consumptive:
Nature Trails 6,236 9,354 15,590
Observation Platforms 191 764 955
Other Wildlife Observation 9,552 14,328 23,880
Beach /Water Use 190 286 476
Other Recreation 10,666 42,662 53,328
Hunting:
Big Game 9 1 10
Small Game 0 0 0
Migratory Birds 5 5 10
Fishing:
Freshwater 3,953 439 4,392
Saltwater 13,835 1,537 15,372
Total Visitation 44,637 69,376 114,013
Total Visitors 23,880
Regional Economic Analysis
The economic area for the Refuge is defined as Citrus and Hernado counties in Florida. It is assumed that Refuge visitor expenditures occur primarily within this 2-county area.
Table 4-23 shows visitor recreation expenditures for the Refuge in 2004. Total expenditures were $3,509,500 with non-residents accounting for $2,994,700 (85 percent of total expenditures). Expenditures on non-consumptive activities accounted for 54 percent of the total, hunting less than 1 percent, and fishing about 46 percent.
221

Banking on Nature: The Economic Benefits to Local Communities of National Wildlife Refuge Visitation
Table 4-248. Chassahowitzka NWR: Visitor Recreation Expenditures (2004 $,000)
Activity Residents Non-Residents Total
Non-Consumptive: $113.9 $1,767.5 $1,881.4
Hunting:
Big Game ─ ─ ─
Small Game ─ ─ ─
Migratory Birds $0.1 $0.3 $0.4
Total Hunting $0.1 $0.3 $0.4
Fishing:
Freshwater $26.5 $72.0 $98.5
Saltwater $374.3 $1,154.9 $1,529.2
Total Fishing $400.8 $1,226.9 $1,627.7
Total Expenditures $514.8 $2,994.7 $3,509.5
Table 4-249 summarizes the total economic impacts associated with refuge visitor spending. Total final demand was $4,710,100. This is the total monetary value of economic activity generated in the 2-county area by refuge visitor spending. In turn, this final demand generated 66 jobs (both full-time and part-time) with total job income of $1,525,000. Total tax revenue generated (county, state and Federal) amounted to $502,000.
Table 4-249. Chassahowitzka NWR: Local Economic Effects Associated with Recreation Visits (2004 $,000)
Residents Non-Residents Total
Final Demand $695.7 $4,014.4 $4,710.1
Jobs 9.7 56.1 65.8
Job Income $222.0 $1,303.0 $1,525.0
Total Tax Revenue $74.4 $427.6 $502.0
222

Sample Refuges Descriptions
Table 4-250 shows total economic effects (total recreation expenditures plus net economic value) compared with the refuge budget for 2004. For an individual, net economic value is that person's total willingness to pay for a particular recreation activity minus his or her actual expenditures for that activity. The figure for economic value is derived by multiplying net economic values for hunting, fishing, and non-consumptive recreation use (on a per-day basis) by estimated refuge visitor days for that activity. This figure is combined with the estimate of total expenditures and divided by the refuge budget for 2004. The $7.48 means that for every $1 of budget expenditures, $7.48 of total economic effects are associated with these budget expenditures. This ratio is provided only for the purpose of broadly comparing the magnitude of economic effects resulting from refuge visitation to budget expenditures and should not be interpreted as a benefit-cost ratio.
Table 4-250. Chassahowitzka NWR: Summary of Local Economic Effects of Recreation Visits (2004 $,000)
FY 2004 Budget
RecreationExpenditures
Net Economic Value
Total economic effects per $1 budget expenditure
Chassahowitzka NWR
$676.1 $3,509.5 $1,546.0 $7.48
223

Banking on Nature: The Economic Benefits to Local Communities of National Wildlife Refuge Visitation
Clarks River National Wildlife Refuge
Description
Clarks River National Wildlife Refuge is a bottomland hardwood forest located in western Kentucky near Benton. The refuge lies along the East Fork of the Clarks River and is seasonal home to over 250 different species of migratory birds. The bottom lands are dominated with overcup oaks, bald cypress, and tupelo gum, and the slightly higher, better drained areas, are covered with willow oak, swamp chestnut oak, red oak, sweet gum, sycamore, ash and elm.
The Clarks River National Wildlife Refuge was first identified as a high priority site for protection in 1978 by the Service's Bottomland Hardwood Preservation Program. In 1991, the Kentucky Department of Fish and Wildlife Resources asked the service to consider the site for protection as a unit of the National Wildlife Refuge System. Clarks River is the only National Wildlife Refuge located solely within the bounds of the State of Kentucky. The refuge was established in July of 1997, with a proposed acquisition boundary of 18,000 acres. The first tract of land was purchased in August of 1998, and the refuge currently consists of over 7,000 acres.
The purpose of the refuge is to protect, enhance, and manage a valuable bottomland wetland ecosystem, along the East Fork of the Clarks River, for the benefit of waterfowl, neotropical migratory songbirds, forest wildlife, riverine species, and a wide array of other diverse species associated with bottomland hardwood communities.
Area Economy
The Clarks River NWR is located in McCracken, Graves and Marshall counties in southwestern Kentucky near the Illinois border. The area had a population of 132,800 in 2003, an increase of 4.1 percent from 1993 compared with an 8 percent for the state of Kentucky and a 12 percent increase for the United States (Table 4-251). Total area employment increased by 11.3 percent from 1993 to 2003 compared with a 15 percent increase in Kentucky and an 18 percent increase in the United States.
Per capita personal income increased in the area by 12.6 percent from 1993 to 2003. This compares with an 18.9 percent increase in Kentucky and a 15.6 percent increase in the United States.
Activity Levels
Clarks River NWR had 30,000 visitors in 2004 (Table 4-252). The majority of recreation visits, 11,725, were for hunting. About 55 percent of recreation visits were undertaken by area residents.
224

Sample Refuges Descriptions
Table 4-251. Clarks River NWR:Summary of Area Economy, 2003
(Population & Employment in 000’s; Per Capita Income in 2004 dollars)
Population Employment Per Capita Income
County 2003
Percent change
1993-2003 2003
Percent change
1993-2003 2003
Percent change
1993-2003McCracken, KY 64.7 0.3% 46.1 10.2% $31,135 18.4%
Graves, KY 37.4 8.2% 17.8 8.8% $22,536 4.7%
Marshall, KY 30.6 8.0% 15.4 17.7% $25,645 9.6%
Area Total 132.8 4.1% 79.2 11.3% $27,446 12.6%
Kentucky 4,118.2 8.0% 2,306.0 15.0% $27,293 18.9%
United States 290,789.0 11.9% 167,174.4 17.9% $32,322 15.6%
Source: U.S. Department of Commerce 2003.
Table 4-252. Clarks River NWR: 2004 Recreation Visits
Activity Residents Non-Residents Total
Non-Consumptive:
Nature Trails 0 4 4
Observation Platforms 0 0 0
Other Wildlife Observation 2,500 2,500 5,000
Beach /Water Use 0 0 0
Other Recreation 120 120 240
Hunting:
Big Game 3,600 2,400 6,000
Small Game 2,000 2,000 4,000
Migratory Birds 949 776 1,725
Fishing:
Freshwater 715 385 1,100
Saltwater 0 0 0
Total Visitation 9,884 8,185 18,069
Total Visitors 30,000
225
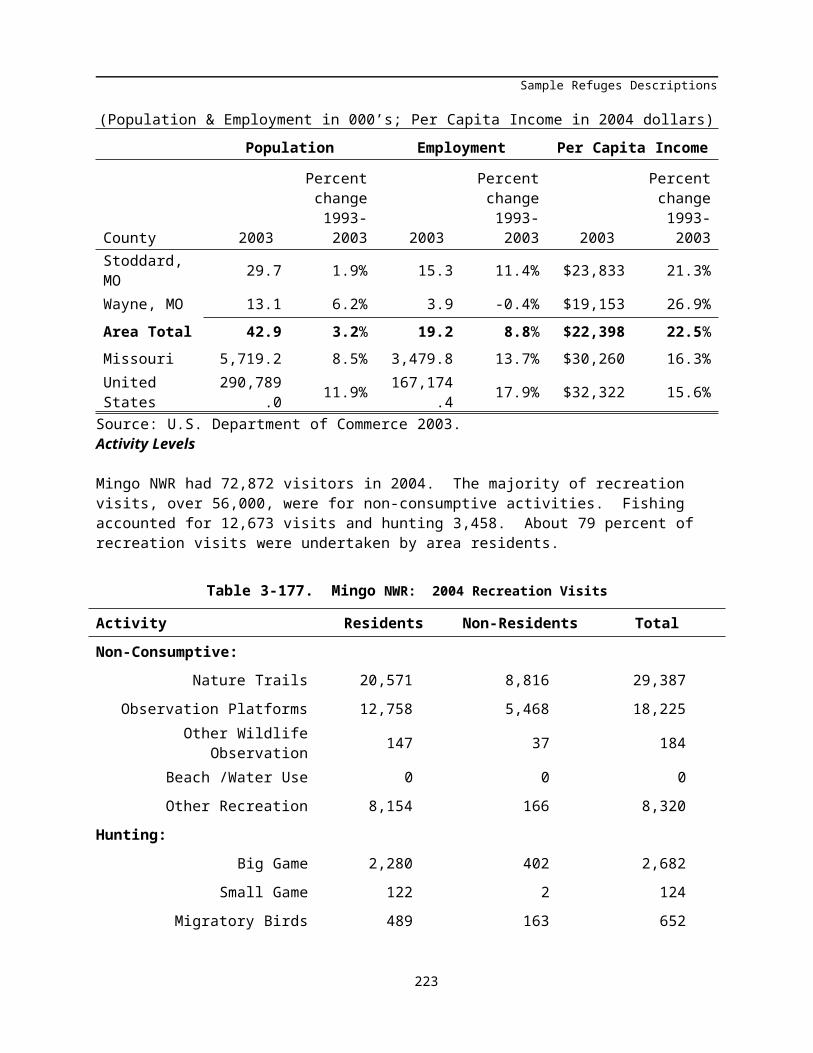
Banking on Nature: The Economic Benefits to Local Communities of National Wildlife Refuge Visitation
Regional Economic Analysis
The economic area for the Refuge is defined as Marshall, McCracken and Graves counties in Kentucky. It is assumed that Refuge visitor expenditures occur primarily within this 3-county area.
Table 4-253 shows visitor recreation expenditures for the Refuge in 2004. Total expenditures were $428,300 with non-residents accounting for $323,300 (75 percent of total expenditures). Expenditures on non-consumptive activities accounted for 29 percent of the total, hunting 62 percent and fishing 9 percent.
Table 4-253. Clarks River NWR: Visitor Recreation Expenditures (2004 $,000)
Activity Residents Non-Residents Total
Non-Consumptive: $19.0 $107.2 $126.2
Hunting:
Big Game $47.0 $76.9 $123.9
Small Game $16.9 $63.3 $80.2
Migratory Birds $12.6 $49.8 $62.3
Total Hunting $76.4 $190.0 $266.4
Fishing:
Freshwater $9.6 $26.1 $35.6
Saltwater ─ ─ ─
Total Fishing $9.6 $26.1 $35.6
Total Expenditures $105.0 $323.3 $428.3
Table 4-254 summarizes the total economic impacts associated with refuge visitor spending. Total final demand was $585,400. This is the total monetary value of economic activity generated in the 3-county area by refuge visitor spending. In turn, this final demand generated 7 jobs (both full-time and part-time) with total job income of $173,400. Total tax revenue generated (county, state and Federal) amounted to $72,400.
Table 4-254. Clarks River NWR: Local Economic Effects Associated with Recreation Visits (2004 $,000)
Residents Non-Residents Total
Final Demand $143.5 $441.9 $585.4
Jobs 1.8 5.5 7.4
Job Income $41.8 $131.5 $173.4
Total Tax Revenue $17.5 $54.9 $72.4
226

Sample Refuges Descriptions
Table 4-255 shows total economic effects (total recreation expenditures plus net economic value) compared with the refuge budget for 2004. For an individual, net economic value is that person's total willingness to pay for a particular recreation activity minus his or her actual expenditures for that activity. The figure for economic value is derived by multiplying net economic values for hunting, fishing, and non-consumptive recreation use (on a per-day basis) by estimated refuge visitor days for that activity. This figure is combined with the estimate of total expenditures and divided by the refuge budget for 2004. The $2.05 means that for every $1 of budget expenditures, $2.05 of total economic effects are associated with these budget expenditures. This ratio is provided only for the purpose of broadly comparing the magnitude of economic effects resulting from refuge visitation to budget expenditures and should not be interpreted as a benefit-cost ratio.
Table 4-255. Clarks River NWR: Summary of Local Economic Effects of Recreation Visits (2004 $,000)
FY 2004 Budget
RecreationExpenditures
Net Economic Value
Total economic effects per $1 budget expenditure
Clarks River NWR
$508.9 $428.3 $617.1 $2.05
227

Banking on Nature: The Economic Benefits to Local Communities of National Wildlife Refuge Visitation
Felsenthal National Wildlife Refuge
Description
Established in 1975, Felsenthal National Wildlife Refuge is located in southeast Arkansas, approximately eight miles west of the town of Crossett. Named for a small community located at its southwest corner, this 65,000 acre refuge contains an abundance of water resources dominated by the Ouachita and Saline Rivers and the Felsenthal Pool.
This low lying area is dissected by an intricate system of rivers, creeks, sloughs, buttonbush swamps and lakes throughout a vast bottomland hardwood forest that gradually rises to an upland forest community. Historically, periodic flooding of the "bottoms" during winter and spring provided excellent wintering waterfowl habitat. These wetlands, in combination with the pine and upland hardwood forest on the higher ridges, support a wide diversity of native plants and animals.
Area Economy
The Felsenthal NWR is located in Union, Ashley and Bradley counties in southeastern Arkansas. A significant number of refuge visitors come from Drew County Arkansas. The area had a population of 200,700 in 2003, an increase of 36.1 percent from 1993 compared with an 11.1 percent for the state of Arkansas and a 12 percent increase for the U.S. Total area employment increased by 27.6 percent from 1993 to 2003 compared with a 14.8 percent increase in Arkansas and a 18 percent increase in the U.S.
Per capita personal income increased in the area by 16 percent from 1993 to 2003. This compares with a 15 percent increase in Arkansas and a 15.6 percent increase in the U.S.
Table 4-256. Felsenthal NWR:Summary of Area Economy, 2003
(Population & Employment in 000’s; Per Capita Income in 2004 dollars)
Population Employment Per Capita Income
County 2003
Percent change
1993-2003 2003
Percent change
1993-2003 2003
Percent change
1993-2003
Union, AR 146.0 57.1% 62.7 42.5% $27,501 15.0%
Ashley, AR 23.7 -3.7% 11.6 -4.6% $23,502 12.2%
Drew, AR 18.6 4.5% 9.4 7.6% $22,324 16.1%
Bradley, AR 12.4 2.7% 5.9 10.5% $21,057 3.8%
Area Total 200.7 36.1% 89.5 27.6% $26,150 16.0%
Arkansas 2,727.8 11.1% 1,502.1 14.8% $25,042 15.0%
United States 290,789.0 11.9% 167,174.4 17.9% $32,322 15.6%
Source: U.S. Department of Commerce 2003.
228

Sample Refuges Descriptions
Activity Levels
Felsenthal NWR had 382,459 visitors in 2004. The vast majority of recreation visits, over 188,000, were for freshwater fishing . About 63 percent of recreation visits were undertaken by area residents.
Table 4-257. Felsenthal NWR: 2004 Recreation Visits
Activity Residents Non-Residents Total
Non-Consumptive:
Nature Trails 2,029 676 2,705Observation Platforms 0 0 0
Other Wildlife Observation 0 0 0
Beach /Water Use 0 0 0
Other Recreation 25,473 8,491 33,964
Hunting:
Big Game 4,815 19,260 24,075
Small Game 8,572 12,858 21,430
Migratory Birds 41,170 27,446 68,616
Fishing:
Freshwater 131,629 56,413 188,042
Saltwater 0 0 0
Total Visitation 213,688 125,144 338,832
Total Visitors 382,459
Regional Economic Analysis
The economic area for the Refuge is defined as Ashley, Bradley, Drew and Union counties in Arkansas. It is assumed that Refuge visitor expenditures occur primarily within this 4-county area.
Table 4-33 shows visitor recreation expenditures for the Refuge in 2004. Total expenditures were $9,761,800 with non-residents accounting for $7,335,100 (75 percent of total expenditures). Expenditures on non-consumptive activities accounted for 3 percent of the total, hunting 30 percent and fishing 67 percent.
229

Banking on Nature: The Economic Benefits to Local Communities of National Wildlife Refuge Visitation
Table 4-258. Felsenthal NWR: Visitor Recreation Expenditures (2004 $,000)
Activity Residents Non-Residents Total
Non-Consumptive: $97.4 $183.1 $280.5
Hunting:
Big Game $62.8 $617.4 $680.3
Small Game $48.2 $271.4 $319.6
Migratory Birds $454.1 $1,466.5 $1,920.5
Total Hunting $565.1 $2,355.3 $2,920.4
Fishing:
Freshwater $1,764.2 $4,796.7 $6,560.9
Saltwater ─ ─ ─
Total Fishing $1,764.2 $4,796.7 $6,560.9
Total Expenditures $2,426.7 $7,335.1 $9,761.8
Table 4-259 summarizes the total economic impacts associated with refuge visitor spending. Total final demand was $13,010,700. This is the total monetary value of economic activity generated in the 4-county area by refuge visitor spending. In turn, this final demand generated 145 jobs (both full-time and part-time) with total job income of $3,357,100. Total tax revenue generated (county, state and Federal) amounted to $1,783,800.
Table 4-259. Felsenthal NWR: Local Economic Effects Associated with Recreation Visits (2004 $,000)
Residents Non-Residents Total
Final Demand $3,227.7 $9,783.0 $13,010.7
Jobs 36.7 108.7 145.4
Job Income $838.0 $2,519.1 $3,357.1
Total Tax Revenue $438.7 $1,345.1 $1,783.8
Table 4-260 shows total economic effects (total recreation expenditures plus net economic value) compared with the refuge budget for 2004. For an individual, net economic value is that person's total willingness to pay for a particular recreation activity minus his or her actual expenditures for that activity. The figure for economic value is derived by multiplying net economic values for hunting, fishing, and non-consumptive recreation use (on a per-day basis) by estimated refuge visitor days for that activity. This figure is combined with the estimate of total expenditures and divided by the refuge budget for 2004. The $23.37 means that for every $1 of budget expenditures, $23.37 of total economic effects are associated with these budget expenditures. This ratio is provided only for the purpose of broadly
230
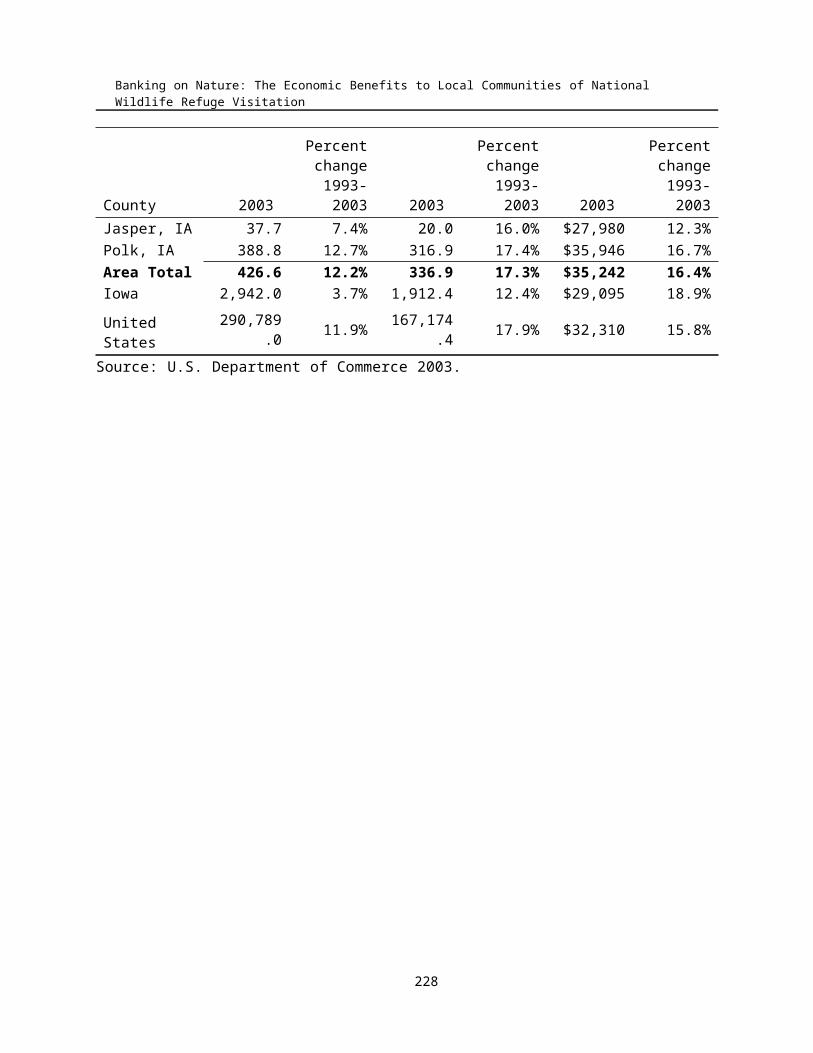
Sample Refuges Descriptions
comparing the magnitude of economic effects resulting from refuge visitation to budget expenditures and should not be interpreted as a benefit-cost ratio.
Table 4-260. Felsenthal NWR: Summary of Local Economic Effects of Recreation Visits (2004 $,000)
FY 2004 Budget
RecreationExpenditures
Net Economic Value
Total economic effects per $1 budget expenditure
Felsenthal NWR
$878.0 $9,761.8 $10,754.6 $23.37
231

Banking on Nature: The Economic Benefits to Local Communities of National Wildlife Refuge Visitation
J. N. Ding Darling National Wildlife Refuge
Description
The J.N. "Ding" Darling National Wildlife Refuge is located on the subtropical barrier island of Sanibel in the Gulf of Mexico. The refuge is part of the largest undeveloped mangrove ecosystem in the United States. It is world famous for its spectacular wading bird populations.
The refuge includes over 6,300 acres of habitat, with 2,825 acres designated as Wilderness, and 950 acres of submerged habitat in the Tarpon Bay Recreation Area. The refuge informs and educates over 800,000 visitors annually in its 12,000 square foot Environmental Education Center and four-mile long Wildlife Drive. The refuge is home to 238 bird species, 51 species of reptiles and amphibians, and 32 species of mammals native to southwest Florida.
The refuge consists of the following habitat types: estuarine habitat consisting of open water, seagrass beds, mud flats and mangrove islands; and interior freshwater habitats consisting of open water ponds, cordgrass marshes, and West Indian hardwood hammocks. Two brackish water impoundments totaling 850 acres managed for wading birds, fisheries and estuarine health.
Several federally threatened and endangered species benefit from the habitats described, including the eastern indigo snake, American alligator, American crocodile, bald eagle, wood stork, peregrine falcon, West Indian manatee and Atlantic loggerhead turtle. Some interesting state listed species of concern to the refuge are gopher tortoise, snowy plover, and the Sanibel rice rat.
The refuge is located approximately 15 miles southwest of Fort Myers on Sanibel Island.
Area Economy
The J.N. Ding Darling NWR is located in Lee County on Sanibel Island on the Gulf coast of Florida. Collier County contributes a significant number of refuge visitors. The area had a population of 778,600 in 2003, an increase of 41.5 percent from 1993 compared with a 22 percent increase for the state of Florida and a 12 percent increase for the U.S. Total area employment increased by 53.2 percent from 1993 to 2003 compared with a 32.4 percent increase in Florida and a 18 percent increase in the U.S.
Per capita personal income increased in the area by 13.7 percent from 1993 to 2003. This compares with a 12.1 percent increase in Florida and a 15.6 percent increase in the U.S.
Activity Levels
J.N. Ding Darling NWR had 723,365 visitors in 2004. Non-consumptive activities accounted for 94 percent of total refuge recreation visits. About 61 percent of recreation visits were undertaken by area residents. About 74 percent of recreation visits are by non-residents.
232

Sample Refuges Descriptions
Table 4-261. J.N. Ding Darling NWR:Summary of Area Economy, 2003
(Population & Employment in 000’s; Per Capita Income in 2004 dollars)
Population Employment Per Capita Income
County 2003
Percent change
1993-2003 2003
Percent change
1993-2003 2003
Percent change
1993-2003
Lee, FL 492.5 33.5% 254.5 48.3% $32,337 16.8%
Collier,FL 286.1 57.8% 164.9 61.4% $42,634 6.4%
Area Total 778.6 41.5% 419.4 53.2% $36,121 13.7%
Florida 16,999.2 22.1% 9,346.8 32.4% $30,911 12.1%
United States 290,789.0 11.9% 167,174.4 17.9% $32,322 15.6%
Source: U.S. Department of Commerce 2003.
Table 4-262. J.N. Ding Darling NWR: 2004 Recreation Visits
Activity Residents Non-Residents Total
Non-Consumptive:
Nature Trails 130,794 523,174 653,968
Observation Platforms 24,352 137,995 162,347
Other Wildlife Observation 49,397 279,350 328,647
Beach /Water Use 1,538 13,839 15,377
Other Recreation 140,441 140,441 280,882
Hunting:
Big Game 0 0 0
Small Game 0 0 0
Migratory Birds 0 0 0
Fishing:
Freshwater 210 52 262
Saltwater 44,837 44,837 89,674
Total Visitation 391,468 1,139,689 1,531,156
Total Visitors 723,365
233

Banking on Nature: The Economic Benefits to Local Communities of National Wildlife Refuge Visitation
Regional Economic Analysis
The economic area for the Refuge is defined as Lee and Collier counties in Florida. It is assumed that Refuge visitor expenditures occur primarily within this 2-county area.
Table 4-263 shows visitor recreation expenditures for the Refuge in 2004. Total expenditures were $31,759,400 with non-residents accounting for $29,266,300 (92 percent of total expenditures). Expenditures on non-consumptive activities accounted for 91 percent of the total, and fishing 9 percent.
Table 4-263. J.N. Ding Darling NWR: Visitor Recreation Expenditures (2004 $,000)
Activity Residents Non-Residents Total
Non-Consumptive: $1,664.3 $27,118.1 $28,782.4
Hunting:
Big Game ─ ─ ─
Small Game ─ ─ ─
Migratory Birds ─ ─ ─
Total Hunting ─ ─ ─
Fishing:
Freshwater $0.9 $2.5 $3.5
Saltwater $727.9 $2,245.7 $2,973.5
Total Fishing $728.8 $2,248.2 $2,977.0
Total Expenditures $2,393.1 $29,366.3 $31,759.4
Table 4-264 summarizes the total economic impacts associated with refuge visitor spending. Total final demand was $47,254,400. This is the total monetary value of economic activity generated in the 3-county area by refuge visitor spending. In turn, this final demand generated 490 jobs (both full-time and part-time) with total job income of $13,933,100. Total tax revenue generated (county, state and Federal) amounted to $5,141,000.
Table 4-264. J.N. Ding Darling NWR: Local Economic Effects Associated with Recreation Visits (2004 $,000)
Residents Non-Residents Total
Final Demand $3,567.5 $43,686.9 $47,254.4
Jobs 37.3 452.5 489.9
Job Income $1,055.0 $12,878.0 $13,933.1
Total Tax Revenue $391.1 $4,749.9 $5,141.0
234

Sample Refuges Descriptions
Table 4-265 shows total economic effects (total recreation expenditures plus net economic value) compared with the refuge budget for 2004. For an individual, net economic value is that person's total willingness to pay for a particular recreation activity minus his or her actual expenditures for that activity. The figure for economic value is derived by multiplying net economic values for hunting, fishing, and non-consumptive recreation use (on a per-day basis) by estimated refuge visitor days for that activity. This figure is combined with the estimate of total expenditures and divided by the refuge budget for 2004. The $29.93 means that for every $1 of budget expenditures, $29.93 of total economic effects are associated with these budget expenditures. This ratio is provided only for the purpose of broadly comparing the magnitude of economic effects resulting from refuge visitation to budget expenditures and should not be interpreted as a benefit-cost ratio.
Table 4-265. J.N. Ding Darling NWR: Summary of Local Economic Effects of Recreation Visits (2004 $,000)
FY 2004 Budget
RecreationExpenditures
Net Economic Value
Total economic effects per $1 budget expenditure
J.N. Ding Darling NWR
$1,633.5 $31,759.4 $17,138.1 $29.93
235
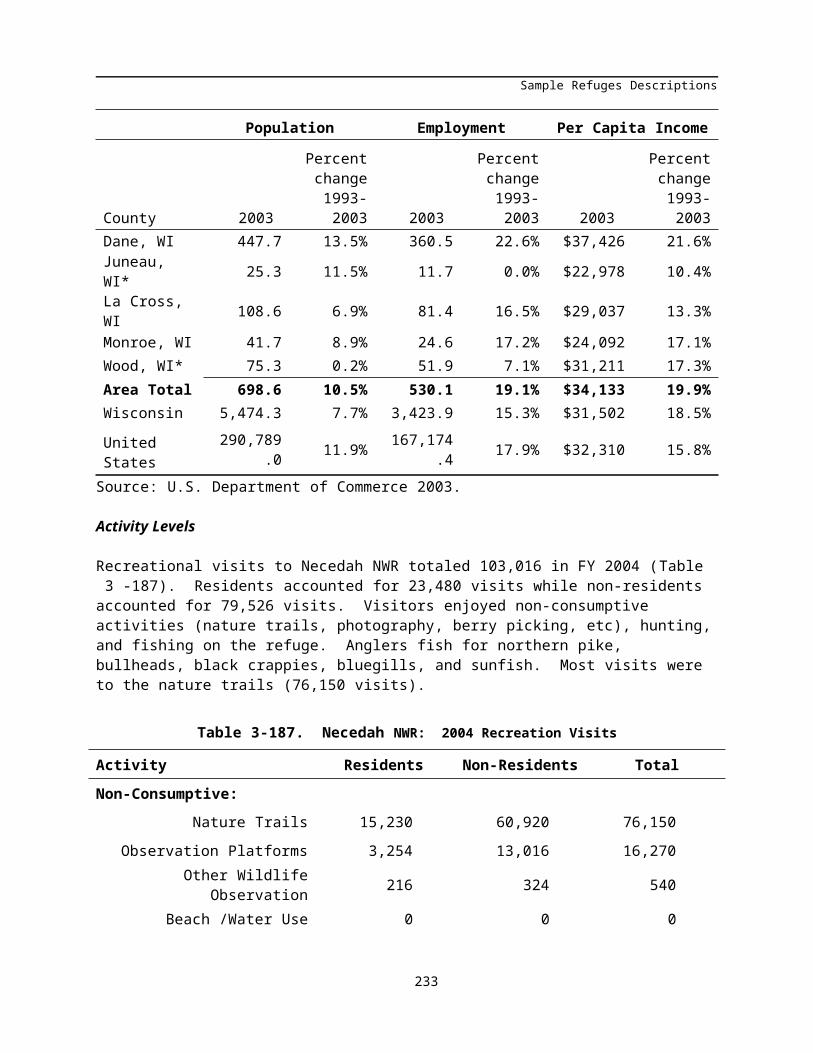
Banking on Nature: The Economic Benefits to Local Communities of National Wildlife Refuge Visitation
Lower Suwannee National Wildlife Refuge
Description
Lower Suwannee National Wildlife Refuge, established in 1979, is located along the southern edge of the Big Bend region of Florida's west coast, approximately 50 miles southwest of Gainsville. This 54,000 acre refuge is one of the largest undeveloped river delta - estuarine systems in the United States and was established to protect natural ecosystems of the Suwannee River's lower reaches and coastal marsh, as it empties into the Gulf of Mexico.
This diverse mixture of uplands, freshwater, saltwater and their associated wetlands, creates a great variety of wildlife habitat and scenic vistas. Osprey and bald eagle nest in early spring, while graceful swallow-tailed kites arrive in March for breeding and remain through July. In March and April migrating shorebirds cover the oysterbars; thousands of knots, dowitchers, oystercatchers, sandpipers, turnstones, and plovers fatten up for their northward trip to their breeding grounds.
Wading birds are most abundant during the summer and they can be found feeding in the freshwater and salt marshes. White ibis, great, snowy, and cattle egrets along with great blue, little blue, green, and tricolored herons are among the birds that roost and nest on nearby Cedar Keys refuge. Rare Limpkins and endangered wood storks are occasionally seen prowling the water's edge during the warm months. Alert boaters may see endangered Gulf Sturgeon jumping in the river. These prehistoric fish migrate from the Gulf of Mexico to the Suwannee River in the spring for spawning and remain there all summer.
Manatees leave Crystal River springs, their winter haven, when the gulf waters warm and utilize the Suwannee River and its estuary from March through November. Seaturtles, mostly green, loggerhead and Ridley's utilize the rich Suwannee sound during the summer months but generally go unnoticed.
Area Economy
The Lower Suwannee NWR is located in Levy and Dixie counties in northwestern Florida on the Gulf of Mexico. Alachua County contributes a significant number of refuge visitors. The area had a population of 272,000 in 2003, an increase of 14.5 percent from 1993 compared with a 22.1 percent for the state of Florida and a 12 percent increase for the United States (Table 4-266). Total area employment increased by 26.4 percent from 1993 to 2003 compared with a 32.4 percent increase in Florida and a 18 percent increase in the United States.
Per capita personal income increased in the area by 11.6 percent from 1993 to 2003. This compares with a 12.1 percent increase in Florida and a 15.6 percent increase in the United States. Activity Levels
Lower Suwannee NWR had 104,000 visitors in 2004 (Table 4-267). The majority of recreation visits, 91,034, were for non-consumptive activities. Fishing accounted for 79,800 visits and hunting 4,745. About 53 percent of recreation visits were undertaken by non-residents.
236

Sample Refuges Descriptions
Table 4-266. Lower Suwannee NWR:Summary of Area Economy, 2003
(Population & Employment in 000’s; Per Capita Income in 2004 dollars)
Population Employment Per Capita Income
County 2003
Percent change
1993-2003 2003
Percent change
1993-2003 2003
Percent change
1993-2003
Alachua, FL 221.7 12.4% 151.7 25.8% $26,744 12.8%
Levy, FL 36.4 27.4% 12.7 39.5% $19,663 6.2%
Dixie, FL 14.0 20.0% 4.1 14.5% $16,677 11.6%
Area Total 272.0 14.5% 168.5 26.4% $25,281 11.6%
Florida 16,999.2 22.1% 9,346.8 32.4% $30,911 12.1%
United States 290,789.0 11.9% 167,174.4 17.9% $32,322 15.6%
Source: U.S. Department of Commerce 2003.
Table 4-267. Lower Suwannee NWR: 2004 Recreation Visits
Activity Residents Non-Residents Total
Non-Consumptive:
Nature Trails 9,676 22,576 32,252
Observation Platforms 327 763 1090
Other Wildlife Observation 25,065 25,065 50,130
Beach /Water Use 90 60 150
Other Recreation 5,188 2,224 7,412
Hunting:
Big Game 1,359 3,171 4,530
Small Game 151 65 215
Migratory Birds 0 0 0
Fishing:
Freshwater 7,100 7,100 14,200
Saltwater 32,800 32,800 65,600
Total Visitation 81,756 93,824 175,579
Total Visitors 104,000
237

Banking on Nature: The Economic Benefits to Local Communities of National Wildlife Refuge Visitation
Regional Economic Analysis
The economic area for the Refuge is defined as Dixie, Levy and Alachua counties in Florida. It is assumed that Refuge visitor expenditures occur primarily within this 3-county area.
Table 4-268 shows visitor recreation expenditures for the Refuge in 2004. Total expenditures were $7,751,000 with non-residents accounting for $6,013,300 (76 percent of total expenditures). Expenditures on non-consumptive activities accounted for 19 percent of the total, hunting 2 percent and fishing 79 percent.
Table 4-268. Lower Suwannee NWR: Visitor Recreation Expenditures (2004 $,000)
Activity Residents Non-Residents Total
Non-Consumptive: $214.0 $1,280.1 $1,494.0
Hunting:
Big Game $23.6 $135.5 $159.2
Small Game $0.8 $1.4 $2.2
Migratory Birds ─ ─ ─
Total Hunting $24.5 $136.9 $161.4
Fishing:
Freshwater $79.3 $215.6 $294.9
Saltwater $1,419.9 $4,380.7 $5,800.7
Total Fishing $1,499.2 $4,596.4 $6,095.6
Total Expenditures $1,737.7 $6,013.3 $7,751.0
Table 4-269 summarizes the total economic impacts associated with refuge visitor spending. Total final demand was $11,133,200. This is the total monetary value of economic activity generated in the 3-county area by refuge visitor spending. In turn, this final demand generated 139 jobs (both full-time and part-time) with total job income of $3,348,000. Total tax revenue generated (county, state and Federal) amounted to $1,206,600.
Table 4-269. Lower Suwannee NWR: Local Economic Effects Associated with Recreation Visits (2004 $,000)
Residents Non-Residents Total
Final Demand $2,450.5 $8,682.7 $11,133.2
Jobs 31.8 107.1 139.0
Job Income $761.4 $2,586.5 $3,348.0
Total Tax Revenue $253.8 $952.8 $1,206.6
238

Sample Refuges Descriptions
Table 4-270 shows total economic effects (total recreation expenditures plus net economic value) compared with the refuge budget for 2004. For an individual, net economic value is that person's total willingness to pay for a particular recreation activity minus his or her actual expenditures for that activity. The figure for economic value is derived by multiplying net economic values for hunting, fishing, and non-consumptive recreation use (on a per-day basis) by estimated refuge visitor days for that activity. This figure is combined with the estimate of total expenditures and divided by the refuge budget for 2004. The $19.31 means that for every $1 of budget expenditures, $19.31 of total economic effects are associated with these budget expenditures. This ratio is provided only for the purpose of broadly comparing the magnitude of economic effects resulting from refuge visitation to budget expenditures and should not be interpreted as a benefit-cost ratio.
Table 4-270. Lower Suwannee NWR: Summary of Local Economic Effects of Recreation Visits (2004 $,000)
FY 2004 Budget
RecreationExpenditures
Net Economic Value
Total economic effects per $1 budget expenditure
Lower Suwannee NWR
$646.5 $7,751.0 $4,734.8 $19.31
239

Banking on Nature: The Economic Benefits to Local Communities of National Wildlife Refuge Visitation
Okefenokee National Wildlife Refuge
Description
Okefenokee National Wildlife Refuge Okefenokee NWR, located about 11 miles southwest of Folkston, was established in 1937 to preserve the 438,000 acre Okefenokee Swamp. The refuge encompasses approximately 396,000 acres with 353,000 acres designated as a National Wilderness Area.
Swamp habitats include open wet "prairies," cypress forests, scrub-shrub vegetation, upland islands, and open lakes. Wildlife species include wading birds, ducks, alligators and other reptiles, a variety of amphibians, bobcats, raptors, white-tailed deer, black bears, and songbirds.
The swamp has a rich human history including Native American occupation, early settlers, a massive drainage attempt, and intensive timber harvesting. Glimpses of the past are visible at Chesser Island Homestead, Billy's Island, Floyd's Island, and Suwannee Canal.
The prosperity and survival of the swamp, and the species dependent on it, is directly tied with maintaining the integrity of complex ecological processes, including hydrology and fire.
The Okefenokee Swamp is one of the world's largest intact freshwater ecosystems. It has been designated a Wetland of International Importance by the United Nations under the Ramsar Convention of 1971. The swamp is compared through research to wetlands worldwide. It is world-renowned for its amphibian populations that are bio-indicators of global health. Water from the Suwannee River Sill area is used as a standard reference by scientists throughout the world.
Refuge staff manages 33,000 acres of uplands which are being restored to once-abundant longleaf pine and wiregrass habitat. Species of concern in this community include red-cockaded woodpeckers, gopher tortoises, and indigo snakes.
Area Economy
The Okefenokee NWR is located in Ware, Charlton and Clinch counties in Georgia and Baker County in Florida. The area had a population of 76, 800 in 2003, an increase of 7.5 percent from 1993 compared with a 24.3 percent for the state of Georgia, 22.1 percent for the state of Florida, and a 12 percent increase for the U.S. Total area employment increased by 13.2 percent from 1993 to 2003 compared with a 25.8 percent increase in Georgia, a 32.4 percent increase in Florida and a 18 percent increase in the U.S.
Per capita personal income increased in the area by 11.2 percent from 1993 to 2003. This compares with a 15.3 percent increase in Georgia, a 12.1 percent increase in Florida, and a 15.6 percent increase in the U.S.
240

Sample Refuges Descriptions
Table 4-271. Okefenokee NWR:Summary of Area Economy, 2003
(Population & Employment in 000’s; Per Capita Income in 2004 dollars)
Population Employment Per Capita Income
County 2003
Percent change
1993-2003 2003
Percent change
1993-2003 2003
Percent change
1993-2003
Ware, GA 35.7 -0.6% 20.5 10.9% $21,671 12.8%
Charlton, GA 10.8 15.8% 3.4 32.5% $16,543 7.4%
Clinch, GA 7.0 8.9% 3.1 -8.8% $18,252 -1.9%
Baker, FL 23.4 17.6% 7.8 23.4% $21,245 15.4%
Area Total 76.8 7.5% 34.8 13.2% $20,512 11.2%
Georgia 8,676.5 24.3% 4,896.3 25.8% $29,783 15.3%
Florida 16,999.2 22.1% 9,346.8 32.4% $30,911 12.1%
United States 290,789.0 11.9% 167,174.4 17.9% $32,322 15.6%
Source: U.S. Department of Commerce 2003.
241

Banking on Nature: The Economic Benefits to Local Communities of National Wildlife Refuge Visitation
Activity Levels
Okefenokee NWR had 362,176 visitors in 2004. The majority of recreation visits, 724,641, were for non-consumptive activities. About 65 percent of recreation visits were undertaken by non-residents.
Table 4-272. Okefenokee NWR: 2004 Recreation Visits
Activity Residents Non-Residents Total
Non-Consumptive:
Nature Trails 123,914 230,126 354,040
Observation Platforms 9,263 17,202 26,465
Other Wildlife Observation 4,317 8,017 12,334
Beach /Water Use 0 0 0
Other Recreation 116,131 215,671 331,802
Hunting:
Big Game 149 17 166
Small Game 0 0 0
Migratory Birds 0 0 0
Fishing:
Freshwater 4,564 1,521 6,085
Saltwater 0 0 0
Total Visitation 258,337 472,554 730,891
Total Visitors 362,176
Regional Economic Analysis
The economic area for the Refuge is defined as Ware, Charlton, and Clinch counties in Georgia and Baker County in Florida. It is assumed that Refuge visitor expenditures occur primarily within this 4-county area.
Table 4-48 shows visitor recreation expenditures for the Refuge in 2004. Total expenditures were $30,359,100 with non-residents accounting for $27,655,500 (91 percent of total expenditures). Freshwater fishing accounted for $303,300, hunting $3,300 and non-consumptive activities $30,052,500.
242

Sample Refuges Descriptions
Table 4-273. Okefenokee NWR: Visitor Recreation Expenditures (2004 $,000)
Activity Residents Non-Residents Total
Non-Consumptive: $2,619.4 $27,433.0 $30,052.5
Hunting:
Big Game $2.6 $0.7 $3.3
Small Game ─ ─ ─
Migratory Birds ─ ─ ─
Total Hunting $2.6 $0.7 $3.3
Fishing:
Freshwater $81.6 $221.7 $303.3
Saltwater ─ ─ ─
Total Fishing $81.6 $221.7 $303.3
Total Expenditures $2,703.6 $27,655.5 $30,359.1
Table 4-264 summarizes the total economic impacts associated with refuge visitor spending. Total final demand was $39,546,700. This is the total monetary value of economic activity generated in the 4-county area by refuge visitor spending. In turn, this final demand generated 529 jobs (both full-time and part-time) with total job income of $12,228,000. Total tax revenue generated (county, state and Federal) amounted to $4,961,100.
Table 4-274. Okefenokee NWR: Local Economic Effects Associated with Recreation Visits (2004 $,000)
Residents Non-Residents Total
Final Demand $3,506.3 $36,040.4 $39,546.7
Jobs 47.6 481.4 529.0
Job Income $1,080.1 $11,148.0 $12,228.0
Total Tax Revenue $442.3 $4,518.8 $4,961.1
Table 4-275 shows total economic effects (total recreation expenditures plus net economic value) compared with the refuge budget for 2004. For an individual, net economic value is that person's total willingness to pay for a particular recreation activity minus his or her actual expenditures for that activity. The figure for economic value is derived by multiplying net economic values for hunting, fishing, and non-consumptive recreation use (on a per-day basis) by estimated refuge visitor days for that activity. This figure is combined with the estimate of total expenditures and divided by the refuge budget for 2004. The $33.84 means that for every $1 of budget expenditures, $33.84 of total economic effects are associated with these budget expenditures. This ratio is provided only for the purpose of broadly
243

Banking on Nature: The Economic Benefits to Local Communities of National Wildlife Refuge Visitation
comparing the magnitude of economic effects resulting from refuge visitation to budget expenditures and should not be interpreted as a benefit-cost ratio.
Table 4-275. Okefenokee NWR: Summary of Local Economic Effects of Recreation Visits (2004 $,000)
FY 2004 Budget
RecreationExpenditures
Net Economic Value
Total economic effects per $1 budget expenditure
Okefenokee NWR
$1,438.2 $30,359.1 $18,316.4 $33.84
244

Sample Refuges Descriptions
Pea Island National Wildlife Refuge
Description
Pea Island National Wildlife Refuge was established in 1937 "as a refuge and breeding ground for migratory birds and other wildlife", including the greater snow goose and other migratory waterfowl. The Refuge lies on the north end of Hatteras Island, a coastal barrier island which is part of a chain of islands known as the Outer Banks. These islands are separated from the mainland by a series of marshes and shallow sounds up to 25 miles wide. Pea Island is a much-used feeding and resting area for many species of wintering waterfowl, migrating shorebirds, raptors, wading birds, and migrating songbirds. The 13 miles of ocean beach provide nesting habitat for loggerhead sea turtles, piping plover and several species of shorebirds. Peregrine falcons occur regularly during migration and bald eagles are occasionally seen.
The Refuge is comprised of ocean beach, dunes, upland, fresh and brackish water ponds, salt flats, and salt marsh. The official Refuge bird list (Birds of the Outer Banks) boasts nearly 400 species. Other wildlife species include: 25 species of mammals, 24 species of reptiles, and 5 species (low number due to salt environment) of amphibians. Ducks, geese, swans, wading birds, shore birds, raptors, migrating songbirds are seasonally abundant on refuge. The Refuge has approximately 1,000 acres of manageable waterfowl impoundments. Several shorebird nesting areas and wading bird rookeries are located on the Refuge. Endangered and threatened species include: peregrine falcons, American bald eagles, loggerhead sea turtles, and piping plovers.
Pea Island National Wildlife Refuge is located on the Outer Banks in Dare County, 14 miles south of Nags Head, NC.
Area Economy
The Pea Island NWR is located in Dare County on the Outer Banks in North Carolina. The area had a population of 33,100 in 2003, an increase of 36.6 percent from 1993 compared with a 19.6 percent increase for the state of North Carolina and a 12 percent increase for the U.S. Total area employment increased by 54.5 percent from 1993 to 2003 compared with a 18.7 percent increase in North Carolina and a 18 percent increase in the U.S.
Per capita personal income increased in the area by 27.6 percent from 1993 to 2003. This compares with a 12.4 percent increase in North Carolina and a 15.6 percent increase in the U.S.
Activity Levels
Pea Island NWR had 2,112,577 visitors in 2004. With the exception of 55,000 visits for saltwater fishing, all recreation visits were for non-consumptive activities. About 57 percent of recreation visits were undertaken by non-residents.
245

Banking on Nature: The Economic Benefits to Local Communities of National Wildlife Refuge Visitation
Table 4-276. Pea Island NWR:Summary of Area Economy, 2003
(Population & Employment in 000’s; Per Capita Income in 2004 dollars)
Population Employment Per Capita Income
County 2003
Percent change
1993-2003 2003
Percent change
1993-2003 2003
Percent change
1993-2003
Dare, NC 33.1 36.6% 27.8 54.5% $30,262 27.6%
North Carolina 8,421.2 19.6% 4,880.3 18.7% $28,829 12.4%
United States 290,789.0 11.9% 167,174.4 17.9% $32,322 15.6%
Source: U.S. Department of Commerce 2003.
Table 4-277. Pea Island NWR: 2004 Recreation Visits
Activity Residents Non-Residents Total
Non-Consumptive:
Nature Trails 801,710 534,474 1,336,184
Observation Platforms 130,618 195,926 326,544
Other Wildlife Observation 46,683 186,734 233,417
Beach /Water Use 196,349 294,373 490,622
Other Recreation 139,178 556,712 695,890
Hunting:
Big Game 0 0 0
Small Game 0 0 0
Migratory Birds 0 0 0
Fishing:
Freshwater 0 0 0
Saltwater 44,000 11,000 55,000
Total Visitation 1,358,438 1,779,219 3,137,657
Total Visitors 2,112,577
246

Sample Refuges Descriptions
Regional Economic Analysis
The economic area for the Refuge is defined as Dare County in North Carolina. It is assumed that Refuge visitor expenditures occur primarily within this county.
Table 4-278 shows visitor recreation expenditures for the Refuge in 2004. Total expenditures were $70,760,600 with non-residents accounting for $62,461,700 (88 percent of total expenditures). Expenditures on non-consumptive activities accounted for 95 percent of the total, and fishing 5 percent.
Table 4-278. Pea Island NWR: Visitor Recreation Expenditures (2004 $,000)
Activity Residents Non-Residents Total
Non-Consumptive: $7,346.5 $59,523.4 $66,869.9
Hunting:
Big Game ─ ─ ─
Small Game ─ ─ ─
Migratory Birds ─ ─ ─
Total Hunting ─ ─ ─
Fishing: ─ ─ ─
Freshwater ─ ─ ─
Saltwater $952.4 $2,938.3 $3,890.7
Total Fishing $952.4 $2,938.3 $3,890.7
Total Expenditures $8,298.9 $62,461.7 $70,760.6
Table 4-279 summarizes the total economic impacts associated with refuge visitor spending. Total final demand was $88,957,400. This is the total monetary value of economic activity generated in the county by refuge visitor spending. In turn, this final demand generated 1,238 jobs (both full-time and part-time) with total job income of $27,908,200. Total tax revenue generated (county, state and Federal) amounted to $13,666,000.
Table 4-279. Pea Island NWR: Local Economic Effects Associated with Recreation Visits (2004 $,000)
Residents Non-Residents Total
Final Demand $10,432.7 $78,524.7 $88,957.4
Jobs 145.8 1,091.7 1,237.5
Job Income $3,270.5 $24,637.7 $27,908.2
Total Tax Revenue $1,632.1 $12,033.9 $13,666.0
247

Banking on Nature: The Economic Benefits to Local Communities of National Wildlife Refuge Visitation
Table 4-280 shows total economic effects (total recreation expenditures plus net economic value) compared with the refuge budget for 2004. For an individual, net economic value is that person's total willingness to pay for a particular recreation activity minus his or her actual expenditures for that activity. The figure for economic value is derived by multiplying net economic values for hunting, fishing, and non-consumptive recreation use (on a per-day basis) by estimated refuge visitor days for that activity. This figure is combined with the estimate of total expenditures and divided by the refuge budget for 2004. The $412.83 means that for every $1 of budget expenditures, $412.83 of total economic effects are associated with these budget expenditures. This ratio is provided only for the purpose of broadly comparing the magnitude of economic effects resulting from refuge visitation to budget expenditures and should not be interpreted as a benefit-cost ratio.
Table 4-280. Pea Island NWR: Summary of Local Economic Effects of Recreation Visits (2004 $,000)
FY 2004 Budget
RecreationExpenditures
Net Economic Value
Total economic effects per $1 budget expenditure
Pea Island NWR $278.9 $70,760.6 $44,384.1 $412.83
248

Sample Refuges Descriptions
Pee Dee National Wildlife Refuge
Description
Situated along the Pee Dee River, Pee Dee NWR contains 8,443 acres in Anson and Richmond Counties, NC. The refuge was established to provide wintering habitat for migratory waterfowl.
Cooperative farming in field impoundments, water level management, and the bottomland hardwood forest along Brown Creek provide excellent habitat for waterfowl and other wildlife. Wintering waterfowl numbers fluctuate greatly, but can exceed 10,000 birds yearly. The refuge also supports a small population of wintering Southern James Bay Canada geese. Pee Dee Refuge is located a few hundred yards from the once famous "Lockhart Gaddy Wild Goose Refuge". In the 1950's, Gaddy's pond wintered more than 10,000 Canada geese a year. Pee Dee National Wildlife Refuge was established in October 1963 to provide additional habitat for these geese and other waterfowl. Local numbers of wintering migratory geese have dwindled in recent years, but the refuge remains an important wintering area for the remaining geese and thousands of ducks.
But Pee Dee has more than just waterfowl. The refuge also supports an abundance of nesting neotropical migratory birds, bobwhite quail, wild turkey, and white-tailed deer. The diversity of habitat and management provides for more than 168 bird species, 49 reptiles and amphibians, 28 mammals, and 20 fish species. Refuge lands include the following habitat types: bottomland hardwood forest (3,000 acres), upland pine forest (1,500 acres), mixed pine/hardwood forest (2,000 acres), crop lands (1,000 acres), old fields, native warm season grass fields, and openings (1,000 acres).
Area Economy
The Pee Dee NWR is located in Anson and Stanly counties in southern North Carolina (Table 4-281). Richmond and Union counties contribute a significant number of refuge visitors. The area had a population of 276,700 in 2003, an increase of 27.8 percent from 1993 compared with a 19.6 percent increase for the state of North Carolina and a 12 percent increase for the U.S. Total area employment increased by 15.2 percent from 1993 to 2003 compared with an 18.7 percent increase in North Carolina and a 18 percent increase in the U.S.
Per capita personal income increased in the area by 13.7 percent from 1993 to 2003. This compares with a 12.4 percent increase in North Carolina and a 15.6 percent increase in the U.S.
Activity Levels
Pee Dee NWR had 31,750 visitors in 2004 (Table 4-282). The majority of recreation visits, 29,400, were for non-consumptive activities. About 52 percent of recreation visits were undertaken by area residents.
249

Banking on Nature: The Economic Benefits to Local Communities of National Wildlife Refuge Visitation
Table 4-281. Pee Dee NWR:Summary of Area Economy, 2003
(Population & Employment in 000’s; Per Capita Income in 2004 dollars)
Population Employment Per Capita Income
County 2003
Percent change
1993-2003 2003
Percent change
1993-2003 2003
Percent change
1993-2003
Union, NC 146.0 57.1% 62.7 42.5% $27,501 15.0%
Stanly, NC 58.8 9.8% 26.0 -2.3% $23,985 8.3%
Richmond, NC 46.7 2.6% 18.8 -10.5% $31,540 10.1%
Anson, NC 25.2 2.9% 10.6 -2.4% $21,848 5.7%
Area Total 276.7 27.8% 118.1 15.2% $25,233 13.7%
North Carolina 8,421.2 19.6% 4,880.3 18.7% $28,829 12.4%
United States 290,789.0 11.9% 167,174.4 17.9% $32,322 15.6%
Source: U.S. Department of Commerce 2003.
Table 4-282. Pee Dee NWR: 2004 Recreation Visits
Activity Residents Non-Residents Total
Non-Consumptive:
Nature Trails 3,750 3,750 7,500
Observation Platforms 2,500 2,500 5,000
Other Wildlife Observation 0 0 0
Beach /Water Use 64 96 160
Other Recreation 8,370 8,370 16,740
Hunting:
Big Game 120 280 400
Small Game 690 1,610 2,300
Migratory Birds 200 200 400
Fishing:
Freshwater 0 0 0
Saltwater 3,264 816 4,080
Total Visitation 18,958 17,622 36,580
Total Visitors 31,750
250

Sample Refuges Descriptions
Regional Economic Analysis
The economic area for the Refuge is defined as Anson, Stanly, Richmond and Union counties in North Carolina. It is assumed that Refuge visitor expenditures occur primarily within this 4-county area.
shows visitor recreation expenditures for the Refuge in 2004. Total expenditures were $885,300 with non-residents accounting for $727,600 (82 percent of total expenditures). Expenditures on non-consumptive activities accounted for 58 percent of the total, hunting 9 percent and fishing 33 percent.
Table 4-283. Pee Dee NWR: Visitor Recreation Expenditures (2004 $,000)
Activity Residents Non-Residents Total
Non-Consumptive: $77.5 $438.1 $515.6
Hunting:
Big Game $2.1 $12.0 $14.1
Small Game $5.8 $51.0 $56.8
Migratory Birds $1.8 $8.5 $10.3
Total Hunting $9.7 $71.5 $81.2
Fishing:
Freshwater ─ ─ ─
Saltwater $70.7 $218.0 $288.6
Total Fishing $70.7 $218.0 $288.6
Total Expenditures $157.8 $727.6 $885.3
Table 4-284 summarizes the total economic impacts associated with refuge visitor spending. Total final demand was $1,188,200. This is the total monetary value of economic activity generated in the 4-county area by refuge visitor spending. In turn, this final demand generated 12 jobs (both full-time and part-time) with total job income of $314,600. Total tax revenue generated (county, state and Federal) amounted to $189,200.
Table 4-284. Pee Dee NWR: Local Economic Effects Associated with Recreation Visits (2004 $,000)
Residents Non-Residents Total
Final Demand $211.7 $976.6 $1,188.2
Jobs 2.3 10.0 12.3
Job Income $56.4 $258.2 $314.6
Total Tax Revenue $33.9 $155.3 $189.2
251

Banking on Nature: The Economic Benefits to Local Communities of National Wildlife Refuge Visitation
Table 4-285 shows total economic effects (total recreation expenditures plus net economic value) compared with the refuge budget for 2004. For an individual, net economic value is that person's total willingness to pay for a particular recreation activity minus his or her actual expenditures for that activity. The figure for economic value is derived by multiplying net economic values for hunting, fishing, and non-consumptive recreation use (on a per-day basis) by estimated refuge visitor days for that activity. This figure is combined with the estimate of total expenditures and divided by the refuge budget for 2004. The $2.20 means that for every $1 of budget expenditures, $2.20 of total economic effects are associated with these budget expenditures. This ratio is provided only for the purpose of broadly comparing the magnitude of economic effects resulting from refuge visitation to budget expenditures and should not be interpreted as a benefit-cost ratio.
Table 4-285. Pee Dee NWR: Summary of Local Economic Effects of Recreation Visits (2004 $,000)
FY 2004 Budget
RecreationExpenditures
Net Economic Value
Total economic effects per $1 budget expenditure
Pee Dee NWR $673.6 $885.3 $596.2 $2.20
252

Sample Refuges Descriptions
Piedmont National Wildlife Refuge
Description
Piedmont National Wildlife Refuge is primarily an upland forest dominated by loblolly pine on the ridges with hardwoods found along the creek bottoms and in scattered upland coves. Clear streams and beaver ponds provide ideal wetland habitat for wood ducks and other wetland dependent species. In the early 1800's the European settlers arrived in abundance and began to clear the land to plant a variety of crops. The settlers removed more than 90% of the forest. The continuous planting of cotton caused serious erosion and soil infertility. By the late 1870's they had abandoned more than a third of the land because the land could not sustain crops.
With the combination of soil infertility, the boll weevil outbreak on remaining cotton and the depression, there was wholesale abandonment of the barren eroded land in the 1930's. By then all the top soil had washed away, leaving the red clay subsoil exposed. The refuge was established from this worn out abandoned farm land where few wildlife species remained. With good soil and forest conservation practices, the wildlife habitat began to improve. Today, through the efforts of the U.S. Fish & Wildlife Service, the 35,000 acre wildlife refuge is once again a forest.
The red-cockaded woodpecker, a native bird of the southern US, is an endangered species because the older age pine forests it requires for nesting and roosting have been cleared throughout most of its range. The refuge currently has 39 active family groups. Prescribed burning and thinning are two forest management practices used to provide habitat for the red-cockaded woodpecker. Many migratory bird species, white-tailed deer, wild turkey, and other native wildlife benefit from these management practices.
The diversity of habitats provides a haven for over 200 species of birds, including many species of neotropical songbirds, and 50 species of mammals.
Area Economy
The Piedmont NWR is located in Jones and Jasper counties in central Georgia southeast of Atlanta. Bibb and Monroe counties account for a significant number of refuge visitors. The area had a population of 216,100 in 2003, an increase of 6.7 percent from 1993 compared with a 24.3 percent increase for the state of Georgia and a 12 percent increase for the U.S. Total area employment increased by 11.9 percent from 1993 to 2003 compared with a 25.8 percent increase in Georgia and a 18 percent increase in the U.S.
Per capita personal income increased in the area by 15.7 percent from 1993 to 2003. This compares with a 15.3 percent increase in Georgia and a 15.6 percent increase in the U.S.
253

Banking on Nature: The Economic Benefits to Local Communities of National Wildlife Refuge Visitation
Table 4-286. Piedmont NWR:Summary of Area Economy, 2003
(Population & Employment in 000’s; Per Capita Income in 2004 dollars)
Population Employment Per Capita Income
County 2003
Percent change
1993-2003 2003
Percent change
1993-2003 2003
Percent change
1993-2003
Bibb, GA 154.6 0.8% 106.4 10.4% $30,199 18.1%
Jones, GA 25.5 19.0% 5.5 31.2% $24,403 6.0%
Monroe, GA 23.3 24.9% 7.3 6.9% $25,888 18.5%
Jasper, GA 12.6 39.9% 4.1 42.6% $22,811 11.3%
Area Total 216.1 6.7% 123.3 11.9% $28,617 15.7%
Georgia 8,676.5 24.3% 4,896.3 25.8% $29,783 15.3%
United States 290,789.0 11.9% 167,174.4 17.9% $32,322 15.6%
Source: U.S. Department of Commerce 2003.
254

Sample Refuges Descriptions
Activity Levels
Piedmont NWR had 55,992 visitors in 2004. The majority of recreation visits, 54,169, were for non-consumptive activities. About 65 percent of recreation visits were undertaken by non-residents.
Table 4-287. Piedmont NWR: 2004 Recreation Visits
Activity Residents Non-Residents Total
Non-Consumptive:
Nature Trails 4,075 4,075 8,150
Observation Platforms 0 0 0
Other Wildlife Observation 6,553 26,214 32,767
Beach /Water Use 0 0 0
Other Recreation 5,301 7,951 13,252
Hunting:
Big Game 2,435 2,435 4,869
Small Game 711 869 1,580
Migratory Birds 0 0 0
Fishing:
Freshwater 3,825 675 4,500
Saltwater 0 0 0
Total Visitation 22,899 42,218 65,117
Total Visitors 55,992
Regional Economic Analysis
The economic area for the Refuge is defined as Jones, Jasper, Bibb and Monroe counties in Georgia. It is assumed that Refuge visitor expenditures occur primarily within this 4-county area.
Table 4-63 shows visitor recreation expenditures for the Refuge in 2004. Total expenditures were $2,297,800 with non-residents accounting for $2,061,500 (90 percent of total expenditures). Expenditures on non-consumptive activities accounted for 85 percent of the total, hunting 8 percent and fishing 7 percent.
255

Banking on Nature: The Economic Benefits to Local Communities of National Wildlife Refuge Visitation
Table 4-288. Piedmont NWR: Visitor Recreation Expenditures (2004 $,000)
Activity Residents Non-Residents Total
Non-Consumptive: $143.2 $1,804.6 $1,947.8
Hunting:
Big Game $42.4 $104.1 $146.4
Small Game $8.0 $36.7 $44.7
Migratory Birds ─ ─ ─
Total Hunting $50.3 $140.7 $191.1
Fishing:
Freshwater $42.7 $116.2 $158.9
Saltwater ─ ─ ─
Total Fishing $42.7 $116.2 $158.9
Total Expenditures $236.2 $2,061.5 $2,297.8
Table 4-289 summarizes the total economic impacts associated with refuge visitor spending. Total final demand was $3,426,000. This is the total monetary value of economic activity generated in the 4-county area by refuge visitor spending. In turn, this final demand generated 37 jobs (both full-time and part-time) with total job income of $952,400. Total tax revenue generated (county, state and Federal) amounted to $495,600.
Table 4-289. Piedmont NWR: Local Economic Effects Associated with Recreation Visits (2004 $,000)
Residents Non-Residents Total
Final Demand $351.6 $3,074.3 $3,426.0
Jobs 3.8 33.0 36.8
Job Income $98.9 $853.5 $952.4
Total Tax Revenue $51.5 $444.1 $495.6
Table 4-290 shows total economic effects (total recreation expenditures plus net economic value) compared with the refuge budget for 2004. For an individual, net economic value is that person's total willingness to pay for a particular recreation activity minus his or her actual expenditures for that activity. The figure for economic value is derived by multiplying net economic values for hunting, fishing, and non-consumptive recreation use (on a per-day basis) by estimated refuge visitor days for that activity. This figure is combined with the estimate of total expenditures and divided by the refuge budget for 2004. The $4.38 means that for every $1 of budget expenditures, $4.38 of total economic effects are associated with these budget expenditures. This ratio is provided only for the purpose of broadly
256

Sample Refuges Descriptions
comparing the magnitude of economic effects resulting from refuge visitation to budget expenditures and should not be interpreted as a benefit-cost ratio.
Table 4-290. Piedmont NWR: Summary of Local Economic Effects of Recreation Visits (2004 $,000)
FY 2004 Budget
RecreationExpenditures
Net Economic Value
Total economic effects per $1 budget expenditure
Piedmont NWR
$890.5 $2,297.8 $1,602.4 $4.38
257

Banking on Nature: The Economic Benefits to Local Communities of National Wildlife Refuge Visitation
Sabine National Wildlife Refuge
Description
Sabine NWR was established in 1937 to provide habitat for migratory waterfowl and other birds. The refuge consists of a basin of wetlands located between the Gulf's beach cheniers (oak ridges) and the coastal prairie, which is one of the most productive and fertile areas of North America. It encompasses 124,511 acres of fresh, intermediate and brackish marshes and is one of the largest estuarine-dependent marine species nurseries in southwest Louisiana. It has also been designated as an "Internationally Important Bird Area" due to the numerous wading, water and marsh birds that utilize it throughout the year.
Over 280,000 people visit the refuge annually. The exhibits in the refuge visitor center and the Wetland Walkway are considered two of the principal tourist attractions in southwest Louisiana. The refuge is an integral part of the Creole Nature Trail All American Road
Sabine NWR encompasses 33,000 acres of impounded fresh marsh and 91,511 acres of brackish to intermediate marsh. Management of this 124,511 acre refuge is not as intensive as that found on smaller refuges. Because of many man-made and natural factors, habitat losses have occurred on an estimated 40,000 acres of the refuge. Major efforts are being taken to correct or prevent further loss.
The primary management objective is to maintain and perpetuate Gulf Coast wetlands for wintering waterfowl from the Mississippi and Central Flyways. The refuge is one of the largest estuarine-dependent marine species nurseries in southwest Louisiana. Wetlands are maintained using prescribed burning, and water level and water quality manipulation. There are over 115 miles of canals, 61 miles of levees, and 8 water control structures that are part of the complex water management operation. Major issues involve restoration of 40,000 acres of marsh habitat for migrating birds, maintaining aquatic conditions for saltwater and freshwater fisheries, and regulation of gas and oil exploration activities to benefit wetlands.
Sabine NWR is located about 22 miles south of Sulphur, Louisiana.
Area Economy
The Sabine NWR is located in Cameron Parish in southwestern Louisiana on the Gulf of Mexico. Calcasieu Parish provides a significant number of refuge visitors. The area had a population of 193,900 in 2003, an increase of 6.5 percent from 1993 compared with a 4.1 percent for the state of Louisiana and a 12 percent increase for the U.S. Total area employment increased by 18.7 percent from 1993 to 2003 compared with a 15.8 percent increase in Louisiana and a 18 percent increase in the U.S.
Per capita personal income increased in the area by 18.2 percent from 1993 to 2003. This compares with a 18.5 percent increase in Louisiana and a 15.6 percent increase in the U.S.
Activity Levels
Sabine NWR had 290,490 visitors in 2004. The majority of recreation visits, over 189,000 were for fishing. About 73 percent of recreation visits were undertaken by non-residents.
258

Sample Refuges Descriptions
Table 4-291. Sabine NWR:Summary of Area Economy, 2003
(Population & Employment in 000’s; Per Capita Income in 2004 dollars)
Population Employment Per Capita Income
County 2003
Percent change
1993-2003 2003
Percent change
1993-2003 2003
Percent change
1993-2003
Calcasieu, LA 184.2 6.6% 102.3 19.7% $27,102 18.5%
Cameron, LA 9.7 4.5% 4.8 0.3% $19,643 11.3%
Area Total 193.9 6.5% 107.1 18.7% $26,729 18.2%
Louisiana 4,493.7 4.1% 2,432.1 15.8% $27,022 18.5%
United States 290,789.0 11.9% 167,174.4 17.9% $32,322 15.6%
Source: U.S. Department of Commerce 2003.
Table 4-292. Sabine NWR: 2004 Recreation Visits
Activity Residents Non-Residents Total
Non-Consumptive:
Nature Trails 16,116 64,465 80,581
Observation Platforms 0 0 0
Other Wildlife Observation 146 586 732
Beach /Water Use 0 0 0
Other Recreation 0 0 0
Hunting:
Big Game 0 0 0
Small Game 5 11 16
Migratory Birds 1,153 2,689 3,842
Fishing:
Freshwater 1,481 3,455 4,935
Saltwater 55,226 128,860 184,086
Total Visitation 74,126 200,065 274,191
Total Visitors 290,490
259
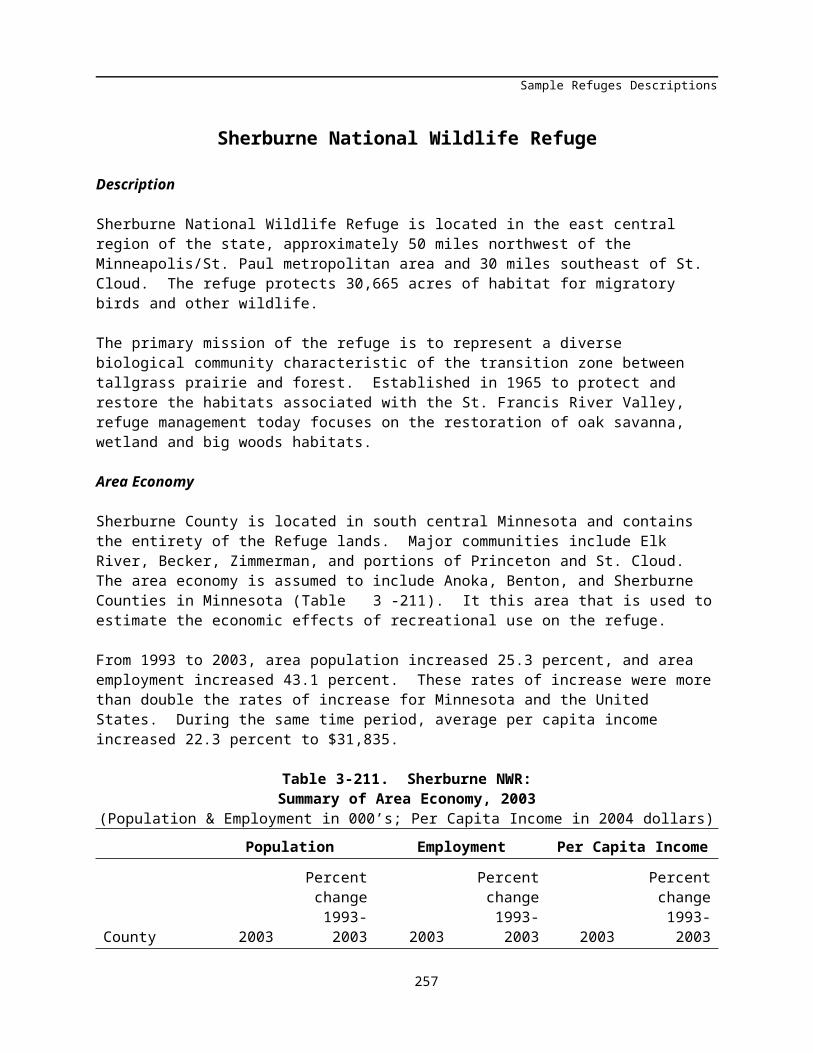
Banking on Nature: The Economic Benefits to Local Communities of National Wildlife Refuge Visitation
Regional Economic Analysis
The economic area for the Refuge is defined as Cameron and Calcasieu Parishes in Louisiana. It is assumed that Refuge visitor expenditures occur primarily within this area.
Table 4-293 shows visitor recreation expenditures for the Refuge in 2004. Total expenditures were $6,477,700 with non-residents accounting for $5,196,200 (80 percent of total expenditures). Expenditures on non-consumptive activities accounted for 21 percent of the total, hunting 3 percent and fishing 76 percent.
Table 4-293. Sabine NWR: Visitor Recreation Expenditures (2004 $,000)
Activity Residents Non-Residents Total
Non-Consumptive: $57.6 $1,299.4 1,357.0
Hunting:
Big Game ─ ─ ─
Small Game ─ $0.4 0.5
Migratory Birds $15.3 $172.4 187.7
Total Hunting $15.3 $172.9 188.2
Fishing:
Freshwater $13.2 $36.0 49.2
Saltwater $1,195.4 $3,688.0 4,883.3
Total Fishing $1,208.6 $3,723.9 4,932.5
Total Expenditures $1,281.5 $5,196.2 6,477.7
Table 4-69 summarizes the total economic impacts associated with refuge visitor spending. Total final demand was $9,049,400. This is the total monetary value of economic activity generated in the area by refuge visitor spending. In turn, this final demand generated 108 jobs (both full-time and part-time) with total job income of $2,467,000. Total tax revenue generated (county, state and Federal) amounted to $1,026,700.
260
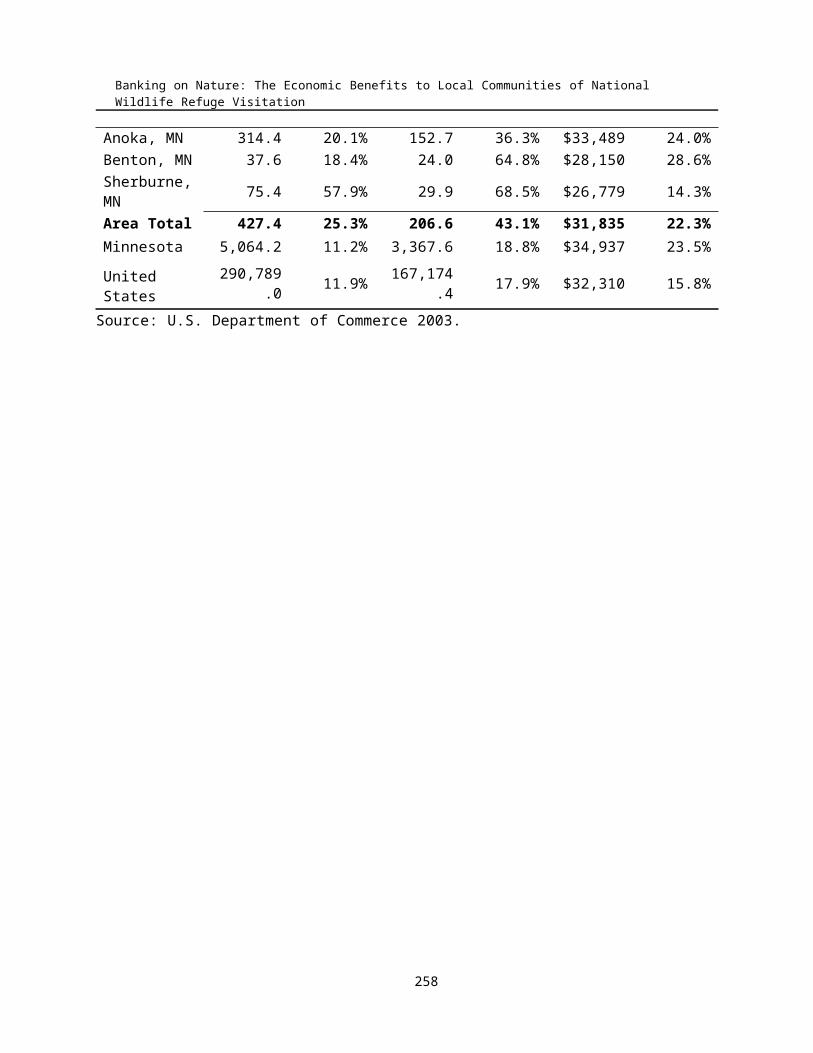
Sample Refuges Descriptions
Table 4-294. Sabine NWR: Local Economic Effects Associated with Recreation Visits (2004 $,000)
Residents Non-Residents Total
Final Demand $1,793.9 $7,255.5 $9,049.4
Jobs 22.0 85.5 107.5
Job Income $492.0 $1,975.0 $2,467.0
Total Tax Revenue $201.8 $824.9 $1,026.7
Table 4-295 shows total economic effects (total recreation expenditures plus net economic value) compared with the refuge budget for 2004. For an individual, net economic value is that person's total willingness to pay for a particular recreation activity minus his or her actual expenditures for that activity. The figure for economic value is derived by multiplying net economic values for hunting, fishing, and non-consumptive recreation use (on a per-day basis) by estimated refuge visitor days for that activity. This figure is combined with the estimate of total expenditures and divided by the refuge budget for 2004. The $10.18 means that for every $1 of budget expenditures, $10.18 of total economic effects are associated with these budget expenditures. This ratio is provided only for the purpose of broadly comparing the magnitude of economic effects resulting from refuge visitation to budget expenditures and should not be interpreted as a benefit-cost ratio.
Table 4-295. Sabine NWR: Summary of Local Economic Effects of Recreation Visits (2004 $,000)
FY 2004 Budget
RecreationExpenditures
Net Economic Value
Total economic effects per $1 budget expenditure
Sabine NWR $1,145.5 $6,477.7 $5,188.7 $10.18
261

Banking on Nature: The Economic Benefits to Local Communities of National Wildlife Refuge Visitation
St. Marks National Wildlife Refuge
Description
St. Marks NWR, located 25 miles south of Tallahassee along the Gulf Coast of Florida, is a well-known oasis of natural Florida habitats for wildlife, especially birds. Natural salt marshes, freshwater swamps, pine forests and lakes provide a haven for wildlife and people.
Established in 1931 for wintering migratory birds, St. Marks NWR has a long tradition of excellent birdwatching. There are over 300 species of birds recorded on the refuge, with 98 species nesting on-site. There are 19 species of ducks and many hawks, falcons, and shorebirds migrating through the refuge in the fall and winter. There are 14 active bald eagle nests and the endangered least tern and red-cockaded woodpecker also nest on the refuge.
In the spring, the refuge is a showcase of colors as songbirds migrate north through coastal oaks and shrubs. Wildlife abounds on St. Marks NWR due to the wide diversity of habitats, ranging from wilderness saltmarshes, ribboned with tidal creeks, to rolling longleaf pine forests, with swamps, sinkholes, and palm/oak hammocks in between. Located in Wakulla, Jefferson, and Taylor counties, the refuge spans over 43 miles of coastline and supports 52 species of mammals such as the Florida black bear and bobcat; 40 species of amphibians such as the endangered flatwoods salamander, and 65 species of reptiles.
Fishing, hiking, birdwatching, butterfly-watching, hunting, and viewing the historic St. Marks lighthouse on beautiful Apalachee Bay attract visitors from around the world. Special events highlighting the refuge's coastal resources, monarch butterflies, wildflowers and migratory birds enhance visitors' opportunities to learn more about this special place.
Visitors may glimpse endangered loggerhead sea turtles and West Indian manatees offshore by the lighthouse. State-listed threatened and endangered plants are also found on the refuge. St. Marks NWR's location also makes it an ideal host for the natural marvel of the migrating monarch butterflies in October on their way to Mexico.
Area Economy
The area economy is defined as the two county area adjacent to the Refuge. This area includes Wakulla and Leon Counties, Florida. Wakulla County is located in the panhandle of Florida on the Gulf of Mexico and contains the majority of the Refuge lands. Leon County lies to the north of the Refuge. The majority of the recreational visitor expenditures are spent in the economic hub of the region, Leon County. Thus, most of the economic impacts of Refuge visitation will occur within the two county study area.
Table 4-71 summarizes the area economy for St. Marks NWR. From 1993 to 2003, the area population increased 17.1 percent to 268,200 people, and employment increased 24.3 percent to 182,900 people. In 2003, the area’s per capita income ($28,223) was below Florida ($30,900) and the United States ($32,310).
262

Sample Refuges Descriptions
Table 4-296. St. Marks NWR:Summary of Area Economy, 2003
(Population & Employment in 000’s; Per Capita Income in 2004 dollars)
Population Employment Per Capita Income
County 2003
Percent change
1993-2003 2003
Percent change
1993-2003 2003
Percent change
1993-2003Leon, FL 242.1 14.2% 175.7 23.1% $28,858 14.3%Wakulla, FL 26.1 53.4% 7.2 61.6% $22,332 15.7%
Area Total 268.2 17.1% 182.9 24.3% $28,223 13.8%Florida 16,999.2 22.1% 9,346.8 32.4% $30,900 12.3%
United States 290,789.0 11.9% 167,174.4 17.9% $32,310 15.8%
Source: U.S. Department of Commerce 2003.
Activity Levels
Table 4-72 shows recreation visits to St. Marks NWR in FY 2004. Total visitation (719,675 visits) is greater than total visitors (311,415) because some visitors chose to partake in more than one activity.
Visitors to the refuge enjoy a wide range of activities including hiking, birdwatching, hunting, fishing, and others. The majority of visits (88 percent or 631,759 visits) were for non-consumptive activities. Saltwater fishing was the most popular type of fishing, while big game hunting was the most popular type of hunting. Visits were fairly equally distributed among residents (349,241 visits) and non-residents (370,434).
263

Banking on Nature: The Economic Benefits to Local Communities of National Wildlife Refuge Visitation
Table 4-297. St. Marks NWR: 2004 Recreation Visits
Activity Residents Non-Residents Total
Non-Consumptive:
Nature Trails 83,582 195,024 278,606
Observation Platforms 84,024 126,036 210,060
Other Wildlife Observation 18,553 4,638 23,191
Beach /Water Use 19,901 2,211 22,112
Other Recreation 78,232 19,558 97,790
Hunting:
Big Game 832 1,249 2,081
Small Game 210 53 263
Migratory Birds 193 83 275
Fishing:
Freshwater 18,030 2,003 20,033
Saltwater 45,685 19,579 65,264
Total Visitation 349,241 370,434 719,675
Total Visitors 311,415
Regional Economic Analysis
Visitor recreation expenditures totaled $12.5 million in FY 2004 (Table 4-73). Non-consumptive, hunting, and fishing expenditures summed to $8.7 million, $74,000, and $3.7 million, respectively. Approximately 75 percent of expenditures ($9.4 million) were attributable to non-residents.
264

Sample Refuges Descriptions
Table 4-298. St. Marks NWR: Visitor Recreation Expenditures (2004 $,000)
Activity Residents Non-Residents Total
Non-Consumptive: $1,393.8 $7,328.7 $8,722.5
Hunting:
Big Game $14.2 $52.4 $66.6
Small Game $1.2 $1.1 $2.2
Migratory Birds $1.7 $3.5 $5.1
Total Hunting $17.0 $56.9 $74.0
Fishing:
Freshwater $237.1 $71.6 $308.8
Saltwater $1,455.6 $1,924.6 $3,380.2
Total Fishing $1,692.7 $1,996.3 $3,689.0
Total Expenditures $3,103.6 $9,381.9 $12,485.5
Table 4-299 shows the local economic effects associated with recreation visits and expenditures. These recreation-related expenditures generated $16.7 million in final demand, 254 jobs, $5.7 million in job income, and $2.2 million in tax revenue. Approximately 75 percent of these effects are attributed to expenditures by non-resident visitors.
Table 4-299. St. Marks NWR: Local Economic Effects Associated with Recreation Visits (2004 $,000)
Residents Non-Residents Total
Final Demand $4,246.9 $12,460.5 $16,707.4
Jobs 69 185 254
Job Income $1,494.9 $4,243.2 $5,738.1
Total Tax Revenue $531.3 $1,679.1 $2,210.5
Table 4-300 compares the refuge budget and the local economic effects of recreation visits. In FY 2004, recreational benefits (recreation-related expenditures plus net economic value) totaled nearly $22.2 million, and budget expenditures summed to $974,500. Comparing these two estimates shows that for every $1 of budget expenditures, $22.74 in recreational benefits are derived. This ratio is provided to broadly compare the magnitude of the two estimates and should not be used as a benefit-cost ratio. In addition to recreational benefits, St. Marks NWR provides a variety of other benefits including ecological and educational values which are not quantified in this analysis. Furthermore, the budget contributes an additional stimulus to the local economy.
265

Banking on Nature: The Economic Benefits to Local Communities of National Wildlife Refuge Visitation
Table 4-300. St. Marks NWR: Summary of Local Economic Effects of Recreation Visits (2004 $,000)
FY 2004 Budget
RecreationExpenditures
Net Economic Value
Total economic effects per $1 budget expenditure
St. Marks NWR
$974.5 $12,485.5 $9,675.5 $22.74
266

Sample Refuges Descriptions
Tennessee National Wildlife Refuge
Description
Tennessee National Wildlife Refuge, encompassing over 51,000 acres, is located on Kentucky Lake in northwest Tennessee. The refuges three units: Big Sandy, Duck River and Busseltown stretch for 65 miles along the Tennessee River. Established in 1945, the refuge is one of the older refuges in the country. It is managed as an important resting and feeding area for wintering waterfowl. The refuge also provides habitat for numerous resident wildlife species and other migratory birds.
The refuge consists of a diversity of habitats including open reservoir waters, bottomland hardwoods, high quality oaks/hickory forests, freshwater marsh, agricultural lands and some of the largest and highest quality moist soil managed impoundments in the nation. The diversity of habitats found on the refuge units provide ample feeding, nesting and resting areas for 293 bird species, 51 types of mammals, 89 species of reptiles and amphibians, and 142 species of fish. A hotspot for fish diversity, this refuge can boast a greater fish species diversity than any other inland national wildlife refuge in the country.
Tennessee NWR is a major wintering area for more than 250,000 ducks and 20,000 geese, and nearly 100 bald eagles. The refuge winters the largest population of the southern James Bay Canada geese in the southeast, one of the most imperiled populations of geese on the North American continent, and winters up to 10% of the continental population and two-thirds of all the American black ducks found in the state. It is an important nesting and migration route for migratory neotropical birds. Eighty-three percent of the species of concern in the Lower Plateau Partners in Flight Physiographic Area occur on the refuge. This refuge is given the distinction of a "Globally Important Bird Area" for migratory birds.
Area Economy
The Tennessee NWR is located in Henry, Humphreys, Benton, Decatur counties in western Tennessee. The area had a population of 77,600 in 2003, an increase of 8.9 percent from 1993 compared with a 13.8 percent for the state of Tennessee and a 12 percent increase for the U.S. Total area employment increased by 7.1 percent from 1993 to 2003 compared with a 17.4 percent increase in Tennessee and a 18 percent increase in the U.S.
Per capita personal income increased in the area by 7.8 percent from 1993 to 2003. This compares with a 16.4 percent increase in Tennessee and a 15.6 percent increase in the U.S.
267

Banking on Nature: The Economic Benefits to Local Communities of National Wildlife Refuge Visitation
Table 4-301. Tennessee NWR:Summary of Area Economy, 2003
(Population & Employment in 000’s; Per Capita Income in 2004 dollars)
Population Employment Per Capita Income
County 2003
Percent change
1993-2003 2003
Percent change
1993-2003 2003
Percent change
1993-2003
Henry, TN 31.3 8.1% 17.0 6.4% $23,582 6.2%Humphreys, TN 18.1 11.4% 88.4 3.8% $23,342 7.9%
Benton, TN 16.6 8.6% 7.2 7.8% $21,169 2.5%
Decatur, TN 11.6 8.0% 6.3 12.8% $23,098 21.0%
Area Total 77.6 8.9% 38.8 7.1% $22,938 7.8%
Tennessee 5,845.2 13.8% 3,476.0 17.4% $29,414 16.4%
United States 290,789.0 11.9% 167,174.4 17.9% $32,322 15.6%
Source: U.S. Department of Commerce 2003.
268

Sample Refuges Descriptions
Activity Levels
Tennessee NWR had 350,000 visitors in 2004. The majority of recreation visits, 230,000, were for freshwater fishing. About 51 percent of total recreation visits were undertaken by non-residents.
Table 4-302. Tennessee NWR: 2004 Recreation Visits
Activity Residents Non-Residents Total
Non-Consumptive:
Nature Trails 240 60 300
Observation Platforms 4,968 11,592 16,560
Other Wildlife Observation 40,000 40,000 80,000
Beach /Water Use 4,000 1,000 5,000
Other Recreation 29,650 29,650 59,300
Hunting:
Big Game 650 650 1300
Small Game 180 120 300
Migratory Birds 0 0 0
Fishing:
Freshwater 115,000 115,000 230,000
Saltwater 0 0 0
Total Visitation 194,688 198,072 392,760
Total Visitors 350,000
Regional Economic Analysis
The economic area for the Refuge is defined as Henry, Benton, Humphreys and Decatur counties in Tennessee. It is assumed that Refuge visitor expenditures occur primarily within this 4-county area.
Table 4-78 shows visitor recreation expenditures for the Refuge in 2004. Total expenditures were $9,360,300 with non-residents accounting for $7,269,300 (78 percent of total expenditures). Expenditures on non-consumptive activities accounted for 38 percent of the total, hunting less than one percent and fishing 61 percent.
269

Banking on Nature: The Economic Benefits to Local Communities of National Wildlife Refuge Visitation
Table 4-303. Tennessee NWR: Visitor Recreation Expenditures (2004 $,000)
Activity Residents Non-Residents Total
Non-Consumptive: $540.2 $3,055.2 $3,595.4
Hunting:
Big Game $8.5 $20.8 $29.3
Small Game $1.0 $2.5 $3.6
Migratory Birds ─ ─ ─
Total Hunting $9.5 $23.4 $32.9
Fishing:
Freshwater $1,541.4 $4,190.7 $5,732.0
Saltwater ─ ─ ─
Total Fishing $1,541.4 $4,190.7 $5,732.0
Total Expenditures $2,091.0 $7,269.3 $9,360.3
Table 4-304 summarizes the total economic impacts associated with refuge visitor spending. Total final demand was $12,193,300. This is the total monetary value of economic activity generated in the 4-county area by refuge visitor spending. In turn, this final demand generated 145 jobs (both full-time and part-time) with total job income of $3,188,700. Total tax revenue generated (county, state and Federal) amounted to $1,257,000.
Table 4-304. Tennessee NWR: Local Economic Effects Associated with Recreation Visits (2004 $,000)
Residents Non-Residents Total
Final Demand $2,738.5 $9,454.8 $12,193.3
Jobs 32.0 112.8 144.7
Job Income $713.3 $2,475.4 $3,188.7
Total Tax Revenue $284.1 $972.9 $1,257.0
Table 4-305 shows total economic effects (total recreation expenditures plus net economic value) compared with the refuge budget for 2004. For an individual, net economic value is that person's total willingness to pay for a particular recreation activity minus his or her actual expenditures for that activity. The figure for economic value is derived by multiplying net economic values for hunting, fishing, and non-consumptive recreation use (on a per-day basis) by estimated refuge visitor days for that activity. This figure is combined with the estimate of total expenditures and divided by the refuge budget for 2004. The $12.46 means that for every $1 of budget expenditures, $12.46 of total economic effects are associated with these budget expenditures. This ratio is provided only for the purpose of broadly
270

Sample Refuges Descriptions
comparing the magnitude of economic effects resulting from refuge visitation to budget expenditures and should not be interpreted as a benefit-cost ratio.
Table 4-305. Tennessee NWR: Summary of Local Economic Effects of Recreation Visits (2004 $,000)
FY 2004 Budget
RecreationExpenditures
Net Economic Value
Total economic effects per $1 budget expenditure
Tennessee NWR
$1,600.2 $9,360.3 $10,579.6 $12.46
271

Banking on Nature: The Economic Benefits to Local Communities of National Wildlife Refuge Visitation
Theodore Roosevelt National Wildlife Refuge Complex
Description
The Theodore Roosevelt National Wildlife Refuge Complex, formerly the Central Mississippi Refuges Complex, comprises the Hillside, Mathews Brake, Morgan Brake, Panther Swamp, Yazoo, Theodore Roosevelt and Holt Collier NWR's. Legislation sponsored by Senator Thad Cochran and Congressman Bennie Thompson changed the name to Theodore Roosevelt National Wildlife Refuge Complex in January, 2004. The legislation established two new refuges in the Complex – Holt Collier National Wildlife Refuge and Theodore Roosevelt National Wildlife Refuge, and included provisions to design and construct the Holt Collier Environmental Education and Interpretation Center in the south Delta region.
The Theodore Roosevelt National Wildlife Refuge Complex is the largest refuge complex in the state of Mississippi and includes both the youngest (Holt Collier and Theodore Roosevelt National Wildlife Refuges) and the oldest refuges (Yazoo National Wildlife Refuge) in the state. Over 100,000 acres of refuge lands on seven refuges, including 13,000 acres of refuge-managed Farmers Home Administration lands, provide vital habitat for fish and wildlife in the Delta region.
Area Economy
The Theodore Roosevelt NWR Complex is located in Washington, Yazoo, Holmes, Leflore and Sharkey counties in Mississippi. The area had a population of 152,300 in 2003, a decline of 3.7 percent from 1993 compared with a 8.6 percent increase for the state of Mississippi and a 12 percent increase for the U.S. Total area employment declined by 4 percent from 1993 to 2003 compared with a 14 percent increase in Mississippi and a 18 percent increase in the U.S.
Per capita personal income increased in the area by 14.4 percent from 1993 to 2003. This compares with a 20.3 percent increase in Mississippi and a 15.6 percent increase in the U.S.
272

Sample Refuges Descriptions
Table 4-306. Theodore Roosevelt NWR Complex:Summary of Area Economy, 2003
(Population & Employment in 000’s; Per Capita Income in 2004 dollars)
Population Employment Per Capita Income
County 2003
Percent change
1993-2003 2003
Percent change
1993-2003 2003
Percent change
1993-2003
Washington MS 60.2 -9.2% 28.4 -5.3% $20,728 15.1%
Yazoo MS 28.2 9.7% 9.7 -2.5% $20,239 13.4%
Holmes MS 21.3 1.2% 5.9 -13.8% $16,913 17.5%
Leflore MS 36.4 -4.3% 19.9 2.7% $21,199 12.0%
Sharkey MS 6.2 -11.1% 2.5 -16.6% $18,997 22.4%Area Total 152.3 -3.7% 66.4 -4.0% $20,147 14.4%Mississippi 2,882.6 8.6% 1,475.4 14.0% $24,100 20.3%United States 290,789.0 11.9% 167,174.4 17.9% $32,322 15.6%
Source: U.S. Department of Commerce 2003.
273
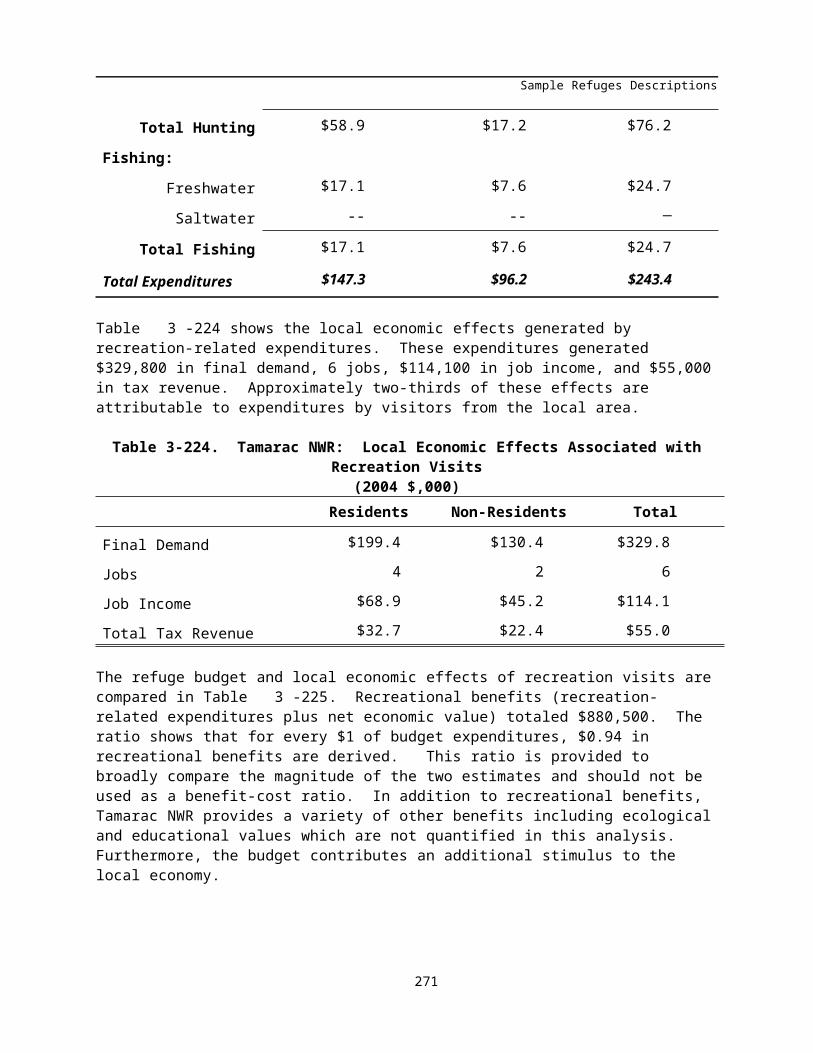
Banking on Nature: The Economic Benefits to Local Communities of National Wildlife Refuge Visitation
Activity Levels
Theodore Roosevelt NWR Complex had 70,992 visitors in 2004. The majority of recreation visits, over 39,075 were for non-consumptive activities. About 56 percent of recreation visits were undertaken by area residents.
Table 4-307. Theodore Roosevelt NWR: 2004 Recreation Visits
Activity Residents Non-Residents Total
Non-Consumptive:
Nature Trails 12,262 23,803 36,065
Observation Platforms 125 1125 1250
Other Wildlife Observation 352 1,408 1,760
Beach /Water Use 0 0 0
Other Recreation 0 0 0
Hunting:
Big Game 11,595 1,288 12,883
Small Game 5,190 577 5,767
Migratory Birds 3,926 436 4,362
Fishing:
Freshwater 3,623 403 4,025
Saltwater 0 0 0
Total Visitation 37,073 29,040 66,112
Total Visitors 70,992
Regional Economic Analysis
The economic area for the Refuge is defined as Washington, Yazoo, Holmes, Leflore and Sharkey counties in Mississippi. It is assumed that Refuge visitor expenditures occur primarily within this 5-county area.
Table 4-83 shows visitor recreation expenditures for the Refuge in 2004. Total expenditures were $1,044,800 with residents accounting for $526,200 (51 percent of total expenditures). Expenditures on non-consumptive activities accounted for 28 percent of the total, hunting 48 percent and fishing 24 percent.
274

Sample Refuges Descriptions
Table 4-308. Theodore Roosevelt NWR: Visitor Recreation Expenditures (2004 $,000)
Activity Residents Non-Residents Total
Non-Consumptive: $177.3 $111.1 $288.3
Hunting:
Big Game $179.3 $110.1 $289.4
Small Game $43.7 $18.3 $62.0
Migratory Birds $57.7 $93.2 $151.0
Total Hunting $280.8 $221.6 $502.4
Fishing:
Freshwater $68.3 $185.8 $254.1
Saltwater ─ ─ ─
Total Fishing $68.3 $185.8 $254.1
Total Expenditures $526.4 $518.5 $1,044.8
Table 4-309 summarizes the total economic impacts associated with refuge visitor spending. Total final demand was $1,407,700. This is the total monetary value of economic activity generated in the 5-county area by refuge visitor spending. In turn, this final demand generated 18 jobs (both full-time and part-time) with total job income of $371,800. Total tax revenue generated (county, state and Federal) amounted to $217,100.
Table 4-309. Theodore Roosevelt NWR: Local Economic Effects Associated with Recreation Visits (2004 $,000)
Residents Non-Residents Total
Final Demand $708.5 $699.3 $1,407.7
Jobs 9.2 9.2 18.4
Job Income $186.5 $185.4 $371.8
Total Tax Revenue $108.2 $108.9 $217.1
Table 4-310 shows total economic effects (total recreation expenditures plus net economic value) compared with the refuge budget for 2004. For an individual, net economic value is that person's total willingness to pay for a particular recreation activity minus his or her actual expenditures for that activity. The figure for economic value is derived by multiplying net economic values for hunting, fishing, and non-consumptive recreation use (on a per-day basis) by estimated refuge visitor days for that activity. This figure is combined with the estimate of total expenditures and divided by the refuge budget for 2004. The $1.24 means that for every $1 of budget expenditures, $1.24 of total economic effects are associated with these budget expenditures. This ratio is provided only for the purpose of broadly
275
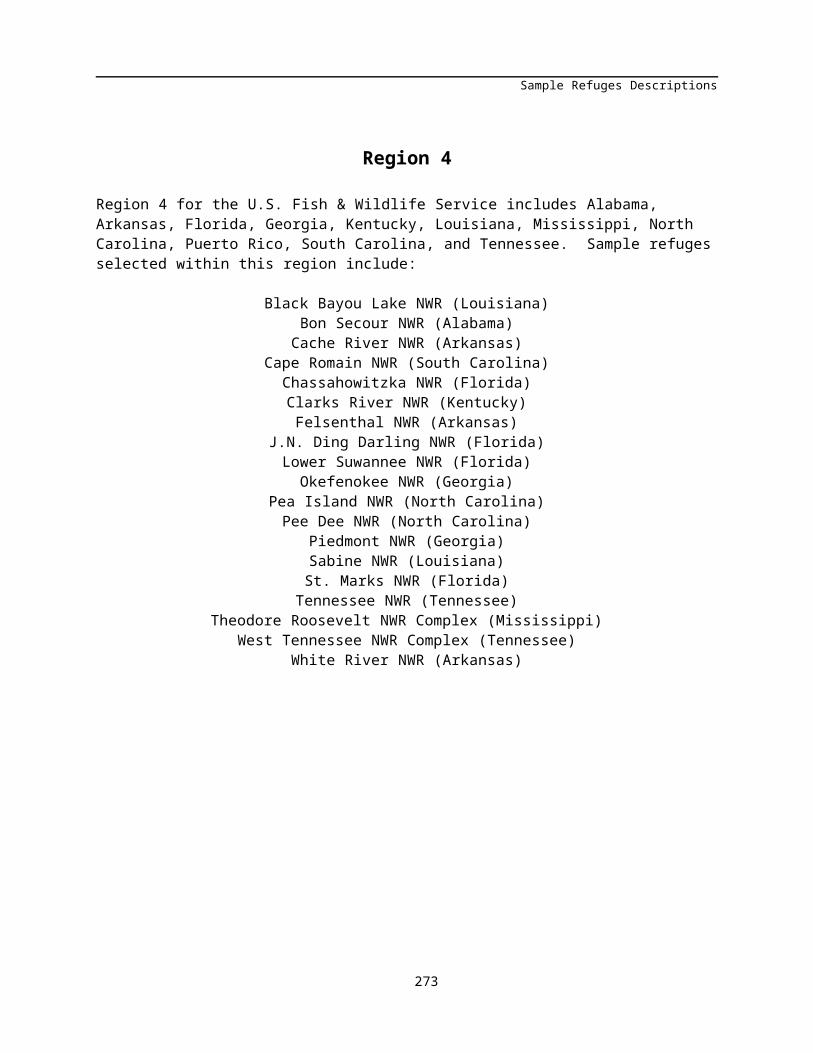
Banking on Nature: The Economic Benefits to Local Communities of National Wildlife Refuge Visitation
comparing the magnitude of economic effects resulting from refuge visitation to budget expenditures and should not be interpreted as a benefit-cost ratio.
Table 4-310. Theodore Roosevelt NWR: Summary of Local Economic Effects of Recreation Visits (2004 $,000)
FY 2004 Budget
RecreationExpenditures
Net Economic Value
Total economic effects per $1 budget expenditure
Theodore Roosevelt NWR
$2,342.6 $1,044.8 $1,855.3 $1.24
276

Sample Refuges Descriptions
West Tennessee Refuge Complex
Description
The West Tennessee Refuge Complex consists of the Reelfoot, Lake Isom, Chickasaw, Lower Hatchie, and Hatchie NWR's in western Tennessee.
The Reelfoot National Wildlife Refuge was established in 1941 to manage the northern third of Reelfoot Lake as a refuge for migratory birds. Additional lands acquired in Southwestern Kentucky expanded the refuge to its current 10,428 acres. The proximity of Reelfoot Lake and the refuge to the Mississippi river has always made the area a major stopover and wintering ground for migratory waterfowl and bald eagles.
The Lake Isom National Wildlife Refuge was established as an inviolate sanctuary for wintering waterfowl in 1938 by presidential proclamation. Lake Isom is the oldest refuge in Tennessee and encompasses some 1,850 acres of migratory bird habitat surrounding Lake Isom. The proximity of Lake Isom to the Mississippi river has always made the area a major stopover and wintering ground for migratory waterfowl
Established August 5, 1985, Chickasaw National Wildlife Refuge lies in the Lower Mississippi River floodplain along the Chickasaw Bluff in western Tennessee. Chickasaw NWR currently encompasses 25,006 acres and includes the largest block of bottomland hardwood forest in Tennessee. Chickasaw NWR and adjacent lands are known to be important wintering and stop-over areas for a large portion of the Mississippi Flyway mallard population. Under optimum conditions, peak waterfowl numbers may exceed 250,000 including black ducks, gadwall, pintail, teal, wigeon, wood duck, ring-necked duck, and hooded merganser.
The Lower Hatchie National Wildlife Refuge (NWR) sits along the lower 17 miles of the Hatchie River in western Tennessee. Unlike most Mississippi River tributaries that have been straightened and levees constructed for flood control, the Hatchie River remains the longest continuous stretch of naturally meandering river in the lower Mississippi River Valley. In result, wildlife and fisheries thrive in its almost pristine watershed ecosystems. The refuge helps protect and enhance the ever diminishing bottomland hardwood forests, along with other important habitats within the Hatchie River watershed. The refuge currently comprises 9,451 acres
The Hatchie NWR includes 11,556 acres along the Scenic Hatchie River and is located about four miles south of Brownsville, Tennessee. The refuge was established in 1964, primarily to provide habitat (food, water and shelter) for migrating and wintering waterfowl
Area Economy
The West Tennessee Complex NWR is located in Tipton, Obion, Lauderdale, and Lake counties in Tennessee and Fulton County in Kentucky. The area had a population of 128,900 in 2003, an increase of 13.3 percent from 1993 compared with a 13.8 percent increase for the state of Tennessee, an 8 percent increase for Kentucky and a 12 percent increase for the U.S. Total area employment increased by 2.7 percent from 1993 to 2003 compared with a 17.4 percent increase in Tennessee, a 15 percent increase in Kentucky and an 18 percent increase in the U.S.
277
Banking on Nature: The Economic Benefits to Local Communities of National Wildlife Refuge Visitation
Per capita personal income increased in the area by 10 percent from 1993 to 2003. This compares with a 16.4 percent increase in Tennessee, a 18.9 percent increase in Kentucky and a 15.6 percent increase in the U.S.
Table 4-311. West Tennessee Complex NWR:Summary of Area Economy, 2003
(Population & Employment in 000’s; Per Capita Income in 2004 dollars)
Population Employment Per Capita Income
County 2003
Percent change
1993-2003 2003
Percent change
1993-2003 2003
Percent change
1993-2003
Tipton, TN 54.1 31.1% 15.7 22.5% $24,429 13.9%
Obion, TN 32.3 1.6% 18.5 0.8% $25,561 5.5%
Lauderdale, TN 27.1 9.3% 9.5 -9.8% $19,498 9.0%
Lake, TN 7.9 -2.0% 2,.2 -18.6% $15,333 4.2%
Fulton, KY 7.5 -4.6% 4.2 -4.4% $24,102 10.7%
Area Total 128.9 13.3% 49.9 2.7% $23,102 10.0%
Tennessee 5,845.2 13.8% 3,476.0 17.4% $29,414 16.4%
Kentucky 4,118.2 8.0% 2,306.0 15.0% $27,293 18.9%
United States 290,789.0 11.9% 167,174.4 17.9% $32,322 15.6%
Source: U.S. Department of Commerce 2003.
278

Sample Refuges Descriptions
Activity Levels
West Tennessee Complex NWR had 487,500 visitors in 2004. The vast majority of recreation visits, 278,952 were for non-consumptive activities. About 67 percent of recreation visits were undertaken by area residents
Table 4-312. West Tennessee Complex NWR: 2004 Recreation Visits
Activity Residents Non-Residents Total
Non-Consumptive:
Nature Trails 126,378 84,252 210,630
Observation Platforms 26,415 2,935 29,350
Other Wildlife Observation 25,650 2,850 28,500
Beach /Water Use 45 5 50
Other Recreation 9,380 1,042 10,422
Hunting:
Big Game 8,502 5,668 14,170
Small Game 13,263 13,263 26,525
Migratory Birds 9,855 1,095 10,950
Fishing:
Freshwater 26,269 8,756 35,025
Saltwater 0 0 0
Total Visitation 245,757 119,866 365,622
Total Visitors 487,500
Regional Economic Analysis
The economic area for the Refuge is defined as Tipton, Obion, Lauderdale, and Lake counties in Tennessee and Fulton County in Kentucky. It is assumed that Refuge visitor expenditures occur primarily within this 5-county area.
Table 4-313 shows visitor recreation expenditures for the Refuge in 2004. Total expenditures were $4,818,900 with non-residents accounting for $3,486,600 (72 percent of total expenditures). Expenditures on non-consumptive activities accounted for 51 percent of the total, hunting 22 percent and fishing 27 percent.
279

Banking on Nature: The Economic Benefits to Local Communities of National Wildlife Refuge Visitation
Table 4-313. West Tennessee Complex NWR: Visitor Recreation Expenditures (2004 $,000)
Activity Residents Non-Residents Total
Non-Consumptive: $651.9 $1,810.9 $2,462.8
Hunting:
Big Game $110.9 $181.7 $292.6
Small Game $130.4 $489.9 $620.4
Migratory Birds $87.0 $46.8 $133.8
Total Hunting $328.3 $718.5 $1,046.8
Fishing:
Freshwater $352.1 $957.3 $1,309.3
Saltwater ─ ─ ─
Total Fishing $352.1 $957.3 $1,309.3
Total Expenditures $1,332.3 $3,486.6 $4,818.9
Table 4-314 summarizes the total economic impacts associated with refuge visitor spending. Total final demand was $6,044,100. This is the total monetary value of economic activity generated in the 5-county area by refuge visitor spending. In turn, this final demand generated 74 jobs (both full-time and part-time) with total job income of $1,650,400. Total tax revenue generated (county, state and Federal) amounted to $641,000.
Table 4-314. West Tennessee Complex NWR: Local Economic Effects Associated with Recreation Visits
(2004 $,000)Residents Non-Residents Total
Final Demand $1,668.2 $4,375.9 $6,044.1
Jobs 20.5 53.8 74.3
Job Income $453.1 $1,197.3 $1,650.4
Total Tax Revenue $176.8 $464.2 $641.0
Table 4-315 shows total economic effects (total recreation expenditures plus net economic value) compared with the refuge budget for 2004. For an individual, net economic value is that person's total willingness to pay for a particular recreation activity minus his or her actual expenditures for that activity. The figure for economic value is derived by multiplying net economic values for hunting, fishing, and non-consumptive recreation use (on a per-day basis) by estimated refuge visitor days for that activity. This figure is combined with the estimate of total expenditures and divided by the refuge budget for 2004. The $5.39 means that for every $1 of budget expenditures, $5.39 of total economic effects are
280

Sample Refuges Descriptions
associated with these budget expenditures. This ratio is provided only for the purpose of broadly comparing the magnitude of economic effects resulting from refuge visitation to budget expenditures and should not be interpreted as a benefit-cost ratio.
Table 4-315. West Tennessee Complex NWR: Summary of Local Economic Effects of Recreation Visits
(2004 $,000)
FY 2004 Budget
RecreationExpenditures
Net Economic Value
Total economic effects per $1 budget expenditure
West Tennessee Complex NWR
$1,956.9 $4,818.9 $5,728.8 $5.39
281

Banking on Nature: The Economic Benefits to Local Communities of National Wildlife Refuge Visitation
White River National Wildlife Refuge
Description
White River NWR, was established in 1935 for the protection of migratory birds. The refuge lies in the floodplain of the White River near where it meets the Mississippi River. White River NWR is one of the largest remaining bottomland hardwood forests in the Mississippi River Valley.
Approximately two-thirds of the bird species found in Arkansas can be seen at White River NWR. Many of these are neotropical migratory songbirds that use the refuge as a stopping point on their journey to and from central and south America. Arriving in early autumn and usually peaking in late December, mallards along with gadwalls, American widgeon, and greenwing teal find their way along that highway in the sky- the Mississippi Flyway. During some years, up to 350,000 birds will winter in these flooded bottomland hardwood forests.
Area Economy
The White River NWR is located in Phillips, Arkansas, Desha and Monroe counties in eastern Arkansas along the White River. The area had a population of 69,100 in 2003, a decline of 9.6 percent from 1993 compared with an 11.1 percent for the state of Arkansas and a 12 percent increase for the U.S. Total area employment declined by 3.4 percent from 1993 to 2003 compared with a 14.8 percent increase in Arkansas and an 18 percent increase in the U.S.
Per capita personal income increased in the area by 21.2 percent from 1993 to 2003. This compares with a 15 percent increase in Arkansas and a 15.6 percent increase in the U.S.
Table 4-316. White River NWR:Summary of Area Economy, 2003
(Population & Employment in 000’s; Per Capita Income in 2004 dollars)
Population Employment Per Capita Income
County 2003
Percent change
1993-2003 2003
Percent change
1993-2003 2003
Percent change
1993-2003
Phillips, AR 24.6 -12.3% 9.8 -14.3% $20,381 16.5%
Arkansas, AR 20.1 -5.5% 13.6 9.4% $27,204 20.0%
Desha, AR 14.7 -9.3% 7.4 -5.1% $21,647 27.9%
Monroe, AR 9.7 -11.5% 4.2 -7.8% $21,272 23.0%
Area Total 69.1 -9.6% 35.0 -3.4% $22,763 21.2%
Arkansas 2,727.8 11.1% 1,502.1 14.8% $25,042 15.0%
United States 290,789.0 11.9% 167,174.4 17.9% $32,322 15.6%
Source: U.S. Department of Commerce 2003.
282

Sample Refuges Descriptions
Activity Levels
White River NWR had 180,000 visitors in 2004. The vast majority of recreation visits, 410,387, were for non-consumptive activities. About 74 percent of recreation visits were undertaken by area residents.
Table 4-317. White River NWR: 2004 Recreation Visits
Activity Residents Non-Residents Total
Non-Consumptive:
Nature Trails 40,451 115,128 155,579
Observation Platforms 26 74 100
Other Wildlife Observation 16 44 60
Beach /Water Use 3,900 11,100 15,000
Other Recreation 62,308 177,340 239,648
Hunting:
Big Game 3,380 9,620 13,000
Small Game 5,239 14,911 20,150
Migratory Birds 6,240 17,760 24,000
Fishing:
Freshwater 16,900 48,100 65,000
Saltwater 0 0 0
Total Visitation 138,460 394,077 532,537
Total Visitors 180,000
Regional Economic Analysis
The economic area for the Refuge is defined as Phillips, Arkansas, Desha and Monroe counties in eastern Arkansas. It is assumed that Refuge visitor expenditures occur primarily within this 4-county area.
Table 4-93 shows visitor recreation expenditures for the Refuge in 2004. Total expenditures were $16,510,400 with non-residents accounting for $17,437,500 (93 percent of total expenditures). Expenditures on non-consumptive activities accounted for 88 percent of the total, hunting 7 percent and fishing 5 percent.
283

Banking on Nature: The Economic Benefits to Local Communities of National Wildlife Refuge Visitation
Table 4-318. White River NWR: Visitor Recreation Expenditures (2004 $,000)
Activity Residents Non-Residents Total
Non-Consumptive: $968.3 $15,542.1 $16,510.4
Hunting:
Big Game $29.4 $205.6 $235.0
Small Game $29.4 $314.8 $344.2
Migratory Birds $55.1 $759.1 $814.2
Total Hunting $113.9 $1,279.5 $1,393.4
Fishing:
Freshwater $226.5 $615.9 $842.4
Saltwater ─ ─ ─
Total Fishing $226.5 $615.9 $842.4
Total Expenditures $1,308.7 $17,437.5 $18,746.2
Table 4-319 summarizes the total economic impacts associated with refuge visitor spending. Total final demand was $22,953,900. This is the total monetary value of economic activity generated in the 4-county area by refuge visitor spending. In turn, this final demand generated 331 jobs (both full-time and part-time) with total job income of $7,341,300. Total tax revenue generated (county, state and Federal) amounted to $2,971,800.
Table 4-319. White River NWR: Local Economic Effects Associated with Recreation Visits (2004 $,000)
Residents Non-Residents Total
Final Demand $1,575.9 $21,377.9 $22,953.9
Jobs 23.7 307.9 331.6
Job Income $508.5 $6,832.9 $7,341.3
Total Tax Revenue $207.5 $2,764.3 $2,971.8
Table 4-320 shows total economic effects (total recreation expenditures plus net economic value) compared with the refuge budget for 2004. For an individual, net economic value is that person's total willingness to pay for a particular recreation activity minus his or her actual expenditures for that activity. The figure for economic value is derived by multiplying net economic values for hunting, fishing, and non-consumptive recreation use (on a per-day basis) by estimated refuge visitor days for that activity. This figure is combined with the estimate of total expenditures and divided by the refuge budget for 2004. The $21.69 means that for every $1 of budget expenditures, $21.69 of total economic effects are associated with these budget expenditures. This ratio is provided only for the purpose of broadly
284

Sample Refuges Descriptions
comparing the magnitude of economic effects resulting from refuge visitation to budget expenditures and should not be interpreted as a benefit-cost ratio.
Table 4-320. White River NWR: Summary of Local Economic Effects of Recreation Visits (2004 $,000)
FY 2004 Budget
RecreationExpenditures
Net Economic Value
Total economic effects per $1 budget expenditure
White River NWR
$1,454.1 $18,746.2 $12,792.0 $21.69
285

Banking on Nature: The Economic Benefits to Local Communities of National Wildlife Refuge Visitation
Region 5
Region 5 for the U.S. Fish & Wildlife Service includes Connecticut, District of Columbia, Delaware, Massachusetts, Maryland, Maine, New Hampshire, New Jersey, New York, Pennsylvania, Rhode Island, Virginia, and Vermont. Sample refuges selected within this region include:
Back Bay NWR (Virginia)Blackwater NWR (Maryland)
Bombay Hook NWR (Delaware)Canaan Valley NWR (West Virginia)
Cape May NWR (New Jersey)Edwin B. Forsythe NWR (New Jersey)
Erie NWR (Pennsylvania)Great Dismal Swamp NWR (Virginia)
Great Swamp NWR (New Jersey)Monomoy NWR (Massachusetts)Montezuma NWR (New York)
Moosehorn NWR (Maine)Parker River NWR (Massachusetts)Patuxent Research NWR (Maryland)
Prime Hook NWR (Delaware)Rachel Carson NWR (Maine)
286

Sample Refuges Descriptions
Back Bay National Wildlife Refuge
Description
Back Bay National Wildlife Refuge is located in Virginia and was established in 1938 to provide habitat for migrating and wintering waterfowl. The refuge contains more than 8,500 acres, situated around Back Bay, in the southeastern corner of the City of Virginia Beach. Because of its unique geographic location along the Atlantic Coast that provides overlapping ranges for both northern and southern species, biodiversity is high. Habitats include barrier island beach and dunes, shrub-scrub, woodlands, farm land and fresh and brackish marsh. Since 1939, an additional 4,600 acres of Bay waters within the refuge boundary have been closed to migratory bird hunting by Presidential Proclamation.
Today the Refuge continues to be an important link in the chain of National Wildlife Refuges along the Atlantic Flyway. More than 300 species of birds have been observed at the Refuge. During the fall and winter months, large flocks of waterfowl use the Bay and freshwater impoundments. The Snow and Canada goose, Tundra swan, and many duck species are abundant. Migrating songbirds and shorebirds arrive at the Refuge each spring and fall. Brightly colored warblers dot shrub and woodland areas while shorebirds search for food in shallow waters. Habitats are also used by a wide assortment of other wildlife, including such threatened and endangered species as the Loggerhead sea turtle, Piping plover, Peregrine falcon, and Bald eagle.
Area Economy
The Back Bay NWR is located in Virginia Beach (Independent City) in southeastern Virginia along the Atlantic coast. The area had a population of 436,000 in 2003, an increase of 3.9 percent from 1993 compared with a 13.1 percent increase for Virginia and a 12 percent increase for the U.S. Total area employment increased by 21.7 percent from 1993 to 2003 compared with a 19.2 percent increase in Virginia and a 18 percent increase in the U.S.
Per capita personal income increased in the area by 14.9 percent from 1993 to 2003. This compares with a 17.7 percent increase in Virginia and a 15.6 percent increase in the U.S.
287

Banking on Nature: The Economic Benefits to Local Communities of National Wildlife Refuge Visitation
Table 5-321. Back Bay NWR:Summary of Area Economy, 2003
(Population & Employment in 000’s; Per Capita Income in 2004 dollars)
Population Employment Per Capita Income
County 2003
Percent change
1993-2003 2003
Percent change
1993-2003 2003
Percent change
1993-2003Virginia Beach, VA 436.0 3.9% 236.9 21.7% $33,735 14.9%
Virginia 7,365.3 13.1% 4,480.9 19.2% $34,641 17.7%
United States 290,789.0 11.9% 167,174.4 17.9% $32,322 15.6%
Source: U.S. Department of Commerce 2003.
Activity Levels
Back Bay NWR had 31,000 visitors in 2004. The majority of recreation visits, 21,240, were for non-consumptive activities. About 73 percent of recreation visits were undertaken by area residents.
Table 5-322. Back Bay NWR: 2004 Recreation Visits
Activity Residents Non-Residents Total
Non-Consumptive:
Nature Trails 12,026 5,154 17,180
Observation Platforms 315 135 450
Other Wildlife Observation 280 70 350
Beach /Water Use 0 0 0
Other Recreation 2,282 978 3,260
Hunting:
Big Game 5,592 1,398 6,990
Small Game 0 0 0
Migratory Birds 891 99 990
Fishing:
Freshwater 520 130 650
Saltwater 0 0 0
Total Visitation 21,906 7,964 29,870
Total Visitors 31,000
288

Sample Refuges Descriptions
Regional Economic Analysis
The economic area for the Refuge is defined as Virginia Beach in Virginia. It is assumed that Refuge visitor expenditures occur primarily within this area.
Table 5-323 shows visitor recreation expenditures for the Refuge in 2004. Total expenditures were $344,900 with non-residents accounting for $210,300 (61 percent of total expenditures). Expenditures on non-consumptive activities accounted for 52 percent of the total, hunting 44 percent and fishing 4 percent.
Table 5-323. Back Bay NWR: Visitor Recreation Expenditures (2004 $,000)
Activity Residents Non-Residents Total
Non-Consumptive: $53.2 $124.7 $178.0
Hunting:
Big Game $70.9 $68.0 $138.9
Small Game ─ ─ ─
Migratory Birds $6.1 $5.3 $11.4
Total Hunting $77.0 $73.3 $150.3
Fishing:
Freshwater $4.4 $12.2 $16.6
Saltwater ─ ─ ─
Total Fishing $4.4 $12.2 $16.6
Total Expenditures $134.6 $210.3 $344.9
Table 5-324 summarizes the total economic impacts associated with refuge visitor spending. Total final demand was $485,000. This is the total monetary value of economic activity generated in the area by refuge visitor spending. In turn, this final demand generated 6 jobs (both full-time and part-time) with total job income of $147,200. Total tax revenue generated (county, state and Federal) amounted to $55,600.
Table 5-324. Back Bay NWR: Local Economic Effects Associated with Recreation Visits (2004 $,000)
Residents Non-Residents Total
Final Demand $188.2 $296.8 $485.0
Jobs 2.2 3.5 5.7
Job Income $57.1 $90.1 $147.2
Total Tax Revenue $21.7 $33.9 $55.6
289
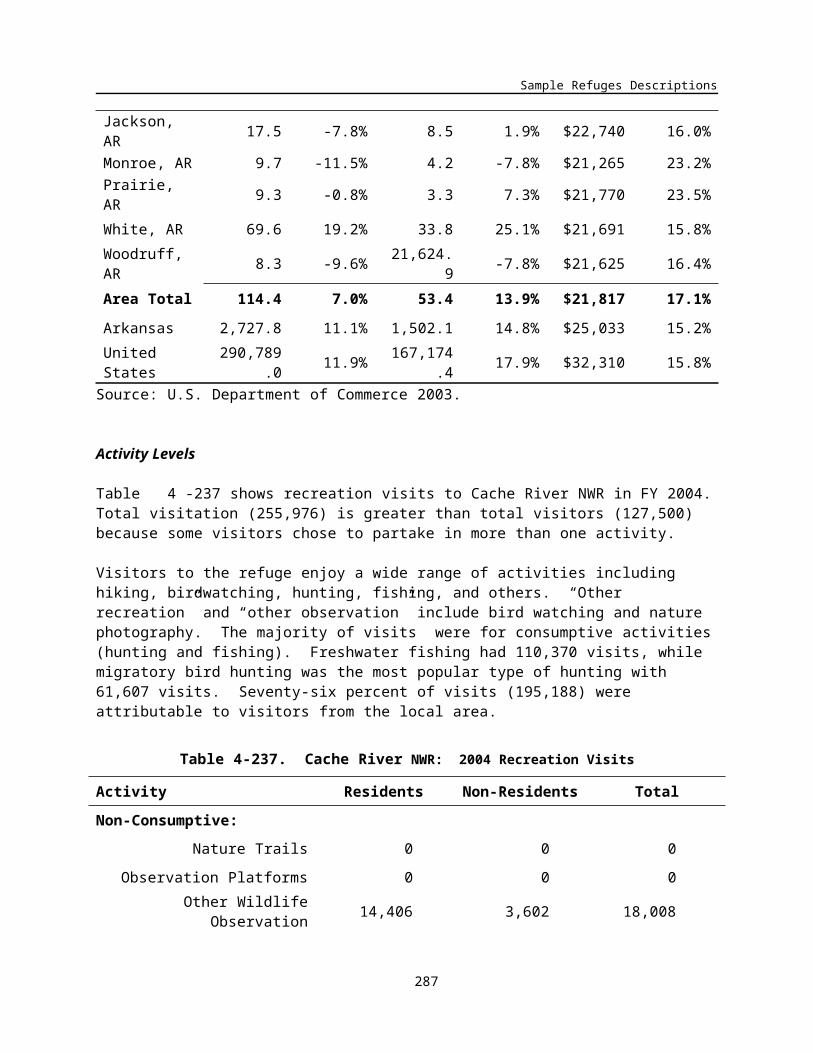
Banking on Nature: The Economic Benefits to Local Communities of National Wildlife Refuge Visitation
Table 5-325 shows total economic effects (total recreation expenditures plus net economic value) compared with the refuge budget for 2004. For an individual, net economic value is that person's total willingness to pay for a particular recreation activity minus his or her actual expenditures for that activity. The figure for economic value is derived by multiplying net economic values for hunting, fishing, and non-consumptive recreation use (on a per-day basis) by estimated refuge visitor days for that activity. This figure is combined with the estimate of total expenditures and divided by the refuge budget for 2004. The $0.68 means that for every $1 of budget expenditures, $0.68 of total economic effects are associated with these budget expenditures. This ratio is provided only for the purpose of broadly comparing the magnitude of economic effects resulting from refuge visitation to budget expenditures and should not be interpreted as a benefit-cost ratio.
Table 5-325. Back Bay NWR: Summary of Local Economic Effects of Recreation Visits (2004 $,000)
FY 2004 Budget
RecreationExpenditures
Net Economic Value
Total economic effects per $1 budget expenditure
Back Bay NWR
$1,611.5 $344.9 $743.3 $0.68
290

Sample Refuges Descriptions
Blackwater National Wildlife Refuge
Description
Blackwater National Wildlife Refuge, part of the Chesapeake Marshlands NWR Complex (Blackwater, Martin, Susquehanna and Eastern Neck NWR's) located 12 miles south of Cambridge, Maryland, was established in 1933 as a refuge for migratory waterfowl. The refuge includes more than 26,000 acres, composed mainly of rich tidal marsh characterized by fluctuating water levels and variable salinity. Other habitat types include freshwater ponds, mixed evergreen and deciduous forests, and small amounts of cropland and managed impoundments that are seasonally flooded for waterfowl use.
Originally established for migratory birds, primarily ducks and geese, Blackwater is one of the chief wintering areas for Canada Geese using the Atlantic Flyway. Geese number approximately 35,000 and ducks exceed 15,000 at the peak of fall migration, usually in November.
Blackwater is also haven for two of our nation's threatened or endangered species. The bald eagle (which has been upgraded from endangered to threatened) and Delmarva fox squirrels are regularly seen on the Refuge.
Area Economy
The Blackwater NWR is located in Dorchester County on the eastern shore of the Chesapeake Bay in Maryland. The area had a population of 30,600 in 2003, a decline of 0.4 percent from 1993 compared with a 10.9 percent increase for the state of Maryland and a 12 percent increase for the U.S. Total area employment increased by 4.1 percent from 1993 to 2003 compared with a 19 percent increase in Maryland and a 18 percent increase in the U.S.
Per capita personal income increased in the area by 16.4 percent from 1993 to 2003. This compares with a 18.8 percent increase in Maryland and a 15.6 percent increase in the U.S.
Activity Levels
Blackwater NWR had 148,825 visitors in 2004. The vast majority of recreation visits, over 165,000, were for non-consumptive activities. About 75 percent of recreation visits were undertaken by non-residents.
291

Banking on Nature: The Economic Benefits to Local Communities of National Wildlife Refuge Visitation
Table 5-326. Blackwater NWR:Summary of Area Economy, 2003
(Population & Employment in 000’s; Per Capita Income in 2004 dollars)
Population Employment Per Capita Income
County 2003
Percent change
1993-2003 2003
Percent change
1993-2003 2003
Percent change
1993-2003
Dorchester MD 30.6 -0.4% 16.4 4.1% $26,541 16.4%
Maryland 5,512.3 10.9% 3,187.1 19.0% $38,457 18.8%
United States 290,789.0 11.9% 167,174.4 17.9% $32,322 15.6%
Source: U.S. Department of Commerce 2003.
Table 5-327. Blackwater NWR: 2004 Recreation Visits
Activity Residents Non-Residents Total
Non-Consumptive:
Nature Trails 21,846 42,408 64,254
Observation Platforms 0 0 0
Other Wildlife Observation 20,241 80,965 101,206
Beach /Water Use 0 0 0
Other Recreation 0 0 0
Hunting:
Big Game 1,355 151 1,505
Small Game 466 52 518
Migratory Birds 0 0 0
Fishing:
Freshwater 77 9 86
Saltwater 980 8,820 9,800
Total Visitation 44,965 132,403 177,368
Total Visitors 148,825
292

Sample Refuges Descriptions
Regional Economic Analysis
The economic area for the Refuge is defined as Dorchester County in Maryland. It is assumed that Refuge visitor expenditures occur primarily within this area.
Table 5-328 shows visitor recreation expenditures for the Refuge in 2004. Total expenditures were $3,168,000 with non-residents accounting for $2,978,300 (94 percent of total expenditures). Expenditures on non-consumptive activities accounted for over 99 percent of all recreational spending on the Refuge.
Table 5-328. Chesapeake Marshlands NWR: Visitor Recreation Expenditures (2004 $,000)
Activity Residents Non-Residents Total
Non-Consumptive: $184.2 $2,974.1 $3,158.4
Hunting:
Big Game ─ ─ ─
Small Game $4.6 $2.1 $6.7
Migratory Birds ─ ─ ─
Total Hunting $4.6 $2.1 $6.7
Fishing:
Freshwater $0.8 $2.2 $3.0
Saltwater ─ ─ ─
Total Fishing $0.8 $2.2 $3.0
Total Expenditures $189.7 $2,978.3 $3,168.0
Table 5-329 summarizes the total economic impacts associated with refuge visitor spending. Total final demand was $3,879,500. This is the total monetary value of economic activity generated in the area by refuge visitor spending. In turn, this final demand generated 46 jobs (both full-time and part-time) with total job income of $1,049,900. Total tax revenue generated (county, state and Federal) amounted to $434,700.
Table 5-329. Chesapeake Marshlands NWR: Local Economic Effects Associated with Recreation Visits
(2004 $,000)Residents Non-Residents Total
Final Demand $304.6 $3,574.9 $3,879.5
Jobs 3.6 42.3 45.9
Job Income $81.5 $968.4 $1,049.9
293

Banking on Nature: The Economic Benefits to Local Communities of National Wildlife Refuge Visitation
Total Tax Revenue $35.2 $399.5 $434.7Table 5-330 shows total economic effects (total recreation expenditures plus net economic value) compared with the refuge budget for 2004. For an individual, net economic value is that person's total willingness to pay for a particular recreation activity minus his or her actual expenditures for that activity. The figure for economic value is derived by multiplying net economic values for hunting, fishing, and non-consumptive recreation use (on a per-day basis) by estimated refuge visitor days for that activity. This figure is combined with the estimate of total expenditures and divided by the refuge budget for 2004. The $2.84 means that for every $1 of budget expenditures, $2.84 of total economic effects are associated with these budget expenditures. This ratio is provided only for the purpose of broadly comparing the magnitude of economic effects resulting from refuge visitation to budget expenditures and should not be interpreted as a benefit-cost ratio.
Table 5-330. Chesapeake Marshlands NWR: Summary of Local Economic Effects of Recreation Visits
(2004 $,000)
FY 2004 Budget
RecreationExpenditures
Net Economic Value
Total economic effects per $1 budget expenditure
Blackwater NWR
$2,162.2 $3,032.0 $3,118.1 $2.84
294

Sample Refuges Descriptions
Bombay Hook National Wildlife Refuge
Description
Bombay Hook NWR comprises 15,978 acres, approximately four-fifths of which is tidal salt marsh. The refuge has one of the largest expanses of nearly unaltered tidal salt marsh in the mid-Atlantic region. It also includes 1,100 acres of impounded fresh water pools, brushy and timbered swamps, 1,100 acres of agricultural lands, and timbered and grassy upland. The general terrain is flat and less than ten feet above sea level.
Bombay Hook was established in 1937 as a link in the chain of refuges that extends from Canada to the Gulf of Mexico. It is primarily a refuge and breeding ground for migrating birds and other wildlife. The value and importance of Bombay Hook for the protection and conservation of waterfowl has increased greatly over the years, primarily due to the loss of extensive surrounding marshland to urban and industrial development.
Bombay Hook is one of many refuges providing critical habitat between Canada and the Gulf of Mexico. Its 16,000 acres include freshwater pools, swamps, upland forests, agricultural fields, and one of the largest unaltered tidal salt marshes in the Mid-Atlantic region.
Tidal salt marsh is the most valuable wildlife habitat in the State of Delaware. At 12,000 acres, Bombay Hook's salt marsh is one of the largest, untouched marshes on the east coast. With its intersecting tidal streams and rivers, it provides excellent natural habitat for the birds and mammals of the area. It also serves as a nursery and breeding area for marine organisms, many of which have sporting and commercial value.
Area Economy
The Bombay Hook NWR is located in Kent County in Delaware adjacent to Delaware Bay. New Castle County provides a significant source of refuge visitors and serves as one of the economic hubs in the area. The area had a population of 649,700 in 2003, an increase of 12 percent from 1993 compared with a 15.8 percent increase for the state of Delaware and a 12 percent increase for the U.S. Total area employment increased by 17.5 percent from 1993 to 2003 compared with a 19.4 percent increase in Delaware and a 18 percent increase in the U.S.
Per capita personal income increased in the area by 17.6 percent from 1993 to 2003. This compares with a 16.7 percent increase in Delaware and a 15.6 percent increase in the U.S.
Activity Levels
Bombay Hook NWR had 149,284 visitors in 2004. The vast majority of recreation visits, over 160,000, were for non-consumptive activities. About 80 percent of recreation visits were undertaken by non-residents.
295

Banking on Nature: The Economic Benefits to Local Communities of National Wildlife Refuge Visitation
Table 5-331. Bombay Hook NWR:Summary of Area Economy, 2003
(Population & Employment in 000’s; Per Capita Income in 2004 dollars)
Population Employment Per Capita Income
County 2003
Percent change
1993-2003 2003
Percent change
1993-2003 2003
Percent change
1993-2003New Castle, DE 515.1 11.4% 342.1 16.4% $39,679 17.8%
Kent, DE 134.1 14.1% 77.4 22.4% $27,152 17.4%
Area Total 649.7 12.0% 419.5 17.5% $37,084 17.6%
Delaware 818.2 15.8% 505.4 19.4% $35,122 16.7%
United States 290,789.0 11.9% 167,174.4 17.9% $32,322 15.6%
Source: U.S. Department of Commerce 2003.
Table 5-332. Bombay Hook NWR: 2004 Recreation Visits
Activity Residents Non-Residents Total
Non-Consumptive:
Nature Trails 29,857 119,427 149,284
Observation Platforms 2,087 8,349 10,436
Other Wildlife Observation 637 2,550 3,187
Beach /Water Use 0 0 0
Other Recreation 0 0 0
Hunting:
Big Game 553 98 650
Small Game 168 0 168
Migratory Birds 850 150 1,000
Fishing:
Freshwater 0 0 0
Saltwater 0 0 0
Total Visitation 33,599 130,574 164,173
Total Visitors 149,284
296
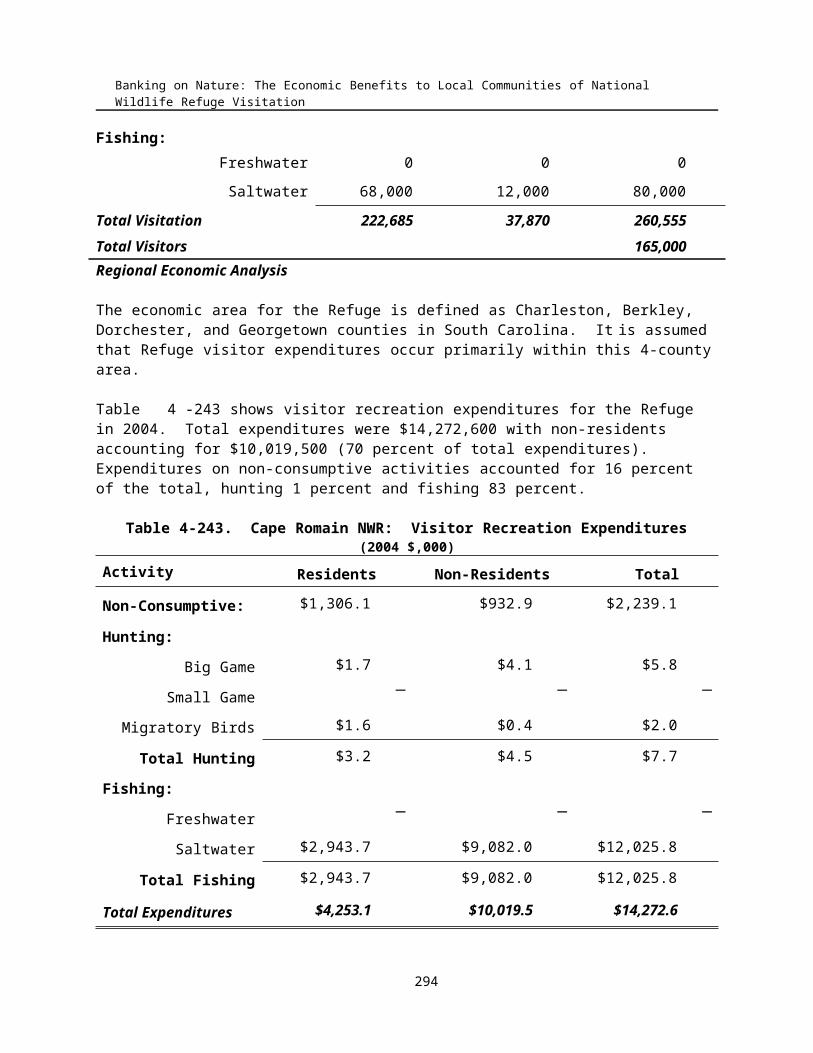
Sample Refuges Descriptions
Regional Economic Analysis
The economic area for the Refuge is defined as Kent and New Castle counties in Delaware. It is assumed that Refuge visitor expenditures occur primarily within this 2-county area.
Table 5-333 shows visitor recreation expenditures for the Refuge in 2004. Total expenditures were $3,166,800 with non-residents accounting for $3,009,800 (95 percent of total expenditures). Expenditures on non-consumptive activities accounted for 99 percent of the total with hunting accounting for 1 percent.
Table 5-333. Bombay Hook NWR: Visitor Recreation Expenditures (2004 $,000)
Activity Residents Non-Residents Total
Non-Consumptive: $135.8 $2,990.8 $3,126.6
Hunting:
Big Game $12.2 $8.3 $20.5
Small Game $1.3 ─ $1.3
Migratory Birds $7.7 $10.7 $18.4
Total Hunting $21.2 $19.0 $40.2
Fishing:
Freshwater ─ ─ ─
Saltwater ─ ─ ─
Total Fishing ─ ─ ─
Total Expenditures $157.0 $3,009.8 $3,166.8
Table 5-334 summarizes the total economic impacts associated with refuge visitor spending. Total final demand was $4,316,600. This is the total monetary value of economic activity generated in the 2-county area by refuge visitor spending. In turn, this final demand generated 37 jobs (both full-time and part-time) with total job income of $1,387,400. Total tax revenue generated (county, state and Federal) amounted to $855,000.
Table 5-334. Bombay Hook NWR: Local Economic Effects Associated with Recreation Visits (2004 $,000)
Residents Non-Residents Total
Final Demand $213.3 $4,103.3 $4,316.6
Jobs 1.8 35.3 37.2
Job Income $67.1 $1,320.3 $1,387.4
Total Tax Revenue $42.4 $812.6 $855.0
297

Banking on Nature: The Economic Benefits to Local Communities of National Wildlife Refuge Visitation
Table 5-335 shows total economic effects (total recreation expenditures plus net economic value) compared with the refuge budget for 2004. For an individual, net economic value is that person's total willingness to pay for a particular recreation activity minus his or her actual expenditures for that activity. The figure for economic value is derived by multiplying net economic values for hunting, fishing, and non-consumptive recreation use (on a per-day basis) by estimated refuge visitor days for that activity. This figure is combined with the estimate of total expenditures and divided by the refuge budget for 2004. The $7.29 means that for every $1 of budget expenditures, $7.29 of total economic effects are associated with these budget expenditures. This ratio is provided only for the purpose of broadly comparing the magnitude of economic effects resulting from refuge visitation to budget expenditures and should not be interpreted as a benefit-cost ratio.
Table 5-335. Bombay Hook NWR: Summary of Local Economic Effects of Recreation Visits (2004 $,000)
FY 2004 Budget
RecreationExpenditures
Net Economic Value
Total economic effects per $1 budget expenditure
Bombay Hook NWR
$815.1 $3,166.8 $2,772.0 $7.29
298

Sample Refuges Descriptions
Canaan Valley National Wildlife Refuge
Description
Canaan Valley NWR is located in Tucker County, West Virginia. The refuge was established in 1994 to preserve the unique wetlands and uplands of this high elevation, moist valley. Currently, the refuge consists of 15,245 acres.
Canaan Valley, at an altitude of 3,200 feet, is 14 miles long and 3 miles wide, and the highest valley of its size east of the Rocky Mountains. Climate and habitats are typical of areas much further north, and the plants and animals are unusual for the latitude. Many Valley species are at or near the southernmost edge of their ranges. Drained by the Blackwater River and its tributaries, Canaan Valley contains the largest freshwater wetland area in West Virginia and the central and southern Appalachians.
Area Economy
The Canaan Valley NWR is located in Tucker County in West Virginia. Marion and Monongalia counties provide a significant number of refuge visitors and comprise an additional economic hub for the area. The area had a population of 147,400 in 2003, an increase of 1.6 percent from 1993 compared with a 0.3 percent decline for the state of West Virginia and a 12 percent increase for the U.S. Total area employment increased by 15.8 percent from 1993 to 2003 compared with a 9.6 percent increase in West Virginia and a 18 percent increase in the U.S.
Per capita personal income increased in the area by 23.5 percent from 1993 to 2003. This compares with a 16.3 percent increase in West Virginia and a 15.6 percent increase in the U.S.
Table 5-336. Canaan Valley NWR:Summary of Area Economy, 2003
(Population & Employment in 000’s; Per Capita Income in 2004 dollars)
Population Employment Per Capita Income
County 2003
Percent change
1993-2003 2003
Percent change
1993-2003 2003
Percent change
1993-2003Monongalia, WV 83.7 5.9% 55.2 17.9% $28,432 22.5%
Marion, WV 56.5 -3.2% 26.8 13.1% $25,852 24.4%
Tucker, WV 7.1 -7.2% 3.8 5.9% $22,420 20.6%
Area Total 147.4 1.6% 85.8 15.8% $27,151 23.5%
West Virginia 1,811.4 -0.3% 883.9 9.6% $25,205 16.3%
United States 290,789.0 11.9% 167,174.4 17.9% $32,322 15.6%
Source: U.S. Department of Commerce 2003.
299

Banking on Nature: The Economic Benefits to Local Communities of National Wildlife Refuge Visitation
Activity Levels
Canaan Valley NWR had 22,000 visitors in 2004. The vast majority of recreation visits, 27,530, were for non-consumptive activities. About 74 percent of recreation visits were undertaken by non-residents residents.
Table 5-337. Canaan Valley NWR: 2004 Recreation Visits
Activity Residents Non-Residents Total
Non-Consumptive:
Nature Trails 4,249 12,746 16,995
Observation Platforms 113 338 450
Other Wildlife Observation 326 109 435
Beach /Water Use 0 0 0
Other Recreation 2,413 7,238 9,650
Hunting:
Big Game 98 653 750
Small Game 65 435 500
Migratory Birds 46 305 350
Fishing:
Freshwater 500 500 1,000
Saltwater 0 0 0
Total Visitation 7,808 22,322 30,130
Total Visitors 22,000
Regional Economic Analysis
The economic area for the Refuge is defined as Tucker, Marion and Monongalia counties in West Virginia. It is assumed that Refuge visitor expenditures occur primarily within this 3-county area.
Table 5-18 shows visitor recreation expenditures for the Refuge in 2004. Total expenditures were $452,700 with non-residents accounting for $425,400 (94 percent of total expenditures). Expenditures on non-consumptive activities accounted for 86 percent of the total, hunting 12 percent and fishing 2 percent.
300

Sample Refuges Descriptions
Table 5-338. Canaan Valley NWR: Visitor Recreation Expenditures (2004 $,000)
Activity Residents Non-Residents Total
Non-Consumptive: $23.1 $365.3 $388.4
Hunting:
Big Game $0.9 $23.8 $24.7
Small Game $0.5 $12.9 $13.4
Migratory Birds $0.3 $16.4 $16.7
Total Hunting $1.7 $53.0 $54.8
Fishing:
Freshwater $2.5 $7.1 $9.6
Saltwater ─ ─ ─
Total Fishing $2.6 $7.1 $9.6
Total Expenditures $27.3 $425.4 $452.7
Table 5-339 summarizes the total economic impacts associated with refuge visitor spending. Total final demand was $611,000. This is the total monetary value of economic activity generated in the 3-county area by refuge visitor spending. In turn, this final demand generated 9 jobs (both full-time and part-time) with total job income of $158,500. Total tax revenue generated (county, state and Federal) amounted to $105,800.
Table 5-339. Canaan Valley NWR: Local Economic Effects Associated with Recreation Visits (2004 $,000)
Residents Non-Residents Total
Final Demand $36.8 $574.2 $611.0
Jobs 0.5 8.1 8.6
Job Income $9.5 $149.0 $158.5
Total Tax Revenue $6.5 $99.3 $105.8
Table 5-340 shows total economic effects (total recreation expenditures plus net economic value) compared with the refuge budget for 2004. For an individual, net economic value is that person's total willingness to pay for a particular recreation activity minus his or her actual expenditures for that activity. The figure for economic value is derived by multiplying net economic values for hunting, fishing, and non-consumptive recreation use (on a per-day basis) by estimated refuge visitor days for that activity. This figure is combined with the estimate of total expenditures and divided by the refuge budget for 2004. The $1.19 means that for every $1 of budget expenditures, $1.19 of total economic effects are associated with these budget expenditures. This ratio is provided only for the purpose of broadly
301

Banking on Nature: The Economic Benefits to Local Communities of National Wildlife Refuge Visitation
comparing the magnitude of economic effects resulting from refuge visitation to budget expenditures and should not be interpreted as a benefit-cost ratio.
Table 5-340. Canaan Valley NWR: Summary of Local Economic Effects of Recreation Visits (2004 $,000)
FY 2004 Budget
RecreationExpenditures
Net Economic Value
Total economic effects per $1 budget expenditure
Canaan Valley NWR
$745.2 $452.7 $432.2 $1.19
302
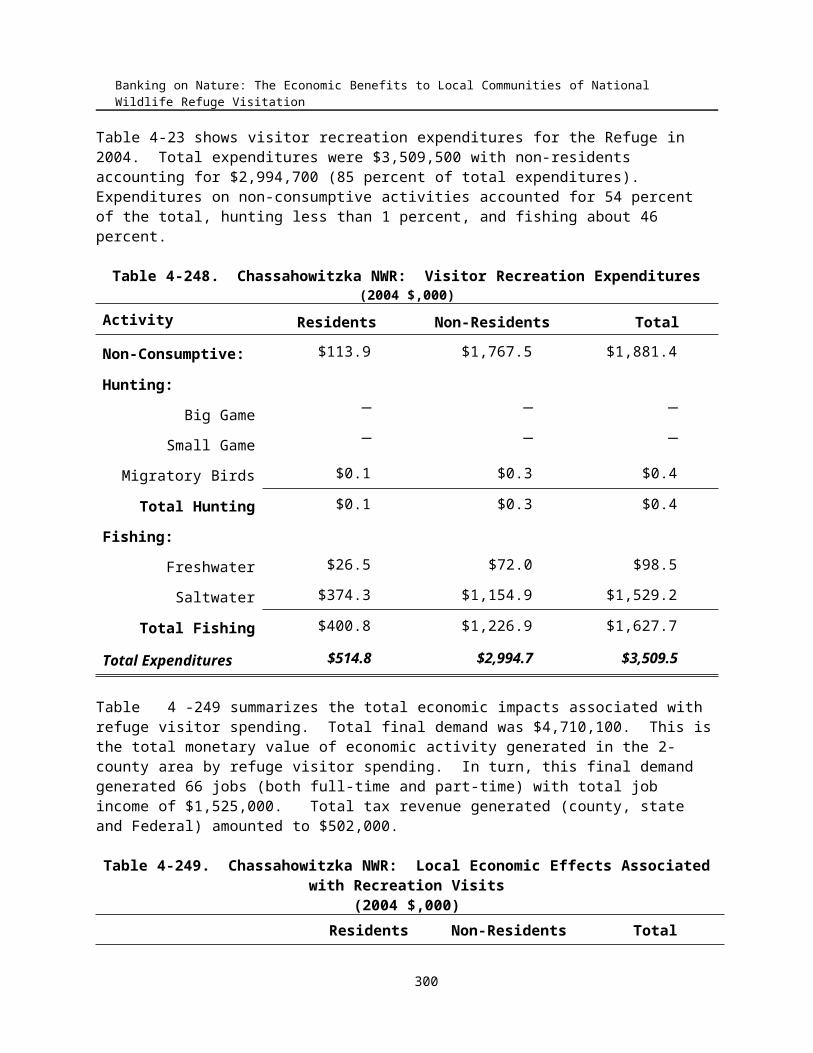
Sample Refuges Descriptions
Cape May National Wildlife Refuge
Description
The Cape May National Wildlife Refuge is strategically located to conserve habitat for hundreds of thousands of migratory birds which pass through the area each year. As the New Jersey Coast and the Cape May Peninsula witness the loss of natural habitat, the refuge, in concert with various partners, is working to ensure that important habitats are preserved. These efforts will provide opportunities for future generations of Americans to enjoy the spectacular concentrations of shorebirds, songbirds, raptors, and waterfowl which have made the Cape May area famous for birdwatching.
These areas are considered so important that refuge lands are included in the North American Waterfowl Management Plan, a "Ramsar" Wetland of International Importance, part of the Western Hemisphere Shorebird Reserve Network, the Pinelands National Reserve, an Important Bird Area, within the Great Egg Harbor National Scenic and Recreational River, and a destination on the New Jersey Coastal Heritage Trail Route.
Cape May National Wildlife Refuge was established in October 1989 for use as a sanctuary and for management for migratory birds, the development, advancement, management, conservation, and protection of fish and wildlife resources, and for the conservation of wetlands. The first piece of land was purchased from The Nature Conservancy which was a 90 acre tract. Since then, the refuge has acquired over 11,000 acres from willing sellers and hopes to acquire approximately 21,000 acres through the land acquisition program.
Area Economy
The Cape May NWR is located in Cape May County in southeastern New Jersey. Ocean and Atlantic counties contribute a significant number of refuge visitors and serve as an additional economic hub for the area (Table 5-341). The area had a population of 912,300 in 2003, an increase of 16.1 percent from 1993 compared with a 8.7 percent increase for the state of New Jersey and a 12 percent increase for the U.S. Total area employment increased by 21.1 percent increase from 1993 to 2003 compared with a 13.9 percent increase in New Jersey and a 18 percent increase in the U.S.
Per capita personal income increased in the area by 9.1 percent from 1993 to 2003. This compares with a 15.7 percent increase in New Jersey and a 15.6 percent increase in the U.S.
Activity Levels
Cape May NWR had 26,000 visitors in 2004. The majority of recreation visits, 14,800, were for non-consumptive activities. About 56 percent of recreation visits were undertaken by non-residents.
303

Banking on Nature: The Economic Benefits to Local Communities of National Wildlife Refuge Visitation
Table 5-341. Cape May NWR:Summary of Area Economy, 2003
(Population & Employment in 000’s; Per Capita Income in 2004 dollars)
Population Employment Per Capita Income
County 2003
Percent change
1993-2003 2003
Percent change
1993-2003 2003
Percent change
1993-2003
Ocean, NJ 546.6 20.7% 199.6 27.7% $32,640 11.6%
Atlantic, NJ 263.9 12.6% 176.7 13.7% $32,606 1.2%
Cape May, NJ 101.8 304% 59.0 23.3% $35,314 18.4%
Area Total 912.3 16.1% 435.2 21.1% $32,929 9.1%
New Jersey 8,642.4 8.7% 4,817.4 13.9% $40,646 15.7%
United States 290,789.0 11.9% 167,174.4 17.9% $32,322 15.6%
Source: U.S. Department of Commerce 2003.
Table 5-342. Cape May NWR: 2004 Recreation Visits
Activity Residents Non-Residents Total
Non-Consumptive:
Nature Trails 2,850 6,650 9,500
Observation Platforms 150 350 500
Other Wildlife Observation 1,440 3,360 4,800
Beach /Water Use 0 0 0
Other Recreation 0 0 0
Hunting:
Big Game 1800 200 2000
Small Game 0 0 0
Migratory Birds 440 110 550
Fishing:
Freshwater 0 0 0
Saltwater 3,600 2,400 6,000
Total Visitation 10,280 13,070 23,350
Total Visitors 26,000
304

Sample Refuges Descriptions
Regional Economic Analysis
The economic area for the Refuge is defined as Cape May, Atlantic, and Ocean counties in Delaware. It is assumed that Refuge visitor expenditures occur primarily within this 3-county area.
Table 1-3 shows visitor recreation expenditures for the Refuge in 2004. Total expenditures were $336,700 with non-residents accounting for $235,100 (71 percent of total expenditures). Expenditures on non-consumptive activities accounted for 23 percent of the total, hunting 45 percent and fishing 33 percent.
Table 5-343. Cape May NWR: Visitor Recreation Expenditures (2004 $,000)
Activity Residents Non-Residents Total
Non-Consumptive: $9.7 $124.9 $134.6
Hunting:
Big Game $17.1 $7.3 $24.4
Small Game ─ ─ ─
Migratory Birds $2.0 $3.9 $5.9
Total Hunting $19.1 $11.2 $30.3
Fishing:
Freshwater ─ ─ ─
Saltwater $72.7 $99.0 $171.8
Total Fishing $72.7 $99.0 $171.8
Total Expenditures $101.6 $235.1 $336.7
Table 5-344 summarizes the total economic impacts associated with refuge visitor spending. Total final demand was $489,200. This is the total monetary value of economic activity generated in the 3-county area by refuge visitor spending. In turn, this final demand generated 5 jobs (both full-time and part-time) with total job income of 139,800. Total tax revenue generated (county, state and Federal) amounted to $62,700.
Table 5-344. Cape May NWR: Local Economic Effects Associated with Recreation Visits (2004 $,000)
Residents Non-Residents Total
Final Demand $148.3 $340.9 $489.2
Jobs 1.4 3.2 4.6
Job Income $43.2 $96.6 $139.8
Total Tax Revenue $19.1 $43.6 $62.7
305

Banking on Nature: The Economic Benefits to Local Communities of National Wildlife Refuge Visitation
Table 5-345 shows total economic effects (total recreation expenditures plus net economic value) compared with the refuge budget for 2004. For an individual, net economic value is that person's total willingness to pay for a particular recreation activity minus his or her actual expenditures for that activity. The figure for economic value is derived by multiplying net economic values for hunting, fishing, and non-consumptive recreation use (on a per-day basis) by estimated refuge visitor days for that activity. This figure is combined with the estimate of total expenditures and divided by the refuge budget for 2004. The $1.14 means that for every $1 of budget expenditures, $1.14 of total economic effects are associated with these budget expenditures. This ratio is provided only for the purpose of broadly comparing the magnitude of economic effects resulting from refuge visitation to budget expenditures and should not be interpreted as a benefit-cost ratio.
Table 5-345. Cape May NWR: Summary of Local Economic Effects of Recreation Visits (2004 $,000)
FY 2004 Budget
RecreationExpenditures
Net Economic Value
Total economic effects per $1 budget expenditure
Cape May NWR
$614.7 $336.7 $362.3 $1.14
306

Sample Refuges Descriptions
Edwin B. Forsythe National Wildlife Refuge
Description
Forsythe NWR, located 10 miles north of Atlantic City, is composed of two separate Divisions, Barnegat in the north and Brigantine in the south. The Brigantine and Barnegat Divisions were originally two distinct refuges, established in 1939 and 1967 respectively, to provide important wintering habitat for waterfowl, especially black ducks and Atlantic brant. The Divisions were combined in 1984 under the Edwin B. Forsythe name, in honor of the late conservationist Congressman from New Jersey.
The refuge complex covers approximately 46,000 acres in three counties including Atlantic, Burlington, and Ocean.
Nearly 80 percent of Forsythe Refuge is tidal salt meadow and marsh, interspersed with shallow coves and bays. Most of the remainder of the refuge acreage is woodlands dominated by pitch pines, oaks, and white cedar, with some fields which are maintained to provide habitat diversity. More than 6,000 acres are designated as Wilderness Area. This includes Holgate and Little Beach, two of the few remaining undeveloped barrier beaches in New Jersey. These pristine sites provide critical nesting habitat for threatened piping plovers and a wide variety of other beachnesting species. Beaches and dunes provide nesting habitat for piping plovers, black skimmers and least terns. Occasionally peregrine falcons, bald eagles and osprey are seen.
Each spring and fall, thousands of water birds stop at Forsythe Refuge during their long migrations. Waterfowl, wading birds, and shore birds may be viewed from the Wildlife Drive as they feed and rest. Refuge uplands also provide important stopover habitat for migrating passerines.
Forsythe is a Western Hemisphere Shorebird Reserve Network site, a Wetlands of International Importance site under the Ramsar Convention, and an important birding area. It also is a part of The Jacques Cousteau National Estuarine Research Reserve and The New Jersey Coastal Heritage Trail. In 2002 the refuge was the recipient of the New Jersey Governor's Eco-Tourism Award.
Area Economy
The Edwin B. Forsythe NWR is located in Atlantic, Burlington and Ocean counties in eastern New Jersey on the Atlantic coast. The area had a population of 1,255,400 in 2003, an increase of 15.2 percent from 1993 compared with a 8.7 percent increase for the state of New Jersey and a 12 percent increase for the U.S. Total area employment increased by 23.6 percent from 1993 to 2003 compared with a 13.9 percent increase in Nevada and a 18 percent increase in the U.S.
Per capita personal income increased in the area by 12.6 percent from 1993 to 2003. This compares with a 15.7 percent increase in New jersey and a 15.6 percent increase in the U.S.
307

Banking on Nature: The Economic Benefits to Local Communities of National Wildlife Refuge Visitation
Table 5-346. Edwin B. Forsythe NWR:Summary of Area Economy, 2003
(Population & Employment in 000’s; Per Capita Income in 2004 dollars)
Population Employment Per Capita Income
County 2003
Percent change
1993-2003 2003
Percent change
1993-2003 2003
Percent change
1993-2003
Ocean, NJ 546.6 20.7% 199.6 27.7% $32,640 11.6%
Burlington, NJ 444.9 10.5% 252.9 28.2% $38,107 21.1%
Atlantic, NJ 263.9 12.6% 176.7 13.7% $32,606 1.2%
Area Total 1,255.4 15.2% 629.1 23.6% $34,571 12.6%
New Jersey 8,642.4 8.7% 4,817.4 13.9% $40,646 15.7%
United States 290,789.0 11.9% 167,174.4 17.9% $32,322 15.6%
Source: U.S. Department of Commerce 2003.
308

Sample Refuges Descriptions
Activity Levels
Edwin B. Forsythe NWR had 250,000 visitors in 2004. The majority of recreation visits, 281,549, were for non-consumptive activities. About 62 percent of recreation visits were undertaken by area residents.
Table 5-347. Edwin B. Forsythe NWR: 2004 Recreation Visits
Activity Residents Non-Residents Total
Non-Consumptive:
Nature Trails 55,583 166,748 222,330
Observation Platforms 4,583 10,693 15,276
Other Wildlife Observation 19,096 6,365 25,461
Beach /Water Use 1,123 374 7,921
Other Recreation 7,921 2,640 10,561
Hunting:
Big Game 1,541 81 1,622
Small Game 252 0 252
Migratory Birds 990 110 1,100
Fishing:
Freshwater 189,126 0 189,126
Saltwater 46,814 15,605 62,418
Total Visitation 327,027 202,616 529,643
Total Visitors 250,000
Regional Economic Analysis
The economic area for the Refuge is defined as Atlantic, Burlington and Ocean counties in New Jersey. It is assumed that Refuge visitor expenditures occur primarily within this 3-county area.
Table 5-348 shows visitor recreation expenditures for the Refuge in 2004. Total expenditures were $9,384,000 with non-residents accounting for $6,812,000 (73 percent of total expenditures). Expenditures on non-consumptive activities accounted for 25 percent of the total, hunting less than one percent, and fishing 74 percent.
309

Banking on Nature: The Economic Benefits to Local Communities of National Wildlife Refuge Visitation
Table 5-348. Edwin B. Forsythe NWR: Visitor Recreation Expenditures (2004 $,000)
Activity Residents Non-Residents Total
Non-Consumptive: $168.6 $2,206.6 $2,375.2
Hunting:
Big Game $17.1 $3.5 $20.6
Small Game $0.9 ─ $0.9
Migratory Birds $6.7 $5.9 $12.6
Total Hunting $24.8 $9.3 $34.1
Fishing:
Freshwater $959.8 $2,664.7 $3,624.5
Saltwater $1,418.8 $1,931.4 $3,350.2
Total Fishing $2,378.6 $4,596.1 $6,974.7
Total Expenditures $2,572.0 $6,812.0 $9,384.0
Table 5-349 summarizes the total economic impacts associated with refuge visitor spending. Total final demand was $14,418,600. This is the total monetary value of economic activity generated in the 3-county area by refuge visitor spending. In turn, this final demand generated 128 jobs (both full-time and part-time) with total job income of $4,251,100. Total tax revenue generated (county, state and Federal) amounted to $513,800.
Table 5-349. Edwin B. Forsythe NWR: Local Economic Effects Associated with Recreation Visits (2004 $,000)
Residents Non-Residents Total
Final Demand $3,969.5 $10,449.1 $14,418.6
Jobs 36.6 91.4 128.0
Job Income $1,195.8 $3,055.2 $4,251.1
Total Tax Revenue $512.5 $1.4 $513.8
Table 5-350 shows total economic effects (total recreation expenditures plus net economic value) compared with the refuge budget for 2004. For an individual, net economic value is that person's total willingness to pay for a particular recreation activity minus his or her actual expenditures for that activity. The figure for economic value is derived by multiplying net economic values for hunting, fishing, and non-consumptive recreation use (on a per-day basis) by estimated refuge visitor days for that activity. This figure is combined with the estimate of total expenditures and divided by the refuge budget for 2004. The $13.52 means that for every $1 of budget expenditures, $13.52 of total economic effects are associated with these budget expenditures. This ratio is provided only for the purpose of broadly
310

Sample Refuges Descriptions
comparing the magnitude of economic effects resulting from refuge visitation to budget expenditures and should not be interpreted as a benefit-cost ratio.
Table 5-350. Edwin B. Forsythe NWR: Summary of Local Economic Effects of Recreation Visits (2004 $,000)
FY 2004 Budget
RecreationExpenditures
Net Economic Value
Total economic effects per $1 budget expenditure
Edwin B. Forsythe NWR
$1,267.1 $9,384.0 $7,748.4 $13.52
311

Banking on Nature: The Economic Benefits to Local Communities of National Wildlife Refuge Visitation
Erie National Wildlife Refuge
Description
Erie National Wildlife Refuge is located in Crawford County, 35 miles south of the City of Erie and 10 miles east of Meadville on the outskirts of Guys Mills village. The refuge consists of two separate land units. The Sugar Lake Division, containing 5,206 acres, is the unit closest to Guys Mills. The Seneca Division, containing 3,571 acres, is 10 miles north of the Sugar Lake Division and borders French Creek near Cambridge Springs.
The diverse habitat types found on Erie NWR attract over 237 species of birds, 47 species of mammals and 37 species of amphibians and reptiles. Waterfowl migrations occur from March to early April and again from September to November.
The primary objective of the refuge is to provide waterfowl and other migratory birds with nesting, feeding, brooding, and resting habitat. Other objectives are to provide habitat to support a diversity of wildlife species and to enhance opportunities for wildlife-oriented public recreation and environmental education.
Area Economy
The area economy includes Crawford and Erie Counties in Pennsylvania (Table 5-351). While the refuge is encompassed within Crawford County, Erie County is the economic hub of the area.
From 1993 to 2003, the area population increased 1.2 percent to 373,100 people. While this rate of increase is comparable with Pennsylvania (2.1 percent), it is much less than the United States (11.9 percent). During the same time period, area employment increased 6.7 percent. In 2003, average per capita income for the area was $25,502, which was below both Pennsylvania ($32,761) and the United States ($32,310)
Table 5-351. Erie NWR:Summary of Area Economy, 2003
(Population & Employment in 000’s; Per Capita Income in 2004 dollars)
Population Employment Per Capita Income
County 2003
Percent change
1993-2003 2003
Percent change
1993-2003 2003
Percent change
1993-2003
Crawford, PA 90.1 2.6% 44.3 10.6% $23,359 7.8%
Erie, PA 283.0 0.8% 158.4 5.7% $26,184 4.7%
Area Total 373.1 1.2% 202.7 6.7% $25,502 5.3%Pennsylvania 12,370.8 2.1% 6,969.4 10.6% $32,761 15.3%
United States 290,789.0 11.9% 167,174.4 17.9% $32,310 15.8%
Source: U.S. Department of Commerce 2003.
312

Sample Refuges Descriptions
Activity Levels
Recreation visits totaled 23,759 visits in FY 2004 (Table 5-352). Most of the visits were due to visitors using the nature trails (10,607 visits) or hunting (6,444 visits). Eleven small game species, eight migratory bird species and three big game species are hunted during the various seasons that occur from September 1 through the end of February. The most popular include deer, turkey, rabbit, and waterfowl hunting. There were 10,262 visits by visitors from the local area, and there were 13,497 visits by non-residents.
Table 5-352. Erie NWR: 2004 Recreation Visits
Activity Residents Non-Residents Total
Non-Consumptive:
Nature Trails 2,652 7,955 10,607
Observation Platforms 81 242 322
Other Wildlife Observation 877 2,632 3,509
Beach /Water Use 0 0 0
Other Recreation 467 156 622
Hunting:
Big Game 2,592 864 3,456
Small Game 1,226 409 1,635
Migratory Birds 677 677 1,353
Fishing:
Freshwater 1,691 564 2,255
Saltwater 0 0 0
Total Visitation 10,262 13,497 23,759
Total Visitors 31,544
313

Banking on Nature: The Economic Benefits to Local Communities of National Wildlife Refuge Visitation
Regional Economic Analysis
In FY 2004, non-consumptive activities, hunting, and fishing generated $278,500 in visitor recreation expenditures (Table 5-353). Residents accounted for 23 percent of spending ($63,600), while non-residents accounted for 77 percent of spending ($214,900).
Table 5-353. Erie NWR: Visitor Recreation Expenditures (2004 $,000)
Activity Residents Non-Residents Total
Non-Consumptive: $8.2 $127.6 $135.7
Hunting:
Big Game $32.3 $41.2 $73.5
Small Game $9.0 $11.9 $20.8
Migratory Birds $3.0 $23.8 $26.8
Total Hunting $44.2 $76.9 $121.1
Fishing:
Freshwater $11.2 $10.4 $21.6
Saltwater ─ ─ ─
Total Fishing $11.2 $10.4 $21.6
Total Expenditures $63.6 $214.9 $278.5
Table 5-354 summarizes the economic effects associated with recreation visits in FY 2004. Total final demand associated with recreational visitor spending was $406,300. In turn, this final demand generated 7 jobs, $140,200 in job income, and $57,600 in total tax revenue.
Table 5-354. Erie NWR: Local Economic Effects Associated with Recreation Visits (2004 $,000)
Residents Non-Residents Total
Final Demand $95.0 $311.3 $406.3
Jobs 2 5 7
Job Income $32.6 $107.6 $140.2
Total Tax Revenue $12.5 $45.2 $57.6
Table 5-355 compares the refuge budget and the local economic effects of recreation visits. In FY 2004, recreational benefits (recreation-related expenditures plus net economic value) totaled about $752,000, and budget expenditures summed to $864,000. Comparing these two estimates shows that for every $1 of budget expenditures, $0.87 in recreational benefits are derived. This ratio is provided to broadly compare the magnitude of the two estimates and should not be used as a benefit-cost ratio. In addition to
314

Sample Refuges Descriptions
recreational benefits, Erie NWR provides a variety of other benefits including ecological and educational values which are not quantified in this analysis. Furthermore, the budget contributes an additional stimulus to the local economy.
Table 5-355. Erie NWR: Summary of Local Economic Effects of Recreation Visits (2004 $,000)
FY 2004 Budget
RecreationExpenditures
Net Economic Value
Total economic effects per $1 budget expenditure
Erie NWR $864.0 $278.5 $473.4 $0.87
315

Banking on Nature: The Economic Benefits to Local Communities of National Wildlife Refuge Visitation
Great Dismal Swamp National Wildlife Refuge
Description
The Great Dismal Swamp NWR is located in southeastern Virginia and northeastern North Carolina. It includes over 111,000-acres of forested wetlands, with Lake Drummond, a 3,100-acre lake, at its heart. The Great Dismal Swamp has long been considered a place of natural beauty, mystery, and legend. The swamp is an integral part of the cultural history of the region and remains a place of refuge for both wildlife and people.
The primary purpose of the refuge's resource management programs is to restore and maintain the natural biological diversity that existed prior to the human-caused alterations. Essential to the swamp ecosystem are its water resources, native vegetative communities, and varied wildlife species. Water is being conserved and managed by placing water control structures in the ditches. Plant community diversity is being restored and maintained through forest management activities which stimulate the ecological effects of wildfires. Wildlife is managed by insuring the presence of required habitats, with hunting used to balance some wildlife populations with available food supplies.
The Dismal Swamp Canal, operated by the Army Corps of Engineers makes up the eastern boundary of the refuge. On the western side of the refuge, two trail entrances, Jericho and Washington Ditch, provide access to some of the 100 miles of hiking trails in the refuge.
The Great Dismal Swamp NWR is a matrix of unique habitat types, many of which are rare. Within the refuge are found typical pocosins of the southeast, some of the largest remaining Atlantic white cedar woodlands to be found anywhere, and potential habitat for the federally-endangered red-cockaded woodpecker.
Area Economy
The Great Dismal Swamp NWR is located in the cities of Chesapeake and Suffolk in Virginia, and the counties of Gates, Pasquotank and Camden in North Carolina. The area had a population of 338,200 in 2003, an increase of 25.6 percent from 1993 compared with a 13.1 percent increase for the state of Virginia, a 19.6 percent increase for North Carolina, and a 12 percent increase for the U.S. Total area employment increased by 46.7 percent from 1993 to 2003 compared with a 19.2 percent increase in Virginia, a 18.7 percent increase in North Carolina, and a 18 percent increase in the U.S.
Per capita personal income increased in the area by 15.1 percent from 1993 to 2003. This compares with a 17.7 percent increase in Virginia, a 12.4 percent increase in North Carolina, and a 15.6 percent increase in the U.S.
316

Sample Refuges Descriptions
Table 5-356. Great Dismal Swamp NWR:Summary of Area Economy, 2003
(Population & Employment in 000’s; Per Capita Income in 2004 dollars)
Population Employment Per Capita Income
County 2003
Percent change
1993-2003 2003
Percent change
1993-2003 2003
Percent change
1993-2003Chesapeake, VA 210.0 22.6% 112.6 53.3% $31,222 15.1%
Suffolk, VA 73.4 37.8% 28.0 29.4% $27,703 16.2%
Gates, NC 10.8 11.0% 2.6 4.8% $20,885 4.7%
Camden, NC 7.9 27.0% 2.6 43.8% $26,585 26.1%
Pasquotank NC 36.1 9.4% 20.7 22.0% $22,867 9.4%
Area Total 338.2 25.6% 166.5 46.7% $29,877 15.1%
Virginia 7,365.3 13.1% 4,480.9 19.2% $34,641 17.7%
North Carolina 8,421.2 19.6% 4,880.3 18.7% $28,829 12.4%
United States 290,789.0 11.9% 167,174.4 17.9% $32,322 15.6%
Source: U.S. Department of Commerce 2003.
317

Banking on Nature: The Economic Benefits to Local Communities of National Wildlife Refuge Visitation
Activity Levels
Great Dismal Swamp NWR had 66,365 visitors in 2004. The majority of recreation visits, 31,317, were for non-consumptive activities. About 65 percent of recreation visits were undertaken by non-residents.
Table 5-357. Great Dismal Swamp NWR: 2004 Recreation Visits
Activity Residents Non-Residents Total
Non-Consumptive:
Nature Trails 10,760 19,984 30,744
Observation Platforms 0 0 0
Other Wildlife Observation 74 297 371
Beach /Water Use 0 0 0
Other Recreation 71 131 202
Hunting:
Big Game 0 0 0
Small Game 0 0 0
Migratory Birds 0 0 0
Fishing:
Freshwater 171 30 201
Saltwater 0 0 0
Total Visitation 11,076 20,442 31,518
Total Visitors 66,365
Regional Economic Analysis
The economic area for the Refuge is defined as cities of Chesapeake and Suffolk in Virginia, and the counties of Gates, Pasquotank and Camden in North Carolina. It is assumed that Refuge visitor expenditures occur primarily within this area.
Table 5-359 shows visitor recreation expenditures for the Refuge in 2004. Total expenditures were $414,100 with non-residents accounting for $376,400 (91 percent of total expenditures). Expenditures on non-consumptive activities accounted for 98 percent of the total, and fishing 2 percent.
318

Sample Refuges Descriptions
Table 5-358. Great Dismal Swamp NWR: Visitor Recreation Expenditures (2004 $,000)
Activity Residents Non-Residents Total
Non-Consumptive: $36.0 $371.6 $407.6
Hunting:
Big Game ─ ─ ─
Small Game ─ ─ ─
Migratory Birds ─ ─ ─
Total Hunting ─ ─ ─
Fishing:
Freshwater $1.7 $4.8 $6.6
Saltwater ─ ─ ─
Total Fishing $1.7 $4.8 $6.6
Total Expenditures $37.7 $376.4 $414.1
Table 5-359 summarizes the total economic impacts associated with refuge visitor spending. Total final demand was $566,500. This is the total monetary value of economic activity generated in the area by refuge visitor spending. In turn, this final demand generated 7 jobs (both full-time and part-time) with total job income of $172,300. Total tax revenue generated (county, state and Federal) amounted to $66,600.
Table 5-359. Great Dismal Swamp NWR: Local Economic Effects Associated with Recreation Visits
(2004 $,000)Residents Non-Residents Total
Final Demand $51.3 $515.2 $566.5
Jobs 0.6 6.0 6.6
Job Income $15.7 $156.5 $172.3
Total Tax Revenue $6.1 $60.5 $66.6
Table 5-360 shows total economic effects (total recreation expenditures plus net economic value) compared with the refuge budget for 2004. For an individual, net economic value is that person's total willingness to pay for a particular recreation activity minus his or her actual expenditures for that activity. The figure for economic value is derived by multiplying net economic values for hunting, fishing, and non-consumptive recreation use (on a per-day basis) by estimated refuge visitor days for that activity. This figure is combined with the estimate of total expenditures and divided by the refuge budget for 2004. The $0.68 means that for every $1 of budget expenditures, $0.68 of total economic effects are associated with these budget expenditures. This ratio is provided only for the purpose of broadly
319

Banking on Nature: The Economic Benefits to Local Communities of National Wildlife Refuge Visitation
comparing the magnitude of economic effects resulting from refuge visitation to budget expenditures and should not be interpreted as a benefit-cost ratio.
Table 5-360. Great Dismal Swamp NWR: Summary of Local Economic Effects of Recreation Visits
(2004 $,000)
FY 2004 Budget
RecreationExpenditures
Net Economic Value
Total economic effects per $1 budget expenditure
Great Dismal Swamp NWR
$1,184.6 $396.6 $410.2 $0.68
320

Sample Refuges Descriptions
Great Swamp National Wildlife Refuge
Description
The Great Swamp National Wildlife Refuge was established in 1960 and lies 26 miles west of New York City's Times Square and 7 miles south of Morristown, New Jersey in Morris County. This oasis of wilderness, surrounded by urban and suburban areas, provides important habitats to fish and wildlife and a unique opportunity for the public to enjoy wildlife and wilderness within close proximity to urban centers. It consists of approximately 7,600 acres of swamp woodland, hardwood ridges, cattail marsh, grassland, ponds and meandering streams. Over the years, the refuge has become a resting and feeding area for more than 244 species of birds. The refuge also provides a "home" for more than 39 species of reptiles and amphibians, 29 species of fish, 33 species of mammals and approximately 600 species of plants (including 215 species of wildflowers). Additionally, 26 of these species are listed by the State of New Jersey as being threatened or endangered, including the wood turtle, blue-spotted salamander and bog turtle (also federally threatened).
Approximately 300,000 people visit the refuge annually, with the Wildlife Observation Center being the most popular pursuit. People are encouraged to observe, study, photograph and hike in designated areas. The refuge has a Wildlife Observation Center that provides spectacular wetlands vistas and is particularly good for photography and wildlife observation. There is over one mile of boardwalk trails, interpretive displays, information kiosk, and two blinds for observing wildlife.
Area Economy
Table 5-361 summarizes the area economy for Great Swamp NWR. From 1993 to 2003, area population increased 7.2 percent. Within the 6-county area, Essex County had the smallest population growth (1.5 percent) and Somerset County had the largest population growth (21.6 percent). During the same time period, area employment increased 11.4 percent. Average per capita income for the area was $48,367 in 2003. This average was well above New Jersey ($40,631) and the United States ($32,310).
321

Banking on Nature: The Economic Benefits to Local Communities of National Wildlife Refuge Visitation
Table 5-361. Great Swamp NWR:Summary of Area Economy, 2003
(Population & Employment in 000’s; Per Capita Income in 2004 dollars)
Population Employment Per Capita Income
County 2003
Percent change
1993-2003 2003
Percent change
1993-2003 2003
Percent change
1993-2003Bergan, NJ 898.6 6.6% 580.3 11.0% $53,136 15.8%Essex, NJ 797.4 1.5% 451.1 3.9% $38,974 13.6%
Morris, NJ* 483.5 11.7% 361.5 24.7% $57,282 21.6%
Somerset, NJ 312.3 21.6% 211.2 18.1% $56,919 14.5%Union, NJ 530.6 5.8% 294.0 5.5% $41,251 12.9%
Area Total 3,022.5 7.2% 1,898.2 11.4% $48,367 16.5%New Jersey 8,642.4 8.7% 4,817.4 13.9% $40,631 15.9%
United States 290,789.0 11.9% 167,174.4 17.9% $32,310 15.8%
Source: U.S. Department of Commerce 2003.
322

Sample Refuges Descriptions
Activity Levels
In FY 2004, visitors to Great Swamp NWR enjoyed both non-consumptive activities (276,600 visits) and big game hunting (800 visits) (Table 5-362). For non-consumptive activities, “other wildlife observation” includes observing wildlife while on the auto tour, and “other recreation” includes jogging, bicycling, and cross-country skiing. Eighty-percent of visits were by residents (221,984 visits).
Table 5-362. Great Swamp NWR: 2004 Recreation Visits
Activity Residents Non-Residents Total
Non-Consumptive:
Nature Trails 100,800 25,200 126,000
Observation Platforms 62,400 15,600 78,000
Other Wildlife Observation 22,240 5,560 27,800
Beach /Water Use 0 0 0
Other Recreation 35,840 8,960 44,800
Hunting:
Big Game 704 96 800
Small Game 0 0 0
Migratory Birds 0 0 0
Fishing:
Freshwater 0 0 0
Saltwater 0 0 0
Total Visitation 221,984 55,416 277,400
Total Visitors 292,901
Regional Economic Analysis
Visitor recreation expenditures totaled $1.7 million in FY 2004 (Table 5-363). Ninety-nine percent of expenditures were related to non-consumptive activities. Residents spent approximately $721,700, and non-residents spent approximately $986,100.
323

Banking on Nature: The Economic Benefits to Local Communities of National Wildlife Refuge Visitation
Table 5-363. Great Swamp NWR: Visitor Recreation Expenditures (2004 $,000)
Activity Residents Non-Residents Total
Non-Consumptive: $712.9 $981.5 $1,694.4
Hunting:
Big Game $8.8 $4.6 $13.3
Small Game ─ ─ ─
Migratory Birds ─ ─ ─
Total Hunting $8.8 $4.6 $13.3
Fishing:
Freshwater ─ ─ ─
Saltwater ─ ─ ─
Total Fishing ─ ─ ─
Total Expenditures $721.7 $986.1 $1,707.8
In FY 2004, recreation visits resulted in nearly $2.7 million in final demand (Table 5-364). As a result, this final demand produced 25 jobs. Non-resident expenditures accounted for 55 percent of the jobs generated.
Table 5-364. Great Swamp NWR: Local Economic Effects Associated with Recreation Visits (2004 $,000)
Residents Non-Residents Total
Final Demand $1,148.7 $1,526.7 $2,675.5
Jobs 11 14 25
Job Income $416.7 $547.5 $964.2
Total Tax Revenue $154.2 $222.7 $376.9
Table 5-365 compares the refuge budget and the local economic effects of recreation visits. In FY 2004, recreational benefits (recreation-related expenditures plus net economic value) totaled nearly $5.3 million, and budget expenditures summed to $1.1 million. Comparing these two estimates shows that for every $1 of budget expenditures, $4.79 in recreational benefits are derived. This ratio is provided to broadly compare the magnitude of the two estimates and should not be used as a benefit-cost ratio. In addition to recreational benefits, Great Swamp NWR provides a variety of other benefits including ecological and educational values which are not quantified in this analysis. Furthermore, the budget contributes an additional stimulus to the local economy.
324

Sample Refuges Descriptions
Table 5-365. Great Swamp NWR: Summary of Local Economic Effects of Recreation Visits (2004 $,000)
FY 2004 Budget
RecreationExpenditures
Net Economic Value
Total economic effects per $1 budget expenditure
Great Swamp NWR
$1,103.9 $1,707.8 $3,584.5 $4.79
325

Banking on Nature: The Economic Benefits to Local Communities of National Wildlife Refuge Visitation
Monomoy National Wildlife Refuge
Description
Monomoy National Wildlife Refuge (NWR) was established in 1944 to provide habitat for migratory birds. Sand stretches for eight miles off the elbow of Cape Cod, forming the barrier islands of North and South Monomoy. In addition to the two islands, a 40-acre unit on Morris Island is also part of the refuge. This is where the headquarters and visitor center are located. The total size of the refuge is 7,604 acres with varied habitats of oceans, salt and freshwater marshes, dunes, and freshwater ponds. The refuge provides important resting, nesting and feeding habitat for migratory birds, including the Federally protected piping plover and roseate tern. More than ten species of seabirds, shorebirds, and waterbirds nest on the islands. The refuge also supports the second largest nesting colony of common terns on the Atlantic seaboard with over 8,000 nesting pairs.
Approximately ninety-four percent of the refuge is designated as a Wilderness Area. The visitor to this wilderness refuge encounters a very special place -- a sanctuary that supports an amazing diversity of wildlife and plant species. Monomoy has been listed as a Western Hemisphere Shorebird Reserve Network Regional site and an Important Bird Area due to its importance to migratory shorebirds. Monomoy's beaches provide important spawning habitat for horseshoe crabs. During the fall and winter, thousands of seaducks congregate in offshore areas around the refuge. The refuge is the largest haul-out site of gray seals on the Atlantic Seaboard with approximately 5,000 seals. Largely protected from human intrusion, Monomoy offers some of the most desirable habitat for seals in the region and harbor and gray seals now thrive on Monomoy. A restored Coast Guard lighthouse is located on South Monomoy and is listed on the National Register of Historic Places.
Area Economy
The Monomoy NWR is located in Barnstable County in Massachusetts. The area had a population of 229,100 in 2003, an increase of 17.6 percent from 1993 compared with a 5.9 percent increase for the state of Massachusetts and a 12 percent increase for the U.S. Total area employment increased by 32.9 percent from 1993 to 2003 compared with a 12.6 percent increase in Massachusetts and a 18 percent increase in the U.S. Per capita personal income increased in the area by 18.7 percent from 1993 to 2003. This compares with a 23.0 percent increase in Massachusetts and a 15.6 percent increase in the U.S.
Table 5-366. Monomoy NWR:Summary of Area Economy, 2003
(Population & Employment in 000’s; Per Capita Income in 2004 dollars)
Population Employment Per Capita Income
County 2003
Percent change
1993-2003 2003
Percent change
1993-2003 2003
Percent change
1993-2003Barnstable, MA 229.1 17.6% 138.6 32.9% $39,681 18.7%
Massachusetts 6,420.4 5.9% 4,028.1 12.6% $40,571 23.0%
United States 290,789.0 11.9% 167,174.4 17.9% $32,322 15.6%
Source: U.S. Department of Commerce 2003.
326
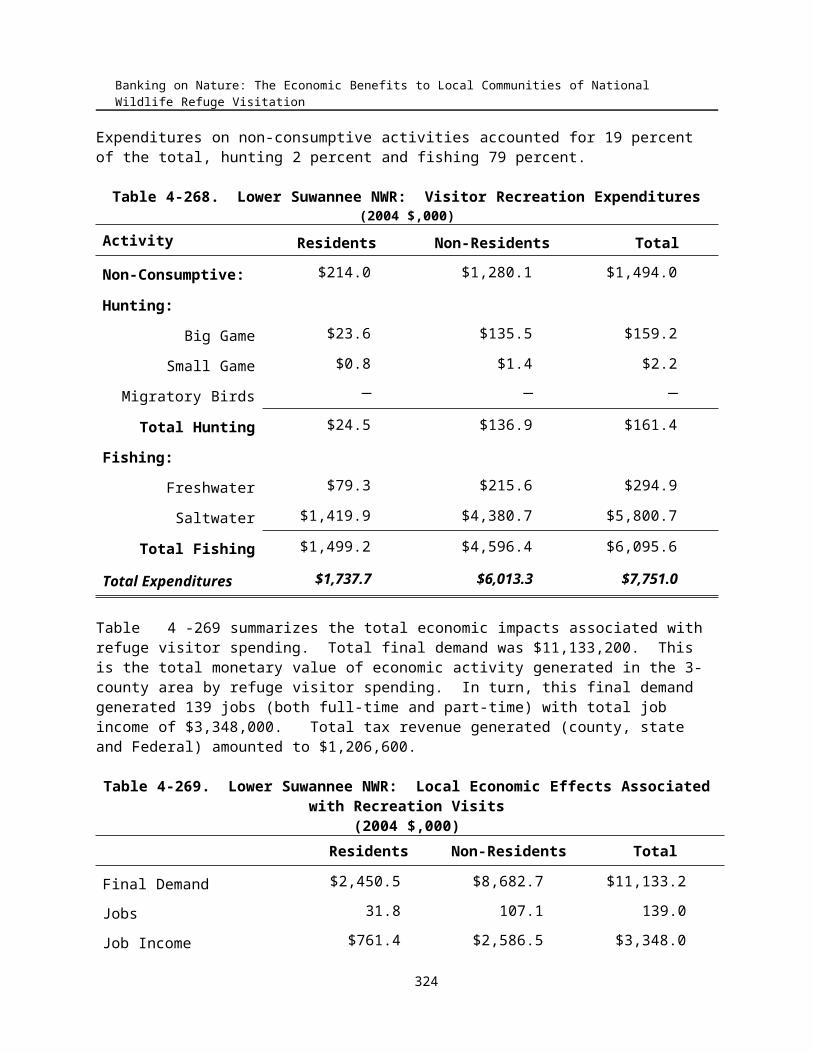
Sample Refuges Descriptions
Activity Levels
Monomoy NWR had 442,900 visitors in 2004. The majority of recreation visits, 587,100 were for non-consumptive activities. About 56 percent of recreation visits were undertaken by non-residents.
Table 5-367. Monomoy NWR: 2004 Recreation Visits
Activity Residents Non-Residents Total
Non-Consumptive:
Nature Trails 105,060 245,140 350,200
Observation Platforms 0 0 0
Other Wildlife Observation 6,180 24,720 30,900
Beach /Water Use 51,500 51,500 103,000
Other Recreation 41,200 61,800 103,000
Hunting:
Big Game 0 0 0
Small Game 0 0 0
Migratory Birds 0 0 0
Fishing:
Freshwater 107 12 119
Saltwater 209,340 139,560 348,900
Total Visitation 413,387 522,732 936,119
Total Visitors 442,900
Regional Economic Analysis
The economic area for the Refuge is defined as Barnstable County in Massachusetts. It is assumed that Refuge visitor expenditures occur primarily within this area.
Table 5-369 shows visitor recreation expenditures for the Refuge in 2004. Total expenditures were $26,347,100 with non-residents accounting for $18,831,600 (71 percent of total expenditures). Expenditures on non-consumptive activities accounted for 43 percent of the total and fishing 57 percent.
327

Banking on Nature: The Economic Benefits to Local Communities of National Wildlife Refuge Visitation
Table 5-368. Monomoy NWR: Visitor Recreation Expenditures (2004 $,000)
Activity Residents Non-Residents Total
Non-Consumptive: $1,170.0 $10,192.8 $11,362.8
Hunting:
Big Game ─ ─ ─
Small Game ─ ─ ─
Migratory Birds ─ ─ ─
Total Hunting ─ ─ ─
Fishing:
Freshwater $0.7 $2.0 $2.7
Saltwater $6,344.7 $8,636.8 $14,981.5
Total Fishing $6,345.4 $8,638.9 $14,984.3
Total Expenditures $7,515.5 $18,831.6 $26,347.1
Table 5-369 summarizes the total economic impacts associated with refuge visitor spending. Total final demand was $37,072,000. This is the total monetary value of economic activity generated in the area by refuge visitor spending. In turn, this final demand generated 131 jobs (both full-time and part-time) with total job income of $12,726,200. Total tax revenue generated (county, state and Federal) amounted to $5,075,000.
Table 5-369. Monomoy NWR: Local Economic Effects Associated with Recreation Visits (2004 $,000)
Residents Non-Residents Total
Final Demand $10,659.7 $26,412.2 $37,072.0
Jobs 102.4 28.9 131.4
Job Income $3,339.8 $9,386.4 $12,726.2
Total Tax Revenue $1,472.4 $3,602.6 $5,075.0
Table 5-370 shows total economic effects (total recreation expenditures plus net economic value) compared with the refuge budget for 2004. For an individual, net economic value is that person's total willingness to pay for a particular recreation activity minus his or her actual expenditures for that activity. The figure for economic value is derived by multiplying net economic values for hunting, fishing, and non-consumptive recreation use (on a per-day basis) by estimated refuge visitor days for that activity. This figure is combined with the estimate of total expenditures and divided by the refuge budget for 2004. The $96.12 means that for every $1 of budget expenditures, $96.12 of total economic effects are associated with these budget expenditures. This ratio is provided only for the purpose of broadly
328

Sample Refuges Descriptions
comparing the magnitude of economic effects resulting from refuge visitation to budget expenditures and should not be interpreted as a benefit-cost ratio.
Table 5-370. Monomoy NWR: Summary of Local Economic Effects of Recreation Visits (2004 $,000)
FY 2004 Budget
RecreationExpenditures
Net Economic Value
Total economic effects per $1 budget expenditure
Monomoy NWR
$521.5 $26,347.1 $23,779.7 $96.12
329

Banking on Nature: The Economic Benefits to Local Communities of National Wildlife Refuge Visitation
Montezuma National Wildlife Refuge
Description
Montezuma National Wildlife Refuge lies at the north end of Cayuga Lake, in the heart of the Finger Lakes Region of New York State. Located between Syracuse and Rochester, in Seneca and Wayne Counties, Montezuma serves as a major resting area for waterfowl and other waterbirds on their journeys to and from nesting areas in northeastern and east-central Canada.
Fall peaks of Canada geese reach over 60,000 birds, and in spring this number has exceeded 100,000 birds. Spring migration peaks of snow geese have recently exceeded 100,000 birds. Late fall use by mallards has exceeded also 100,000 birds. Use by American black ducks in the fall often reaches 25,000.
Bald eagles have resided on the refuge since 1986, first producing offspring in 1987. Several pair of osprey also nest on the refuge. There are established nesting colonies of black terns, black-crowned night-herons, and great blue herons. Dewatered refuge impoundments provide significant foraging habitat for shorebirds during the late summer and fall.
Area Economy
The refuge’s lands are contained within Cayuga, Seneca, and Wayne Counties in New York. The economic hub for the area includes the cities of Rochester, Syracuse, and Ithaca, which are in Monroe, Onondago, and Tompkins Counties, respectively. The area economy for Montezuma NWR is summarized in Table 5-51.
From 1993 to 2003, the area population declined 0.5 percent to 1.5 million people. Both Cayuga and Onondago counties had decreasing populations, while the remaining counties’ populations slightly increased. During the same time period, area employment increased 1.2 percent. Changes in employment ranged from -3.8 percent for Wayne county and +12.5 percent for Seneca County. In 2003, the area’s average per capita income was $31,596. This was lower than New York ($37,074) and the United States ($32,310).
330

Sample Refuges Descriptions
Table 5-371. Montezuma NWR:Summary of Area Economy, 2003
(Population & Employment in 000’s; Per Capita Income in 2004 dollars)
Population Employment Per Capita Income
County 2003
Percent change
1993-2003 2003
Percent change
1993-2003 2003
Percent change
1993-2003Cayuga, NY 82.0 -1.2% 36.3 11.6% $25,615 15.3%Monroe, NY 735.8 0.2% 472.1 0.6% $34,158 10.2%
Onondago, NY 459.4 -3.3% 297.1 -0.2% $31,181 10.9%
Seneca, NY 35.0 6.6% 15.5 12.5% $24,721 1.6%Tompkins, NY 99.4 3.4% 64.9 7.9% $26,736 14.1%
Wayne, NY 94.0 2.4% 35.5 -3.8% $26,493 3.6%
Area Total 1,505.6 -0.5% 921.4 1.2% $31,596 10.3%New York 19,212.4 4.6% 10,420.2 9.5% $37,074 12.8%
United States 290,789.0 11.9% 167,174.4 17.9% $32,310 15.8%
Source: U.S. Department of Commerce 2003.
331

Banking on Nature: The Economic Benefits to Local Communities of National Wildlife Refuge Visitation
Activity Levels
Table 5-372 shows recreation visits for Montezuma NWR. Total recreation visits (118,992 visits) are higher than total visitors (106,543) because visitors may choose to partake in more than one activity.
Ninety-five percent of visits were non-consumptive activities (113,133 visits), such as nature trails, observation platforms, and other wildlife observation. Visitors can enjoy the Main Pool observation tower, which is equipped with a telescope and opportunities for wildlife observation. In addition, there is also a wildlife drive, which is a 3.5 mile drive providing many opportunities to observe and photograph wildlife. Visitors also enjoyed hunting (1,959 visits) and freshwater fishing (3,900 visits). Seventy-three percent of visits (86,274) were by non-residents.
Table 5-372. Montezuma NWR: 2004 Recreation Visits
Activity Residents Non-Residents Total
Non-Consumptive:
Nature Trails 21,686 65,057 86,742
Observation Platforms 6,510 19,529 26,039
Other Wildlife Observation 93 259 352
Beach /Water Use 0 0 0
Other Recreation 0 0 0
Hunting:
Big Game 548 821 1,369
Small Game 0 0 0
Migratory Birds 177 413 590
Fishing:
Freshwater 3,705 195 3,900
Saltwater 0 0 0
Total Visitation 32,718 86,274 118,992
Total Visitors 106,543
332

Sample Refuges Descriptions
Regional Economic Analysis
Visitor recreation expenditures totaled approximately $1.2 million in FY 2004 (Table 5-373). Non-consumptive activities, hunting, and fishing accounted for $1.1 million, $59,000, and $35,000, respectively. Non-residents comprised 92 percent of all expenditures.
Table 5-373. Montezuma NWR: Visitor Recreation Expenditures (2004 $,000)
Activity Residents Non-Residents Total
Non-Consumptive: $60.8 $1,003.6 $1,064.3
Hunting:
Big Game $4.3 $24.5 $28.8
Small Game ─ ─ ─
Migratory Birds $1.6 $29.0 $30.6
Total Hunting $5.8 $53.5 $59.4
Fishing:
Freshwater $30.8 $4.5 $35.2
Saltwater ─ ─ ─
Total Fishing $30.8 $4.5 $35.2
Total Expenditures $97.3 $1,061.6 $1,158.9
Table 5-374 shows the local economic effects associated with recreational visitor spending in FY 2004. Final demand ($1.8 million) generated 23 jobs, $647,400 in job income, and $278,400 in tax revenue. Non-resident expenditures provided a 21 job stimulus to the local economy of Montezuma NWR.
Table 5-374. Montezuma NWR: Local Economic Effects Associated with Recreation Visits (2004 $,000)
Residents Non-Residents Total
Final Demand $155.2 $1,655.6 $1,810.8
Jobs 2 21 23
Job Income $56.1 $591.3 $647.4
Total Tax Revenue $22.2 $256.2 $278.4
Table 5-375 compares the refuge budget and the local economic effects of recreation visits. In FY 2004, recreational benefits (recreation-related expenditures plus net economic value) totaled approximately $2.3 million, and budget expenditures summed to about $1.3 million. Comparing these two estimates shows that for every $1 of budget expenditures, $1.82 in recreational benefits are derived. This ratio is provided to broadly compare the magnitude of the two estimates and should not be used as a benefit-cost ratio. In
333

Banking on Nature: The Economic Benefits to Local Communities of National Wildlife Refuge Visitation
addition to recreational benefits, Montezuma NWR provides a variety of other benefits including ecological and educational values which are not quantified in this analysis. Furthermore, the budget contributes an additional stimulus to the local economy.
Table 5-375. Montezuma NWR: Summary of Local Economic Effects of Recreation Visits (2004 $,000)
FY 2004 Budget
RecreationExpenditures
Net Economic Value
Total economic effects per $1 budget expenditure
Montezuma NWR
$1,273.2 $1,158.9 $1,157.2 $1.82
334

Sample Refuges Descriptions
Moosehorn National Wildlife Refuge
Description
Moosehorn NWR is one of the northern most national wildlife refuges in the Atlantic Flyway, a migratory route that follows the eastern coast of North America. The refuge provides important feeding and nesting habitat for many bird species, including waterfowl, wading birds, shorebirds, upland game birds, songbirds, and birds of prey.
The refuge serves as a breeding area and migration stop for a variety of waterfowl, wading birds, and shorebirds. Black ducks, wood ducks, ring-necked ducks, Canada geese, and common loons can be seen on the refuge's lakes and marshes. In mid-May, Magurrewock Marsh, which borders U.S. Route 1 on the Baring Division, abounds with goose and duck broods. In addition, great blue herons and American bitterns feed there during the warmer months
The refuge consists of two divisions. The Baring Division covers 20,016 acres and is located off U.S. Route 1, southwest of Calais. The 8,735 acre Edmunds Division is between Dennysville and Whiting on U.S. Route 1 and borders the tidal waters of Cobscook Bay. Each division contains a National Wilderness Area, thousands of acres managed to preserve their wild character for future generation.
Area Economy
The Moosehorn NWR is located in Washington County, Maine. The area had a population of 33,500 in 2003, a decline of 5.9 percent from 1993 compared with a 5.4 percent for the state of Maine and a 12 percent increase for the U.S. Total area employment increased by 10.1 percent from 1993 to 2003 compared with a 15.7 percent increase in Maine and a 18 percent increase in the U.S.
Per capita personal income increased in the area by 21.4 percent from 1993 to 2003. This compares with a 22.7 percent increase in Maine and a 15.6 percent increase in the U.S.
Activity Levels
Moosehorn NWR had 36,000 visitors in 2004. The majority of recreation visits, 142,950, were for non-consumptive activities. About 79 percent of recreation visits were undertaken by area residents.
335

Banking on Nature: The Economic Benefits to Local Communities of National Wildlife Refuge Visitation
Table 5-376. Moosehorn NWR:Summary of Area Economy, 2003
(Population & Employment in 000’s; Per Capita Income in 2004 dollars)
Population Employment Per Capita Income
County 2003
Percent change
1993-2003 2003
Percent change
1993-2003 2003
Percent change
1993-2003Washington, ME 33.5 -5.9% 19.3 10.1% $24,143 21.4%
Maine 1,309.2 5.4% 806.4 15.7% $29,951 22.7%
United States 290,789.0 11.9% 167,174.4 17.9% $32,322 15.6%
Source: U.S. Department of Commerce 2003.
Table 5-377. Moosehorn NWR: 2004 Recreation Visits
Activity Residents Non-Residents Total
Non-Consumptive:
Nature Trails 10,975 10,975 21,950
Observation Platforms 3,000 3,000 6,000
Other Wildlife Observation 9,180 6,120 15,300
Beach /Water Use 0 0 0
Other Recreation 89,730 9,970 99,700
Hunting:
Big Game 270 30 300
Small Game 6 0 6
Migratory Birds 45 5 50
Fishing:
Freshwater 540 60 600
Saltwater 80 20 100
Total Visitation 113,826 30,180 144,006
Total Visitors 36,000
336

Sample Refuges Descriptions
Regional Economic Analysis
The economic area for the Refuge is defined as Washington County in Maine. It is assumed that Refuge visitor expenditures occur primarily within this area.
Table 5-379 shows visitor recreation expenditures for the Refuge in 2004. Total expenditures were $$446,300 with non-residents accounting for $294,300 (66 percent of total expenditures). Expenditures on non-consumptive activities accounted for 96 percent of the total, hunting 1 percent and fishing 3 percent.
Table 5-378. Moosehorn NWR: Visitor Recreation Expenditures (2004 $,000)
Activity Residents Non-Residents Total
Non-Consumptive: $145.6 $284.2 $429.8
Hunting:
Big Game $2.6 $1.1 $3.7
Small Game ─ ─ ─
Migratory Birds $0.3 $0.3 $0.6
Total Hunting $2.9 $1.4 $4.3
Fishing:
Freshwater $2.7 $7.6 $10.3
Saltwater $0.8 $1.1 $1.9
Total Fishing $3.6 $8.7 $12.3
Total Expenditures $152.1 $294.3 $446.3
Table 5-379 summarizes the total economic impacts associated with refuge visitor spending. Total final demand was $538.7. This is the total monetary value of economic activity generated in the area by refuge visitor spending. In turn, this final demand generated 8 jobs (both full-time and part-time) with total job income of $152,300. Total tax revenue generated (county, state and Federal) amounted to $72,300.
Table 5-379. Moosehorn NWR: Local Economic Effects Associated with Recreation Visits (2004 $,000)
Residents Non-Residents Total
Final Demand $182.7 $356.0 $538.7
Jobs 2.6 5.0 7.6
Job Income $52.0 $100.4 $152.3
Total Tax Revenue $24.9 $47.4 $72.3
337

Banking on Nature: The Economic Benefits to Local Communities of National Wildlife Refuge Visitation
Table 5-380 shows total economic effects (total recreation expenditures plus net economic value) compared with the refuge budget for 2004. For an individual, net economic value is that person's total willingness to pay for a particular recreation activity minus his or her actual expenditures for that activity. The figure for economic value is derived by multiplying net economic values for hunting, fishing, and non-consumptive recreation use (on a per-day basis) by estimated refuge visitor days for that activity. This figure is combined with the estimate of total expenditures and divided by the refuge budget for 2004. The $1.63 means that for every $1 of budget expenditures, $1.63 of total economic effects are associated with these budget expenditures. This ratio is provided only for the purpose of broadly comparing the magnitude of economic effects resulting from refuge visitation to budget expenditures and should not be interpreted as a benefit-cost ratio.
Table 5-380. Moosehorn NWR: Summary of Local Economic Effects of Recreation Visits (2004 $,000)
FY 2004 Budget
RecreationExpenditures
Net Economic Value
Total economic effects per $1 budget expenditure
Moosehorn NWR
$761.2 $446.3 $795.0 $1.63
338

Sample Refuges Descriptions
Parker River National Wildlife Refuge
Description
Parker River National Wildlife Refuge was established in 1942 primarily to provide feeding, resting, and nesting habitat for migratory birds. Located along the Atlantic Flyway, the refuge is of vital stopover significance to waterfowl, shorebirds, and songbirds during pre- and post-breeding migratory periods. The refuge occupies in part, the southern three-fourths of Plum Island, an 8 mile long barrier island near Newburyport, Massachusetts.
The refuge consists of 4,662 acres of diverse upland and wetland habitats including sandy beach and dune, shrub/thicket, bog, swamp, freshwater marsh, saltwater marsh and associated creek, river, mud flat, and salt panne. These and other refuge habitats support varied and abundant populations of resident and migratory wildlife including more than 300 species of birds and additional species of mammals, reptiles, amphibians, insects, and plants.
Area Economy
The Parker River NWR is located in Essex County in Massachusetts. The area had a population of 738,300 in 2003, an increase of 8.9 percent from 1993 compared with a 5.9 percent for the state of Massachusetts and a 12 percent increase for the U.S. Total area employment increased by 14 percent from 1993 to 2003 compared with a 12.6 percent increase in Massachusetts and an 18 percent increase in the U.S.
Per capita personal income increased in the area by 21.2 percent from 1993 to 2003. This compares with a 23 percent increase in Massachusetts and a 15.6 percent increase in the U.S.
Table 5-381. Parker River NWR:Summary of Area Economy, 2003
(Population & Employment in 000’s; Per Capita Income in 2004 dollars)
Population Employment Per Capita Income
County 2003
Percent change
1993-2003 2003
Percent change
1993-2003 2003
Percent change
1993-2003
Essex, MA 738.3 8.9% 389.1 14.0% $39,576 21.2%
Massachusetts 6,420.4 5.9% 4,028.1 12.6% $40,571 23.0%
United States 290,789.0 11.9% 167,174.4 17.9% $32,322 15.6%
Source: U.S. Department of Commerce 2003.
339

Banking on Nature: The Economic Benefits to Local Communities of National Wildlife Refuge Visitation
Activity Levels
Parker River NWR had 247,056 visitors in 2004. The vast majority of recreation visits, 585,488, were for non-consumptive activities. About 54 percent of recreation visits were undertaken by area residents.
Table 5-382. Parker River NWR: 2004 Recreation Visits
Activity Residents Non-Residents Total
Non-Consumptive:
Nature Trails 83,816 142,714 226,530
Observation Platforms 4,732 5,783 10,515
Other Wildlife Observation 19,959 24,394 44,353
Beach /Water Use 75,000 50,000 125,000
Other Recreation 134,318 44,773 179,090
Hunting:
Big Game 32 14 45
Small Game 0 0 0
Migratory Birds 185 185 370
Fishing:
Freshwater 0 0 0
Saltwater 4,859 3,976 8,835
Total Visitation 322,900 271,838 594,738
Total Visitors 247,056
Regional Economic Analysis
The economic area for the Refuge is defined as Essex County in Massachusetts. It is assumed that Refuge visitor expenditures occur primarily within this area.
Table 5-383 shows visitor recreation expenditures for the Refuge in 2004. Total expenditures were $5,128,400 with non-residents accounting for $4,075,300 (79 percent of total expenditures). Expenditures on non-consumptive activities accounted for 90 percent of the total, hunting less than one percent, and fishing 9 percent.
340

Sample Refuges Descriptions
Table 5-383. Parker River NWR: Visitor Recreation Expenditures (2004 $,000)
Activity Residents Non-Residents Total
Non-Consumptive: $854.6 $3,794.1 $4,648.7
Hunting:
Big Game $0.4 $0.7 $1.1
Small Game ─ ─ ─
Migratory Birds $1.7 $13.2 $14.9
Total Hunting $2.1 $13.9 $16.0
Fishing:
Freshwater ─ ─ ─
Saltwater $196.4 $267.3 $463.7
Total Fishing $196.4 $267.3 $463.7
Total Expenditures $1,053.1 $4,075.3 $5,128.4
Table 5-384 summarizes the total economic impacts associated with refuge visitor spending. Total final demand was $7,818,900. This is the total monetary value of economic activity generated in the area by refuge visitor spending. In turn, this final demand generated 66 jobs (both full-time and part-time) with total job income of $2,347,800. Total tax revenue generated (county, state and Federal) amounted to $1,111,600.
Table 5-384. Parker River NWR: Local Economic Effects Associated with Recreation Visits (2004 $,000)
Residents Non-Residents Total
Final Demand $1,607.2 $6,211.7 $7,818.9
Jobs 13.4 52.1 65.5
Job Income $482.7 $1,865.1 $2,347.8
Total Tax Revenue $230.9 $880.7 $1,111.6
Table 5-385 shows total economic effects (total recreation expenditures plus net economic value) compared with the refuge budget for 2004. For an individual, net economic value is that person's total willingness to pay for a particular recreation activity minus his or her actual expenditures for that activity. The figure for economic value is derived by multiplying net economic values for hunting, fishing, and non-consumptive recreation use (on a per-day basis) by estimated refuge visitor days for that activity. This figure is combined with the estimate of total expenditures and divided by the refuge budget for 2004. The $9.42 means that for every $1 of budget expenditures, $9.42 of total economic effects are associated with these budget expenditures. This ratio is provided only for the purpose of broadly
341

Banking on Nature: The Economic Benefits to Local Communities of National Wildlife Refuge Visitation
comparing the magnitude of economic effects resulting from refuge visitation to budget expenditures and should not be interpreted as a benefit-cost ratio.
Table 5-385. Parker River NWR: Summary of Local Economic Effects of Recreation Visits (2004 $,000)
FY 2004 Budget
RecreationExpenditures
Net Economic Value
Total economic effects per $1 budget expenditure
Parker River NWR
$1,229.3 $5,128.4 $6,445.6 $9.42
342

Sample Refuges Descriptions
Patuxent Research Refuge
Description
Established in 1936 by executive order of President Franklin D. Roosevelt, the Patuxent Research Refuge is the Nation's only National Wildlife Refuge established to support wildlife research. With land surrounding the Patuxent and Little Patuxent Rivers between Washington, D.C. and Baltimore, MD, the Refuge has grown from the original 2,670 acres to its present size of 12,750 acres and encompasses land formerly managed by the Departments of Agriculture and Defense. Throughout decades of change, Patuxent's mission of conserving and protecting the nation's wildlife and habitat through research and wildlife management techniques has remained virtually unchanged.
Patuxent Research Refuge supports a wide diversity of wildlife in forest, meadow, and wetland habitats. The land is managed to maintain biological diversity and to protect and benefit native and migratory bird species. During the fall and spring migrations, many waterfowl species stop to rest and feed. Over 270 species of birds occur on the Refuge. A nesting pair of bald eagles has used the North Tract of the Refuge since 1989.
Area Economy
The Patuxent Research Refuge is located in Prince George's and Anne Arundel counties in Maryland. The area had a population of 1,341,600 in 2003, an increase of 11.6 percent from 1993 compared with a 10.9 percent increase for the state of Maryland and a 12 percent increase for the U.S. Total area employment increased by 21.2 percent from 1993 to 2003 compared with a 19 percent increase in Maryland and a 18 percent increase in the U.S.
Per capita personal income increased in the area by 15.2 percent from 1993 to 2003. This compares with a 18.8 percent increase in Maryland and a 15.6 percent increase in the U.S.
Table 5-386. Patuxent Research Refuge NWR:Summary of Area Economy, 2003
(Population & Employment in 000’s; Per Capita Income in 2004 dollars)
Population Employment Per Capita Income
County 2003
Percent change
1993-2003 2003
Percent change
1993-2003 2003
Percent change
1993-2003Prince George's, MD 836.4 11.0% 410.8 15.7% $32,798 8.2%
Anne Arundel, MD 505.2 12.6% 318.7 29.1% $41,556 25.8%
Area Total 1,341.6 11.6% 729.5 21.2% $36,096 15.2%
Maryland 5,512.3 10.9% 3,187.1 19.0% $38,457 18.8%
United States 290,789.0 11.9% 167,174.4 17.9% $32,322 15.6%
Source: U.S. Department of Commerce 2003.
343

Banking on Nature: The Economic Benefits to Local Communities of National Wildlife Refuge Visitation
Activity Levels
Patuxent Research Refuge had 118,303 visitors in 2004. The vast majority of recreation visits, 196,482, were for non-consumptive activities. About 52 percent of recreation visits were undertaken by area residents.
Table 5-387. Patuxent Research Refuge NWR: 2004 Recreation Visits
Activity Residents Non-Residents Total
Non-Consumptive:
Nature Trails 29,729 57,710 87,439
Observation Platforms 2,986 26,874 29,860
Other Wildlife Observation 3,272 13,088 16,360
Beach /Water Use 0 0 0
Other Recreation 59,682 3,141 62,823
Hunting:
Big Game 5,450 606 6,055
Small Game 381 42 423
Migratory Birds 510 57 567
Fishing:
Freshwater 5,082 565 5,647
Saltwater 0 0 0
Total Visitation 107,092 102,082 209,174
Total Visitors 118,303
Regional Economic Analysis
The economic area for the Refuge is defined as Price George's and Anne Arundel counties in Maryland. It is assumed that Refuge visitor expenditures occur primarily within this 2-county area.
Table 5-68 shows visitor recreation expenditures for the Refuge in 2004. Total expenditures were $2,563,400 with non-residents accounting for $1,968,200 (77 percent of total expenditures). Expenditures on non-consumptive activities accounted for 92 percent of the total, hunting less than one percent, and fishing 7 percent.
344

Sample Refuges Descriptions
Table 5-388. Patuxent Research Refuge NWR: Visitor Recreation Expenditures (2004 $,000)
Activity Residents Non-Residents Total
Non-Consumptive: $536.3 $1,820.3 $2,356.6
Hunting:
Big Game ─ ─ ─
Small Game $3.8 $1.7 $5.5
Migratory Birds $3.5 $3.0 $6.5
Total Hunting $7.3 $4.7 $12.0
Fishing:
Freshwater $51.6 $143.2 $194.8
Saltwater ─ ─ ─
Total Fishing $51.6 $143.2 $194.8
Total Expenditures $595.2 $1,968.2 $2,563.4
Table 5-389 summarizes the total economic impacts associated with refuge visitor spending. Total final demand was $3,815,900. This is the total monetary value of economic activity generated in the 2-county area by refuge visitor spending. In turn, this final demand generated 35 jobs (both full-time and part-time) with total job income of $1,097,600. Total tax revenue generated (county, state and Federal) amounted to $478,600.
Table 5-389. Patuxent Research Refuge NWR: Local Economic Effects Associated with Recreation Visits
(2004 $,000)Residents Non-Residents Total
Final Demand $887.2 $2,928.7 $3,815.9
Jobs 8.1 26.4 34.5
Job Income $251.8 $845.8 $1,097.6
Total Tax Revenue $113.5 $365.1 $478.6
Table 5-390 shows total economic effects (total recreation expenditures plus net economic value) compared with the refuge budget for 2004. For an individual, net economic value is that person's total willingness to pay for a particular recreation activity minus his or her actual expenditures for that activity. The figure for economic value is derived by multiplying net economic values for hunting, fishing, and non-consumptive recreation use (on a per-day basis) by estimated refuge visitor days for that activity. This figure is combined with the estimate of total expenditures and divided by the refuge budget for 2004. The $2.31 means that for every $1 of budget expenditures, $2.31 of total economic effects are associated with these budget expenditures. This ratio is provided only for the purpose of broadly
345

Banking on Nature: The Economic Benefits to Local Communities of National Wildlife Refuge Visitation
comparing the magnitude of economic effects resulting from refuge visitation to budget expenditures and should not be interpreted as a benefit-cost ratio.
Table 5-390. Patuxent Research Refuge NWR: Summary of Local Economic Effects of Recreation Visits
(2004 $,000)
FY 2004 Budget
RecreationExpenditures
Net Economic Value
Total economic effects per $1 budget expenditure
Patuxent Research Refuge NWR
$2,674.1 $2,563.4 $3,620.7 $2.31
346
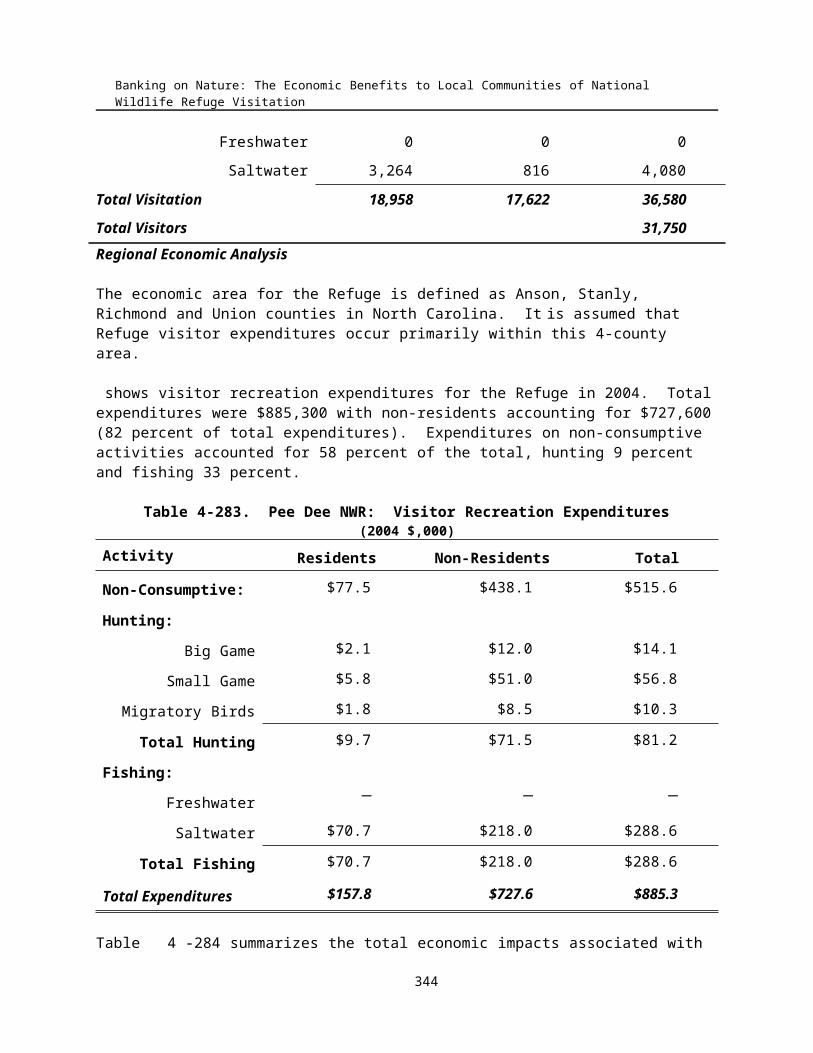
Sample Refuges Descriptions
Prime Hook National Wildlife Refuge
Description
Prime Hook NWR is located 22 miles southeast of Dover, DE, near the western shore of Delaware Bay. The refuge was established in 1963 to conserve an important segment of the Delaware Bay marshes, to protect migrating and wintering waterfowl habitat. The refuge is considered to have one of the best existing wetland habitat areas along the Atlantic Coast. The intensively managed freshwater impoundments have become important stop-over sites for spring and fall migrating shorebirds and wading birds. Endangered and threatened species management activities provide habitat for the Delmarva fox squirrel, nesting bald eagles and migrating peregrine falcons. Neotropical land birds passing through utilize the refuge's upland forested habitat during the fall and spring. The refuge's 10,000 acres are a diverse landscape featuring freshwater and salt marshes, woodlands, grasslands, scrub-brush habitats, ponds, bottomland forested areas, a 7 mile long creek, and agricultural lands. These cover types provide habitat for approximately 267 species of birds, 35 species of reptiles and amphibians and 36 different mammals.
Area Economy
The Prime Hook NWR is located in Sussex County in Delaware. New Castle and Kent counties are also a source of a significant number of refuge visitors. The area had a population of 818,200 in 2003, an increase of 15.8 percent from 1993 (note: These counties comprise all of the counties in the state of Delaware) compared with a 12 percent increase for the U.S. Total area employment increased by 19.4 percent from 1993 to 2003 compared with an18 percent increase in the U.S.
Per capita personal income increased in the area by 17.7 percent from 1993 to 2003. This compares with a 15.6 percent increase in the U.S. .
Table 5-391. Prime Hook NWR:Summary of Area Economy, 2003
(Population & Employment in 000’s; Per Capita Income in 2004 dollars)
Population Employment Per Capita Income
County 2003
Percent change
1993-2003 2003
Percent change
1993-2003 2003
Percent change
1993-2003New Castle, DE 515.1 11.4% 342.1 16.4% $39,679 17.8%
Sussex, DE 168.4 33.5% 85.9 29.5% $27,556 17.8%
Kent, DE 134.6 14.1% 77.4 22.4% $27,152 17.4%
Area Total 818.2 15.8% 505.4 19.4% $35,123 17.7%
United States 290,789.0 11.9% 167,174.4 17.9% $32,322 15.6%
Source: U.S. Department of Commerce 2003.
347
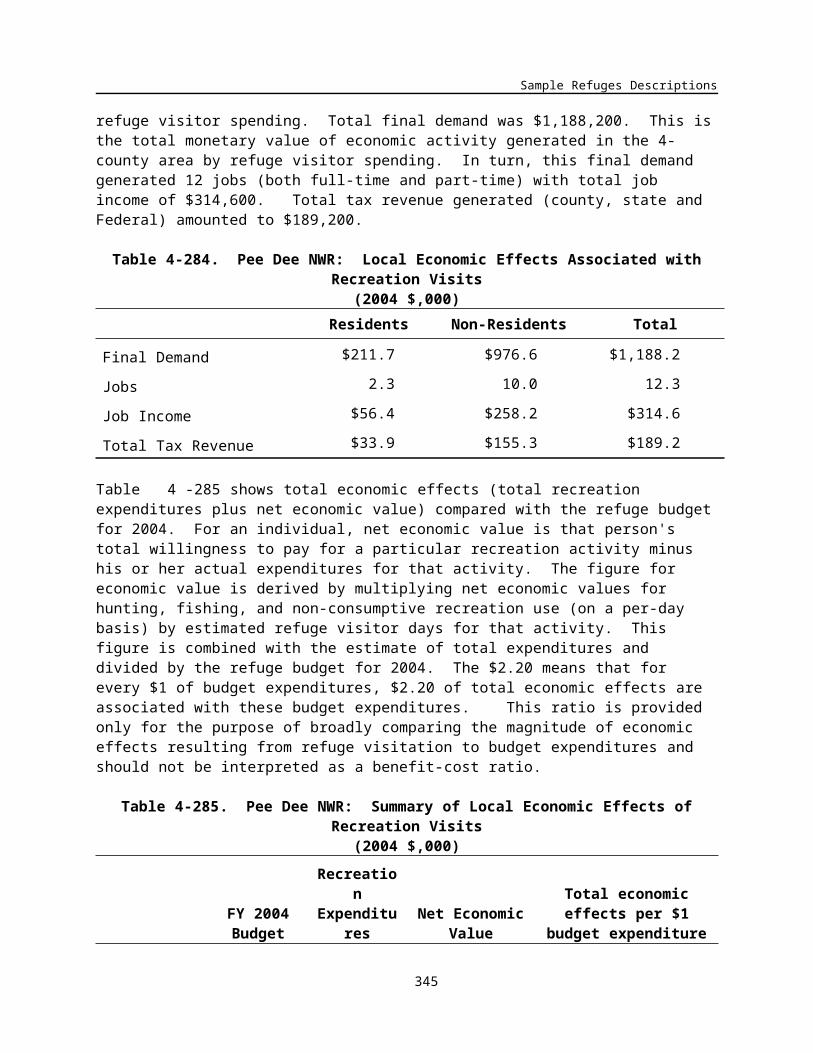
Banking on Nature: The Economic Benefits to Local Communities of National Wildlife Refuge Visitation
Activity Levels
Prime Hook NWR had 106,525 visitors in 2004. The vast majority of recreation visits, 108,611, were for non-consumptive activities. About 63 percent of recreation visits were undertaken by area residents.
Table 5-392. Prime Hook NWR: 2004 Recreation Visits
Activity Residents Non-Residents Total
Non-Consumptive:
Nature Trails 30,077 20,052 50,129
Observation Platforms 5,264 3,509 8,773
Other Wildlife Observation 25,916 17,277 43,193
Beach /Water Use 0 0 0
Other Recreation 3,910 2,606 6,516
Hunting:
Big Game 345 518 863
Small Game 71 4 75
Migratory Birds 1,100 367 1,466
Fishing:
Freshwater 5,357 282 5,639
Saltwater 3,572 188 3,760
Total Visitation 75,612 44,802 120,414
Total Visitors 106,525
Regional Economic Analysis
The economic area for the Refuge is defined as Sussex, New Castle, and Kent counties in Delaware. It is assumed that Refuge visitor expenditures occur primarily within this 3-county area.
Table 5-73 shows visitor recreation expenditures for the Refuge in 2004. Total expenditures were $1,043,600 with non-residents accounting for $795,000 (76 percent of total expenditures). Expenditures on non-consumptive activities accounted for 74 percent of the total, hunting 5 percent and fishing 21 percent.
348

Sample Refuges Descriptions
Table 5-393. Prime Hook NWR: Visitor Recreation Expenditures (2004 $,000)
Activity Residents Non-Residents Total
Non-Consumptive: $165.2 $606.6 $771.9
Hunting:
Big Game $3.3 $18.9 $22.2
Small Game $0.3 ─ $0.3
Migratory Birds $7.5 $19.7 $27.2
Total Hunting $11.0 $38.6 $49.7
Fishing:
Freshwater $36.2 $100.6 $136.9
Saltwater $36.1 $49.1 $85.2
Total Fishing $72.3 $149.8 $222.1
Total Expenditures $248.6 $795.0 $1,043.6
Table 5-394 summarizes the total economic impacts associated with refuge visitor spending. Total final demand was $1,456,600. This is the total monetary value of economic activity generated in the 3-county area by refuge visitor spending. In turn, this final demand generated 13 jobs (both full-time and part-time) with total job income of $419,400. Total tax revenue generated (county, state and Federal) amounted to $291,000.
Table 5-394. Prime Hook NWR: Local Economic Effects Associated with Recreation Visits (2004 $,000)
Residents Non-Residents Total
Final Demand $346.4 $1,110.2 $1,456.6
Jobs 3.0 9.8 12.8
Job Income $99.4 $320.0 $419.4
Total Tax Revenue $69.7 $221.3 $291.0
Table 5-395 shows total economic effects (total recreation expenditures plus net economic value) compared with the refuge budget for 2004. For an individual, net economic value is that person's total willingness to pay for a particular recreation activity minus his or her actual expenditures for that activity. The figure for economic value is derived by multiplying net economic values for hunting, fishing, and non-consumptive recreation use (on a per-day basis) by estimated refuge visitor days for that activity. This figure is combined with the estimate of total expenditures and divided by the refuge budget for 2004. The $1.85 means that for every $1 of budget expenditures, $1.85 of total economic effects are associated with these budget expenditures. This ratio is provided only for the purpose of broadly
349

Banking on Nature: The Economic Benefits to Local Communities of National Wildlife Refuge Visitation
comparing the magnitude of economic effects resulting from refuge visitation to budget expenditures and should not be interpreted as a benefit-cost ratio.
Table 5-395. Prime Hook NWR: Summary of Local Economic Effects of Recreation Visits (2004 $,000)
FY 2004 Budget
RecreationExpenditures
Net Economic Value
Total economic effects per $1 budget expenditure
Prime Hook NWR
$1,290.7 $1,043.6 $1,344.4 $1.85
350

Sample Refuges Descriptions
Rachel Carson National Wildlife Refuge
Description
Rachel Carson National Wildlife Refuge was established in 1966 in cooperation with the State of Maine to protect valuable salt marshes and estuaries for migratory birds. Scattered along 50 miles of coastline in York and Cumberland counties, the refuge consists of ten divisions between Kittery and Cape Elizabeth. It will contain approximately 7,600 acres when land acquisition is complete.
Major habitat types present on the refuge include forested upland, barrier beach/dune, coastal meadows, tidal salt marsh, and the distinctive rocky coast. Refuge marshes, estuaries and adjacent forests promote abundant wildlife. Refuge and adjacent lands provide food and essential habitat for over 250 species of birds. Many migrating birds, for which the refuge was established, revitalize themselves here as they travel to and from northern breeding areas. Shorebirds are abundant during spring and fall migrations.
Waterfowl are common year-round; black ducks, mallards, Canada geese, and common eiders are often found in marshes and waterways. Warblers, thrushes and other songbirds migrate through or stop to nest in the forests, fields and marshes of the refuge. Spring and fall provide excellent opportunities to see migrating birds of prey.
The refuge supports many species of mammals, reptiles and amphibians, including white-tailed deer, river otter, beaver, fox, coyote, moose, harbor seals, painted and spotted turtles, spring peepers, wood frogs and tree frogs are just a few of the representative species supported by the refuge.
Area Economy
The Rachel Carson NWR is located in York and Cumberland counties in Maine. The area had a population of 470,400 in 2003, an increase of 13 percent from 1993 compared with a 5.4 percent increase for the state of Maine and a 12 percent increase for the U.S. Total area employment increased by 21.3 percent from 1993 to 2003 compared with a 15.7 percent increase in Maine and a 18 percent increase in the U.S.
Per capita personal income increased in the area by 22.3 percent from 1993 to 2003. This compares with a 22.7 percent increase in Maine and a 15.6 percent increase in the U.S.
Activity Levels
Rachel Carson NWR had 250,000 visitors in 2004. The vast majority of recreation visits, 229,400 were for non-consumptive activities. About 58 percent of recreation visits were undertaken by area residents.
351
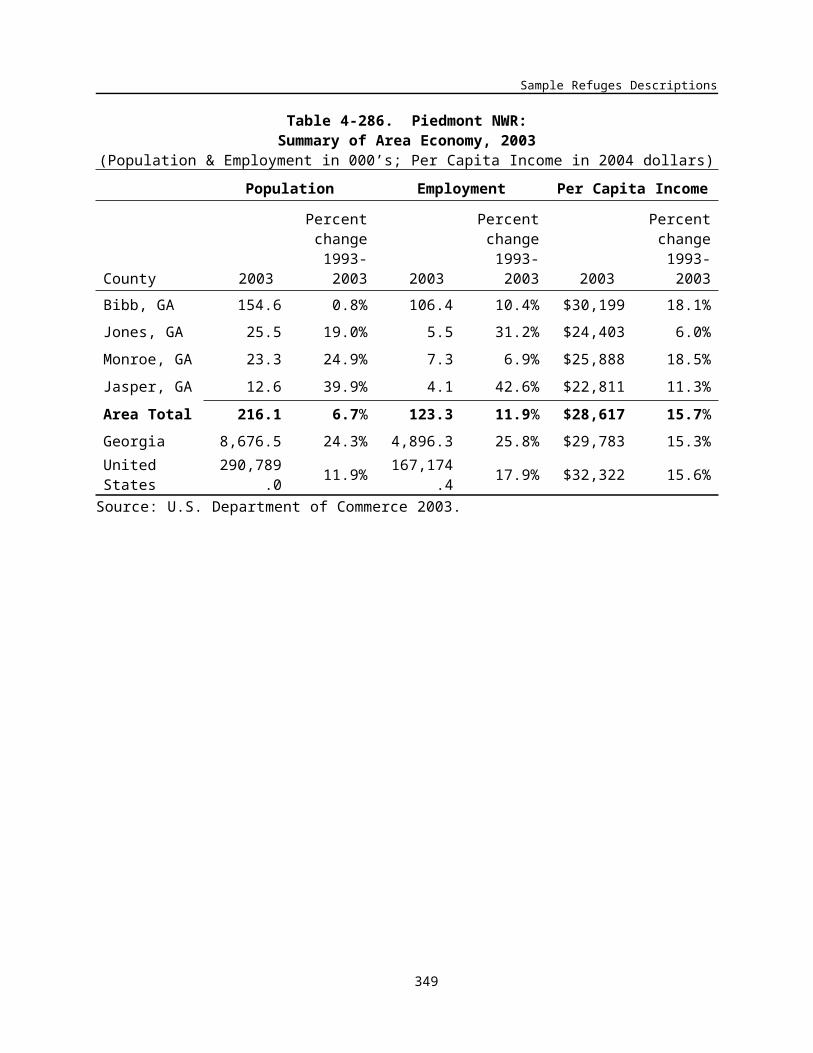
Banking on Nature: The Economic Benefits to Local Communities of National Wildlife Refuge Visitation
Table 5-396. Rachel Carson NWR:Summary of Area Economy, 2003
(Population & Employment in 000’s; Per Capita Income in 2004 dollars)
Population Employment Per Capita Income
County 2003
Percent change
1993-2003 2003
Percent change
1993-2003 2003
Percent change
1993-2003Cumberland, ME 272.2 10.1% 219.9 22.0% $36,933 23.5%
York, ME 198.2 17.3% 93.8 19.7% $30,383 21.1%
Area Total 470.4 13.0% 313.7 21.3% $34,173 22.3%
Maine 1,309.2 5.4% 806.4 15.7% $29,951 22.7%
United States 290,789.0 11.9% 167,174.4 17.9% $32,322 15.6%
Source: U.S. Department of Commerce 2003.
Table 5-397. Rachel Carson NWR: 2004 Recreation Visits
Activity Residents Non-Residents Total
Non-Consumptive:
Nature Trails 97,500 97,500 195,000
Observation Platforms 500 500 1,000
Other Wildlife Observation 900 100 1,000
Beach /Water Use 400 600 1,000
Other Recreation 31,400 0 31,400
Hunting:
Big Game 3,400 600 4,000
Small Game 475 25 500
Migratory Birds 1,890 210 2,100
Fishing:
Freshwater 0 0 0
Saltwater 1,360 240 1,600
Total Visitation 137,825 99,775 237,600
Total Visitors 250,000
Regional Economic Analysis
352

Sample Refuges Descriptions
The economic area for the Refuge is defined as York and Cumberland counties in Maine. It is assumed that Refuge visitor expenditures occur primarily within this 2-county area.
Table 5-398 shows visitor recreation expenditures for the Refuge in 2004. Total expenditures were $902,700 with non-residents accounting for $677,400 (83 percent of total expenditures). Expenditures on non-consumptive activities accounted for 83 percent of the total, hunting 10 percent and fishing 7 percent.
Table 5-398. Rachel Carson NWR: Visitor Recreation Expenditures (2004 $,000)
Activity Residents Non-Residents Total
Non-Consumptive: $144.9 $602.7 $747.6
Hunting:
Big Game $37.7 $25.5 $63.3
Small Game $2.4 $0.5 $2.9
Migratory Birds $12.8 $11.3 $24.1
Total Hunting $52.9 $37.3 $90.2
Fishing:
Freshwater ─ ─ ─
Saltwater $27.5 $37.4 $64.9
Total Fishing $27.5 $37.4 $64.9
Total Expenditures $225.3 $677.4 $902.7
Table 5-399 summarizes the total economic impacts associated with refuge visitor spending. Total final demand was $1,321,400. This is the total monetary value of economic activity generated in the 2-county area by refuge visitor spending. In turn, this final demand generated 14 jobs (both full-time and part-time) with total job income of $377,800. Total tax revenue generated (county, state and Federal) amounted to $204,200.
Table 5-399. Rachel Carson NWR: Local Economic Effects Associated with Recreation Visits (2004 $,000)
Residents Non-Residents Total
Final Demand $334.0 $987.4 $1,321.4
Jobs 3.5 10.5 14.0
Job Income $93.8 $284.0 $377.8
Total Tax Revenue $53.7 $150.5 $204.2
353

Banking on Nature: The Economic Benefits to Local Communities of National Wildlife Refuge Visitation
Table 5-400 shows total economic effects (total recreation expenditures plus net economic value) compared with the refuge budget for 2004. For an individual, net economic value is that person's total willingness to pay for a particular recreation activity minus his or her actual expenditures for that activity. The figure for economic value is derived by multiplying net economic values for hunting, fishing, and non-consumptive recreation use (on a per-day basis) by estimated refuge visitor days for that activity. This figure is combined with the estimate of total expenditures and divided by the refuge budget for 2004. The $3.40 means that for every $1 of budget expenditures, $3.40 of total economic effects are associated with these budget expenditures. This ratio is provided only for the purpose of broadly comparing the magnitude of economic effects resulting from refuge visitation to budget expenditures and should not be interpreted as a benefit-cost ratio.
Table 5-400. Rachel Carson NWR: Summary of Local Economic Effects of Recreation Visits (2004 $,000)
FY 2004 Budget
RecreationExpenditures
Net Economic Value
Total economic effects per $1 budget expenditure
Rachel Carson NWR
$655.4 $902.7 $1,323.5 $3.40
354

Sample Refuges Descriptions
Region 6
Region 6 includes the states of Colorado, Kansas, Montana, North Dakota, Nebraska, South Dakota, Utah, and Wyoming. Sample refuges selected within this region include:
Arrowwood NWR (North Dakota)Audubon NWR (North Dakota)
Bowdoin NWR (Montana)Boyer Chute NWR (Nebraska)Fort Niobrara NWR (Nebraska)Lacreek NWR (South Dakota)Lee Metcalf NWR (Montana)
Medicine Lake NWR (Montana)
355

Banking on Nature: The Economic Benefits to Local Communities of National Wildlife Refuge Visitation
Arrowwood National Wildlife Refuge
Description
Arrowwood National Wildlife Refuge (NWR) was established in 1935 as a refuge and breeding ground for migratory birds and other wildlife. It is an important link in a chain of refuges extending from the prairie lands of the Canadian border to the Gulf of Mexico. Located along the James River in east-central North Dakota, Arrowwood NWR is 15,934 acres in size and is made up of lakes, marshes, prairie grasslands, wooded coulees, and cultivated fields.
Arrowwood NWR is managed primarily to attract waterfowl during migration, but it also provides excellent nesting habitat for ducks, geese, grebes, shorebirds, and upland perching birds. As the James River meanders its way across the prairie and through the Refuge, it passes through four naturally occurring riverine lakes. These lakes have been modified to enhance water management capabilities and provide a variety of wetland habitats.
Opportunities to observe wildlife in their natural habitat are numerous. Waterfowl, perching birds, owls, hawks, and even eagles, along with deer and other mammals, can be seen along the 5.5-mile auto tour route. Associated with the Warbler Woodland Watchable Wildlife Area is a short, interpreted hiking trail which winds through wooded draws, prairie grasslands, and along the lakeshore affording visitors many opportunities to observe wildlife, especially one of the more than 24 warbler species known to use the Refuge.
Area Economy
The area economy for Arrowwood NWR includes Foster and Stutsman Counties in North Dakota (Table 6-1). The refuge is located within both of these counties. The main cities for commerce are Carrington and Jamestown, which are in Foster and Stutsman Counties, respectively.
In 2003, the area population was 24,700 people – a 4.9 percent decrease from 1993. This decrease was slightly larger than North Dakota’s population change (-1.2 percent). Although area population declined, area employment increased 8.7 percent during the same time period. The area’s average per capita income increased by 24.8 percent to $28,173 between 1993 and 2003. This rate of increase is higher than the United States (15.8 percent).
Activity Levels
As shown in Table 6-402, visitors to Arrowwood NWR enjoy various non-consumptive activities (76 percent), hunting (19 percent), and fishing (5 percent). For non-consumptive activities, “other wildlife observation” includes roadside wildlife observation and using the grouse blind, while “other recreation” consists of wild food gathering, horseback riding, bicycling, and other activities. Hunting is permitted for deer, late season upland game birds, fox, and cottontail rabbit. Residents accounted for 5,526 visits, while non-residents accounted for 1,270 visits.
356

Sample Refuges Descriptions
Table 6-401. Arrowwood NWR:Summary of Area Economy, 2003
(Population & Employment in 000’s; Per Capita Income in 2004 dollars)
Population Employment Per Capita Income
County 2003
Percent change
1993-2003 2003
Percent change
1993-2003 2003
Percent change
1993-2003Foster, ND 3.5 -9.2% 2.5 10.5% $30,816 50.1%Stutsman, ND 21.2 -4.2% 14.1 8.4% $27,733 21.0%
Area Total 24.7 -4.9% 16.6 8.7% $28,173 24.8%North Dakota 633.4 -1.2% 456.7 14.3% $29,692 28.3%
United States 290,789.0 11.9% 167,174.4 17.9% $32,310 15.8%
Source: U.S. Department of Commerce 2003.
Table 6-402. Arrowwood NWR: 2004 Recreation Visits
Activity Residents Non-Residents Total
Non-Consumptive:
Nature Trails 2,687 896 3,583
Observation Platforms 77 9 85
Other Wildlife Observation 372 93 465
Beach /Water Use 52 3 55
Other Recreation 943 10 953
Hunting:
Big Game 900 225 1,125
Small Game 162 18 180
Migratory Birds 0 0 0
Fishing:
Freshwater 333 18 350
Saltwater 0 0 0
Total Visitation 5,526 1,270 6,796
Total Visitors 4,975
357

Banking on Nature: The Economic Benefits to Local Communities of National Wildlife Refuge Visitation
Regional Economic Analysis
In FY 2004, visitor recreation expenditures totaled $68,300 (Table 6-403). The majority of expenditures were related to big game hunting ($42,600). Resident and non-resident expenditures were distributed fairly evenly, $33,800 and $34,500, respectively.
Table 6-403. Arrowwood NWR: Visitor Recreation Expenditures (2004 $,000)
Activity Residents Non-Residents Total
Non-Consumptive: $11.0 $9.5 $20.5
Hunting:
Big Game $18.7 $23.9 $42.6
Small Game $1.5 $0.6 $2.1
Migratory Birds ─ ─ ─
Total Hunting $20.2 $24.5 $44.7
Fishing:
Freshwater $2.6 $0.5 $3.1
Saltwater ─ ─ ─
Total Fishing $2.6 $0.5 $3.1
Total Expenditures $33.8 $34.5 $68.3
In FY 2004, recreational visitor spending resulted in $87,600 in final demand (Table 6-404). This is the total monetary value of economic activity generated in the local area economy by recreational visitors. This final demand generated 2 jobs (both part-time and full-time) and $30,400 in job income.
Table 6-404. Arrowwood NWR: Local Economic Effects Associated with Recreation Visits (2004 $,000)
Residents Non-Residents Total
Final Demand $43.5 $44.1 $87.6
Jobs 1 1 2
Job Income $14. $15.8 $30.4
Total Tax Revenue $9.8 $10.9 $20.8
The refuge budget and the local economic effects of recreation visits are compared in Table 6-405. In FY 2004, recreational benefits (recreation-related expenditures plus net economic value) totaled $156,400, and FY 2003 budget expenditures summed to $839,900. Comparing these two estimates shows that for every $1 of budget expenditures, $0.19 in recreational benefits are derived. This ratio is provided to broadly compare the magnitude of the two estimates and should not be used as a benefit-cost ratio. In
358

Sample Refuges Descriptions
addition to recreational benefits, Arrowwood NWR provides a variety of other benefits including ecological values which are not quantified in this analysis. In particular, the refuge provides important habitat for migrating waterfowl. The refuge budget also contributes an additional stimulus to the local economy.
Table 6-405. Arrowwood NWR: Summary of Local Economic Effects of Recreation Visits (2004 $,000)
FY 2004 Budget
RecreationExpenditures
Net Economic Value
Total economic effects per $1 budget expenditure
Arrowwood NWR
$839.9 $68.3 $88.1 $0.19
359

Banking on Nature: The Economic Benefits to Local Communities of National Wildlife Refuge Visitation
Audubon National Wildlife Refuge
Description
Audubon National Wildlife Refuge (NWR) is located in west-central North Dakota and is part of a landscape marked by numerous wetlands or "potholes" that remained after glaciers melted more than 10,000 years ago. This landscape is commonly called the "Prairie Pothole Region." The Prairie Pothole Region extends into Canada, Minnesota, western Iowa, South Dakota, and eastern Montana. The Refuge encompasses 14,735 acres of native prairie, planted grasslands, and wetlands. These lands are managed to provide food, water, shelter, and space to meet the needs of waterfowl and other migratory birds, threatened and endangered species, and resident wildlife. The Refuge is home to 243 bird, 34 mammal, 5 reptile, 4 amphibian, and 37 fish species.
Area Economy
McLean County is located in North Dakota and contains the entirety of the Refuge lands. Major communities include Bismarck, Minot, Garrison, and Washburn. The area economy is assumed to include Burleigh, McLean, and Ward Counties in North Dakota (Table 6-406). It this area that is used to estimate the economic effects of recreational use on the refuge.
While the area population increased 4.2 percent from 1993 to 2003, both McLean and Ward counties had decreasing populations. During the same time period, area employment increased 21.5 percent. This employment increase was higher than both North Dakota (14.3 percent) and the United States (17.9 percent). In 2003, the area’s average per capita income was $31,447 – a 24.2 percent increase from 1993.
Table 6-406. Audubon NWR:Summary of Area Economy, 2003
(Population & Employment in 000’s; Per Capita Income in 2004 dollars)
Population Employment Per Capita Income
County 2003
Percent change
1993-2003 2003
Percent change
1993-2003 2003
Percent change
1993-2003
Burleigh, ND 71.8 12.5% 58.7 30.1% $32,161 23.6%
McLean, ND* 8.9 -10.0% 5.1 4.0% $29,152 18.2%
Ward, ND 56.4 -2.6% 40.8 13.0% $30,902 25.3%
Area Total 137.1 4.2% 104.6 21.5% $31,447 24.2%
North Dakota 633.4 -1.2% 456.7 14.3% $29,692 28.3%
United States 290,789.0 11.9% 167,174.4 17.9% $32,310 15.8%
Source: U.S. Department of Commerce 2003.
360

Sample Refuges Descriptions
Activity Levels
In FY 2004, there were 16,027 visits on Audubon NWR (Table 6-407). Non-consumptive activities and freshwater fishing were the most popular activities, with 43 percent and 48 percent of the activities, respectively. Ice fishing is permitted as soon as ice covers the water. Walleye, perch, and northern pike are popular game fish in Lake Audubon. Over two-thirds of the visits were by non-residents (11,228 visits).
Table 6-407. Audubon NWR: 2004 Recreation Visits
Activity Residents Non-Residents Total
Non-Consumptive:
Nature Trails 1,120 4,480 5,600
Observation Platforms 0 0 0
Other Wildlife Observation 210 840 1,050
Beach /Water Use 0 0 0
Other Recreation 48 192 240
Hunting:
Big Game 74 74 147
Small Game 248 992 1,240
Migratory Birds 0 0 0
Fishing:
Freshwater 3,100 4,650 7,750
Saltwater 0 0 0
Total Visitation 4,800 11,228 16,027
Total Visitors 18,804
Regional Economic Analysis
Visitor recreation expenditures totaled $444,700, with fishing related expenditures accounting for $387,700 (68 percent) (Table 6-8). Non-consumptive related expenditures totaled $106,300, and hunting related expenditures totaled $34,200. Non-residents accounted for 87 percent ($387,700) of all expenditures.
361

Banking on Nature: The Economic Benefits to Local Communities of National Wildlife Refuge Visitation
Table 6-408. Audubon NWR: Visitor Recreation Expenditures (2004 $,000)
Activity Residents Non-Residents Total
Non-Consumptive: $5.0 $101.3 $106.3
Hunting:
Big Game $1.0 $5.2 $6.2
Small Game $1.7 $26.2 $28.0
Migratory Birds ─ ─ ─
Total Hunting $2.8 $31.4 $34.2
Fishing:
Freshwater $49.3 $254.9 $304.2
Saltwater ─ ─ ─
Total Fishing $49.3 $254.9 $304.2
Total Expenditures $57.0 $387.7 $444.7
Table 6-409 summarizes the local economic effects associated with recreation visits. Total final demand associated with recreation spending summed to $593,000. This final demand generated 9 jobs and $199,000 in job income. The majority of economic effects are associated with non-resident visitor expenditures.
Table 6-409. Audubon NWR: Local Economic Effects Associated with Recreation Visits (2004 $,000)
Residents Non-Residents Total
Final Demand $77.0 $516.0 $593.0
Jobs 1 8 9
Job Income $26.0 $173.0 $199.0
Total Tax Revenue $17.5 $123.8 $141.2
Table 6-410 compares the refuge budget and the local economic effects of recreation visits. In FY 2004, recreational benefits (recreation-related expenditures plus net economic value) totaled about $800,000, and the FY 2003 budget expenditures summed to about $339,000. Comparing these two estimates shows that for every $1 of budget expenditures, $2.36 in recreational benefits are derived. This ratio is provided to broadly compare the magnitude of the two estimates and should not be used as a benefit-cost ratio. In addition to recreational benefits, Audubon NWR provides a variety of other benefits including ecological and educational values which are not quantified in this analysis. In particular, as part of the Prairie Pothole Region, the refuge provides important habitat for waterfowl and other migratory birds. The refuge budget also contributes a stimulus to the local economy, through payroll, maintenance, and operation expenditures.
362

Sample Refuges Descriptions
Table 6-410. Audubon NWR: Summary of Local Economic Effects of Recreation Visits (2004 $,000)
FY 2004 Budget
RecreationExpenditures
Net Economic Value
Total economic effects per $1 budget expenditure
Audubon NWR $338.8 $444.7 $355.2 $2.36
363

Banking on Nature: The Economic Benefits to Local Communities of National Wildlife Refuge Visitation
Bowdoin National Wildlife Refuge
Description
Bowdoin National Wildlife Refuge (NWR) is located 7 miles east of Malta in the Milk River Valley of north-central Montana. Bowdoin NWR encompasses 15,551 acres, including more than 6,600 acres of wetlands. Established in 1936 to provide habitat for migrating, nesting, and feeding birds, the Refuge is home to more than 260 species of birds, 26 species of mammals, and a variety of reptiles, amphibians, and fish. Many of these wildlife species can be seen from the Refuge’s 15-mile auto tour loop.
Area Economy
The area economy is defined as Phillips County, which entirely encompasses the Refuge (Table 6-411). Thus, Phillips County comprises the local study area for estimating the economic effects of the recreational use of the Refuge.
From 1993 to 2003, Phillips County population declined 15.3 percent, while the Montana population and the United States population increased 8.7 percent and 11.9 percent, respectively. During the same time period, the county employment also declined 4.8 percent. In 2003, the area’s average per capita income was $20,847 – a 2.1 percent decrease from 1993.
Table 6-411. Bowdoin NWR:Summary of Area Economy, 2003
(Population & Employment in 000’s; Per Capita Income in 2004 dollars)
Population Employment Per Capita Income
County 2003
Percent change
1993-2003 2003
Percent change
1993-2003 2003
Percent change
1993-2003
Phillips, MT 4.3 -15.3% 2.7 -4.8% $20,847 -2.1%
Area Total 4.3 -15.3% 2.7 -4.8% $20,847 -2.1%Montana 918.2 8.7% 584.0 23.4% $26,083 12.3%
United States 290,789.0 11.9% 167,174.4 17.9% $32,310 15.8%
Source: U.S. Department of Commerce 2003.
Activity Levels
In FY 2004, there were 5,217 recreation visits at Bowdoin NWR (Table 6-412). Refuge visitors enjoyed nature trails, wildlife observation, other recreation, and small game and migratory bird hunts. Seventy-seven percent of visits were for non-consumptive activities. One activity that the refuge offers is a 15-mile auto tour route, which offers visitors an opportunity to view wildlife up-close from their vehicle. Bowdoin NWR also offers a 0.4-mile accessible pedestrian trail with a photo blind and observation deck. The majority of visits were by non-residents (4,292 visits).
364

Sample Refuges Descriptions
Table 6-412. Bowdoin NWR: 2004 Recreation Visits
Activity Residents Non-Residents Total
Non-Consumptive:
Nature Trails 265 1,058 1,323
Observation Platforms 0 0 0
Other Wildlife Observation 529 2,117 2,646
Beach /Water Use 0 0 0
Other Recreation 13 51 64
Hunting:
Big Game 0 0 0
Small Game 98 878 975
Migratory Birds 21 188 209
Fishing:
Freshwater 0 0 0
Saltwater 0 0 0
Total Visitation 925 4,292 5,217
Total Visitors 7,147
Regional Economic Analysis
Visitor expenditures related to recreational activities on the refuge totaled $90,100 (Table 6-13). Two-thirds of these expenditures ($62,200) are attributable to non-consumptive activities. Non-residents spent $86,400 (96 percent of all expenditures).
365

Banking on Nature: The Economic Benefits to Local Communities of National Wildlife Refuge Visitation
Table 6-413. Bowdoin NWR: Visitor Recreation Expenditures (2004 $,000)
Activity Residents Non-Residents Total
Non-Consumptive: $2.9 $59.3 $62.2
Hunting:
Big Game ─ ─ ─
Small Game $0.7 $23.2 $23.9
Migratory Birds $0.1 $3.9 $4.0
Total Hunting $0.8 $27.1 $27.9
Fishing:
Freshwater ─ ─ ─
Saltwater ─ ─ ─
Total Fishing ─ ─ ─
Total Expenditures $3.7 $86.4 $90.1
In FY 2004, recreation visits resulted in $111,700 in final demand in the local area economy (Table 6-414). This is the total monetary value of economic activity generated by recreational visitors to Bowdoin NWR. This final demand generated 3 jobs (both part-time and full-time), $36,500 in job income, and $23,600 in total tax revenue. The majority of these effects are attributable to expenditures by non-resident visitors.
Table 6-414. Bowdoin NWR: Local Economic Effects Associated with Recreation Visits (2004 $,000)
Residents Non-Residents Total
Final Demand $4.7 $107.0 $111.7
Jobs 1 2 3
Job Income $1.5 $35.0 $36.5
Total Tax Revenue $0.9 $22.7 $23.6
The refuge budget and the local economic effects of recreation visits are compared in Table 6-415. In FY 2004, recreational benefits (recreation-related expenditures plus net economic value) totaled $149,100, and the FY 2003 budget expenditures summed to $796,700. Comparing these two estimates shows that for every $1 of budget expenditures, $0.19 in recreational benefits are derived. This ratio is provided to broadly compare the magnitude of the two estimates and should not be used as a benefit-cost ratio. In addition to recreational benefits, Bowdoin NWR provides a variety of other benefits including ecological and educational values which are not quantified in this analysis. In particular, the refuge provides important habitat for migrating, nesting, and feeding birds. The refuge budget also contributes a stimulus to the local economy, through payroll, maintenance, and operation expenditures.
366

Sample Refuges Descriptions
Table 6-415. Bowdoin NWR: Summary of Local Economic Effects of Recreation Visits (2004 $,000)
FY 2004 Budget Expenditures
NetEconomic Value
Total economic value per $1 budget expenditure
Bowdoin NWR
$796.7 $90.1 $59.0 $0.19
Note: The FY 2004 budget shown here is for the entire refuge complex. The budget for Bowdoin NWR would be smaller.
367

Banking on Nature: The Economic Benefits to Local Communities of National Wildlife Refuge Visitation
Boyer Chute National Wildlife Refuge
Description
Boyer Chute National Wildlife Refuge (NWR) was established to recover fish and wildlife habitat in and along the Missouri River. The purpose of the Boyer Chute Restoration Project is to restore essential wildlife habitat that became scarce when the Missouri River was "improved" for navigation half a century ago. River channelization, wetland drainage, and conversion of river bottom floodplain areas to agricultural, industrial, and municipal uses had resulted in the loss of over 500,000 acres of habitat along the navigable stretch of the Missouri River floodplain.
The Boyer Chute project is a joint Federal and local conservation partnership success story. The project has restored the area to near pre-channelization condition without affecting navigation on the main stem of the Missouri River. Boyer Chute is once again a functioning part of the river. Close to 3,350 acres of floodplain woodland, tallgrass prairie, and wetland habitats now benefit Missouri River fishes, migratory birds, endangered species, and resident wildlife.
Area Economy
Washington County is located in Nebraska and contains the entirety of the refuge lands. The economic hub for the refuge includes Douglas, Harrison, and Pottawattamie counties. It this four-county area that is used to estimate the economic effects of recreational use on the refuge.
Table 6-16 summarizes the area economy for Boyer Chute NWR. The area population increased 9.5 percent from 1993 to 2001, which is slightly less than the United States (11.9 percent) but higher than both Nebraska (6.9 percent) and Iowa (3.7 percent). During the same time period, area employment increased 14.9 percent, compared to a 15.3 percent increase in Nebraska and a 12.4 percent increase in Iowa. In 2003, the area’s per capita income ($35,796) was higher than Nebraska ($30,983), Iowa ($29,095), and the United States ($32,310).
Activity Levels
In FY 2004, Boyer Chute NWR had 22,044 total recreation visits and 21,610 total visitors (Table 6-417. The number of recreation visits is higher than the number of visitors because some visitors choose to partake in more than one activity. For example, a visitor that enjoys the nature trails in the morning may fish in the afternoon (1 visitor, 2 visits).
The majority of visits were non-consumptive activities, especially nature trails (16,816 visits). “Other recreation” includes biking, picnicking, and cross-country skiing. Ninety percent of visits (19,840) were by visitors from the local area.
368

Sample Refuges Descriptions
Table 6-416. Boyer Chute NWR:Summary of Area Economy, 2003
(Population & Employment in 000’s; Per Capita Income in 2004 dollars)
Population Employment Per Capita Income
County 2003
Percent change
1993-2003 2003
Percent change
1993-2003 2003
Percent change
1993-2003
Douglas, NE 476.5 10.2% 384.5 13.7% $38,651 26.6%
Harrison, IA 15.7 5.4% 6.8 9.4% $26,395 24.8%Pottawattamie, IA 88.5 5.8% 46.9 22.0% $29,351 29.7%
Washington, NE* 19.5 13.5% 10.6 39.2% $32,200 22.6%
Area Total 600.2 9.5% 448.8 14.9% $35,796 23.7%Nebraska 1,737.5 6.9% 1,184.7 15.3% $30,983 20.0%
Iowa 2,942.0 3.7% 1,912.4 12.4% $29,095 18.9%
United States 290,789.0 11.9% 167,174.4 17.9% $32,310 15.8%
Source: U.S. Department of Commerce 2003.
Table 6-417. Boyer Chute NWR: 2004 Recreation Visits
Activity Residents Non-Residents Total
Non-Consumptive:
Nature Trails 15,134 1,682 16,816
Observation Platforms 0 0 0
Other Wildlife Observation 0 0 0
Beach /Water Use 0 0 0
Other Recreation 2,786 310 3,096
Hunting:Big Game 41 5 46
Small Game 0 0 0
Migratory Birds 0 0 0
Fishing:
Freshwater 1,877 209 2,086
Saltwater 0 0 0
Total Visitation 19,840 2,204 22,044
369

Banking on Nature: The Economic Benefits to Local Communities of National Wildlife Refuge Visitation
Total Visitors 21,610
370
Sample Refuges Descriptions
Regional Economic Analysis
Recreational visitors to Boyer Chute NWR spent approximately $123,000 in FY 2004 (Table 6-418). The majority of these expenditures were attributable to non-consumptive activities ($101,500). Furthermore, about two-thirds were by residents in the local area ($80,400).
Table 6-418. Boyer Chute NWR: Visitor Recreation Expenditures (2004 $,000)
Activity Residents Non-Residents Total
Non-Consumptive: $64.9 $36.6 $101.5
Hunting:
Big Game $0.6 $0.3 $0.9
Small Game ─ ─ ─
Migratory Birds ─ ─ ─
Total Hunting $0.6 $0.3 $0.9
Fishing:
Freshwater $14.9 $5.7 $20.6
Saltwater ─ ─ ─
Total Fishing $14.9 $5.7 $20.6
Total Expenditures $80.4 $42.6 $123.0
Table 6-19 shows the economic effects associated with recreation visits in FY 2004. Final demand totaled $192,900, which generated 3 jobs (both part-time and full-time). Resident recreational expenditures accounted for twice as many jobs (2) as non-resident recreational expenditures.
Table 6-419. Boyer Chute NWR: Local Economic Effects Associated with Recreation Visits (2004 $,000)
Residents Non-Residents Total
Final Demand $127.7 $65.2 $192.9
Jobs 2 1 3
Job Income $42.9 $21.9 $64.8
Total Tax Revenue $17.1 $9.5 $26.7
Table 6-420 compares the refuge budget and the local economic effects of recreation visits. In FY 2004, recreational benefits (recreation-related expenditures plus net economic value) totaled $330,000, and the FY 2004 budget expenditures summed to $494,100. Comparing these two estimates shows that for every $1 of budget expenditures, $0.67 in recreational benefits are derived. This ratio is provided to broadly
371

Banking on Nature: The Economic Benefits to Local Communities of National Wildlife Refuge Visitation
compare the magnitude of the two estimates and should not be used as a benefit-cost ratio. In addition to recreational benefits, Boyer Chute NWR provides a variety of other benefits including ecological and educational values which are not quantified in this analysis. In particular, the refuge is restoring the ecosystem along a section of the Missouri River to support wildlife, migratory birds, and fish. The refuge budget also contributes a stimulus to the local economy, through payroll, maintenance, and operation expenditures.
Table 6-420. Boyer Chute NWR: Summary of Local Economic Effects of Recreation Visits (2004 $,000)
FY 2004 Budget
RecreationExpenditures
Net Economic Value
Total economic effects per $1 budget expenditure
Boyer Chute NWR
$494.1 $123.0 $207.0 $0.67
372

Sample Refuges Descriptions
Fort Niobrara National Wildlife Refuge
Description
Fort Niobrara National Wildlife Refuge (NWR) is 19,131 acres in size and is located 4 miles east of the city of Valentine along the Niobrara River in Nebraska. This region of the country is the point of convergence of six distinct ecosystems. The plant communities include sandhills prairie, mixed prairie, Rocky Mountain coniferous forest, eastern deciduous forest, and northern boreal forest. This habitat diversity explains the unique diversity of plants and animals found here.
A stopover spot for numerous neo-tropical migrants, the Refuge hosts some 225 species of birds and 13 commonly seen species of mammals. A prairie dog town on the Refuge covers more than 100 acres, and offers excellent viewing opportunities.
Approximately 350 head of buffalo and 70 head of elk can be found on the Refuge. Also, numerous species of reptiles, plants, and insects can be seen at Fort Niobrara NWR. The rolling sandhills and breaks along the Niobrara River canyon are home to a great variety of wildlife. In the winter, bald and golden eagles can be seen along the river. Wild turkeys can be spotted among the birch, burr oak, and Ponderosa pine.
Area Economy
Cherry County, Nebraska encompasses the entirety of the refuge lands. The majority of the recreational visitor expenditures are spent in the major community, Valentine, which is also in Cherry County. Thus, most of the economic impacts of Refuge visitation will occur within Cherry County.
The area economy is summarized in Table 6-421. The county population declined 3.3 percent from 1993 to 2003, which was lower than both Nebraska (6.9 percent) and the United States (11.9 percent). During the same time period, county employment increased 9.0 percent. In 2003, the county’s average per capita income increased 20.3 percent to $25,447.
Activity Levels
The Refuge offers many activities for visitors. Bison, elk, deer, and prairie dogs can be seen along the wildlife drive at all times of the year. Interpretive displays at the visitor center describe the history and ecology of the area. Hiking trails lead to Fort Falls and, for the more adventurous, into the Niobrara River Wilderness Area. Canoeing or tubing through down the Niobrara National Scenic River is a popular activity on the Refuge.
In FY 2004, recreation visits totaled 207,069 and visitors totaled 95,000 (Table 6-22). Recreation visits were greater than total visitors because some visitors chose to enjoy more than one activity. (For example, one visitor using the nature trails and the observation platforms counts as two visits.)
With the exception of 60 freshwater visits, all visits were for non-consumptive activities. The most popular non-consumptive activity was the nature trails (103,963 visits). “Other wildlife observation” includes wildlife photography.
373

Banking on Nature: The Economic Benefits to Local Communities of National Wildlife Refuge Visitation
Table 6-421. Fort Niobrara NWR:Summary of Area Economy, 2003
(Population & Employment in 000’s; Per Capita Income in 2004 dollars)
Population Employment Per Capita Income
County 2003
Percent change
1993-2003 2003
Percent change
1993-2003 2003
Percent change
1993-2003
Cherry, NE 6.0 -3.3% 4.1 9.0% $25,447 20.3%
Area Total 6.0 -3.3% 4.1 9.0% $25,447 20.3%Nebraska 1,737.5 6.9% 1,184.7 15.3% $30,983 20.0%
United States 290,789.0 11.9% 167,174.4 17.9% $32,310 15.8%
Source: U.S. Department of Commerce 2003.
Table 6-422. Fort Niobrara NWR: 2004 Recreation Visits
Activity Residents Non-Residents Total
Non-Consumptive:
Nature Trails 67,576 36,387 103,963
Observation Platforms 16,000 4,000 20,000
Other Wildlife Observation 14,000 42,000 56,000
Beach /Water Use 60 140 200
Other Recreation 6,712 20,135 26,846
Hunting:
Big Game 0 0 0
Small Game 0 0 0
Migratory Birds 0 0 0
Fishing:
Freshwater 27 33 60
Saltwater 0 0 0
Total Visitation 104,374 102,695 207,069
Total Visitors 95,000
374

Sample Refuges Descriptions
Regional Economic Analysis
Table 6-23 shows visitor recreation expenditures in the refuge region during FY 2004. These expenditures totaled $3.9 million, with the majority being attributed to non-consumptive activities. Non-resident visitors to the refuge spent $3.2 million in the local area in FY 2004.
Table 6-423. Fort Niobrara NWR: Visitor Recreation Expenditures (2004 $,000)
Activity Residents Non-Residents Total
Non-Consumptive: $751.0 $3,152.6 $3,903.6
Hunting:
Big Game ─ ─ ─
Small Game ─ ─ ─
Migratory Birds ─ ─ ─
Total Hunting ─ ─ ─
Fishing:
Freshwater $0.4 $1.5 $1.9
Saltwater ─ ─ ─
Total Fishing $0.4 $1.5 $1.9
Total Expenditures $751.3 $3,154.1 $3,905.5
Table 6-424 summarizes the local economic effects associated with recreation visits. These recreation visits resulted in nearly $4.9 million in final demand, 102 jobs (both part-time and full-time), $1.7 million in job income, and $750,500 in total tax revenue. Non-resident visitor spending provided a $3.9 million stimulus to the local area economy.
Table 6-424. Fort Niobrara NWR: Local Economic Effects Associated with Recreation Visits (2004 $,000)
Residents Non-Residents Total
Final Demand $938.5 $3,921.9 $4,860.4
Jobs 19 83 102
Job Income $327.4 $1,376.1 $1,703.5
Total Tax Revenue $131.7 $618.8 $750.5
The refuge budget and the local economic effects of recreation visits are compared in Table 6-425. In FY 2004, recreational benefits (recreation-related expenditures plus net economic value) totaled $7.1 million, and budget expenditures summed to about $1.6 million. Comparing these two estimates shows that for every $1 of budget expenditures, $4.60 in recreational benefits are derived. This ratio is provided to
375

Banking on Nature: The Economic Benefits to Local Communities of National Wildlife Refuge Visitation
broadly compare the magnitude of the two estimates and should not be used as a benefit-cost ratio. In addition to recreational benefits, Fort Niobrara NWR provides a variety of other benefits including ecological and educational values which are not quantified in this analysis. The refuge budget also contributes a stimulus to the local economy, through payroll, maintenance, and operation expenditures.
Table 6-425. Fort Niobrara NWR: Summary of Local Economic Effects of Recreation Visits (2004 $,000)
FY 2004 Budget
RecreationExpenditures
Net Economic Value
Total economic effects per $1 budget expenditure
Fort Niobrara NWR
$1,552.7 $3,905.5 $3,235.0 $4.60
376

Sample Refuges Descriptions
Lacreek National Wildlife Refuge
Description
Lacreek National Wildlife Refuge (NWR) was established in 1935 as a refuge and breeding ground for migratory birds and other wildlife. The Refuge is located in Bennett County in southwestern South Dakota. The Refuge lies in the shallow Lake Creek valley on the northern edge of the Nebraska sandhills and includes 16,410 acres of native sandhills, sub-irrigated meadows, impounded fresh water marshes, and tallgrass and mixed-grass prairie uplands.
The Refuge includes 11 impoundments that provide nesting and migration habitat for Canada geese, ducks, water birds, and shorebirds. Several units are drawn down during the summer to encourage vegetative growth and are then re-flooded in the fall to provide food for migrating waterfowl. The Brown Ranch meadows sometimes have seasonal flooding during which they provide waterfowl and neotropical migrant habitat. The upland habitat is important for resident species such as mule and white-tailed deer, sharp-tailed grouse, and ring-necked pheasants.
The Refuge hosts one of only two nesting colonies of American white pelicans (approximately 3,000 birds) within South Dakota. The Refuge serves as an important staging area for migrating Canada geese, other waterfowl, sandhill cranes, shorebirds, and neotropical migrants. Black-tailed prairie dogs and burrowing owls are common in the uplands, and bald eagles are frequent winter visitors.
The Refuge is the home of the high plains trumpeter swan population, which now totals more than 350 birds. Trumpeter swans began wintering along the Snake River in Nebraska in 1995. The primary goal is achieve a free-ranging population that winters on natural habitat off the Refuge.
Area Economy
Bennett County encompasses the entirety of the refuge lands. The major city in the area is Rapid City, which is located in Pennington County. The refuge’s area economy is defined as this two-county area (Table 6-426).
From 1993 to 2003, the area population increased 6.7 percent, which was comparable to South Dakota (5.9 percent) but below the United States (11.9 percent). During the same time period, area employment increased 5.1 percent. The employment growth in Bennett County (13.3 percent) was higher than the growth in Pennington county (4.9 percent). In 2003, the area’s average per capita income was $29,588, which was similar to South Dakota ($29,624).
Activity Levels
Table 6-427 shows the recreation visits for Lacreek NWR in FY 2004. Non-consumptive activities were the most popular activities with 3,570 visits. The Refuge offers a 4-mile, self-guided auto tour loop starting at the Refuge headquarters and winding around several large wetlands offering great opportunities to view wildlife. Waterfowl, shorebirds, raptors, and wading birds are common along the auto tour loop as are deer and muskrats. Auto tour guides are available at the visitor center and provide interpretive information along the route. Hunting opportunities attracted 1,750 visits, with migratory bird hunting being the most popular with area residents. Approximately two-thirds of all visits (3,498) were by visitors living in the local area.
377

Banking on Nature: The Economic Benefits to Local Communities of National Wildlife Refuge Visitation
Table 6-426. Lacreek NWR:Summary of Area Economy, 2003
(Population & Employment in 000’s; Per Capita Income in 2004 dollars)
Population Employment Per Capita Income
County 2003
Percent change
1993-2003 2003
Percent change
1993-2003 2003
Percent change
1993-2003Bennett, SD 3.5 8.2% 1.6 13.3% $20,495 1.3%Pennington, SD 91.5 6.6% 61.4 4.9% $29,937 21.2%
Area Total 95.0 6.7% 63.0 5.1% $29,588 20.6%South Dakota 764.9 5.9% 523.7 17.6% $29,624 23.9%
United States 290,789.0 11.9% 167,174.4 17.9% $32,310 15.8%
Source: U.S. Department of Commerce 2003.
Table 6-427. Lacreek NWR: 2004 Recreation Visits
Activity Residents Non-Residents Total
Non-Consumptive:
Nature Trails 465 1,085 1,550
Observation Platforms 75 25 100
Other Wildlife Observation 0 0 0
Beach /Water Use 375 125 500
Other Recreation 1,065 355 1,420
Hunting:
Big Game 20 180 200
Small Game 50 450 500
Migratory Birds 998 53 1,050
Fishing:
Freshwater 450 50 500
Saltwater 0 0 0
Total Visitation 3,498 2,323 5,820
Total Visitors 5,000
378
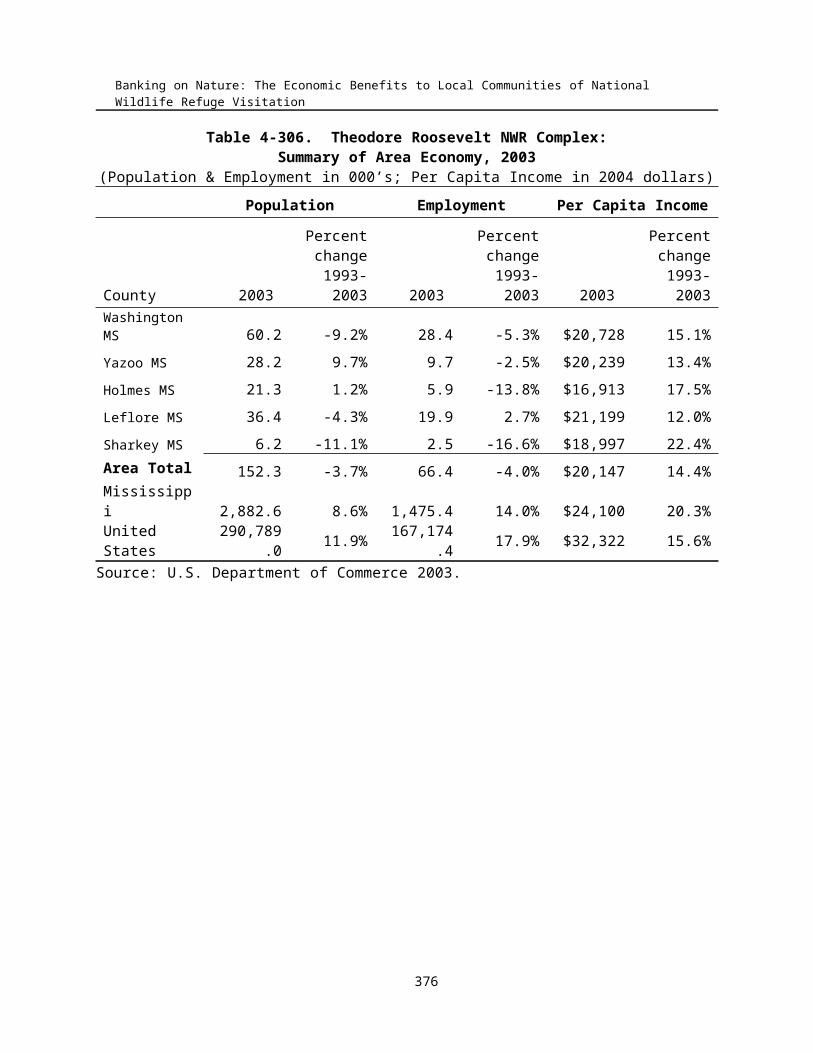
Sample Refuges Descriptions
Regional Economic Analysis
Visitor recreation expenditures in the refuge region totaled $60,600 (Table 6-428). Expenditures associated with hunting activities ($32,000) accounted for the largest portion of recreation-related expenditures. Non-resident refuge visitors spent $47,700 in the local area in FY 2004.
Table 6-428. Lacreek NWR: Visitor Recreation Expenditures (2004 $,000)
Activity Residents Non-Residents Total
Non-Consumptive: $6.2 $19.0 $25.2
Hunting:
Big Game $0.4 $19.1 $19.5
Small Game $0.2 $7.9 $8.2
Migratory Birds $3.7 $0.7 $4.4
Total Hunting $4.3 $27.7 $32.0
Fishing:
Freshwater $2.4 $0.9 $3.3
Saltwater ─ ─ ─
Total Fishing $2.4 $0.9 $3.3
Total Expenditures $12.9 $47.7 $60.6
In FY 2004, recreation visits resulted in $84,500 in local economic effects (Table 6-429). This final demand resulted in 2 jobs (both part-time and full-time) and $28,800 in job income. The majority of effects are associated with expenditures by non-resident visitors.
Table 6-429. Lacreek NWR: Local Economic Effects Associated with Recreation Visits (2004 $,000)
Residents Non-Residents Total
Final Demand $18.3 $66.2 $84.5
Jobs 1 1 2
Job Income $6.1 $22.7 $28.8
Total Tax Revenue $3.1 $12.0 $15.0
The refuge budget and the local economic effects of recreation visits are compared in Table 6-430. In FY 2004, recreational benefits (recreation-related expenditures plus net economic value) totaled $119,600, and budget expenditures summed to $684,200. Comparing these two estimates shows that for every $1 of budget expenditures, $0.17 in recreational benefits are derived. This ratio is provided to broadly compare the magnitude of the two estimates and should not be used as a benefit-cost ratio. In addition to
379

Banking on Nature: The Economic Benefits to Local Communities of National Wildlife Refuge Visitation
recreational benefits, Lacreek NWR provides a variety of other benefits including ecological values which are not quantified in this analysis. In particular, the refuge provides important habitat for waterfowl and other migrating birds. The refuge budget also contributes a stimulus to the local economy, through payroll, maintenance, and operation expenditures
Table 6-430. Lacreek NWR: Summary of Local Economic Effects of Recreation Visits (2004 $,000)
FY 2004 Budget
RecreationExpenditures
Net Economic Value
Total economic effects per $1 budget expenditure
Lacreek NWR $684.2 $60.6 $59.0 $0.17
380

Sample Refuges Descriptions
Lee Metcalf National Wildlife Refuge
Description
Located along the meandering Bitterroot River and surrounded by the majestic Bitterroot and Sapphire mountain ranges, Lee Metcalf NWR offers spectacular viewing opportunities of the Montana landscapes and wildlife. The 2,800 acre refuge was established in 1963 to provide habitat for migratory birds.
The Refuge encompasses a narrow strip of riparian habitat along the Bitterroot River as well as a higher bench of upland habitat along the eastern boundary. The river course is dynamic because of spring flooding and channel erosion. A chain of ponds is located at the center of the Refuge; these ponds are managed to provide water for wildlife. Annual precipitation in the valley is only about 12 inches; however, water levels are maintained during arid summer months by a naturally high water table, flowing springs, and runoff from neighboring mountains.
The Refuge has proven to be an attractive home for a variety of wildlife. White-tailed deer are commonly seen feeding in the upland fields, along with pheasants, ground squirrels, and coyotes. During the summer, osprey dive for fish while painted turtles soak in the sun and muskrats gnaw on cattails in the pond. Along the river, great-horned owls, pileated woodpeckers, and yellow warblers are commonly seen in the ponderosa pine trees.
The Refuge has an abundance of songbirds, waterfowl, and other waterbirds throughout the year, with peak populations during spring and fall migrations. Since 1990, a pair of bald eagles has nested on the Refuge each year. There are also great blue heron and double-crested cormorant rookeries on the Refuge.
Area Economy
Lee Metcalf NWR is located in Ravalli County. The city of Missoula is the nearest large city and provides most services to the region. Table 6-431 summarizes the area economy, which includes Missoula and Ravalli Counties.
From 1993 to 2003, the area population increased rapidly (19.4 percent), compared to Montana (8.7 percent) and the United States (11.9 percent). During the same time period, the area’s employment increased by 34.1 percent to 90,100. In 2003, the area’s average per capita income was $27,016 – a 19.0 percent increase from 1993.
Activity Levels
In FY 2004, Lee Metcalf NWR had 164,372 recreation visits and 148,499 visitors (Table 6-432). Recreation visits were greater than total visitors because some visitors chose to enjoy more than one activity. (For example, one visitor fishing in the morning and hiking along the nature trails in the afternoon counts as two visits.)
The majority of visits were associated with non-consumptive activities, such as hiking the nature trails to the Bitterroot River and driving along Waterfowl Lane to view the countryside and possibly an osprey. Fewer visits are associated with the big game and migratory bird hunting opportunities. Eighty-five percent of visits (139,881)are by people from the local area.
381

Banking on Nature: The Economic Benefits to Local Communities of National Wildlife Refuge Visitation
Table 6-431. Lee Metcalf NWR:Summary of Area Economy, 2003
(Population & Employment in 000’s; Per Capita Income in 2004 dollars)
Population Employment Per Capita Income
County 2003
Percent change
1993-2003 2003
Percent change
1993-2003 2003
Percent change
1993-2003Missoula, MT 98.5 14.2% 71.6 31.5% $28,743 22.6%Ravalli, MT 38.7 34.7% 18.5 45.3% $22,628 10.7%
Area Total 137.3 19.4% 90.1 34.1% $27,016 19.0%Montana 918.2 8.7% 584.0 23.4% $26,083 12.3%
United States 290,789.0 11.9% 167,174.4 17.9% $32,310 15.8%
Source: U.S. Department of Commerce 2003.
Table 6-432. Lee Metcalf NWR: 2004 Recreation Visits
Activity Residents Non-Residents Total
Non-Consumptive:
Nature Trails 122,400 21,600 144,000
Observation Platforms 0 0 0
Other Wildlife Observation 0 0 0
Beach /Water Use 0 0 0
Other Recreation 15,912 2,808 18,720
Hunting:
Big Game 1,240 65 1,305
Small Game 0 0 0
Migratory Birds 216 11 227
Fishing:
Freshwater 114 6 120
Saltwater 0 0 0
Total Visitation 139,881 24,491 164,372
Total Visitors 148,499
382
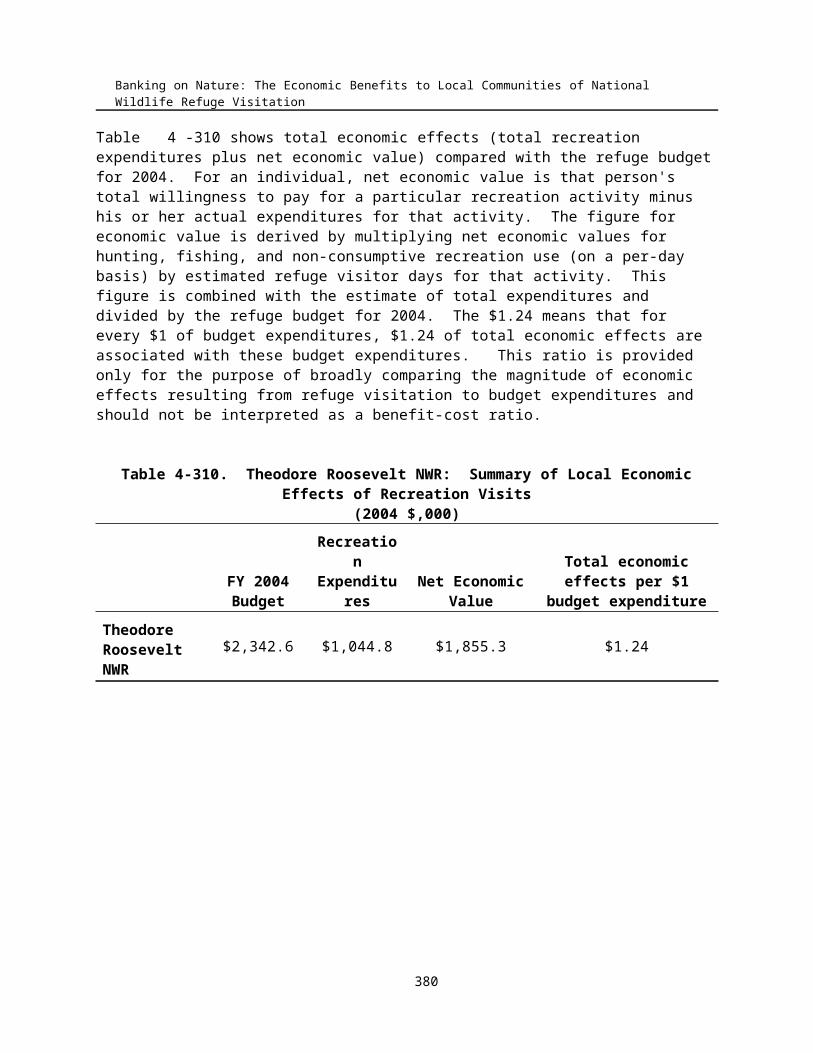
Sample Refuges Descriptions
Regional Economic Analysis
Table 6-433 shows visitor recreation expenditures for Lee Metcalf NWR in FY 2004. Total expenditures were nearly $1 million with resident expenditures being slightly higher than non-resident expenditures. Ninety-seven percent of expenditures ($949,400were associated with non-consumptive activities on the refuge.
Table 6-433. Lee Metcalf NWR: Visitor Recreation Expenditures (2004 $,000)
Activity Residents Non-Residents Total
Non-Consumptive: $500.8 $448.6 $949.4
Hunting:
Big Game $21.5 $5.8 $27.2
Small Game ─ ─ ─
Migratory Birds $1.6 $0.3 $1.9
Total Hunting $23.0 $6.1 $29.1
Fishing:
Freshwater $0.6 $0.1 $0.7
Saltwater ─ ─ ─
Total Fishing $0.6 $0.1 $0.7
Total Expenditures $524.4 $454.8 $979.2
Table 6-434 summarizes the total economic impacts associated with refuge visitor spending. Total final demand associated with recreational visitor spending was nearly $1.4 million. This is the total monetary value of economic activity generated in the local area economy by recreational visitors. This final demand generated 23 jobs, $461,100 in job income, and $287,900 in total tax revenue. Economic effects were fairly evenly distributed due to resident expenditures and non-resident expenditures.
Table 6-434. Lee Metcalf NWR: Local Economic Effects Associated with Recreation Visits (2004 $,000)
Residents Non-Residents Total
Final Demand $735.2 $627.5 $1,362.7
Jobs 13 11 23
Job Income $249.0 $212.1 $461.1
Total Tax Revenue $150.7 $137.2 $287.9
Table 6-435 compares the refuge budget and the local economic effects of recreation visits. In FY 2004, recreational benefits (recreation-related expenditures plus net economic value) totaled over $2.4 million,
383

Banking on Nature: The Economic Benefits to Local Communities of National Wildlife Refuge Visitation
and budget expenditures summed to $905,100. Comparing these two estimates shows that for every $1 of budget expenditures, $2.67 in recreational benefits are derived. This ratio is provided to broadly compare the magnitude of the two estimates and should not be used as a benefit-cost ratio. In addition to recreational benefits, Lee Metcalf NWR provides a variety of other benefits including ecological and educational values which are not quantified in this analysis. In particular, the refuge provides important habitat for a variety of wildlife and migrating birds. The refuge budget also contributes a stimulus to the local economy, through payroll, maintenance, and operation expenditures
Table 6-435. Lee Metcalf NWR: Summary of Local Economic Effects of Recreation Visits (2004 $,000)
FY 2004 Budget
RecreationExpenditures
Net Economic Value
Total economic effects per $1 budget expenditure
Lee Metcalf NWR
$905.1 $979.2 $1,441.3 $2.67
384

Sample Refuges Descriptions
Medicine Lake National Wildlife Refuge
Description
Medicine Lake National Wildlife Refuge (NWR) was established in 1935 to provide breeding habitat for migratory birds and other wildlife. It lies within the highly productive prairie pothole region and has relief typical of the glacial drift prairie ─ relatively gentle rolling plains with numerous shallow wetland depressions. Medicine Lake NWR has been recognized by the American Bird Conservancy as one of the "Top 100 Globally Important Bird Areas in the U.S." and was designated as a National Natural Landmark in 1980.
The Refuge is home to a diverse array of native prairie and wetland-associated wildlife species. More than 273 species of birds have been seen on the Refuge, and 125 bird species breed here.
Area Economy
Sheridan County encompasses 90 percent of the refuge, while Roosevelt County has the remaining 10 percent. The largest communities for the area are Plentywood (Sheridan County) and Culbertson (Roosevelt County). Most large shopping and medical facilities are located in Williston, North Dakota (Williams County).
Table 6-436 summarizes the area economy for the three-county area. The area’s population decreased 7.2 percent from 1993 to 2003. Total employment was 21,100 in 2003, an increase of 5.6 percent from 1993. Per capita personal income increased 12.6 percent from 1993 to 2003, adjusting for inflation. Williams County had the highest per capita income at $27,585; Roosevelt County had the lowest at $19,699. The states of Montana and North Dakota had average per capita incomes of $26,083 and $29,692, respectively
Table 6-436. Medicine Lake NWR:Summary of Area Economy, 2003
(Population & Employment in 000’s; Per Capita Income in 2004 dollars)
Population Employment Per Capita Income
County 2003
Percent change
1993-2003 2003
Percent change
1993-2003 2003
Percent change
1993-2003
Roosevelt, MT* 10.4 -3.8% 5.4 7.3% $19,699 2.8%
Sheridan, MT* 3.7 -18.2% 2.5 -3.2% $25,545 -0.6%
Williams, ND 19.4 -6.6% 13.2 6.8% $27,585 20.6%
Area Total 33.5 -7.2% 21.1 5.6% $24,899 12.6%Montana 918.2 8.7% 584.0 23.4% $26,083 12.3%
North Dakota 633.4 -1.2% 456.7 14.3% $29,692 28.3%
United States 290,789.0 11.9% 167,174.4 17.9% $32,310 15.8%
Source: U.S. Department of Commerce 2003.
385

Banking on Nature: The Economic Benefits to Local Communities of National Wildlife Refuge Visitation
Activity Levels
Visitors enjoyed a wide variety of activities at Medicine Lake NWR, including nature trails, big game hunting, fishing, and others. Other wildlife observation includes visitors observing wildlife while driving the 14-mile Wildlife Drive. On this auto tour, there are several interpretive signs to describe unique areas and/or wildlife and information about wildlife management activities.
Table 6-437 shows the recreation visits at the refuge in FY 2004. There were 9,238 visits with the majority of visits being attributed to non-consumptive activities. Hunting opportunities include hunting for white-tailed deer, ducks and geese, and upland game birds. Sixty-nine percent of visits (6,383) were by people living outside the local area.
Table 6-437. Medicine Lake NWR: 2004 Recreation Visits
Activity Residents Non-Residents Total
Non-Consumptive:
Nature Trails 900 3,600 4,500
Observation Platforms 270 810 1,080
Other Wildlife Observation 55 165 220
Beach /Water Use 0 0 0
Other Recreation 314 105 418
Hunting:
Big Game 140 210 350
Small Game 220 880 1,100
Migratory Birds 57 513 570
Fishing:
Freshwater 900 100 1,000
Saltwater 0 0 0
Total Visitation 2,856 6,383 9,238
Total Visitors 16,000
Regional Economic Analysis
Visitor recreation expenditures resulted in $192,600 in expenditures in the local economy (Table 6-438). Most of the expenditures are attributed to non-consumptive activities and hunting. Expenditures associated with fishing activities resulted in $16,500. The majority of expenditures (88 percent) were associated with non-resident visits.
386

Sample Refuges Descriptions
Table 6-438. Medicine Lake NWR: Visitor Recreation Expenditures (2004 $,000)
Activity Residents Non-Residents Total
Non-Consumptive: $5.3 $81.6 $86.9
Hunting:
Big Game $2.9 $22.3 $25.2
Small Game $3.1 $46.5 $49.6
Migratory Birds $0.4 $14.1 $14.5
Total Hunting $6.4 $82.9 $89.3
Fishing:
Freshwater $11.9 $4.6 $16.5
Saltwater ─ ─ ─
Total Fishing $11.9 $4.6 $16.5
Total Expenditures $23.6 $169.0 $192.6
Recreation visits to Medicine Lake NWR resulted in $248,100 in final demand (Table 6-439). This final demand generated 5 jobs (both part-time and full-time) and $82,0000 in job income. The majority of impacts were a result of non-resident visits.
Table 6-439. Medicine Lake NWR: Local Economic Effects Associated with Recreation Visits (2004 $,000)
Residents Non-Residents Total
Final Demand $30.8 $217.3 $248.1
Jobs 1 4 5
Job Income $10.0 $72.0 $82.0
Total Tax Revenue $6.4 $48.2 $54.6
The refuge budget and the local economic effects of recreation visits are compared in Table 6-440. In FY 2004, recreational benefits (recreation-related expenditures plus net economic value) totaled $347,700, and budget expenditures summed to about $1.0 million. Comparing these two estimates shows that for every $1 of budget expenditures, $0.35 in recreational benefits are derived. This ratio is provided to broadly compare the magnitude of the two estimates and should not be used as a benefit-cost ratio. In addition to recreational benefits, Medicine lake NWR provides a variety of other benefits including ecological values which are not quantified in this analysis. The refuge budget also contributes a stimulus to the local economy, through payroll, maintenance, and operation expenditures.
387

Banking on Nature: The Economic Benefits to Local Communities of National Wildlife Refuge Visitation
Table 6-440. Medicine Lake NWR: Summary of Local Economic Effects of Recreation Visits (2004 $,000)
FY 2004 Budget
RecreationExpenditures
Net Economic Value
Total economic effects per $1 budget expenditure
Medicine Lake NWR
$1,002.8 $192.6 $155.1 $0.35
388

Sample Refuges Descriptions
Region 7
Region 7 includes the State of Alaska. Sample refuges selected within the region include:
Alaska Peninsula NWRIzembek NWR
Kenai NWRKodiak NWRTogiak NWR
389

Banking on Nature: The Economic Benefits to Local Communities of National Wildlife Refuge Visitation
Alaska Peninsula National Wildlife Refuge
Description
Sandwiched between Becharof National Wildlife Refuge to the north and Izembek NWR to the south, Alaska Peninsula National Wildlife Refuge presents a breathtakingly dramatic landscape made up of active volcanoes, towering mountain peaks, rolling tundra and rugged, wave-battered coastlines. As is the case with most of Alaska's coastal refuges, salmon provide the principal "nutrient engine" for Alaska Peninsula, supporting the species that prey upon them and enriching the rivers and surrounding lands after they spawn and die.
Where there are salmon, there will usually be bears, and when the fish are running, Ugashik Lakes and the streams that surround them attract brown bears in great numbers. Other large land mammals include wolverine, the caribou of the approximately 7,000-animal Northern Alaska Peninsula Herd, wolves, and moose. The latter are relative newcomers, first observed on the peninsula in the early 1900s, and uncommon until the 1950s. The refuge's coastal and offshore waters are home to sea otters, harbor seals, sea lions and migrating whales.
Alaska Peninsula's numerous wetlands and often rugged shoreline provide habitat for migratory birds, including ducks, geese and shorebirds. The refuge is also home to the westernmost black cottonwood forests in America, which offer both migration stop-over and nesting habitat to neotropical land birds.
Area Economy
Lake and Peninsula Borough encompasses most of the refuge, while the refuge office is located in Bristol Bay Borough. Anchorage is included in the area economy because the city is the economic center for most of Alaska. Communities for the area also include King Salmon and Naknek.
Table 7-441 summarizes the area economy for the three-county area. The area’s population increased 7.9 percent from 1993 to 2003. However, population decreased in Bristol Bay and Lake and Peninsula by 33.4 percent and 9.1 percent respectively. Total employment for the area was 191,300 in 2003, an increase of 14.6 percent from 1993. Again, both Bristol Bay Borough and Lake and Peninsula Borough had decreasing employment of 5.9 percent and 19.4 percent, respectively. Per capita personal income increased 7.4 percent from 1993 to 2003. Bristol Bay Borough had the highest per capita income of $41,855.
Activity Levels
Table 7-442 shows the recreation visits for the refuge in FY 2004. For non-consumptive uses, “other recreation” includes berry picking and other plant food gathering (5,006 visits). Anglers can fish for all five North American Pacific salmon species and others (1,118 visits). There were 1,751 visits for big game, 50 visits for small game, and 100 visits for migratory birds. Seventy-six percent of visits were by people from the local area.
390

Sample Refuges Descriptions
Table 7-441. Alaska Peninsula NWR:Summary of Area Economy, 2003
(Population & Employment in 000’s; Per Capita Income in 2004 dollars)
Population Employment Per Capita Income
County 2003
Percent change
1993-2003 2003
Percent change
1993-2003 2003
Percent change
1993-2003
Anchorage, AK 270.9 8.3% 188.9 15.1% $38,755 7.3%
Bristol Bay, AK 1.1 -33.4% 1.7 -5.9% $41,855 9.3%Lake and Peninsula, AK 1.6 -9.1% 0.8 -19.4% $23,301 9.2%
Area Total 273.6 7.9% 191.3 14.6% $38,678 7.4%
Alaska 648.3 8.1% 418.5 16.1% $34,097 6.3%
United States 290,789.0 11.9% 167,174.4 17.9% $32,310 15.8%
Source: U.S. Department of Commerce 2003.
Table 7-442. Alaska Peninsula NWR: 2004 Recreation Visits
Activity Residents Non-Residents Total
Non-Consumptive:
Nature Trails 0 0 0
Observation Platforms 0 0 0
Other Wildlife Observation 0 0 0
Beach /Water Use 50 50 100
Other Recreation 4,906 100 5,006
Hunting:
Big Game 683 1,068 1,751
Small Game 41 10 50
Migratory Birds 54 46 100
Fishing:
Freshwater 180 258 438
Saltwater 279 401 680
Total Visitation 6,192 1,933 8,125
Total Visitors 15,599
391

Banking on Nature: The Economic Benefits to Local Communities of National Wildlife Refuge Visitation
Regional Economic Analysis
Visits to the Alaska Peninsula NWR resulted in $878,900 in recreation-related expenditures (Table 7-443). The majority of expenditures are attributed to hunting ($687,500). Non-residents spent $769,600 and residents spent $109,300.
Table 7-443. Alaska Peninsula NWR: Visitor Recreation Expenditures (2004 $,000)
Activity Residents Non-Residents Total
Non-Consumptive: $50.5 $11.3 $61.8
Hunting:
Big Game $42.5 $637.8 $680.3
Small Game $0.6 $0.5 $1.0
Migratory Birds $1.5 $4.7 $6.1
Total Hunting $44.6 $642.9 $687.5
Fishing:
Freshwater $4.5 $59.9 $64.4
Saltwater $9.6 $55.6 $65.2
Total Fishing $14.1 $115.4 $129.6
Total Expenditures $109.3 $769.6 $878.9
Recreation visits to the refuge resulted in nearly $1.3 million in final demand in FY 2004 (Table 7-444). This is the total monetary value of economic activity associated with recreation visits. The majority of this impact is due to non-resident visitation. Non-residents expenditures resulted in 17 jobs and $413,100 in job income.
Table 7-444. Alaska Peninsula NWR: Local Economic Effects Associated with Recreation Visits (2004 $,000)
Residents Non-Residents Total
Final Demand $159.5 $1,111.6 $1,271.1
Jobs 2 15 17
Job Income $57.6 $413.1 $470.7
Total Tax Revenue $32.7 $239.4 $272.1
The refuge budget and the local economic effects of recreation visits are compared in Table 6-425. In FY 2004, recreational benefits (recreation-related expenditures plus net economic value) totaled $1.1 million, and budget expenditures summed to about $2.0 million. Comparing these two estimates shows that for every $1 of budget expenditures, $0.54 in recreational benefits are derived. This ratio is provided to
392

Sample Refuges Descriptions
broadly compare the magnitude of the two estimates and should not be used as a benefit-cost ratio. In addition to recreational benefits, the refuge provides a variety of other benefits including ecological and subsistence values which are not quantified in this analysis. The refuge budget also contributes a stimulus to the local economy, through payroll, maintenance, and operation expenditures.
Table 7-445. Alaska Peninsula NWR: Summary of Local Economic Effects of Recreation Visits (2004 $,000)
FY 2004 Budget
RecreationExpenditures
Net Economic Value
Total economic effects per $1 budget expenditure
Alaska Peninsula NWR
$2,038.4 $878.9 $221.5 $0.54
Note: The budget also includes Becharof NWR. Therefore, the ratio is most likely higher than $0.54.
393

Banking on Nature: The Economic Benefits to Local Communities of National Wildlife Refuge Visitation
Izembek National Wildlife Refuge
Description
The Izembek National Wildlife Refuge is the smallest (315,000 acres) and one of the most ecologically unique of Alaska's refuges. Most of the refuge was designated as Wilderness in 1980 under the Alaska National Interest Lands Conservation Act. This diverse wilderness protects a wide variety of fish and wildlife species and their habitats. These include five species of salmon; furbearers such as wolf, fox and wolverine; large mammals such as caribou, moose and brown bears; shorebirds; seabirds; and an incredible array of waterfowl, to name just a few.
Salmon returns to natal streams fuel this coastal ecosystem during the summer and fall. This rich fishery provides quality forage for coastal brown bears and other predators. The Southern Alaska Peninsula Caribou Herd (5,400 animals in 2002) also inhabits the Refuge. Several species of marine mammals either inhabit or pass through Refuge coastal waters and lagoons. These include harbor seal, sea otter, walrus, the threatened Stellar's sea lion, and gray, minke, killer and humpback whales.
At the heart of the Refuge is the 150-square mile Izembek Lagoon. The lagoon and its associated state-owned tidal lands have been protected by the State of Alaska since 1960 as the Izembek State Game Refuge. Here, shallow, brackish water covers one of the world's largest beds of eelgrass, creating a rich feeding and resting area for hundreds of thousands of waterfowl. Virtually the entire population of Pacific black brant (150,000 birds on average), Taverner's Canada goose (55,000), and emperor goose (6,000) inhabit the lagoon each fall. Approximately 23,000 threatened Steller's eiders also molt, rest, and feed at Izembek each autumn.
Area Economy
Izembek NWR is located in southwest Alaska in the Aleutians East Borough. Anchorage is included in the area economy because the city is the economic center for most of Alaska. Table 7-446 summarizes the area economy.
From 1993 to 2003, area population increased 8.3 percent. During the same time period, area employment increased 15.7 percent. Employment in the Aleutians East Borough increased by 73.3 percent, which was well above Anchorage (15.1 percent), Alaska (16.1 percent), and the United States (17.9 percent). In 2003, area per capita income was $38,620. While per capita income for Anchorage was $38,755, the per capita income for Aleutians East was $25,175.
Activity Levels
Visitors to Izembek NWR enjoyed a wide variety of activities ranging from hiking on the nature trails to salmon fishing (Table 7-447). The number of visitors (3,900) is lower than the number of visits (6,155) because some visitors choose to participate in more than one activity. For example, a visitor who fishes in the morning and hikes along a nature trail in the afternoon counts as one visitor and two visits.
Sixty-one percent of visits (3,740) were attributed to non-consumptive activities. “Other wildlife observation" includes visitors who travel by aircraft overflights onto the Refuge to view wildlife and habitats. Hunting activities accounted for 32 percent of visits, and fishing activities accounted for 7 percent of visits.
394

Sample Refuges Descriptions
Table 7-446. Izembek NWR:Summary of Area Economy, 2003
(Population & Employment in 000’s; Per Capita Income in 2004 dollars)
Population Employment Per Capita Income
County 2003
Percent change
1993-2003 2003
Percent change
1993-2003 2003
Percent change
1993-2003
Aleutians East, AK 2.7 6.2% 3.0 73.3% $25,175 2.6%
Anchorage, AK 270.9 8.3% 188.9 15.1% $38,755 7.3%
Area Total 273.6 8.3% 191.9 15.7% $38,620 7.3%Alaska 648.3 8.1% 418.5 16.1% $34,097 6.3%
United States 290,789.0 11.9% 167,174.4 17.9% $32,310 15.8%
Source: U.S. Department of Commerce 2003.
Table 7-447. Izembek NWR: 2004 Recreation Visits
Activity Residents Non-Residents Total
Non-Consumptive:
Nature Trails 540 360 900
Observation Platforms 204 136 340
Other Wildlife Observation 330 220 550
Beach /Water Use 0 0 0
Other Recreation 1,170 780 1,950
Hunting:
Big Game 360 240 600
Small Game 142 213 355
Migratory Birds 404 606 1,010
Fishing:
Freshwater 100 100 200
Saltwater 175 75 250
Total Visitation 3,425 2,730 6,155
Total Visitors 3,900
Regional Economic Analysis
395

Banking on Nature: The Economic Benefits to Local Communities of National Wildlife Refuge Visitation
Expenditures associated with visitor recreation at Izembek NWR totaled $446,900 in FY 2004 (Table 7-448). Fifty-three percent of expenditures ($238,800) were attributable to hunting activities; 37 percent of expenditures ($163,900) were attributable to non-consumptive activities; and, 10 percent of expenditures ($44,100) were attributable to fishing activities. Non-resident expenditures accounted for 84 percent of all expenditures.
Table 7-448. Izembek NWR: Visitor Recreation Expenditures (2004 $,000)
Activity Residents Non-Residents Total
Non-Consumptive: $27.8 $136.2 $163.9
Hunting:
Big Game $21.8 $139.2 $161.0
Small Game $1.1 $6.3 $7.5
Migratory Birds $10.8 $59.6 $70.4
Total Hunting $33.7 $205.1 $238.8
Fishing:
Freshwater $2.5 $22.5 $25.0
Saltwater $7.0 $12.1 $19.1
Total Fishing $9.5 $34.6 $44.1
Total Expenditures $71.0 $375.9 $446.9
Table 7-449 summarizes the economic effects associated with recreation visits to Izembek NWR in FY 2004. Recreation visits resulted in $644,800 in final demand, 8 jobs, $233,600 in job income, and $138,600 in tax revenue for the Alaska and the United States. The majority of jobs (7) were due to non-resident expenditures.
Table 7-449. Izembek NWR: Local Economic Effects Associated with Recreation Visits (2004 $,000)
Residents Non-Residents Total
Final Demand $103.5 $541.3 $644.8
Jobs 1 7 8
Job Income $37.5 $196.1 $233.6
Total Tax Revenue $21.2 $117.4 $138.6
The refuge budget and the local economic effects of recreation visits are compared in Table 7-450. In FY 2004, recreational benefits (recreation-related expenditures plus net economic value) totaled $611,800, and budget expenditures summed to $919,900. Comparing these two estimates shows that for every $1
396
Sample Refuges Descriptions
of budget expenditures, $0.67 in recreational benefits are derived. This ratio is provided to broadly compare the magnitude of the two estimates and should not be used as a benefit-cost ratio. In addition to recreational benefits, Izembek NWR provides a variety of other benefits including subsistence, and ecological and subsistence values which are not quantified in this analysis. In particular, the refuge protects a rich habitat that supports a variety of wildlife such as brown bears, salmon, and otters. The refuge budget also contributes a stimulus to the local economy, through payroll, maintenance, and operation expenditures.
Table 7-450. Izembek NWR: Summary of Local Economic Effects of Recreation Visits (2004 $,000)
FY 2004 Budget
RecreationExpenditures
Net Economic Value
Total economic effects per $1 budget expenditure
Izembek NWR
$919.9 $446.9 $164.9 $0.67
397

Banking on Nature: The Economic Benefits to Local Communities of National Wildlife Refuge Visitation
Kenai National Wildlife Refuge
Description
Alaska's Kenai Peninsula is, in geologic terms, still quite "young," since its entire land mass was covered by glacial ice as recently as 10,000 years ago. Much of that frozen blanket still exists today, in the form of the more than 800-square mile Harding Ice Field, which the refuge "shares" with Kenai Fjords National Park.
The grudging withdrawal of the Harding Ice Field has helped to make the lands of the Kenai National Wildlife Refuge a "miniature Alaska.” Today, the refuge includes examples of every major Alaska habitat type. The refuge is an Alaska in miniature in its diversity of wildlife, as well. Sportfish bring hundreds of thousands of visitors to the peninsula each year. Eager anglers can pursue chinook, sockeye, coho and pink salmon; as well as Dolly Varden char, rainbow trout, and arctic grayling. The refuge is also home to brown and black bears, caribou, Dall sheep, mountain goats, wolves, lynx, wolverines, eagles and thousands of shorebirds and waterfowl, not to mention the mighty Alaska-Yukon moose that the refuge was originally established (as the Kenai National Moose Range) to protect.
Today the Kenai National Wildlife Refuge's wealth of habitat, scenery and wildlife draws a half a million visitors a year, more than any other wildlife refuge in Alaska.
Area Economy
Table 7-11 shows the area economy for Kenai NWR. The economic base for the refuge includes Anchorage and Kenai Peninsula Boroughs, Alaska. Anchorage is included in the area economy because the city is the economic center for most of Alaska. It is assumed that most of the visitor expenditures take place within this area. From 1993 to 2003, area population and area employment increased 9.4 percent and 15.8 percent, respectively. In 2003, the area’s per capita income was $37,384 – a 6.2 percent increase from 1993. The average per capita income is higher than both Alaska ($34,097) and the United States ($32,310).
Activity Levels
Recreation visits to Kenai NWR for FY 2004 are shown in Table 7-454. The number of visits (587,395) is higher than the number of visitors (575,000) because some visitors choose to participate in more than one activity. For example, a visitor salmon fishing in the morning and hiking in the afternoon would count as one visitor and two visits.
Visitors to the Kenai NWR enjoy a wide variety of recreational activities, including hiking, hunting, and fishing. The majority of visits (65 percent) are attributed to non-consumptive activities. Fifty-four percent of visits (314,925) are associated with visitors from the local area.
398

Sample Refuges Descriptions
Table 7-451. Kenai NWR:Summary of Area Economy, 2003
(Population & Employment in 000’s; Per Capita Income in 2004 dollars)
Population Employment Per Capita Income
County 2003
Percent change
1993-2003 2003
Percent change
1993-2003 2003
Percent change
1993-2003
Anchorage, AK 270.9 8.3% 188.9 15.1% $38,755 7.3%Kenai Peninsula, AK*
51.3 16.0% 29.6 20.9% $30,144 0.1%
Area Total 322.2 9.4% 218.5 15.8% $37,384 6.2%
Alaska 648.3 8.1% 418.5 16.1% $34,097 6.3%
United States 290,789.0 11.9% 167,174.4 17.9% $32,310 15.8%
Source: U.S. Department of Commerce 2003.
Table 7-452. Kenai NWR: 2004 Recreation Visits
Activity Residents Non-Residents Total
Non-Consumptive:
Nature Trails 126,000 84,000 210,000
Observation Platforms 0 0 0
Other Wildlife Observation 0 0 0
Beach /Water Use 125 125 250
Other Recreation 87,085 87,085 174,170
Hunting:
Big Game 3,240 2,160 5,400
Small Game 2,685 1,790 4,475
Migratory Birds 3,040 4,560 7,600
Fishing:
Freshwater 92,750 92,750 185,500
Saltwater 0 0 0
Total Visitation 314,925 272,470 587,395
Total Visitors 575,000
399

Banking on Nature: The Economic Benefits to Local Communities of National Wildlife Refuge Visitation
Regional Economic Analysis
Visitor recreation expenditures totaled $39.5 million in FY 2004 (Table 7-453). Non-consumptive activities accounted for $13.1 million (33 percent); hunting accounted for $2.6 million (7 percent); and, fishing accounted for $23.8 million (60 percent). Non-residents expenditures accounted for the majority of expenditures (88 percent).
Table 7-453. Kenai NWR: Visitor Recreation Expenditures (2004 $,000)
Activity Residents Non-Residents Total
Non-Consumptive: $1,852.9 $11,257.9 $13,110.8
Hunting:
Big Game $201.8 $1,289.8 $1,491.6
Small Game $59.2 $145.6 $204.8
Migratory Birds $134.1 $738.0 $872.0
Total Hunting $395.1 $2,173.4 $2,568.5
Fishing:
Freshwater $2,344.5 $21,491.1 $23,835.5
Saltwater ─ ─ ─
Total Fishing $2,344.5 $21,491.1 $23,835.5
Total Expenditures $4,592.5 $34,922.4 $39,514.8
Table 7-454 summarizes the economic effects due to recreation visits in FY 2004. Recreational visitor expenditures resulted in $57.9 million in final demand. This final demand resulted in 689 jobs, of which 88 percent (607 jobs) were associated with non-resident expenditures. This final demand also generated nearly $20.4 million in job income and $12.3 million in tax revenue.
Table 7-454. Kenai NWR: Local Economic Effects Associated with Recreation Visits (2004 $,000)
Residents Non-Residents Total
Final Demand $6,859.0 $51,083.3 $57,942.3
Jobs 82 607 689
Job Income $2,387.8 $17,967.1 $20,354.9
Total Tax Revenue $1,369.9 $10,954.3 $12,324.2
The refuge budget and the local economic effects of recreation visits are compared in Table 7-455. In FY 2004, recreational benefits (recreation-related expenditures plus net economic value) totaled nearly $51.5 million, and budget expenditures summed to about $3.5 million. Comparing these two estimates shows
400

Sample Refuges Descriptions
that for every $1 of budget expenditures, $14.87 in recreational benefits are derived. This ratio is provided to broadly compare the magnitude of the two estimates and should not be used as a benefit-cost ratio. In addition to recreational benefits, Kenai NWR provides a variety of other benefits including ecological, subsistence, and educational values which are not quantified in this analysis. The refuge budget also contributes a stimulus to the local economy, through payroll, maintenance, and operation expenditures.
Table 7-455. Kenai NWR: Summary of Local Economic Effects of Recreation Visits (2004 $,000)
FY 2004 Budget
RecreationExpenditures
Net Economic Value
Total economic effects per $1 budget expenditure
Kenai NWR $3,461.4 $39,514.8 $11,950.3 $14.87
401

Banking on Nature: The Economic Benefits to Local Communities of National Wildlife Refuge Visitation
Kodiak National Wildlife Refuge
Description
Kodiak is a rugged, beautiful island on the coast of southwestern Alaska. Established in 1941, the refuge provides habitat for brown bear, salmon and other wildlife. Kodiak's scenery is magnificent- rugged mountains, hundreds of miles of shoreline, lakes, marshes, bogs, and meadows. Four-thousand-foot mountains rise from the sea accented with fjord like inlets. Lush vegetation blankets the mountains ranging from sedges, alders, and spruce to colorful wildflowers and berries.
The 1.9 million-acre Kodiak National Wildlife Refuge roughly encompasses the southwestern two-thirds of Kodiak Island, Uganik Island, the Red Peaks area on northwestern Afognak Island, and all of Ban Island. No place on the refuge is more than 15 miles from the Pacific Ocean. Without roads, the refuge provides a wilderness setting for fish, wildlife, and humans alike.
The refuge is home to an estimated 2,300 brown bears, and at least 600 nesting pairs of bald eagles. More than 250 species of birds live upon or visit the refuge, while more than 1.5 million seabirds overwinter in nearshore waters surrounding Kodiak Island.
The refuge also provides spawning and rearing habitat for all five North American species of Pacific salmon. Salmon produced on the refuge make up approximately 65% of the total commercial harvest in the Kodiak Archipelago.
Area Economy
Table 7-16 summarizes the area economy for Kodiak NWR. Anchorage is included in the area economy because the city is the economic center for most of Alaska. Also included is Kodiak, where the refuge is located. In 2003, area population increased 7.5 percent to 284,200 people. The population for Kodiak, however, decreased 6.0 percent. During the same time period, employment increased 14.4 percent and per capita income increased 7.5 percent. The rate of increase for per capita income was slightly higher than the state of Alaska (6.3 percent) but lower than the United States (15.8 percent).
Activity Levels
Kodiak refuge offers superb recreational opportunities. These include hunting, fishing, wildlife observation, photography, rafting and camping. The refuge also maintains several remote public-use cabins.
Table 7-17 shows the recreation visits to Kodiak NWR in FY 2004. Refuge visitors enjoyed non-consumptive activities (22,112 visits), hunting (5,384 visits), and freshwater fishing (2,600 visits). One popular non-consumptive activity is birdwatching. Approximately two-thirds of visits were by residents (20,358 visits).
402

Sample Refuges Descriptions
Table 7-456. Kodiak NWR:Summary of Area Economy, 2003
(Population & Employment in 000’s; Per Capita Income in 2004 dollars)
Population Employment Per Capita Income
County 2003
Percent change
1993-2003 2003
Percent change
1993-2003 2003
Percent change
1993-2003
Anchorage, AK 270.9 8.3% 188.9 15.1% $38,755 7.3%
Kodiak, AK 13.4 -6.0% 9.2 2.6% $30,264 6.4%
Area Total 284.2 7.5% 198.1 14.4% $38,356 7.5%Alaska 648.3 8.1% 418.5 16.1% $34,097 6.3%
United States 290,789.0 11.9% 167,174.4 17.9% $32,310 15.8%
Source: U.S. Department of Commerce 2003.
Table 7-457. Kodiak NWR: 2004 Recreation Visits
Activity Residents Non-Residents Total
Non-Consumptive:
Nature Trails 84 36 120
Observation Platforms 135 315 450
Other Wildlife Observation 875 375 1,250
Beach /Water Use 14 6 20
Other Recreation 14,190 6,082 20,272
Hunting:
Big Game 2,271 2,271 4,541
Small Game 250 83 333
Migratory Birds 459 51 510
Fishing:
Freshwater 2,080 520 2,600
Saltwater 0 0 0
Total Visitation 20,358 9,738 30,096
Total Visitors 24,915
Regional Economic Analysis
403

Banking on Nature: The Economic Benefits to Local Communities of National Wildlife Refuge Visitation
Visitor recreation expenditures totaled nearly $1.8 million in FY 2004 (Table 7-458). Hunting accounted for 64 percent of all expenditures. The majority of expenditures ($1.5 million) were associated with non-resident visitation.
Table 7-458. Kodiak NWR: Visitor Recreation Expenditures (2004 $,000)
Activity Residents Non-Residents Total
Non-Consumptive: $116.8 $382.3 $499.1
Hunting:
Big Game $106.1 $1,016.8 $1,122.9
Small Game $3.4 $4.2 $7.7
Migratory Birds $10.1 $4.1 $14.2
Total Hunting $119.6 $1,025.2 $1,144.8
Fishing:
Freshwater $42.1 $96.4 $138.5
Saltwater ─ ─ ─
Total Fishing $42.1 $96.4 $138.5
Total Expenditures $278.5 $1,503.9 $1,782.4
Recreation visits resulted in $2.6 million in final demand in the local economy (Table 7-459). This is the total monetary value of economic activity generated in the area due to recreational visitors. The final demand generated 34 jobs (both part-time and full-time), $946,000 in job income, and $556,900 in tax revenue. Non-resident expenditures provided a $2.2 million stimulus to the local economy.
Table 7-459. Kodiak NWR: Local Economic Effects Associated with Recreation Visits (2004 $,000)
Residents Non-Residents Total
Final Demand $406.8 $2,165.1 $2,571.9
Jobs 5 29 34
Job Income $146.7 799 $946.0
Total Tax Revenue $83.5 $473.3 $556.9
Table 7-460 compares the refuge budget and the local economic effects of recreation visits. In FY 2004, recreational benefits (recreation-related expenditures plus net economic value) totaled $2.3 million, and budget expenditures summed to about $1.9 million. Comparing these two estimates shows that for every $1 of budget expenditures, $1.24 in recreational benefits are derived. This ratio is provided to broadly compare the magnitude of the two estimates and should not be used as a benefit-cost ratio. In addition to
404

Sample Refuges Descriptions
recreational benefits, Kodiak NWR provides a variety of other benefits including supporting the commercial salmon fishery, and ecological and subsistence values which are not quantified in this analysis. The refuge budget also contributes a stimulus to the local economy, through payroll, maintenance, and operation expenditures.
Table 7-460. Kodiak NWR: Summary of Local Economic Effects of Recreation Visits (2004 $,000)
FY 2004 Budget
RecreationExpenditures
Net Economic Value
Total economic effects per $1 budget expenditure
Kodiak NWR $1,888.9 $1,782.4 $556.7 $1.24
405

Banking on Nature: The Economic Benefits to Local Communities of National Wildlife Refuge Visitation
Togiak National Wildlife Refuge
Description
Dominated by the Ahklun Mountains in the north and the cold waters of Bristol Bay to the south, Togiak National Wildlife Refuge confronts the traveler with a kaleidoscope of landscapes. The natural forces that have shaped this land range from the violent and powerful to the geologically patient. Earthquakes and volcanoes filled the former role, and their marks can still be found, but it was the gradual advance and retreat of glacial ice that carved many of the physical features of this refuge.
The refuge is home to 48 mammal species, 31 of which are terrestrial and 17 marine. More than 150,000 caribou from two herds, the Nushagak Peninsula and the Mulchatna, make use of refuge lands, which they share with wolves, moose, brown and black bears, wolverines, red foxes, marmots, beavers, and porcupines, among other land mammals. Seals, sea lions, walrus and whales are found at various times of year along the refuge's 600 miles of coastline.
Some 201 species of birds have been sighted on Togiak Refuge. Threatened species can occasionally be found here, including Steller's and spectacled eiders. Several arctic goose species frequent the refuge, along with murres, peregrine falcons, dowitchers, Lapland longspurs and a rich variety of other seabirds, waterfowl, shorebirds, songbirds and raptors. Refuge staff and volunteers have also documented more than 500 species of plants, demonstrating a high degree of biodiversity for a sub-arctic area.
Area Economy
The area economy for Togiak NWR is shown in Table 7-21. The refuge is located in Bethel and Dillingham boroughs in Alaska. Anchorage is included in the area economy because the city is the economic center for most of Alaska. From 1993 to 2003, the area population increased 8.7 percent to 292,600 people. During this time period, the boroughs of Bethel and Dillingham had a higher rate of increase for both population and employment than the area total. In 2003, the area’s average per capita income was $37,718 – a 7.1 percent increase from 1993.
Activity Levels
Recreation visits to Togiak NWR totaled 128,077 in FY 2004 (Table 7-462). The number of visitors (29,500) is lower than the total visitation because some visitors choose to partake in more than one activity. For example, a visitor may decide to fish in the morning and have a picnic in the afternoon (1 visitor, 2 visits). For non-consumptive visits, “other wildlife observation” includes ecotourism operations that visit the refuge to see walrus, seabirds, bears, moose, and other animals, and “other recreation” includes activities such as cross country skiing, camping, and picnicking.
The majority of visitors participated in non-consumptive activities (105,550 visits). Seventy-seven percent of visits (98,488) were by visitors from the local area.
406
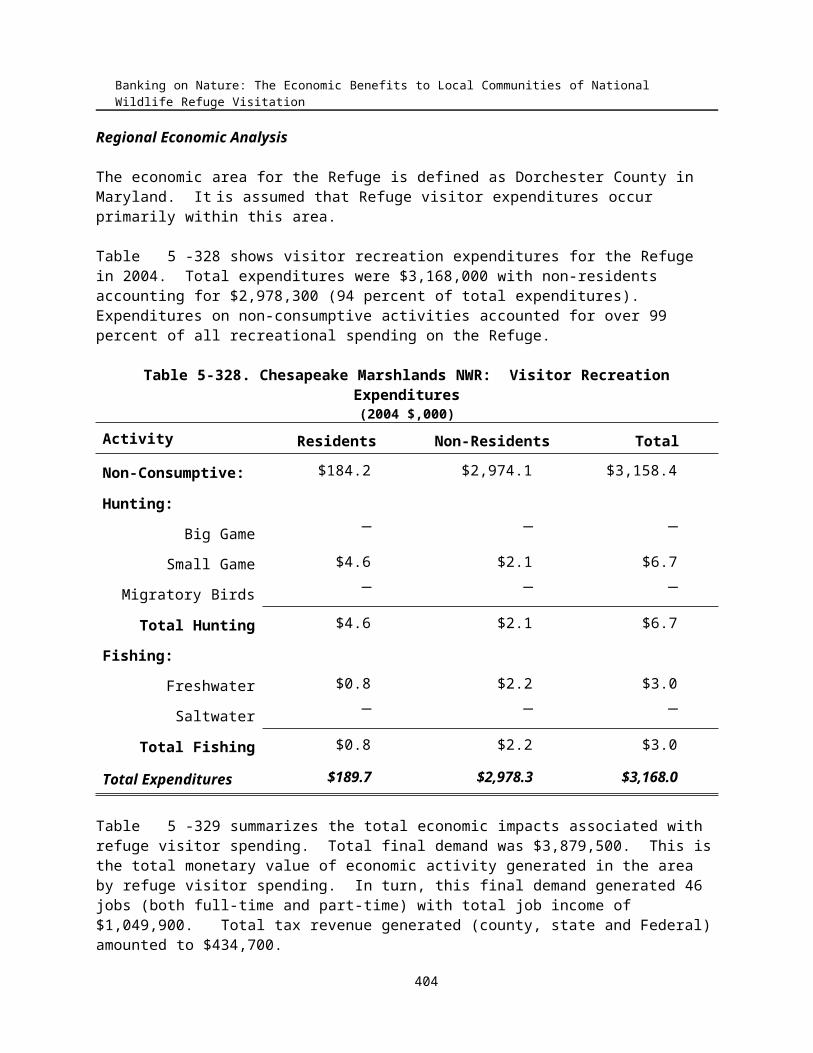
Sample Refuges Descriptions
Table 7-461. Togiak NWR:Summary of Area Economy, 2003
(Population & Employment in 000’s; Per Capita Income in 2004 dollars)
Population Employment Per Capita Income
County 2003
Percent change
1993-2003 2003
Percent change
1993-2003 2003
Percent change
1993-2003Anchorage, AK 270.9 8.3% 188.9 15.1% $38,755 7.3%
Bethel, AK 16.8 16.0% 9.0 32.9% $23,492 7.4%
Dillingham, AK 4.9 10.4% 4.1 18.5% $29,244 2.8%
Area Total 292.6 8.7% 202.0 15.8% $37,718 7.1%
Alaska 648.3 8.1% 418.5 16.1% $34,097 6.3%
United States 290,789.0 11.9% 167,174.4 17.9% $32,310 15.8%
Source: U.S. Department of Commerce 2003.
Table 7-462. Togiak NWR: 2004 Recreation Visits
Activity Residents Non-Residents Total
Non-Consumptive:
Nature Trails 0 0 0
Observation Platforms 0 0 0
Other Wildlife Observation 9,000 9,000 18,000
Beach /Water Use 420 180 600
Other Recreation 82,603 4,348 86,950
Hunting:
Big Game 724 128 852
Small Game 451 24 475
Migratory Birds 190 10 200
Fishing:
Freshwater 3,600 14,400 18,000
Saltwater 1,500 1,500 3,000
Total Visitation 98,488 29,589 128,077
Total Visitors 29,500
407

Banking on Nature: The Economic Benefits to Local Communities of National Wildlife Refuge Visitation
Regional Economic Analysis
Table 7-463 shows the visitor recreation expenditures in FY 2004. Recreational visitors to the refuge spent approximately $2.6 million, with $2.1 million being attributed to non-resident visits. Sixty-three percent of expenditures ($1.6 million) were associated with fishing activities.
Table 7-463. Togiak NWR: Visitor Recreation Expenditures (2004 $,000)
Activity Residents Non-Residents Total
Non-Consumptive: $403.8 $516.2 $919.9
Hunting:
Big Game $12.5 $21.2 $33.7
Small Game $2.8 $0.5 $3.3
Migratory Birds $2.3 $0.4 $2.8
Total Hunting $17.6 $22.2 $39.8
Fishing:
Freshwater $40.4 $1,483.1 $1,523.5
Saltwater $23.0 $92.3 $115.3
Total Fishing $63.4 $1,575.4 $1,638.8
Total Expenditures $484.8 $2,113.8 $2,598.6
Table 7-464 shows that recreation visits resulted in $3.7 million in final demand to the local area. This is the total monetary value of economic activity generated by recreational visitors. This final demand resulted in 45 jobs, $1.3 million in job income, and $806,600 in tax revenue. Non-resident visitors provided a $3.0 million stimulus to the local area economy.
Table 7-464. Togiak NWR: Local Economic Effects Associated with Recreation Visits (2004 $,000)
Residents Non-Residents Total
Final Demand $705.9 $3,017.7 $3,723.6
Jobs 8 37 45
Job Income $253.2 $1,092.6 $1,345.8
Total Tax Revenue $145.6 $661.0 $806.6
Table 7-465 compares the refuge budget and the local economic effects of recreation visits. In FY 2004, recreational benefits (recreation-related expenditures plus net economic value) totaled nearly $3.7 million, and budget expenditures summed to just under $2.1 million. Comparing these two estimates shows that for every $1 of budget expenditures, $1.80 in recreational benefits are derived. This ratio is
408
Sample Refuges Descriptions
provided to broadly compare the magnitude of the two estimates and should not be used as a benefit-cost ratio. In addition to recreational benefits, Togiak NWR provides a variety of other benefits including subsistence and ecological values which are not quantified in this analysis. The refuge budget also contributes a stimulus to the local economy, through payroll, maintenance, and operation expenditures.
Table 7-465. Togiak NWR: Summary of Local Economic Effects of Recreation Visits (2004 $,000)
FY 2004 Budget
RecreationExpenditures
Net Economic Value
Total economic effects per $1 budget expenditure
Togiak NWR $2,051.7 $2,598.6 $1,084.3 $1.80
409

Banking on Nature: The Economic Benefits to Local Communities of National Wildlife Refuge Visitation
An Overview of Sample Refuges
Characteristics of Sample Refuges
Unlike previous reports, the refuges selected for the detailed analysis are not a random sample. Instead, each refuge was chosen by the FWS Regional Office. The following tables are provided to compare the sample refuges to the refuge population as a whole.
Figure 8-1 shows the distribution of national wildlife refuges by recreational visitor days (RVDs). The sample represents each category well, except for the category for refuges with less than 10,000 RVDs which is slightly underrepresented.
Figure 8-1. Percent of National Wildlife Refuges by Recreational Visitor Days
37
33
17
10
3
29
39
17
12
30
5
10
15
20
25
30
35
40
45
<10,000 10,000 to 49,999 50,000 to 149,000 150,000 to 499,000 >500,000
Recreational Visitor Days
Perc
ent o
f Nat
iona
l Wild
life
Ref
uges
All Refuges Sample Refuges
Figure 8-2 illustrates the percentage of RVDs across activities. The majority of RVDs are attributable to non-consumptive activities, followed by fishing activities and hunting activities. Again, the sample represents the refuge population well when comparing averages.
410

Figure 8-2. Percent of Recreational Visitor Days by Activity
5
21
74
4
19
77
0
10
20
30
40
50
60
70
80
90
Hunting Activities Fishing Activities Non-Consumptive Activities
Perc
ent
All Refuges Sample Refuges
Economic Effects of Sample Refuges
Many variables affect a refuge’s economic impact on its region. Some relate to the refuge and its public use program; others relate to the economy of the region. This section recapitulates the results from the detailed case studies to highlight the differences among the sampled refuges. This information is not intended to rate refuges. Refuges serve many different purposes ─ a refuge with no public use, for example, could be vital to the survival of an endangered species. Each refuge must be viewed in light of its individual goals and how it achieves them.
Figure 8-3 shows the distribution of recreational visitor days and expenditures by activity. Although non-consumptive activities represent 77 percent of RVDs, they represent only 68 percent of visitor expenditures. This reflects the higher daily expenditures for hunting and fishing activities compared to non-consumptive uses.
Figure 8-4 illustrates the impact of non-resident visitors on total expenditures. Non-resident visitors are associated with 83 percent of the total expenditures for the sample refuges. This shows the proportionately greater impact of non-residents on local economies due to their higher daily expenditures compared to local visitors.
Figure 8-3. Distribution of Recreational Visitor Days and Expenditures by Activity
411

Banking on Nature: The Economic Benefits to Local Communities of National Wildlife Refuge Visitation
7768
4
5
1927
0%
20%
40%
60%
80%
100%
Recreational Visitor Days Recreation-Related Expenditures
Perc
ent
Non-Consumptive Activities Hunting activities Fishing Activities
Figure 8-4. Distribution of Expenditures by Resident and Non-Resident Visitors
17%
83%
Resident Expenditures Non-Resident Expenditures
412

Table 8-1 shows the sample refuges with the highest final demand generated by recreational visitation. Compared to all the sample refuges, Pea Island NWR had the highest recreational visitation (3,137,657 visits) and the highest final demand ($88.96 million). A close look at Table 8-1 shows how differences in refuge use result in different economic results. Time spent, activities enjoyed, and residence of visitors determine refuge recreation economics. The J.N. Ding Darling NWR receives about 1.5 million recreation visits annually compared with Okefenokee NWR receiving about 731,000 recreation visits. Although J.N Ding Darling NWR receives about 100 percent more visits, the final demand for J.N. Ding Darling NWR is only 20 percent higher than Okefenokee NWR. This difference is because visitors to Okefenokee NWR spend more time on average than visitors to J.N. Ding Darling NWR.
For information on other refuges, Appendix 3 summarizes the economic effects of the sample refuges.
Table 8-1 Top 10 National Wildlife Refuges Ranked by Final Demand
Refuge Recreational Visitation
Final Demand $(,000)
Employment Income $(,000) Jobs
Pea Island NWR 3,137,657 $88,957.4 $27,908.2 1,237Kenai NWR 587,395 $57,942.3 $20,354.9 689J.N. Ding Darling NWR 1,531,156 $47,254.4 $13,933.1 490Okefenokee NWR 730,891 $39,546.7 $12,228.0 529Monomoy NWR 936,119 $37,072.0 $12,726.0 131White River NWR 532,537 $22,953.9 $7,341.3 332Cape Romain NWR 260,555 $20,515.3 $5,729.9 218Bosque del Apache NWR 337,597 $20,300.3 $5,659.4 203St. Marks NWR 719,675 $16,707.4 $5,738.1 254E.B. Forsythe NWR 529,643 $14,418.6 $4,251.1 128
413

Banking on Nature: The Economic Benefits to Local Communities of National Wildlife Refuge Visitation
A National View
Aggregate National Economic Effects for the Lower 48 States2
Ninety-three refuges were studied in detail for this report. Sample refuges with more than 1,500 visitors and located within the lower 48 states were used to estimate the local economic effects of refuge visitation nationwide3. The methodology for this aggregation provides only a rough approximation at the refuge level. In the regional totals shown here, some of the errors for individual refuges will cancel out as they are added up, thus making the regional totals somewhat more reliable.
As shown in Table 9-1, final demand associated with recreation visits totaled nearly $1.4 billion. This is the total monetary value of economic activity generated by recreational refuge visitation. In turn, this final demand generated $453.9 million in job income and approximately 24,000 jobs.
Region 4 had the most visits in FY 2004 and was responsible for the highest number of jobs. The region contains several very popular refuges such as Pea Island, Ding Darling, Merritt Island, and Okefenokee.
National wildlife refuges received more visitors in 2004 than Grand Canyon, Yosemite, Yellowstone, Acadia, Grand Teton, and Statue of Liberty national parks combined (36.7 million vs. 18.6 million; National Park Service, 2004). The National Park system as a whole received 277 million visits for about 100 million visitor days. In 2004, the Bureau of Land Management lands received about 54 million visitors for nearly 70 million visitor days, and the National Forests hosted 204 million visitors (U.S. Department of Agriculture 2005, and U.S. Department of the Interior 2005). Although national wildlife refuges are used less intensively than the other federal lands, they are a major contributor to the mix of outdoor recreational opportunities in the United States.
Net Economic Value
As explained in the Introduction, refuge visitors derive more benefits from their recreation than they pay for it. Surveys can measure the additional benefit by asking how much the costs of recreating would need to rise before the visitor would decide not to participate in the activity. These amounts have been
2 The predictive model to estimate the 2004 national economic effects has changed significantly from previous reports. This is primarily because of the effects of using 93 refuges instead of 15 to estimate national impacts. Consequently, the 2004 national impacts are not directly comparable with national impacts as estimated in previous reports.3 Refer to the Introduction and Appendix 1 for further information.
Fish and Wildlife Service Regions
Region 1Region 3
Region 4Region 2
Region 6
Region 5
414

estimated for the nation. Multiplying the national value by the number of recreational visitor days spent pursuing that activity on a refuge yields an estimate for the net economic value (or consumer surplus) of the activity. These values are summed by Fish and Wildlife Service region in Table 9-2.
Consumer surplus from non-consumptive recreation dominates every region except for region 3 (the Midwest). Furthermore, consumer surplus from consumptive recreation (hunting and fishing) exceeds non-consumptive consumer surplus only in region 3, where several refuges’ activities are dominated by fishing. While hunting consumer surplus has the greatest value per trip ($55.46), hunting consumer surplus comprises only 8 percent of the consumer surplus values from national refuge visitation. Regional variation is caused by differing levels of activity.
Table 9-1. National Significance of Refuge Visitation by FWS Region
Fish and Wildlife Service Region
Visitors FY 2004
Final Demand($2004 ,000)
Job Income($2004 ,000) Jobs
1 5,414,101 $154,174 $50,901 3,195
2 4,512,943 $181,996 $61,499 3,571
3 7,416,192 $257,210 $77,674 3,680
4 10,963,087 $451,670 $166,626 8,527
5 6,189,308 $260,385 $80,402 3,645
6 2,248,679 $64,975 $16,769 1,341
Total 36,744,310 $1,370,408 $453,872 23,959
Table 9-2. Net Economic Values* from National Wildlife Refuge Visitation by FWS Region
Fish and Wildlife Service Region Visitors
FY 2004
Non-Consumptive
(2004 $,000)Hunting
(2004 $,000)Fishing
(2004 $,000)Total
(2004 $,000)
1 5,414,101 $112,869 $8,713 $10,228 $131,811
2 4,512,943 $105,874 $5,975 $36,611 $148,462
3 7,416,192 $80,848 $19,709 $74,021 $174,581
4 10,963,087 $208,738 $41,934 $126,343 $377,019
5 6,189,308 $144,151 $3,488 $51,487 $199,131
6 2,248,679 $28,394 $10,353 $9,490 $48,243
Total 36,744,310 $680,874 $90,172 $308,179 $1,079,247
* Due to data limitations, regional consumer surplus values were unavailable. Therefore, national estimates were substituted.
415

Banking on Nature: The Economic Benefits to Local Communities of National Wildlife Refuge Visitation
416

References
Aiken, Richard and Genevieve Pullis LaRouche. Net Economic Values for Wildlife-Related Recreation in 2001. (Report 2001-3). Addendum to the 2001 National Survey of Fishing, Hunting, and Wildlife Associated Recreation.) U. S. Department of the Interior, Fish and Wildlife Service. Washington, D.C. September 2003.
Heinrich, James W. And Scott R. Gaven. “The Economic Impact of Canada Geese at the Horicon Marsh, Wisconsin.” Wildlife Society Bulletin, 20:364-371. 1972.
Kerlinger, Paul. The Economic Impact of Birding on the Chincoteague National Wildlife Refuge Area, Virginia, 1993-1994 (unpublished survey report.) 1994.
Kerlinger, Paul. The Economic Impact of Birding on the Laguna Atascosa National Wildlife Refuge Area, Texas, 1993-1994 (unpublished survey report.) 1994.
Kerlinger, Paul. The Economic Impact of Birding on the Quivira National Wildlife Refuge Area, Kansas, 1993-1994 (unpublished survey report.) 1994.
Minnesota IMPLAN Group, Inc. IMPLAN System (2002 data and software). 1940 South Greeley Street, Suite 101, Stillwater MN 55082. 2002.
Olson, Doug and Scott Lindall. IMPLAN Professional Software, Analysis and Data Guide. 1940 South Greeley Street, Suite 101, Stillwater, MN 55082. 1996.
Taylor, Carol, Susan Winter, Greg Alward and Eric Siverts. Micro IMPLAN User’s Guide. Fort Collins CO: U.S. Department of Agriculture - Forest Service, Land Management Planning Systems Group, 1993.
U.S. Department of Agriculture. Forest Service. National Forest Visitor Use Monitoring National and Regional Project Results. August 2004.
http://www.fs.fed.us/recreation/programs/nvum/revised_vis_est.pdf Accessed 23 August 2005.
U. S. Department of Commerce. Bureau of the Census. Statistical Abstract of the United States: 1995. Washington, D.C. 1995.
U. S. Department of Commerce. Bureau of Economic Analysis. Regional Economic Accounts. www.bea.doc.gov/bea/regional/data.htm. Washington, D.C. August 2005.
U. S. Department of the Interior. Fiscal Year 2001 U. S. Department of the Interior Annual Financial Report. Washington, D.C. 2001.
417

Banking on Nature: The Economic Benefits to Local Communities of National Wildlife Refuge Visitation
U.S. Department of the Interior, Bureau of Land Management. Estimated Recreational Use of Public Lands Administered by the BLM, Fiscal Year 2004. http://www.blm.gov/natacq/pls04/pls4-1_04.pdf Accessed 5 September 2005.
U.S. Department of the Interior, National Park Service. National Park Service Statistical Abstract 2004. http://www2.nature.nps.gov/stats Accessed 8 August 2005.
U. S. Department of the Interior, U.S. Fish and Wildlife Service, Division of Federal Aid. 2001 National Survey of Fishing, Hunting, and Wildlife Associated Recreation (CD-ROM.) Washington, D.C. May 2002.
U.S. Department of the Interior, U.S. Fish and Wildlife Service, National Wildlife Refuge System. Refuge Management Information System 2004. Washington, D.C. Unpublished.
418

Note on the Appendices
The following appendices are intended to provide technical background information on the data, methods, and assumptions used to produce “Banking on Nature: The Economic Benefits to Local Communities of National Wildlife Refuge Recreation.” The appendices should be read in conjunction with the report, especially the Introduction. There is very little expository material in the appendices.
Appendix 1 - Estimating Economic Impacts: General Methodology and AssumptionsThis appendix explains the methodology and assumptions used to generate estimates of the sample refuges’ impacts and the national aggregation of local impacts. It is intended for economists and others knowledgeable in impact analysis.
Appendix 2 - Regional Recreation ExpendituresThis appendix shows the expenditure function by Fish and Wildlife Service region, activity, and residence for four categories of expenditures (food, lodging, transportation, and other).
Appendix 3 – Summary of Sample Refuges’ Economic EffectsThis appendix summarizes the data presented for the refuges in the sample.
419

Appendix 1Estimating Economic Impacts: General Methodology and Assumptions
1. Model.
Economic impacts for the 93 sample refuges were estimated using IMPLAN, a regional input-output modeling system. For more information on IMPLAN and regional input-output economic analysis, see Taylor et. al. Micro IMPLAN User’s Guide. U.S. Department of Agriculture - Forest Service. Fort Collins, CO, May 1993, and Olson and Lindall, IMPLAN Professional Software, Analysis and Data Guide., Stillwater, MN, 1996
2. Data Set.
The 2002 IMPLAN data set was used for the analysis. All monetary impacts were adjusted to 2004 dollars.
3. Expenditure Data
Per-person per-day expenditure information is based on the 2001 National Survey of Fishing, Hunting and Wildlife Associated Recreation (NSFHWR). This survey is conducted every 5 years by the U.S. Fish and Wildlife Service. Expenditure categories include: (1) food, including food, drink, and refreshments; (2) lodging, which includes lodging at motels, cabins, lodges, or campgrounds; (3) transportation, which includes both public transportation and the round-trip cost of transportation by private vehicle; and (4) other, which encompasses guide fees, pack trip or package fees, public land use or access fees, private land use or access fees (not including leases), equipment rental, and miscellaneous retail expenditures.
NSFHWR respondents were classified as non-residents if their state of residence differed from the state where the activity took place. Mean expenditures were calculated for each Fish and Wildlife Service region. Smaller geographic breakdowns left too few respondents in some categories for reliable averages.
Appendix 2 shows the per-day per-person expenditures for U.S. Fish and Wildlife Regions 1 through 7. These expenditures were allocated to IMPLAN sectors and activities as follows (Table 1a).
420

Appendix 1. Estimating Economic Impacts
Table 1a. Allocation of Expenditures to IMPLAN Categories
Fish/ Hunt Survey
Category IMPLAN
Activity/SectorPercentage allocated to
IMPLAN sector4
Lodging hotels 100%
Food/drinkfood for off-site
consumptionResidents: 35%
Non-residents 65%
..purchased meals
Residents: 65%Non-residents: 35%
Transportation gas/oilResidents: 90%
Non-residents: 85%
.. car repairs 10%
..airline
Residents: 0%Non-residents: 5%
Other sporting goods 40%
.. tobacco 1%
.. alcohol 1%
.. shoes 8%
.. clothing: women 8%
.. clothing: men 8%
.. personal/misc. 8%
.. toilet articles 8%
.. telephone 6%
.. postage 6%
.. film development 6%
4Percentage of spending in NSFHWR category allocated to specified IMPLAN activity or sector.
421

Banking on Nature: The Economic Benefits to Local Communities of National Wildlife Refuge Visitation
4. Recreation Visits and Expenditures
(a) Visits to the refuge are assumed to be for the primary purpose of engaging in wildlife-dependent recreation activities.
(b) Visitor use data is based on information obtained from the U.S. Fish and Wildlife Service Division of Refuges’ Refuge Management Information System (RMIS). Fiscal year 2004 data are used in this report.
(c) For the economic impact IMPLAN analysis, residents are defined as living within a 30-mile radius of the refuge; non-residents live outside of this area.
(d) Non-consumptive use is calculated by summing visitor use for nature trails, beach and water uses, wildlife observation, observation towers/platforms/photo blinds, and other non-consumptive recreation specific to each refuge. Visitor use data for the 93 sample refuges were further refined by discussions with refuge personnel to minimize the possibility of double-counting visitors who engage in more than one activity during a given visit.
(e) It is assumed that all expenditures related to refuge visits occur primarily in the economic base area defined for the refuge.
(f) Information on refuge visitors concerning trip destinations or the primary purpose of the trip is not currently available. To address the question of how much of total per-person per-day trip expenditures can be attributed to refuge visitation, the following assumptions were used for this study:
(i) On average, the more hours people spend on the refuge per trip, the higher the proportion of total daily trip expenditures are attributed to the refuge visit.
(ii) For hunting and fishing, it is assumed that refuge-related expenditures are the full amount of the NSFHWR per-person per-day trip expenditures for the specified activity in the given USFWS region. This assumption is appropriate since most hunting and fishing activities on refuges typically last 6 or more hours, making the refuge the probable primary destination for the day.
(iii) For non-consumptive activities, visits are converted to recreation visitor days based upon the average number of hours that visitors engaged in non-consumptive activities at the sample refuges. Thus, each refuge visitor day is then assumed to result in just less than half of the NSFHWR per-person per-day trip expenditures for non-consumptive recreation.
422

Appendix 1. Estimating Economic Impacts
5. Economic Study Area for the 93 Sample Refuges
In lieu of specific regional and local trade-flow information, IMPLAN economic study areas are defined as those counties adjacent or within the refuge which had a significant proportion of total refuge recreation expenditures. Significance was determined in consultation with refuge personnel and is based on estimates of where refuge visitors spent money and the location of major travel corridors. Generally, a conservative approach was taken in identifying counties to be included in the study area. Only spatial expenditure patterns and major travel corridors were used as criteria for determining counties to be included in the study area for each refuge. Backward linkages were not explicitly considered. It was decided that, given the lack of site-specific information on spending and trade flows, it would be better to underestimate economic impacts by keeping the study area small than to overestimate impacts by including counties marginally affected by refuge spending.
6. National Aggregation
(a) Economic Significance - One goal of this research is to generate estimates of the national impact of refuges on their regional economies. Ideally, an IMPLAN model and the necessary visitation information would be developed for each refuge and the results summed for a national estimate. Such a process would be prohibitively expensive. As an alternative, the results from 82 of the case studies can be treated as data points. (To remain consistent with past studies, refuges with less than 1,500 visitors or located outside the continental United States were not included in this model. Therefore, the number of data points for the model is slightly less than the number of refuges in the detailed sample.) Regression analysis determines the impacts of refuge characteristics to explain the differences in final demand, employment income, and jobs generated by visits to each refuge. Economic results for refuges not studied can be estimated from the regression coefficients developed from the regression analysis of the 82 sample refuges. The totals of these refuge estimates are national estimates for final demand, employment income, and jobs generated by refuge visitation. The process is explained in more detail below.
Basic visitation information about the refuges is available from the Refuge Management Information System database (RMIS). The Fish and Wildlife Service has also collected information about the counties where refuges are located from the Bureau of Census data and other sources. Various combinations of these variables were tested to see how well they predicted three dependent variables from the economic significance analysis:
1. Final Demand 2. Employment Income3. Jobs
With predictions of these variables and visitation for each of the unstudied refuges, final demand, employment income, and jobs could be estimated. After testing several combinations of the available variables to predict these dependent variables, the equations in Table A2 were selected. These equations are similar to those in the 1997 and 2002 reports. Each dependent variable is assumed to be a linear combination of the independent variables. Table 1b shows the coefficients.
423

Banking on Nature: The Economic Benefits to Local Communities of National Wildlife Refuge Visitation
Table 1b. Prediction Equations (Unless otherwise noted, data is for FY2004.)
Variable Final Demand Employment Income Jobs
Intercept 283.458 158.315 1.150
Total RVDs 0.001***
Non-Consumptive RVDs 0.071*** 0.022***
Hunting RVDs 0.052* 0.008
Fishing RVDs 0.063*** 0.020**
Area of County in Sq. Mi. -1.186* -0.460** -0.040*
Share Big Game Hunting of all visits
25.173
County Population, 1990 8.5 E-6
Distance of nearest city > 50,000 population
-1.053
Adjusted R2 0.95 0.97 0.89
***Significant at the 1 percent confidence level.**Significant at the 5 percent confidence level.*Significant at the 15 percent confidence level.
Several adjustments were made to the data to ensure consistency. The sample refuges’ visitation ranged from 3,300 to 2.1 million. Applying the equations derived from this sample to refuges with very low visitation yielded very high estimates of final demand. To avoid adding these into the national results, all refuges with fewer than 1,500 visits were deleted from the calculations. This eliminated about 87 refuges but relatively few visits. Refuges in Alaska, Hawaii, and the U.S. Territories were also deleted from the calculations. These areas were considered to have very different local economies which this overall model did not capture well. The distance to the nearest city over 50,000 was over 1,000 miles for some Pacific Island refuges, for example. The model applied the average length of stay for the sample refuges to all refuges, and this was felt to be problematic only for the Upper Mississippi Refuge which records extremely high visitation much of which is only loosely attributable to the refuge. To adjust for this the final demand for Upper Mississippi was reduced to one eighth of the calculated value. Even so, it showed the highest final demand ahead of Pea Island and Chincoteague.
424

Appendix 1. Estimating Economic Impacts
This technique produces estimates of final demand, employment income and jobs created by all visitor spending at each refuge. From comparison of these predictions with the case study results, it was clear that the estimates could be wide of the mark. However, the predicted values were both too high and too low so it appeared that the deviations would balance each other when applied to aggregates of refuges. For this reason, the results for refuges outside of the study sample are not reported. Only regional and national aggregates are reported.
For the most part, the coefficients are logical. For example, the variable that denotes the distance to a city with greater than 50,000 people is negative for the employment income generated equation. This implies that smaller towns in rural areas have a lower cost of living. However, the coefficient for the square mile variable was unexpected. A negative coefficient suggests that as the size of the county increases, then employment income will decrease.
(b) Consumer Surplus - Consumer surplus (net economic value) was estimated for the sample refuges by multiplying recreational visitor days by the national consumer surplus value. Essentially the same process was followed for the refuges outside of the sample. Outside of the sample, detailed information was not available on the amount of time spent in each activity on the refuge. This was not a problem for hunting and fishing as it had been assumed that these were full day activities for the most part. Non-consumptive use was adjusted to recreational visitor days using the average length of time such visitors stayed at the sample refuges.
The national estimates and refuge case studies provide a rough scale of the economic significance of refuge recreation in local communities. These results are broadly descriptive. They are not intended to provide policy direction or performance measures. Refuge management balances multiple goals. This report highlights only one component.
425

Appendix 2Regional Recreation Expenditures
Table 2a. Region 1 Recreation Expenditures: Per Person Per Day, by Recreation Activity (2004 $).
Non-Consumptive Big Game HuntingSmall Game
HuntingMigratory
Waterfowl Hunting Freshwater Fishing Saltwater Fishing
Sector ResidentNon-resident Resident
Non-resident Resident
Non-resident Resident
Non-resident Resident
Non-resident Resident
Non-resident
Lodging $5.34 $36.28 $1.84 $3.15 $3.64 $7.08 $0.47 $10.13 $3.59 $8.48 $2.52 $20.06
Food/drink $7.70 $28.16 $16.54 $19.63 $9.50 $19.63 $8.06 $39.85 $8.97 $18.10 $13.18 $23.21
Transportation $6.82 $43.32 $14.62 $38.62 $10.60 $48.01 $6.96 $94.80 $8.38 $30.50 $7.56 $21.23
Other $1.57 $3.94 $4.38 $30.02 $2.93 $5.35 $13.80 $14.54 $9.40 $7.64 $26.65 $17.14
Totals $21.44 $111.71 $37.37 $91.42 $26.67 $80.06 $29.30 $159.32 $30.34 $64.72 $49.90 $81.64For the purpose of this analysis, Region 1 includes California, Idaho, Nevada, Oregon, and Washington.
426

Appendix 2
Table 2b. Region 2 Recreation Expenditures: Per Person Per Day, by Recreation Activity (2004 $).
Non-Consumptive Big Game HuntingSmall Game
HuntingMigratory
Waterfowl Hunting Freshwater Fishing Saltwater Fishing
Sector ResidentNon-resident Resident
Non-resident Resident
Non-resident Resident
Non-resident Resident
Non-resident Resident
Non-resident
Lodging $4.44 $21.27 $3.63 $11.96 $1.03 $20.78 $2.29 $28.45 $1.47 $12.76 $7.16 $5.00
Food/drink $7.22 $29.48 $14.46 $31.52 $5.93 $15.48 $8.55 $20.83 $6.59 $19.55 $11.15 $5.28
Transportation $5.89 $28.84 $11.30 $27.34 $4.35 $5.07 $8.64 $34.08 $6.28 $20.00 $7.38 $7.27
Other $1.42 $3.86 $5.11 $83.76 $1.10 $6.59 $2.96 $25.48 $6.54 $15.06 $17.74 $11.42
Totals $18.97 $83.45 $34.49 $154.59 $12.42 $47.92 $22.45 $108.84 $20.88 $67.37 $43.43 $28.97Region 2 includes Arizona, New Mexico, Oklahoma and Texas.
427
Banking on Nature: The Economic Benefits to Local Communities of National Wildlife Refuge Visitation
Table 2c. Region 3 Recreation Expenditures: Per Person Per Day, by Recreation Activity (2004 $).
Non-Consumptive Big Game HuntingSmall Game
Hunting
Migratory Waterfowl Hunting
Freshwater Fishing Saltwater Fishing
Sector ResidentNon- resident Resident
Non- resident Resident
Non-resident Resident
Non-resident Resident
Non-resident Resident
Non-resident
Lodging $1.56 $10.10 $1.30 $4.07 $0.33 $9.93 $0.84 $2.64 $2.06 $11.58 ─ ─
Food/drink $3.31 $23.17 $7.46 $20.59 $4.42 $16.58 $7.35 $7.78 $5.82 $13.49 ─ ─
Transportation $2.39 $16.22 $5.53 $13.39 $4.39 $14.81 $6.29 $5.67 $5.13 $12.05 ─ ─
Other $0.97 $1.26 $1.15 $11.81 $0.76 $23.83 $1.19 $5.42 $4.90 $7.75 ─ ─
Totals $8.23 $50.75 $15.44 $49.85 $9.90 $65.16 $15.67 $21.52 $17.91 $44.88 ─ ─Region 3 includes Iowa, Illinois, Indiana, Minnesota, Missouri, Michigan, Ohio and Wisconsin.
428

Appendix 2
Table 2d. Region 4 Recreation Expenditures: Per Person Per Day, by Recreation Activity (2004 $).
Non-Consumptive Big Game HuntingSmall Game
Hunting
Migratory Waterfowl Hunting
Freshwater Fishing Saltwater Fishing
Sector ResidentNon-resident Resident
Non-resident Resident
Non-resident Resident
Non-resident Resident
Non-resident Resident
Non-resident
Lodging $2.14 $23.90 $1.49 $4.89 $1.20 $6.39 $1.19 $6.03 $1.18 $9.52 $4.62 $30.86
Food/drink $5.22 $28.48 $6.65 $19.01 $4.54 $8.26 $6.74 $14.32 $5.61 $13.22 $10.56 $21.87
Transportation $3.95 $22.42 $5.31 $13.19 $3.92 $18.02 $5.57 $42.38 $3.96 $14.66 $5.76 $29.17
Other $2.59 $3.61 $3.62 $4.86 $1.37 $8.76 $3.81 $21.17 $6.78 $10.28 $21.53 $49.16
Total $13.90 $78.41 $17.07 $41.95 $11.03 $41.43 $17.32 $83.89 $17.54 $47.68 $42.48 $131.07Region 4 includes Alabama, Arkansas, Florida, Georgia, Kentucky, Louisiana, Mississippi, North Carolina, Puerto Rico, South Carolina, and Tennessee.
429

Banking on Nature: The Economic Benefits to Local Communities of National Wildlife Refuge Visitation
Table 2e. Region 5 Recreation Expenditures: Per Person Per Day, by Recreation Activity (2004 $).
Non-Consumptive Big Game HuntingSmall Game
Hunting
Migratory Waterfowl Hunting
Freshwater Fishing Saltwater Fishing
Sector ResidentNon-resident Resident
Non-resident Resident
Non-resident Resident
Non-resident Resident
Non-resident Resident
Non-resident
Lodging $1.07 $14.08 $0.61 $6.27 $0.53 $4.66 $0.79 $7.96 $0.89 $9.10 $0.81 $7.58
Food/drink $3.29 $16.14 $5.55 $17.57 $3.78 $13.28 $3.71 $24.71 $4.27 $9.74 $8.06 $12.42
Transportation $2.75 $11.59 $3.97 $13.53 $3.23 $12.94 $2.96 $17.43 $3.29 $11.17 $4.12 $10.08
Other $1.48 $5.50 $2.32 $10.37 $2.22 $7.84 $1.43 $20.15 $4.83 $6.85 $26.67 $23.91
Total $8.59 $47.31 $12.44 $47.74 $9.76 $38.73 $8.89 $70.25 $13.28 $36.87 $39.66 $53.98Region 5 includes Connecticut, District of Columbia, Delaware, Massachusetts, Maryland, Maine, New Hampshire, New Jersey, New York, Pennsylvania, Rhode Island, Virginia, Vermont, and West Virginia.
430

Appendix 2
Table 2f. Region 6 Recreation Expenditures: Per Person Per Day, by Recreation Activity (2004 $).
Non-Consumptive Big Game HuntingSmall Game
Hunting
Migratory Waterfowl Hunting
Freshwater Fishing Saltwater Fishing
Sector ResidentNon-resident Resident
Non-resident Resident
Non-resident Resident
Non-resident Resident
Non-resident Resident
Non-resident
Lodging $2.01 $23.55 $1.56 $17.19 $0.86 $14.38 $0.29 $10.02 $1.23 $18.38 ─ ─
Food/drink $5.57 $24.20 $12.33 $28.09 $7.40 $19.94 $5.52 $25.90 $7.68 $23.32 ─ ─
Transportation $5.56 $22.88 $11.40 $33.43 $9.13 $26.40 $7.26 $15.78 $7.03 $23.68 ─ ─
Other $1.34 $2.89 $2.42 $62.69 $1.24 $9.79 $1.59 $3.10 $5.25 $7.71 ─ ─
Total $14.48 $73.52 $27.70 $141.40 $18.63 $70.51 $14.66 $54.80 $21.20 $73.10 ─ ─Region 6 includes Colorado, Kansas, Montana, North Dakota, Nebraska, South Dakota, Utah, and Wyoming.
431

Banking on Nature: The Economic Benefits to Local Communities of National Wildlife Refuge Visitation
Table 2g. Region 7 Recreation Expenditures: Per Person Per Day, by Recreation Activity (2004 $).
Non-Consumptive Big Game HuntingSmall Game
Hunting
Migratory Waterfowl Hunting
Freshwater Fishing Saltwater Fishing
Sector ResidentNon-resident Resident
Non-resident Resident
Non-resident Resident
Non-resident Resident
Non-resident Resident
Non-resident
Lodging 2.90
52.78 1.79 33
.35 0.75 7.19 2.12 10.29 4.12 70.30 3.91 52.43
Food/drink 6.56
23.35 16.29 26.42 10.47 19.94 11.72 40.48 13.23 64.04 11.57 30.58
Transportation 7.70
50.00 19.67 131.52 9.22 48.77 8.73 96.29 12.73 102.09 10.04 67.76
Other 3.24
23.77 24.55 405.85 1.60 5.43 21.53 14.77 10.37 134.30 29.60 70.79
Total 20.39 149.90 62.29 597.14 22.04 81.33 44.10 161.84 40.44 370.74 55.11 221.55
Region 7 includes Alaska.
432

Appendix 3Sample Refuges’ Economic Impacts
Table 3a. Sample Refuges’ Visitation and Economic Significance
Refuge Name RegionTotal
Recreation Visits
Total Final Demand $
(,000)
Total Employment
Income $(,000)Total Jobs
Alaska Peninsula 7 8,125 $1,271.1 $470.7 17Arrowwood 6 6,796 $87.6 $30.4 1Ash Meadows 1 68,632 $3,296.5 $915.6 28Audubon 6 16,027 $593.0 $199.0 9Back Bay 5 29,870 $485.0 $147.2 6Balcones Canyonlands 2 6,420 $127.0 $35.8 1Bandon Marsh 1 1,869 $32.5 $11.6 2Big Stone 3 27,790 $210.1 $69.6 4Bill Williams River 2 88,128 $3,668.9 $936.7 41Bitter Lake 2 56,891 $908.0 $227.0 11Black Bayou Lake 4 27,260 $723.7 $191.1 8Blackwater 5 177,368 $3,879.5 $1,049.9 46Bombay Hook 5 113,366 $2,259.6 $660.8 20Bon Secour 4 176,272 $7,158.4 $1,940.1 74Bosque del Apache 2 337,597 $20,300.3 $5,659.4 203Bowdoin 6 5,217 $111.7 $36.5 3Boyer Chute 6 22,044 $192.9 $64.8 3Buffalo Lake 2 7,957 $179.8 $48.6 2Cache River 4 255,976 $4,494.2 $1,609.7 82Canaan Valley 5 30,130 $611.0 $158.5 9Cape May 5 23,350 $489.2 $139.8 5Cape Romain 4 260,555 $20,515.3 $5,729.9 218Chassahowitzka 4 114,013 $4,710.1 $1,525.0 66Cibola 2 8,0173 $410.7 $126.1 4Clarks River 4 18,069 $585.4 $173.4 8Columbia 1 65,426 $5,149.8 $1,816.8 72Crane Meadows 3 4,998 $21.2 $7.2 2Deer Flat 1 126,405 $3,550.9 $1,197.3 50E.B. Forsythe 5 529,643 $14,418.6 $4,251.1 128Erie 5 23,759 $406.3 $140.2 6Felsenthal 4 338,832 $13,010.7 $3,357.1 145Fort Niobrara 6 207,069 $4,860.4 $1,703.5 102Grays Harbor 1 21,900 $406.5 $139.6 5Great Dismal Swamp 5 31,518 $566.5 $172.3 7Great Swamp 5 277,400 $2,675.5 $964.2 25Guadalupe-Nipomo Dunes 1 12,000 $1,138.0 $301.6 10Saddle Mountain 1 16,400 $926.5 $329.4 13Table 3a continued
Appendix 3
433

Banking on Nature: The Economic Benefits to Local Communities of National Wildlife Refuge Visitation
Refuge Name RegionTotal
Recreation Visits
Total Final Demand $
(,000)
Total Employment
Income $(,000)Total Jobs
Humboldt 1 21,845 $480.4 $159.5 6Izembek 7 6,155 $644.8 $233.6 8J.N. Ding Darling 4 1,531,156 $47,254.4 $13,933.1 490Kealia Pond 1 2,358 $102.7 $34.8 2Kenai 7 587,395 $57,942.3 $20,354.9 689Kern 1 5,523 $739.4 $184.2 6Kodiak 7 30,096 $2,571.9 $946.0 34Kofa 2 282,645 $8,572.9 $2,479.9 106Kootenai 1 92,819 $2,185.3 $748.4 43Lacreek 6 5,820 $84.5 $28.8 2Lee Metcalf 6 164,372 $1,362.7 $461.1 23Little Pend-Oreille 1 59,700 $3,658.4 $1,211.4 42Lower Klamath 1 240,563 $3,197.9 $1,119.9 43Lower Suwannee 4 175,579 $11,133.2 $3,348.0 139Malheur 1 240,563 $2,622.3 $927.1 50Maxwell 2 4,235 $171.2 $45.5 2Medicine Lake 6 9,238 $248.1 $82.0 4Mingo 3 72,247 $872.1 $242.4 12Monomoy 5 936,119 $37,072.0 $12,726.0 131Montezuma 5 118,992 $1,810.8 $647.4 23Moosehorn 5 144,006 $538.7 $152.3 8Neal Smith 3 87,033 $718.2 $234.4 9Necedah 3 103,016 $2,870.2 $931.5 37Nisqually 1 259,946 $4,149.1 $1,398.0 51Okefenokee 4 730,891 $39,546.7 $12,228.0 529Ottawa 3 350,038 $4,260.4 $1,359.7 55Parker River 5 594,738 $7,818.9 $2,347.8 66Patoka River 3 20,000 $384.1 $127.3 6Patuxent Research 5 209,174 $3,815.9 $1,097.6 35Pea Island 4 3,137,657 $88,957.4 $27,908.2 1,237Pee Dee 4 36,580 $1,188.2 $314.6 12Piedmont 4 65,117 $3,426.0 $952.4 37Prime Hook 5 120,414 $1,456.6 $419.4 13Rachel Carson 5 237,600 $1,321.4 $377.8 14Rice Lake 3 44,750 $413.0 $144.4 7Ridgefield 1 135,548 $2,169.1 $748.1 25Ruby Lake 1 14,976 $833.9 $281.7 11Sabine 4 274,191 $9,049.4 $2,467.0 108Sacramento 1 109,096 $2,398.4 $856.4 22Santa Ana 2 164,846 $3,412.7 $856.7 40Seney 3 57,403 $671.8 $235.5 11Sequoyah 2 108,605 $5,873.9 $1,516.9 69Sherburne 3 97,830 $1,219.3 $406.8 18Table 3a continued
434

Refuge Name RegionTotal
Recreation Visits
Total Final Demand $
(,000)
Total Employment
Income $(,000)Total Jobs
Sonny Bono Salton Sea 1 18,993 $622.7 $182.2 7Squaw Creek 3 259,706 $2,252.3 $748.8 26St. Marks 4 719,675 $16,707.4 $5,738.1 254Stillwater 1 35,720 $979.0 $345.4 11Tamarac 3 36,480 $329.8 $114.2 6Tennessee 4 392,760 $12,193.3 $3,188.7 145Theodore Roosevelt Complex 4 66,112 $1,407.7 $371.8 18
Tijuana Slough 1 209,000 $2,221.1 $614.9 18Tishomingo 2 198,035 $4,087.4 $1,104.3 57Togiak 7 128,077 $3,723.6 $1,345.8 45Washita 2 129,743 $2,554.9 $666.6 34West Tennessee Complex 4 365,622 $6,044.1 $1,650.4 75
White River 4 532,537 $22,953.9 $7,341.3 332
Appendix 3
435

Banking on Nature: The Economic Benefits to Local Communities of National Wildlife Refuge Visitation
Certain ratios may shed more light on the differences among the sample refuges and their local economies. The differences in visitors’ length of stay are shown by the Recreation Visitor Days per Recreational Visit ratio in Table 3b. The Saddle Mountain, Kern, and Columbia NWRs have ratios around 0.85 while the Lower Klamath Refuge’s ratio is 0.14.
Final demand, jobs generated, and employment income are broad measures of the economic significance of a refuge’s visitation to its neighborhood. These measures show the variation in the ultimate impact of the refuge when all of the factors are included. The broad range of change in final demand per 1,000 visits from $3,741 for Moosehorn NWR to $156,443 for Alaska Peninsula Refuge highlights how any blanket assumptions about the value of refuge visitation may be inaccurate. Taking any kind of average rate for impacts will clearly be inaccurate for any single refuge.
Table 3b. Sample Refuges’ Economic Ratios
Refuge
Final Demandper 1,000
Recreation Visits
Employment Income
per 1,000Recreation Visits
Jobsper 1,000
Recreation Visits
RVDs per Recreation
Visit
Alaska Peninsula 156,443 57,930 2.08 0.63Arrowwood 12,895 4,466 0.22 0.29Ash Meadows 48,032 13,341 0.41 0.24Audubon 37,003 12,418 0.56 0.50Back Bay 16,237 4,928 0.20 0.56Balcones Canyonlands 19,782 5,576 0.19 0.25Bandon Marsh 17,387 6,232 1.07 0.17Big Stone 7,559 2,505 0.14 0.31Bill Williams River 41,631 10,629 0.47 0.47Bitter Lake 15,960 3,990 0.19 0.24Black Bayou Lake 26,548 7,010 0.29 0.34Blackwater 21,873 5,919 0.26 0.49Bombay Hook 19,932 5,829 0.18 0.37Bon Secour 40,610 11,006 0.42 0.40Bosque del Apache 60,132 16,764 0.60 0.49Bowdoin 21,409 6,997 0.59 0.28Boyer Chute 8,750 2,940 0.11 0.26Buffalo Lake 22,596 6,108 0.25 0.52Cache River 17,557 6,288 0.32 0.46Canaan Valley 20,279 5,261 0.30 0.39Cape May 20,951 5,987 0.21 0.36Cape Romain 78,737 21,991 0.84 0.71Chassahowitzka 41,312 13,376 0.58 0.36Cibola 51,273 15,742 0.50 0.40Clarks River 32,398 9,597 0.44 0.68Columbia 78,712 27,769 1.10 0.84Crane Meadows 4,243 1,443 0.40 0.23Deer Flat 28,091 9,472 0.39 0.56E.B. Forsythe 27,223 8,026 0.24 0.35Erie 17,101 5,901 0.26 0.43Felsenthal 38,399 9,908 0.43 0.65Fort Niobrara 23,472 8,227 0.49 0.55Grays Harbor 18,561 6,376 0.24 0.25Great Dismal Swamp 17,974 5,467 0.22 0.38Table 3b continued
436

Refuge
Final Demandper 1,000
Recreation Visits
Employment Income
per 1,000Recreation Visits
Jobsper 1,000
Recreation Visits
RVDs per Recreation
Visit
Appendix 3
437

Banking on Nature: The Economic Benefits to Local Communities of National Wildlife Refuge Visitation
Great Swamp 9,645 3,476 0.09 0.38Guadalupe-Nipomo Dunes 94,833 25,133 0.83 0.60Humboldt 21,990 7,300 0.29 0.26Izembek 104,760 37,951 1.27 0.63J.N. Ding Darling 30,862 9,100 0.32 0.32Kealia Pond 43,550 14,775 0.85 0.38Kenai 98,643 34,653 1.17 0.47Kern 133,877 33,351 1.09 0.84Kodiak 85,457 31,434 1.11 0.45Kofa 30,331 8,774 0.38 0.65Kootenai 23,544 8,063 0.46 0.55Lacreek 14,520 4,956 0.34 0.23Lee Metcalf 8,290 2,805 0.14 0.25Little Pend-Oreille 61,280 20,291 0.71 0.65Lower Klamath 13,293 4,655 0.18 0.14Lower Suwannee 63,408 19,068 0.79 0.63Malheur 10,901 3,854 0.21 0.26Maxwell 40,425 10,744 0.47 0.38Medicine Lake 26,860 8,876 0.45 0.38Mingo 12,071 3,355 0.17 0.30Monomoy 39,602 13,594 0.14 0.65Montezuma 15,218 5,441 0.19 0.37Moosehorn 3,741 1,058 0.06 0.16Neal Smith 8,252 2,694 0.10 0.27Necedah 27,862 9,042 0.36 0.44Nisqually 15,961 5,378 0.20 0.26Okefenokee 54,108 16,730 0.72 0.73Ottawa 12,171 3,884 0.16 0.34Parker River 13,147 3,948 0.11 0.31Patoka River 19,207 6,363 0.29 0.61Patuxent Research 18,243 5,247 0.17 0.50Pea Island 28,352 8,895 0.39 0.41Pee Dee 32,482 8,600 0.33 0.25Piedmont 52,613 14,626 0.57 0.64Prime Hook 12,097 3,483 0.11 0.31Rachel Carson 5,561 1,590 0.06 0.15Rice Lake 9,228 3,227 0.15 0.20Ridgefield 16,002 5,519 0.19 0.25Ruby Lake 55,680 18,812 0.75 0.83Sabine 33,004 8,997 0.39 0.43Sacramento 21,984 7,850 0.21 0.39Saddle Mountain 56,494 20,086 0.81 0.85Santa Ana 20,702 5,197 0.24 0.19Seney 11,703 4,103 0.19 0.25Sequoyah 54,085 13,967 0.64 0.53Sherburne 12,464 4,158 0.18 0.41Table 3b continued
Refuge
Final Demandper 1,000
Recreation Visits
Employment Income
per 1,000Recreation Visits
Jobsper 1,000
Recreation Visits
RVDs per Recreation
Visit
Squaw Creek 8,672 2,883 0.10 0.24Sonny Bono Salton Sea 32,786 9,593 0.37 0.26
438

St. Marks 23,215 7,973 0.35 0.36Stillwater 27,406 9,669 0.30 0.43Tamarac 9,042 3,130 0.17 0.43Tennessee 31,045 8,119 0.37 0.64Theodore Roosevelt Complex 21,293 5,624 0.27 0.60Tijuana Slough/Sweetwater 10,627 2,942 0.09 0.15Tishomingo 20,640 5,576 0.29 0.29Togiak 29,073 10,508 0.35 0.23Washita 19,692 5,138 0.26 0.30West Tennessee Complex 16,531 4,514 0.21 0.37White River 43,103 13,786 0.62 0.64
Appendix 3
439