bank time deposit rates and market discipline in poland: the
TRANSCRIPT
Bank Time Deposit Rates and MarketDiscipline in Poland: The Impact of StateOwnership and Deposit Insurance Reform*
Thomas S. Mondschean and Timothy P.Opiela
Working Papers SeriesResearch Department(WP-98-13)
Federal Reserve Bank of Chicago
Working Paper Series
1
Bank Time Deposit Rates and Market Discipline in Poland: The Impact ofState Ownership and Deposit Insurance Reform*
Thomas S. MondscheanDepartment of Economics
DePaul University1 East Jackson Blvd.Chicago IL 60604
(312) 362-5210
Timothy P. OpielaDepartment of EconomicsUniversity of the Pacific
Stockton, CA 95211(209) 946-2293
November 1998
Abstract
This paper examines the impact of ownership structure and changes in the deposit insurancesystem on the market for bank time deposits in Poland. In an environment of less restrictive banksupervision and a deposit insurance policy that favored state banks, we find that depositors exacteda price for risk taking. After a new law increasing coverage for private banks went into effect,however, bank specific variables became less important in explaining differences in deposit interestrates. We report that the three fully guaranteed state banks pay significantly lower rates thanprivate banks. However, other state-owned banks, with the same de jure guarantee as privatebanks, pay significantly lower rates than private banks, so it appears that depositors treat thesestate-owned banks as if they have a larger de facto guarantee.
* We thank the National Bank of Poland for supplying data and especially Marta Golajewska,Agnieszka Grat and Pawel Wyczanski for their assistance. We have greatly benefited fromdiscussions with, suggestions from and translations by Ewa M. Nikiel. Urszula Zapolska
provided excellent research assistance. We also thank Linda M. Hooks for helpful commentswhen this paper was presented at the 1997 WEA conference in Seattle. Financial support
from DePaul University’s College of Commerce and the University of the Pacific is gratefullyacknowledged. All views expressed are those of the authors and are not necessarily those ofthe National Bank of Poland, the Federal Reserve Bank of Chicago or the Federal Reserve
System.Bank Time Deposit Rates and Market Discipline in Poland:The Impact of State Ownership and Deposit Insurance Reform
2
During the past several years, Poland has been promoting financial market
development and stability through market-based microeconomic banking reforms.1 The
National Bank of Poland (NBP) has evolved into a modern central bank that oversees the
payments system and uses open market operations to conduct monetary policy. At the
same time, it has enhanced bank safety and soundness by establishing prudential
regulations based on the Basel Capital Standards and improving the quality of bank
supervision.2 The Ministry of Finance has also fostered banking reform through
commercializing and privatizating several previously state-owned banks. As a result, the
banking system has changed from having a handful of state-owned banks controlling
almost all deposits at the beginning of the decade to an environment where state-owned,
partially state-owned, privately owned, and foreign banks coexist and compete to provide
financial services to Polish firms and households.
This paper examines an aspect of this “mixed” banking system by focusing on the
behavior of banks and their customers in the market for time deposits from 1992 to 1996.
We believe this subject is worth studying for three reasons. First, all Polish banks are free
to set interest rates on the time deposit products they offer, and depositors are free to
choose the banks in which they deposit their funds. By examining the deposit rates that
individual banks pay, we can observe whether the market is exerting discipline on banks in
the sense that weaker banks are being forced to pay a risk premium for funds. As
Flannery (1998) concluded in a recent survey article about US financial institutions,
“[e]ven in the presence of conjectural federal guarantees, large CD rates sensibly reflect
3
bank risks. Bank debenture rates came to reflect bank condition once conjectural
guarantees were lifted from these instruments. Even small, retail depositors have been
shown to behave rationally when some intermediaries exhibit solvency problems.” If we
can show similar empirical results for Poland, a nation with a less sophisticated financial
system than the United States, we not only illustrate the robustness of Flannery’s
conclusions but we also demonstrate that private monitoring of banks can complement
public monitoring by bank regulators even in developing countries. 3
The second motivation for this study is to examine how changes in deposit
insurance coverage affect deposit interest rates. During the period chosen for this study,
Poland implemented a new deposit insurance law that made explicit the extent of previous
mostly implicit deposit guarantees. Although deposit insurance, properly structured and
implemented, can assist in stabilizing banking systems, particularly in transition economies
when potentially destabilizing economic restructuring is being undertaken, the guarantees
created can increase the potential for moral hazard, especially if banks are
undercapitalized. Examining the Polish deposit market during this period of institutional
change may help us better understand how private depositors respond to changes in
deposit insurance regimes.
The third motivation for this study is to examine the impact of state ownership of
banks on deposit rates. Poland adopted explicit differences in deposit insurance coverage
between state and private banks. The deposits of three of the largest banks, all state-
owned, are fully covered, while the remaining banks have partial insurance; moreover,
these three banks pay a lower premium than other banks despite receiving greater

4
coverage. This policy of differential pricing provides both direct (they pay lower premiums
for broader coverage) and indirect (they can offer lower deposit rates than other banks)
subsidies to these three banks. By studying this market, we can document the existence of
this “cross-subsidization” between fully and partially covered banks. Furthermore, some
smaller state-owned banks currently possess the same partial explicit coverage as the
private banks, but, given their ownership structure, may actually possess a larger implicit
guarantee. Therefore, we also examine whether their ownership status gives them a
competitive advantage over private banks in gathering deposits.
We find that before explicit deposit insurance was in effect, the interest rates paid
by Polish banks on their time deposits were significantly related to individual bank
characteristics, especially for banks with low capital. After the passage of a formal explicit
deposit insurance scheme in late 1994, the relationship between these factors and time
deposit rates diminishes. Controlling for bank-specific factors, we also show that the three
fully guaranteed state banks paid lower deposit rates than the partially guaranteed banks.
Thus, we conclude these banks benefited from the larger guarantee. We also find that,
again controlling for bank-specific effects, the partially guaranteed state banks paid lower
rates than partially guaranteed private banks. It may be that these state-owned banks are
perceived as possessing a larger de facto guarantee than fully private banks.
This paper is organized as follows. Section two presents an overview of the Polish
banking system, describes trends in deposit growth since 1992, and examines the evolution
of deposit insurance policy in Poland. Section three discusses the data and methodology
used in the empirical analysis, including the hypotheses we test. Section four reports the
5
empirical results. Section five concludes.
2. The Market Environment for Commercial Bank Deposits in Poland
In terms of the ownership structure of the banking system, Poland has been in
transition toward greater privatization since the beginning of the decade. Nevertheless, as
of the end of 1997, over half of commercial banking assets were still under full or partial
state control. Table 1 lists the major banks in Poland, their total deposits, and the degree
of state ownership at the end of 1997. The three largest banks, PKO-BP, Pekao SA, and
BGZ, are all fully state-owned and held 46.4 percent of the country’s deposits at yearend
1997. PKO-BP is a savings bank that has branches and outlets throughout the country.
Its original mission was to accept household deposits and finance residential construction
projects. Pekao SA offers, among other services, foreign and domestic currency deposit
accounts to its customers and serves as a vehicle for overseas Poles to remit funds to
relatives in Poland. In 1997, Pekao was merged with major state-owned banks in three
Polish cities, to form Group Pekao, the largest bank holding company in Poland. BGZ
serves primarily the agricultural and food processing sectors of the economy. It is jointly
owned by the national government and by over 1,200 cooperative banks that offer deposit
accounts and loans to private farmers and self-employed craftspeople. Despite having
received several capital infusions from the state during the 1990s, it has remained insolvent
for several years. Other major Polish banks are listed in Table 1. These include large
regional banks as well as those banks primarily engaged in providing international trade
and wholesale banking services.4 Several of these have been privatized.
Deposit Market Development
Approximately one third of Polish households have never used financial services,

6
according to a survey reported in Gorniak (1995). He also reports that safety is a major
concern of household depositors. These results were confirmed in a 1997 survey by
Jerschina (1998), who found that 36.7 percent of Poles surveyed had never used a bank,
and only 1.2 percent held a certificate of deposit in the last twelve months. Poland, for the
most part, continues to operate as a cash economy. These statistics support the opinion of
many researchers and bankers that Poland is underbanked and that the potential to provide
additional banking services to the Polish public is one reason foreign banks are attracted to
Poland. Depositors in Poland have several options. They can hold demand, savings and
time deposits. Deposit accounts are available in zloty as well as in foreign currencies (US
dollar or Deutschmark).
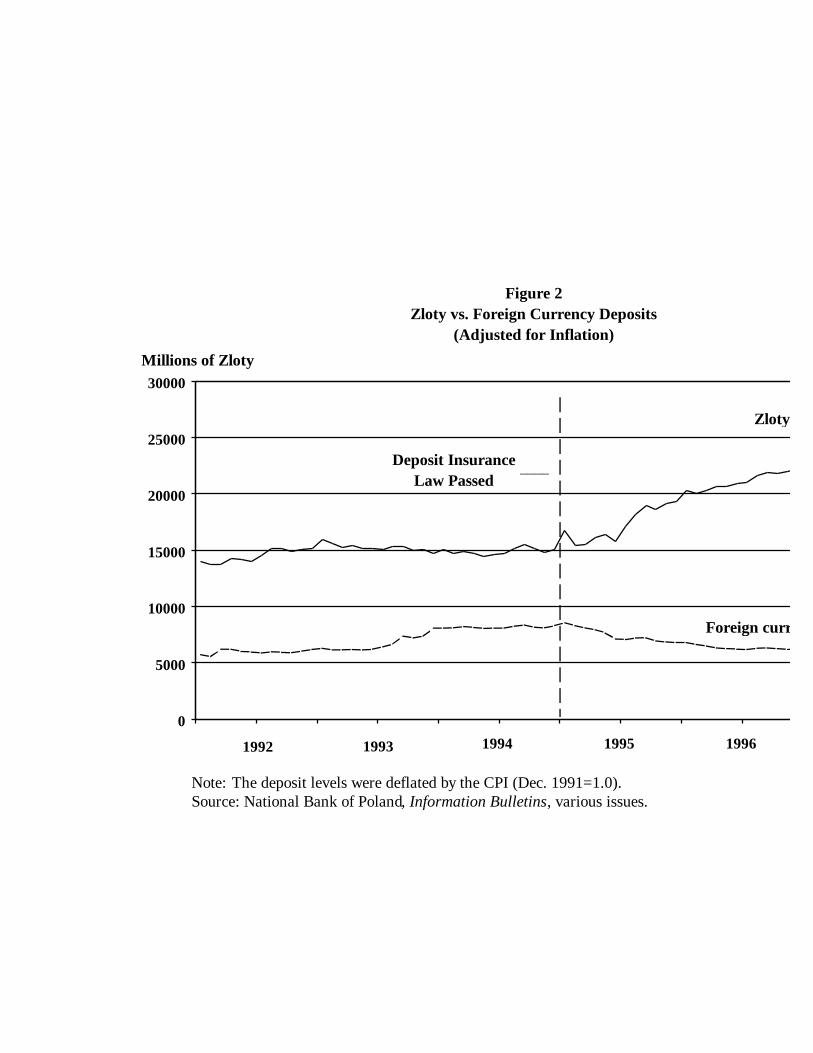
For the purpose of analyzing aggregate deposit trends, we divide our period of
study into two subperiods based on yearend figures: 1991 to 1994, and 1994 to 1997.
Table 2 reports on how several categories of deposits, adjusted for inflation, have grown
over the period. One can observe that the demand for foreign currency deposits was
growing much more rapidly than zloty-denominated deposits from 1991 to 1994. During
this period, inflation was extremely volatile, and exchange rate policy was uncertain, with
the Polish government devaluing the zloty twice in addition to maintaining a crawling peg
depreciation rate of 1.8 percent per month.5
After 1994, however, foreign currency deposits fell sharply, declining 16 percent
by yearend 1997. There are several potential explanations. First, the zloty was re-
denominated at the beginning of 1995 with one new zloty equal to 10,000 old zloty. This
may have enhanced public confidence in the domestic currency. Second, the dollar fell
7
sharply against most currencies in the first half of 1995, so the real exchange rate value of
the zloty was appreciating. This may have induced Poles to switch to zloty-denominated
deposits given the interest rate on zloty deposits was much higher than on dollar deposits.
Third, formal deposit insurance was passed in late 1994 and took effect in March 1995,
which may have enhanced public confidence in local currency deposits.
Examining the growth of zloty-denominated deposits, the acceleration of overall
deposit growth from 1991 to 1997 is clear: total deposits grew 19.5 percent after inflation
from 1991 to 1994 and 59.7 percent from 1994 to 1997. Household demand deposits
soared, accelerating in the latter period to a 147.8 percent gain after inflation. This may
have been due to an increased willingness of banks to make personal loans beginning in
early 1995, since this would permit banks to increase checkable deposits.
Personal time deposits grew 22.9 percent after inflation over the 1991-1994 period
and more than doubled from 1994 to 1997. The introduction of deposit insurance, an
improving economy, increasing confidence in the zloty and declining inflation are all
possible explanations for the rapid growth. Table 3 classifies zloty time deposits of
households by term to maturity. These data show that the vast majority of time deposits
have a term to maturity less than one year. Given the volatility of inflation and the rates
offered on longer-term deposits by Polish banks, depositors were evidently reluctant to
hold longer-term time deposits. The share of total time deposits with maturity over one
year fell from 13.1 percent at the end of 1991 to about 4 percent by the end of 1997.
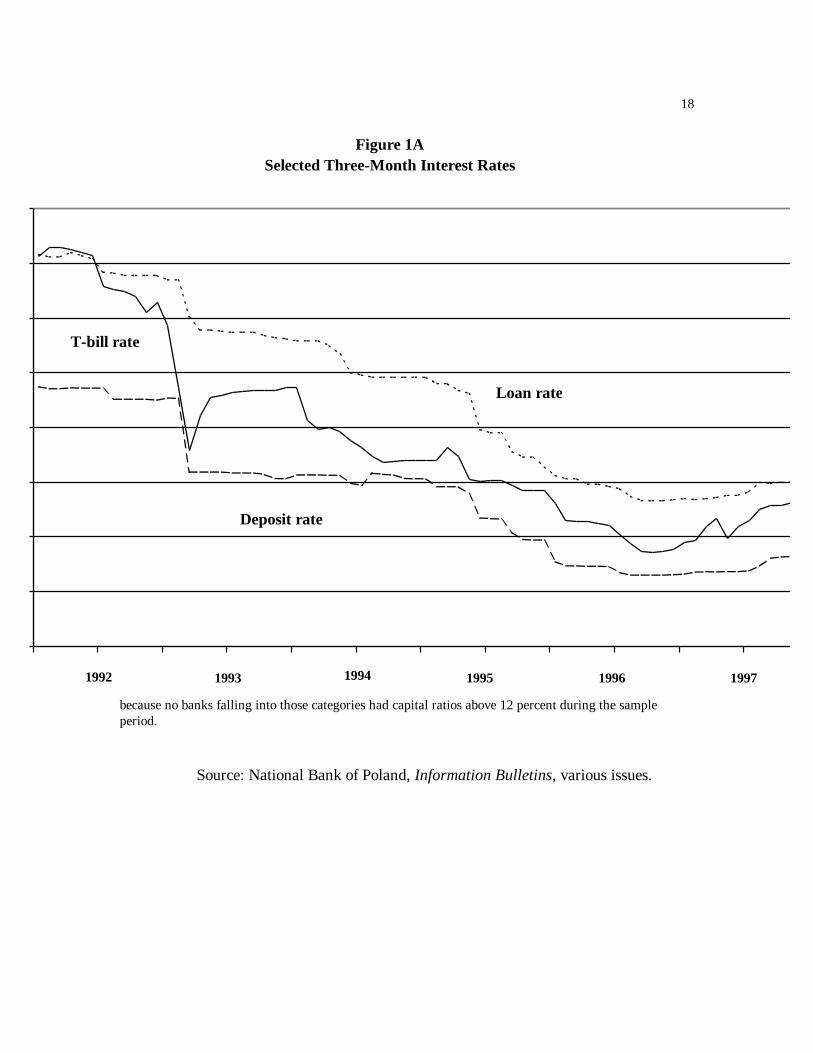
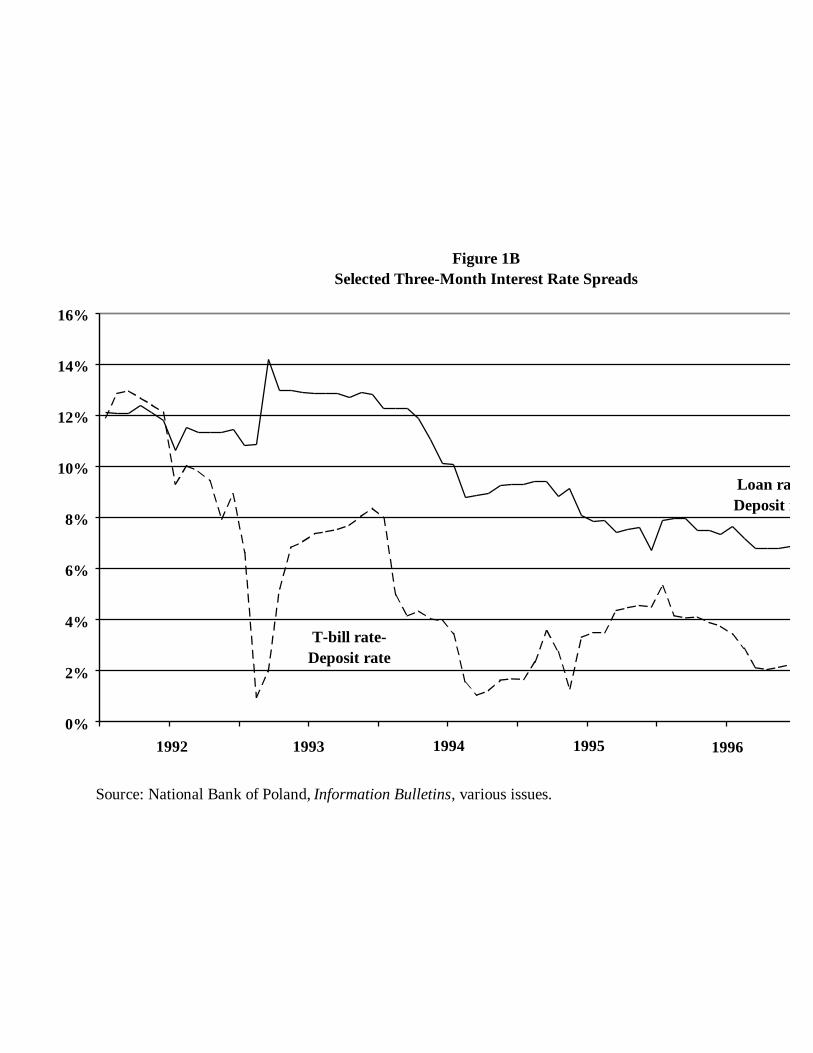
Figures 1A and 1B illustrate the short-term interest rate environment facing Polish
banks during the 1992-1997 period. The general decline in interest rates during this
8
period was driven primarily by falling inflation. Examining Figure 1B, one can observe
that the spread between the three month T-bill and deposit rate was much higher in 1992-
1993 (except for a brief period in March and April of 1993 where the Ministry of Finance
tried to hold down Treasury rates) than in the 1994-1997 period. Moreover, if one adjusts
the deposit rate for reserve requirements (9-10 percent over the sample period), the spread
between the T-bill rate and adjusted deposit rate became negative in the second half of
1994 and early 1995, turned up sharply in 1995, and declined to almost zero in late 1996.
Since that time, NBP has raised short-term Treasury rates substantially to stem loan
growth and reduce inflationary pressure. The resulting narrowing of interest rate spreads
between loans and Treasuries has made government securities relatively more attractive
for banks to hold.
The Development of the Deposit Insurance System
Deposit insurance is an important component of prudential regulation. Deposit
insurance promotes a stable flow of funds to the banking system by instilling public
confidence in the safety of their funds. Government deposit guarantees, however, also
reduce the incentive for depositors to monitor banks or for banks to monitor each other.
In the absence of adequate government supervision, this lack of monitoring can lead to
excessive moral hazard behavior by poorly capitalized banks. Thus, the structure and
implementation of the insurance scheme determines the incentive structure for all those
involved. It also determines the degree and distribution of risk in the system, both of
which affect banking system soundness.
It has been argued that extensive or full government deposit insurance schemes are

9
not well suited to transition economies.6 Transition economies often do not have adequate
prudential regulations, accounting standards are not high enough to provide accurate
measures of bank net worth, and regulatory agencies often lack the expertise to contain
moral hazard. The governments of these economies also cannot afford extensive payoffs
to depositors. On the other hand, it can be argued that without deposit insurance, the
inherent risk in an unstable transition economy and its banking system will reduce overall
saving, adversely affecting both financial and real sector development.
The Polish deposit insurance scheme is an example of a system that went through
three distinct structural changes, each establishing its own set of monitoring incentives for
depositors and affecting the level and distribution of risk in the banking system. Deposit
insurance started as a bifurcated system with full guarantees for state banks and no
guarantees for private banks (1989-1992). It then moved to a possible implicit partial
guarantee for private banks and a full guarantee for state banks (1992-94), and finally
resulted in explicit full coverage for three large state banks and partial coverage for all
other banks (1995-present). In conjunction with the incentives created by these changes,
depositors appear to have had access to both audited and unaudited information on
individual banks. The combination of shifting incentives and bank-specific information may
have allowed depositors to discipline the deposit rates paid by banks.
Before 1989, Polish law contained no provisions for deposit protection. The 1989
Banking Law (Article 49) made the Ministry of Finance liable for the deposit claims of the
NBP, three state banks (PKO-BP, Pekao SA, and BGZ), 11 joint-stock banks, 3 other
state-owned banks and 1664 cooperative banks. This law provided full deposit coverage

10
only for the state-owned banks. Private banks were not covered, even partially, by the
state.7
In the early years of banking system development, government monitoring was in
an infant stage. Although the 1989 NBP Act gave the central bank sole supervisory
responsibility over banks, the fragility of the banking system and the magnitude of
economic change brought about by the “shock therapy” stabilization program of 1990
made it extremely difficult to enforce prudential regulations even if bank supervisory skills
had been adequate. In addition, a liberal chartering policy designed to promote greater
competition was adopted in 1989, so during this high-risk period, the number of banks
increased from the above mentioned 14 state-owned banks to 75 private and state-owned
banks from 1989 to 1990. By the end of 1993, private banks numbered about 80 and held
about 21% of the total assets and 18% of the total deposits of the commercial banking
system. The bifurcated deposit insurance system (full guarantee for state-owned banks and
no guarantee for private banks) created incentives for depositor monitoring.
The combination of poorly capitalized banks, inadequate bank supervision,
imperfect private monitoring, corruption, and an unstable economy pushed several private
banks into insolvency within the first few years of the transition. Bank Handlowo
Kredytowy of Katowice was the first commercial bank put into receivership and was
liquidated by August 1992. Soon after, several weak banks were either strongly
encouraged to merge with other banks, or forced into bankruptcy. From August 1992 to
the end of 1995, action was taken by the NBP (i.e., decrees were issued) on 14 private
commercial banks. Twenty other weak banks were merged with stronger banks with the

11
aid of NBP, but without official action.
After several cooperative bank failures, the NBP formulated its own deposit
insurance policy in the middle of 1992. All deposit accounts were to be fully covered up to
1000 ECU ($1,300 US) and 90% for the next 2000 ECU. This regulation, however, was
not officially announced to the banks or the public. Rather, NBP intended to slowly reveal
its policy to the public as banks failed. Since NBP did not have the authority to charge
banks a deposit insurance premium, a policy of not clearly revealing the existence and
conditions of coverage may have mitigated moral hazard behavior by banks by
encouraging depositor monitoring. At the same time, this policy may have averted a panic
by giving some assurance that NBP would provide funds in the event of a systemic failure.
At the end of 1993 the Parliament passed a resolution, which was then included in NBP’s
annual guidelines, compelling NBP to provide their previously implicit coverage for 1994.
Publicity for this resolution, however, was not extensive. Many newspaper articles
continued to write about the full guarantee for state banks and the lack of insurance for
private banks.
An implicit guarantee may not have existed in the minds of the public. The cost of
these bank failures to the NBP was relatively small. For example, the NBP made payments
to depositors in only two out of 14 closures: one to a cooperative bank in June 1992 (for
which NBP was reimbursed from the government budget) and the second to Bank
Posnania in August 1995 (for a failure by the bank in January 1995 – one month before
the formal deposit insurance took effect). The NBP did, however, arrange the merger or
buyout of several weak banks. These actions may have improved the solvency of the
12
banking system while retaining a role for private depositor monitoring.
During this volatile period, depositors had some ability to monitor bank risk.
Although disclosure laws only required publicly traded banks to provide information on
their performance, depositors had other information sources. Popular newspapers (e.g.,
Rzeczpospolita and Nowa Europa), bank specialty newspapers (e.g., Gazeta Bankowa),
and specialty magazines (e.g., Bank) reported measures of bank performance and bank
risk (including various balance sheet and income statement items). Since it may have been
to a bank=s short-term advantage to disseminate information that enhanced depositor
confidence even when the information may not be accurate, many publications only
printed survey data certified by legitimate international auditors. Although this information
may not have always been relevant in assessing solvency risk, depositors had some means
of monitoring bank risk.
After years of debate in the Parliament, a bill establishing formal deposit insurance
was passed in December 1994 and became law at the end of February 1995. This law
established the Bank Guarantee Fund (Bank Fundusz Gwarancyjny, BFG). The BFG was
to assist in bank supervision (after a bank’s failure), and to administer two funds: (1) the
Deposit Protection Fund B which reimburses depositors of failed banks; and (2) the Bank
Assistance Fund B which provides financial assistance in the assumption of troubled banks
by healthy ones.
The Deposit Protection Fund provides for full coverage of all deposit accounts at
PKO-BP, Pekao SA, and BGZ.8 In 1996, these banks paid premiums of 0.20% (0.12%
for 1997) of total deposits. Full coverage is scheduled to terminate at the end of 1999.
13
Premiums for all other banks were 0.40% in 1996 (0.18% for 1997) of total deposits.
Deposit premium rates are adjusted annually based on the estimated needs of the fund for
the coming year. Annual premiums are not paid to the Deposit Protection Fund, but are
held by banks in a special deposit account collateralized by Treasury bills. Banks are
assessed ex post for the cost of compensating depositors of failed banks. The Deposit
Protection Fund initially provided coverage up to 3000 ECU (100% of the first 1000 ECU
and 90% of next 2000 ECU) for state-owned, private Polish, and foreign banks (other
than the fully guaranteed banks).9
From 1995 to early 1997, the Deposit Protection Fund spent $51.4 million
covering the deposits (only to the limits specified in the deposit insurance law) of 124
failed cooperative banks and 4 commercial banks. On average, depositors lost 8% of their
deposits and waited 125.2 days for the final payment of their funds.10
The Bank Assistance Fund, however, is financed by ex ante assessments of
commercial banks. The premiums are 0.20 percent of total risk weighted assets
(computed as set forth by the Basle Accord) for the three largest banks and 0.40 percent
for other banks. The choice of basing premiums on risk-weighted assets instead of
deposits was designed to reduce the problem of mispricing deposit insurance by using
fixed-rate deposit premiums. However, it does not eliminate the problem since
undercapitalized banks with large Treasury security portfolios might pay less for deposit
insurance than a well-capitalized bank with a healthy loan portfolio. Unlike the premiums
paid for the Deposit Protection Fund, these premiums are paid directly to the Bank
Assistance Fund.

14
The Bank Assistance Fund collected $150.7 million in the 1995-1996 period and
made loans of $45.5 million for nine restructuring projects. These loans were for
acquisitions of 5 commercial banks and 1 cooperative bank, and for the self-recovery of 1
commercial bank and 2 cooperatives. They are ten year loans during which only the
interest is paid for the first 5 years.
The establishment of formal deposit insurance lowers the incentive for monitoring
by depositors and potentially increases moral hazard incentives for bank risk-taking. Given
the high risk associated with the economic transition and the lack of strong government
supervision to contain this moral hazard problem, these incentives could lead to adverse
consequences for the banking system, the state budget, and the overall economy. Since the
explicit level of full coverage was only 1000 ECU per depositor before 1997, the risk
exposure to the BFG is relatively modest. In addition, the 10 percent of deposits that
were not covered for deposit balances above 1000 ECU and below 3000 ECU (prior to
July 1997) meant that these depositors had an incentive to monitor. The time delay in
paying off depositors also provided a monitoring incentive. Since coverage is per
depositor per bank, depositors are encouraged to spread their deposits over several banks
for maximum coverage. For firms, though, spreading balances across banks to increase
coverage can be particularly costly. Insurance, however, did not cover multi-factory firms
that may find it cost effective to bank at branches of a single institution.11 This means that
the deposits of firms at partially insured banks are at greater risk than deposits of
households. Thus, firms have a greater incentive to monitor bank risk-taking.
Alternatively, they will have a greater incentive to bank at one of the three large state

15
banks possessing a full guarantee.
The more serious moral hazard problem is the differential treatment of the three
large state-owned banks vis-a-vis the other banks. These three banks receive a full state
guarantee yet their premium is approximately one-half the rate other banks pay.
Depositors have no incentive to monitor the behavior of the three fully covered banks,
giving them a competitive advantage over other banks in the deposit market.
3. Data and Methodology
Since we are interested in examining the implications of the change in the deposit
insurance system, our quarterly sample ranges from 1992:1-1996:4. This includes 11
quarters before the passage of formal deposit insurance and 9 quarters after. The starting
point of the first period was chosen due to the unavailability of data in previous periods.
Since the Polish Parliament passed formal deposit insurance legislation in December 1994,
the third quarter of 1994 was chosen as the break point between sample periods even
though the law did not take effect until February 1995. Since several mergers and
privatizations took place in 1997, the sample period was ended in 1996:4. The number of
banks in the sample changes due to bank entry and exit, but averages 58 banks per quarter
over the sample period. The sample consists of 18 state-owned banks (3 of which had the
full deposit guarantee for the entire period), 7 foreign banks, and 55 private Polish
banks.13 This includes complete data on 80 out of approximately 110 commercial banks
that did or still exist, representing a mean value of about 90 percent of total assets.
The dependent variable (the spread) is calculated as the difference between the six
month deposit rate and the six month Treasury bill rate. Since reserve requirements are a
16
cost of raising deposits that are built into deposit rates, these rates are adjusted for reserve
requirements changes. The six month deposit rates for each bank were obtained from
various issues of Gazeta Bankowa. The six month yield on T-bills and the reserve ratio on
time deposits were taken from various issues of the NBP Information Bulletin. Data
for all bank-specific explanatory variables were obtained from the NBP and from various
issues of Biuletyn Statystyczny (Statistical Bulletin) from GUS (The Main Statistical
Office).
We model deposit market discipline by assuming a perfectly competitive market
for a homogeneous time deposit, as in Hannan and Hanweck (1988). Any differences in
deposit rates between banks will reflect the quality of the deposit as determined by the
probability of depositor payback. Differences in rates across banks are then due to
differences in bank-specific solvency risk. We directly estimate the relationship between
the deposit rate/T-bill rate spread and measures of bank-specific solvency risk. We include
the following bank-specific explanatory variables in our analysis:
• Capital-Asset Ratio. We use the ratio of Tier 1 plus Tier 2 capital to total assets. The
risk premium should be inversely related to this ratio.
• Asset Growth. It has been argued that the rapid growth of Polish bank deposits has
been partly due to rapid loan expansion. The deposit rate offered by banks should be
positively related to the growth of assets. For poorly capitalized banks, asset growth
may reflect an attempt by banks to exploit the moral hazard incentive for greater risk-
taking. Banks should be willing to pay higher rates to gamble for resurrection because
they would keep the gains if they are successful and creditors (including the
17
government) would absorb the losses if the bank fails. For well-capitalized banks
wishing to expand rapidly, they may have had to pay higher rates to secure funds to
support their expansion, especially if the demand for deposits at an individual bank is
interest inelastic. Thus, the deposit rates of aggressive, well-capitalized banks may be
positively related to the capital-asset ratio as well as to asset growth.
• Loan-Asset Ratio. In trying to understand the determinants of bank failure, credit risk
plays an important role. Credit risk can be measured using the loan-asset ratio.
Assuming that the credit risk associated with a zloty of loans is constant across all
banks, the greater fraction of loans to assets the greater the credit risk at any bank.
Thus, a positive relationship should exist between the deposit rate spread and the loan-
asset ratio.
• Regional Risk. The loan-to-asset ratio assumes that a zloty of loans at one bank is as
risky as a zloty at any other bank. The Polish loan market has been a credit risk
roulette wheel for banks, due to the overall restructuring of the economy. This credit
risk has had a differential effect on individual banks because of differing economic
performance among various industries and regions. The potential for regional variation
in bank risk is especially relevant in the Polish banking system where individual banks
have assets concentrated heavily in particular industries or regions. As a proxy for this
regional risk we use the unemployment rate in the county where the bank is based.
Higher unemployment rates imply greater risk and thus should be positively correlated
with deposit rates.
• Size. Other things equal, larger banks may be better able to diversify their asset

18
portfolios than smaller banks, potentially leading to lower risk. Larger banks may
have greater name recognition with potential depositors, making it relatively easier to
attract new funds. Polish regulatory policy also favors larger banks. The initial full
guarantee to all state banks and the later full guarantee to three of the largest gave the
largest banks an advantage in raising funds. In addition, some regional Polish banks
may be considered too large to fail. All of these arguments would suggest a negative
relationship between bank size and deposit rates.
• Business Deposits. The relationship between deposit rates and other bank-specific
variables may also be affected by the degree of monitoring by partially insured
depositors. Providing a ceiling on deposit insurance coverage means that small
accounts are fully insured while large accounts are not. Partially covered depositors
have stronger incentives to engage in monitoring. The ratio of the value of partially
insured deposits to total deposits could proxy for the degree of monitoring. Since it is
more likely that the deposits of businesses would exceed the insurance limit than
deposits of households, we use the ratio of business deposits to total deposits as a
proxy for the degree of private sector monitoring. As the degree of monitoring
increases, we expect deposit rates to be more strongly related to bank-specific
measures of risk. Monitoring can take two forms: depositors could demand higher
rates from weaker banks in compensation for greater risk bearing or depositors could
move their funds to safer banks (e.g. if rates are a minor consideration). If the latter
were true, we would observe a negative relationship between the business deposit ratio
and the deposit spread. This relationship would be stronger if this ratio also acts as an

19
indicator of bank safety for household depositors.
The relationships between the deposit rate/T-bill rate spread and the bank-specific
explanatory variables mentioned above can be expressed in the following equation,
1(1) SPREADit = "t(DUMTt)+$k(DUMk)+$1(SIZE it)+$2(KAS it)+
$3(GROWTH it)+$4(LNASit)+$5(UNEMit)+$6(BUSDEPit)+, it
where the SPREAD is the difference between the deposit rate for the ith bank and the T-bill
rate of comparable maturity adjusted by the reserve requirement ratio. SIZE is measured
by the logarithm of total assets; KAS is the ratio of tier 1 plus tier 2 capital to total assets;
GROWTH is the percentage change in total assets between quarters; LNAS is the ratio of
loans to assets; UNEM is the regional unemployment rate; and BUSDEP is the ratio of
business to total deposits. Balance sheet variables are measured end of period. Table 4
contains sample means of balance sheet ratios of three groups of banks examined in the
study. We hypothesize that $1, $2 and $6 should be less than zero while $3, $4 and $5
should be greater than zero.13
Time dummies were included in each period to control for the effects of
macroeconomic and other variables that do not vary cross-sectionally. What remains are
the cross-sectional differences between banks and bank groups. DUMk is a dummy
variable for the kth bank group, k = “2 fully guaranteed banks,” “14 other state-owned
banks,” “7 foreign banks,” “2 state-owned negatively capitalized banks,” and all other
banks.” The it subscript refers to the ith bank for the tth quarter.
This regression model is used to examine four questions. First, did market
discipline exist, that is, did the above bank-specific factors significantly explain bank
deposit rates? Second, did the degree of market discipline change significantly between the
pre-insurance and post-insurance periods, that is, does the magnitude and significance of
the bank-specific factors decrease in the post-insurance period? Third, while controlling

2for bank-specific and time effects, did the three state-owned banks with a full guarantee
pay significantly lower deposit rates than private banks? Fourth, controlling for bank-
specific and time effects, did the other state-owned banks pay significantly lower rates
than the private banks in the pre-insurance period and in the post-insurance period when
they had the same de jure coverage as private banks?
4. Estimation and Results
The model is estimated from a pooled cross-sectional time series for two time
periods: 1992:1-1994:3 and 1994:4-1996:4. Equation (1) was estimated by generalized
least squares for the two periods coinciding with the two deposit insurance regimes (full
coverage for state-owned banks and no coverage for private banks in the first period and
partial coverage for both groups with full coverage for the three largest state-owned banks
in the latter period). Because depositors are more likely to scrutinize the economic
behavior of banks with low capital than well-capitalized banks, we decided to divide the
sample into two groups based on the mean capital-asset ratio. A capital-asset ratio of 12
percent was used as the dividing point for two reasons. First, Polish banking regulations
stipulate that de novo banks must maintain a 12 percent capital-asset ratio for the first year
of operations. Second, this threshold separated the sample almost in half. We would
expect bank-specific variables to be more significantly related to deposit rates for the low
capital group. A Chow test was performed to test the joint hypothesis that coefficient
estimates between the low and high capital bank groups were equal. The hypothesis was
rejected at the one percent level in both periods, thereby providing statistical support for
dividing the sample in this way.
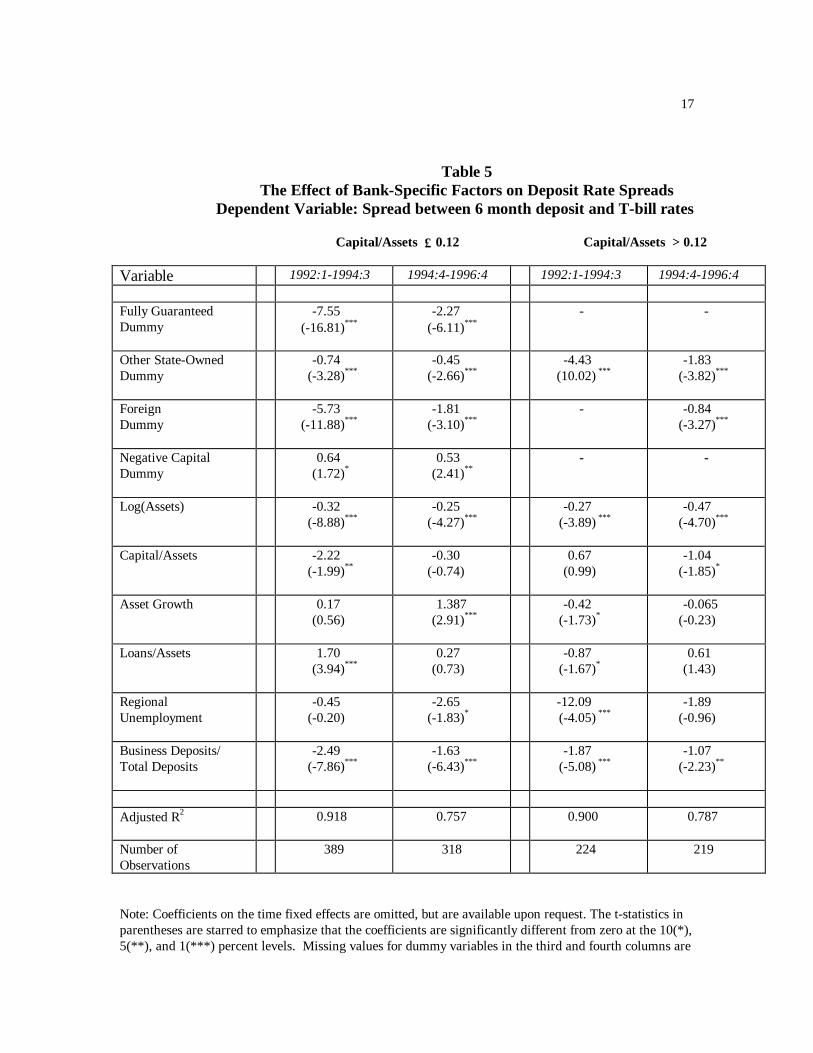
The coefficient estimates for the two capital-asset groups during both periods

3appear in Table 5 using the six-month rate spread as the dependent variable. This variable
was chosen because the majority of Polish time deposits appear to have a term to maturity
close to six months. The coefficient estimates for the fully guaranteed bank dummy
variable show that in both periods, controlling for bank-specific effects, the fully
guaranteed banks paid significantly lower deposit rates than either private banks or other
state-owned banks. The coefficient becomes less negative in the post-insurance period,
when private banks had partial coverage, but the coefficient is still significant at the one
percent level. The coefficients on the other state-owned bank dummy are significantly less
negative than those of the three large state banks in the first period, even though both
groups had a full de jure guarantee. In the second period when the other state-owned and
private banks had the same de jure guarantee, the coefficient estimate for other state-
owned banks with low capital was still significantly negative. This highlights the possibility
that a more comprehensive de facto guarantee may have existed, and may still exist, for
these banks. A foreign bank dummy was added to allow better separation of state-owned
and private banks. Though foreign banks are private, they may have an advantage because
they may be perceived as providing better service or greater safety relative to Polish
banks. They may therefore be able to pay lower rates. The coefficient on this dummy
variable is negative, as expected, and significant in both periods, though it becomes less
negative in the second period. This may indicate that the advantage enjoyed by foreign
banks is diminishing.
The results for the other explanatory variables, by and large, are consistent with
our hypotheses. The coefficient on asset size is negative and significant in both periods.
The coefficient on the capital-asset ratio is negative and significant in the first period, but

4becomes small and insignificant in the second period, which is consistent with less
monitoring after formal deposit insurance was enacted. Asset growth has the expected
positive sign and is significant in both periods. The loan-asset ratio is positive and
significant in the early period, but is insignificant in the post-insurance period. Regional
unemployment is surprisingly negative and significant for well-capitalized banks in the
latter period. This may reflect more aggressive deposit gathering behavior by banks in
counties with low unemployment rates as they try to meet growing loan demand. The
coefficient on business deposits is negative and significant in both periods but declines in
magnitude in the second period. This is consistent with the view that banks with larger
amounts of business deposits are more closely monitored by businesses and are safer, and
that monitoring diminishes when more comprehensive deposit guarantees exists.
Table 5 also reports the results for the well-capitalized banks. Not surprisingly, the
results are mixed. The capital-asset ratio, the loan-asset ratio, and the unemployment rate
are insignificant in the pre-insurance period. In the latter period, the capital-asset ratio is
significant at the 10 percent level, but asset growth, the loan-asset ratio, and
unemployment are insignificant. Asset size and the business-deposit ratio both have the
expected signs and are significant in both periods.
In general, the coefficients on bank-specific variables are of the correct sign and
significant in the pre-insurance period, but are of smaller magnitude and/or insignificant in
the post-insurance period. The joint hypothesis that coefficient estimates for the low
capital group were equal in both periods was rejected at the one percent level, and the
same is true of the high capital group. The adjusted R2 indicates that the explanatory
power of the variables in the pre-insurance period is greater than in the second period. The
5decreasing explanatory power and decreasing significance of most variables in the second
period may be explained by the introduction of deposit insurance, but it may also be due to
other factors such as increasing competition or improved economic performance.
5. Conclusions
This paper examines the behavior of Polish depositors and banks from 1992 to
1996. Given an absence of strong bank regulation and supervision and in the presence of
a bifurcated deposit insurance regime, this paper examines the degree of the market
discipline that depositors impose on banks. We conclude that in the period before explicit
deposit insurance was the law of the land, depositors exacted a price for risk. However, in
the post-insurance period, risk factors are either insignificant and/or decrease in absolute
value for the less capitalized banks. A second finding is that the fully guaranteed banks
paid significantly lower deposit rates than private or other state-owned banks, even when
controlling for other bank-specific factors. These three large state-owned banks continue
to dominate the banking system, controlling almost half of total deposits as of the end of
1997, and they are among the least capitalized Polish banks. Current deposit insurance
regulations give them more generous coverage at a lower cost than other banks, resulting
in cross-subsidization. Thus, regulatory policy has removed the use of market discipline
as a check on these banks= behavior. They have little market incentive to improve
efficiency and capital adequacy due to the full guarantee. Although this differential
treatment is scheduled to end in 1999, until that time, well-capitalized private and state-
owned banks will remain at a competitive disadvantage, raising their cost of funds and
reducing their profitability.14 Third, the deposit rates of well-capitalized banks are not as

6responsive to changes in risk factors. Fourth, the business-deposit ratio appears to serve
relatively well as a proxy for greater monitoring. The estimated coefficients on this
variable tend to be large and significant in the pre- and post-insurance periods, indicating
that relatively small deposit insurance coverage for businesses gives them greater incentive
to monitor. This result is important given that the deposit insurance coverage has recently
increased for multi-plant firms. Fifth, even though other state-owned banks have the same
de jure partial guarantee as the private banks in the post-insurance period, those in the low
capital group pay significantly lower deposit rates after controlling for bank-specific
factors. Hence, they may be viewed as having more comprehensive de facto coverage.
This has important implications for state owned banking systems (or systems to be
nationalized) that limit de jure coverage in an attempt to promote market discipline and
prevent moral hazard.
Because certain state-owned banks receive a broader insurance guarantee relative
to other banks, our results illustrate how this differential treatment can affect a bank’s cost
of funds. If banks receiving a full guarantee can attract funds at lower rates, they will have
a competitive advantage over other banks. Given that these banks are also often the ones
that need the most restructuring, the current system in Poland may be reducing economic
incentives to modernize these banks= operations in preparation for the opening of Polish
banking to foreign competition in 1999.
We believe that our empirical results demonstrate that private monitoring of banks
can complement monitoring by bank regulators even in a country with a less sophisticated
financial system; thus, opportunities for private monitoring should be included when
designing deposit insurance systems. In fact, given that the supervisory capabilities of

7bank regulators may be lower in developing countries due to a lack of resources and
skilled personnel, the benefits of private monitoring may be even greater than in a
developed economy.
81. See Mondschean and Opiela (1997) for a survey of banking system reform in Poland.
2. For a detailed discussion of the reform of the NBP, see Ugolini (1996).
3. Deposit rates have been used by many researchers to measure the degree of market
discipline imposed on banks. Examples include Baer and Brewer (1986), Hannan and
Hanweck (1988), Ellis and Flannery (1992), and for Chile, Davies and Robitaille (1997).
4. In 1989, the commercial lending arm of the National Bank of Poland was separated
from the central bank. It was then divided into nine regional banks located in major Polish
cities. For more information, see Mondschean and Opiela (1997). Bank Handlowy,
founded in 1870, is the nation’s leading corporate bank. BRE is primarily engaged in
financing international transactions. PBR acts as a wholesale bank, lending money to
other banks from its own resources as well as from foreign credit lines. Kredyt Bank PBI
was not part of the original nine carved out of NBP in 1989, but has grown rapidly due to
several acquisitions.
5. A discussion of Poland’s exchange rate policy during the first few years of transition
can be found in Otker (1994).
6. See World Bank (1996).
7. Private banks might have formed a co-insurance system (similar to U.S. state-
chartered banks in the late 1800s and early 1900s), but the adverse selection problem
associated with lax entry requirements, underdeveloped laws on collateral, lack of audited
information on banks, and the risky environment associated with the transition created a
climate too risky for co-monitoring. For more historical information on co-insurance
schemes for deposit insurance in the United States, see Calomiris (1990).
8. The other three banks in the Group Pekao holding company are not explicitly included

9in the full guarantee given to Pekao SA. Since the merger did not take place before the
end of our sample period, these banks are classified as “other state-owned banks.”
9. This coverage increased from 3,000 ECU to 4,000 ECU on July 1, 1997, and to 5,000
ECU as of January 1, 1998. It is scheduled to increase to 7,000 ECU in January 1999 and
the goal is for coverage to eventually increase to 25,000 ECU to meet EU standards.
Currently, cooperative banks are also covered by the Depositor Protection Fund. When
the cooperatives are reorganized, they will have a separate fund financed by the
cooperatives alone.
10. Each zloty amount was converted using the average daily exchange rate during
December 1995 and 1996.
11. This facet of the law has been altered. As of July 1, 1997 each branch of multi-plant
firms and non-profit organizations will enjoy the same coverage as individual accounts.
We develop the implications of this change in coverage in Sections 3 and 4.
12. Many foreign banks are excluded since deposit rate data were not available. Some of
the private banks are partially owned by local governmental bodies, state-owned
enterprises, or cooperatives.
13. As argued above, $2 may be > 0 for highly capitalized banks that are growth oriented.
14. Opiela (1998) provides evidence that this full guarantee gives these three banks an
advantage in raising time deposits. This allows them to continue expanding loans during
periods of contractionary monetary policy.

10References
Baer, Herbert and Elijah Brewer III, (1986), “The Effect of Bank Risk on the Price andAvailability of Uninsured Deposits,” Proceedings from a Conference on BankStructure and Competition, Federal Reserve Bank of Chicago, pp. 88-103.
Baka, Wladyslaw, (1998), “Gwarancje Depozytow – w Kierunku Poprawy PozyciKonkurencynej Polskich Bankow,”(Guarantee of Deposits – in the Direction ofImproving the Competitive Position of Polish Banks), Prawo Bankowe (BankingLaw), No. 4 (20), pp. 45-49.
Bank Guarantee Fund, (1996), Biuletyny (Bulletins).
Bank Guarantee Fund, (1996), Cele i Dzialalnosc (Purpose and Activities), April.
Calomiris, Charles W., (1990), AIs Deposit Insurance Necessary? A Historical Perspective, The Journal of Economic History, June, pp. 283-96.
Calomiris, Charles W., (1992), ADo Vulnerable Economies Need Deposit Insurance?” inIf Texas Were Chile, A Primer on Banking Reform, ed. Philip L. Brock, SequoiaInstitute, San Francisco, pp. 237-314.
Davies, Sally, and Patrice Robitaille, (1997), “Market Discipline and Bank Certificates ofDeposit: Evidence from Chile,” draft.
Ellis, David M. and Mark J. Flannery (1992), “Does the Debt Market Assess LargeBanks’ Risk? Time Series Evidence from Money Center CDs,” Journal ofMonetary Economics, 30:481-502.
Flannery, Mark J., (1998), “Using Market Information in Prudential Bank Supervision: AReview of the U.S. Empirical Evidence,” Journal of Money, Credit and Banking,Vol. 30, No. 3, pp.273-305.
Glowny Urzad Statystyczny, Biuletyn Statysticzny, various issues.
Gorniak, Jaroslow, (1995), AUse of Banking Services In Polish Households - A Survey,”in Competitive Banking in Central and Eastern Europe, Ewa Miklaszewska, ed., (Krakow, Poland: Jagiellonian University Press) pp. 87-96.
Hannan, Timothy H., and Gerald A. Hanweck, (1988), “Bank Insolvency Risk and theMarket for Large Certificates of Deposit,” Journal of Money, Credit and Banking,pp.203-211.

11Jerschina, Jan, (1998), “Usage of Banking Services in 12 Central and East European
Countries in 1997,” in Ewa Miklaszewska, ed., Global Tendencies and Changesin East European Banking, (Krakow, Poland: Jagiellonian University PrintingHouse), pp. 70-79.
Mondschean, Thomas S., and Timothy P. Opiela, (1997), ABanking System Reform in aTransition Economy: The Case of Poland,” Economic Perspectives, FederalReserve Bank of Chicago, pp. 16-32.
National Bank of Poland, (1990-96), Information Bulletins.
Opiela, Timothy P., (1998), “The Bank Lending Channel in Poland: The Effect ofDeposit Guarantees and Balance Sheet Structure,” draft.
Otker Inci., (1994), “Exchange Rate Policy,” in Ebrill, L., et al., Poland: The Path to aMarket Economy, IMF Occasional Paper #113, October, pp. 43-55.
World Bank, (1996), 1996 World Development Report: From Plan to Market.
Wyczanski, Pawel, and Marta Golajewska, (1996), Polski System Bankowy 1990-95,Friedrich Ebert, Warsaw.

12
Table 1
Structure and Ownership of the Polish Banking Industry
Total Percent of Percent ofBank Deposits Total Banking State
(mln. PLN) System OwnershipFully Guaranteed Banks
Powszechna Kasa Oszczednosci - 37,445.0 25.7 100.0 Bank Panstwowy (PKO-BP)Bank Gospodarki Zywnosciowej (BGZ) 8,200.6 5.6 100.0Polska Kasa Opieki SA (Pekao-SA) 21,822.9 15.0 100.0
Total for Fully Guaranteed Banks 67,468.5 46.4 100.0
Other Group Pekao Banks
Powszechny Bank Gospodarczy (PBG) 2,887.0 2.0 100.0Bank Depozytowo-Kredytowy (BDK) 3,146.6 2.2 100.0Pomorski Bank Kredytowy (PBK-S) 3,095.6 2.1 100.0
Other Large Polish Banks
Bank Slaski (BS) 6,081.3 4.2 5.0Bank Przemyslowo-Handlowy (BPH) 5,591.7 3.8 46.7Powszechny Bank Kredytowy (PBK) 5,756.9 4.0 53.3*Bank Handlowy (BH) 4,960.7 3.4 7.9Kredyt Bank PBI 4,710.3 3.2 10.6*Wielkopolski Bank Kredytowy (WBK) 4,487.0 3.1 5.1Bank Zachodni (BZ) 4,051.3 2.8 100.0BIG Bank Gdanski (BG) 3,960.7 2.7 6.0*Bank Rozwoju Eksportu (BRE) 3,249.9 2.2 0BIG Bank 1,186.7 0.8 6.0*Polski Bank Rozwoju (PBR) 266.4 0.2 29.5
Other Banks 24,618.1 16.9
Total System Deposits 145,518.7 100.0
*Includes shares held by state-owned insurance companies. All data are as of December 31, 1997

13Source: National Bank of Poland.

14
Table 2
Real Deposit Growth at Polish Commercial Banks--1991-1997(Percent)
Category 1991-1994 1994-1997
Total Deposits 28.21 34.00
Zloty Denominated Deposits
Total 19.50 59.65
Demand Deposits 12.59 24.07 Corporate 6.76 -11.78 Personal 38.74 147.75
Time Deposits 24.31 82.10 Corporate 27.71 23.38 Personal 22.90 107.62
Foreign Currency Deposits
Total 49.44 -15.99
Demand Deposits 52.00 -15.25 Corporate -8.58 195.09 Personal 59.33 -29.85
Time Deposits 48.15 -16.37 Corporate 134.24 144.13 Personal 45.62 -23.96
Source: National Bank of Poland Information Bulletins (1992-1997). All data are measured at the end of each year.

15
Table 3
Zloty Time Deposits of Households by Maturity(Percent of Total at End of Each Year)
Maturity 1992 1993 1994 1995 1996 1997
< 1month 0.34 0.59 0.12 2.70 4.21 5.94
1-6 months 65.94 56.38 55.42 57.74 57.95 57.17
6-12 months 23.98 33.72 35.99 33.6 32.82 32.99
1-2 years 2.90 2.83 2.82 2.39 1.97 1.18
Over 2 years 6.84 6.47 5.65 3.57 3.05 2.72
Source: National Bank of Poland.

16 Table 4
Balance Sheet Ratios by Bank Group
Fully GuaranteedState-Owned
OtherState-Owned Private
Number of Banks in Sample 3 15 62
Percent of Total System Assets 37.8 43.5 7.3
% of Sample Assets 42.7 49.1 8.3
Securities/Total Assets (%) 28.4 22.4 18.5
Loans/Total Assets (%) 32.1 35.5 47.1
Total Deposits/Total Assets (%) 64.0 41.5 44.0
Demand Deposits/Total Assets (%) 20.3 14.6 9.7
Time Deposits/Total Assets (%) 43.7 27.2 34.5
Zloty Deposits/Total Assets (%) 40.3 30.2 36.6
Zloty Dem. Deposits/Total Assets (%) 12.3 11.1 8.8
Zloty Time Deposits/Total Assets (%) 27.9 19.2 28.0
FC Deposits/Total Assets (%)** 23.7 11.5 8.1
FC Demand Deposits/Total Assets (%) 8.0 3.5 1.1
FC Time Deposits/Total Assets (%) 15.7 8.0 7.0
Business Deposits/Total Assets (%) 9.0 17.2 23.5
Capital/Total Assets (%) 1.9 7.1 11.1
* Mean values within each group** Foreign Currency (FC)
Source: Computed from data from the National Bank of Poland.
17
Table 5The Effect of Bank-Specific Factors on Deposit Rate Spreads
Dependent Variable: Spread between 6 month deposit and T-bill rates
Capital/Assets ≤ 0.12 Capital/Assets > 0.12
Variable 1992:1-1994:3 1994:4-1996:4 1992:1-1994:3 1994:4-1996:4
Fully GuaranteedDummy
-7.55(-16.81)***
-2.27(-6.11)***
- -
Other State-OwnedDummy
-0.74(-3.28)***
-0.45(-2.66)***
-4.43(10.02) ***
-1.83(-3.82)***
ForeignDummy
-5.73(-11.88)***
-1.81(-3.10)***
- -0.84(-3.27)***
Negative CapitalDummy
0.64(1.72)*
0.53(2.41)**
- -
Log(Assets) -0.32(-8.88)***
-0.25(-4.27)***
-0.27(-3.89) ***
-0.47(-4.70)***
Capital/Assets -2.22(-1.99)**
-0.30(-0.74)
0.67(0.99)
-1.04(-1.85)*
Asset Growth 0.17(0.56)
1.387(2.91)***
-0.42(-1.73)*
-0.065(-0.23)
Loans/Assets 1.70(3.94)***
0.27(0.73)
-0.87(-1.67)*
0.61(1.43)
RegionalUnemployment
-0.45(-0.20)
-2.65(-1.83)*
-12.09(-4.05) ***
-1.89(-0.96)
Business Deposits/Total Deposits
-2.49(-7.86)***
-1.63(-6.43)***
-1.87(-5.08) ***
-1.07(-2.23)**
Adjusted R2 0.918 0.757 0.900 0.787
Number ofObservations
389 318 224 219
Note: Coefficients on the time fixed effects are omitted, but are available upon request. The t-statistics inparentheses are starred to emphasize that the coefficients are significantly different from zero at the 10(*),5(**), and 1(***) percent levels. Missing values for dummy variables in the third and fourth columns are
18
because no banks falling into those categories had capital ratios above 12 percent during the sampleperiod.
Source: National Bank of Poland, Information Bulletins, various issues.
Figure 1ASelected Three-Month Interest Rates
Loan rate
Deposit rate
T-bill rate
1994 1995 199619931992 1997
Source: National Bank of Poland, Information Bulletins, various issues.
Figure 1BSelected Three-Month Interest Rate Spreads
0%
2%
4%
6%
8%
10%
12%
14%
16%
1993 1994 1995 1996
Loan rate -Deposit rate
T-bill rate-Deposit rate
1992
Note: The deposit levels were deflated by the CPI (Dec. 1991=1.0).Source: National Bank of Poland, Information Bulletins, various issues.
Figure 2Zloty vs. Foreign Currency Deposits
(Adjusted for Inflation)
0
5000
10000
15000
20000
25000
30000Millions of Zloty
1992 1993 1994 1995 1996
Deposit InsuranceLaw Passed
Zloty deposits
Foreign currency deposits
||||||||||||||||
____

1