bank risk-taking, securitization, supervision, and low interest rates: evidence from lending
TRANSCRIPT
Bank Risk-Taking, Securitization, Supervision, and Low Interest Rates:
Evidence from Lending Standards
Angela Maddaloni and José-Luis Peydró*
September 2009
Abstract
We analyze the root causes of the current crisis by studying the determinants of bank lending standards in the Euro Area using the answers from the confidential Bank Lending Survey, where national central banks request quarterly information on the lending standards banks apply to customers. We find that low short-term interest rates soften lending standards for both businesses and households and, by exploiting cross-country variation of Taylor-rule implied rates, that rates too low for too long soften standards even further. The softening is over and above the improvement of borrowers’ creditworthiness and all the relevant lending standards are softened, thus implying that banks’ appetite for (loan) risk increases. In addition, high securitization activity and weak banking supervision standards amplify the positive impact of low short-term interest rates on bank risk-taking, even when we instrument securitization. Moreover, short-term rates – directly and in conjunction with securitization activity and supervision standards – have a stronger impact on bank risk-taking than long-term interest rates. These results help shed light on the origins of the current crisis and have important policy implications.
* The authors are at the European Central Bank, Kaiserstrasse 29, D-60311 Frankfurt am Main, Germany. Contact information: [email protected], and [email protected] / [email protected]. Lieven Baert and Francesca Fabbri provided excellent research assistance. We thank Tobias Adrian, Franklin Allen, Gianluigi Ferrucci, Steven Ongena, Catherine Samolyk, Michael Woodford and the participants in the RFS-Yale Conference on The Financial Crisis for very useful comments and suggestions. Any views expressed are only those of the authors and should not be attributed to the European Central Bank or the Eurosystem.
“One (error) was that monetary policy around the world was too loose too long. And that created this just huge boom in asset prices, money chasing risk. People trying to get a higher return. That was just overwhelmingly powerful... We all bear a responsibility for that”… “The supervisory system was just way behind the curve. You had huge pockets of risk built up outside the regulatory framework and not enough effort to try to contain that. But even in the core of the system, banks got to be too big and overleveraged. Now again, here’s an important contrast. Banks in the United States, even with investment banks now banks, bank assets are about one times GDP of the United States. In many other mature countries - in Europe, for example – they’re a multiple of that. So again, around the world, banks got to just be too big, took on too much risk relative to the size of their economies.”
Timothy Geithner, United States Secretary of the Treasury, “Charlie Rose Show” on PBS, May 2009
“The ‘global savings glut’ led to very low returns on safer long-term investments which, in turn, led many investors to seek higher returns at the expense of greater risk… (Monetary policy) interest rates were low by historical standards. And some said that policy was therefore not sufficiently geared towards heading off the risks. Some countries did raise interest rates to ‘lean against the wind’. But on the whole, the prevailing view was that monetary policy was best used to prevent inflation and not to control wider imbalances in the economy.”
Letter to Her Majesty The Queen by Timothy Besley and Peter Hennessy, British Academy, July 2009
I. Introduction
The current financial crisis has had a dramatic impact on the banking sector of
most developed countries, it has severely impaired the functioning of interbank
markets, and it may have triggered an economic crisis in these same countries.
What are the causes of this crisis? In answering this question, Acharya and
Richardson (2009), Allen and Carletti (2009), and Diamond and Rajan (2009a)
distinguish between proximate and root (or fundamental) causes.2 The following key
elements were mentioned as root causes of an excessive softening of lending
standards: too low levels of short- and/or long-term (risk-less) interest rates, a
concurrent widespread use of financial innovation resulting in high securitisation
activity and weak banking supervision standards.3 Therefore, the crisis that started in
2 Emilio Botín, Chairman of Bank Santander, summarizes very well the distinction: “I believe the causes cannot be found in any one market, such as the US. Nor are they limited to a particular business, such as subprime mortgages. These triggered the crisis, but they did not cause it. The causes are the same as in any previous financial crisis: excesses and losing the plot in an extraordinarily favourable environment. Indeed, some fundamental realities of banking were forgotten: cycles exist; lending cannot grow indefinitely; liquidity is not always abundant and cheap; financial innovation involves risk that cannot be ignored” (Financial Times, October 2008).
3 See for example Allen (2009), Besley and Hennessy (2009), Blanchard (2009), Brunnemeier (2009), Calomiris (2008), Engel (2009), Rajan (2009), Taylor (2007 and 2008), and numerous articles since summer 2007 in The Financial Times, The Wall Street Journal, and The Economist. Nominal monetary policy rates were the lowest in almost four decades and below rates implied by a Taylor rule in many countries, while real policy rates were negative (Taylor, 2008; and Ahrend, Cournède and Price, 2008).
2
the subprime mortgage market in the US may have been the manifestation of deep
rooted problems, which were not peculiar to one financial instrument and/or country
but were present globally, albeit to different degrees. Moreover, these root causes may
have been interrelated and mutually amplifying in affecting the risk-taking of
financial institutions (Rajan, 2005). In this paper, we test these hypotheses.
Low (risk-less) interest rates, directly and also in conjunction with weak banking
supervision standards and high securitization activity, may imply more loan risk-
taking by banks through several channels. One channel relies upon the severe moral
hazard problems present in the banking industry, due for example to potential bail-
outs and high leverage ratios. In such an environment, abundant liquidity increases the
incentives for bank risk-taking (Allen and Gale, 2007).4 In the absence of agency
problems, excess of liquidity would be given back to shareholders or central banks.
However, owing to bank moral hazard, banks may “over-lend” the extra-liquidity and
finance projects with negative net present value. Allen and Carletti (2009) and Allen
and Gale (2007 and 2004) connect ample liquidity with a low short-term interest rate
policy.5 In fact, the level of overnight rates is a key driver of liquidity for banks since
banks increase their balance sheets (leverage) when financing conditions through
short-term debt are more favourable (Adrian and Shin, 2009).6 In addition, low levels
of both short- and long-term interest rates may induce a search for yield from
financial intermediaries due to moral hazard problems (Rajan, 2005).7 Securitization
of loans results in assets yielding attractive returns for investors, but, at the same time,
it may induce softer lending standards through lower screening and monitoring of
securitized loans or through the improvement of banks’ liquidity and capital position.
4 Concerning the link between liquidity and loan risk-taking by banks, it is interesting what Chuck Prince, former Citigroup Chairman, said when describing why his bank continued financing leveraged buyouts despite mounting risks: “When the music stops, in terms of liquidity, things will be complicated. But, as long as the music is playing, you’ve got to get up and dance. We’re still dancing.” (Financial Times, July 2007). 5 Low short-term interest rates also soften lending standards by abating adverse selection problems in credit markets thereby increasing bank competition (Dell’Ariccia and Marques, 2006); by reducing the threat of deposit withdrawals (Diamond and Rajan, 2006); and by improving banks’ net worth thereby increasing leverage (Shin, 2009a; Fostel and Geanokoplus, 2008; Geanakoplos, 2009; and Borio and Zhu, 2008). In addition, current low short-term interest rates may signal low short-term interest rates in the future, thus further increasing loan risk-taking by banks (Diamond and Rajan, 2009b). 6 See also Diamond and Rajan (2001 and 2009b); Brunnermeier et al. (2009); Shin (2009b); and Reinhart and Rogoff (2008). 7 See also Blanchard (2008).
3
As a consequence, the impact of low (risk-less) interest rates on the softening of
lending standards may be stronger when securitization activity is high (Rajan, 2005).
Finally, in this environment, strong banking supervision standards – by limiting the
effects of bank agency problems – should reduce the softening impact of low interest
rates.8
We empirically analyze the following questions: Do low levels of short- and/or
long-term interest rates soften bank lending standards? Is this softening more
pronounced when securitization activity is high or banking supervision standards are
weak? Does the softening imply more risk-taking by banks, i.e. is the softening over
and above the improvement of borrowers’ creditworthiness?9
There are four major challenges to identify the previous questions. First,
monetary policy rates are endogenous to the (local) economic conditions. Second,
banking supervision standards may be endogenous to monetary policy, in particular
when the central bank is responsible for both. Third, securitization activity is
endogenous to monetary (bank liquidity) conditions, since those affect the ability of
banks to grant loans. Finally, it is very difficult to obtain data on lending standards
applied to the pool of potential borrowers (including individuals and firms that were
rejected or decided not to take the loan), and to know whether, how and, most
importantly, why banks change these lending standards.
8 There are other channels through which low levels of both short- and long-term interest rates may affect bank (loan) risk-taking. First, low (risk-less) rates increase the attractiveness of risky assets in a mean-variance portfolio framework. Moreover, in habit formation models agents become less risk-averse during economic booms because their consumption increases relative to status-quo (Campbell and Cochrane, 1999). Therefore, a more accommodative monetary policy, by supporting real economic activity, may result in lower investors’ risk aversion. Second, there could be also monetary illusion associated to low levels of interest rates inducing banks to choose riskier products to boost returns (Shiller, 2000; and Akerlof and Shiller 2009). Third, low short-term interest rates may decrease banks’ intermediation margins (profits), thus reducing banks’ charter value, in turn increasing the incentive for risk-taking (Keeley, 1990). Fourth, low short-term interest rates by increasing the yield curve slope may induce banks to increase loan supply to exploit the maturity mismatch between assets and liabilities – since banks finance themselves at short maturity and lend at longer maturities (Adrian and Estrella, 2007). Fifth, an environment in which central banks focus only on price stability may result in monetary policy rates which are too low, fostering in turn bubbles in asset prices and credit (Borio 2003; Borio and Lowe, 2002). In the context of the current crisis, Acharya and Richardson (2009) argue that the fundamental causes of the crisis were the credit boom and the housing bubble. For Taylor (2007), these were largely spurred by too low monetary policy rates. 9 Throughout the paper we use the term “bank risk-taking” to indicate the risk that banks are taking through their lending activity. There are other ways in which banks may change their risk exposure, for example by changing the composition of other assets and/or liabilities. Since these mechanisms are not the subject of this paper, our analysis of bank risk-taking refers exclusively to the lending activity.
4
Our identification strategy relies upon the data we use – the answers from the
Euro Area Bank Lending Survey. These data address the four identification
challenges as follows. First, we use data from Euro Area countries, where monetary
policy rates are identical. However, there are significant cross-country differences in
terms of GDP growth and inflation, implying in turn significant exogenous cross-
sectional variation of monetary policy conditions (e.g. measured by Taylor-rule
implied rates (see Taylor, 2008)). Second, banking supervision in the Euro Area is
responsibility of the national supervisory authorities, whereas monetary policy is
decided by the Governing Council of the ECB.10 Third, there is significant cross-
country variation in securitization activity in the Euro Area partly stemming from
legal and regulatory differences in the market for securitization. Fourth, we use the
confidential Bank Lending Survey (BLS) database of the Eurosystem. National
central banks request banks to provide quarterly information on the lending standards
they apply to customers and on the loan demand they receive. We use this rich
information set to analyze whether banks change their lending standards over time, to
whom these changes are directed (average or riskier borrowers), how standards are
adjusted (loan spreads, size, collateral, maturity and covenants) and, most importantly,
why standards are changed (due to changes of borrower risk, of bank balance-sheet
strength, or of bank competition).11
We find that low short-term interest rates soften lending standards directly and
also indirectly by amplifying the softening effect on standards of high securitization
activity and weak banking supervision. This softening is over and above the
improvement of borrowers’ creditworthiness – it works through better bank balance-
sheets position and stronger banking competition – and the analysis of terms and
10 Banking regulation on capital follows international guidelines established for example by the Basel Committee, but there is room for discretion, in particular for supervision standards for bank capital (see Laeven and Levine, 2009; and Barth, Caprio and Levine, 2006). 11 The US Senior Loan Officer Survey does not have information for all types of loans on why banks change lending standards. The BLS contains this information for all type of loans and for all banks, which is key to identify bank risk-taking, since for example lower interest rates tend to improve borrowers’ creditworthiness by increasing the value of collateral (see Bernanke and Gertler, 1995). Therefore, in this case, a softening of standards would not imply more risk-taking. Another advantage stemming from the use of the BLS data compared to the US survey is that banks in the Euro Area are more important than in the US for the overall provision of funds to the economy (see for example Hartmann, Maddaloni, Manganelli, 2003; and Allen, Chui and Maddaloni, 2004). Therefore, a softening of bank lending standards in the Euro Area is likely to have a significantly stronger impact on the economy compared to the United States.
5
conditions for loans shows that all relevant standards are softened. Hence, the results
suggest that banks’ appetite for risky loans increases when overnight rates are low.
The impact of short-term interest rates on lending standards and on bank (loan) risk-
taking is statistically and economically significant. Moreover, it is higher than the
effect of long-term rates – both directly and in conjunction with securitization activity
and supervision standards. These results, therefore, help shed light on the root causes
of the current global crisis and have important implications for monetary policy,
banking regulation and supervision, and for financial stability.
We contribute to the literature in several dimensions. First, as far as we are aware
this paper is the first to analyze whether the impact of short-term (monetary policy)
and long-term interest rates on lending standards – and especially on loan risk-taking
– depends on securitization activity and banking regulation supervision standards.
Second, Lown and Morgan (2006) analyze the predictive power of data on lending
standards from the US Senior Loan Officer Survey for credit and economic growth.
However, that study only considers changes of total lending standards. We study
changes in total lending standards for the Euro Area and, most importantly for the
questions we pursue in our paper, we study also why and how they change. This
makes it possible to analyze loan risk-taking by banks, which is the main issue we
address in this paper (i.e. the softening of lending standards due to factors not related
to the improvement of borrowers’ creditworthiness).12 Finally, we contribute to the
emerging literature on the origins of the current financial crisis in at least two ways.
As explained earlier, the “special” setting of the Euro Area (for monetary policy,
securitization activity and banking supervision) provides an excellent platform, almost
a natural experiment, to identify the potential root causes of the current crisis and their
interactions. In addition, the emerging literature on the current crisis has focused
primarily on the US market, where the financial crisis was triggered by the collapse of
the subprime mortgage market. We analyze the drivers of the crisis in the other major
developed market, the Euro Area, by making use of a very rich dataset. We ultimately
show that the global nature of the crisis may have resulted not only from spill-over
12 Lown and Morgan (2006) analyze the predictive power of lending standards for credit and output growth and, as a byproduct, they study the impact of monetary policy changes on total lending standards. For the relationship between lending standards and credit and economic growth in the Euro Area, see Ciccarelli, Maddaloni and Peydró (2009).
6
effects across countries but it may have been due to causes inherent to the functioning
of global financial intermediation and to policy choices, which may have affected all
markets and countries, albeit with different intensities.
In the rest of this Section we summarize in more detail the results of the paper. In
the first part of the analysis we look at the relationship between lending standards and
interest rates. First, we find that a softening of lending standards is associated with
low overnight rates. This association is more economically significant for business
loans.13 Second, high GDP growth implies a softening of standards, i.e. standards are
pro-cyclical. Our findings are economically relevant: taking into consideration the
standard deviation of overnight rates and GDP growth, the impact of a change in the
overnight rate is double the impact of a change in GDP growth both for business and
consumer credit, while it is similar for loans for house purchase. Third, by exploiting
cross-country variation of Taylor-rule implied rates, we find that lending standards are
softened even more when short-term rates are too low for too long (measured as the
number of consecutive quarters in which short-term rates were lower than Taylor-rule
implied rates) – and the effect is stronger for loans for house purchase. In addition,
when we add time fixed effects to control for common shocks across countries, rates
too low for too long soften lending standards only for households, both for house
purchase and for consumption.
Fourth, low overnight rates have a stronger direct impact than low long-term rates
on the softening of standards – the effect is economically and statistically more
significant.14 Fifth, all terms and conditions of a loan are softened when short-term
13 Jiménez, Ongena, Peydró and Saurina (2009a) and Ioannidou, Ongena and Peydró (2009) also investigate the impact of short-term (monetary policy) rates on loan risk-taking by banks. They use comprehensive credit registers for business loans from Spain and Bolivia respectively. They find that low levels of overnight rates increase loan risk-taking. Our results complement these papers by analyzing all type of loans (business loans, loans for house purchase and consumer credit) and also by using data from all Euro Area countries. Moreover, we do not have the comprehensive data from credit registers, but we have information on the potential pool of borrowers, a key issue for identification in this type of analysis (see Bernanke and Gertler, 1995). We know whether, how and why banks change lending standards, which is key for identifying loan risk-taking. For indirect evidence on short-term interest rates and risk-taking, see Bernanke and Kuttner (2005), Rigobon and Sack (2004), Manganelli and Wolswijk (2009), Axelson, Jenkinson, Strömberg and Weisbach (2007), Den Haan, Sumner, and Yamashiro (2007), and Calomiris and Pornrojnangkool (2006). 14 One of the key root causes of the current crisis may have been the “saving glut and the existence of current account imbalances” building up over the previous years, implying that savers (mainly in emerging economies) were looking for investment opportunities abroad (see Bernanke, 2005; and Besley and Hennessy, 2009). One type of investment often mentioned was US long-term bonds.
7
rates are low, both for average and for riskier borrowers. Lending standards are
relaxed through lower loan margins, lower collateral and covenant requirements,
longer loan maturity and larger loan size. Finally, and most importantly, not only is
the softening of standards associated to the improvement of borrowers’ outlook and
collateral risk/ value (this would not imply more risk-taking), but also to less binding
constraints to banks’ balance-sheets (better liquidity and capital position and better
access to market finance) and to stronger banking competition (especially from non-
banks and market finance). Therefore, based on the previous results, we conclude that
low short-term interest rates imply more bank risk-taking.15 Moreover, the positive
impact of low short-term rates on loan risk-taking is statistically and economically
more significant than the effect of low long-term interest rates.
In the second part of the paper we analyze the impact of securitization activity.16
We find that the softening effect of low short-term rates on lending standards is
stronger when securitization activity is high. We do not find a similar result for long-
term interest rates. Adding time fixed effects to control for common shocks across
countries does not significantly change the results. Similarly the results hold when we
instrument securitization activity by the regulation of the market for securitization in
each country. In this case the instrument has a t-stat higher than 7 in the first-stage
regression and, hence, it does not suffer from weak instrument concerns (Staiger and
Stock, 1997).
However, there is also evidence that investors were seeking to buy short-term assets (Gross, 2009) and, in fact, Brender and Pisani (2009) report that about one third of all foreign exchange reserves are in the form of bank deposits. Little is known about the maturity composition of the remainder, most of which is invested in interest-bearing securities. The scarce evidence on the composition of USD foreign exchange reserves that can be gleaned from the US Treasury International Capital data suggests that over half of foreign official holdings of US securities has a maturity of less than three years (see Gross, 2009). 15 In other words, the effect of low policy rates on the softening of standards is over and above the firm balance sheet channel of monetary policy (Bernanke and Gertler, 1995). Because of imperfect information and incomplete contracts, expansive monetary policy increases banks’ loan supply by increasing firm (borrower) net worth, for example through collateral’s value (see Bernanke, Gertler and Gilchrist, 1996). See also Kashyap and Stein, 2000; Diamond and Rajan, 2006; Stiglitz, 2001; Stiglitz and Greenwald, 2003; and Bernanke, 2007. 16 For evidence on the softening of lending standards due to securitization, see for example Keys et al. (2009), Mian and Sufi (2009), and Dell'Ariccia, Igan and Laeven (2008). For an exhaustive analysis of recent financial innovations in banking, see Gorton and Souleles (2006), Gorton (2008), Gorton (2009), and Gorton and Metrick (2009). For a discussion of loan sales by banks, see Gorton and Pennacchi (1995).
8
Our analysis of the reasons why banks change their lending standards in an
environment of low short-term rates and high securitization activity highlights the
following mechanisms: (i) the “shadow banking system” may influence bank lending
standards by increasing banking competition since we find that competition from non-
banks and markets induce banks to soften lending standards. The impact is possibly
stemming from the different regulatory and supervisory environment in which banks
and other financial intermediaries operate;17 (ii) bank balance-sheet liquidity and
capital position influence the softening of lending standards. Short-term rates in
conjunction with securitization affect in turn these balance sheet constraints; and (iii)
changes in lending standards due to the risk and value of the collateral are affected by
securitization, possibly owing to the fact that securitization allows banks to offload
risk from their balance sheet.
The analysis of conditions and terms of the loans suggests that when short-term
rates are low and securitization activity is high bank margins on loans to riskier firms
are not softened while margins on riskier households – both for house purchase and
for consumption – are relaxed. This result is consistent with the fact that loans to
households represent the largest share of loans underlying securitized assets in the
Euro Area.18 In addition, collateral requirements, covenants, maturity, and loan-to-
value ratio restrictions are softened as well.
All in all, the set of results suggests that low short-term interest rates induce
banks to take more risk through their lending activity when securitization is high. The
same does not hold for low long-term interest rates.
Finally, we study the impact of banking supervision standards on loan risk-taking
in conjunction with low interest rates. Since the indicator of banking supervision has
almost no time variation, we use differences from Taylor rule-implied rates to fully
exploit cross-sectional variation. We find that the softening impact of low monetary
policy rates on lending standards due to bank balance-sheet factors is stronger when
17 See Gorton and Metrick (2009) for the role played by financial intermediaries other than banks in the current crisis. 18 See Carter and Watson (2006).
9
supervision standards for bank capital are weak.19 However, we do not find similar
results for long-term interest rates.
The rest of the paper proceeds as follows. Section II describes the data,
introduces the variables used in the empirical specifications and reviews the empirical
strategy. Section III discusses the results and Section IV concludes.
II. Data and Empirical Strategy
A. The Bank Lending Survey (BLS) dataset
The main dataset used in the paper are the answers from the Euro Area BLS.
Since 2002 in each country of the Euro Area the national central banks of the
Eurosystem run a quarterly survey on banks' lending practices. The questions asked
were formulated on the basis of theoretical considerations related to the monetary
policy transmission channels and of the experiences of other central banks running
similar surveys, in particular in the US and in Japan. The main set of questions did not
change since the start of the survey in 2002:Q4.20
The survey contains 18 questions on past and expected credit market
developments. Past developments refer to credit conditions over the past three
months, while expected developments focus on the next quarter. Two borrower
sectors are the focus of the survey: enterprises and households. Loans to households
are further disentangled in loans for house purchase and for consumer credit,
consistently with the official classification of loans in the statistics of the Euro Area.
The backward-looking questions cover the period from the last quarter of 2002 to
the first quarter of 2009. While the current sample covers the banking sector in the 16
countries comprising the Euro Area, we restrict the analysis to the 12 countries in the
19 The results, however, suggest that the effect is not very strong. This is consistent with the arguments put forward among others by Allen and Carletti (2009) and Rajan (2009) concerning the need for good supervision regulation, which does not necessarily mean more stringent supervision. See also Barth, Caprio and Levine (2006). 20 Berg, van Rixtel, Ferrando, de Bondt and Scopel (2005) describe in detail the setup of the survey. Sauer (2009) and Hempell, Köhler-Ulbrich and Sauer (2009) provide an update including the most recent developments and the few changes implemented (e.g. request of additional information via ad-hoc questions).
10
monetary union as of 2002:Q4, therefore we work with a balanced panel. Over this
period we consistently have data for Austria, Belgium, France, Finland, Germany,
Greece, Ireland, Italy, Luxembourg, Netherlands, Portugal, and Spain. The sample of
banks is representative of the banking sector in each country. This implies that it may
comprise banks of different size, although some preference was given to the inclusion
of large banks.
The questions imply only qualitative answers and no figures are required. The
survey is carried out by the national central banks of the Euro Area countries.
Typically the questionnaire is sent to senior loan officers, like for example the
chairperson of the bank’s credit committee. The response rate has been virtually 100%
all the time.
Banks provide information on the lending standards they apply to customers and
on the loan demand they receive. Concerning the supply of credit, which is the focus
of ten different questions, attention is given to changes in lending standards, to the
factors responsible for these changes, and to the credit conditions and terms applied to
customers – i.e. whether, why, and how lending standards are changed.
Lending standards are defined as the internal guidelines or criteria for a bank's
loan policy. Two main questions, each referring to a different borrower sector
(enterprises and households, further disentangled in loans for house purchase and
consumer loans), ask about changes in lending standards.21 The main question is:
“Over the past three months, how have your bank’s lending standards as applied to
the approval of loans (to enterprises or to households) changed?” There are five
possible replies, ranging from “eased considerably” to “tightened considerably.” (See
Appendix A for a detailed description of the questions used in the paper.)22
The second set of questions gives respondents the opportunity to assess how
specific factors affected lending standards. In particular, whether the changes in
standards were due to changes in bank balance-sheet strength (bank liquidity, capital,
21 In cases when foreign banks are part of the sample, the lending standards refer to the loans' policy in the domestic market which may differ from guidelines established for the headquarter bank. 22 See http://www.ecb.int/stats/money/lend/html/index.en.html for all the information related to the BLS.
11
or access to market finance), to changes in competitive pressures (from other banks,
from non-banks and from access to market finance), or to changes in borrowers’
creditworthiness (collateral risk/value or outlook, including general economic
conditions). We use this information to assess bank risk-taking – by looking at
changes of lending standards which are not fully explained by changes in borrowers’
creditworthiness.
Finally, the Survey provides information on the changes in the terms and
conditions of loans. These are the contractual obligations agreed upon by lenders and
borrowers such as the margin (interest rate applied to average and riskier borrowers),
the loan collateral, size, maturity and covenants. We use this information to assess
how the different conditions are adjusted for the risk taken.
Concerning demand for bank loans, which is the topic of seven questions, the
survey addresses various factors related to financing needs and the use of alternative
finance. Three questions deal with loan demand from corporations and four with
demand from households. Finally, banks can also give free-formatted comments in
response to an open-ended question.23
The Euro Area results of the Survey – a weighted average of the answers received
by banks in each Euro Area country – are published every quarter on the website of
the European Central Bank (ECB). In very few countries the aggregate answers of the
domestic samples are published by the respective national central banks. However, the
overall sample including all the answers at the country and bank level is confidential.
For the purpose of this paper we concentrate only on few questions from the BLS
described in detail in Appendix A. Since we are interested in actual lending decisions
by banks, we analyze the answers related to changes in lending standards over the
previous three months. However, the results are broadly unchanged when we use, in
non-reported regressions, the answers concerning expected changes of lending
standards over the next quarter.
23 For the purpose of this paper we do not use the answers related to the demand for loans; however, in non-reported regressions we control using the loan demand answers. The results are qualitatively similar.
12
Following for instance Lown and Morgan (2006), we quantify the different
answers on lending standards by using the net percentage of banks that have tightened
their lending standards over the previous quarter, which is defined as follows: the
difference between the percentage of banks reporting a tightening of lending standards
and the percentage of banks reporting a softening of standards. Therefore, a positive
figure indicates a net tightening of lending standards.24
B. Macroeconomic and financial variables
We regress the BLS variables on several macroeconomic and financial variables,
lagged by one quarter. Therefore, we use macroeconomic information from 2002:Q3
to 2008:Q4.25 All the series have quarterly frequency to be consistent with the
answers from the BLS.
The main proxy for the monetary policy rate is the quarterly average of the
EONIA overnight interest rate, as published by the ECB. To assess the impact of
long-term rates, we use 10-year government bond interest rates, different across Euro
Area countries. The main macroeconomic controls are the annual real GDP growth
rate and the inflation rate, defined as the quarterly average of monthly inflation rates
expressed in annual terms.26 Both measures are different across countries.
To assess monetary policy rates against a benchmark, we calculate for each
country a Taylor-rule implied rate over the sample period. We then use the difference
24 The use of this statistic implies that no distinction is made for the degree of tightening/easing of lending standards in the replies. This issue can be addressed using diffusion indexes. A simple way of calculating these indexes consists for example in weighting by 0.5 the percentage of banks answering that they have tightened somewhat (eased somewhat) and in weighting by 1 the percentage of banks that have tightened considerably (eased considerably). The results obtained using diffusion indexes do not differ qualitatively from the results obtained with net percentages and, therefore, we do not report them since they also imply a certain level of discretion when choosing the weights. 25 See Appendix B for a detailed description of the main variables used in the paper. 26 In non-reported regressions we have used as macroeconomic variables also expectations of GDP growth and inflation from Consensus Forecast or from the ECB projections. The results are qualitatively similar, but these variables are not available for all Euro Area countries and/or with quarterly frequency over the whole period considered. In addition, we have also used variables that proxy for country risk, as for example the difference between the long-term interest rates for each country (based on the 10 year Government bond rate) and the corresponding long-term German rate. We have also controlled in some non-reported regressions for the term spread, calculated as the difference between the 10 year rate and the 3-month rate, for house price growth and for credit (loan) growth. The results are qualitatively similar.
13
between the 3-month EURIBOR rate and this implied rate as explanatory variable in
the regressions (following Taylor, 2008, and Ahrend, Cournède and Price, 2008). A
high (positive) value indicates high monetary policy rates (restrictive stance of
monetary policy), whereas a low (negative) value indicates low levels of short-term
rates (expansive monetary policy). The rule-implied rates are calculated using simple
country-specific Taylor rules with coefficients 0.5 for inflation and output gap (see
Taylor, 1993). Output gap and inflation are country specific, while the natural rate is
set at 2.1 and the inflation target at 1.9.27 We also count the number of consecutive
quarters of “expansive” monetary policy, in which the 3-month EURIBOR was below
the rate implied by a Taylor rule since 1999:Q1, when the Euro was introduced. We
use this as a measure of monetary policy rates too low for too long.
One of the most notable innovations in financial markets over the last few years
has been the use of securitization. Thus, we also construct a variable measuring
securitization activity. It is the ratio between the volume of all the deals involving
asset-backed securities and mortgage-backed securities in each quarter, as reported by
Dealogic, normalized by the outstanding volume of loans during the previous
quarter.28 The securitization variable is country-specific since we have information
about the nationality of the securitized collateral.29 The volume of loans is available
from the official ECB statistics.
Since securitization is endogenous to the business cycle, in particular to the level
of short-term interest rates, for robustness we instrument securitization activity with a
time invariant indicator based on the legal environment for securitization in each
country. The indicator is constructed from country information contained in the report
Legal Obstacles to Cross-Border Securitization in the EU (European Financial
27 The estimated output gap for each country is the average of the estimates from the European Commission, the OECD and the IMF. As a robustness check we have also used the Taylor rule specification in Gerdesmeier, Mongelli and Roffia (2007) with interest-rate smoothing. The results are qualitatively similar. 28 It can be presumed that loans are securitized by the banks after they have been granted. Therefore, we lag the numerator of the ratio by one quarter. As a robustness check we use also the ratio of securitization volumes over gross volumes of new loans issued. However, the official Euro Area harmonized statistics on new loans are available only since 2003 and, therefore, in this case, we need to shorten consistently the time series of our sample. 29 In doing so, we are taking into account only securitization deals for which the underlying collateral resides in one of the Euro Area countries. Thus, we do not include securitization of loans granted outside the Euro Area by Euro Area banks.
14
Markets Lawyers Group, 2007). The view taken is that a more regulated environment
can be conducive to a framework of “legal certainty” which may be more attractive
for investors. Indeed the indicator shows a positive correlation with securitization
activity. In addition, it results in ample cross-country variation in the Euro Area. (See
Appendix C for details.)
Finally, we also use a capital stringency index to assess supervision standards for
bank capital. Capital stringency is an index of regulatory oversight of bank capital
(see Appendix C for details). It does not measure statutory capital requirements but
the supervisory approach to assessing and verifying the degree of capital at risk in a
bank (Laeven and Levine, 2009).
Table 1 shows the summary statistics of the main variables used, including the
correlations of Taylor rates across countries. Table 1 Panel A shows that the average
overnight rate (common across countries) was 2.87 with a standard deviation of 0.81,
whereas long-term rates had an average of 4.05 and a standard deviation of 0.46.
Average GDP growth was 2.42% while its standard deviation was 2.09, showing
ample cross-section and time series variability since it ranged from a minimum of -
7.98 to a maximum of 8.42. Average inflation was 2.51 with a standard deviation of
0.99. Average Taylor rate differences were -1.23, indicating that on average monetary
policy was expansive, with a standard deviation of 1.62, a minimum value of -6.55
and a maximum of 2.67. There is ample variation of Taylor-rule implied rates over the
sample as shown in the cross-country correlation table. For example, the correlation
between Germany and Spain was 0.32, while it was 0.82 between Germany and
Austria.
Securitization had an average of 1.82 ranging from 0 to 9.87. Therefore, on
average, the overall volume of securitized loans was small compared with the
outstanding amount of total loans. However, there is ample cross-section and time
series variation. Capital stringency index ranged from 3 to 7, reflecting mainly cross-
country variation, and the securitization instrument based on regulation varied from
1.5 to 14.
In Table 1 Panel B, C and D, average statistics for lending standards are shown.
There is ample variation of lending standards applied to non-financial firms and to
15
households over the sample period and across countries. It is also interesting to note
that the average measure of lending standards was positive, which implies average
tightening (in particular for business loans). This may signal a possible bias towards
tightening. Hence we analyze deviations over the mean values by introducing country
fixed effects, reflecting also the fact that the number and the structure of banks as well
as the regulatory and supervisory banking environment differ in each country.
C. Empirical strategy
We want to empirically analyze the impact of short-term and long-term interest
rates on the softening of lending standards directly and also indirectly in conjunction
with securitization activity and banking supervision standards. Moreover, we want to
assess whether a softening of lending standards implies more (loan) risk-taking by
banks.
As we discussed in the introduction, there are four major empirical challenges to
overcome. First, monetary policy rates are endogenous to the (local) economic
conditions. Second, banking supervision regulation may be endogenous to monetary
policy, in particular when the central bank is responsible for both. Third,
securitization activity is endogenous to monetary (bank liquidity) conditions, since
those affect the ability of banks to grant loans. Fourth, it is very difficult to obtain data
on lending standards applied to the pool of potential borrowers, and to know whether,
why, and how banks change these standards.
Our identification strategy to tackle the four previous challenges relies upon the
data we use, the Euro Area Bank Lending Survey dataset.
First, with regard to monetary policy, there is an identical monetary policy
(overnight) rate for all Euro Area countries, which show some significant time
variation between 2002 and 2009.30 At the same time, cross-country differences in
GDP growth and inflation imply different monetary conditions.31 Therefore, we can
exploit exogenous cross-sectional variation of the stance of monetary policy. For
30 In Bernanke and Blinder (1992), and in Christiano, Eichenbaum, and Evans (1996), among others, the overnight interest rate is the indicator of the stance of monetary policy. In the Euro Area the Governing Council of the ECB determines the corridor within which the overnight money market rate (EONIA) can fluctuate. Therefore, this rate is a measure of the stance of the monetary policy. 31 See for example Camacho, Pérez-Quiros and Saiz (2006).
16
example, Spain and Ireland have grown at a much higher rate and with a higher
inflation rate than Germany and France, the two largest Euro Area countries, over the
period 2002-2006 (Taylor, 2008).
Second, banking supervision regulation in the Euro Area is a responsibility of the
national supervisory authorities, whereas monetary policy is conducted by the
European Central Bank and the Eurosystem as a whole. Therefore, in the Euro Area,
differences in banking supervision and regulation standards across countries are
exogenous to the conduct of monetary policy. As explained above, we use a country
measure of supervision standards for bank capital.
Third, there is significant cross-sectional variation in securitization activity partly
arising from cross-country differences in the regulation of the market for
securitization. We construct a time-invariant indicator of the regulatory environment
for securitization and use it as an instrument in the robustness analysis.
Fourth, we use the confidential Bank Lending Survey dataset of the Eurosystem.
As explained earlier, national central banks request banks to provide quarterly
information on the lending standards they apply to customers and on the loan demand
they receive. We use this rich information set to analyze whether banks change their
lending standards for the pool of potential borrowers, to whom these changes are
directed (average or riskier borrowers), how standards are adjusted (loan spreads, size,
collateral, maturity and covenants) and, most importantly, why standards are changed
(due to changes in borrower risk, in bank balance-sheet strength and in competition).
Data on lending standards overcome some of the problems inherent to data on
actual credit granted. These data do not contain information on the conditions offered
to the pool of potential borrowers, including those customers that were either rejected
by the banks or that found the terms and conditions of the loan too onerous. In
addition, the BLS data contain information on all type of loans (loans for business, for
house purchase and for consumption) and on all type of standards (loan spreads for
average or riskier borrowers, loan size, maturity, covenants, etc). Finally, and most
importantly, the BLS dataset addresses the issue on why banks have changed their
standards. In particular, whether the decision was triggered by the improvement of the
borrowers’ creditworthiness, by better bank capital and/or liquidity position, or by
higher banking competition (stemming either from the banking sector or from the
17
non-banking sector, e.g. the “shadow banking system”).32 All this rich information
helps us to tackle the identification issue related to differences in borrowers’ quality –
the sample selection problem – and to analyze banks’ appetite for (loan) risk –
changes in lending standards over and above changes in borrowers’ creditworthiness.
The empirical strategy relies on a series of panel regressions where the basic
equation is the following:
ititititiit CONTROLSLTrateSTrateBLS ,,1,1,1, εδγβα +×+×+×+= −−−
where BLSt,i is the net percentage of banks which have tightened credit standards in
quarter t and country i (either total standards, or standards related to specific factors,
or the different loan conditions) in the 12 Euro Area countries over the period
2002:Q4-2009:Q1. STratet-1,i is the short-term interest rate at time t-1 in country i and
LTratet-1,i is the long-term interest rate. CONTROLSt-1,i are the other macroeconomic
and financial variables used in the analysis.
In the benchmark regressions we compare directly the impact of short-term
(EONIA) and long-term (10-year) nominal interest rates, controlling for GDP growth
and inflation. We also assess their indirect effect by looking at the interaction with
securitization activity. In an alternative specification, we use differences from Taylor-
rule implied rates to assess whether the softening of standards may be related to too
low for too long monetary policy rates (in this case GDP growth and inflation rates are
not included in the regressions but are used to calculate the Taylor-rule implied rates).
We also analyze the interaction of these differences with banking supervision
standards to fully exploit the cross-sectional variation of supervision standards and
monetary policy rates.
The nature of the data used – (1) from economically integrated but different
countries with a common monetary policy and (2) serial correlation of lending
standards – implies that the errors of the regressions are heteroskedastic and
correlated across countries, and serially correlated within countries. Since we have 26
quarters of data and only 12 countries, we run a series of GLS panel regressions with
32 This is a very important difference compared to the US Senior Loan Officer Survey where no information is reported on why banks change lending standards for real estate and consumer loans.
18
country (and when possible time) fixed-effects where we allow the residuals to be
correlated both cross-sectionally and serially (within correlation).33 We implement a
test for serial correlation of order one following Wooldridge (2002) and Drukker
(2003) and because of evidence of autocorrelation, the residuals of the regressions are
modeled as an autocorrelated process of order one.34 We also check the residuals for
evidence of higher order autocorrelation; in addition, we replicate all the main results
using LS panel regressions with country (and when possible time) fixed effects and
errors clustered by country to correct for serial correlation (see Appendix D).35 It
should be noted that clustering at the same time by country and time is likely to
produce biased estimates because of the limited number of countries and also the
relatively short time series of the data we use (see Petersen, 2009).
III. Results
The results are shown as follows. First, we analyze the impact of monetary policy
(short-term interest) rates on lending standards and bank risk-taking (Table 2). Then,
we compare the impact of short-term and long-term interest rates on lending standards
and loan risk-taking directly (Table 3), and indirectly through the interaction with
securitization activity (Table 4), and banking supervision standards (Table 5).
Short-term interest rates
Table 2 Panel A analyzes the impact of overnight rates (EONIA) on lending
standards applied to business loans, mortgage loans and consumer loans (Questions 1
and 8 of the BLS, see Appendix A). From Columns 1 to 6, the dependent variable
total credit standards is the net percentage of banks reporting a tightening of lending
33 We introduce country fixed effects since the number and the structure of banks as well as the regulatory and supervisory environment differ in each country; moreover, as shown e.g. by Laeven and Levine (2009), the banking structure, regulation and supervision affect bank (loan) risk-taking. In addition, whenever possible, we introduce time fixed effects to control for common shocks across countries in order to further exploit the cross-sectional implications of the hypotheses we are testing. 34 The coefficient of the lagged value of lending standards is generally lower than 0.5. 35 This is a common approach adopted by researchers to address two sources of correlation at the same time (see Petersen, 2009; and Angrist and Pischke, 2009). If the time effect were fixed, time dummies would completely remove the correlation between panels and then clustering by country would yield unbiased standards errors (but it would not adjust the coefficient of the regressions as when using GLS). Moreover, adding time fixed effects implies that we cannot compare the effect of short- and long-term nominal interest rates, a key question that we want to address in the paper.
19
standards over the previous quarter. In column 1, the coefficient of overnight rates is
equal to 24.889***.36 Therefore, higher overnight rates imply tighter lending
standards for non-financial firms. In column 2, controlling for real GDP growth and
inflation rate at the country level – the main determinants of overnight rates if
monetary policy were decided in each country – results are still highly statistically
significant: the coefficient on overnight rates is 22.157***. The coefficient on GDP
growth is negative and equal to -3.151***. Higher GDP growth softens lending
standards applied to non-financial firms. Hence, lending standards are pro-cyclical.
On the other hand, the coefficient on inflation is 5.268***, which indicates that a
higher inflation rate implies a tightening of lending standards to non-financial firms,
maybe as a consequence of expected increases in overnight rates in the near future.
In Columns 3 to 6 we report the results of the same regressions for lending
standards to households, either for loans for house purchase or for consumption. The
direction of the impact is similar for all the regressions. However, the size of the
coefficient of overnight rates indicates that the impact of short-term rates on lending
standards is stronger for loans to non-financial corporations than for loans to
households (22.157***, 11.507*** and 8.172*** respectively).
Results are also highly economically significant: the softening of standards for
business loans due to the impact of a one standard deviation decrease of overnight
rates is more than double the impact of a comparable increase of real GDP growth
(almost 18 and 7 respectively). Following a similar line of reasoning, our results
imply that the impact of overnight rates and GDP growth is comparable for mortgage
loans (approximately 9.5), while overnight rates have a stronger impact than GDP
growth for consumer loans (approximately 6.5 and 4 respectively).
Banks may soften lending standards when overnight rates are low because of
improvements in borrowers’ net worth and in the quality of their collateral as shown
by Matsuyama (2007), Bernanke and Gertler (1995) and Bernanke, Gertler, and
Gilchrist (1996 and 1999). In the previous regressions we have used GDP growth to
control for improvements of borrowers’ net worth. In Columns 7 to 12 we make a
further identification step. The left hand side variable is now defined as the tightening
36 *** denote significant at 1% level, ** significant at 5%, and * significant at 10%.
20
of lending standards due to changes in banks’ balance sheet constraints (bank capital,
liquidity and access to market finance), which are changes in lending standards not
associated to changes in borrowers’ creditworthiness (answers to Questions 2 and 9 of
the BLS, see Appendix A).
In Columns 7 to 12 we see that low overnight rates also softens lending standards
because of less stringent banks’ balance-sheet constraints. In this case, lending
standards are relaxed because of pure bank-supply factors and, hence we can interpret
these changes as reflecting more bank risk-taking. Results are statistically and
economically significant. Moreover, the impact of EONIA is stronger than that of
GDP growth for all type of loans, including loans for house purchase (the coefficients
in this case are respectively 5.488*** and -1.125***).
In Table 2 Panel A, controlling for GDP growth and inflation we have used the
level of overnight rates as an indicator of monetary policy. The next step is to assess
the level of short-term rates against a benchmark. One way to do it, following other
examples in the literature, is to calculate the difference between a nominal short-term
interest rate and the rate implied by a country-specific Taylor-rule.37 Note that this
measure provides exogenous cross-sectional differences of monetary policy stance
since the deviation from the Euro Area average for a country at a given point in time
is due to both the common monetary policy rate and the domestic inflation and GDP
growth.
In Table 2 Panel B, Columns 1 to 3 show that a low value of Taylor-rate
differences (i.e. more expansive monetary policy) implies a softening of standards for
all type of loans. Moreover, in Columns 4, 7 and 10 we show that the softening is over
and above the improvement of borrowers’ creditworthiness – the softening also stems
from pure bank-supply factors, measured by bank balance sheet constraints.
The next step is to introduce an additional variable measuring the persistence of
expansive monetary policy in each country by counting the number of consecutive
quarters in which nominal short-term rates were lower than Taylor-rule implied rates.
37 Another way to do it is through short-term real interest rates. In this case, negative rates are low. In non-reported regressions, we find similar results when using real rates.
21
Also this measure is country-specific. As we can see in Columns 5, 8, and 11, (short-
term) rates too low for too long imply an even further softening of lending standards.
Results are significant for all type of loans but are stronger for loans for house
purchase. Finally, as shown in Columns 6, 9 and 12, when we add time fixed effects
to control for common shocks across countries, rates too low for too long soften
lending standards only for households, both for house purchase and for consumption.
Short-term versus long-term interest rates
Table 3 shows the results of the regressions including long-term interest rates. In
Panel A, we analyze the impact of short- and long-term nominal interest rates on total
lending standards. In Panel B we analyze why the lending standards are changed in
order to assess bank risk-taking, while in Panel C we study how banks adjust their
terms and conditions for loans. The results reported in Panel B and C, therefore, are
crucial to assess the effects of short- and long-term interest rates on banks’ (loan) risk
appetite.
In Table 3 Panel A, Columns 1, 3 and 5, we find that low long-term rates soften
lending standards for all type of loans. However, once we control for overnight rates
in Columns 2, 4 and 6, the statistical and economical significance of long-term rates
disappear except for mortgage loans, possibly reflecting the long maturity feature of
these loans. Overnight rates, instead, continues to be statistically and economically
significant for all type of loans. For loans for house purchase, as Column 4 shows,
short- and long-term interest rates have a similar (economic) impact on lending
standards (the coefficients are 7.998*** and 11.311*** respectively, but the standard
deviation of overnight rates is 0.81 whereas it is 0.46 for long-term interest rates).
The next step is to assess the impact on loan risk-taking. Table 3 Panel B shows
the results of panel regressions where the left hand side variable is the tightening of
standards due to the following factors: expected economic conditions, borrowers’
collateral risk/value and outlook (i.e. creditworthiness), bank capital and liquidity
position and market access to finance (i.e. bank balance-sheet strength) and, finally,
competitive pressures stemming from the banking system or from non-banks.
Panel B for non-financial firms shows that low short-term interest rates soften
lending standards through all the factors considered. Lending standards are relaxed
22
because of the improvement of borrowers’ creditworthiness (Columns 8, 9 and 10),
but also owing to stronger bank balance-sheets (Columns 1 to 4), higher competition
from other banks (Column 5), from the non-banking sector (Column 6) and from
market finance (Column 7). Therefore, these results suggest that banks take more risk
when short-term rates are low. Banks increase risk-taking through easier lending
standards because of both better balance-sheet positions (as shown by Allen and Gale,
2007, and Diamond and Rajan, 2006) and higher competition (as shown by
Dell'Ariccia and Marquez, 2006).
The results concerning long-term rates have a much weaker statistical and
economical significance. It is worth noting that the changes in lending standards
linked to the liquidity position of banks are more affected by short-term rates than by
long-term rates (through mechanisms shown by Adrian and Shin, 2009). At the same
time, the coefficient linked to risk of collateral is higher for long-term rates, reflecting
probably the longer term nature of assets used as collateral, as for example real estate.
Panel B for households shows the results of similar regressions for mortgage and
consumer loans. Short-term rates significantly affect lending standards for
households. However, the coefficients of the factors related to competition are
smaller, suggesting that short-term rates (in the Euro Area) increase competition in
banking mainly for loans with shorter maturity (business loans as compared to loans
for house purchase). On the other hand, low long-term rates do not seem to imply
more risk-taking by banks (as Columns 1 to 3 and 6 to 8 suggest) except for factors
linked to bank competition. Finally, low long-term rates soften lending standards by
affecting borrowers’ creditworthiness through better housing market prospects and the
reduction of collateral risk (as Columns 5 and 11 suggest).
In Table 3 Panel C we report the results of panel regressions where the left hand
side variables are the conditions and terms of loans. We find that low short-term rates
soften all standards (price and non-price terms) for all type of loans. It is interesting to
note that the softening of standards applied to average and riskier borrowers is similar
for loans for house purchase. On the contrary, for business loans and consumer credit
the impact of low overnight rates is stronger for margins applied to average borrowers
than to riskier borrowers (first two columns for each type of loans). Moreover, low
23
long-term rates soften standards significantly for riskier firms but not for average
firms (see Column 1 and 2 of the non-financial firms’ table).
All in all, the results in Table 3 suggest that low short-term rates imply more
banks’ appetite for risk. Banks soften the standards not only because of the
improvement of borrowers’ creditworthiness but also because banks’ balance-sheet
constraints are relaxed and banking competition is increased; in addition, all the terms
and conditions are softened. Moreover, the analysis suggests that the positive impact
of low short-term rates on bank risk-taking is statistically and economically stronger
than the effect induced by low long-term interest rates.
Securitization
In the regression reported in Table 3 we have analyzed the direct impact of short-
and long-term nominal interest rates on lending standards. In Table 4 we show the
indirect impact via securitization activity. Results are reported as in the previous
section. First, Panel A shows the coefficients of the regressions with total credit
standards. Panel B reports the results when the left hand side variable is the tightening
due to factors related to changes in standards (i.e. why banks change them) and,
finally, Panel C shows the analysis of the terms and conditions of loans (i.e. how
banks adjust lending standards).
In Table 4, Panel A, Columns 1 to 6, the coefficient of securitization is negative,
implying that higher securitization activity tends to soften lending standards for all
type of loans. Most importantly for the research questions that we address in the
paper, the coefficient of the interaction between securitization and overnight rate is
positive and statistically significant, implying that the impact of low short-term rates
on the softening of lending standards is amplified when securitization is high. The
results are similar for all type of loans. However, the same does not hold when
studying the interaction of long-term rates and securitization.
The results are robust to the introduction of time fixed effects to control for
common shocks across countries, as shown in Columns 2, 4, and 6. In this case, the
overnight rate is dropped from the regression since it is common across countries and
the identification entirely arises from the interaction of interest rates and securitization
24
(for identification, in all the Panels of Table 4 and in Table 5 we present also the
results with time fixed effects).
The securitization activity in each country depends on the regulation and
development of the financial system of that specific country, but presumably also on
short-term rates and on the business cycle. Monetary policy affects loan volume,
affecting in turn the securitization of loans. Therefore, securitization activity is
endogenous to monetary policy. To address this issue, we instrument securitization
with an indicator of the relevant regulatory environment in each country (see Section
II and Appendix C for a detailed description of the instrument). As shown in Panel A,
Column 7 above, the securitization regulation instrument is highly significant (the t-
statistic in the first stage regression is 7.44), thus the instrument does not suffer from
weak instrument concerns (Staiger and Stock, 1997). Moreover, the estimates from
the second-stage regression (Columns 7 to 12) suggest that the impact of low short-
term rates on the softening of standards is stronger when the component of actual
securitization predicted by securitization regulation is high. As in Columns 1 to 6, the
results are similar for all type of loans. Finally, we do not find similar results when we
analyze the interaction of long-term rates and (the predicted) securitization.
In Table 4, Panel B, we analyze the tightening of lending standards due to
specific factors. For loans to non-financial firms, we find that higher securitization
activity amplifies the impact of low overnight rates on the softening of standards due
to: (1) higher competition from the non-banking sector (Columns 11 to 14); and (2)
lower risk of collateral and better firm outlook (Columns 15 to 20). Since one of the
significant factors is stronger competition, the results imply that banks soften lending
standards also for reasons not related to improvements of borrowers’ creditworthiness,
thus suggesting more bank risk-taking in business loans in an environment of high
securitization activity and low short-term interest rates.
For loans to households, we find that the effect of high securitization activity and
low overnight rates on the softening of lending standards is due to stronger bank
balance-sheet position (Columns 1, 2, 11 and 12) and to improvements of borrowers’
creditworthiness for both mortgages (Columns 7 to 10) and consumer loans (Columns
17 to 22). For loans for house purchase, non-bank competition has a significant
coefficient as well (Columns 5 and 6). The results suggest that banks take more risk in
25

lending to households when securitization activity is high and overnight rates are low,
in particular because bank balance-sheet constraints are relaxed.
In this environment of low short-term interest rates and high securitization
activity, our results highlight: (i) the “shadow banking system” may induce a
softening of bank lending standards through competition (since competition from non-
banks and from market finance is a significant mechanism in the analysis). The
impact presumably stems from the different regulatory and supervisory environment
in which markets and financial intermediaries other than banks operate; (ii) the
importance of bank balance-sheet strength in affecting the softening of standards (low
overnight rates and high securitization improve balance-sheet liquidity and capital
positions); and (iii) the effect of securitization as a risk transfer device. Our results
suggest that lending standards related to collateral risk and value are softened more as
banks are able to offload the risk from their balance sheets.
In Table 4 Panel C the terms and conditions of loans are analyzed. We find that
more securitization in conjunction with low short-term rates has an impact on the
following standards: (i) for business loans: margins for average borrowers, collateral
requirements, and maturity; (ii) for mortgage loans: margins on both average and
riskier loans, collateral requirements, and loan-to-value ratio restrictions; (iii) for
consumer credit: margins on both average and riskier loans, collateral requirements,
maturity, and non-interest rate charges.
It is interesting to note that lending standards are relaxed for riskier, lower rated
households, but not for riskier firms (see Column 3 and 4 for business loans),
consistently with the evidence showing that loans to households represent the largest
share of loans underlying securitized assets in the Euro Area.
All in all, the analysis suggests that the impact of short-term rates on bank risk-
taking through securitization is statistically and economically stronger than the effect
induced by long-term interest rates.
Banking regulation and supervision standards
The last part of the analysis is devoted to the inclusion of supervision standards
for bank capital. In Table 5 we introduce the capital stringency index which is a
26
measure of regulatory oversight of bank capital (see Laeven and Levine, 2009). This
measure has some cross-sectional variation but very little time variation (see Section
II and Appendix C), hence to fully exploit the cross-sectional variation, we use
differences from Taylor rule implied rates as a proxy for low short-term interest rates.
In Panel A and B, we find in general that the impact of low monetary rates on the
softening of lending standards due to bank balance sheet constraints is higher when
supervision standards are weak. This effect is stronger (statistically and economically)
for consumer credit. However, we do not find similar results for long-term interest
rates.
All in all, the results suggest that the effect on loan risk-taking of low monetary
policy rates in conjunction with weak supervision standards is not very strong. This
may hinge on two (non exclusive) possible explanations. First, the indicator may not
reflect enough variation of banking supervision across Euro Area countries. Second, it
may be difficult to capture the goodness of regulation or supervision with measures
based on the stringency of banking supervision. This is consistent with the arguments
made by Allen and Carletti (2009) and Rajan (2009) concerning the need for “good”
supervision regulation standards, which do not necessarily mean more stringent.38
IV. Conclusions
Many commentators have suggested that low levels of short and/or long-term
interest rates induced more bank risk-taking over the period preceding the financial
crisis. This view is summarized for example in the letter to Her Majesty the Queen on
the origins of the current crisis written by the British Academy (see Besley and
Hennessy, 2009). In this paper we have addressed empirically this issue.
Using a rich dataset on lending standards from the Euro Area, we find that low
short-term rates affect more than low long-term interest rates the softening of lending
standards. The impact works both directly and indirectly in conjunction with high
securitization activity and weak banking supervision standards. The softening of
lending standards is over and above the improvement of borrowers’ creditworthiness,
and the analysis of the terms and conditions of loans shows that all relevant standards
38 See also Barth, Caprio and Levine (2006).
27
are softened. Therefore, the results suggest that banks’ appetite for (loan) risk
increases when overnight rates are low; high securitization and weak banking
supervision amplify this effect even more. The same, however, does not hold for low
long-term interest rates.
A low level of short-term interest rates has preceded many financial crises over
the last centuries (Calomiris, 2008). However, in the current juncture, the impact of
low interest rates may have been even stronger than in the past for at least two
reasons: First, because short-term interest rates were low in both nominal and real
terms (or similarly as compared to Taylor-rule implied rates). We analyze the impact
of both on lending standards and find that they both contribute to the softening of
lending standards. Second, perhaps most importantly, because in the years previous to
the crisis short-term interest rates were low for an extended period of time – too low
for too long – in conjunction with high securitization activity and possibly weak
banking supervision standards. The concurrency of these factors may have enhanced
the effects of low short-term interest rates on loan risk-taking by banks, an hypothesis
that is supported by the results of this paper.39 40
We contribute significantly to the current debate on the origins of the financial
crisis. The special setting of the Euro Area with identical monetary policy rates but
important differences of GDP growth, inflation and securitization activity provides an
excellent platform to identify the potential root causes of the current crisis and their
interactions (Allen and Carletti, 2009; Diamond and Rajan, 2009a; Rajan, 2005;
Acharya and Richardson, 2009).41 Differently from the emerging literature on the
current crisis focusing primarily on the US market, we analyze the drivers of the crisis
in the other major developed market – i.e. the Euro Area – by making use of a very
rich dataset on lending standards. By using this dataset we can assess whether banks
39 Another reason can be that short-term rates may be more important nowadays for banks’ leverage (see Adrian and Shin, 2009). 40 We would like to thank Tobias Adrian, the discussant of this paper at the RFS-Yale Conference on The Financial Crisis, for showing that our results related to monetary policy and securitization also hold when using US lending standards. This suggests that low monetary policy rates in the US not only softened lending standards directly, but also indirectly through high securitization activity. 41 See also Allen (2009), Besley and Hennessy (2009), Blanchard (2009), Brunnemeier (2009), Calomiris (2008), Engel (2009), Rajan (2009), Taylor (2007 and 2008), and numerous articles since summer 2007 in The Financial Times, The Wall Street Journal, and The Economist.
28
change lending standards for potential borrowers, how they do it (by changing terms
and conditions) and most importantly why, a key piece of information to assess risk-
taking.
We ultimately show that the global nature of the crisis may have resulted not only
from spill-over effects across countries and banks but it may have been due to causes
inherent to the functioning of financial intermediation at large (including the “shadow
banking system”) and policy decisions, which worked in all the markets and
countries, albeit with different intensities.42 These results, therefore, help shed light on
the origins of the current crisis and have important policy implications for monetary
policy, banking regulation and supervision, and for financial stability.
42 Bank risk problems may transmit through the system through interbank contagion and other mechanisms, see Iyer and Peydró (2009) and Bandt, Hartmann and Peydró (2009). Once the banking system is in trouble, a credit crunch stemming from low bank capital and liquidity is more likely to happen (see Jiménez, Ongena, Peydró and Saurina, 2009b) in turn affecting the real economy (see Ciccarelli, Maddaloni and Peydró, 2009).
29
References
Acharya, V. and M. Richardson, Repairing a Failed System: An Introduction, Wiley, 2009.
Adrian, T. and A. Estrella, “Monetary Tightening Cycles and the Predictability of Economic Activity,” Economics letters, 2008, 99, pp. 260-264.
Adrian, T. and H. Shin, “Money, Liquidity and Monetary Policy,” American Economic Review Papers and Proceedings, 2009, 99:2, pp. 600-605.
Adrian, T. and H. Shin, “Liquidity and Leverage,” Journal of Financial Intermediation, forthcoming, 2009.
Ahrend, R., B. Cournède and R. Price, “Monetary Policy, Market Excesses and Financial Turmoil,” OECD Economics Department Working Papers, No. 597, 2008.
Akerlof, G. and R. Shiller, Animal Spirits: How Human Psychology Drives the Economy And Why It Matters for Global Capitalism, Princeton University Press, 2009.
Allen, F., “Lessons from the Crisis,” paper presented at the Wharton Club Conference Call, 2009.
Allen, F. and E. Carletti, “The Global Financial Crisis: Causes and Consequences,” mimeo, 2009.
Allen, F. and D. Gale, Understanding Financial Crises, Oxford University Press, 2007.
Allen, F. and D. Gale, “Asset Price Bubbles and Monetary Policy,” in Global Governance and Financial Crises ed. by M. Desai and Y. Said, 2004.
Allen, F, Chui, M. and A. Maddaloni, “Financial Systems in Europe, the USA and Asia,” Oxford Review of Economic Policy, 2004, 20(4), pp. 490-508.
Angrist, J. and J.-S. Pischke, Mostly Harmless Econometrics, Princeton University Press, 2009.
Axelson, U., Jenkinson, T., Strömberg, P. and M. S. Weisbach, “Leverage and Pricing in Buyouts: An Empirical Analysis,” mimeo, 2007.
Bandt, O., Hartmann, P. and J.-L. Peydró, “Systemic Risk in Banking: An Update,” in A. N. Berger, P. Molyneux and J. Wilson, eds., The Oxford Handbook of Banking, Oxford University Press, 2009.
Barth, R. J., Caprio G. and R. Levine, Rethinking Bank Regulation, Cambridge University Press, 2006.
Berg, J., van Rixtel, A., Ferrando, A., de Bondt, G. and S. Scopel, “The Bank Lending Survey for the Euro Area,” ECB Occasional Paper No. 23, 2005.
30
Bernanke, B.S., “The Financial Accelerator and the Credit Channel”, remarks at the conference on the Credit Channel of Monetary Policy in the Twenty-first Century, Federal Reserve Bank of Atlanta, Georgia, 2007.
Bernanke, B. S., “The Global Saving Glut and the U.S. Current Account Deficit,” speech delivered at the Sandridge Lecture, Virginia Association of Economics, Richmond, 2005.
Bernanke, B. S. and A. S. Blinder, “The Federal Funds Rate and the Channels of Monetary Transmission,” American Economic Review, 1992, 82(4), pp. 901-21.
Bernanke, B. S. and M. Gertler, “Inside the Black Box: The Credit Channel of Monetary Policy Transmission,” Journal of Economic Perspectives, 1995, 9(4), pp. 27-48.
Bernanke, B. S., Gertler, M. and S. Gilchrist, “The Financial Accelerator and the Flight to Quality,” Review of Economics and Statistics, 1996, 78(1), pp. 1-15.
____. “The Financial Accelerator in a Quantitative Business Cycle Framework,” in J. Taylor and M. Woodford, eds., Handbook of Macroeconomics, Elsevier, Amsterdam, 1999, pp.1341-93.
Bernanke, B. S. and K. N. Kuttner, “What Explains the Stock Market's Reaction to Federal Reserve Policy?” Journal of Finance, 2005, 60(3), pp. 1221-58.
Besley, T. and P. Hennessy, “Letter to Her Majesty The Queen,” British Academy, 2009.
Blanchard, O., “The Crisis: Basic Mechanisms, and Appropriate Policies,” MIT Department of Economics, Working Paper, 09-01, 2009.
Blanchard, O., “The State of Macro,” NBER Working Paper No. 14259, 2008.
Borio, C., “Towards a Macroprudential Framework for Financial Supervision and Regulation,” CESifo Economic Studies, 2003, 49, pp. 181-215.
Borio, C. and P. Lowe, “Asset Prices, Financial and Monetary Stability: Exploring the Nexus,” BIS Working Paper No. 114, 2002.
Borio, C. and H. Zhu, “Capital Regulation, Risk-Taking and Monetary Policy: a Missing Link in the Transmission Mechanism?” BIS Working Paper No. 268, 2008.
Brender, A., and F. Pisani, Globalised Finance and its Collapse, Dexia, Brussels, 2009.
Brunnermeier, M., Crockett A., Goodhart C., Persaud A. and H. Shin, The Fundamental Principles of Financial Regulation, Geneva Report 11, 2009.
Brunnermeier, M. K., “Deciphering the Liquidity and Credit Crunch 2007-2008,” Journal of Economic Perspectives, 2009, Vol. 23, No. 1, pp. 77-100.
31
Calomiris, C. W., “The Subprime Turmoil: What’s Old, What’s New, What’s Next?” paper presented at the Jacques Polak Conference, IMF, 2008.
Calomiris, C. W. and T. Pornrojnangkool, “Relationship Banking and the Pricing of Financial Services,” NBER Working Paper No. 12622, 2006.
Camacho, M., Pérez-Quiros, G. and L. Saiz, “Are European Business Cycles Close Enough to be Just One?” Journal of Economic Dynamics and Control, 2006, vol. 30(9-10), pp. 1687-1706.
Campbell, J. and J. Cochrane, “By Force of Habit: a Consumption-Based Explanation of Aggregate Stock Market Behaviour,” Journal of Political Economy, 1999, 107, pp. 205–51.
Carter, J. and R. Watson, Asset Securitisation and Synthetic Structures: Innovations in the European Credit Markets, Euromoney Books, 2006.
Christiano, L. J. Eichenbaum, M. and C. Evans, “The Effects of Monetary Policy Shocks: Evidence from the Flow of Funds,” Review of Economics and Statistics, 1996, 78(1), pp. 16-34.
Ciccarelli, M., Maddaloni, A. and J.-L. Peydró, “Trusting the Bankers: a New Look at the Credit Channel of Monetary Policy,” mimeo, 2009.
Dell’Ariccia, G. Igan, D. and L. Laeven, “Credit Booms and Lending Standards: Evidence from the Subprime Mortgage Market,” IMF Working Paper 08/106, 2008.
Dell'Ariccia, G. and R. Marquez, “Lending Booms and Lending Standards,” Journal of Finance, 2006, 61(5), pp. 2511-46.
Den Haan, W. J. Sumner, S. and G. Yamashiro, “Bank Loan Portfolios and the Monetary Transmission Mechanism,” Journal of Monetary Economics, 2007, 54(3), pp. 904-924.
Diamond, D. W. and R. G. Rajan, “Liquidity Risk, Liquidity Creation and Financial Fragility: A Theory of Banking”, Journal of Political Economy, 2001, 109, pp. 287-327.
Diamond, D. W. and R. G. Rajan, “Money in a Theory of Banking,” American Economic Review, 2006, 96(1), pp. 30-53.
Diamond, D. W. and R. G. Rajan, “The Credit Crisis: Conjectures about Causes and Remedies,” American Economic Review, 2009a.
Diamond, D. and R. G. Rajan, “Illiquidity and Interest Rate Policy,” mimeo, 2009b.
Drukker, D. M. “Testing for Serial Correlation in Linear Panel-Data Models,” Stata Journal, 2003, (3)2, pp. 168-177.
European Financial Markets Lawyer Group (EFMLG), Legal Obstacles to Cross-Border Securitization in the EU, 2007, available at http://www.efmlg.org/.
32
Engel, C. “Global Imbalances, Exchange Rates, and the Global Crisis,” mimeo, 2009.
Fostel, A. and J. Geanakoplos, “Leverage Cycles and the Anxious Economy,” American Economic Review, 2008, 98:4, pp. 1211-1244.
Geanakoplos, J., “The Leverage Cycle,” NBER Macroeconomics Annual, eds. D. Acemoglu, K. Rogoff and M. Woodford, 2009.
Gerdesmeier, D., Mongelli F. and B. Roffia, “The Eurosystem, the U.S. Federal Reserve and the Bank of Japan: Similarities and Differences,” Journal of Money, Credit and Banking, 2007, Vol. 39, No. 7, pp. 1785-1819.
Gorton, G. and N. Souleles, “Special Purpose Vehicles and Securitization,” in The Risks of Financial Institutions, eds. R. Stulz and M. Carey, University of Chicago Press, 2006.
Gorton, G. and G. Pennacchi, “Banks and Loan Sales: Marketing Non-Marketable Assets,” Journal of Monetary Economics, 1995, 35(3), pp. 389-411.
Gorton, G., “Information, Liquidity, and the (Ongoing) Panic of 2007,” American Economic Review, Papers and Proceedings, 2009, vol. 99, no. 2, pp. 567-572.
Gorton, G., “The Panic of 2007,” paper presented at the symposium sponsored by the Federal Reserve Bank of Kansas City, Jackson Hole, 2008.
Gorton, G, B. and A. Metrick, “Securitized Banking and the Run on Repo,” NBER Working Paper No. 15223, 2009.
Gross, D., “Global Imbalances and the Accumulation of Risk,” CEPR VoxEu column, http://www.voxeu.org/index.php?q=node/3655, 2009.
Hartmann, P., Maddaloni, A. and S. Manganelli, “The Euro-Area Financial System: Structure, Integration, and Policy Initiatives,” Oxford Review of Economic Policy, 2003, Vol. 19, No. 1, pp. 180- 213.
H.S. Hempell, P. Köhler-Ulbrich and S. Sauer, “Information from the Euro Area Bank Lending Survey,” ECB Occasional Paper Series, 2009, forthcoming.
Ioannidou, V. P., Ongena, S. and J.-L. Peydró, “Monetary Policy, Risk-Taking and Pricing: Evidence from a Quasi Natural Experiment,” presented at the 2009 NBER Summer Institute Carey-Kashyap-Rajan-Stulz group.
Iyer, R. and J.-L. Peydró, “Interbank Contagion at Work: Evidence from a Natural Experiment,” The Review of Financial Studies, forthcoming, 2009.
Jiménez, G., Ongena S., Peydró J.-L. and J. Saurina, “Hazardous Times for Monetary Policy: What do Twenty-Three Million Bank Loans Say About the Effects of Monetary Policy on Credit Risk?," presented at the American Finance Association Meetings, San Francisco, 2009a.
33
Jiménez, G., S. Ongena, J. L. Peydró and J. Saurina, “Credit Availability: Identifying Balance-Sheet Channels with Loan Applications,” mimeo, 2009b.
Kashyap, A. K. and J. C. Stein, “What Do a Million Observations on Banks Say About the Transmission of Monetary Policy?” American Economic Review, 2000, 90(3), pp. 407-28.
Keeley, M. C., “Deposit Insurance Risk and Market Power in Banking,” American Economic Review, 1990, 80, pp. 1183-1200.
Keys, B., Mukherjee, T., Seru, A. and V. Vig, “Did Securitization Lead to Lax Screening? Evidence from Subprime Loans 2001-2006,” Quarterly Journal of Economics, forthcoming, 2009.
Laeven, L. and R. Levine, “Bank Governance, Regulation, and Risk-Taking”, Journal of Financial Economics, forthcoming, 2009.
Lown, C. and D. P. Morgan, “The Credit Cycle and the Business Cycle: New Findings Using the Loan Officer Opinion Survey,” Journal of Money, Credit and Banking, 2006, Vol. 38, No.6, pp. 1575-1597.
Manganelli, S. and G. Wolswijk, “What Drives Spreads in the Euro Area Government Bond Market?” Economic Policy, 2009, 48, pp. 191-240.
Matsuyama, K., “Credit Traps and Credit Cycles,” American Economic Review, 2007, 97(1), pp. 503-16.
Mian, A. and A. Sufi, “The Consequences of Mortgage Credit Expansion: Evidence from the 2007 Mortgage Default Crisis,” Quarterly Journal of Economics, forthcoming, 2009.
Petersen, M. “Estimating Standard Errors in Finance Panel Data Sets: Comparing Approaches,” The Review of Financial Studies, 2009, 22, pp 435-480.
Rajan, R. G, “Has Financial Development Made the World Riskier?” NBER Working Paper 11728, and paper presented at the symposium sponsored by the Federal Reserve Bank of Kansas City, Jackson Hole, 2005.
Rajan, R. G.,“The Credit Crisis and Cycle Proof Regulation,” mimeo, 2009.
Reinhart, C. and K. Rogoff, “This Time is Different: A Panoramic View of Eight Centuries of Financial Crises,” NBER Working Paper 13882, 2008.
Rigobon, R. and B. Sack, “The Impact of Monetary Policy on Asset Prices,” Journal of Monetary Economics, 2004, 51(8), pp. 1553-75.
Sauer, S., “The Euro Area Bank Lending Survey – A Review of Six Years of Experience”, forthcoming in Revue Bancaire et Financière, 2009.
Shiller, R., Irrational Exuberance, Princeton University Press, 2000.
34
Shin, Hyun S., Discussion of “The Leverage Cycle by John Geanakoplos,” NBER Macroeconomics Annual, eds D. Acemoglu, K. Rogoff and M. Woodford, 2009a.
Shin, H., Risk and liquidity, the 2008 Clarendon Lectures in Finance, Oxford University Press, forthcoming 2009b.
Staiger, D. and J. H. Stock, “Instrumental Variables Regression with Weak Instruments,” Econometrica, 1997, 65, 557-86.
Stiglitz, J. E., “Information and the Change in the Paradigm in Economics,” Prize Lecture, Nobel Foundation, Stockholm, 2001.
Stiglitz, J. E. and B. Greenwald, Towards a New Paradigm in Monetary Economics, Cambridge University Press, 2003.
Taylor, J. B., “Discretion versus Policy Rules in Practice,” Carnegie-Rochester Conference Series on Public Policy, 1993, 39, pp. 195-214.
Taylor, J. B., “Housing and Monetary Policy,” NBER Working Paper 13682 and paper presented at the symposium sponsored by the Federal Reserve Bank of Kansas City, Jackson Hole, 2007.
Taylor, J. B., “The Financial Crisis and the Policy Responses: an Empirical Analysis of What Went Wrong,” mimeo, 2008.
Wooldridge, J. M., Econometric Analysis of Cross Section and Panel Data, MIT Press, 2002.
35
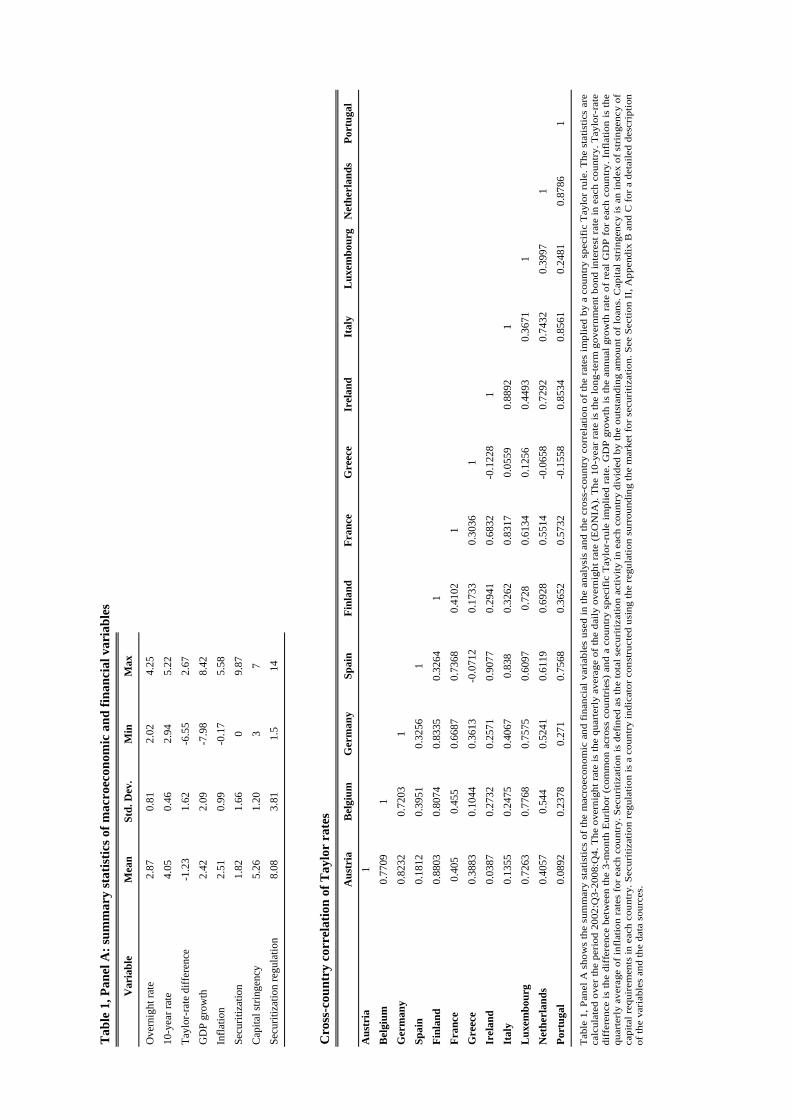
Tab
le 1
, Pan
el A
: sum
mar
y st
atis
tics o
f mac
roec
onom
ic a
nd fi
nanc
ial v
aria
bles
Var
iabl
e M
ean
Std.
Dev
.M
inM
ax
Ove
rnig
ht ra
te2.
870.
812.
024.
2510
-yea
r rat
e4.
050.
462.
945.
22Ta
ylor
-rat
e di
ffer
ence
-1.2
31.
62-6
.55
2.67
GD
P gr
owth
2.42
2.09
-7.9
88.
42In
flatio
n2.
510.
99-0
.17
5.58
Secu
ritiz
atio
n1.
821.
660
9.87
Cap
ital s
tring
ency
5.26
1.20
37
Secu
ritiz
atio
n re
gula
tion
8.08
3.81
1.5
14
Cro
ss-c
ount
ry c
orre
latio
n of
Tay
lor
rate
s
Aus
tria
Bel
gium
Ger
man
ySp
ain
Finl
and
Fran
ceG
reec
eIr
elan
dIt
aly
Lux
embo
urg
Net
herl
ands
Port
ugal
Aus
tria
1B
elgi
um0.
7709
1G
erm
any
0.82
320.
7203
1Sp
ain
0.18
120.
3951
0.32
561
Finl
and
0.88
030.
8074
0.83
350.
3264
1Fr
ance
0.40
50.
455
0.66
870.
7368
0.41
021
Gre
ece
0.38
830.
1044
0.36
13-0
.071
20.
1733
0.30
361
Irel
and
0.03
870.
2732
0.25
710.
9077
0.29
410.
6832
-0.1
228
1It
aly
0.13
550.
2475
0.40
670.
838
0.32
620.
8317
0.05
590.
8892
1L
uxem
bour
g0.
7263
0.77
680.
7575
0.60
970.
728
0.61
340.
1256
0.44
930.
3671
1N
ethe
rlan
ds0.
4057
0.54
40.
5241
0.61
190.
6928
0.55
14-0
.065
80.
7292
0.74
320.
3997
1Po
rtug
al0.
0892
0.23
780.
271
0.75
680.
3652
0.57
32-0
.155
80.
8534
0.85
610.
2481
0.87
861
Tab
le 1
, Pan
el A
sho
ws
the
sum
mar
y st
atis
tics
of th
e m
acro
econ
omic
and
fin
anci
al v
aria
bles
use
d in
the
anal
ysis
and
the
cros
s-co
untr
y co
rrel
atio
n of
the
rate
s im
plie
d by
a c
ount
ry s
peci
fic
Tay
lor
rule
. The
sta
tistic
s ar
e ca
lcul
ated
ove
r th
e pe
riod
200
2:Q
3-20
08:Q
4. T
he o
vern
ight
rat
e is
the
quar
terl
y av
erag
e of
the
daily
ove
rnig
ht r
ate
(EO
NIA
). T
he 1
0-ye
ar r
ate
is th
e lo
ng-t
erm
gov
ernm
ent b
ond
inte
rest
rat
e in
eac
h co
untr
y. T
aylo
r-ra
te
diff
eren
ce is
the
diff
eren
ce b
etw
een
the
3-m
onth
Eur
ibor
(co
mm
on a
cros
s co
untr
ies)
and
a c
ount
ry s
peci
fic
Tay
lor-
rule
impl
ied
rate
. GD
P gr
owth
is th
e an
nual
gro
wth
rat
e of
rea
l GD
P fo
r ea
ch c
ount
ry. I
nfla
tion
is th
e qu
arte
rly
aver
age
of in
flat
ion
rate
s fo
r ea
ch c
ount
ry. S
ecur
itiza
tion
is d
efin
ed a
s th
e to
tal s
ecur
itiza
tion
activ
ity in
eac
h co
untr
y di
vide
d by
the
outs
tand
ing
amou
nt o
f lo
ans.
Cap
ital s
trin
genc
y is
an
inde
x of
str
inge
ncy
of
capi
tal r
equi
rem
ents
in e
ach
coun
try.
Sec
uriti
zatio
n re
gula
tion
is a
cou
ntry
indi
cato
r co
nstr
ucte
d us
ing
the
regu
latio
n su
rrou
ndin
g th
e m
arke
t for
sec
uriti
zatio
n. S
ee S
ectio
n II
, App
endi
x B
and
C fo
r a d
etai
led
desc
ript
ion
of th
e va
riab
les
and
the
data
sou
rces
.
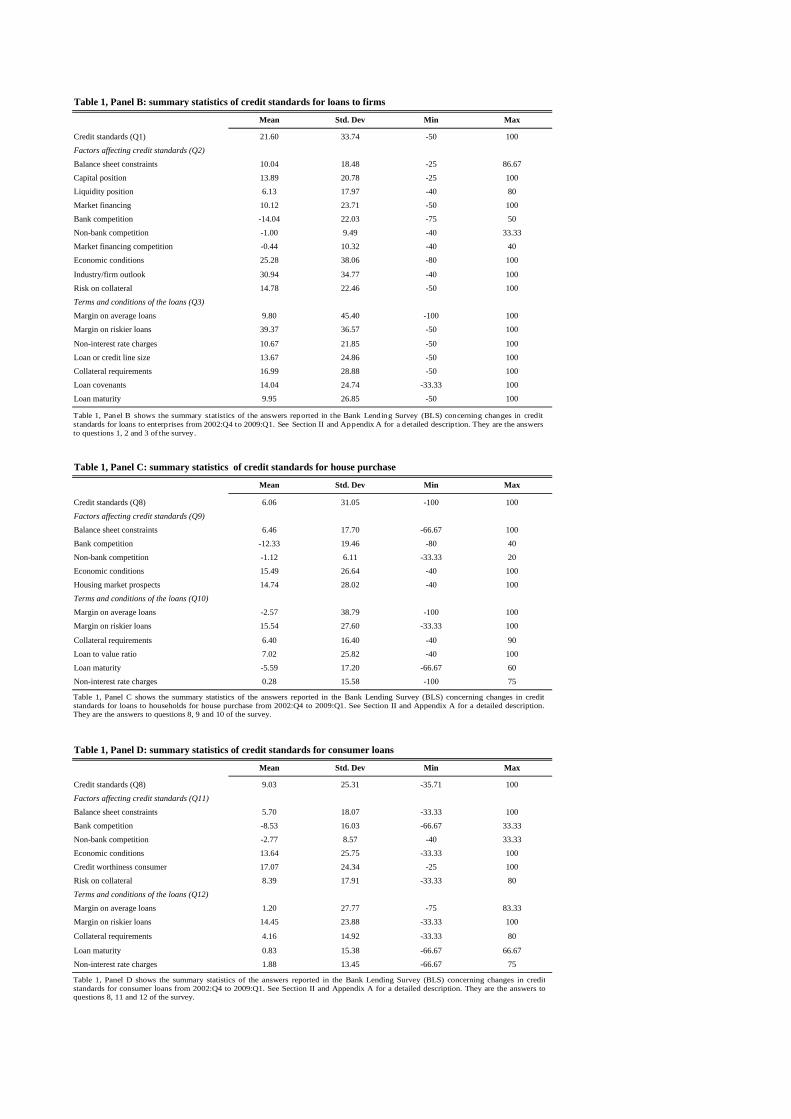
Table 1, Panel B: summary statistics of credit standards for loans to firms
Mean Std. Dev Min Max
Credit standards (Q1) 21.60 33.74 -50 100
Factors affecting credit standards (Q2)
Balance sheet constraints 10.04 18.48 -25 86.67
Capital position 13.89 20.78 -25 100
Liquidity position 6.13 17.97 -40 80
Market financing 10.12 23.71 -50 100
Bank competition -14.04 22.03 -75 50
Non-bank competition -1.00 9.49 -40 33.33
Market financing competition -0.44 10.32 -40 40
Economic conditions 25.28 38.06 -80 100
Industry/firm outlook 30.94 34.77 -40 100
Risk on collateral 14.78 22.46 -50 100
Terms and conditions of the loans (Q3)
Margin on average loans 9.80 45.40 -100 100
Margin on riskier loans 39.37 36.57 -50 100
Non-interest rate charges 10.67 21.85 -50 100
Loan or credit line size 13.67 24.86 -50 100
Collateral requirements 16.99 28.88 -50 100
Loan covenants 14.04 24.74 -33.33 100
Loan maturity 9.95 26.85 -50 100
Table 1, Panel C: summary statistics of credit standards for house purchase
Mean Std. Dev Min Max
Credit standards (Q8) 6.06 31.05 -100 100
Factors affecting credit standards (Q9)
Balance sheet constraints 6.46 17.70 -66.67 100
Bank competition -12.33 19.46 -80 40
Non-bank competition -1.12 6.11 -33.33 20
Economic conditions 15.49 26.64 -40 100
Housing market prospects 14.74 28.02 -40 100
Terms and conditions of the loans (Q10)
Margin on average loans -2.57 38.79 -100 100
Margin on riskier loans 15.54 27.60 -33.33 100
Collateral requirements 6.40 16.40 -40 90
Loan to value ratio 7.02 25.82 -40 100
Loan maturity -5.59 17.20 -66.67 60
Non-interest rate charges 0.28 15.58 -100 75
Table 1, Panel D: summary statistics of credit standards for consumer loans
Mean Std. Dev Min Max
Credit standards (Q8) 9.03 25.31 -35.71 100
Factors affecting credit standards (Q11)
Balance sheet constraints 5.70 18.07 -33.33 100
Bank competition -8.53 16.03 -66.67 33.33
Non-bank competition -2.77 8.57 -40 33.33
Economic conditions 13.64 25.75 -33.33 100
Credit worthiness consumer 17.07 24.34 -25 100
Risk on collateral 8.39 17.91 -33.33 80
Terms and conditions of the loans (Q12)
Margin on average loans 1.20 27.77 -75 83.33
Margin on riskier loans 14.45 23.88 -33.33 100
Collateral requirements 4.16 14.92 -33.33 80
Loan maturity 0.83 15.38 -66.67 66.67
Non-interest rate charges 1.88 13.45 -66.67 75
Table 1, Panel B shows the summary statistics of the answers reported in the Bank Lending Survey (BLS) concerning changes in credit standards for loans to enterprises from 2002:Q4 to 2009:Q1. See Section II and Appendix A for a detailed description. They are the answersto questions 1, 2 and 3 of the survey.
Table 1, Panel C shows the summary statistics of the answers reported in the Bank Lending Survey (BLS) concerning changes in credit standards for loans to households for house purchase from 2002:Q4 to 2009:Q1. See Section II and Appendix A for a detailed description. They are the answers to questions 8, 9 and 10 of the survey.
Table 1, Panel D shows the summary statistics of the answers reported in the Bank Lending Survey (BLS) concerning changes in credit standards for consumer loans from 2002:Q4 to 2009:Q1. See Section II and Appendix A for a detailed description. They are the answers to questions 8, 11 and 12 of the survey.
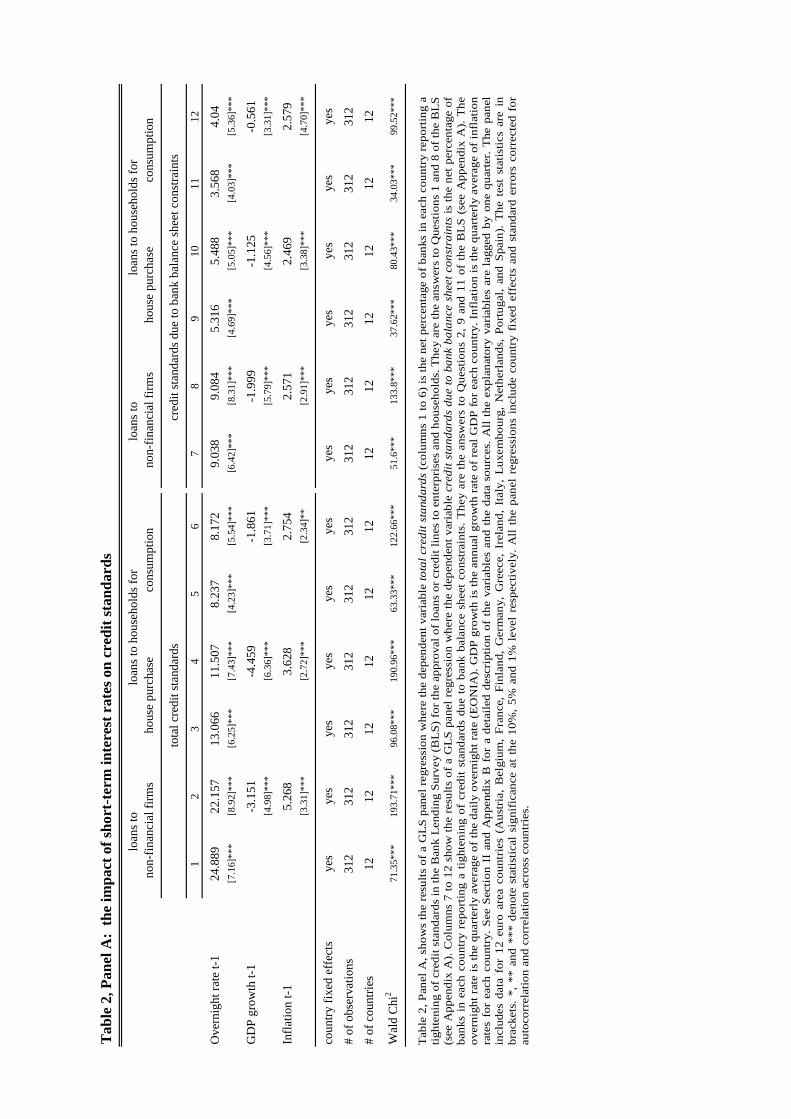
Tab
le 2
, Pan
el A
: th
e im
pact
of s
hort
-ter
m in
tere
st r
ates
on
cred
it st
anda
rds
12
34
56
78
910
1112
Ove
rnig
ht ra
te t-
124
.889
22.1
5713
.066
11.5
078.
237
8.17
29.
038
9.08
45.
316
5.48
83.
568
4.04
[7.1
6]**
*[8
.92]
***
[6.2
5]**
*[7
.43]
***
[4.2
3]**
*[5
.54]
***
[6.4
2]**
*[8
.31]
***
[4.6
9]**
*[5
.05]
***
[4.0
3]**
*[5
.36]
***
GD
P gr
owth
t-1
-3.1
51-4
.459
-1.8
61-1
.999
-1.1
25-0
.561
[4.9
8]**
*[6
.36]
***
[3.7
1]**
*[5
.79]
***
[4.5
6]**
*[3
.31]
***
Infla
tion
t-15.
268
3.62
82.
754
2.57
12.
469
2.57
9[3
.31]
***
[2.7
2]**
*[2
.34]
**[2
.91]
***
[3.3
8]**
*[4
.70]
***
coun
try fi
xed
effe
cts
yes
yes
yes
yes
yes
yes
yes
yes
yes
yes
yes
yes
# of
obs
erva
tions
312
312
312
312
312
312
312
312
312
312
312
312
# of
cou
ntrie
s12
1212
1212
1212
1212
1212
12
Wal
d C
hi2
71.3
5***
193.
71**
*96
.08*
**19
0.96
***
63.3
3***
122.
66**
*51
.6**
*13
3.8*
**37
.62*
**80
.43*
**34
.03*
**99
.52*
**
* si
gnifi
cant
at 1
0%; *
* si
gnifi
cant
at 5
%; *
** si
gnifi
cant
at 1
%
loan
s to
non-
finan
cial
firm
s
tota
l cre
dit s
tand
ards
hous
e pu
rcha
selo
ans t
o ho
useh
olds
for
hous
e pu
rcha
seco
nsum
ptio
nno
n-fin
anci
al fi
rms
cred
it st
anda
rds d
ue to
ban
k ba
lanc
e sh
eet c
onst
rain
ts
loan
s to
loan
s to
hous
ehol
ds fo
rco
nsum
ptio
n
Tab
le 2
, Pan
el A
, sho
ws
the
resu
lts o
f a
GL
S pa
nel r
egre
ssio
n w
here
the
depe
nden
t var
iabl
e to
tal c
redi
t sta
ndar
ds (
colu
mns
1 to
6)
is th
e ne
t per
cent
age
of b
anks
in e
ach
coun
try
repo
rtin
g a
tight
enin
g of
cre
dit s
tand
ards
in th
e B
ank
Len
ding
Sur
vey
(BL
S) f
or th
e ap
prov
al o
f loa
ns o
r cr
edit
lines
to e
nter
pris
es a
nd h
ouse
hold
s. T
hey
are
the
answ
ers
to Q
uest
ions
1 a
nd 8
of t
he B
LS
(see
App
endi
x A
). C
olum
ns 7
to 1
2 sh
ow th
e re
sults
of
a G
LS
pane
l reg
ress
ion
whe
re th
e de
pend
ent v
aria
ble
cred
it st
anda
rds
due
to b
ank
bala
nce
shee
t con
stra
ints
is th
e ne
t per
cent
age
of
bank
s in
eac
h co
untr
y re
port
ing
a tig
hten
ing
of c
redi
t st
anda
rds
due
to b
ank
bala
nce
shee
t co
nstr
aint
s. T
hey
are
the
answ
ers
to Q
uest
ions
2,
9 an
d 11
of
the
BL
S (s
ee A
ppen
dix
A).
The
ov
erni
ght r
ate
is th
e qu
arte
rly
aver
age
of th
e da
ily o
vern
ight
rat
e (E
ON
IA).
GD
P gr
owth
is th
e an
nual
gro
wth
rat
e of
rea
l GD
P fo
r ea
ch c
ount
ry. I
nfla
tion
is th
e qu
arte
rly
aver
age
of in
flat
ion
rate
s fo
r ea
ch c
ount
ry.
See
Sect
ion
II a
nd A
ppen
dix
B f
or a
det
aile
d de
scri
ptio
n of
the
var
iabl
es a
nd t
he d
ata
sour
ces.
All
the
expl
anat
ory
vari
able
s ar
e la
gged
by
one
quar
ter.
The
pan
el
incl
udes
dat
a fo
r 12
eur
o ar
ea c
ount
ries
(A
ustr
ia,
Bel
gium
, Fr
ance
, Fi
nlan
d, G
erm
any,
Gre
ece,
Ire
land
, It
aly,
Lux
embo
urg,
Net
herl
ands
, Po
rtug
al,
and
Spai
n).
The
tes
t st
atis
tics
are
in
brac
kets
. *,
**
and
***
deno
test
atis
tical
sig
nifi
canc
e at
the
10%
, 5%
and
1%
lev
el r
espe
ctiv
ely.
All
the
pane
l re
gres
sion
s in
clud
e co
untr
y fi
xed
effe
cts
and
stan
dard
err
ors
corr
ecte
d fo
rau
toco
rrel
atio
n an
d co
rrel
atio
n ac
ross
cou
ntri
es.
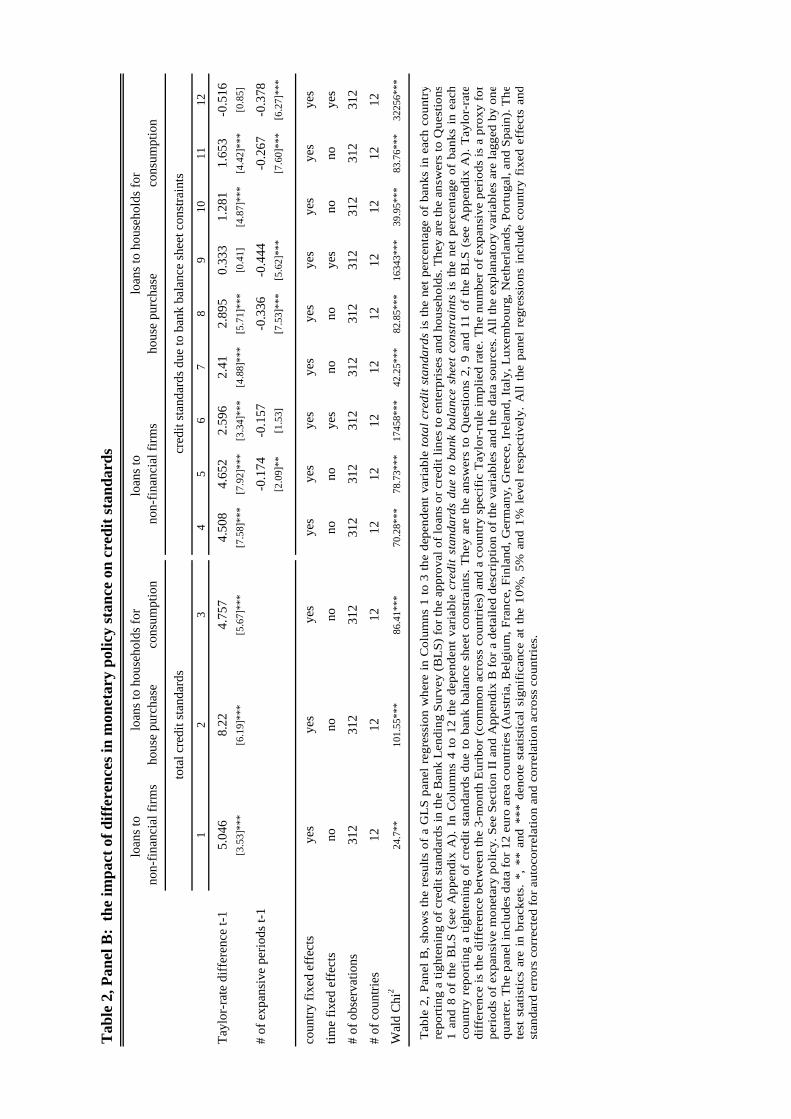
Tab
le 2
, Pan
el B
: th
e im
pact
of d
iffer
ence
s in
mon
etar
y po
licy
stan
ce o
n cr
edit
stan
dard
s
loan
s to
non-
finan
cial
firm
sho
use
purc
hase
cons
umpt
ion
12
34
56
78
910
1112
Tayl
or-r
ate
diff
eren
ce t-
15.
046
8.22
4.75
74.
508
4.65
22.
596
2.41
2.89
50.
333
1.28
11.
653
-0.5
16[3
.53]
***
[6.1
9]**
*[5
.67]
***
[7.5
8]**
*[7
.92]
***
[3.3
4]**
*[4
.88]
***
[5.7
1]**
*[0
.41]
[4.8
7]**
*[4
.42]
***
[0.8
5]
# of
exp
ansi
ve p
erio
ds t-
1-0
.174
-0.1
57-0
.336
-0.4
44-0
.267
-0.3
78[2
.09]
**[1
.53]
[7.5
3]**
*[5
.62]
***
[7.6
0]**
*[6
.27]
***
coun
try fi
xed
effe
cts
yes
yes
yes
yes
yes
yes
yes
yes
yes
yes
yes
yes
time
fixed
eff
ects
nono
nono
noye
sno
noye
sno
noye
s
# of
obs
erva
tions
312
312
312
312
312
312
312
312
312
312
312
312
# of
cou
ntrie
s12
1212
1212
1212
1212
1212
12
Wal
d C
hi2
24.7
**10
1.55
***
86.4
1***
70.2
8***
78.7
3***
1745
8***
42.2
5***
82.8
5***
1634
3***
39.9
5***
83.7
6***
3225
6***
loan
s to
hous
ehol
ds fo
rlo
ans t
o no
n-fin
anci
al fi
rms
loan
s to
hous
ehol
ds fo
rho
use
purc
hase
cons
umpt
ion
tota
l cre
dit s
tand
ards
cred
it st
anda
rds d
ue to
ban
k ba
lanc
e sh
eet c
onst
rain
ts
Tab
le 2
, Pan
el B
, sho
ws
the
resu
lts o
f a
GL
S pa
nel r
egre
ssio
n w
here
in C
olum
ns 1
to 3
the
depe
nden
t var
iabl
e to
tal c
redi
t sta
ndar
ds is
the
net p
erce
ntag
e of
ban
ks in
eac
h co
untr
yre
port
ing
a tig
hten
ing
of c
redi
t sta
ndar
ds in
the
Ban
k L
endi
ng S
urve
y (B
LS)
for t
he a
ppro
val o
f loa
ns o
r cre
dit l
ines
to e
nter
pris
es a
nd h
ouse
hold
s. T
hey
are
the
answ
ers
to Q
uest
ions
1 an
d 8
of t
he B
LS
(see
App
endi
x A
). In
Col
umns
4 t
o 12
the
dep
ende
nt v
aria
ble
cred
it st
anda
rds
due
to b
ank
bala
nce
shee
t co
nstr
aint
s is
the
net
per
cent
age
of b
anks
in
each
coun
try
repo
rtin
g a
tight
enin
g of
cre
dit
stan
dard
s du
e to
ban
k ba
lanc
e sh
eet
cons
trai
nts.
The
y ar
e th
e an
swer
s to
Que
stio
ns 2
, 9 a
nd 1
1 of
the
BL
S (s
ee A
ppen
dix
A).
Tay
lor-
rate
diff
eren
ce is
the
diff
eren
ce b
etw
een
the
3-m
onth
Eur
ibor
(co
mm
on a
cros
s co
untr
ies)
and
a c
ount
ry s
peci
fic
Tay
lor-
rule
impl
ied
rate
. The
num
ber
of e
xpan
sive
per
iods
is a
pro
xy f
orpe
riod
s of
exp
ansi
ve m
onet
ary
polic
y. S
ee S
ectio
n II
and
App
endi
x B
for
a d
etai
led
desc
ript
ion
of th
e va
riab
les
and
the
data
sou
rces
. All
the
expl
anat
ory
vari
able
s ar
e la
gged
by
one
quar
ter.
The
pan
el in
clud
es d
ata
for 1
2 eu
ro a
rea
coun
trie
s (A
ustr
ia, B
elgi
um, F
ranc
e, F
inla
nd, G
erm
any,
Gre
ece,
Irel
and,
Ital
y, L
uxem
bour
g, N
ethe
rlan
ds, P
ortu
gal,
and
Spai
n). T
hete
st s
tatis
tics
are
in b
rack
ets.
*,
** a
nd *
** d
enot
e st
atis
tical
sig
nifi
canc
e at
the
10%
, 5%
and
1%
lev
el r
espe
ctiv
ely.
All
the
pane
l re
gres
sion
s in
clud
e co
untr
y fi
xed
effe
cts
and
stan
dard
err
ors
corr
ecte
d fo
r aut
ocor
rela
tion
and
corr
elat
ion
acro
ss c
ount
ries
.
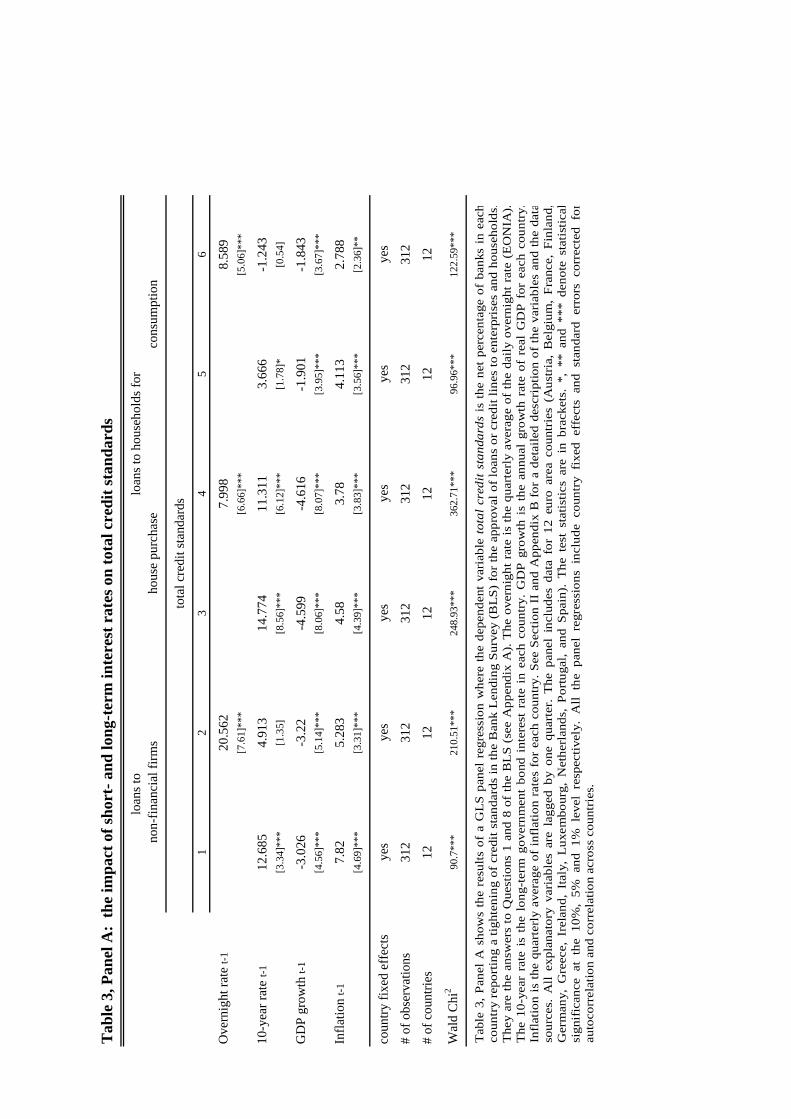
Tab
le 3
, Pan
el A
: th
e im
pact
of s
hort
- and
long
-ter
m in
tere
st r
ates
on
tota
l cre
dit s
tand
ards
12
34
56
Ove
rnig
ht ra
te t-
120
.562
7.99
88.
589
[7.6
1]**
*[6
.66]
***
[5.0
6]**
*
10-y
ear r
ate
t-112
.685
4.91
314
.774
11.3
113.
666
-1.2
43[3
.34]
***
[1.3
5][8
.56]
***
[6.1
2]**
*[1
.78]
*[0
.54]
GD
P gr
owth
t-1
-3.0
26-3
.22
-4.5
99-4
.616
-1.9
01-1
.843
[4.5
6]**
*[5
.14]
***
[8.0
6]**
*[8
.07]
***
[3.9
5]**
*[3
.67]
***
Infla
tion
t-17.
825.
283
4.58
3.78
4.11
32.
788
[4.6
9]**
*[3
.31]
***
[4.3
9]**
*[3
.83]
***
[3.5
6]**
*[2
.36]
**
coun
try fi
xed
effe
cts
yes
yes
yes
yes
yes
yes
# of
obs
erva
tions
312
312
312
312
312
312
# of
cou
ntrie
s12
1212
1212
12
Wal
d C
hi2
90.7
***
210.
51**
*24
8.93
***
362.
71**
*96
.96*
**12
2.59
***
loan
s to
hous
ehol
ds fo
r
tota
l cre
dit s
tand
ards
loan
s to
non-
finan
cial
firm
sho
use
purc
hase
cons
umpt
ion
Tab
le 3
, Pan
el A
sho
ws
the
resu
lts o
f a
GL
S pa
nel
regr
essi
on w
here
the
dep
ende
nt v
aria
ble
tota
l cr
edit
stan
dard
s is
the
net
per
cent
age
of b
anks
in
each
coun
try
repo
rtin
g a
tight
enin
g of
cre
dit s
tand
ards
in th
e B
ank
Len
ding
Sur
vey
(BL
S) f
or th
e ap
prov
al o
f loa
ns o
r cr
edit
lines
to e
nter
pris
es a
nd h
ouse
hold
s.T
hey
are
the
answ
ers
to Q
uest
ions
1 a
nd 8
of
the
BL
S (s
ee A
ppen
dix
A).
The
ove
rnig
ht r
ate
is th
e qu
arte
rly
aver
age
of th
e da
ily o
vern
ight
rat
e (E
ON
IA).
The
10-
year
rat
e is
the
lon
g-te
rm g
over
nmen
t bo
nd i
nter
est
rate
in
each
cou
ntry
. G
DP
grow
th i
s th
e an
nual
gro
wth
rat
e of
rea
l G
DP
for
each
cou
ntry
.In
flat
ion
is th
e qu
arte
rly
aver
age
of in
flat
ion
rate
s fo
r ea
ch c
ount
ry. S
ee S
ectio
n II
and
App
endi
x B
for
a d
etai
led
desc
ript
ion
of th
e va
riab
les
and
the
data
sour
ces.
All
expl
anat
ory
vari
able
s ar
e la
gged
by
one
quar
ter.
The
pan
el i
nclu
des
data
for
12
euro
are
a co
untr
ies
(Aus
tria
, B
elgi
um,
Fran
ce,
Finl
and,
Ger
man
y, G
reec
e, I
rela
nd,
Ital
y, L
uxem
bour
g, N
ethe
rlan
ds,
Port
ugal
, an
d Sp
ain)
. T
he t
est
stat
istic
s ar
e in
bra
cket
s. *
, **
and
***
den
ote
stat
istic
alsi
gnif
ican
ce a
t th
e 10
%,
5% a
nd 1
% l
evel
res
pect
ivel
y. A
ll th
e pa
nel
regr
essi
ons
incl
ude
coun
try
fixe
d ef
fect
s an
d st
anda
rd e
rror
s co
rrec
ted
for
auto
corr
elat
ion
and
corr
elat
ion
acro
ss c
ount
ries
.
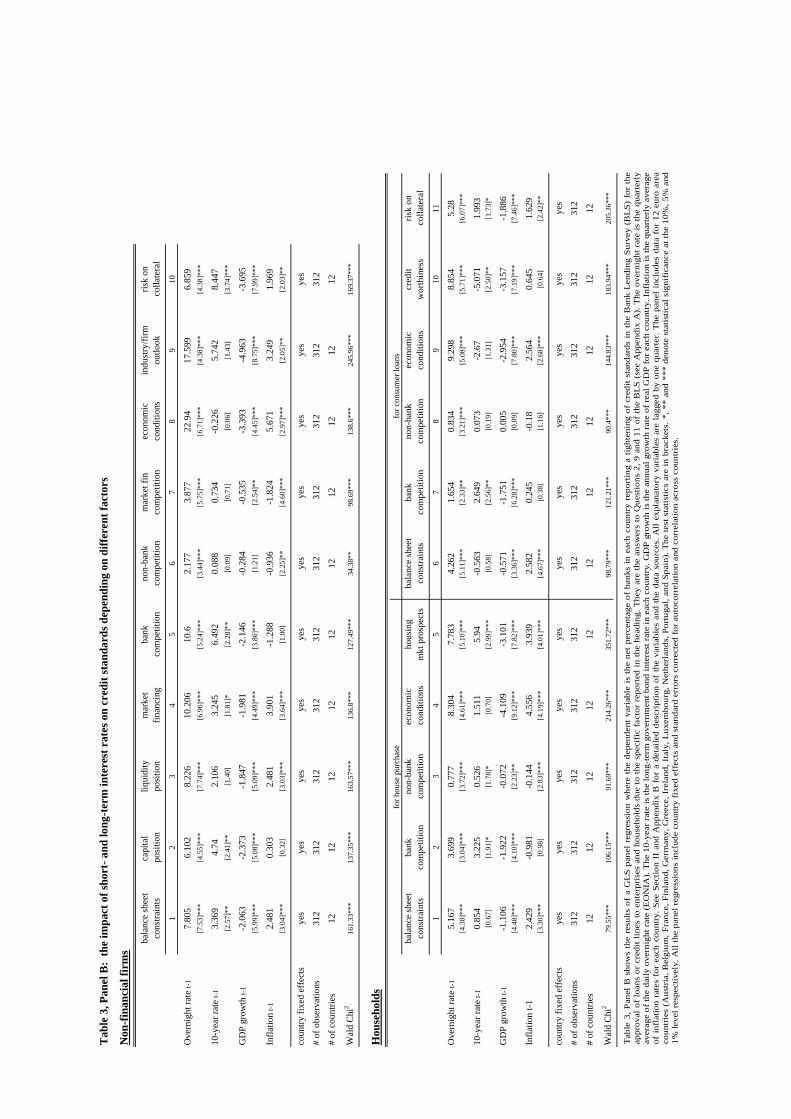
Tab
le 3
, Pan
el B
: th
e im
pact
of s
hort
- and
long
-ter
m in
tere
st r
ates
on
cred
it st
anda
rds d
epen
ding
on
diff
eren
t fac
tors
Non
-fin
anci
al fi
rms
bala
nce
shee
tca
pita
l liq
uidi
tym
arke
tba
nkno
n-ba
nkm
arke
t fin
econ
omic
indu
stry
/firm
risk
onco
nstra
ints
posi
tion
posi
tion
finan
cing
com
petit
ion
com
petit
ion
com
petit
ion
cond
ition
sou
tlook
colla
tera
l
12
34
56
78
910
Ove
rnig
ht ra
te t-
17.
805
6.10
28.
226
10.2
0610
.62.
177
3.87
722
.94
17.5
996.
859
[7.5
3]**
*[4
.55]
***
[7.7
4]**
*[6
.96]
***
[5.2
4]**
*[3
.44]
***
[5.7
5]**
*[6
.71]
***
[4.3
8]**
*[4
.38]
***
10-y
ear r
ate
t-13.
369
4.74
2.10
63.
245
6.49
20.
088
0.73
4-0
.226
5.74
28.
447
[2.5
7]**
[2.4
1]**
[1.4
0][1
.81]
*[2
.28]
**[0
.09]
[0.7
1][0
.06]
[1.4
3][3
.74]
***
GD
P gr
owth
t-1
-2.0
63-2
.373
-1.8
47-1
.981
-2.1
46-0
.284
-0.5
35-3
.393
-4.9
63-3
.695
[5.9
9]**
*[5
.08]
***
[5.0
9]**
*[4
.49]
***
[3.8
6]**
*[1
.21]
[2.5
4]**
[4.4
5]**
*[8
.75]
***
[7.9
9]**
*
Infla
tion
t-12.
481
0.30
32.
481
3.90
1-1
.288
-0.9
36-1
.824
5.67
13.
249
1.96
9[3
.04]
***
[0.3
2][3
.03]
***
[3.6
4]**
*[1
.00]
[2.2
5]**
[4.6
0]**
*[2
.97]
***
[2.0
5]**
[2.0
3]**
coun
try fi
xed
effe
cts
yes
yes
yes
yes
yes
yes
yes
yes
yes
yes
# of
obs
erva
tions
312
312
312
312
312
312
312
312
312
312
# of
cou
ntrie
s12
1212
1212
1212
1212
12
Wal
d C
hi2
161.
33**
*13
7.35
***
163.
57**
*13
6.8*
**12
7.49
***
34.3
8**
98.6
9***
138.
6***
245.
96**
*16
9.37
***
Hou
seho
lds
bala
nce
shee
tba
nkno
n-ba
nkec
onom
ic
hous
ing
bala
nce
shee
tba
nkno
n-ba
nkec
onom
iccr
edit
risk
onco
nstra
ints
com
petit
ion
com
petit
ion
cond
ition
sm
kt p
rosp
ects
cons
train
tsco
mpe
titio
nco
mpe
titio
nco
nditi
ons
wor
thin
ess
colla
tera
l
12
34
56
78
910
11
Ove
rnig
ht ra
te t-
15.
167
3.69
90.
777
8.30
47.
783
4.26
21.
654
0.83
49.
298
8.85
45.
28[4
.38]
***
[3.0
4]**
*[3
.72]
***
[4.6
1]**
*[5
.10]
***
[5.1
1]**
*[2
.33]
**[3
.21]
***
[5.0
8]**
*[5
.71]
***
[6.0
7]**
*
10-y
ear r
ate
t-10.
854
3.22
50.
526
1.51
15.
94-0
.563
2.64
90.
073
-2.6
7-5
.071
1.99
3[0
.67]
[1.9
1]*
[1.7
8]*
[0.7
0][2
.99]
***
[0.5
8][2
.56]
**[0
.19]
[1.3
1][2
.50]
**[1
.73]
*
GD
P gr
owth
t-1
-1.1
06-1
.922
-0.0
72-4
.109
-3.1
01-0
.571
-1.7
510.
005
-2.9
54-3
.157
-1.8
86[4
.48]
***
[4.1
0]**
*[2
.23]
**[9
.12]
***
[7.8
2]**
*[3
.36]
***
[6.2
8]**
*[0
.09]
[7.8
0]**
*[7
.19]
***
[7.4
6]**
*
Infla
tion
t-12.
429
-0.9
81-0
.144
4.55
63.
939
2.58
20.
245
-0.1
82.
564
0.64
51.
629
[3.3
0]**
*[0
.98]
[2.8
3]**
*[4
.19]
***
[4.0
1]**
*[4
.67]
***
[0.3
8][1
.16]
[2.6
8]**
*[0
.64]
[2.4
2]**
coun
try fi
xed
effe
cts
yes
yes
yes
yes
yes
yes
yes
yes
yes
yes
yes
# of
obs
erva
tions
312
312
312
312
312
312
312
312
312
312
312
# of
cou
ntrie
s12
1212
1212
1212
1212
1212
Wal
d C
hi2
79.5
5***
106.
15**
*91
.69*
**21
4.26
***
351.
72**
*98
.79*
**12
1.21
***
90.4
***
144.
83**
*18
3.94
***
205.
36**
*
for h
ouse
pur
chas
efo
r con
sum
er lo
ans
Tab
le 3
, Pan
el B
sho
ws
the
resu
lts o
f a
GL
S pa
nel
regr
essi
on w
here
the
dep
ende
nt v
aria
ble
is t
he n
et p
erce
ntag
e of
ban
ks i
n ea
ch c
ount
ry r
epor
ting
a tig
hten
ing
of c
redi
t st
anda
rds
in t
he B
ank
Len
ding
Sur
vey
(BL
S)fo
r th
e ap
prov
al o
f lo
ans
or c
redi
t lin
es to
ent
erpr
ises
and
hou
seho
lds
due
to t
he s
peci
fic
fact
or r
epor
ted
in th
e he
adin
g. T
hey
are
the
answ
ers
to Q
uest
ions
2, 9
and
11
of t
he B
LS
(see
App
endi
x A
). T
he o
vern
ight
rat
e is
the
quar
terl
y av
erag
e of
the
daily
ove
rnig
ht r
ate
(EO
NIA
). T
he 1
0-ye
ar r
ate
is th
e lo
ng-t
erm
gov
ernm
ent b
ond
inte
rest
rat
e in
eac
h co
untr
y. G
DP
gro
wth
is th
e an
nual
gro
wth
rat
e of
rea
l GD
P fo
r ea
ch c
ount
ry. I
nfla
tion
is th
e qu
arte
rly
aver
age
of i
nfla
tion
rate
s fo
r ea
ch c
ount
ry. S
ee S
ectio
n II
and
App
endi
x B
for
a d
etai
led
desc
ript
ion
of t
he v
aria
bles
and
the
dat
a so
urce
s. A
ll ex
plan
ator
y va
riab
les
are
lagg
ed b
y on
e qu
arte
r. T
he p
anel
inc
lude
s da
ta f
or 1
2 eu
ro a
rea
coun
trie
s (A
ustr
ia, B
elgi
um, F
ranc
e, F
inla
nd, G
erm
any,
Gre
ece,
Ire
land
, Ita
ly, L
uxem
bour
g, N
ethe
rlan
ds, P
ortu
gal,
and
Spai
n). T
he te
st s
tatis
tics
are
in b
rack
ets.
*, *
* an
d **
* de
note
stat
istic
al s
igni
fica
nce
at th
e 10
%, 5
% a
nd
1% le
vel r
espe
ctiv
ely.
All
the
pane
l reg
ress
ions
incl
ude
coun
try
fixe
d ef
fect
s an
d st
anda
rd e
rror
s co
rrec
ted
for
auto
corr
elat
ion
and
corr
elat
ion
acro
ss c
ount
ries
.
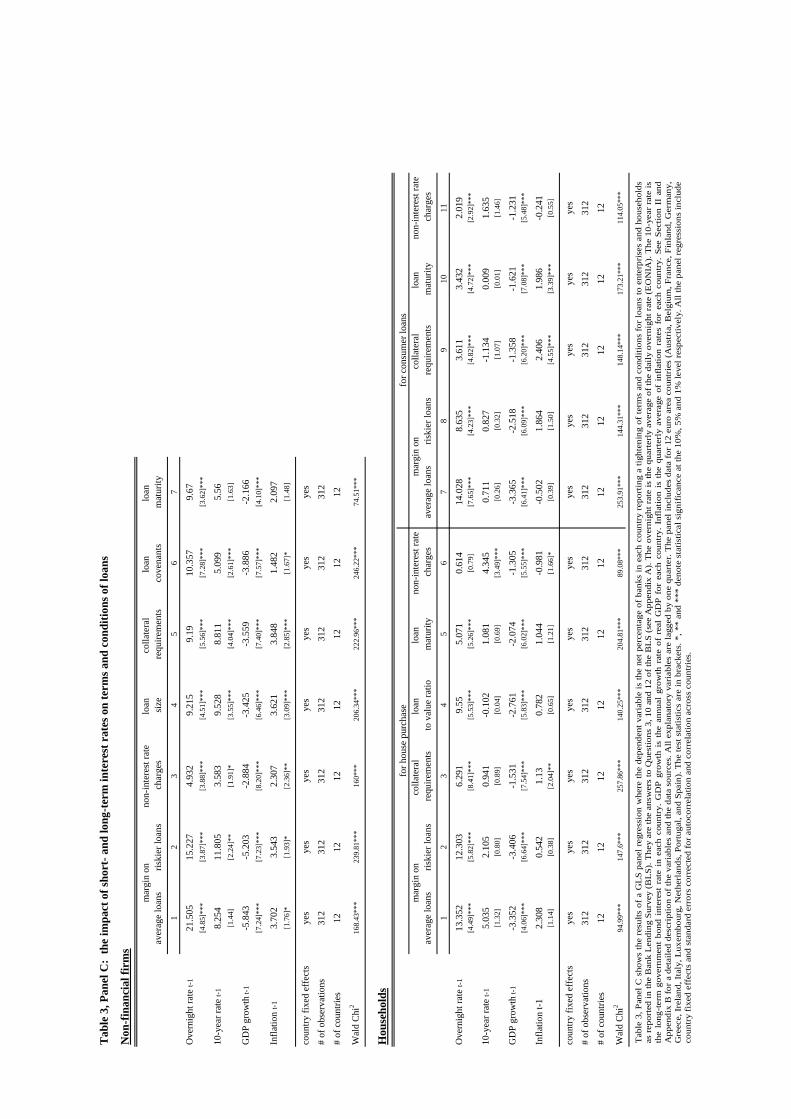
Tab
le 3
, Pan
el C
: th
e im
pact
of s
hort
- and
long
-ter
m in
tere
st r
ates
on
term
s and
con
ditio
ns o
f loa
ns
Non
-fin
anci
al fi
rms
non-
inte
rest
rate
loan
co
llate
ral
loan
lo
an
aver
age
loan
sris
kier
loan
s c
harg
essi
zere
quire
men
tsco
vena
nts
mat
urity
12
34
56
7
Ove
rnig
ht ra
te t-
121
.505
15.2
274.
932
9.21
59.
1910
.357
9.67
[4.8
5]**
*[3
.87]
***
[3.8
8]**
*[4
.51]
***
[5.5
6]**
*[7
.28]
***
[3.6
2]**
*
10-y
ear r
ate
t-18.
254
11.8
053.
583
9.52
88.
811
5.09
95.
56[1
.44]
[2.2
4]**
[1.9
1]*
[3.5
5]**
*[4
.04]
***
[2.6
1]**
*[1
.63]
GD
P gr
owth
t-1
-5.8
43-5
.203
-2.8
84-3
.425
-3.5
59-3
.886
-2.1
66[7
.24]
***
[7.2
3]**
*[8
.20]
***
[6.4
6]**
*[7
.40]
***
[7.5
7]**
*[4
.10]
***
Infla
tion
t-13.
702
3.54
32.
307
3.62
13.
848
1.48
22.
097
[1.7
6]*
[1.9
3]*
[2.3
6]**
[3.0
9]**
*[2
.85]
***
[1.6
7]*
[1.4
8]
coun
try fi
xed
effe
cts
yes
yes
yes
yes
yes
yes
yes
# of
obs
erva
tions
312
312
312
312
312
312
312
# of
cou
ntrie
s12
1212
1212
1212
Wal
d C
hi2
168.
43**
*23
9.81
***
160*
**20
6.34
***
222.
96**
*24
6.22
***
74.5
1***
Hou
seho
lds
colla
tera
l lo
an
loan
no
n-in
tere
st ra
teco
llate
ral
loan
no
n-in
tere
st ra
teav
erag
e lo
ans
riski
er lo
ans
requ
irem
ents
to v
alue
ratio
mat
urity
cha
rges
aver
age
loan
sris
kier
loan
sre
quire
men
tsm
atur
ity c
harg
es
12
34
56
78
910
11
Ove
rnig
ht ra
te t-
113
.352
12.3
036.
291
9.55
5.07
10.
614
14.0
288.
635
3.61
13.
432
2.01
9[4
.49]
***
[5.8
2]**
*[8
.41]
***
[5.5
3]**
*[5
.26]
***
[0.7
9][7
.65]
***
[4.2
3]**
*[4
.82]
***
[4.7
2]**
*[2
.92]
***
10-y
ear r
ate
t-15.
035
2.10
50.
941
-0.1
021.
081
4.34
50.
711
0.82
7-1
.134
0.00
91.
635
[1.3
2][0
.80]
[0.8
9][0
.04]
[0.6
9][3
.49]
***
[0.2
6][0
.32]
[1.0
7][0
.01]
[1.4
6]
GD
P gr
owth
t-1
-3.3
52-3
.406
-1.5
31-2
.761
-2.0
74-1
.305
-3.3
65-2
.518
-1.3
58-1
.621
-1.2
31[4
.06]
***
[6.6
4]**
*[7
.54]
***
[5.8
3]**
*[6
.02]
***
[5.5
5]**
*[6
.41]
***
[6.0
9]**
*[6
.20]
***
[7.0
8]**
*[5
.48]
***
Infla
tion
t-12.
308
0.54
21.
130.
782
1.04
4-0
.981
-0.5
021.
864
2.40
61.
986
-0.2
41[1
.14]
[0.3
8][2
.04]
**[0
.65]
[1.2
1][1
.66]
*[0
.39]
[1.5
0][4
.55]
***
[3.3
9]**
*[0
.55]
coun
try fi
xed
effe
cts
yes
yes
yes
yes
yes
yes
yes
yes
yes
yes
yes
# of
obs
erva
tions
312
312
312
312
312
312
312
312
312
312
312
# of
cou
ntrie
s12
1212
1212
1212
1212
1212
Wal
d C
hi2
94.9
9***
147.
6***
257.
86**
*14
0.25
***
204.
81**
*89
.08*
**25
3.91
***
144.
31**
*14
8.14
***
173.
21**
*11
4.05
***
for c
onsu
mer
loan
s
mar
gin
on
for h
ouse
pur
chas
em
argi
n on
mar
gin
on
Tab
le 3
, Pan
el C
sho
ws
the
resu
lts o
f a
GL
S pa
nel r
egre
ssio
n w
here
the
depe
nden
t var
iabl
e is
the
net p
erce
ntag
e of
ban
ks in
eac
h co
untr
y re
port
ing
a tig
hten
ing
of te
rms
and
cond
ition
s fo
r lo
ans
to e
nter
pris
es a
nd h
ouse
hold
s as
repo
rted
in th
e B
ank
Len
ding
Sur
vey
(BL
S). T
hey
are
the
answ
ers
to Q
uest
ions
3, 1
0 an
d 12
of t
he B
LS
(see
App
endi
x A
). T
he o
vern
ight
rate
is th
e qu
arte
rly
aver
age
of th
e da
ily o
vern
ight
rate
(EO
NIA
). Th
e 10
-yea
r rat
e is
th
e lo
ng-t
erm
gov
ernm
ent
bond
int
eres
t ra
te i
n ea
ch c
ount
ry.
GD
P gr
owth
is
the
annu
al g
row
th r
ate
of r
eal
GD
P fo
r ea
ch c
ount
ry.
Infl
atio
n is
the
qua
rter
ly a
vera
ge o
f in
flatio
n ra
tes
for
each
cou
ntry
. Se
e Se
ctio
n II
an d
A
ppen
dix
B fo
r a
deta
iled
desc
ript
ion
of th
e va
riab
les
and
the
data
sou
rces
. All
expl
anat
ory
vari
able
sar
e la
gged
by
one
quar
ter.
The
pan
el in
clud
es d
ata
for
12 e
uro
area
cou
ntri
es (
Aus
tria
, Bel
gium
, Fra
nce,
Fin
land
, Ger
man
y,G
reec
e, Ir
elan
d, It
aly,
Lux
embo
urg,
Net
herl
ands
, Por
tuga
l, an
d Sp
ain)
. The
test
sta
tistic
s ar
e in
bra
cket
s. *
, **
and
***
deno
te s
tatis
tical
sig
nific
ance
at t
he 1
0%, 5
% a
nd 1
% le
vel r
espe
ctiv
ely.
All
the
pane
l reg
ress
ions
incl
ude
coun
try
fixe
d ef
fect
s an
d st
anda
rd e
rror
s co
rrec
ted
for a
utoc
orre
latio
n an
d co
rrel
atio
n ac
ross
cou
ntri
es.
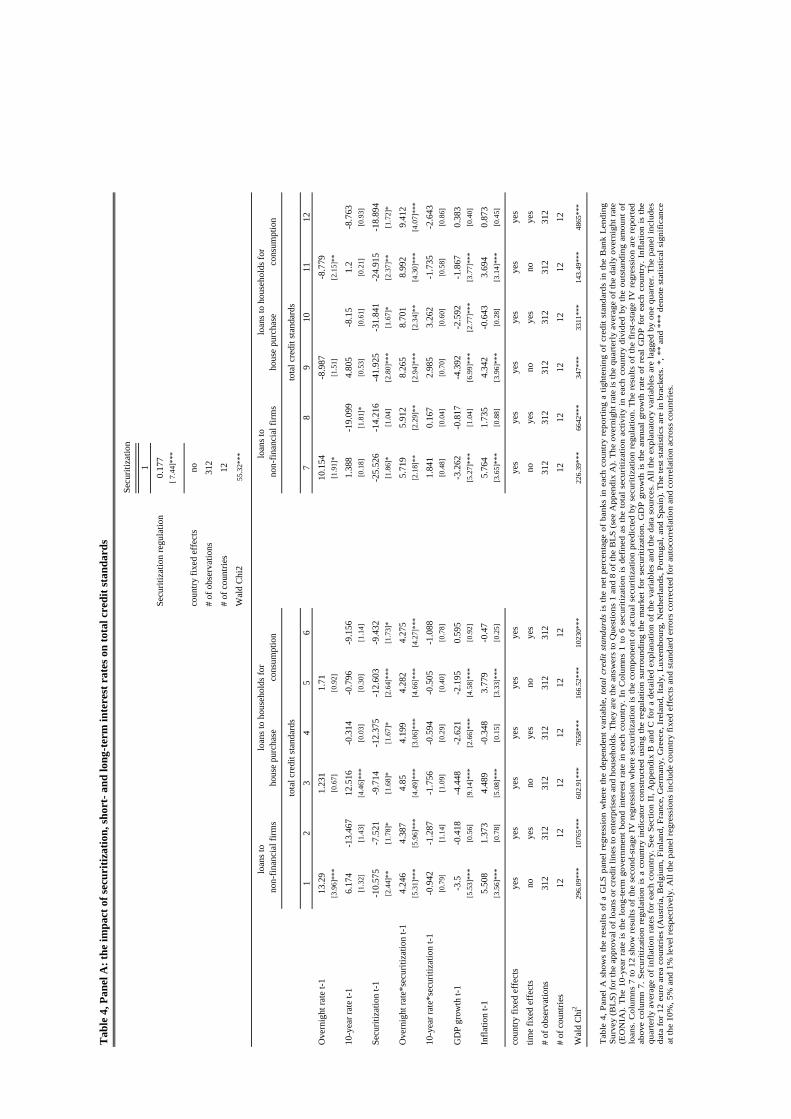
Tab
le 4
, Pan
el A
: the
impa
ct o
f sec
uriti
zatio
n, sh
ort-
and
long
-ter
m in
tere
st r
ates
on
tota
l cre
dit s
tand
ards
Secu
ritiz
atio
n
1Se
curit
izat
ion
regu
latio
n0.
177
[ 7.4
4]**
*
coun
try fi
xed
effe
cts
no#
of o
bser
vatio
ns31
2#
of c
ount
ries
12W
ald
Chi
2 5
5.32
***
12
34
56
78
910
1112
Ove
rnig
ht ra
te t-
113
.29
1.23
11.
7110
.154
-8.9
87-8
.779
[3.9
6]**
*[0
.67]
[0.9
2][1
.91]
*[1
.51]
[2.1
5]**
10-y
ear r
ate
t-16.
174
-13.
467
12.5
16-0
.314
-0.7
96-9
.156
1.38
8-1
9.09
94.
805
-8.1
51.
2-8
.763
[1.3
2][1
.43]
[4.4
6]**
*[0
.03]
[0.3
0][1
.14]
[0.1
8][1
.81]
*[0
.53]
[0.6
1][0
.21]
[0.9
3]
Secu
ritiz
atio
n t-1
-10.
575
-7.5
21-9
.714
-12.
375
-12.
603
-9.4
32-2
5.52
6-1
4.21
6-4
1.92
5-3
1.84
1-2
4.91
5-1
8.89
4[2
.44]
**[1
.78]
*[1
.68]
*[1
.67]
*[2
.64]
***
[1.7
3]*
[1.8
6]*
[1.0
4][2
.80]
***
[1.6
7]*
[2.3
7]**
[1.7
2]*
Ove
rnig
ht ra
te*s
ecur
itiza
tion
t-14.
246
4.38
74.
854.
199
4.28
24.
275
5.71
95.
912
8.26
58.
701
8.99
29.
412
[5.3
1]**
*[5
.96]
***
[4.4
9]**
*[3
.06]
***
[4.6
6]**
*[4
.27]
***
[2.1
8]**
[2.2
9]**
[2.9
4]**
*[2
.34]
**[4
.30]
***
[4.0
7]**
*
10-y
ear r
ate*
secu
ritiz
atio
n t-1
-0.9
42-1
.287
-1.7
56-0
.594
-0.5
05-1
.088
1.84
10.
167
2.98
53.
262
-1.7
35-2
.643
[0.7
9][1
.14]
[1.0
9][0
.29]
[0.4
0][0
.78]
[0.4
8][0
.04]
[0.7
0][0
.60]
[0.5
8][0
.86]
GD
P gr
owth
t-1
-3.5
-0.4
18-4
.448
-2.6
21-2
.195
0.59
5-3
.262
-0.8
17-4
.392
-2.5
92-1
.867
0.38
3[5
.53]
***
[0.5
6][9
.14]
***
[2.6
6]**
*[4
.58]
***
[0.9
2][5
.27]
***
[1.0
4][6
.99]
***
[2.7
7]**
*[3
.77]
***
[0.4
0]
Infla
tion
t-15.
508
1.37
34.
489
-0.3
483.
779
-0.4
75.
764
1.73
54.
342
-0.6
433.
694
0.87
3[3
.56]
***
[0.7
8][5
.08]
***
[0.1
5][3
.33]
***
[0.2
5][3
.65]
***
[0.8
8][3
.96]
***
[0.2
8][3
.14]
***
[0.4
5]
coun
try fi
xed
effe
cts
yes
yes
yes
yes
yes
yes
yes
yes
yes
yes
yes
yes
time
fixed
eff
ects
noye
sno
yes
noye
sno
yes
noye
sno
yes
# of
obs
erva
tions
312
312
312
312
312
312
312
312
312
312
312
312
# of
cou
ntrie
s12
1212
1212
1212
1212
1212
12
Wal
d C
hi2
296.
09**
*10
765*
**60
2.91
***
7658
***
166.
52**
*10
230*
**22
6.39
***
6642
***
347*
**33
11**
*14
3.49
***
4865
***
hous
e pu
rcha
seco
nsum
ptio
n
tota
l cre
dit s
tand
ards
tota
l cre
dit s
tand
ards
loan
s to
hous
ehol
ds fo
rlo
ans t
o no
n-fin
anci
al fi
rms
loan
s to
hous
ehol
ds fo
rlo
ans t
o no
n-fin
anci
al fi
rms
hous
e pu
rcha
seco
nsum
ptio
n
Tab
le 4
, Pan
el A
sho
ws
the
resu
lts o
f a
GLS
pan
el r
egre
ssio
n w
here
the
depe
nden
t va
riab
le, t
otal
cre
dit s
tand
ards
is t
he n
et p
erce
ntag
e of
ban
ks in
eac
h co
untr
yre
port
ing
a tig
hten
ing
of c
redi
t sta
ndar
ds i
n th
e B
ank
Len
ding
Su
rvey
(BL
S) fo
r the
app
rova
l of l
oans
or c
redi
t lin
es to
ent
erpr
ises
and
hou
seho
lds.
The
y ar
e th
e an
swer
s to
Que
stio
ns 1
and
8 o
f the
BL
S (s
ee A
ppen
dix
A).
The
over
nigh
t rat
e is
the
quar
terl
y av
erag
e of
the
daily
ove
rnig
ht ra
te
(EO
NIA
). Th
e 10
-yea
r ra
te i
s th
e lo
ng-t
erm
gov
ernm
ent
bond
int
eres
t ra
te i
n ea
ch c
ount
ry. I
n C
olum
ns 1
to
6 se
curi
tizat
ion
is d
efin
ed a
sth
e to
tal s
ecur
itiza
tion
activ
ity in
eac
h co
untr
y di
vide
d by
the
out
stan
ding
am
ount
of
loan
s. C
olum
ns 7
to 1
2 sh
ow r
esul
ts o
f th
e se
cond
-sta
ge I
V r
egre
ssio
n w
here
sec
uriti
zatio
n is
the
com
pone
nt o
f ac
tual
sec
uriti
zatio
n pr
edic
ted
by s
ecur
itiza
tion
regu
latio
n. T
he r
esul
ts o
f th
e fir
st-s
tage
IV
reg
ress
ion
are
repo
rte d
abov
e co
lum
n 7.
Sec
uriti
zatio
n re
gula
tion
is a
cou
ntry
ind
icat
or c
onst
ruct
ed u
sing
the
reg
ulat
ion
surr
ound
ing
the
mar
ket
for
secu
ritiz
atio
n. G
DP
grow
th i
s th
e an
nual
gro
wth
rat
e of
rea
l G
DP
for
each
cou
ntry
. Inf
latio
n is
the
qu
arte
rly
aver
age
of in
flatio
n ra
tes
for
each
cou
ntry
. See
Sec
tion
II, A
ppen
dix
B a
nd C
for
a de
taile
d ex
plan
atio
n of
the
vari
able
s an
d th
e da
ta s
ourc
es. A
ll th
e ex
plan
ator
y va
riab
les
are
lagg
ed b
y on
e qu
arte
r. T
he p
anel
incl
udes
da
ta fo
r 12
eur
o ar
ea c
ount
ries
(Aus
tria
, Bel
gium
, Fin
land
, Fra
nce,
Ger
man
y, G
reec
e, I
rela
nd, I
taly
, Lux
embo
urg,
Net
herl
ands
, Por
tuga
l, an
d Sp
ain)
. The
test
sta
tistic
s ar
e in
bra
cket
s. *
, **
and
***
deno
test
atis
tical
sig
nific
ance
at
the
10%
, 5%
and
1%
leve
l res
pect
ivel
y. A
ll th
e pa
nel r
egre
ssio
ns in
clud
e co
untr
y fi
xed
effe
cts
and
stan
dard
err
ors
corr
ecte
d fo
r aut
ocor
rela
tion
and
corr
elat
ion
acro
ss c
ount
ries
.
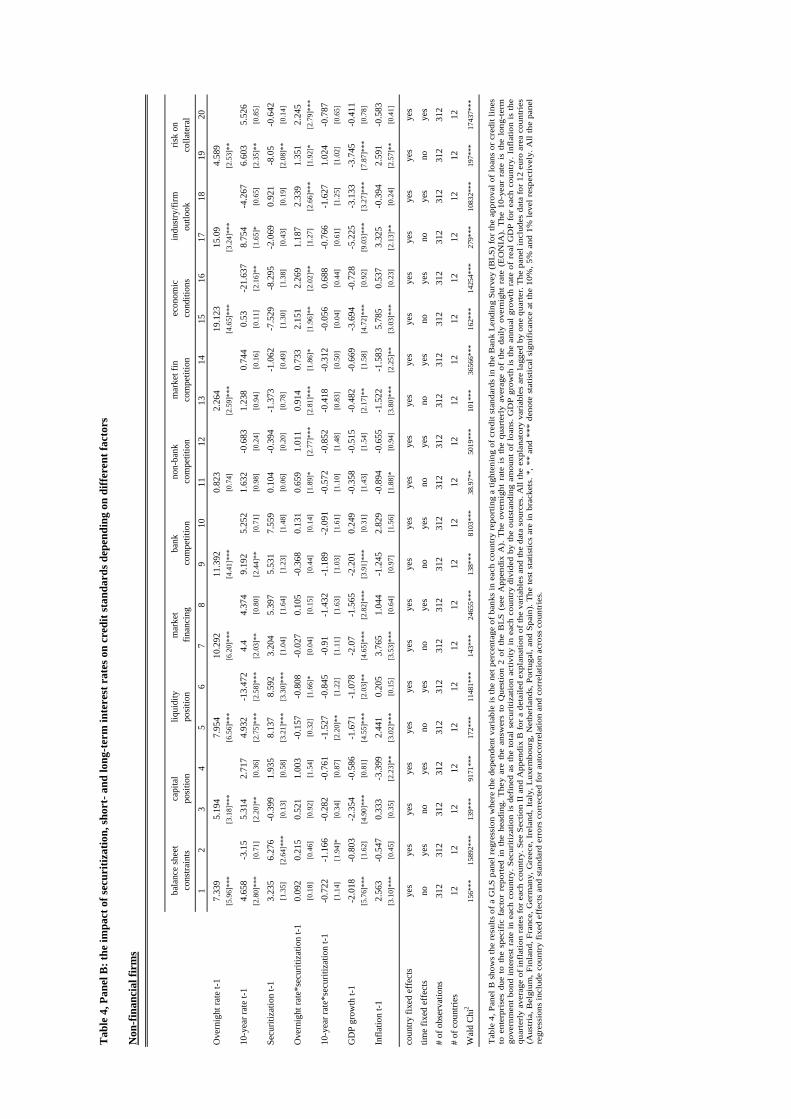
Tab
le 4
, Pan
el B
: the
impa
ct o
f sec
uriti
zatio
n, sh
ort-
and
long
-ter
m in
tere
st r
ates
on
cred
it st
anda
rds d
epen
ding
on
diff
eren
t fac
tors
Non
-fin
anci
al fi
rms
12
34
56
78
910
1112
1314
1516
1718
1920
Ove
rnig
ht ra
te t-
17.
339
5.19
47.
954
10.2
9211
.392
0.82
32.
264
19.1
2315
.09
4.58
9[5
.96]
***
[3.1
8]**
*[6
.56]
***
[6.2
0]**
*[4
.41]
***
[0.7
4][2
.59]
***
[4.6
5]**
*[3
.24]
***
[2.5
3]**
10-y
ear r
ate
t-14.
658
-3.1
55.
314
2.71
74.
932
-13.
472
4.4
4.37
49.
192
5.25
21.
632
-0.6
831.
238
0.74
40.
53-2
1.63
78.
754
-4.2
676.
603
5.52
6[2
.80]
***
[0.7
1][2
.20]
**[0
.36]
[2.7
5]**
*[2
.58]
***
[2.0
3]**
[0.8
0][2
.44]
**[0
.71]
[0.9
8][0
.24]
[0.9
4][0
.16]
[0.1
1][2
.16]
**[1
.65]
*[0
.65]
[2.3
5]**
[0.8
5]
Secu
ritiz
atio
n t-1
3.23
56.
276
-0.3
991.
935
8.13
78.
592
3.20
45.
397
5.53
17.
559
0.10
4-0
.394
-1.3
73-1
.062
-7.5
29-8
.295
-2.0
690.
921
-8.0
5-0
.642
[1.3
5][2
.64]
***
[0.1
3][0
.58]
[3.2
1]**
*[3
.30]
***
[1.0
4][1
.64]
[1.2
3][1
.48]
[0.0
6][0
.20]
[0.7
8][0
.49]
[1.3
0][1
.38]
[0.4
3][0
.19]
[2.0
8]**
[0.1
4]
Ove
rnig
ht ra
te*s
ecur
itiza
tion
t-10.
092
0.21
50.
521
1.00
3-0
.157
-0.8
08-0
.027
0.10
5-0
.368
0.13
10.
659
1.01
10.
914
0.73
32.
151
2.26
91.
187
2.33
91.
351
2.24
5[0
.18]
[0.4
6][0
.92]
[1.5
4][0
.32]
[1.6
6]*
[0.0
4][0
.15]
[0.4
4][0
.14]
[1.8
9]*
[2.7
7]**
*[2
.81]
***
[1.8
6]*
[1.9
6]**
[2.0
2]**
[1.2
7][2
.66]
***
[1.9
2]*
[2.7
9]**
*
10-y
ear r
ate*
secu
ritiz
atio
n t-1
-0.7
22-1
.166
-0.2
82-0
.761
-1.5
27-0
.845
-0.9
1-1
.432
-1.1
89-2
.091
-0.5
72-0
.852
-0.4
18-0
.312
-0.0
560.
688
-0.7
66-1
.627
1.02
4-0
.787
[1.1
4][1
.94]
*[0
.34]
[0.8
7][2
.20]
**[1
.22]
[1.1
1][1
.63]
[1.0
3][1
.61]
[1.1
0][1
.48]
[0.8
3][0
.50]
[0.0
4][0
.44]
[0.6
1][1
.25]
[1.0
2][0
.65]
GD
P gr
owth
t-1
-2.0
18-0
.803
-2.3
54-0
.586
-1.6
71-1
.078
-2.0
7-1
.565
-2.2
010.
249
-0.3
58-0
.515
-0.4
82-0
.669
-3.6
94-0
.728
-5.2
25-3
.133
-3.7
45-0
.411
[5.7
6]**
*[1
.62]
[4.9
0]**
*[0
.81]
[4.5
5]**
*[2
.03]
**[4
.65]
***
[2.8
2]**
*[3
.91]
***
[0.3
1][1
.43]
[1.5
4][2
.17]
**[1
.58]
[4.7
2]**
*[0
.92]
[9.0
3]**
*[3
.27]
***
[7.8
7]**
*[0
.78]
Infla
tion
t-12.
563
-0.5
470.
333
-3.3
992.
441
0.20
53.
765
1.04
4-1
.245
2.82
9-0
.894
-0.6
55-1
.522
-1.5
835.
785
0.53
73.
325
-0.3
942.
591
-0.5
83[3
.10]
***
[0.4
5][0
.35]
[2.2
3]**
[3.0
2]**
*[0
.15]
[3.5
3]**
*[0
.64]
[0.9
7][1
.56]
[1.8
8]*
[0.9
4][3
.80]
***
[2.2
5]**
[3.0
3]**
*[0
.23]
[2.1
3]**
[0.2
4][2
.57]
**[0
.41]
coun
try fi
xed
effe
cts
yes
yes
yes
yes
yes
yes
yes
yes
yes
yes
yes
yes
yes
yes
yes
yes
yes
yes
yes
yes
time
fixed
eff
ects
noye
sno
yes
noye
sno
yes
noye
sno
yes
noye
sno
yes
noye
sno
yes
# of
obs
erva
tions
312
312
312
312
312
312
312
312
312
312
312
312
312
312
312
312
312
312
312
312
# of
cou
ntrie
s12
1212
1212
1212
1212
1212
1212
1212
1212
1212
12
Wal
d C
hi2
156*
**15
892*
**13
9***
9171
***
172*
**11
481*
**14
3***
2465
5***
138*
**81
03**
*38
.97*
*50
19**
*10
1***
3656
6***
162*
**14
254*
**27
9***
1083
2***
197*
**17
437*
**
cond
ition
sou
tlook
colla
tera
lec
onom
icin
dust
ry/fi
rmris
k on
bala
nce
shee
tca
pita
lliq
uidi
tym
arke
tco
nstra
ints
posi
tion
posi
tion
finan
cing
com
petit
ion
bank
non-
bank
mar
ket f
inco
mpe
titio
nco
mpe
titio
n
Tab
le 4
, Pan
el B
sho
ws
the
resu
lts o
f a
GL
S pa
nel r
egre
ssio
n w
here
the
depe
nden
t var
iabl
e is
the
net p
erce
ntag
e of
ban
ks in
eac
h co
untr
yre
port
ing
a tig
hten
ing
of c
redi
t sta
ndar
ds in
the
Ban
k L
endi
ng S
urve
y (B
LS)
for
the
appr
oval
of
loan
s or
cre
dit l
ines
to e
nter
pris
es d
ue t
o th
e sp
ecif
ic f
acto
r re
port
ed i
n th
e he
adin
g. T
hey
are
the
answ
ers
to Q
uest
ion
2 of
the
BL
S (s
ee A
ppen
dix
A).
The
ove
rnig
ht r
ate
is t
he q
uart
erly
ave
rage
of
the
daily
ove
rnig
ht r
ate
(EO
NIA
). T
he 1
0-ye
ar r
ate
is t
he l
ong-
ter m
go
vern
men
t bo
nd in
tere
st r
ate
in e
ach
coun
try.
Sec
uriti
zatio
n is
def
ined
as
the
tota
l se
curi
tizat
ion
activ
ity i
n ea
ch c
ount
ry d
ivid
ed b
y th
e ou
tsta
ndin
g am
ount
of
loan
s. G
DP
grow
th i
s th
e an
nual
gro
wth
rat
e of
rea
l G
DP
for
each
cou
ntry
. Inf
latio
n is
th e
qu
arte
rly
aver
age
of in
flat
ion
rate
s fo
r ea
ch c
ount
ry. S
ee S
ectio
n II
and
App
endi
x B
for
a de
taile
d ex
plan
atio
n of
the
vari
able
s an
d th
e da
ta s
ourc
es. A
ll th
e ex
plan
ator
y va
riab
les
are
lagg
ed b
y on
e qu
arte
r. T
he p
anel
incl
udes
dat
a fo
r 12
eur
o ar
ea c
ount
ries
(Aus
tria
, Bel
gium
, Fin
land
, Fra
nce,
Ger
man
y, G
reec
e, I
rela
nd, I
taly
, Lux
embo
urg,
Net
herl
ands
, Por
tuga
l, an
d Sp
ain)
. The
test
sta
tistic
s ar
e in
bra
cket
s. *
, **
and
***
deno
test
atis
tical
sig
nifi
canc
e at
the
10%
, 5%
and
1%
leve
l res
pect
ivel
y. A
ll th
e pa
nel
regr
essi
ons
incl
ude
coun
try
fixe
d ef
fect
s an
d st
anda
rd e
rror
s co
rrec
ted
for
auto
corr
elat
ion
and
corr
elat
ion
acro
ss c
ount
ries
.
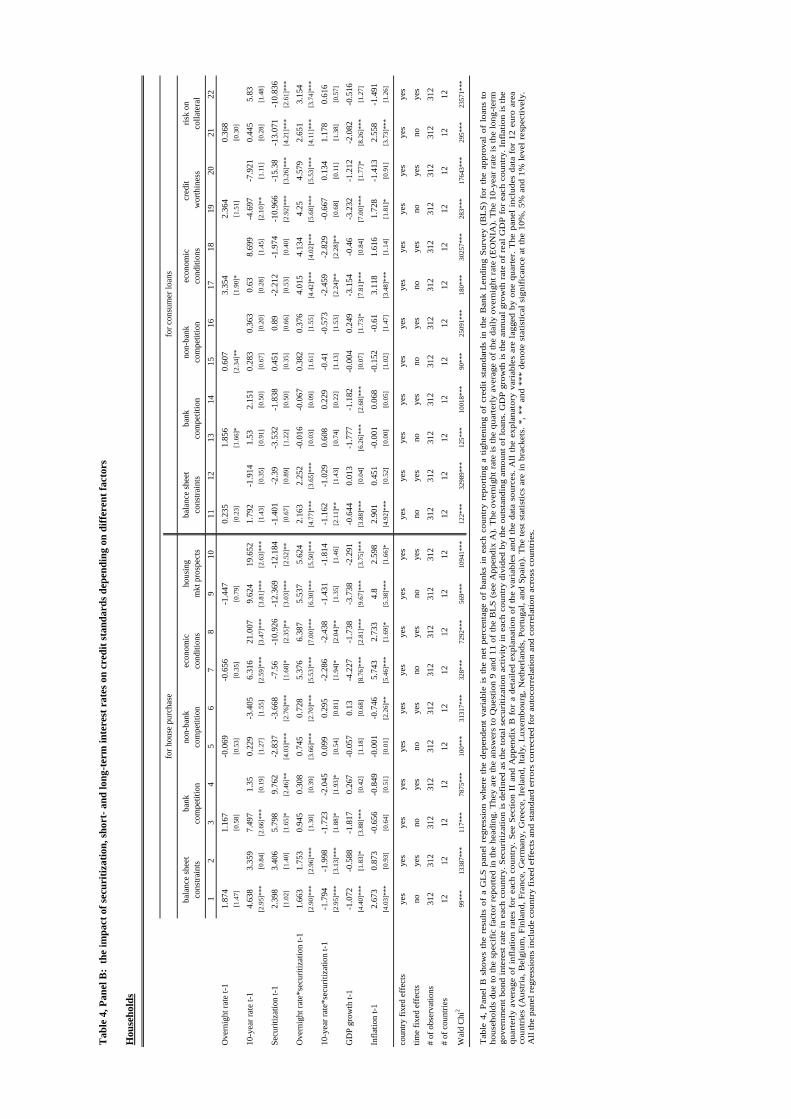
Tab
le 4
, Pan
el B
: th
e im
pact
of s
ecur
itiza
tion,
shor
t- a
nd lo
ng-t
erm
inte
rest
rat
es o
n cr
edit
stan
dard
s dep
endi
ng o
n di
ffer
ent f
acto
rs
Hou
seho
lds
12
34
56
78
910
1112
1314
1516
1718
1920
2122
Ove
rnig
ht ra
te t-
11.
874
1.16
7-0
.069
-0.6
56-1
.447
0.23
51.
856
0.60
73.
354
2.36
40.
368
[1.4
7][0
.58]
[0.5
3][0
.35]
[0.7
9][0
.23]
[1.6
6]*
[2.3
4]**
[1.9
0]*
[1.5
1][0
.30]
10-y
ear r
ate
t-14.
638
3.35
97.
497
1.35
0.22
9-3
.405
6.31
621
.007
9.62
419
.652
1.79
2-1
.914
1.53
2.15
10.
283
0.36
30.
638.
699
-4.6
97-7
.921
0.44
55.
83[2
.95]
***
[0.8
4][2
.66]
***
[0.1
9][1
.27]
[1.5
5][2
.59]
***
[3.4
7]**
*[3
.81]
***
[2.6
3]**
*[1
.43]
[0.3
5][0
.91]
[0.5
0][0
.67]
[0.2
0][0
.28]
[1.4
5][2
.10]
**[1
.11]
[0.2
8][1
.48]
Secu
ritiz
atio
n t-1
2.39
83.
406
5.79
89.
762
-2.8
37-3
.668
-7.5
6-1
0.92
6-1
2.36
9-1
2.18
4-1
.401
-2.3
9-3
.532
-1.8
380.
451
0.89
-2.2
12-1
.974
-10.
966
-15.
38-1
3.07
1-1
0.83
6[1
.02]
[1.4
0][1
.65]
*[2
.46]
**[4
.03]
***
[2.7
6]**
*[1
.68]
*[2
.35]
**[3
.03]
***
[2.5
2]**
[0.6
7][0
.89]
[1.2
2][0
.50]
[0.3
5][0
.66]
[0.5
3][0
.40]
[2.9
2]**
*[3
.26]
***
[4.2
1]**
*[2
.61]
***
Ove
rnig
ht ra
te*s
ecur
itiza
tion
t-11.
663
1.75
30.
945
0.30
80.
745
0.72
85.
376
6.38
75.
537
5.62
42.
163
2.25
2-0
.016
-0.0
670.
382
0.37
64.
015
4.13
44.
254.
579
2.65
13.
154
[2.9
0]**
*[2
.96]
***
[1.3
0][0
.39]
[3.6
6]**
*[2
.70]
***
[5.5
3]**
*[7
.00]
***
[6.3
0]**
*[5
.50]
***
[4.7
7]**
*[3
.65]
***
[0.0
3][0
.09]
[1.6
1][1
.55]
[4.4
2]**
*[4
.02]
***
[5.6
8]**
*[5
.53]
***
[4.1
1]**
*[3
.74]
***
10-y
ear r
ate*
secu
ritiz
atio
n t-1
-1.7
94-1
.998
-1.7
23-2
.045
0.09
90.
295
-2.2
86-2
.438
-1.4
31-1
.814
-1.1
62-1
.029
0.60
80.
229
-0.4
1-0
.573
-2.4
59-2
.829
-0.6
670.
134
1.17
80.
616
[2.9
5]**
*[3
.13]
***
[1.8
8]*
[1.9
3]*
[0.5
4][0
.81]
[1.9
4]*
[2.0
4]**
[1.3
5][1
.46]
[2.1
1]**
[1.4
3][0
.74]
[0.2
2][1
.13]
[1.5
3][2
.24]
**[2
.28]
**[0
.68]
[0.1
1][1
.38]
[0.5
7]
GD
P gr
owth
t-1
-1.0
72-0
.588
-1.8
170.
267
-0.0
570.
13-4
.227
-1.7
38-3
.738
-2.2
91-0
.644
0.01
3-1
.777
-1.1
82-0
.004
0.24
9-3
.154
-0.4
6-3
.232
-1.2
12-2
.082
-0.5
16[4
.40]
***
[1.8
3]*
[3.8
8]**
*[0
.42]
[1.1
8][0
.68]
[8.7
6]**
*[2
.81]
***
[9.6
7]**
*[3
.75]
***
[3.8
8]**
*[0
.04]
[6.2
6]**
*[2
.68]
***
[0.0
7][1
.73]
*[7
.81]
***
[0.8
4][7
.00]
***
[1.7
7]*
[8.2
6]**
*[1
.27]
Infla
tion
t-12.
673
0.87
3-0
.656
-0.8
49-0
.001
-0.7
465.
743
2.73
34.
82.
598
2.90
10.
451
-0.0
010.
068
-0.1
52-0
.61
3.11
81.
616
1.72
8-1
.413
2.55
8-1
.491
[4.0
3]**
*[0
.93]
[0.6
4][0
.51]
[0.0
1][2
.26]
**[5
.46]
***
[1.6
9]*
[5.3
8]**
*[1
.66]
*[4
.92]
***
[0.5
2][0
.00]
[0.0
5][1
.02]
[1.4
7][3
.48]
***
[1.1
4][1
.81]
*[0
.91]
[3.7
3]**
*[1
.26]
coun
try fi
xed
effe
cts
yes
yes
yes
yes
yes
yes
yes
yes
yes
yes
yes
yes
yes
yes
yes
yes
yes
yes
yes
yes
yes
yes
time
fixed
eff
ects
noye
sno
yes
noye
sno
yes
noye
sno
yes
noye
sno
yes
noye
sno
yes
noye
s#
of o
bser
vatio
ns31
231
231
231
231
231
231
231
231
231
231
231
231
231
231
231
231
231
231
231
231
231
2#
of c
ount
ries
1212
1212
1212
1212
1212
1212
1212
1212
1212
1212
1212
Wal
d C
hi2
99**
*13
387*
**11
7***
7875
***
100*
**31
317*
**32
8***
7292
***
569*
**10
941*
**12
2***
3298
9***
125*
**10
018*
**90
***
2509
1***
180*
**30
257*
**28
3***
1764
3***
295*
**23
571*
**
bala
nce
shee
tco
nstra
ints
bank
com
petit
ion
non-
bank
com
petit
ion
econ
omic
cond
ition
sho
usin
gm
kt p
rosp
ects
wor
thin
ess
bala
nce
shee
tba
nkno
n-ba
nkris
k on
colla
tera
l
for h
ouse
pur
chas
efo
r con
sum
er lo
ans
econ
omic
cred
it co
nstra
ints
com
petit
ion
com
petit
ion
cond
ition
s
Tab
le 4
, Pa
nel
B s
how
s th
e re
sults
of
a G
LS
pane
l re
gres
sion
whe
re t
he d
epen
dent
var
iabl
e is
the
net
per
cent
age
of b
anks
in
each
cou
ntry
rep
ortin
g a
tight
enin
g of
cre
dit
stan
dard
s in
the
Ban
k L
endi
ng S
urve
y (B
LS)
for
the
app
rova
l of
loa
ns t
oho
useh
olds
due
to th
e sp
ecif
ic f
acto
r re
port
ed in
the
head
ing.
The
y ar
e th
e an
swer
s to
Que
stio
n 9
and
11 o
f th
e B
LS
(see
App
endi
x A
). T
he o
vern
ight
rat
e is
the
quar
terl
y av
erag
e of
the
daily
ove
rnig
ht r
ate
(EO
NIA
). T
he 1
0-ye
ar r
ate
is th
e lo
ng-t
erm
go
vern
men
t bon
d in
tere
st r
ate
in e
ach
coun
try.
Sec
uriti
zatio
n is
def
ined
as
the
tota
l sec
uriti
zatio
n ac
tivity
in e
ach
coun
try
divi
ded
by th
e ou
tsta
ndin
g am
ount
of
loan
s. G
DP
grow
th is
the
annu
al g
row
th r
ate
of r
eal G
DP
for
each
cou
ntry
. Inf
latio
n is
the
quar
terl
y av
erag
e of
inf
latio
n ra
tes
for
each
cou
ntry
. See
Sec
tion
II a
nd A
ppen
dix
B f
or a
det
aile
d ex
plan
atio
n of
the
var
iabl
es a
nd t
he d
ata
sour
ces.
All
the
expl
anat
ory
vari
able
s ar
e la
gged
by
one
quar
ter.
The
pan
el i
nclu
des
data
for
12
euro
are
aco
untr
ies
(Aus
tria
, Bel
gium
, Fin
land
, Fra
nce,
Ger
man
y, G
reec
e, I
rela
nd, I
taly
, Lux
embo
urg,
Net
herl
ands
, Por
tuga
l, an
d Sp
ain)
. The
test
sta
tistic
s ar
e in
bra
cket
s. *
, **
and
***
deno
test
atis
tical
sig
nifi
canc
e at
the
10%
, 5%
and
1%
leve
l res
pect
ivel
y.
All
the
pane
l reg
ress
ions
incl
ude
coun
try
fixe
d ef
fect
s an
d st
anda
rd e
rror
s co
rrec
ted
for
auto
corr
elat
ion
and
corr
elat
ion
acro
ss c
ount
ries
.
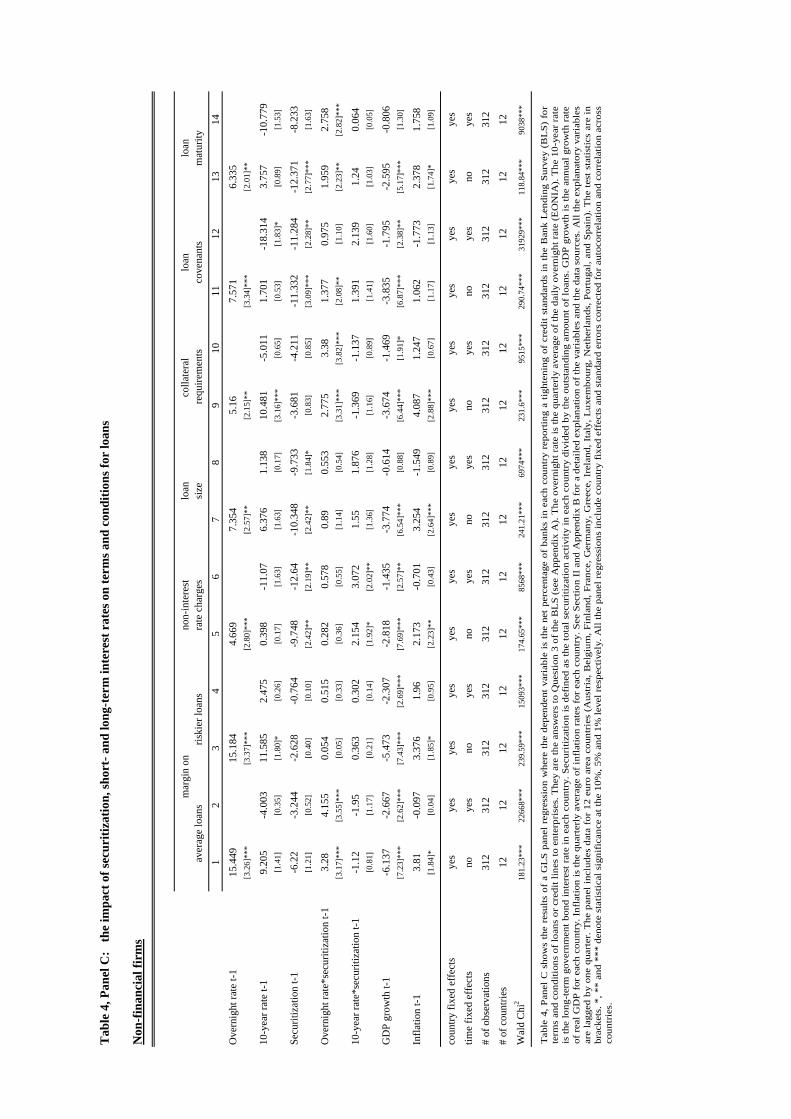
Tab
le 4
, Pan
el C
: th
e im
pact
of s
ecur
itiza
tion,
shor
t- a
nd lo
ng-t
erm
inte
rest
rat
es o
n te
rms a
nd c
ondi
tions
for
loan
s
Non
-fin
anci
al fi
rms
12
34
56
78
910
1112
1314
Ove
rnig
ht ra
te t-
115
.449
15.1
844.
669
7.35
45.
167.
571
6.33
5[3
.26]
***
[3.3
7]**
*[2
.80]
***
[2.5
7]**
[2.1
5]**
[3.3
4]**
*[2
.01]
**
10-y
ear r
ate
t-19.
205
-4.0
0311
.585
2.47
50.
398
-11.
076.
376
1.13
810
.481
-5.0
111.
701
-18.
314
3.75
7-1
0.77
9[1
.41]
[0.3
5][1
.80]
*[0
.26]
[0.1
7][1
.63]
[1.6
3][0
.17]
[3.1
6]**
*[0
.65]
[0.5
3][1
.83]
*[0
.89]
[1.5
3]
Secu
ritiz
atio
n t-1
-6.2
2-3
.244
-2.6
28-0
.764
-9.7
48-1
2.64
-10.
348
-9.7
33-3
.681
-4.2
11-1
1.33
2-1
1.28
4-1
2.37
1-8
.233
[1.2
1][0
.52]
[0.4
0][0
.10]
[2.4
2]**
[2.1
9]**
[2.4
2]**
[1.8
4]*
[0.8
3][0
.85]
[3.0
9]**
*[2
.28]
**[2
.77]
***
[1.6
3]
Ove
rnig
ht ra
te*s
ecur
itiza
tion
t-13.
284.
155
0.05
40.
515
0.28
20.
578
0.89
0.55
32.
775
3.38
1.37
70.
975
1.95
92.
758
[3.1
7]**
*[3
.55]
***
[0.0
5][0
.33]
[0.3
6][0
.55]
[1.1
4][0
.54]
[3.3
1]**
*[3
.82]
***
[2.0
8]**
[1.1
0][2
.23]
**[2
.82]
***
10-y
ear r
ate*
secu
ritiz
atio
n t-1
-1.1
2-1
.95
0.36
30.
302
2.15
43.
072
1.55
1.87
6-1
.369
-1.1
371.
391
2.13
91.
240.
064
[0.8
1][1
.17]
[0.2
1][0
.14]
[1.9
2]*
[2.0
2]**
[1.3
6][1
.28]
[1.1
6][0
.89]
[1.4
1][1
.60]
[1.0
3][0
.05]
GD
P gr
owth
t-1
-6.1
37-2
.667
-5.4
73-2
.307
-2.8
18-1
.435
-3.7
74-0
.614
-3.6
74-1
.469
-3.8
35-1
.795
-2.5
95-0
.806
[7.2
3]**
*[2
.62]
***
[7.4
3]**
*[2
.69]
***
[7.6
9]**
*[2
.57]
**[6
.54]
***
[0.8
8][6
.44]
***
[1.9
1]*
[6.8
7]**
*[2
.38]
**[5
.17]
***
[1.3
0]
Infla
tion
t-13.
81-0
.097
3.37
61.
962.
173
-0.7
013.
254
-1.5
494.
087
1.24
71.
062
-1.7
732.
378
1.75
8[1
.84]
*[0
.04]
[1.8
5]*
[0.9
5][2
.23]
**[0
.43]
[2.6
4]**
*[0
.89]
[2.8
8]**
*[0
.67]
[1.1
7][1
.13]
[1.7
4]*
[1.0
9]
coun
try fi
xed
effe
cts
yes
yes
yes
yes
yes
yes
yes
yes
yes
yes
yes
yes
yes
yes
time
fixed
eff
ects
noye
sno
yes
noye
sno
yes
noye
sno
yes
noye
s#
of o
bser
vatio
ns31
231
231
231
231
231
231
231
231
231
231
231
231
231
2#
of c
ount
ries
1212
1212
1212
1212
1212
1212
1212
Wal
d C
hi2
181.
23**
*22
668*
**23
9.59
***
1509
3***
174.
65**
*85
68**
*24
1.21
***
6974
***
231.
6***
9515
***
290.
74**
*31
929*
**11
8.84
***
9038
***
rate
cha
rges
size
mar
gin
onre
quire
men
tsco
vena
nts
mat
urity
colla
tera
l lo
anlo
anav
erag
e lo
ans
riski
er lo
ans
non-
inte
rest
loan
Tab
le 4
, Pan
el C
sho
ws
the
resu
lts o
f a
GL
S pa
nel r
egre
ssio
n w
here
the
dep
ende
nt v
aria
ble
is t
he n
et p
erce
ntag
e of
ban
ks i
n ea
ch c
ount
ryre
port
ing
a tig
hten
ing
of c
redi
t st
anda
rds
in th
e B
ank
Len
ding
Sur
vey
(BL
S) f
or
term
s an
d co
nditi
ons
of lo
ans
or c
redi
t lin
es to
ent
erpr
ises
. The
y ar
e th
e an
swer
s to
Que
stio
n 3
of th
e B
LS
(see
App
endi
x A
). T
he o
vern
ight
rat
e is
the
quar
terl
y av
erag
e of
the
daily
ove
rnig
ht ra
te (E
ON
IA).
The
10-
year
rat
e is
the
long
-ter
m g
over
nmen
t bon
d in
tere
st r
ate
in e
ach
coun
try.
Sec
uriti
zatio
n is
def
ined
as
the
tota
l sec
uriti
zatio
n ac
tivity
in e
ach
coun
try
divi
ded
by th
e ou
tsta
ndin
g am
ount
of
loan
s.G
DP
grow
th is
the
annu
al g
row
th r
ate
of re
al G
DP
for
each
cou
ntry
. Inf
latio
n is
the
quar
terl
y av
erag
e of
infl
atio
n ra
tes
for
each
cou
ntry
. See
Sec
tion
II a
nd A
ppen
dix
B fo
r a
deta
iled
expl
anat
ion
of th
e va
riab
les
and
the
data
sou
rces
. All
the
expl
anat
ory
vari
able
s ar
e la
gged
by
one
quar
ter.
The
pan
el in
clud
es d
ata
for
12 e
uro
area
cou
ntri
es (
Aus
tria
, Bel
gium
, Fin
land
, Fra
nce,
Ger
man
y, G
reec
e, I
rela
nd, I
taly
, Lux
embo
urg,
Net
herl
ands
, Por
tuga
l, an
d Sp
ain)
. The
test
sta
tistic
s ar
e in
br
acke
ts. *
, **
and
***
deno
te s
tatis
tical
sig
nifi
canc
e at
the
10%
, 5%
and
1%
leve
l res
pect
ivel
y. A
ll th
e pa
nel r
egre
ssio
ns in
clud
e co
untr
y fi
xed
effe
cts
and
stan
dard
erro
rs c
orre
cted
for
auto
corr
elat
ion
and
corr
elat
ion
acro
ss
coun
trie
s.
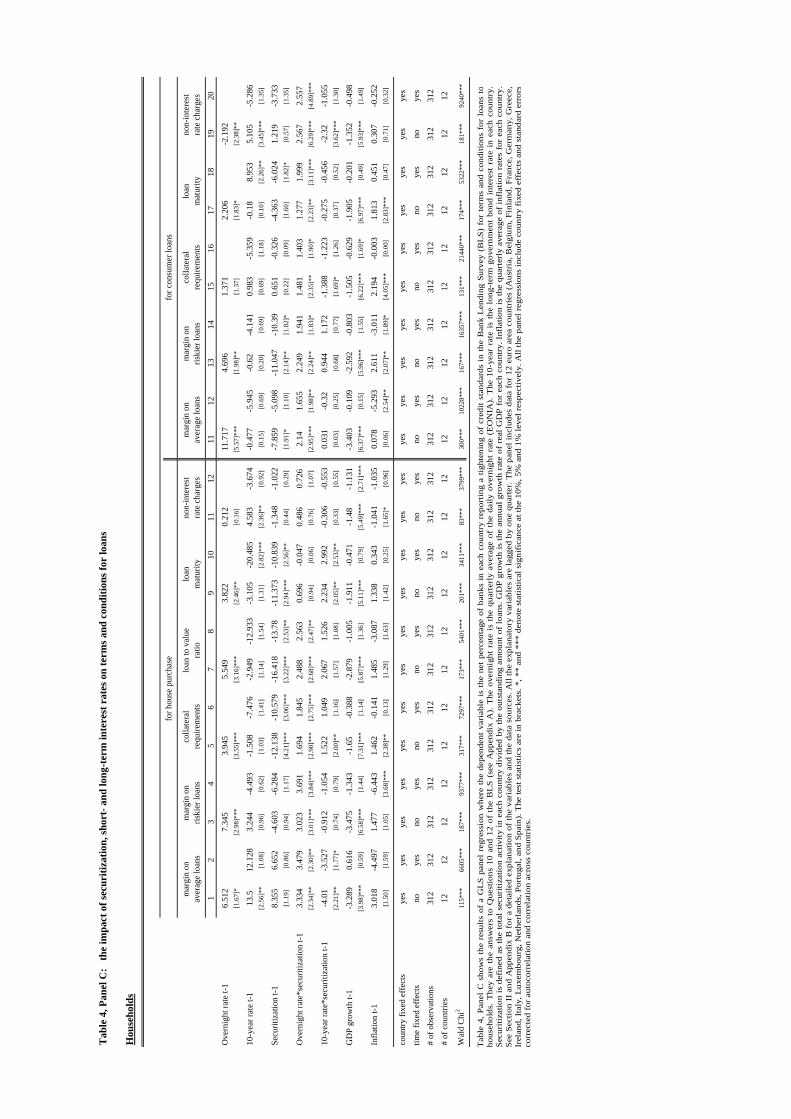
Tab
le 4
, Pan
el C
: th
e im
pact
of s
ecur
itiza
tion,
shor
t- a
nd lo
ng-t
erm
inte
rest
rat
es o
n te
rms a
nd c
ondi
tions
for
loan
s
Hou
seho
lds
12
34
56
78
910
1112
1112
1314
1516
1718
1920
Ove
rnig
ht ra
te t-
16.
512
7.34
53.
945
5.54
93.
822
0.21
211
.717
4.69
61.
371
2.20
6-2
.192
[1.6
7]*
[2.9
8]**
*[3
.55]
***
[3.1
6]**
*[2
.46]
**[0
.16]
[5.5
7]**
*[1
.98]
**[1
.37]
[1.8
3]*
[2.3
8]**
10-y
ear r
ate
t-113
.512
.128
3.24
4-4
.493
-1.5
08-7
.476
-2.9
49-1
2.93
3-3
.105
-20.
485
4.58
3-3
.674
-0.4
77-5
.945
-0.6
2-4
.141
0.98
3-5
.359
-0.1
88.
953
5.10
5-5
.286
[2.5
6]**
[1.0
8][0
.96]
[0.6
2][1
.03]
[1.4
1][1
.14]
[1.5
4][1
.31]
[2.8
2]**
*[2
.36]
**[0
.92]
[0.1
5][0
.69]
[0.2
0][0
.69]
[0.6
9][1
.18]
[0.1
0][2
.26]
**[3
.45]
***
[1.3
5]
Secu
ritiz
atio
n t-1
8.35
56.
652
-4.6
03-6
.284
-12.
138
-10.
579
-16.
418
-13.
78-1
1.37
3-1
0.83
9-1
.348
-1.0
22-7
.859
-5.0
98-1
1.04
7-1
0.39
0.65
1-0
.326
-4.3
63-6
.024
1.21
9-3
.733
[1.1
9][0
.86]
[0.9
4][1
.17]
[4.2
1]**
*[3
.06]
***
[3.2
2]**
*[2
.53]
**[2
.94]
***
[2.5
6]**
[0.4
4][0
.29]
[1.9
1]*
[1.1
0][2
.14]
**[1
.82]
*[0
.22]
[0.0
9][1
.60]
[1.8
2]*
[0.5
7][1
.35]
Ove
rnig
ht ra
te*s
ecur
itiza
tion
t-13.
334
3.47
93.
023
3.69
11.
694
1.84
52.
488
2.56
30.
696
-0.0
470.
486
0.72
62.
141.
655
2.24
91.
941
1.48
11.
403
1.27
71.
999
2.56
72.
557
[2.3
4]**
[2.3
0]**
[3.0
1]**
*[3
.84]
***
[2.9
0]**
*[2
.75]
***
[2.6
8]**
*[2
.47]
**[0
.94]
[0.0
6][0
.76]
[1.0
7][2
.95]
***
[1.9
8]**
[2.2
4]**
[1.8
3]*
[2.3
5]**
[1.9
0]*
[2.2
3]**
[3.1
1]**
*[6
.29]
***
[4.8
9]**
*
10-y
ear r
ate*
secu
ritiz
atio
n t-1
-4.0
1-3
.527
-0.9
12-1
.054
1.52
21.
049
2.06
71.
526
2.23
42.
992
-0.3
06-0
.553
0.03
1-0
.32
0.94
41.
172
-1.3
88-1
.223
-0.2
75-0
.456
-2.3
2-1
.055
[2.2
1]**
[1.7
7]*
[0.7
4][0
.79]
[2.0
0]**
[1.1
6][1
.57]
[1.0
8][2
.05]
**[2
.53]
**[0
.33]
[0.5
5][0
.03]
[0.2
5][0
.68]
[0.7
7][1
.69]
*[1
.26]
[0.3
7][0
.52]
[3.6
2]**
*[1
.30]
GD
P gr
owth
t-1
-3.2
890.
616
-3.4
75-1
.343
-1.6
5-0
.388
-2.8
79-1
.005
-1.9
11-0
.471
-1.4
8-1
.131
-3.4
03-0
.109
-2.5
92-0
.803
-1.5
05-0
.629
-1.9
05-0
.201
-1.3
52-0
.498
[3.9
8]**
*[0
.59]
[6.5
8]**
*[1
.44]
[7.3
1]**
*[1
.14]
[5.8
7]**
*[1
.36]
[5.1
1]**
*[0
.79]
[5.4
9]**
*[2
.71]
***
[6.3
7]**
*[0
.15]
[5.9
6]**
*[1
.55]
[6.2
2]**
*[1
.69]
*[6
.97]
***
[0.4
9][5
.93]
***
[1.4
9]
Infla
tion
t-13.
018
-4.4
971.
477
-6.4
431.
462
-0.1
411.
485
-3.0
871.
338
0.34
3-1
.041
-1.0
350.
078
-5.2
932.
611
-3.0
112.
194
-0.0
031.
813
0.45
10.
307
-0.2
52[1
.50]
[1.5
9][1
.05]
[3.6
8]**
*[2
.38]
**[0
.13]
[1.2
9][1
.63]
[1.4
2][0
.25]
[1.6
5]*
[0.9
6][0
.06]
[2.5
4]**
[2.0
7]**
[1.8
9]*
[4.0
5]**
*[0
.00]
[2.8
3]**
*[0
.47]
[0.7
1][0
.32]
coun
try fi
xed
effe
cts
yes
yes
yes
yes
yes
yes
yes
yes
yes
yes
yes
yes
yes
yes
yes
yes
yes
yes
yes
yes
yes
yes
time
fixed
eff
ects
noye
sno
yes
noye
sno
yes
noye
sno
yes
noye
sno
yes
noye
sno
yes
noye
s#
of o
bser
vatio
ns31
231
231
231
231
231
231
231
231
231
231
231
231
231
231
231
231
231
231
231
231
231
2#
of c
ount
ries
1212
1212
1212
1212
1212
1212
1212
1212
1212
1212
1212
Wal
d C
hi2
115*
**66
05**
*18
7***
9377
***
317*
**72
97**
*17
3***
5401
***
201*
**34
11**
*83
***
3799
***
300*
**10
228*
**16
7***
1635
7***
131*
**21
440*
**17
4***
5322
***
181*
**92
40**
*
aver
age
loan
sm
argi
n on
riski
er lo
ans
colla
tera
lre
quire
men
tsra
te c
harg
eslo
an to
val
uera
tiom
atur
itym
argi
n on
loan
mar
gin
onm
argi
n on
colla
tera
lno
n-in
tere
st
for h
ouse
pur
chas
e
loan
non-
inte
rest
aver
age
loan
sris
kier
loan
sre
quire
men
tsm
atur
ity
for c
onsu
mer
loan
s
rate
cha
rges
Tab
le 4
, Pan
el C
sho
ws
the
resu
lts o
f a
GL
S pa
nel
regr
essi
on w
here
the
dep
ende
nt v
aria
ble
is t
he n
et p
erce
ntag
e of
ban
ks i
n ea
ch c
ount
ry r
epor
ting
a tig
hten
ing
of c
redi
t st
anda
rds
in t
he B
ank
Len
ding
Sur
vey
(BL
S) f
or t
erm
s an
d co
nditi
ons
for
loan
s to
hous
ehol
ds.
The
y ar
e th
e an
swer
s to
Que
stio
ns 1
0 an
d 12
of
the
BL
S (s
ee A
ppen
dix
A).
The
ove
rnig
ht r
ate
is t
he q
uart
erly
ave
rage
of
the
daily
ove
rnig
ht r
ate
(EO
NIA
). T
he 1
0-ye
ar r
ate
is t
he l
ong-
term
gov
ernm
ent
bond
int
eres
t ra
te i
n ea
ch c
ount
ry.
Secu
ritiz
atio
n is
def
ined
as
the
tota
l sec
uriti
zatio
n ac
tivity
in e
ach
coun
try
divi
ded
by th
e ou
tsta
ndin
g am
ount
of
loan
s. G
DP
grow
th is
the
annu
al g
row
th r
ate
of r
eal
GD
P f
or e
ach
coun
try.
Inf
latio
n is
the
quar
terl
y av
erag
e of
infl
atio
n ra
tes
for
each
cou
ntry
.Se
e Se
ctio
n II
and
App
endi
x B
for
a d
etai
led
expl
anat
ion
of th
e va
riab
les
and
the
data
sou
rces
. All
the
expl
anat
ory
vari
able
s ar
e la
gged
by
one
quar
ter.
The
pan
el in
clud
es d
ata
for
12 e
uro
area
cou
ntri
es (
Aus
tria
, Bel
gium
, Fin
land
, Fra
nce,
Ger
man
y, G
reec
e,Ir
elan
d, I
taly
, Lux
embo
urg,
Net
herl
ands
, Por
tuga
l, an
d Sp
ain)
. The
test
sta
tistic
s ar
e in
bra
cket
s. *
, **
and
***
deno
test
atis
tical
sig
nifi
canc
e at
the
10%
, 5%
and
1%
leve
l res
pect
ivel
y. A
ll th
e pa
nel r
egre
ssio
ns in
clud
e co
untr
y fi
xed
effe
cts
and
stan
dard
err
ors
corr
ecte
d fo
r au
toco
rrel
atio
n an
d co
rrel
atio
n ac
ross
cou
ntri
es.
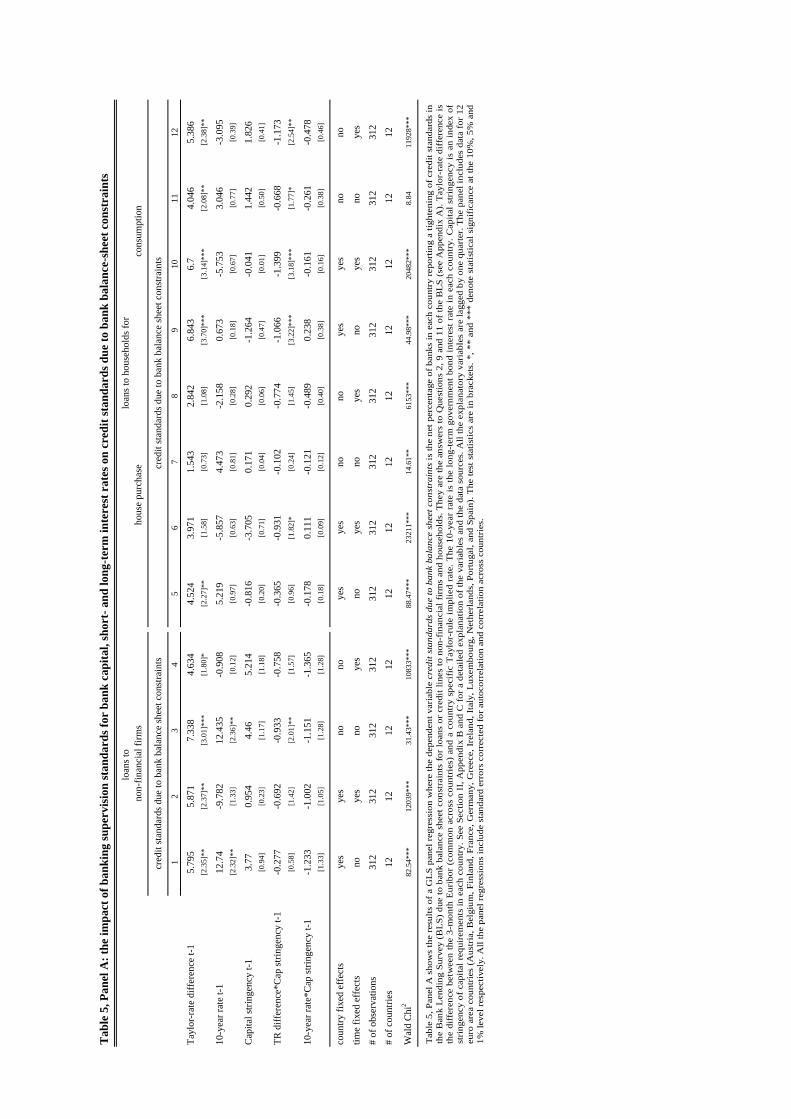
Tab
le 5
, Pan
el A
: the
impa
ct o
f ban
king
supe
rvis
ion
stan
dard
s for
ban
k ca
pita
l, sh
ort-
and
long
-ter
m in
tere
st r
ates
on
cred
it st
anda
rds d
ue to
ban
k ba
lanc
e-sh
eet c
onst
rain
ts
12
34
56
78
910
1112
Tayl
or-r
ate
diff
eren
ce t-
15.
795
5.87
17.
338
4.63
44.
524
3.97
11.
543
2.84
26.
843
6.7
4.04
65.
386
[2.3
5]**
[2.3
7]**
[3.0
1]**
*[1
.80]
*[2
.27]
**[1
.58]
[0.7
3][1
.08]
[3.7
0]**
*[3
.14]
***
[2.0
8]**
[2.3
8]**
10-y
ear r
ate
t-112
.74
-9.7
8212
.435
-0.9
085.
219
-5.8
574.
473
-2.1
580.
673
-5.7
533.
046
-3.0
95[2
.32]
**[1
.33]
[2.3
6]**
[0.1
2][0
.97]
[0.6
3][0
.81]
[0.2
8][0
.18]
[0.6
7][0
.77]
[0.3
9]
Cap
ital s
tring
ency
t-1
3.77
0.95
44.
465.
214
-0.8
16-3
.705
0.17
10.
292
-1.2
64-0
.041
1.44
21.
826
[0.9
4][0
.23]
[1.1
7][1
.18]
[0.2
0][0
.71]
[0.0
4][0
.06]
[0.4
7][0
.01]
[0.5
0][0
.41]
TR d
iffer
ence
*Cap
strin
genc
y t-1
-0.2
77-0
.692
-0.9
33-0
.758
-0.3
65-0
.931
-0.1
02-0
.774
-1.0
66-1
.399
-0.6
68-1
.173
[0.5
8][1
.42]
[2.0
1]**
[1.5
7][0
.96]
[1.8
2]*
[0.2
4][1
.45]
[3.2
2]**
*[3
.18]
***
[1.7
7]*
[2.5
4]**
10-y
ear r
ate*
Cap
strin
genc
y t-1
-1.2
33-1
.002
-1.1
51-1
.365
-0.1
780.
111
-0.1
21-0
.489
0.23
8-0
.161
-0.2
61-0
.478
[1.3
3][1
.05]
[1.2
8][1
.28]
[0.1
8][0
.09]
[0.1
2][0
.40]
[0.3
8][0
.16]
[0.3
8][0
.46]
coun
try fi
xed
effe
cts
yes
yes
nono
yes
yes
nono
yes
yes
nono
time
fixed
eff
ects
noye
sno
yes
noye
sno
yes
noye
sno
yes
# of
obs
erva
tions
312
312
312
312
312
312
312
312
312
312
312
312
# of
cou
ntrie
s12
1212
1212
1212
1212
1212
12
Wal
d C
hi2
82.5
4***
1203
9***
31.4
3***
1083
3***
88.4
7***
2321
1***
14.6
1**
6153
***
44.9
8***
2048
2***
8.84
1192
8***
cred
it st
anda
rds d
ue to
ban
k ba
lanc
e sh
eet c
onst
rain
tscr
edit
stan
dard
s due
to b
ank
bala
nce
shee
t con
stra
ints
loan
s to
loan
s to
hous
ehol
ds fo
rno
n-fin
anci
al fi
rms
hous
e pu
rcha
seco
nsum
ptio
n
Tab
le 5
, Pan
el A
sho
ws
the
resu
lts o
f a
GL
S pa
nel r
egre
ssio
n w
here
the
depe
nden
t var
iabl
e cr
edit
stan
dard
s du
e to
ban
k ba
lanc
e sh
eet c
onst
rain
ts is
the
net p
erce
ntag
e of
ban
ks in
eac
h co
untr
yre
port
ing
a tig
hten
ing
of c
redi
t sta
ndar
ds in
th
e B
ank
Len
ding
Sur
vey
(BL
S) d
ue to
ban
k ba
lanc
e sh
eet c
onst
rain
ts f
or lo
ans
or c
redi
t lin
es to
non
-fin
anci
al f
irm
s an
d ho
useh
olds
. The
y ar
e th
e an
swer
s to
Que
stio
ns 2
, 9 a
nd 1
1 of
the
BL
S (s
ee A
ppen
dix
A).
Tay
lor-
rate
dif
fere
nce
isth
e di
ffer
ence
bet
wee
n th
e 3-
mon
th E
urib
or (
com
mon
acr
oss
coun
trie
s) a
nd a
cou
ntry
spe
cifi
c T
aylo
r-ru
le i
mpl
ied
rate
. The
10-
year
rat
e is
the
long
-ter
m g
over
nmen
t bon
d in
tere
st r
ate
in e
ach
coun
try.
Cap
ital s
trin
genc
y is
an
inde
x o f
st
ring
ency
of
capi
tal r
equi
rem
ents
in e
ach
coun
try.
See
Sec
tion
II, A
ppen
dix
B a
nd C
for
a d
etai
led
expl
anat
ion
of th
e va
riab
les
and
the
data
sou
rces
. All
the
expl
anat
ory
vari
able
s ar
e la
gged
by
one
quar
ter.
The
pan
el in
clud
es d
ata
for
12
euro
are
a co
untr
ies
(Aus
tria
, Bel
gium
, Fin
land
, Fra
nce,
Ger
man
y, G
reec
e, I
rela
nd, I
taly
, Lux
embo
urg,
Net
herl
ands
, Por
tuga
l, an
d Sp
ain)
. The
test
sta
tistic
s ar
e in
bra
cket
s. *
, **
and
***
deno
test
atis
tical
sig
nifi
canc
e at
the
10%
, 5%
and
1%
leve
l res
pect
ivel
y. A
ll th
e pa
nel r
egre
ssio
ns in
clud
e st
anda
rd e
rror
s co
rrec
ted
for a
utoc
orre
latio
n an
d co
rrel
atio
n ac
ross
cou
ntri
es.
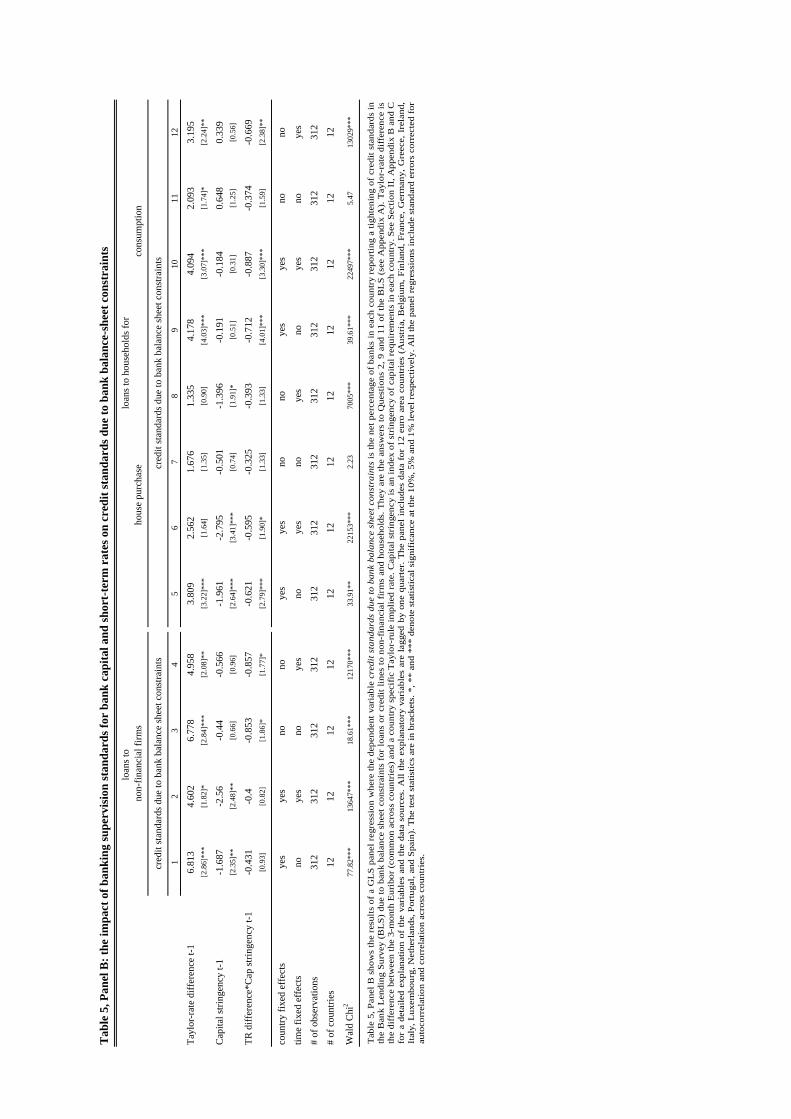
Tab
le 5
, Pan
el B
: the
impa
ct o
f ban
king
supe
rvis
ion
stan
dard
s for
ban
k ca
pita
l and
shor
t-te
rm r
ates
on
cred
it st
anda
rds d
ue to
ban
k ba
lanc
e-sh
eet c
onst
rain
ts
12
34
56
78
910
1112
Tayl
or-r
ate
diff
eren
ce t-
16.
813
4.60
26.
778
4.95
83.
809
2.56
21.
676
1.33
54.
178
4.09
42.
093
3.19
5[2
.86]
***
[1.8
2]*
[2.8
4]**
*[2
.08]
**[3
.22]
***
[1.6
4][1
.35]
[0.9
0][4
.03]
***
[3.0
7]**
*[1
.74]
*[2
.24]
**
Cap
ital s
tring
ency
t-1
-1.6
87-2
.56
-0.4
4-0
.566
-1.9
61-2
.795
-0.5
01-1
.396
-0.1
91-0
.184
0.64
80.
339
[2.3
5]**
[2.4
8]**
[0.6
6][0
.96]
[2.6
4]**
*[3
.41]
***
[0.7
4][1
.91]
*[0
.51]
[0.3
1][1
.25]
[0.5
6]
TR d
iffer
ence
*Cap
strin
genc
y t-1
-0.4
31-0
.4-0
.853
-0.8
57-0
.621
-0.5
95-0
.325
-0.3
93-0
.712
-0.8
87-0
.374
-0.6
69[0
.93]
[0.8
2][1
.86]
*[1
.77]
*[2
.79]
***
[1.9
0]*
[1.3
3][1
.33]
[4.0
1]**
*[3
.30]
***
[1.5
9][2
.38]
**
coun
try fi
xed
effe
cts
yes
yes
nono
yes
yes
nono
yes
yes
nono
time
fixed
eff
ects
noye
sno
yes
noye
sno
yes
noye
sno
yes
# of
obs
erva
tions
312
312
312
312
312
312
312
312
312
312
312
312
# of
cou
ntrie
s12
1212
1212
1212
1212
1212
12
Wal
d C
hi2
77.8
2***
1364
7***
18.6
1***
1217
0***
33.9
1**
2215
3***
2.23
7005
***
39.6
1***
2249
7***
5.47
1302
9***
cred
it st
anda
rds d
ue to
ban
k ba
lanc
e sh
eet c
onst
rain
tscr
edit
stan
dard
s due
to b
ank
bala
nce
shee
t con
stra
ints
loan
s to
loan
s to
hous
ehol
ds fo
rno
n-fin
anci
al fi
rms
hous
e pu
rcha
seco
nsum
ptio
n
Tab
le 5
, Pan
el B
sho
ws
the
resu
lts o
f a
GL
S pa
nel r
egre
ssio
n w
here
the
depe
nden
t var
iabl
e cr
edit
stan
dard
s du
e to
ban
k ba
lanc
e sh
eet c
onst
rain
ts is
the
net p
erce
ntag
e of
ban
ks in
eac
h co
untr
yre
port
ing
a tig
hten
ing
of c
redi
t sta
ndar
ds in
th
e B
ank
Len
ding
Sur
vey
(BL
S) d
ue to
ban
k ba
lanc
e sh
eet c
onst
rain
ts f
or lo
ans
or c
redi
t lin
es to
non
-fin
anci
al f
irm
s an
d ho
useh
olds
. The
y ar
e th
e an
swer
s to
Que
stio
ns 2
, 9 a
nd 1
1 of
the
BL
S (s
ee A
ppen
dix
A).
Tay
lor-
rate
dif
fere
nce
isth
e di
ffer
ence
bet
wee
n th
e 3-
mon
th E
urib
or (c
omm
on a
cros
s co
untr
ies)
and
a c
ount
ry s
peci
fic
Tay
lor-
rule
impl
ied
rate
. Cap
ital s
trin
genc
y is
an
inde
x of
str
inge
ncy
of c
apita
l req
uire
men
ts in
eac
h co
untr
y. S
ee S
ectio
n II
, App
endi
x B
and
C
for
a de
taile
d ex
plan
atio
n of
the
vari
able
s an
d th
e da
ta s
ourc
es. A
ll th
e ex
plan
ator
y va
riab
les
are
lagg
ed b
y on
e qu
arte
r. T
he p
anel
inc
lude
s da
ta f
or 1
2 eu
ro a
rea
coun
trie
s (A
ustr
ia, B
elgi
um, F
inla
nd, F
ranc
e, G
erm
any,
Gre
ece,
Ire
land
,It
aly,
Lux
embo
urg,
Net
herl
ands
, Por
tuga
l, an
d Sp
ain)
. The
test
sta
tistic
s ar
e in
bra
cket
s. *
, **
and
***
deno
test
atis
tical
sig
nifi
canc
e at
the
10%
, 5%
and
1%
leve
l res
pect
ivel
y. A
ll th
e pa
nel r
egre
ssio
ns in
clud
e st
anda
rd e
rror
s co
rrec
ted
for
auto
corr
elat
ion
and
corr
elat
ion
acro
ss c
ount
ries
.
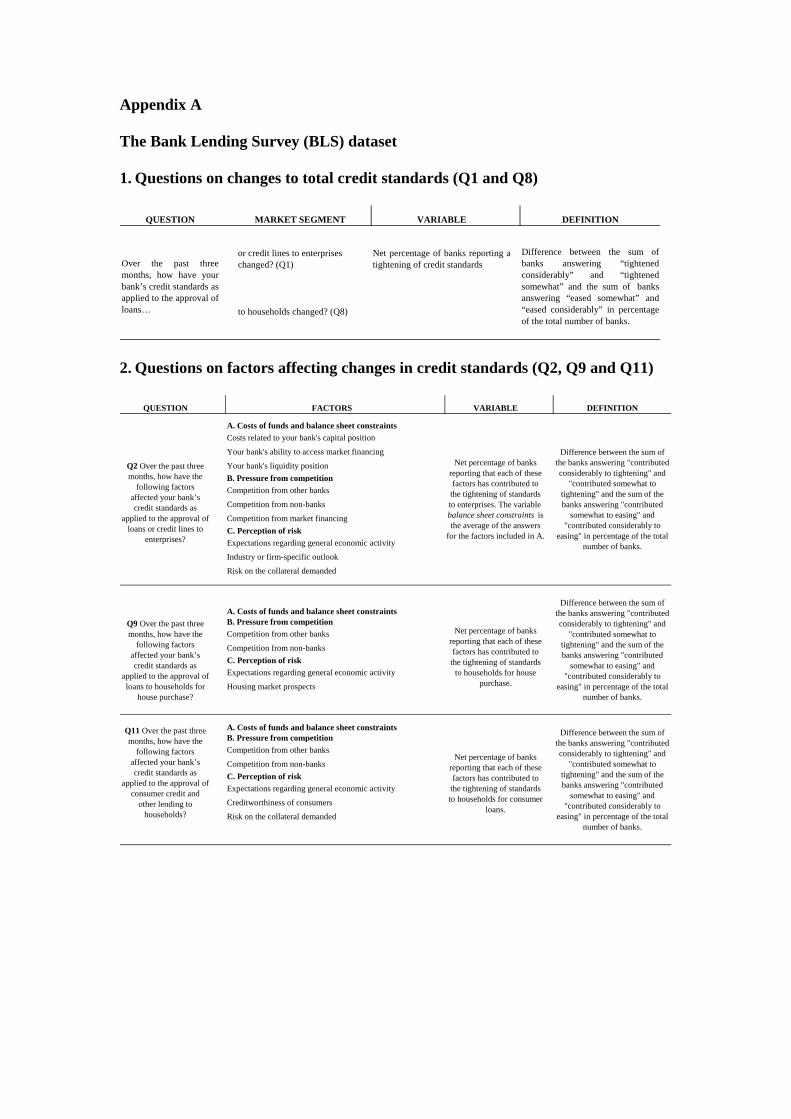
Appendix A The Bank Lending Survey (BLS) dataset 1. Questions on changes to total credit standards (Q1 and Q8)
QUESTION MARKET SEGMENT VARIABLE DEFINITION
or credit lines to enterprises changed? (Q1)
Net percentage of banks reporting atightening of credit standards
to households changed? (Q8)
Difference between the sum ofbanks answering “tightenedconsiderably” and “tightenedsomewhat” and the sum of banksanswering “eased somewhat” and“eased considerably” in percentageof the total number of banks.
Over the past threemonths, how have yourbank’s credit standards asapplied to the approval ofloans…
2. Questions on factors affecting changes in credit standards (Q2, Q9 and Q11)
QUESTION FACTORS VARIABLE DEFINITION
A. Costs of funds and balance sheet constraintsCosts related to your bank's capital position
Your bank's ability to access market financing
Your bank's liquidity positionB. Pressure from competitionCompetition from other banks
Competition from non-banks
Competition from market financingC. Perception of riskExpectations regarding general economic activity
Industry or firm-specific outlook
Risk on the collateral demanded
A. Costs of funds and balance sheet constraintsB. Pressure from competitionCompetition from other banks
Competition from non-banksC. Perception of riskExpectations regarding general economic activity
Housing market prospects
A. Costs of funds and balance sheet constraintsB. Pressure from competitionCompetition from other banks
Competition from non-banksC. Perception of riskExpectations regarding general economic activity
Creditworthiness of consumers
Risk on the collateral demanded
Difference between the sum of the banks answering "contributed considerably to tightening" and
"contributed somewhat to tightening" and the sum of the banks answering "contributed
somewhat to easing" and "contributed considerably to
easing" in percentage of the total number of banks.
Q9 Over the past three months, how have the
following factors affected your bank’s credit standards as
applied to the approval of loans to households for
house purchase?
Net percentage of banks reporting that each of these factors has contributed to
the tightening of standards to households for house
purchase.
Q2 Over the past three months, how have the
following factors affected your bank’s credit standards as
applied to the approval of loans or credit lines to
enterprises?
Net percentage of banks reporting that each of these factors has contributed to
the tightening of standards to enterprises. The variable balance sheet constraints is the average of the answers
for the factors included in A.
Q11 Over the past three months, how have the
following factors affected your bank’s credit standards as
applied to the approval of consumer credit and
other lending to households?
Net percentage of banks reporting that each of these factors has contributed to
the tightening of standards to households for consumer
loans.
Difference between the sum of the banks answering "contributed considerably to tightening" and
"contributed somewhat to tightening" and the sum of the banks answering "contributed
somewhat to easing" and "contributed considerably to
easing" in percentage of the total number of banks.
Difference between the sum of the banks answering "contributed considerably to tightening" and
"contributed somewhat to tightening" and the sum of the banks answering "contributed
somewhat to easing" and "contributed considerably to
easing" in percentage of the total number of banks.
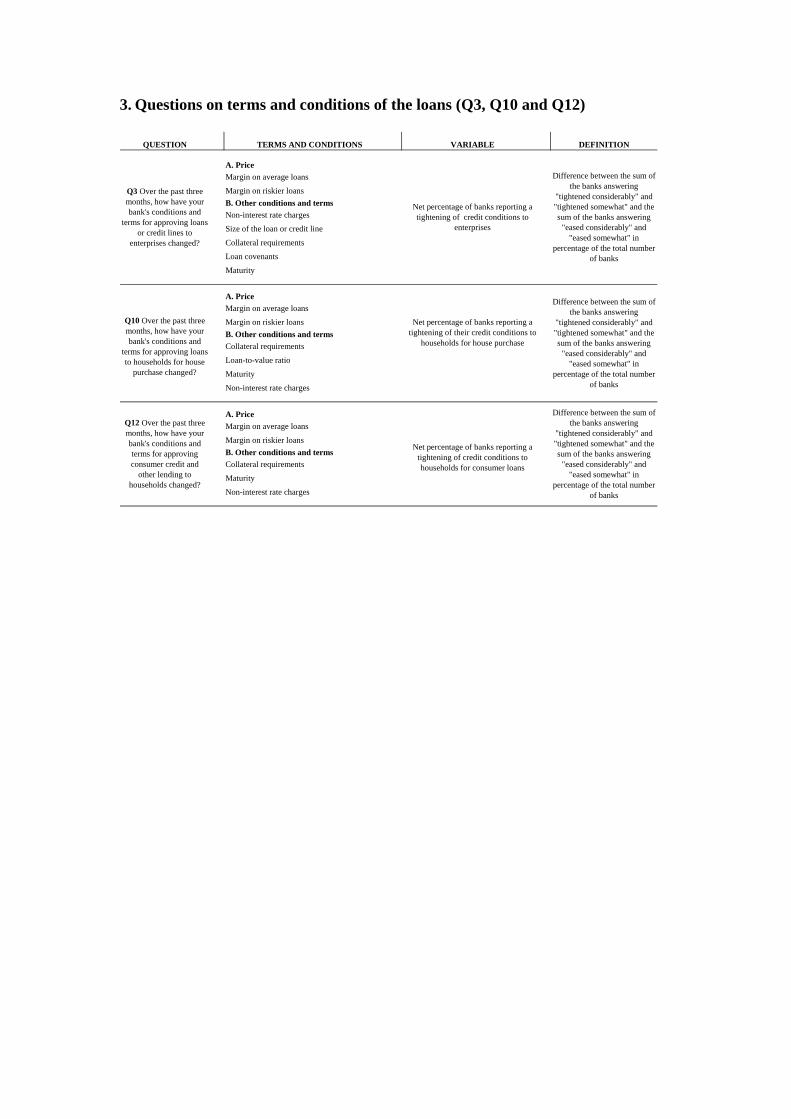
3. Questions on terms and conditions of the loans (Q3, Q10 and Q12)
QUESTION TERMS AND CONDITIONS VARIABLE DEFINITION
A. PriceMargin on average loans
Margin on riskier loansB. Other conditions and termsNon-interest rate charges
Size of the loan or credit line
Collateral requirements
Loan covenants
Maturity
A. PriceMargin on average loans
Margin on riskier loansB. Other conditions and termsCollateral requirements
Loan-to-value ratio
Maturity
Non-interest rate charges
A. PriceMargin on average loans
Margin on riskier loansB. Other conditions and termsCollateral requirements
Maturity
Non-interest rate charges
Net percentage of banks reporting a tightening of credit conditions to households for consumer loans
Q10 Over the past three months, how have your bank's conditions and
terms for approving loans to households for house
purchase changed?
Difference between the sum of the banks answering
"tightened considerably" and "tightened somewhat" and the sum of the banks answering
"eased considerably" and "eased somewhat" in
percentage of the total number of banks
Q12 Over the past three months, how have your bank's conditions and terms for approving consumer credit and
other lending to households changed?
Net percentage of banks reporting a tightening of their credit conditions to
households for house purchase
Difference between the sum of the banks answering
"tightened considerably" and "tightened somewhat" and the sum of the banks answering
"eased considerably" and "eased somewhat" in
percentage of the total number of banks
Net percentage of banks reporting a tightening of credit conditions to
enterprises
Difference between the sum of the banks answering
"tightened considerably" and "tightened somewhat" and the sum of the banks answering
"eased considerably" and "eased somewhat" in
percentage of the total number of banks
Q3 Over the past three months, how have your bank's conditions and
terms for approving loans or credit lines to
enterprises changed?
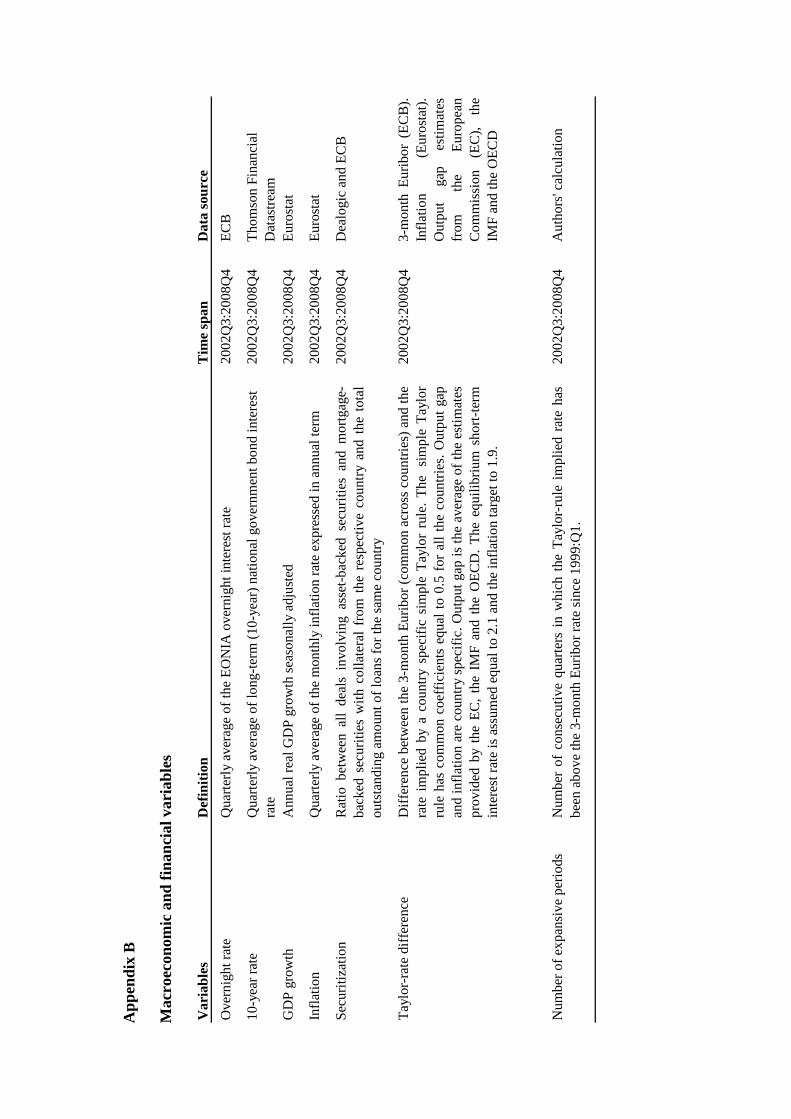
App
endi
x B
M
acro
econ
omic
and
fina
ncia
l var
iabl
es
Var
iabl
esD
efin
ition
Tim
e sp
anD
ata
sour
ceO
vern
ight
rate
Qua
rterly
ave
rage
of t
he E
ON
IA o
vern
ight
inte
rest
rate
2002
Q3:
2008
Q4
ECB
10-y
ear r
ate
Qua
rterly
ave
rage
of l
ong-
term
(10-
year
) nat
iona
l gov
ernm
ent b
ond
inte
rest
ra
te
2002
Q3:
2008
Q4
Thom
son
Fina
ncia
l D
atas
tream
GD
P gr
owth
Ann
ual r
eal G
DP
grow
th se
ason
ally
adj
uste
d20
02Q
3:20
08Q
4Eu
rost
at
Infla
tion
Qua
rterly
ave
rage
of t
he m
onth
ly in
flatio
n ra
te e
xpre
ssed
in a
nnua
l ter
m20
02Q
3:20
08Q
4Eu
rost
at
Secu
ritiz
atio
nR
atio
betw
een
all
deal
sin
volv
ing
asse
t-bac
ked
secu
ritie
san
dm
ortg
age-
back
edse
curit
ies
with
colla
tera
lfr
omth
ere
spec
tive
coun
tryan
dth
eto
tal
outs
tand
ing
amou
nt o
f loa
ns fo
r the
sam
e co
untry
2002
Q3:
2008
Q4
Dea
logi
c an
d EC
B
Tayl
or-r
ate
diff
eren
ce
Diff
eren
cebe
twee
nth
e3-
mon
thEu
ribor
(com
mon
acro
ssco
untri
es)a
ndth
era
teim
plie
dby
aco
untry
spec
ific
sim
ple
Tayl
orru
le.T
hesi
mpl
eTa
ylor
rule
has
com
mon
coef
ficie
nts
equa
lto
0.5
fora
llth
eco
untri
es.O
utpu
tgap
and
infla
tion
are
coun
trysp
ecifi
c.O
utpu
tgap
isth
eav
erag
eof
the
estim
ates
prov
ided
byth
eEC
,the
IMF
and
the
OEC
D.T
heeq
uilib
rium
shor
t-ter
min
tere
st ra
te is
ass
umed
equ
al to
2.1
and
the
infla
tion
targ
et to
1.9
.
2002
Q3:
2008
Q4
3-m
onth
Eurib
or(E
CB
).In
flatio
n(E
uros
tat).
Out
put
gap
estim
ates
from
the
Euro
pean
Com
mis
sion
(EC
),th
eIM
F an
d th
e O
ECD
Num
ber o
f exp
ansi
ve p
erio
dsN
umbe
rof
cons
ecut
ive
quar
ters
inw
hich
the
Tayl
or-r
ule
impl
ied
rate
has
been
abo
ve th
e 3-
mon
th E
urib
or ra
te si
nce
1999
:Q1.
2002
Q3:
2008
Q4
Aut
hors
' cal
cula
tion
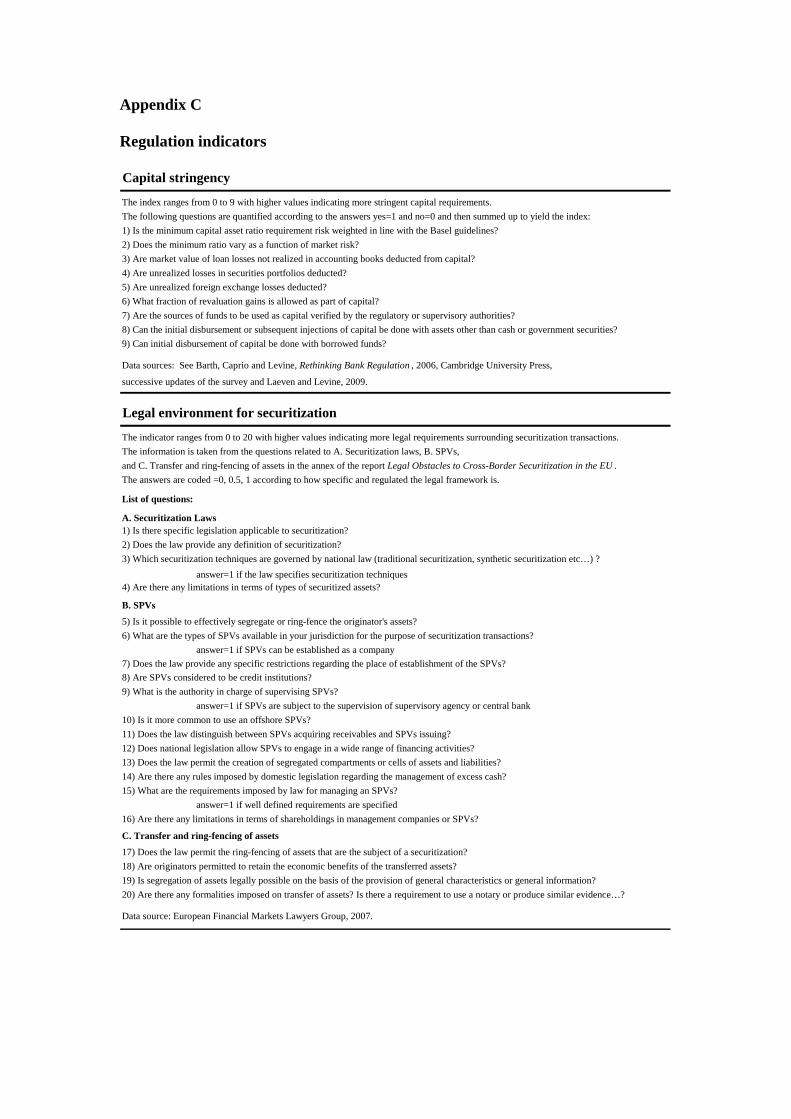
Appendix C Regulation indicators Capital stringency
The index ranges from 0 to 9 with higher values indicating more stringent capital requirements. The following questions are quantified according to the answers yes=1 and no=0 and then summed up to yield the index: 1) Is the minimum capital asset ratio requirement risk weighted in line with the Basel guidelines?2) Does the minimum ratio vary as a function of market risk?3) Are market value of loan losses not realized in accounting books deducted from capital?4) Are unrealized losses in securities portfolios deducted?5) Are unrealized foreign exchange losses deducted?6) What fraction of revaluation gains is allowed as part of capital?7) Are the sources of funds to be used as capital verified by the regulatory or supervisory authorities?8) Can the initial disbursement or subsequent injections of capital be done with assets other than cash or government securities?9) Can initial disbursement of capital be done with borrowed funds?
Data sources: See Barth, Caprio and Levine, Rethinking Bank Regulation , 2006, Cambridge University Press,
successive updates of the survey and Laeven and Levine, 2009.
Legal environment for securitization
The indicator ranges from 0 to 20 with higher values indicating more legal requirements surrounding securitization transactions.The information is taken from the questions related to A. Securitization laws, B. SPVs,and C. Transfer and ring-fencing of assets in the annex of the report Legal Obstacles to Cross-Border Securitization in the EU .The answers are coded =0, 0.5, 1 according to how specific and regulated the legal framework is.
List of questions:
A. Securitization Laws1) Is there specific legislation applicable to securitization?2) Does the law provide any definition of securitization?3) Which securitization techniques are governed by national law (traditional securitization, synthetic securitization etc…) ?
answer=1 if the law specifies securitization techniques4) Are there any limitations in terms of types of securitized assets?
B. SPVs
5) Is it possible to effectively segregate or ring-fence the originator's assets?6) What are the types of SPVs available in your jurisdiction for the purpose of securitization transactions?
answer=1 if SPVs can be established as a company7) Does the law provide any specific restrictions regarding the place of establishment of the SPVs?8) Are SPVs considered to be credit institutions?9) What is the authority in charge of supervising SPVs?
answer=1 if SPVs are subject to the supervision of supervisory agency or central bank10) Is it more common to use an offshore SPVs?11) Does the law distinguish between SPVs acquiring receivables and SPVs issuing?12) Does national legislation allow SPVs to engage in a wide range of financing activities?13) Does the law permit the creation of segregated compartments or cells of assets and liabilities?14) Are there any rules imposed by domestic legislation regarding the management of excess cash?15) What are the requirements imposed by law for managing an SPVs?
answer=1 if well defined requirements are specified 16) Are there any limitations in terms of shareholdings in management companies or SPVs?
C. Transfer and ring-fencing of assets
17) Does the law permit the ring-fencing of assets that are the subject of a securitization?18) Are originators permitted to retain the economic benefits of the transferred assets?19) Is segregation of assets legally possible on the basis of the provision of general characteristics or general information?20) Are there any formalities imposed on transfer of assets? Is there a requirement to use a notary or produce similar evidence…?
Data source: European Financial Markets Lawyers Group, 2007.
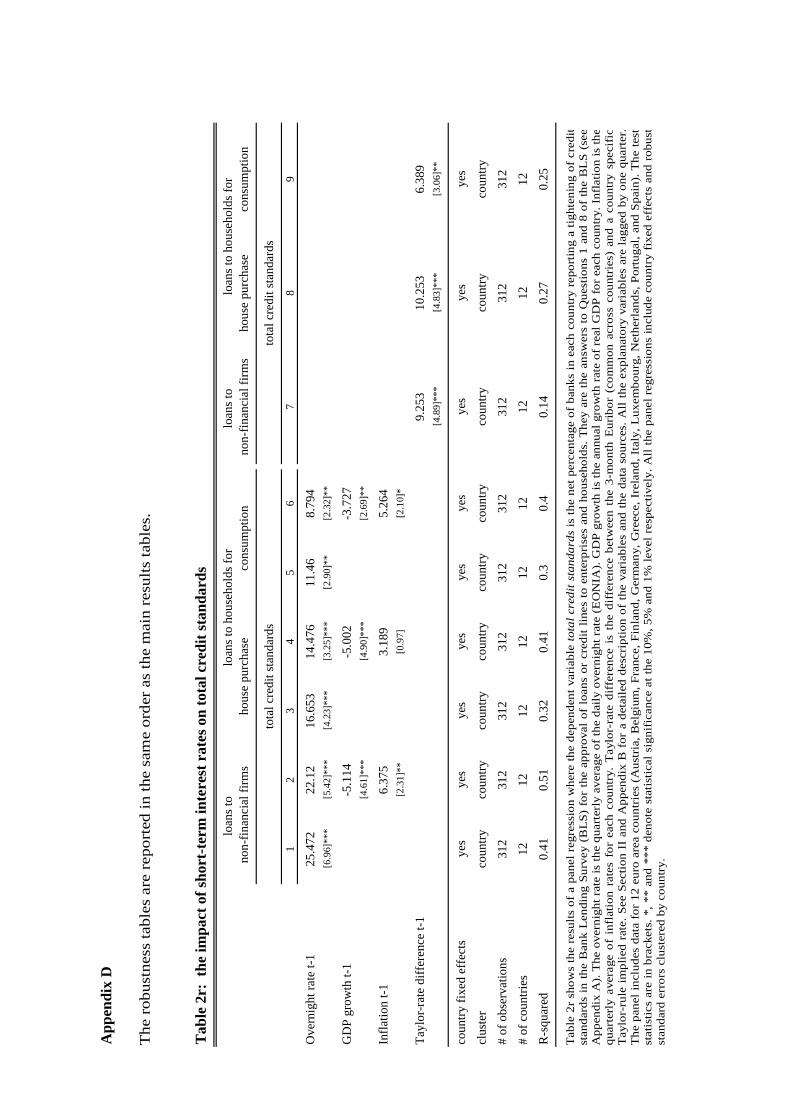
App
endi
x D
Tab
le 2
r: t
he im
pact
of s
hort
-ter
m in
tere
st r
ates
on
tota
l cre
dit s
tand
ards
loan
s to
non-
finan
cial
firm
sho
use
purc
hase
cons
umpt
ion
12
34
56
78
9
Ove
rnig
ht ra
te t-
125
.472
22.1
216
.653
14.4
7611
.46
8.79
4[6
.96]
***
[5.4
2]**
*[4
.23]
***
[3.2
5]**
*[2
.90]
**[2
.32]
**
GD
P gr
owth
t-1
-5.1
14-5
.002
-3.7
27[4
.61]
***
[4.9
0]**
*[2
.69]
**
Infla
tion
t-16.
375
3.18
95.
264
[2.3
1]**
[0.9
7][2
.10]
*
Tayl
or-r
ate
diff
eren
ce t-
19.
253
10.2
536.
389
[4.8
9]**
*[4
.83]
***
[3.0
6]**
coun
try fi
xed
effe
cts
yes
yes
yes
yes
yes
yes
yes
yes
yes
clus
ter
coun
tryco
untry
coun
tryco
untry
coun
tryco
untry
coun
tryco
untry
coun
try#
of o
bser
vatio
ns31
231
231
231
231
231
231
231
231
2#
of c
ount
ries
1212
1212
1212
1212
12R
-squ
ared
0.41
0.51
0.32
0.41
0.3
0.4
0.14
0.27
0.25
loan
s to
hous
ehol
ds fo
r
tota
l cre
dit s
tand
ards
loan
s to
non-
finan
cial
firm
s
tota
l cre
dit s
tand
ards
loan
s to
hous
ehol
ds fo
rho
use
purc
hase
cons
umpt
ion
Tab
le 2
r sh
ows
the
resu
lts o
f a
pane
l reg
ress
ion
whe
re th
e de
pend
ent v
aria
ble
tota
l cre
dit s
tand
ards
is th
e ne
t per
cent
age
of b
anks
in e
ach
coun
try
repo
rtin
g a
tight
enin
g of
cre
dit
stan
dard
s in
the
Ban
k L
endi
ng S
urve
y (B
LS)
for
the
app
rova
l of
loa
ns o
r cr
edit
lines
to
ente
rpri
ses
and
hous
ehol
ds. T
hey
are
the
answ
ers
to Q
uest
ions
1 a
nd 8
of
the
BL
S (s
eeA
ppen
dix
A).
The
ove
rnig
ht r
ate
is th
e qu
arte
rly
aver
age
of th
e da
ily o
vern
ight
rat
e (E
ON
IA).
GD
P gr
owth
is th
e an
nual
gro
wth
rat
e of
rea
l GD
P fo
r ea
ch c
ount
ry. I
nfla
tion
is th
equ
arte
rly
aver
age
of i
nfla
tion
rate
s fo
r ea
ch c
ount
ry.
Tay
lor-
rate
dif
fere
nce
is t
he d
iffe
renc
e be
twee
n th
e 3-
mon
th E
urib
or (
com
mon
acr
oss
coun
trie
s) a
nd a
cou
ntry
spe
cifi
cT
aylo
r-ru
le i
mpl
ied
rate
. See
Sec
tion
II a
nd A
ppen
dix
B f
or a
det
aile
d de
scri
ptio
n of
the
var
iabl
es a
nd th
e da
ta s
ourc
es. A
ll th
e ex
plan
ator
y va
riab
les
are
lagg
ed b
y on
e qu
arte
r.T
he p
anel
incl
udes
dat
a fo
r 12
eur
o ar
ea c
ount
ries
(A
ustr
ia, B
elgi
um, F
ranc
e, F
inla
nd, G
erm
any,
Gre
ece,
Ire
land
, Ita
ly, L
uxem
bour
g, N
ethe
rlan
ds, P
ortu
gal,
and
Spai
n). T
he te
stst
atis
tics
are
in b
rack
ets.
*, *
* an
d **
* de
note
sta
tistic
al s
igni
fica
nce
at th
e 10
%, 5
% a
nd 1
% le
vel r
espe
ctiv
ely.
All
the
pane
l reg
ress
ions
incl
ude
coun
try
fixe
d ef
fect
s an
d ro
bust
stan
dard
err
ors
clus
tere
d by
cou
ntry
. T
he r
obus
tnes
s ta
bles
are
rep
orte
d in
the
sam
e or
der
as th
e m
ain
resu
lts ta
bles
.
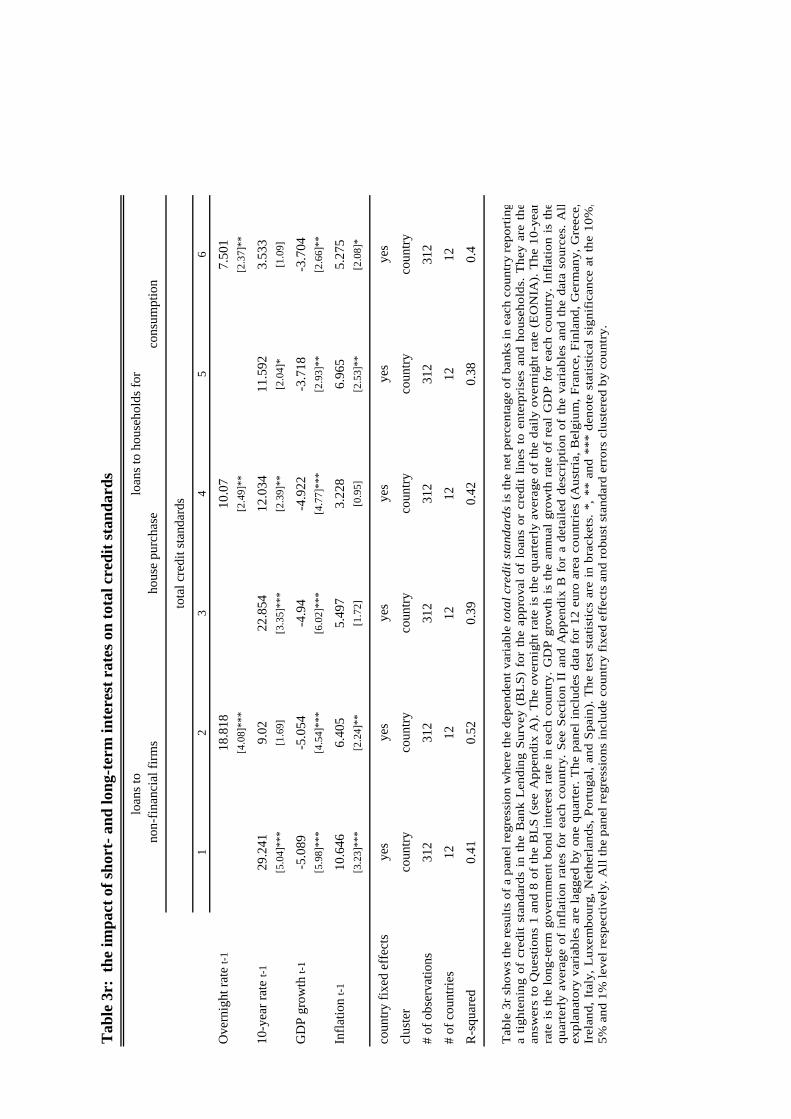
Tab
le 3
r: t
he im
pact
of s
hort
- and
long
-ter
m in
tere
st r
ates
on
tota
l cre
dit s
tand
ards
12
34
56
Ove
rnig
ht ra
te t-
118
.818
10.0
77.
501
[4.0
8]**
*[2
.49]
**[2
.37]
**
10-y
ear r
ate
t-129
.241
9.02
22.8
5412
.034
11.5
923.
533
[5.0
4]**
*[1
.69]
[3.3
5]**
*[2
.39]
**[2
.04]
*[1
.09]
GD
P gr
owth
t-1
-5.0
89-5
.054
-4.9
4-4
.922
-3.7
18-3
.704
[5.9
8]**
*[4
.54]
***
[6.0
2]**
*[4
.77]
***
[2.9
3]**
[2.6
6]**
Infla
tion
t-110
.646
6.40
55.
497
3.22
86.
965
5.27
5[3
.23]
***
[2.2
4]**
[1.7
2][0
.95]
[2.5
3]**
[2.0
8]*
coun
try fi
xed
effe
cts
yes
yes
yes
yes
yes
yes
clus
ter
coun
tryco
untry
coun
tryco
untry
coun
tryco
untry
# of
obs
erva
tions
312
312
312
312
312
312
# of
cou
ntrie
s12
1212
1212
12
R-s
quar
ed0.
410.
520.
390.
420.
380.
4
loan
s to
hous
ehol
ds fo
r
tota
l cre
dit s
tand
ards
loan
s to
non-
finan
cial
firm
sho
use
purc
hase
cons
umpt
ion
Tab
le 3
r sh
ows
the
resu
lts o
f a p
anel
regr
essi
on w
here
the
depe
nden
t var
iabl
e to
tal c
redi
t sta
ndar
ds is
the
net p
erce
ntag
e of
ban
ks in
eac
h co
untr
yre
port
ing
a tig
hten
ing
of c
redi
t st
anda
rds
in t
he B
ank
Len
ding
Sur
vey
(BL
S) f
or t
he a
ppro
val
of l
oans
or
cred
it lin
es t
o en
terp
rise
s an
d ho
useh
olds
. T
hey
are
the
answ
ers
to Q
uest
ions
1 a
nd 8
of
the
BL
S (s
ee A
ppen
dix
A).
The
ove
rnig
ht r
ate
is th
e qu
arte
rly
aver
age
of th
e da
ily o
vern
ight
rat
e (E
ON
IA).
The
10-
year
rate
is
the
long
-ter
m g
over
nmen
t bo
nd i
nter
est
rate
in
each
cou
ntry
. GD
P gr
owth
is
the
annu
al g
row
th r
ate
of r
eal
GD
P fo
r ea
ch c
ount
ry. I
nfla
tion
is th
equ
arte
rly
aver
age
of i
nfla
tion
rate
s fo
r ea
ch c
ount
ry.
See
Sect
ion
II a
nd A
ppen
dix
B f
or a
det
aile
d de
scri
ptio
n of
the
var
iabl
es a
nd t
he d
ata
sour
ces.
All
expl
anat
ory
vari
able
s ar
e la
gged
by
one
quar
ter.
The
pan
el in
clud
es d
ata
for
12 e
uro
area
cou
ntri
es (
Aus
tria
, Bel
gium
, Fra
nce,
Fin
land
, Ger
man
y, G
reec
e,Ir
elan
d, I
taly
, Lux
embo
urg,
Net
herl
ands
, Por
tuga
l, an
d Sp
ain)
. The
tes
t sta
tistic
s ar
e in
bra
cket
s. *
, **
and
***
den
ote
stat
istic
al s
igni
fica
nce
at th
e 10
%,
5% a
nd 1
% le
vel r
espe
ctiv
ely.
All
the
pane
l reg
ress
ions
incl
ude
coun
try
fixe
d ef
fect
s an
d ro
bust
sta
ndar
d er
rors
clu
ster
ed b
y co
untr
y.
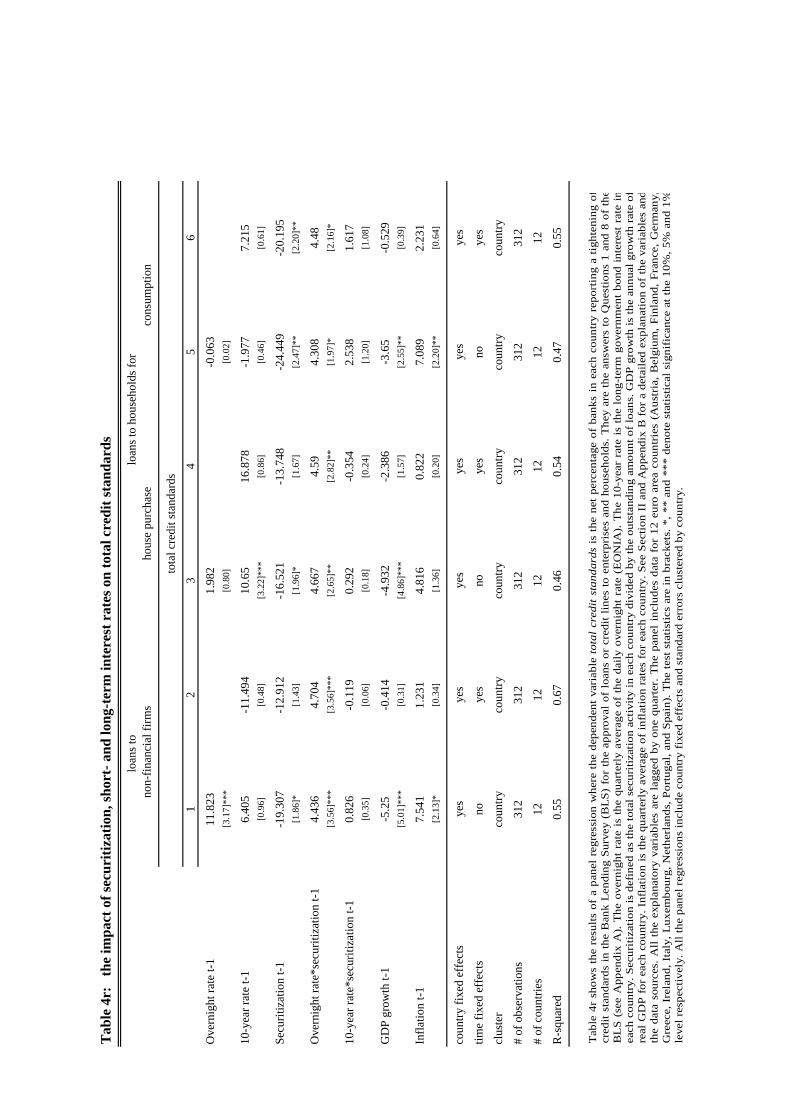
Tab
le 4
r:
the
impa
ct o
f sec
uriti
zatio
n, sh
ort-
and
long
-ter
m in
tere
st r
ates
on
tota
l cre
dit s
tand
ards
12
34
56
Ove
rnig
ht ra
te t-
111
.823
1.98
2-0
.063
[3.1
7]**
*[0
.80]
[0.0
2]
10-y
ear r
ate
t-16.
405
-11.
494
10.6
516
.878
-1.9
777.
215
[0.9
6][0
.48]
[3.2
2]**
*[0
.86]
[0.4
6][0
.61]
Secu
ritiz
atio
n t-1
-19.
307
-12.
912
-16.
521
-13.
748
-24.
449
-20.
195
[1.8
6]*
[1.4
3][1
.96]
*[1
.67]
[2.4
7]**
[2.2
0]**
Ove
rnig
ht ra
te*s
ecur
itiza
tion
t-14.
436
4.70
44.
667
4.59
4.30
84.
48[3
.56]
***
[3.5
6]**
*[2
.65]
**[2
.82]
**[1
.97]
*[2
.16]
*
10-y
ear r
ate*
secu
ritiz
atio
n t-1
0.82
6-0
.119
0.29
2-0
.354
2.53
81.
617
[0.3
5][0
.06]
[0.1
8][0
.24]
[1.2
0][1
.08]
GD
P gr
owth
t-1
-5.2
5-0
.414
-4.9
32-2
.386
-3.6
5-0
.529
[5.0
1]**
*[0
.31]
[4.8
6]**
*[1
.57]
[2.5
5]**
[0.3
9]
Infla
tion
t-17.
541
1.23
14.
816
0.82
27.
089
2.23
1[2
.13]
*[0
.34]
[1.3
6][0
.20]
[2.2
0]**
[0.6
4]
coun
try fi
xed
effe
cts
yes
yes
yes
yes
yes
yes
time
fixed
eff
ects
noye
sno
yes
noye
s
clus
ter
coun
tryco
untry
coun
tryco
untry
coun
tryco
untry
# of
obs
erva
tions
312
312
312
312
312
312
# of
cou
ntrie
s12
1212
1212
12
R-s
quar
ed0.
550.
670.
460.
540.
470.
55
tota
l cre
dit s
tand
ards
loan
s to
non-
finan
cial
firm
slo
ans t
o ho
useh
olds
for
hous
e pu
rcha
seco
nsum
ptio
n
Tab
le 4
r sh
ows
the
resu
lts o
f a
pane
l re
gres
sion
whe
re t
he d
epen
dent
var
iabl
e to
tal
cred
it st
anda
rds
is t
he n
et p
erce
ntag
e of
ban
ks i
n ea
ch c
ount
ryre
port
ing
a tig
hten
ing
ofcr
edit
stan
dard
s in
the
Ban
k L
endi
ng S
urve
y (B
LS)
for
the
app
rova
l of
loa
ns o
r cr
edit
lines
to e
nter
pris
es a
nd h
ouse
hold
s. T
hey
are
the
answ
ers
to Q
uest
ions
1 a
nd 8
of
the
BL
S (s
ee A
ppen
dix
A).
The
ove
rnig
ht r
ate
is t
he q
uart
erly
ave
rage
of
the
daily
ove
rnig
ht r
ate
(EO
NIA
). T
he 1
0-ye
ar r
ate
is t
he l
ong-
term
gov
ernm
ent
bond
int
eres
t ra
tein
each
cou
ntry
. Sec
uriti
zatio
n is
def
ined
as
the
tota
l sec
uriti
zatio
n ac
tivity
in e
ach
coun
try
divi
ded
by th
e ou
tsta
ndin
g am
ount
of
loan
s.G
DP
gro
wth
is th
e an
nual
gro
wth
rat
e of
real
GD
P fo
r ea
ch c
ount
ry. I
nfla
tion
is th
e qu
arte
rly
aver
age
of in
flat
ion
rate
s fo
r ea
ch c
ount
ry. S
ee S
ectio
n II
and
App
endi
x B
for
a d
etai
led
expl
anat
ion
of th
e va
riab
les
and
the
data
sou
rces
. A
ll th
e ex
plan
ator
y va
riab
les
are
lagg
ed b
y on
e qu
arte
r. T
he p
anel
inc
lude
s da
ta f
or 1
2 eu
ro a
rea
coun
trie
s (A
ustr
ia,
Bel
gium
, Fi
nlan
d, F
ranc
e, G
erm
any,
Gre
ece,
Ire
land
, Ita
ly, L
uxem
bour
g, N
ethe
rlan
ds, P
ortu
gal,
and
Spai
n). T
he te
st s
tatis
tics
are
in b
rack
ets.
*, *
* an
d **
* de
note
stat
istic
al s
igni
fica
nce
at th
e 10
%, 5
% a
nd 1
%le
vel r
espe
ctiv
ely.
All
the
pane
l reg
ress
ions
incl
ude
coun
try
fixe
d ef
fect
s an
d st
anda
rd e
rror
s cl
uste
red
by c
ount
ry.
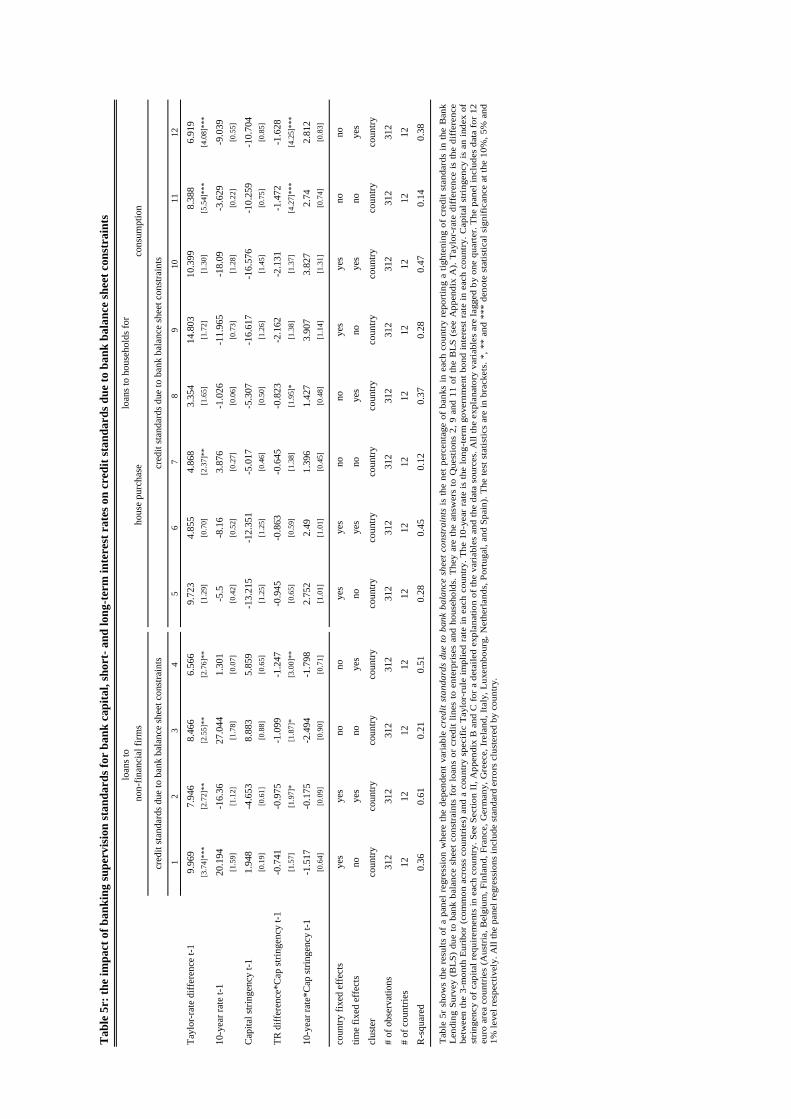
Tab
le 5
r: th
e im
pact
of b
anki
ng su
perv
isio
n st
anda
rds f
or b
ank
capi
tal,
shor
t- a
nd lo
ng-t
erm
inte
rest
rat
es o
n cr
edit
stan
dard
s due
to b
ank
bala
nce
shee
t con
stra
ints
12
34
56
78
910
1112
Tayl
or-r
ate
diff
eren
ce t-
19.
969
7.94
68.
466
6.56
69.
723
4.85
54.
868
3.35
414
.803
10.3
998.
388
6.91
9[3
.74]
***
[2.7
2]**
[2.5
5]**
[2.7
6]**
[1.2
9][0
.70]
[2.3
7]**
[1.6
5][1
.72]
[1.3
0][5
.54]
***
[4.0
8]**
*
10-y
ear r
ate
t-120
.194
-16.
3627
.044
1.30
1-5
.5-8
.16
3.87
6-1
.026
-11.
965
-18.
09-3
.629
-9.0
39[1
.59]
[1.1
2][1
.78]
[0.0
7][0
.42]
[0.5
2][0
.27]
[0.0
6][0
.73]
[1.2
8][0
.22]
[0.5
5]
Cap
ital s
tring
ency
t-1
1.94
8-4
.653
8.88
35.
859
-13.
215
-12.
351
-5.0
17-5
.307
-16.
617
-16.
576
-10.
259
-10.
704
[0.1
9][0
.61]
[0.8
8][0
.65]
[1.2
5][1
.25]
[0.4
6][0
.50]
[1.2
6][1
.45]
[0.7
5][0
.85]
TR d
iffer
ence
*Cap
strin
genc
y t-1
-0.7
41-0
.975
-1.0
99-1
.247
-0.9
45-0
.863
-0.6
45-0
.823
-2.1
62-2
.131
-1.4
72-1
.628
[1.5
7][1
.97]
*[1
.87]
*[3
.00]
**[0
.65]
[0.5
9][1
.38]
[1.9
5]*
[1.3
8][1
.37]
[4.2
7]**
*[4
.25]
***
10-y
ear r
ate*
Cap
strin
genc
y t-1
-1.5
17-0
.175
-2.4
94-1
.798
2.75
22.
491.
396
1.42
73.
907
3.82
72.
742.
812
[0.6
4][0
.09]
[0.9
0][0
.71]
[1.0
1][1
.01]
[0.4
5][0
.48]
[1.1
4][1
.31]
[0.7
4][0
.83]
coun
try fi
xed
effe
cts
yes
yes
nono
yes
yes
nono
yes
yes
nono
time
fixed
eff
ects
noye
sno
yes
noye
sno
yes
noye
sno
yes
clus
ter
coun
tryco
untry
coun
tryco
untry
coun
tryco
untry
coun
tryco
untry
coun
tryco
untry
coun
tryco
untry
# of
obs
erva
tions
312
312
312
312
312
312
312
312
312
312
312
312
# of
cou
ntrie
s12
1212
1212
1212
1212
1212
12
R-s
quar
ed0.
360.
610.
210.
510.
280.
450.
120.
370.
280.
470.
140.
38
cred
it st
anda
rds d
ue to
ban
k ba
lanc
e sh
eet c
onst
rain
tscr
edit
stan
dard
s due
to b
ank
bala
nce
shee
t con
stra
ints
loan
s to
loan
s to
hous
ehol
ds fo
rno
n-fin
anci
al fi
rms
hous
e pu
rcha
seco
nsum
ptio
n
Tab
le 5
r sh
ows
the
resu
lts o
f a
pane
l reg
ress
ion
whe
re th
e de
pend
ent
vari
able
cre
dit s
tand
ards
due
to b
ank
bala
nce
shee
t con
stra
ints
is th
e ne
t per
cent
age
of b
anks
in e
ach
coun
try
repo
rtin
g a
tight
enin
g of
cre
dit s
tand
ards
in
the
Ban
k L
endi
ng S
urve
y (B
LS)
due
to
bank
bal
ance
she
et c
onst
rain
ts f
or lo
ans
or c
redi
t lin
es t
o en
terp
rise
s an
d ho
useh
olds
. The
y ar
e th
e an
swer
s to
Que
stio
ns 2
, 9 a
nd 1
1 of
the
BL
S (s
ee A
ppen
dix
A).
Tay
lor-
rate
dif
fere
nce
is t
he d
iffe
renc
ebe
twee
n th
e 3-
mon
th E
urib
or (
com
mon
acr
oss
coun
trie
s) a
nd a
cou
ntry
spe
cifi
c T
aylo
r-ru
le im
plie
d ra
te in
eac
h co
untr
y. T
he 1
0-ye
ar r
ate
is th
e lo
ng-t
erm
gov
ernm
ent b
ond
inte
rest
rat
e in
eac
h co
untr
y. C
apita
l str
inge
ncy
is a
n in
dex
o f
stri
ngen
cy o
f ca
pita
l req
uire
men
ts in
eac
h co
untr
y. S
ee S
ectio
n II
, App
endi
x B
and
C f
or a
det
aile
d ex
plan
atio
n of
the
vari
able
s an
d th
e da
ta s
ourc
es. A
ll th
e ex
plan
ator
y va
riab
les
are
lagg
ed b
y on
e qu
arte
r. T
he p
anel
incl
udes
dat
a fo
r 12
eu
ro a
rea
coun
trie
s (A
ustr
ia, B
elgi
um, F
inla
nd, F
ranc
e, G
erm
any,
Gre
ece,
Ire
land
, Ita
ly, L
uxem
bour
g, N
ethe
rlan
ds, P
ortu
gal,
and
Spai
n). T
he te
st s
tatis
tics
are
in b
rack
ets.
*, *
* an
d **
* de
note
stat
istic
al s
igni
fica
nce
at th
e 10
%, 5
% a
nd
1% le
vel r
espe
ctiv
ely.
All
the
pane
l reg
ress
ions
incl
ude
stan
dard
err
ors
clus
tere
d by
cou
ntry
.