bank relationships and firms' financial performance: the ... · 3 bank relationships and...
TRANSCRIPT

Annalisa Castelli – Gerald P Dwyer – Iftekhar Hasan
Bank relationships and firms’ financial performance: the Italian experience
Bank of Finland ResearchDiscussion Papers36 • 2009

Suomen Pankki Bank of Finland
PO Box 160 FI-00101 HELSINKI
Finland +358 10 8311
http://www.bof.fi
E-mail: [email protected]

Bank of Finland Research Discussion Papers 36 • 2009
Annalisa Castelli* – Gerald P Dwyer** – Iftekhar Hasan***
Bank relationships and firms’ financial performance: the Italian experience
The views expressed in this paper are those of the authors and do not necessarily reflect the views of the Bank of Finland. * University of Rome, Italy.
Email: [email protected] ** Federal Reserve Bank of Atlanta, USA.
Email: [email protected]. *** Rensselaer Polytechnic Institute, USA and Bank of
Finland. Corresponding author. Email: [email protected]. We thank the Federal Reserve Bank of Atlanta for research support and Linda Mundy for her editorial assistance. We also thank Sabrina Auci, Gianluca Cubadda, Scott Frame, Scott Hein, Robert Marquez, Enrico Santarelli, Tuomas Takalo, Giovanni Trovato, Chris Tucci, and participants in sessions at the XV International Tor Vergata Conference on Banking and Finance and at the Southern Finance Association for helpful comments and suggestions. Two anonymous referees provided helpful, detailed suggestions. The views expressed here are the authors’ and not necessarily those of the Federal Reserve Bank of Atlanta or the Federal Reserve System.

http://www.bof.fi
ISBN 978-952-462-566-1 ISSN 0785-3572
(print)
ISBN 978-952-462-567-8 ISSN 1456-6184
(online)
Helsinki 2009
3
Bank relationships and firms’ financial performance: the Italian experience
Bank of Finland Research Discussion Papers 36/2009
Annalisa Castelli – Gerald P Dwyer – Iftekhar Hasan Monetary Policy and Research Department
Abstract
We examine the connection between the number of bank relationships and firms’ performance using a unique data set on Italian small firms for which banks are a major source of financing. Our evidence indicates that return on equity and return on assets decrease as the number of bank relationships increases, the effects being stronger for small firms than for large firms. We also find that the ratio of interest expense to assets increases as the number of relationships increases. Particularly for small firms, these results are consistent with finding that suggest that having fewer bank relationships reduces the information asymmetries and agency problems and outweighs the hold-up problems. Keywords: bank relationships, small business lending, firms’ performance JEL classification numbers: D21, G21, G32

4
Pankkisuhteiden lukumäärä ja pienten yritysten taloudellinen menestyminen Italiassa
Suomen Pankin keskustelualoitteita 36/2009
Annalisa Castelli – Gerald P. Dwyer – Iftekhar Hasan Rahapolitiikka- ja tutkimusosasto
Tiivistelmä
Tässä työssä tarkastellaan empiirisesti pienten yritysten pankkisuhteiden luku-määrän ja taloudellisen menestymisen välistä riippuvuutta ainutlaatuisessa otok-sessa, johon on kerätty tietoja pääasiassa pankkirahoitusta käyttävistä pienistä italialaisista yrityksistä. Tulosten mukaan sekä yrityksen osakkeiden että muun varallisuuden tuotto heikkenee, kun yrityksen pankkisuhteiden lukumäärä kasvaa. Estimoitu negatiivinen riippuvuus yrityksen pankkisuhteiden ja varallisuuden tuoton välillä on voimakkaampi pienissä yrityksissä kuin suuremmissa yrityksissä. Tulosten mukaan myös korkokulut kasvavat suhteellisesti pankkisuhteiden luku-määrän kasvaessa. Erityisesti pienten yritysten tapauksessa nämä tulokset korosta-vat harvemmista pankkisuhteista saatuja hyötyjä, kun informaation epäsymmetria ja agentuuriongelmat vähenevät. Näin saadut hyödyt ovat tulosten mukaan suu-remmat kuin harvemmille pankkisuhteille mahdollisesta pankin monopolivoiman väärinkäytöstä aiheutuvat haitat. Avainsanat: pankkisuhteet, pienten yritysten lainanotto, yritysten suorituskyky JEL-luokittelu: D21, G21, G32

5
Contents
Abstract .................................................................................................................... 3 Tiivistelmä (abstract in Finnish) .............................................................................. 4 1 Introduction ...................................................................................................... 7 2 Background literature ..................................................................................... 8 2.1 Theory ........................................................................................................ 8 2.2 Empirical literature .................................................................................. 11 2.3 The Italian banking industry .................................................................... 13 3 Empirical analysis .......................................................................................... 14 3.1 Sample ..................................................................................................... 14 3.2 Estimated relationships ............................................................................ 17 4 Conclusions ..................................................................................................... 20 Tables ..................................................................................................................... 22 Figures ................................................................................................................... 34 References .............................................................................................................. 38 Appendix 1 ............................................................................................................. 44 Appendix 2 ............................................................................................................. 45

6

7
1 Introduction
The contemporary literature on relationship banking has developed along two main branches corresponding to the lender’s and the borrower’s side of the issue. In his review of this topic, Boot (2000) characterises relationship banking and evaluates its associated costs and benefits from the lender’s point of view. Ongena and Smith (2000) review the other side of the coin, focusing their analytical review mainly on the effect of bank relationships on customers. This paper takes this latter point of view and focuses on the effect of bank relationships on firms’ performance. Empirical results on the effect of bank relationships on firms’ performance are mixed. For example, using Norwegian data, Degryse and Ongena (2001) find a negative relationship between the number of bank relationships and firms’ performance; using Japanese data, Weinstein and Yafeh (1998) report a positive relationship between the number of bank relationships and firm profitability. Ongena and Smith (2000) summarize various estimates of the average number of bank relationships per firm across a variety of countries and data sets. The main features they highlight are: 1. multiple bank relationships are a common feature in nearly all the data sets; 2. small firms tend to have fewer bank relationships than large firms; and 3. country effects exist, eg firms in the United Kingdom, Norway and Sweden have fewer relationships than firms in Italy, France, Spain, Belgium and Portugal. This paper is based on a rich survey data on the banking relationships of 4,500 Italian manufacturing firms (Capitalia Sample) to examine a set of research questions: How do bank relationships affect firm performance? Is a single bank relationship associated with better performance than relationships with multiple banks? Does duration affect performance? Is there a differential effect connected with a firm’s size? This study contributes to the existing literature in several ways. First, over 95 per cent of the sample firms report multiple lending relationships. This is similar to other continental European Union countries such as Portugal, France, Spain and Belgium which report 95, 91, 98 and almost 100 per cent of firms, respectively, having multiple lending relationships. This is much different than the United Kingdom and Sweden where around 60 per cent of firms report multiple lending relationships. In Norway, studied by Degryse and Ongena (2001), only 30 per cent of the firms have more than one bank. This feature of continental Europe is more evident looking at the median firm of each country (Ongena and Smith, 2000). In Italy the median firm reports twelve banking relationships. In Portugal the median firms uses ten banks, in France nine, and in Belgium and Spain seven. The median Swedish and Norwegian firms report relationships, on average, with two banks. Our results provide evidence for firms in countries with a relatively

8
large number of banking relationships, which is not uncommon in Europe. Second, almost 75 per cent of our sample consists of firms with no more than 50 employees. This predominance of smaller firms in our sample makes it possible to test the effect of the number of banks on small firms’ performance. Third, most of the firms are not listed on a stock exchange. Fourth, the relationship lending we analyse is related to the geographical proximity of the bank and the firm. The evidence reveals that the number of relationships does affect firms’ performance, with performance measured by five different proxies generally declining as the number of relationships increases. This inverse relationship between performance and the number of banking relationships is stronger for smaller firms. The results also show that financing cost – measured by interest expense over assets – increases as the number of relationships increases. These findings are consistent with the positive value of fewer bank relationships – lower information asymmetries and less costly agency problems – outweighing hold-up problems associated with having fewer relationships. The remainder of the paper is organised as follows. Section 2 reviews the theoretical and empirical literature and describes the Italian banking industry. Section 3 describes the data, the empirical specification and presents the estimates. Section 4 concludes.
2 Background literature
2.1 Theory
Part of the literature on the value of a close relationship between a firm and a bank is premised on observations by Fama (1985) and James (1987) that, compared to other forms of financing, bank loans to firms are based on less widely available information. The relationship between a firm and a bank can help to overcome information asymmetries and agency problems that create liquidity constraints which can reduce firms’ investment (Fazzari et al, 1988; Hoshi et al, 1991; Bernanke and Gertler, 1995). These theories suggest that screening and monitoring by banks can overcome information and incentive problems and reduce liquidity constraints for borrowers (Leland and Pyle, 1977; Diamond, 1984; Boyd and Prescott, 1986; Bhattacharya and Thakor, 1993). A bank relationship – a continuing contact between the financial institution and the firm for the provision of financial services beyond simple, anonymous transactions – is associated with the collection of information that can be used to make decisions about the evolution of the contract terms (Berger and Udell, 1998). On the other hand, banks could disseminate, accidentally or on purpose, confidential information to firms’ competitors, and
9
borrowing firms may need to consider negative effects of such dissemination of confidential information.1 Given these preliminary considerations, the main issue that arises is the potential benefit of this relationship for the borrower and the bank. This benefit has to be evaluated taking into account the influence of external factors such as the competitiveness of the environment, the degree of technological diffusion and the level of financial market development. Theoretical analyses suggest that a close relationship between a bank and a firm can reduce information asymmetries, improve the firm’s access to credit and lead to an overall improvement in the firm’s performance. Stiglitz and Weiss (1983) show that the threat of future credit rationing can reduce moral hazard. Diamond (1991) shows that reputation building through bank borrowing can provide certification, which can allow a firm to eventually raise funds on public markets. This benefit of a successful bank relationship raises the cost of default on a bank loan and lowers the equilibrium probability of default. A bank relationship also can reduce agency problems because the risk of a reduction in the amount of bank loans is an incentive for managers to pursue less risky projects (Rajan, 1992).2 On the same line, von Thadden (1995) shows that the efficiency of investment is improved by a debt contract with periodic monitoring. Moreover, borrowing from banks allows firms to keep information confidential, not requiring the widespread disclosure typical of others sources of financing.3 This line of argument suggests that a closer bank relationship will be associated with better firm performance and that a small firm’s optimal strategy is to establish a long-term relationship and to borrow from one or perhaps a limited number of banks. The empirical observation of multiple, time-varying relationships, however, led economists to consider other factors. If a bank and a firm have a long-term relationship, the bank can acquire a great deal of unique information about a firm and the bank may be able to exploit this, a problem which is called a hold-up problem in game theory. Various theoretical contributions emphasise the information-capture problems and the presence of fixed costs associated with the search for a new bank. On the one side, Sharpe (1990) suggests that long-lasting bank and firm relationships arise because high quality firms are ‘informationally captured’, meaning that the firms are unable to convey information about their quality to other banks. On the other side, Blackwell and Santomero (1982) highlight the inertia linked to search costs borne by a firm looking for a new source of funds. In a repeated game with moral hazard 1 Rheinbaben and Ruckers (2004) show that the number of bank relationships can increase with a firm’s age and size. 2 Boot and Thakor (1994) examine optimal contract design in a model in which banks provide firms with contracts that require high initial collateral combined with interest payments that fall when the bank has verified the successful completion of financed projects. 3 This is particularly important for innovating and R&D-investing firms, as highlighted by Yosha (1995) and Bhattacharya and Chiesa (1995).

10
and adverse selection, Petersen and Rajan (1995) show that the reduction of the interest rate due to information acquired about the borrower is limited in more concentrated credit markets, and motivate this result by arguing that these markets are characterised by more severe hold-up problems. Von Thadden (1998) shows that a single bank with better information about a firm can impose hold-up costs that can adversely affect the borrowers’ value. These additional costs can be lessened or eliminated by multiple banking relationships. The duration of a relationship between a firm and a bank also plays a role. Greenbaum et al (1989) present a model that includes search costs for firms looking for new banks and show that the borrowing rate is a non-decreasing function of the duration of the credit relationship and that the probability that a firm will terminate a relationship is positively associated with its duration. Longhofer and Santos (2000) demonstrate how during a recession firms that have ongoing relationships with a bank are better able to obtain additional financing, allowing them to weather the recession with minimal loss. These effects of relationships between banks and firms are likely to be more important for relatively small firms, because small firm have a higher cost – often prohibitively higher – of obtaining investment funds from financial markets and rely heavily on banks as primary credit sources. Small firms tend to borrow from banks and to borrow from a few banks with which they have a long-term relationship. These relationships are an important feature of small business lending. As noted by Berger and Udell (1998), perhaps the most important characteristic defining small business finance is informational opacity: small firms usually do not enter into contracts that are publicly visible, do not have audited financial statements and consequently can have difficulty building reputations to signal high quality. Since there may be little public information available on small firms, relationship lending enables banks to collect private information on the credit-worthiness of these firms (Strahan and Weston, 1998). These factors suggest that relationship lending may be particularly beneficial to small firms, including lower cost or greater availability of credit, protection against credit crunches, and the provision of implicit interest rate or credit risk insurance. On the other side, for a small firm with a single relationship, an interruption of the credit line from the bank can be interpreted as a bad signal about the firm even if the withdrawal of the credit is not linked to financial distress of the small business but others are uncertain about the reason for the credit withdrawal. As a result, small firms can have multiple banking relationships, which have higher transactions costs but also greater benefits than a single relationship (Berger and Udell, 1998).

11
2.2 Empirical literature
Although the empirical implication of recent theoretical models seems to be in favour of single versus multiple relationships lending, we have shown in the previous section how the value of a single and close bank firm relationship remains unclear. A brief review of the empirical literature adds complexity to the issue by highlighting contrasting results. Studies of financial markets’ responses to announcements of bank loans usually indicate a positive effect of new bank loans on firms’ values (Slovin, Johnson and Glascock, 1992; Best and Zhang, 1993; Shockley and Thakor, 1998). Analysis of bank lending behaviour focused on banks’ liabilities suggests that, thanks to their access to core deposits, banks can protect themselves from exogenous shocks and consequently insulate long-term borrowers from exogenous credit shocks (Berlin and Mester, 1999). There are exceptions. For example, Kang and Stulz’s (2000) results for a sample of Japanese firms indicate better performance for firms not financed by banks compared to firms with high shares of bank debt. Empirical evidence on the effects of single versus multiple banking relationships on firms’ performance is mixed. Angelini, Di Salvo and Ferri (1998), studying a sample of small Italian firms, find evidence that liquidity constraints are relatively less frequent for firms borrowing from a limited number of banks, with a resulting positive impact on firms’ performance. Petersen and Rajan (1994) find that multiple bank relationships are associated with higher interest payments and more credit constraints. Using a data set on Norwegian publicly listed firms, Degryse and Ongena (2001) find a negative two-way correspondence between the number of relationships and sales profitability and also find that firms deciding to switch from single to multiple relationships are on average smaller and younger than firms choosing not to switch. Fok, Chang and Lee (2004) apply the Degryse and Ongena methodology to a sample of Taiwanese firms and find a negative link between firms’ performance and the number of bank relationships, consistent with Degryse and Ongena’s results. Harhoff and Korting (1998) and Cole (1998) report increasing limits to credit access for firms borrowing from more than one bank. In sharp contrast with these findings, Houston and James (1995, 1996) find a negative correlation between firm’s reliance on one bank and growth potential plus evidence that firms with one banking relationship also face more credit constraints than those with multiple relationships. Detragiache et al (2000) suggest that multiple banking relationships can diversify liquidity risk. By empirically testing a model of the optimal number of bank relationships, they find that multiple bank relationships decrease the probability of an interruption of funding due to a lender’s internal problems. Forestieri and Tirri (2002), studying the relationships between Italian firms and

12
banks, find that the costs associated with a single long-lasting relationship are higher than the corresponding benefits. Turning to the empirical literature that investigates the impact of bank relationship on small firms’ performance, data for the United States, Japan and almost all European Union (EU) countries indicate that small firms tend to borrow from fewer banks than large firms (Ongena and Smith, 2000). This is in line with theoretical models which suggest that relationship lending can have a number of benefits for small firms including lower cost or greater availability of credit due to efficient gathering of information, protection against credit crunches and provision of implicit interest rate or credit risk insurance (Berger and Udell, 1998). Berger, Klapper and Udell (2001) find that Argentinean firms tend to borrow from more than one bank when their primary bank is financially distressed and that smaller firms prefer exclusive lending relationships. Based on US data, Petersen and Rajan (1995) find that small and young firms tend to be less credit constrained and to receive better lending rates when they borrow from only one bank. This result is stronger in more concentrated credit markets, suggesting that small borrowers may be worse off with competition among banks. Cole’s (1998) evidence indicates that the existence of a single bank relationship increases the probability of extension of credit for small businesses in the US. Ongena and Smith (2001) in their study of publicly traded Norwegian firms find that the probability of ending a bank relationship increases over time, suggesting a corresponding decrease in the value of the relationship. Surprisingly, the shortest relationships are those of young, small and highly leveraged borrowers that usually are considered to be highly dependent on bank financing. These effects altogether lead to a conclusion that firms do not seem to become locked into bank relationships, which could be interpreted as raising some doubt about the value of bank relationships. Some more general results suggest that long-term relationships improve credit access by reducing both funding costs (Berger and Udell, 1995; Elsas and Krahnen, 1998) and collateral requirements (Berger and Udell, 1995; Harhoff and Korting, 1998; Degryse and Van Cayseele, 2000). Berlin and Mester (1997) show how loan-rate smoothing in response to interest-rate shocks is part of an optimal long-term contract between a bank and a firm. De Bodt, Lobez and Statnik (2005), using Belgian data, highlight that there is no unique strategy for a small firm’s choice of the optimal number of banking relationships. This choice instead depends on two factors: characteristics of the main bank, namely whether it is small or large and local or national; and the degree of opacity that characterizes the small firm. More recently, Iannotta and Navone (2008) examine the effect of a banking relationship on bond underwriting fees in about 2,200 bond issues completed by European firms from 1993 to 2003. They find that a strong relationship between
13
an issuer and the issuer’s main bank reduces underwriting fees, a result consistent with the positive value of information acquired in the banking relationship.4
2.3 The Italian banking industry
During the last 20 years, Italian banking has gone through a process of consolidation common to all European banking systems. Although this process has led to an overall improvement of the sector’s efficiency, the system still has some unique aspects. Italian banks have been isolated simply due Italy’s higher protective regulations. Most of the banks have reacted to the sharper competition by cutting costs and expanding in size, often by merging with competitors. While the 1990s experienced a large number of mergers creating a few large regional institutions, as well as national banks, smaller local banks still dominate local deposit markets. While these consolidations decreased the number of banking institutions, the deregulation of branching activities increased the number of bank branches by almost 75 per cent. Focusing on the period considered in our empirical estimates, as Table 1 shows, the number of Italian banks decreased from 921 in 1998 to 841 in 2000 while the number of branches increased from 26258 to 28177 respectively. During the same period there were 176 mergers and acquisitions (M&As) which transferred 33.4 per cent of total intermediated funds.5 There were 85 banking groups at the beginning of 1998 and 74 at the end of 2000. After this wave of M&As, market concentration as measured by the Herfindahl – Hirschmann Index fell from 210 to 190. The consolidation process has not changed the main characteristic of the relationship between Italian banks and firms, which continues to be mainly based on their geographical proximity. The importance of proximity is the main reason why so many local banks survived the consolidation process and big banks continue to maintain many branches scattered all over the nation. The national banks have been able to exploit scale economies without eliminating the relatively small local banks which have maintained their substantial role in financing firms. This coexistence is similar to the continued existence of community banks in the US after the adoption of the Riegle-Neal Act which permits banks to have branches across state boundaries (Angelini and Cetorelli, 2003; De Young, Hasan and Kirchhoff, 1997).
4 The strength of a banking relationship is measured by the repeated use of the main bank in similar transactions. 5 M&As between banks already belonging to the same group are not included.

14
This type of banking structure can have consequences for lending relationships. As Brickley, Linck and Smith (2003) suggest, small locally owned banks can have a comparative advantage over large banks in specific environments. On the same line of reasoning, Hein, Koch and MacDonald (2005) note that banks are not homogeneous financial intermediaries and, in the US, small community banks operate very differently from large banks. While community banks generally emphasize relationship banking, large banks rely on transactional banking in which they provide highly standardized services based on readily available, quantifiable information with little human input. Data limitations restrict our ability to control for differences in lenders but, as highlighted in the description above, the Italian banking system still is mainly focused on relationship banking. Such banking and lending relationships involve the use of soft information, not easily available and quantifiable. Such information requires human input and evaluation and is acquired mainly by working one-on-one with the banking customer.
3 Empirical analysis
3.1 Sample
The data in this paper are from the Capitalia Survey, which is one of the most important qualitative and quantitative information sources on Italian firms. The survey has been conducted to create a sample of 4,680 Italian manufacturer firms which have ten or more employees.6 The sample has been stratified by size classes based on the number of employees, geographical areas – North-East, North-West, Central Regions, South and Isles – and sectors – the Pavitt classification (Pavitt 1984) – with each strata obtained using the Neyman formula with value added per employee as a stratifying factor.7 Balance sheet and income statement data are from the CERVED database which collects information from the Italian Chamber of Commerce. Qualitative data are obtained from questionnaires answered by a representative of each firm and then checked for inconsistencies. The years included in our sample are 1998, 1999 and 2000. From the total sample, we select firms for which complete balance sheets and income statements are available. We select firms with positive values of total
6 Manufacturing is the main contributor to Italian GDP and loans financing fixed investment are the underlying objects of the bank relationships examined in this paper. 7 The size classes are 11–20, 21–50, 51–250, 251–500, and more than 500. The macroareas are North East (Trentino Alto Adige, Veneto, Friuli Venezia Giulia and Emilia Romagna), North West (Piemonte, Valle d’Aosta, Lombardia and Liguria), Central (Toscana, Umbria, Marche and Lazio), and South and Isles (Abruzzo, Molise, Campania, Puglia, Basilicata, Calabria, Sicilia and Sardegna). The sectors are scale Economies, specialised, traditional, and high technology.
15
assets, net worth and net sales. In order to eliminate the influence of extreme values, we discard observations according to the following rules: 1. return on equity (ROE) greater than 100 per cent or lower than -20 per cent; 2. return on assets (ROA) greater than 30 per cent or lower than -20 per cent; 3. ratio of total sales to total assets greater than 300 per cent or less than 20 per cent; or 4. number of bank relationships greater than 50. The result is an unbalanced sample including 3,566 firms for 1998, 3,601 firms for 1999 and 3,597 firms for 2000, with a total of 10,764 firm-year observations. Table 2 shows the classification of the firms across industries as measured by the ATECO 1998 code. Within the manufacturing sector, the firms belong mostly to Food, beverage and tobacco (9 per cent), Textile knitwear and clothing (12.5 per cent), Wood and wooden furniture (8.5 per cent), Metal products (15 per cent) and Mechanical equipment (9 per cent).8 In order to investigate differential effects linked to firm size, we divide the full sample into size classes based on the number of employees. Small firms (10 to 50 employees) are 76.5 per cent of the total sample; medium firms (51 to 250 employees) are 17.2 per cent of the total; and large firms (greater than 250 employees) are 6.3 per cent of the total. The large number of small firms stands out clearly from the comparison of means and medians in Table 2, which is consistent with one of the main characteristics of Italian industry – the relatively small size of firms compared to other countries. Descriptive statistics on the firms’ ages show that average age ranges from 19 to 33 years across sectors with the oldest firms belonging to the food, beverage and tobacco sector. Information on the number and duration of bank relationships is based on the firms’ answers to questions on ‘the number of banks with which they had commercial relationships at the end of (for example) 2000’ and ‘the number of years for which a bank has been their main lender’. We are explicitly considering only bank loans and not other types of credit such as trade credit. During the period considered, 4 per cent of the firms say that they have a single bank relationship, 63 per cent have two to five bank relationships, and the remaining 33 per cent have six or more bank relationships. By size class, relatively more small firms have relationships than do medium and large firms (4.7, 1.0 and 1.3 per cent respectively). Descriptive statistics on these variables are reported in Table 3. On average, small firms are younger than medium and large firms and have somewhat shorter relationships with banks. All three age classes of firms report 8 The ATECO 1998 classification corresponds to NACE rev. 1.1. The manufacturing sector (section D) covers the following industries: 1. Food, beverage and tobacco; 2. Textile, knitwear and clothing; 3. Leather and shoes; 4. Wood and wooden furniture; 5. Paper and printing; 6. Chemicals; 7. Rubber and plastics; 8. Glass and ceramics; 9. Construction materials; 10. Metal extractions; 11. Metal products; 12. Mechanical materials; 13. Mechanical equipment; 14. Electronics; 15. Electrical equipment; 16. Precision instruments and apparel; 17 Vehicles and vehicle components; 18. Other transports; 19. Energy; and 20. Other manufacturing.

16
quite long average durations of main relationships – 17 years for small firms and almost 19 years for medium and large firms. Nine out of ten firms have relationships that last more than five years. As proxies for firms’ performance, we use five different ratios: ROA, ROE, interest expense over assets, non-interest expense over assets, and sales over assets. Details on the calculation of these variables are included in Appendix 1. Table 4 reports summary statistics on these performance measures broken down by firm size. Table 4 suggests that small firms have relatively better performance than the average as measured by all performance variables except ROA. Tables 5 and 6 present summary statistics on the performance measures broken down by size and number of bank relationships and by size and duration of the main relationship. For this summary, we divide the number of bank relationships and the duration of the main relationship into three groups (in table 5, bank relationships are grouped into single relationships, 2 to 5 relationships, more than 5 relationships; in table 6, the duration of the main relationship is grouped into 1 to 2 years, 3 to 5 years, more than 5 years). Table 5 shows lower values of all performance indicators as the number of bank relationships increases both for the total sample and for small firms. This relation fades when considering medium and large firms. For medium firms, we find lower interest expense over assets always is associated with a single relationship, while evidence on other variables is mixed. The same happens for large firms. Table 6 highlights how the cost of credit is higher at the beginning of the relationship for small and medium firms but not for large firms and how performance as measured by ROA increases with the duration of the relationship. One reason why the Capitalia Sample is particularly interesting is that it captures lending relationships not captured by the Central Credit Register (CCR).9 The CCR in fact, collects information on individual firms asking for credit from banks above the threshold of 150 million liras or approximately 75,000 dollars in 1998. The bank-firm relationships captured by our sample instead are mostly smaller as indicated by the per centiles reported in table 7. Even if the average debt of firms is about 1,929.5 million liras in the short term, 40 per cent of the firms declare zero bank debt. This is particularly true for small firms which have an average bank debt of 1,872.5 million liras in the short run. This means that almost 50 per cent of our sample is below the threshold of the CCR.
9 The Central Credit Register is a databank coordinated by the Bank of Italy, which collects information from all banks on individual borrowers. It is one of the most reliable and complete data sets on Italian lending relationships.
17
3.2 Estimated relationships
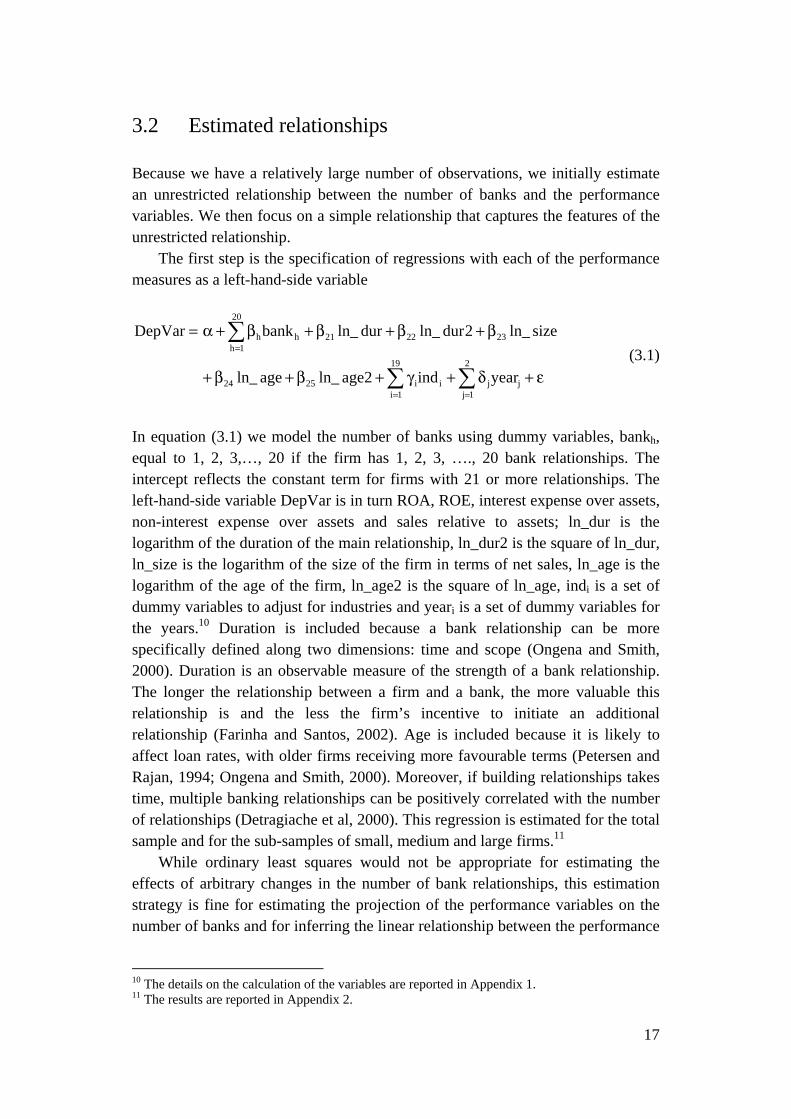
Because we have a relatively large number of observations, we initially estimate an unrestricted relationship between the number of banks and the performance variables. We then focus on a simple relationship that captures the features of the unrestricted relationship. The first step is the specification of regressions with each of the performance measures as a left-hand-side variable
ε+δ+γ+β+β+
β+β+β+β+α=
==
=
j
2
1jji
19
1ii2524
232221h
20
1hh
yearind2ageln_ageln_
sizeln_2durln_durln_bankDepVar
(3.1)
In equation (3.1) we model the number of banks using dummy variables, bankh, equal to 1, 2, 3,…, 20 if the firm has 1, 2, 3, …., 20 bank relationships. The intercept reflects the constant term for firms with 21 or more relationships. The left-hand-side variable DepVar is in turn ROA, ROE, interest expense over assets, non-interest expense over assets and sales relative to assets; ln_dur is the logarithm of the duration of the main relationship, ln_dur2 is the square of ln_dur, ln_size is the logarithm of the size of the firm in terms of net sales, ln_age is the logarithm of the age of the firm, ln_age2 is the square of ln_age, indi is a set of dummy variables to adjust for industries and yeari is a set of dummy variables for the years.10 Duration is included because a bank relationship can be more specifically defined along two dimensions: time and scope (Ongena and Smith, 2000). Duration is an observable measure of the strength of a bank relationship. The longer the relationship between a firm and a bank, the more valuable this relationship is and the less the firm’s incentive to initiate an additional relationship (Farinha and Santos, 2002). Age is included because it is likely to affect loan rates, with older firms receiving more favourable terms (Petersen and Rajan, 1994; Ongena and Smith, 2000). Moreover, if building relationships takes time, multiple banking relationships can be positively correlated with the number of relationships (Detragiache et al, 2000). This regression is estimated for the total sample and for the sub-samples of small, medium and large firms.11 While ordinary least squares would not be appropriate for estimating the effects of arbitrary changes in the number of bank relationships, this estimation strategy is fine for estimating the projection of the performance variables on the number of banks and for inferring the linear relationship between the performance
10 The details on the calculation of the variables are reported in Appendix 1. 11 The results are reported in Appendix 2.

18
variables and the number of relationships.12 We stress that we are looking at projections and not at structural equations. The question we are answering is: ‘Conditional on the actual number of relationships, what is the firm’s performance?’ and not ‘For arbitrary numbers of relationships, what is the firm’s performance?’ In other words, we are not trying to predict the effect of a firm changing the number of its relationships for some reason; we are predicting the performance based on the number of relationships that the firm has. These regressions estimate exactly that conditional relationship. Previous theoretical and empirical work on the same issue focusing both on Italy and on other countries has considered the number of relationships to be an endogenous variable (eg Detragiache et al, 2000). Although our question is a bit different as highlighted in the previous paragraph, we have taken into account the endogeneity issue performing instrumental-variable estimation using the Lewbel methodology (Lewbel, 1997) and performing simultaneous-equation estimation (Alfò and Trovato, 2006). The results are in line with those presented and are available upon request. We then estimate a restricted equation (3.2) in which the number of bank relationships is represented by a second-order polynomial.13 The equation with a second-order polynomial is
ε+δ+γ+β+β+β+
β+β+β+β+α=
==
j
2
1jji
19
1ii765
4321
yearind2ageln_ageln_sizeln_
2durln_durln_2bankln_bankln_DepVar
(3.2)
where, ln_bank is the logarithm of the number of banks and ln_bank2 is the square of the logarithm of the number of banks.14 Table 8 reports the results of F-tests to test restricting the general regression with dummies (3.1) to the regression with a second-order polynomial (3.2) for each of the performance variables. The p-values provide mixed evidence, with the number of banks in some instances seeming not to be well summarised by a second-order polynomial function of the number of banks. On the other hand, given the large number of observations, it is possible that these differences are statistically but not economically significant. To examine economic significance, we plot the values of the implied performance variables by number of banks in Figures 1 to 4 for all banks and for 12 For example, the variation in the number of relationships in our data seldom if ever is due to liquidity problems at banks. Ordinary least squares would provide a consistent estimator of the effect of such liquidity problems only if the effect of such problems on the number of relationships and performance were the same as the estimated relationship due to other factors. 13 Estimation with the number of banks and with the natural logarithm of number of banks indicated that the natural logarithm fits better. 14 We decided which control variables to include in our estimations after checking several different specifications and testing for possible correlation and misspecification problems.

19
the three size classes. The graphs in these figures, each of which shows the coefficients of the dummy variables and the values implied by the second-order polynomial, make it possible to examine the differences between the two estimated relationships and decide on the economic significance of deviations from the restricted equation. The polynomial is a reasonably close approximation for about ten or fewer bank relationships. The dummy variables estimate a more erratic relationship between the performance variables and the number of relationships as the number of relationships increases. This is not surprising, given that most of the banks have five or fewer relationships and as few as three firms underlie the estimated coefficients of the dummy variables at higher numbers of relationships. For example, there are only three small firms with 20 bank relationships. This relative paucity of underlying data suggests putting less weight on the point estimate of the coefficient shown in Figure 2 for 20 relationships than on the coefficients based on more observations. Overall, we conclude that the simple nonlinear function well approximates the more general estimated relationship and focus on those results. The p-values are mixed, but the estimated effects for the numbers of relationships are quite similar for numbers of relationships with many observations. The figures show generally consistent results for the small firms, which are the largest part of the sample of all firms. ROA and ROE generally decline with the number of relationships, interest expense over assets generally increases, non-interest expense over assets shows some evidence of decreasing as the number of relationships increases and sales over assets decrease. Table 9 reports the regressions including the logarithm of the number of banks linearly and squared.15 F-statistics indicate that the estimated coefficients of the number of banks are statistically significant for all regressions for small and medium firms at any usual significance level. The F-statistics indicate that, even for the largest firms, the number of banks is statistically significant at the five per cent significance level for ROA and interest expense over assets, and at the 5.2 per cent level for ROE. Figures 1 through 4 show that these statistically significant relationships generally are economically significant as well, with the relationships most marked for small firms and hardly apparent for large firms. These figures also show that a larger number of bank relationships is associated with lower ROA and ROE, higher interest expense over assets, lower non-interest expense over assets and lower sales over assets. These results support the hypothesis that better performing firms are more likely to have a smaller number of bank relationships than more poorly performing firms. This indicates that the benefits of fewer relationships in terms of reduction of information asymmetries and agency problems outweigh the negative effects connected to hold-up problems. The clear negative relationship between firms’ performance and the
15 The unrestricted regressions with dummy variables are reported in Appendix 2.

20
number of bank relationships for small firms also suggests how multiple bank relationships are associated with worse performance by small firms. Due to the heavy reliance of this group of firms on bank credit, the lower cost or the greater availability of credit due to efficient gathering of information derived from a close relationship acquires a great importance. F-statistics also indicate that the duration of the main relationship is important for these performance variables, as is the age of the firm. Although our results do not show a clear path of the interaction between duration, age and firms’ performance, the values of the F-statistics suggest that these measures add important elements in explaining the relationship between number of bank relationships and firms’ performances, which is the main task of this paper. The duration of the lending relationship and the age of the firm become measures of the information generated over time that represent the possibility for the bank to gain private information about the borrower and the risk for the latter to be locked in that relationship. This interpretation of our results is strengthened by the fact that, as highlighted in paragraph 2.3, the Italian banking system is mostly based on local bank and small firm relationships. One of the consequences of this kind of structure is that neither small nor large banks usually give credit without the provision of adequate collateral, particularly for small firms even those with good projects and good profit expectations. The credit-risk evaluation mostly is based on the collateral instead of the firm’s history, future projects and the expected return on the investment proposed. This creates particular mechanisms for accessing credit. The firm’s owner usually uses personal belongings as collateral. That is why most firms maintain relationships with more than one bank and is in line with the fact that only 4% of the firms report single relationships. In summary, firms with poor prospects are unable to maintain a single banking relationship and therefore seek out multiple relationships; their choice is partly due to the peculiarities of the environment they work in.
4 Conclusions
Based on data for Italian manufacturing firms, this paper investigates the effect on firms’ performance of their financing strategy in terms of the number of lenders. This includes an analysis of possible differential effects related to firms’ sizes. The sample has three distinctive features compared to data used in prior studies: 1. five per cent of the firms have a single bank relationship and 66 per cent report two to five relationships; 2. about 75 per cent of the firms are small with no more than 50 workers; and 3. about 99 per cent of the firms are not listed on a stock exchange.

21
We find that a firm’s performance measured by return on assets and return on equity decreases as the number of bank relationships increases. This negative association between a firm’s performance and the number of relationships is stronger for small firms. We also find that interest expense over assets increases with the number of relationships, which may indicate a higher interest rate or more borrowing. This estimated negative association between the number of bank relationships and a firm’s performance strengthens similar findings in other countries (Degryse and Ongena, 2001 and Fok, Chang and Lee, 2004). Additionally, the results are consistent with the positive value of fewer bank relationships in reducing information asymmetries and agency problems, where these positive effects outweigh hold-up problems.

22
Tables
Table 1. Statistics on the Italian banking system Statistics for the Italian banking system on 1. the number of banks, 2. the number of branches, 3. the number of groups, 4. the number of banks belonging to a group, and 5. the market share of 5 bigger groups, 6. the market share of 10 bigger groups, and 7. the Herfindahl Hirshmann Index which is the sum of the squares of all the credit institutions’ market shares based on total assets with a scale from zero with an infinite number of banks to 10,000 with one bank.
Number of banks
Number of
branches
Number of groups
Number of banks
belonging to a
group
Market share of 5
bigger groups
Market share of 5
bigger groups
Herfindahl Hirshmann
Index
1998 921 26258 85 200 42% 58% 210 1999 876 27134 79 208 50% 63% 220 2000 841 28177 74 217 54% 67% 190
Sources: Bank of Italy Annual Report and ECB Report on EU Banking Structure, 2004.

23
Table 2. Sample distribution across industries Descriptive statistics of the Capitalia Sample on the 1. percentage of firms belonging to an industry, 2. size measured as the number of employees working in the firm, and 3. age measured by the number of years the firm exists.
Size (n. of employees) Age (years) % of
firms Min mean
median
sd max
Min
mean
median
sd maxFood, beverage and tobacco 8.8 5 57.36 24 122.29 1221 1 33.48 29 25.08 147Textile, knitwear and clothing 12.4 3 80.88 26 159.35 1279 1 24.32 19 20.26 171Leather and shoes 4.5 11 45.28 28 55.56 428 1 19.90 16 13.34 77Wood and wooden furniture 8.5 10 48.64 25 71.14 650 1 22.73 19 22.25 312Paper and printing 6.0 8 47.75 20 98.53 863 1 26.15 21 19.69 141Chemicals 4.1 10 109.33 25 253.85 1955 1 30.05 24 23.15 182Rubber and plastics 5.2 10 69.32 26 177.58 2250 1 21.57 19 13.97 95Glass and ceramics 1.9 10 212.11 31 530.49 3600 1 26.03 22 22.23 137Construction materials 4.1 8 42.56 21.5 74.52 650 3 24.65 23 14.22 119Metal extractions 1.8 9 145.53 35 360.17 2886 1 26.09 22 16.32 71Metal products 15.0 7 45.18 23 74.85 650 2 22.53 20 14.83 162Mechanical materials 2.8 12 122.12 44.5 184.85 1130 2 25.38 23 15.22 94Mechanical equipment 8.7 9 63.33 29 126.60 1715 2 25.03 21 16.83 116Electronics 4.5 7 153.34 29 758.48 8625 1 19.66 18 11.94 61Electrical equipment 0.5 13 291.48 64.5 856.43 3800 2 21.10 20.5 10.92 42Precision instruments and apparel 1.1 12 149.03 32 483.24 3322 4 25.48 21 17.40 74Vehicles and vehicle components 2.1 12 190.60 37 384.74 2132 1 23.47 19.5 17.04 103Other transports 0.7 11 156.10 25.5 373.81 1760 2 26.54 21.5 16.77 70Energy 0.2 14 23.52 16 18.91 73 6 19.12 18 7.43 32Other manufacturing 7.1 6 78.85 25 216.51 2905 2 22.36 19 15.98 131

Tab
le 3
. D
escr
ipti
ve s
tati
stic
s fo
r th
e ca
pit
alia
sam
ple
Des
crip
tive
sta
tist
ics,
gro
uped
by
size
cla
sses
, on
the
1.
num
ber
of b
anks
wit
h w
hich
the
fir
m h
as a
com
mer
cial
rel
atio
nshi
p, 2
. th
e du
rati
on o
f th
e m
ain
rela
tion
ship
in
year
s an
d 3.
the
age
of
the
firm
mea
sure
d as
200
1 m
inus
the
yea
r of
bir
th. O
bs. i
s th
e nu
mbe
r of
obs
erva
tion
s on
eac
h fi
rm i
n ea
ch y
ear.
The
si
ze c
lass
es a
re s
mal
l (fr
om 1
to 5
0 em
ploy
ees)
, med
ium
(fr
om 5
1 to
250
em
ploy
ees)
and
larg
e (g
reat
er th
an 2
50 e
mpl
oyee
s).
S
mal
l
Med
ium
Lar
ge
A
ll
ba
nks
dura
tion
ag
e
bank
s du
rati
onag
e
bank
s du
rati
on
age
ba
nks
dura
tion
age
Mea
n 4.
4 17
.0
22.2
7.2
19.8
29
.7
10
.5
19.3
37
.9
5.
2 17
.6
24.5
M
edia
n 4
15
19
6
20
26
10
15
32
4 15
20
S
d 2.
5 12
.0
16.6
4.0
13.2
19
.8
7.
1 16
.2
28.0
3.6
12.5
18
.6
min
1
1 1
1
1 1
1
1 1
1
1 1
Max
33
19
1 31
2
35
100
182
50
10
0 17
1
50
191
312
obs.
82
00
7790
82
36
18
37
1712
18
50
59
9 50
9 67
8
1063
6 10
011
1076
4

Tab
le 4
. S
um
mar
y st
atis
tics
of
firm
s p
erfo
rman
ce in
dic
ator
s b
rok
en d
own
by
size
S
umm
ary
stat
isti
cs o
n 1.
RO
A, t
he r
atio
of
net e
arni
ngs
to to
tal a
sset
s, 2
. RO
E, t
he r
atio
of
net e
arni
ngs
to n
et w
orth
, 3. i
nter
est o
ver
asse
ts, t
he r
atio
of
inte
rest
ex
pens
e to
tota
l ass
ets,
4. n
on-i
nter
est o
ver
asse
ts, t
he r
atio
of
non-
inte
rest
exp
ense
to to
tal a
sset
s, a
nd 5
. sal
es o
ver
asse
ts, t
he r
atio
of
net s
ales
to t
otal
ass
ets.
A
ll v
aria
bles
are
in p
erce
ntag
e te
rms.
The
sam
ple
is f
rom
199
8 to
200
0. T
he n
umbe
r of
fir
m-y
ear
obse
rvat
ions
is 1
0,76
4. T
he s
ize
clas
ses
are
smal
l (fr
om 1
to
50 e
mpl
oyee
s), m
ediu
m (
from
51
to 2
50 e
mpl
oyee
s) a
nd la
rge
(gre
ater
than
250
em
ploy
ees)
.
All
(ob
s. 1
0764
)
Sm
all (
obs.
823
6)
m
ean
med
ian
sdm
inm
ax
m
ean
med
ian
sdm
inm
ax
RO
A
2.57
0.95
4.33
-11.
3529
.80
2.
540.
854.
41-1
1.3
29.8
0 R
OE
9.
905.
5115
.60
-20.
0099
.05
10
.14
5.45
16.1
4-2
0.00
99.0
5 In
tere
st o
ver
Ass
ets
2.34
2.03
1.91
062
.06
2.
412.
081.
870
26.3
4 N
on-i
nter
est o
ver
Ass
ets
55.9
450
.69
28.6
31.
3326
7.90
57.9
453
.23
29.7
41.
3326
7.90
S
ales
ove
r A
sset
s 12
5.51
119.
7147
.10
20.0
429
9.39
129.
3412
4.66
48.7
320
.04
299.
39
M
ediu
m (
obs.
185
0)
L
arge
(ob
s. 6
78)
m
ean
med
ian
sdm
inm
ax
m
ean
med
ian
sdm
inm
ax
RO
A
2.51
1.09
4.01
-7.0
226
.03
3.
112.
114.
13-1
1.03
25.1
0 R
OE
8.
875.
0513
.94
-19.
9798
.26
9.
717.
5812
.87
-19.
5985
.77
Inte
rest
ove
r A
sset
s 2.
161.
902.
200
62.0
6
2.09
1.85
1.44
013
.87
Non
-int
eres
t ove
r A
sset
s 51
.20
46.5
624
.93
5.23
219.
10
44
.59
41.7
218
.42
6.01
164.
74
Sal
es o
ver
Ass
ets
115.
8711
0.65
39.8
224
.28
298.
13
10
5.20
103.
6334
.83
21.9
628
9.25

Tab
le 5
. S
um
mar
y st
atis
tics
of
firm
s’ p
erfo
rman
ce b
y si
ze a
nd
nu
mb
er o
f re
lati
onsh
ips
wit
h b
ank
s S
umm
ary
stat
isti
cs o
n 1.
RO
A, t
he r
atio
of
net e
arni
ngs
to to
tal a
sset
s, 2
. RO
E, t
he r
atio
of
net e
arni
ngs
to n
et w
orth
, 3. i
nter
est o
ver
asse
ts, t
he r
atio
of
inte
rest
ex
pens
e to
tota
l ass
ets,
4. n
on-i
nter
est o
ver
asse
ts, t
he r
atio
of
non-
inte
rest
exp
ense
to to
tal a
sset
s, a
nd 5
. sal
es o
ver
asse
ts, t
he r
atio
of
net s
ales
to t
otal
ass
ets.
A
ll v
aria
bles
are
in p
erce
ntag
e te
rms.
The
sam
ple
is f
rom
199
8 to
200
0. T
he n
umbe
r of
fir
m-y
ear
obse
rvat
ions
is 1
0,76
4. T
he s
ize
clas
ses
are
smal
l (fr
om 1
to
50 e
mpl
oyee
s),
med
ium
(fr
om 5
1 to
250
em
ploy
ees)
and
lar
ge (
grea
ter
than
250
em
ploy
ees)
. B
ank
rela
tion
ship
: fi
rms
are
aske
d th
e nu
mbe
r of
ban
ks w
ith
whi
ch th
ey h
ad c
omm
erci
al r
elat
ions
hips
at t
he e
nd o
f 20
00.
Sin
gle
bank
rel
atio
nshi
p 2–
5 ba
nk r
elat
ions
hips
m
ore
than
5 b
ank
rela
tions
hips
m
ean
med
ian
sdm
inm
axn.
mea
nm
edia
nsd
m
in
max
n.
m
ean
med
ian
sd
min
m
ax
n.
All
RO
A
3.79
1.
855.
51-8
.98
28.6
640
82.
821.
084.
62
11.3
529
.80
6738
1.97
0.71
3.46
-10.
8427
.78
3618
RO
E
12.7
4 8.
6517
.44
-19.
5596
.23
408
10.4
55.
8816
.14
-19.
9295
.65
6738
8.54
4.59
14.1
8-2
0.00
99.0
536
18
In
tere
st o
ver
Ass
ets
1.45
0.
881.
550
10.2
840
82.
171.
821.
84
026
.34
6738
2.77
2.48
1.99
062
.06
3618
Non
inte
rest
ov
er A
sset
s 59
.87
53.6
131
.79
7.46
206.
0840
858
.73
54.1
029
.94
1.33
244.
9167
3850
.29
46.1
024
.66
3.20
267.
9036
18
S
ales
ove
r A
sset
s 13
2.60
13
0.97
54.6
524
.03
291.
4740
812
8.31
122.
8048
.67
20.0
429
9.39
6738
119.
4911
3.95
4.38
21.9
629
6.37
3618
S
mal
l R
OA
3.
91
1.85
5.62
-8.9
828
.66
381
2.75
0.98
4.61
-1
1.35
29.8
058
311.
650.
503.
31-6
.17
27.7
820
24
R
OE
12
.93
8.47
17.6
6-1
9.55
96.2
338
110
.53
5.83
16.4
0 -1
9.92
95.6
558
318.
513.
9414
.90
-20.
0099
.05
2024
Inte
rest
ove
r A
sset
s 1.
45
0.86
1.58
010
.28
381
2.24
1.88
1.87
0
26.3
458
313.
062.
821.
720
12.1
820
24
N
on in
tere
st
over
Ass
ets
60.7
2 54
.64
31.7
57.
4620
6.08
381
59.4
755
.35
30.2
4 1.
3324
4.91
5831
53.0
048
.24
27.2
63.
2026
7.90
2024
Sal
es o
ver
Ass
ets
133.
22
130.
8255
.78
24.0
329
1.47
381
130.
2312
5.57
49.3
5 20
.04
299.
3958
3112
6.06
121.
2445
.23
22.4
129
5.24
2024

Sin
gle
bank
rel
atio
nshi
p 2–
5 ba
nk r
elat
ions
hips
m
ore
than
5 b
ank
rela
tions
hips
m
ean
med
ian
sdm
inm
axn.
mea
nm
edia
nsd
m
in
max
n.
m
ean
med
ian
sd
min
m
ax
n.
Med
ium
R
OA
0.
78
0.00
2.81
-3.8
66.
8419
3.28
1.61
4.82
-7
.02
26.0
374
72.
010.
863.
26-6
.42
22.6
510
84
R
OE
6.
64
0.00
14.8
1-1
1.76
41.3
819
10.2
05.
9114
.81
-19.
2788
.10
747
7.99
4.55
13.2
1-1
9.97
98.2
610
84
In
tere
st o
ver
Ass
ets
1.29
1.
081.
020
3.57
191.
701.
421.
58
023
.52
747
2.49
2.27
2.50
062
.06
1084
Non
inte
rest
ov
er A
sset
s 49
.84
43.2
333
.82
11.0
514
7.57
1955
.10
48.8
428
.10
5.23
219.
1074
748
.54
45.0
121
.92
8.02
199.
3210
84
S
ales
ove
r A
sset
s 11
1.94
11
2.18
33.3
537
.41
164.
4019
117.
7611
0.61
42.4
8 26
.22
298.
1374
711
4.64
110.
6837
.96
24.2
829
6.37
1084
L
arge
R
OA
5.
28
4.30
1.98
3.53
8.52
82.
891.
964.
19
-11.
0322
.63
160
3.15
2.13
4.14
-10.
8425
.10
510
R
OE
18
.35
19.4
47.
0010
.07
27.4
38
8.85
6.82
12.2
1 -1
8.98
66.7
516
09.
857.
6113
.10
-19.
5985
.77
510
In
tere
st o
ver
Ass
ets
1.75
1.
201.
460.
454.
168
1.82
1.59
1.34
0
6.28
160
2.18
1.92
1.46
013
.87
510
N
on in
tere
st
over
Ass
ets
42.7
4 33
.64
21.3
725
.95
78.6
68
48.8
346
.30
23.8
4 14
.56
164.
7416
043
.29
40.3
716
.13
6.01
102.
6151
0
Sal
es o
ver
Ass
ets
151.
91
146.
7215
.66
132.
7217
6.21
810
7.48
105.
0638
.97
25.2
528
9.25
160
103.
7510
1.74
33.1
321
.96
247.
8351
0

Tab
le 6
. S
um
mar
y st
atis
tics
of
firm
s’ p
erfo
rman
ce in
dica
tors
by
size
an
d d
ura
tion
of
mai
n r
elat
ion
ship
S
umm
ary
stat
isti
cs o
n 1.
RO
A,
the
rati
o of
net
ear
ning
s to
tot
al a
sset
s, 2
. R
OE
, th
e ra
tio
of n
et e
arni
ngs
to n
et w
orth
, 3. i
nter
est
/ as
sets
, th
e ra
tio
of i
nter
est
expe
nse
to t
otal
ass
ets,
4.
non-
inte
rest
/ a
sset
s, t
he r
atio
of
non-
inte
rest
exp
ense
to
tota
l as
sets
, an
d 5.
sal
es /
ass
ets,
the
rat
io o
f ne
t sa
les
to t
otal
ass
ets.
All
va
riab
les
are
in p
erce
ntag
e te
rms.
The
sam
ple
is f
rom
199
8 to
200
0. T
he n
umbe
r of
fir
m-y
ear
obse
rvat
ions
is
10,7
64. T
he s
ize
clas
ses
are
smal
l (f
rom
1 t
o 50
em
ploy
ees)
, m
ediu
m (
from
51
to 2
50 e
mpl
oyee
s) a
nd l
arge
(gr
eate
r th
an 2
50 e
mpl
oyee
s).
Dur
atio
n of
the
mai
n re
lati
onsh
ip:
firm
s ar
e as
ked
the
num
ber
of
year
s th
at a
ban
k ha
s be
en th
eir
mai
n le
nder
.
1–
2 ye
ars
dura
tion
of m
ain
rela
tions
hip
3–5
year
s du
ratio
n of
mai
n re
latio
nshi
p m
ore
than
5 y
ears
dur
atio
n of
mai
n re
latio
nshi
ps
mea
n m
edia
nsd
min
max
n.m
ean
med
ian
sd
min
m
ax
n.
mea
nm
edia
nsd
m
in
max
n.
A
ll R
OA
2.
50
0.77
4.62
-3.6
928
.24
146
2.28
0.89
4.06
-6
.63
29.1
610
182.
600.
964.
36-1
1.35
29.8
096
00
RO
E
9.76
5.
8216
.02
-19.
3563
.05
146
10.9
15.
9317
.43
-19.
4393
.78
1018
9.79
5.48
15.3
8-2
0.00
99.0
596
00
Inte
rest
/ A
sset
s 2.
56
2.28
1.78
09.
3714
62.
362.
111.
74
013
.87
1018
2.34
2.02
1.93
062
.06
9600
N
on in
tere
st /
Ass
ets
46.8
4 45
.18
23.1
79.
0913
0.28
146
53.0
448
.80
28.4
3 7.
7226
7.90
1018
56.3
851
.17
28.6
91.
3324
4.91
9600
S
ales
/ A
sset
s 10
8.12
10
1.10
47.2
230
.28
287.
2814
612
2.10
115.
3947
.97
20.0
429
4.78
1018
126.
1312
0.56
46.9
521
.96
299.
3996
00Sm
all
RO
A
2.70
0.
605.
23-3
.69
28.2
410
52.
270.
834.
02
-6.6
329
.16
790
2.56
0.87
4.44
-11.
3529
.80
7341
R
OE
9.
77
6.58
16.8
0-1
9.35
63.0
510
510
.97
6.10
17.4
0 -1
9.18
93.7
879
010
.06
5.36
15.9
8-2
0.00
99.0
573
41
Inte
rest
/ A
sset
s 2.
54
2.09
1.97
0.00
9.37
105
2.35
2.14
1.73
0.
0011
.09
790
2.41
2.08
1.88
0.00
26.3
473
41
Non
inte
rest
/ A
sset
s 48
.80
46.4
324
.58
9.09
130.
2810
553
.98
50.7
127
.72
7.72
267.
9079
058
.49
53.7
229
.97
1.33
244.
9173
41
Sal
es /
Ass
ets
110.
82
100.
7150
.33
35.7
828
7.28
105
124.
9111
9.10
49.5
8 20
.04
294.
7879
013
0.09
125.
2948
.54
22.4
129
9.39
7341
Med
ium
R
OA
1.
86
0.77
2.52
-0.7
49.
7522
2.11
1.15
3.91
-6
.37
20.7
516
72.
561.
094.
04-7
.02
26.0
316
61
RO
E
8.35
3.
9211
.46
-3.5
241
.76
2210
.17
5.43
17.0
8 -1
9.27
88.1
016
78.
745.
0413
.61
-19.
9798
.26
1661
In
tere
st /
Ass
ets
2.92
2.
491.
381.
125.
5722
2.25
2.03
1.38
0.
0210
.43
167
2.14
1.87
2.28
062
.06
1661
N
on in
tere
st /
Ass
ets
39.8
5 38
.86
21.3
010
.79
87.3
822
52.4
044
.08
34.3
1 9.
1220
5.65
167
51.2
346
.86
23.8
15.
2321
9.10
1661
S
ales
/ A
sset
s 83
.58
77.2
740
.88
30.2
819
2.66
2211
6.45
108.
5042
.61
41.9
223
2.54
167
116.
2411
1.38
39.3
624
.28
298.
1316
61L
arge
R
OA
2.
15
2.06
2.30
-1.6
06.
4319
2.85
1.49
4.89
-3
.92
24.2
561
3.17
2.25
4.10
-11.
0325
.10
598
R
OE
11
.32
4.21
16.7
0-1
0.11
55.2
519
12.1
05.
5718
.84
-19.
4373
.90
619.
427.
7211
.96
-19.
5985
.77
598
In
tere
st /
Ass
ets
2.24
2.
460.
760.
413.
3019
2.73
1.99
2.49
0.
4013
.87
612.
021.
821.
290
8.18
598
N
on in
tere
st /
Ass
ets
44.0
6 39
.40
14.6
132
.87
98.7
619
42.6
540
.94
14.8
1 10
.64
79.7
561
44.8
042
.08
18.8
76.
0116
4.74
598
S
ales
/ A
sset
s 12
1.62
12
0.89
20.0
596
.01
181.
6019
101.
2310
1.65
31.9
1 28
.10
198.
8361
105.
0810
2.21
35.3
721
.96
289.
2559
8

Tab
le 7
. S
tati
stic
s on
sh
ort-
term
an
d m
ediu
m a
nd
lon
g-te
rm b
ank
deb
t of
the
cap
ital
ia s
amp
le in
199
8 P
erce
ntil
es a
nd s
umm
ary
stat
isti
cs o
f sh
ort-
term
(S
T d
ebt)
and
med
ium
-ter
m a
nd l
ong-
term
(M
/L T
deb
t) b
ank
debt
by
size
cla
sses
. T
he s
ize
clas
ses
are
1.
smal
l (f
rom
1 t
o 50
em
ploy
ees)
, 2.
med
ium
(fr
om 5
1 to
250
em
ploy
ees)
and
3.
larg
e (g
reat
er t
han
250
empl
oyee
s).
Val
ues
are
in m
illi
ons
of I
tali
an L
iras
(1
€ =
193
6.27
lira
s).
m
in
p40
p42
p45
p50
p73
p80
max
sd
m
ean
n
1998
Sm
all
S T
deb
t 0
0 5.
34
49.5
8 14
9.63
93
8.36
15
58.9
8 64
5938
.30
1427
6.82
18
72.5
0 24
26
M/L
deb
t 0
0 0
0 0
10.1
7 13
7.58
13
830.
20
514.
37
145.
69
2742
Med
ium
S
T d
ebt
0 0.
33
12.1
0 11
0.10
24
9.39
10
72.3
8 16
99.4
5 70
905.
91
5906
.19
1898
.63
512
M/L
deb
t 0
138.
04
192.
72
285.
86
413.
17
1271
.60
1719
.18
2649
3.00
22
68.0
4 12
27.1
3 59
7
Lar
ge
S T
deb
t 0
0 0
15.1
7 39
.50
915.
91
1374
.69
1213
32.8
0 10
441.
53
2707
.74
198
M/L
deb
t 0
2235
.17
2612
.34
3199
.97
4043
.00
1171
4.85
15
269.
65
3626
00.0
0 39
659.
69
1443
4.15
22
7
All
S
T d
ebt
0 0
6.92
49
.34
156.
17
964.
72
1569
.51
6459
38.3
0 13
047.
74
1929
.51
3136
M
/L d
ebt
0 0
0 0
0 22
1.03
43
5.22
36
2600
.00
1061
9.86
12
36.3
0 35
66

30
Table 8. p-values of the F statistics on the significance of restrictions This table reports the results of F-tests to test restriction of the general regression with dummies, equation (3.1) in section 3.2, to the regression with a second-order polynomial, equation (3.2) in section 3.2, for each of the performance variables. The performance variables are 1. ROA, the ratio of net earnings to total assets, 2. ROE, the ratio of net earnings to net worth, 3. interest over assets, the ratio of interest expense to total assets, 4. non-interest over assets, the ratio of non-interest expense to total assets, and 5. sales over assets, the ratio of net sales to total assets. The size classes are 1. small (from 1 to 50 employees), 2. medium (from 51 to 250 employees) and 3. large (greater than 250 employees). “Num DF” is the numerator degrees of freedom and “Den DF” is the denominator degrees of freedom. ROA ROE Interest
over Assets
Non-Interest
over Assets
Sales over
Assets
Num DF
Den DF
All 0.018 0.316 <0.001 0.024 0.005 18 9949 Small 0.02 0.243 <0.001 0.969 0.015 18 7733 Medium 0.077 0.034 0.321 <0.001 <0.01 18 1663 Large 0.009 <0.001 <0.001 <0.001 <0.001 18 463
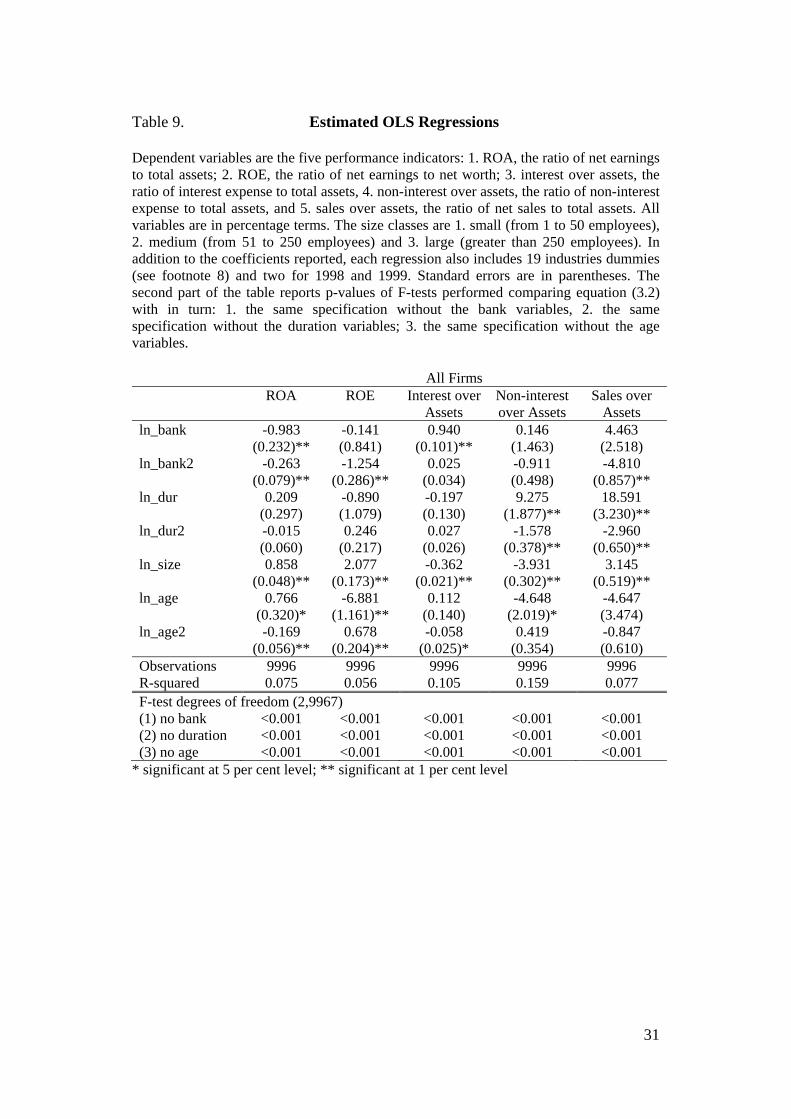
31
Table 9. Estimated OLS Regressions Dependent variables are the five performance indicators: 1. ROA, the ratio of net earnings to total assets; 2. ROE, the ratio of net earnings to net worth; 3. interest over assets, the ratio of interest expense to total assets, 4. non-interest over assets, the ratio of non-interest expense to total assets, and 5. sales over assets, the ratio of net sales to total assets. All variables are in percentage terms. The size classes are 1. small (from 1 to 50 employees), 2. medium (from 51 to 250 employees) and 3. large (greater than 250 employees). In addition to the coefficients reported, each regression also includes 19 industries dummies (see footnote 8) and two for 1998 and 1999. Standard errors are in parentheses. The second part of the table reports p-values of F-tests performed comparing equation (3.2) with in turn: 1. the same specification without the bank variables, 2. the same specification without the duration variables; 3. the same specification without the age variables. All Firms ROA ROE Interest over
Assets Non-interest over Assets
Sales over Assets
ln_bank -0.983 -0.141 0.940 0.146 4.463 (0.232)** (0.841) (0.101)** (1.463) (2.518) ln_bank2 -0.263 -1.254 0.025 -0.911 -4.810 (0.079)** (0.286)** (0.034) (0.498) (0.857)** ln_dur 0.209 -0.890 -0.197 9.275 18.591 (0.297) (1.079) (0.130) (1.877)** (3.230)** ln_dur2 -0.015 0.246 0.027 -1.578 -2.960 (0.060) (0.217) (0.026) (0.378)** (0.650)** ln_size 0.858 2.077 -0.362 -3.931 3.145 (0.048)** (0.173)** (0.021)** (0.302)** (0.519)** ln_age 0.766 -6.881 0.112 -4.648 -4.647 (0.320)* (1.161)** (0.140) (2.019)* (3.474) ln_age2 -0.169 0.678 -0.058 0.419 -0.847 (0.056)** (0.204)** (0.025)* (0.354) (0.610) Observations 9996 9996 9996 9996 9996 R-squared 0.075 0.056 0.105 0.159 0.077 F-test degrees of freedom (2,9967) (1) no bank <0.001 <0.001 <0.001 <0.001 <0.001 (2) no duration <0.001 <0.001 <0.001 <0.001 <0.001 (3) no age <0.001 <0.001 <0.001 <0.001 <0.001
* significant at 5 per cent level; ** significant at 1 per cent level
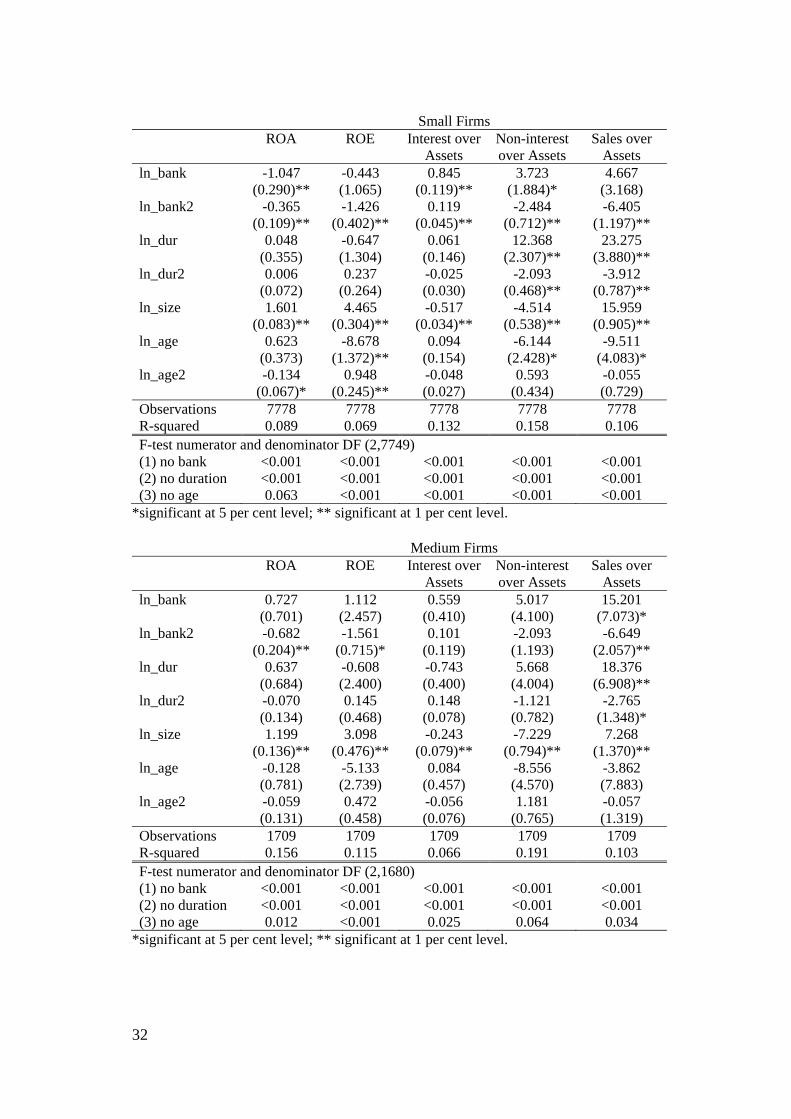
32
Small Firms ROA ROE Interest over
Assets Non-interest over Assets
Sales over Assets
ln_bank -1.047 -0.443 0.845 3.723 4.667 (0.290)** (1.065) (0.119)** (1.884)* (3.168) ln_bank2 -0.365 -1.426 0.119 -2.484 -6.405 (0.109)** (0.402)** (0.045)** (0.712)** (1.197)** ln_dur 0.048 -0.647 0.061 12.368 23.275 (0.355) (1.304) (0.146) (2.307)** (3.880)** ln_dur2 0.006 0.237 -0.025 -2.093 -3.912 (0.072) (0.264) (0.030) (0.468)** (0.787)** ln_size 1.601 4.465 -0.517 -4.514 15.959 (0.083)** (0.304)** (0.034)** (0.538)** (0.905)** ln_age 0.623 -8.678 0.094 -6.144 -9.511 (0.373) (1.372)** (0.154) (2.428)* (4.083)* ln_age2 -0.134 0.948 -0.048 0.593 -0.055 (0.067)* (0.245)** (0.027) (0.434) (0.729) Observations 7778 7778 7778 7778 7778 R-squared 0.089 0.069 0.132 0.158 0.106 F-test numerator and denominator DF (2,7749) (1) no bank <0.001 <0.001 <0.001 <0.001 <0.001 (2) no duration <0.001 <0.001 <0.001 <0.001 <0.001 (3) no age 0.063 <0.001 <0.001 <0.001 <0.001
*significant at 5 per cent level; ** significant at 1 per cent level. Medium Firms ROA ROE Interest over
Assets Non-interest over Assets
Sales over Assets
ln_bank 0.727 1.112 0.559 5.017 15.201 (0.701) (2.457) (0.410) (4.100) (7.073)* ln_bank2 -0.682 -1.561 0.101 -2.093 -6.649 (0.204)** (0.715)* (0.119) (1.193) (2.057)** ln_dur 0.637 -0.608 -0.743 5.668 18.376 (0.684) (2.400) (0.400) (4.004) (6.908)** ln_dur2 -0.070 0.145 0.148 -1.121 -2.765 (0.134) (0.468) (0.078) (0.782) (1.348)* ln_size 1.199 3.098 -0.243 -7.229 7.268 (0.136)** (0.476)** (0.079)** (0.794)** (1.370)** ln_age -0.128 -5.133 0.084 -8.556 -3.862 (0.781) (2.739) (0.457) (4.570) (7.883) ln_age2 -0.059 0.472 -0.056 1.181 -0.057 (0.131) (0.458) (0.076) (0.765) (1.319) Observations 1709 1709 1709 1709 1709 R-squared 0.156 0.115 0.066 0.191 0.103 F-test numerator and denominator DF (2,1680) (1) no bank <0.001 <0.001 <0.001 <0.001 <0.001 (2) no duration <0.001 <0.001 <0.001 <0.001 <0.001 (3) no age 0.012 <0.001 0.025 0.064 0.034
*significant at 5 per cent level; ** significant at 1 per cent level.
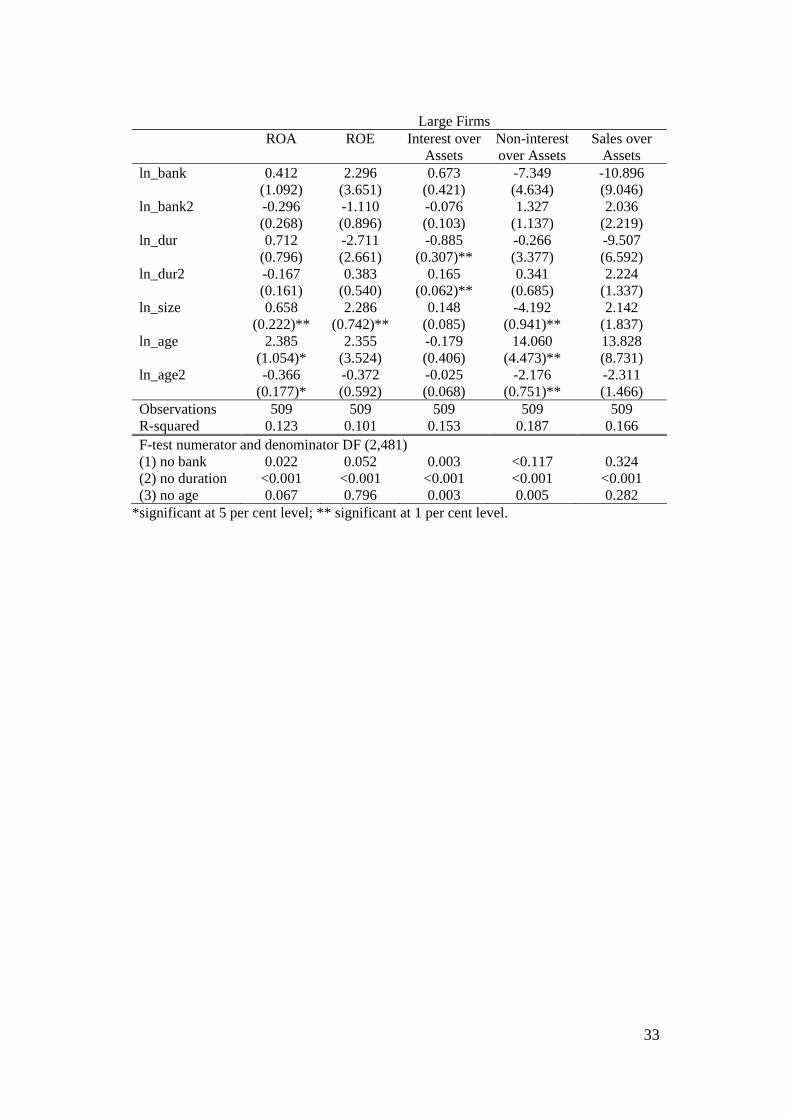
33
Large Firms ROA ROE Interest over
Assets Non-interest over Assets
Sales over Assets
ln_bank 0.412 2.296 0.673 -7.349 -10.896 (1.092) (3.651) (0.421) (4.634) (9.046) ln_bank2 -0.296 -1.110 -0.076 1.327 2.036 (0.268) (0.896) (0.103) (1.137) (2.219) ln_dur 0.712 -2.711 -0.885 -0.266 -9.507 (0.796) (2.661) (0.307)** (3.377) (6.592) ln_dur2 -0.167 0.383 0.165 0.341 2.224 (0.161) (0.540) (0.062)** (0.685) (1.337) ln_size 0.658 2.286 0.148 -4.192 2.142 (0.222)** (0.742)** (0.085) (0.941)** (1.837) ln_age 2.385 2.355 -0.179 14.060 13.828 (1.054)* (3.524) (0.406) (4.473)** (8.731) ln_age2 -0.366 -0.372 -0.025 -2.176 -2.311 (0.177)* (0.592) (0.068) (0.751)** (1.466) Observations 509 509 509 509 509 R-squared 0.123 0.101 0.153 0.187 0.166 F-test numerator and denominator DF (2,481) (1) no bank 0.022 0.052 0.003 <0.117 0.324 (2) no duration <0.001 <0.001 <0.001 <0.001 <0.001 (3) no age 0.067 0.796 0.003 0.005 0.282
*significant at 5 per cent level; ** significant at 1 per cent level.

34
Figures
Figure 1. Dummy (1) variables and second-order polynomial (2) of logarithm of number of relationships for all firms This figure shows the estimated relationship between each performance measure and two models of that relationship for all firms in our sample for all years. One model, dummies_model, uses a separate dummy variable for each number of relationships with banks from one to 20. This is completely unrestricted. The second model, ln_model, uses a second-order polynomial of the logarithm of the number of relationships with banks. The performance variables are 1. ROA, the ratio of net earnings to total assets, 2. ROE, the ratio of net earnings to net worth, 3. interest over assets, the ratio of interest expense to total assets, 4. non-interest over assets, the ratio of non-interest expense to total assets, and 5. sales over assets, the ratio of net sales to total assets. All variables are in percentage terms. The sample is from 1998 to 2000.
01
23
45
dum
mie
s_m
odel
/ln_m
odel
0 5 10 15 20n_banks
dummies_model ln_model
ROAAll Firms
05
1015
dum
mie
s_m
odel
/ln_m
odel
0 5 10 15 20n_banks
dummies_model ln_model
ROEAll Firms
12
34
dum
mie
s_m
odel
/ln_m
odel
0 5 10 15 20n_banks
dummies_model ln_model
Interest over AssetsAll Firms
4060
8010
0du
mm
ies_
mod
el/ln
_mod
el
0 5 10 15 20n_banks
dummies_model ln_model
Non Interest over AssetsAll Firms
9010
011
012
013
014
0du
mm
ies_
mod
el/ln
_mod
el
0 5 10 15 20n_banks
dummies_model ln_model
Sales over AssetsAll Firms

35
Figure 2. Dummy (1) variables and second-order polynomial (2) of logarithm of number of relationships for small firms This figure shows the estimated relationship between each performance measure and two models of that relationship for small firms in our sample for all years. A small firm is a firm with no more than 50 employees. One model, dummies_model, uses a separate dummy variable for each number of relationships with banks. This is completely unrestricted. The second model, ln_model, uses a second-order polynomial of the logarithm of the number of relationships with banks. The performance variables are 1. ROA, the ratio of net earnings to total assets, 2. ROE, the ratio of net earnings to net worth, 3. interest over assets, the ratio of interest expense to total assets, 4. non-interest over assets, the ratio of non-interest expense to total assets, and 5. sales over assets, the ratio of net sales to total assets. All variables are in percentage terms. The sample is from 1998 to 2000.
02
46
810
dum
mie
s_m
odel
/ln_m
odel
0 5 10 15 20n_banks
dummies_model ln_model
ROASmall Firms
05
1015
dum
mie
s_m
odel
/ln_m
odel
0 5 10 15 20n_banks
dummies_model ln_model
ROESmall Firms
12
34
5du
mm
ies_
mod
el/ln
_mod
el
0 5 10 15 20n_banks
dummies_model ln_model
Interest over AssetsSmall Firms
2030
4050
60du
mm
ies_
mod
el/ln
_mod
el
0 5 10 15 20n_banks
dummies_model ln_model
Non Interest over AssetsSmall Firms
8010
012
014
0du
mm
ies_
mod
el/ln
_mod
el
0 5 10 15 20n_banks
dummies_model ln_model
Sales over AssetsSmall Firms

36
Figure 3. Dummy (1) variables and second-order polynomial (2) of logarithm of number of relationships for medium firms This figure shows the estimated relationship between each performance measure and two models of that relationship for medium-sized firms in our sample for all years. A medium firm is a firm with 51 to 250 employees. One model, dummies_model, uses a separate dummy variable for each number of relationships with banks. This is completely unrestricted. The second model, ln_model, uses a second-order polynomial of the logarithm of the number of relationships with banks. The performance variables are 1. ROA, the ratio of net earnings to total assets, 2. ROE, the ratio of net earnings to net worth, 3. interest over assets, the ratio of interest expense to total assets, 4. non-interest over assets, the ratio of non-interest expense to total assets, and 5. sales over assets, the ratio of net sales to total assets. All variables are in percentage terms. The sample is from 1998 to 2000.
-20
24
6du
mm
ies_
mod
el/ln
_mod
el
0 5 10 15 20n_banks
dummies_model ln_model
ROAMedium Firms
-50
510
15du
mm
ies_
mod
el/ln
_mod
el
0 5 10 15 20n_banks
dummies_model ln_model
ROEMedium Firms
12
34
5du
mm
ies_
mod
el/ln
_mod
el
0 5 10 15 20n_banks
dummies_model ln_model
Interest over AssetsMedium Firms
4050
6070
8090
dum
mie
s_m
odel
/ln_m
odel
0 5 10 15 20n_banks
dummies_model ln_model
Non Interest over AssetsMedium Firms
6080
100
120
140
dum
mie
s_m
odel
/ln_m
odel
0 5 10 15 20n_banks
dummies_model ln_model
Sales over AssetsMedium Firms

37
Figure 4. Dummy (1) variables and second-order polynomial (2) of logarithm of number of relationships for large firms This figure shows the estimated relationship between each performance measure and two models of that relationship for large firms in our sample for all years. A large firm is a firm with more than 250 employees. One model, dummies_model, uses a separate dummy variable for each number of relationships with banks. This is completely unrestricted. The second model, ln_model, uses a second-order polynomial of the logarithm of the number of relationships with banks. The performance variables are 1. ROA, the ratio of net earnings to total assets, 2. ROE, the ratio of net earnings to net worth, 3. interest over assets, the ratio of interest expense to total assets, 4. non-interest over assets, the ratio of non-interest expense to total assets, and 5. sales over assets, the ratio of net sales to total assets. All variables are in percentage terms. The sample is from 1998 to 2000.
-10
12
34
dum
mie
s_m
odel
/ln_m
odel
0 5 10 15 20n_banks
dummies_model ln_model
ROALarge Firms
-50
510
dum
mie
s_m
odel
/ln_m
odel
0 5 10 15 20n_banks
dummies_model ln_model
ROELarge Firms
01
23
4du
mm
ies_
mod
el/ln
_mod
el
0 5 10 15 20n_banks
dummies_model ln_model
Interest over AssetsLarge Firms
4060
8010
0du
mm
ies_
mod
el/ln
_mod
el
0 5 10 15 20n_banks
dummies_model ln_model
Non Interest over AssetsLarge Firms
5010
015
020
025
0du
mm
ies_
mod
el/ln
_mod
el
0 5 10 15 20n_banks
dummies_model ln_model
Sales over AssetsLarge Firms
38
References
Agarwal, R – Elston, J A (2001) Bank firm relationships, financing and firm performance in Germany. Economics Letters, Vol. 72, 225–232.
Alfò, M – Trovato, G (2006) Credit rationing and the financial structure of
Italian small and medium enterprises. Journal of Applied Economic, IX, No. 1, 167–184.
Angelini, P – Cetorelli, N (2003) The effects of regulatory reform on
competition in the banking industry. Journal of Money, Credit & Banking, Vol. 35.
Angelini, P – Di Salvo, R – Ferri, G (1998) Availability and cost of credit for
small businesses: customer relationships and credit co-operatives. Journal of Banking Finance, Vol. 22, 925–954.
Berger, A N – Klapper, L F – Udell, G F (2001) The ability of banks to lend to
informationally opaque small businesses. Journal of Banking and Finance, Vol. 25, 2127–2167.
Berger, A N – Udell, G F (1995) Relationship lending and lines of credit in
small firm finance. Journal of Business, Vol. 68, 351–381. Berger, A N – Udell, G F (1998) The economics of small business finance: the
roles of private equity and debt market in the financial growth cycle. Journal of Banking and Finance, Vol. 22, 613–673.
Berlin, M – Mester, L (1998) On the profitability and costs of relationship
lending. Journal of Banking and Finance, Vol. 22, 873–897. Berlin, M – Mester, L (1999) Deposits and relationship lending. The Review of
Financial Studies, Vol. 12, 579–607. Bernanke, B S – Gertler, M (1995) Inside the black box: the credit channel of
monetary policy transmission. Journal of Economic Perspectives, Vol. 9, 27–48.
Best, R – Zhang, H (1993) Alternative information sources and the
information content of bank loans. Journal of Finance, Vol. 48, 1507–1522.

39
Bhattacharya, S – Chiesa, G (1995) Proprietary information, financial intermediation and research incentives. Journal of Financial Intermediation, Vol. 4, 328–357.
Bhattacharya, S – Thakor, A V (1993) Contemporary banking theory. Journal
of Financial Intermediation, Vol. 3, 2–50. Blackwell, N R – Santomero, A M (1982) Bank credit rationing and the
customer relation. Journal of Monetary Economics, Vol. 9, 121–129. Boot, A W A (2000) Relationship banking: what do we know? Journal of
Financial Intermediation, Vol. 9, 7–25. Boot, A W A – Thakor, A V (1994) Moral hazard and secured lending in an
infinitely repeated credit market game. International Economic Review, Vol. 35, 899–920.
Boyd, J H – Prescott, E C (1986) Financial intermediary coalition. Journal of
Economic Theory, Vol. 38, 211–232. Brickley, J A – Linck, J S – Smith, Jr C W (2003) Boundaries of the firm:
evidence from the banking industry. Journal of Financial Economics, Vol. 70, 351–383.
Cole, R (1998) The importance of relationships to the availability of credit.
Journal of Banking and Finance, Vol. 22, 959–977. De Bodt, E – Lobez, F – Statnik, J C (2005) Credit rationing, customer
relationship and the number of banks: an empirical analysis. European Financial Management, Vol. 11, No. 2, 195–228.
Degryse, H – Ongena, S (2001) Bank relationship and firm profitability.
Financial Management, 9–34. Degryse, H – van Cayseele, P (2000) Relationship lending within a bank-based
system: evidence from European small business data. Journal of Financial Intermediation, Vol. 9, 90–109.
De Young, R – Hasan, I – Kirchhoff, B (1997) Out-of-state entry and the cost
efficiency of local commercial banks. Office of the Comptroller of the Currency, Economics Working Paper 97-7.

40
Detragiache, E – Garella, P – Guisom, L (2000) Multiple versus single banking relationships: theory and evidence. Journal of Finance, Vol. 55, 1133–1161.
Diamond, D (1984) Financial intermediation and delegated monitoring.
Review of Economic Studies, Vol. 51, 393–414. Diamond, D (1991) Monitoring and reputation: the choice between bank
loans and privately placed debt. Journal of Political Economy, Vol. 99, 689–721.
Elsas, R – Krahnen, J P (1998) Is relationship lending special? Evidence from
credit-file data in Germany. Journal of Banking and Finance, Vol. 22, 1283–1316.
European Central Bank (2002) Structural Analysis of the European Banking
Sector – Year 2001. Fama, E F (1985) What’s different about banks? Journal of Monetary
Economics, Vol. 15, 5–29. Farinha, L – Santos, J A C (2002) Switching from single to multiple bank
lending relationships: determinants and implications. Journal of Financial Intermediation, Vol. 11, 124–151.
Fazzari, S M – Hubbard, R G – Petersen, B C (1988) Financing constraints and
corporate investment. Brookings Papers on Economic Activity, Vol. 1, 141–206.
Fok, C W – Chang, Y C – Lee, W T (2004) Bank relationships and their effects
on firms performance around the Asian financial crises: evidence from Taiwan. Financial Management, 89–112.
Forestieri, G – Tirri, V (2002) Verso un sistema bancario e finanziario
europeo? Rapporto banca-impresa: struttura del mercato e politiche di prezzo, Quaderni di Ricerche, No. 31, Ente L Einaudi.
Greenbaum, S I – Kanatas, G – Venezia, I (1989) Equilibrium loan pricing
under the bank-client relationship. Journal of Banking Finance, Vol. 13, 221–235.
James, C (1987) Some evidence on the uniqueness of bank loans. Journal of
Financial Economics, Vol. 19, 217–235.

41
Harhoff, D – Korting, T (1998) Lending relationships in Germany – empirical evidence from survey data. Journal of Banking and Finance, Vol. 22, 1317–1353.
Hein, S E – Koch, T W – MacDonald, S S (2005) On the uniqueness of
community banks. Economic Review, First Quarter. Hoshi, T – Kashyap, A K – Scharfstein, D (1991) Corporate structure, liquidity
and investment: evidence from Japanese industrial groups. Quarterly Journal of Economics, Vol. 106, 33–60.
Houston, J – James, C M (1995) Banking relationships, financial constraints
and investment: Are bank dependent borrowers more financially constrained? University of Florida Working Paper.
Houston, J – James, C M (1996) Bank information monopolies and the mix of
private and public debt choices. Journal of Finance, Vol. 51, 1863–1889. Iannotta, G – Navone, M (2008) Which factors affect bond underwriting fees?
The role of banking relationships. European Financial Management, Vol. 14, No. 5, 944–961.
Kang, J – Stulz, R M (2000) Do banking shocks affect borrowing firm
performance? An analysis of the Japanese experience. Journal of Business, Vol. 73, 1–23.
Leland, H E – Pyle, D H (1977) Informational asymmetries, financial structure
and financial intermediation. Journal of Finance, Vol. 32, 371–387. Lewbel, A (1997) Constructing instruments for regressions with
measurement error when no additional data are available, with an application to patents and R&D. Econometrica, Vol. 65, No. 5, 1201–1213.
Longhofer, S D – Santos, J A C (2000) The importance of bank seniority for
relationship lending. Journal of Financial Intermediation, Vol. 9, 57–89. Ongena, S – Smith, C (2000) Bank relationship: a survey. In Harker and Zenios
eds. The Performance of Financial Institutions, Cambridge University Press, 2000.
Ongena, S – Smith, C (2001) The duration of bank relationships. Journal of
Financial Economics, Vol. 61, 449–475.

42
Pavitt, K (1984) Sectoral patterns of technological change: towards a taxonomy and a theory. Research Policy, No. 6.
Petersen, M – Rajan, R (1994) The benefits of lending relationships: evidence
from small business data. Journal of Finance, Vol. 49, 1367–1400. Petersen, M A – Rajan, R G (1995) The effect of credit market competition on
lending relationship. Quarterly Journal of Economics, Vol. 110, 406-443. Rajan, R G (1992) Insiders and outsiders: the choice between informed and
arm’s length debt. Journal of Finance, Vol. 47, 1367–1400. Refait, C (2003) Multiple banking relationship: choice of the number of main
banks and choice of the number of banks. Revue Economic, Vol. 3, 54, 649–661.
Sharpe, S A (1990) Asymmetric information, bank lending and implicit
contracts: a stylized model of customer relationships. Journal of Finance, Vol. 45, 1069–1087.
Shockley, R – Thakor, A V (1998) Bank loan commitment contracts: data,
theory, and tests. Journal of Money, Credit, and Banking, Vol. 29, 517–534. Slovin, M – Johnson, S – Glascock, J (1992) Firm size and the information
content of bank loan announcements. Journal of Banking and Finance, Vol. 16, 35–49.
Stiglitz, J – Weiss, A (1983) Credit rationing in markets with incomplete
information. American Economic Review, Vol. 73, 912–927. Strahan, P E – Weston, J P (1998) Small business lending and the changing
structure of the banking industry. Journal of Banking and Finance, Vol. 22, 821–845.
von Rheinbaben, J – Ruckes, M (2004) The number and the closeness of bank
relationships. Journal of Banking and Finance, Vol. 28, 1597–1615. von Thadden, E L (1995) Long term contracts, short term investment, and
monitoring. Review of Economic Studies, Vol. 62, 557–575.

43
von Thadden, E L (1998) Asymmetric information, bank lending, and implicit contracts: the Winner’s curse. Unpublished working paper. University of Lausanne (DEEP).
Weinstein, D – Yafeh, Y (1998) On the costs of a bank-centered financial
system: evidence from the changing main bank relations in Japan. Journal of Finance, Vol. 53, 635–672.
Yosha, O (1995) Information disclosure costs and the choice of financing
source. Journal of Financial Intermediation, Vol. 4, 3–20.

44
Appendix 1
Definition of variables 1) Performance variables: – ROA= (net earnings/ total assets)*100 – ROE = (net earnings/ net worth)*100 – Interest over Assets = (interest expenses/ total assets)*100 – Non-interest over Assets = ((non-interest expenses) /Total Assets)*100.
Non-interest expenses is complementary to interest expenses meaning that the two sum up to total expenses.
– Sales over Assets = (net sales/ total assets)*100 2) Regressors – bank1, bank2, ... ,bank20 = dummies equal to 1 if 1,2,...,20 relationships
and 0 otherwise – ln bank = natural logarithm of number of banks with which the firms had
commercial relationships at the end of 2000 – ln bank2 = ln bank squared – ln dur = natural logarithm of number of years a bank has been the main
lender of the firm at the end of 2000 – ln dur2 = ln dur squared – ln size = natural logarithm of net sales – ln age = natural logarithm of (2001– firm’s year of birth) – ln age2 = ln age squared – indi = industry dummies – yearj = year dummies

45
Appendix 2
Table A2.1 Estimated OLS regressions with dummy variables Dependent variables are the five performance indicators: 1. ROA, the ratio of net earnings to total assets; 2. ROE, the ratio of net earnings to net worth; 3. interest over assets, the ratio of interest expense to total assets, 4. non-interest over assets, the ratio of non-interest expense to total assets, and 5. sales over assets, the ratio of net sales to total assets. All variables are in percentage terms. The size classes are 1. small (from 1 to 50 employees), 2. medium (from 51 to 250 employees) and 3. large (greater than 250 employees). In addition to the coefficients reported, each regression also includes 19 industries dummy variables (see footnote 8) and two dummy variables for 1998 and 1999. Standard errors are in parentheses. The second part of the table reports p-values of F-tests performed comparing equation (3.2) with in turn: 1. the same specification without the bank variables, 2. the same specification without the duration variables; 3. the same specification without the age variables.
All Firms
ROA ROE Interest
over Assets
Non-interest
over Assets
Sales over Assets
bank1 5.135 14.113 -2.110 -0.011 30.018 (0.609)** 5.078 0.106 -2.228 10.906 bank2 4.863 13.332 -1.775 2.051 31.928 (0.582)** (2.113)** (0.254)** (3.673) (6.319)** bank3 4.402 12.741 -1.534 1.984 29.904 (0.577)** (2.094)** (0.251)** (3.642) (6.265)** bank4 3.708 11.676 -1.055 -0.135 25.801 (0.576)** (2.091)** (0.251)** (3.636) (6.254)** bank5 3.188 10.803 -0.774 0.232 26.816 (0.574)** (2.086)** (0.250)** (3.626) (6.238)** bank6 2.827 10.120 -0.477 -1.363 25.400 (0.579)** (2.101)** (0.252) (3.654) (6.286)** bank7 2.581 9.516 -0.382 -2.234 20.274 (0.588)** (2.135)** (0.256) (3.713) (6.387)** bank8 2.220 7.691 -0.255 -1.231 19.281 (0.594)** (2.158)** (0.259) (3.752) (6.455)** bank9 1.949 7.049 0.075 -4.655 18.489 (0.628)** (2.281)** (0.274) (3.967) (6.823)** bank10 1.879 6.024 -0.167 -4.227 8.245 (0.590)** (2.145)** (0.257) (3.729) (6.415) bank11 0.970 (2.214)** (0.266)** (3.849) (6.622)** (0.658) (2.391)* (0.287) (4.158) (7.152) bank12 2.273 8.923 -0.346 -4.003 10.687 (0.653)** (2.374)** (0.285) (4.127) (7.100) bank13 0.947 4.419 0.319 0.131 24.353 (0.752) (2.732) (0.328) (4.751) (8.172)** bank14 1.738 7.798 0.043 -3.148 22.952 (0.820)* (2.981)** (0.358) (5.182) (8.915)* bank15 1.553 7.897 0.667 -5.521 3.265 (0.711)* (2.584)** (0.310)* (4.493) (7.729)

46
All Firms
ROA ROE Interest
over Assets
Non-interest
over Assets
Sales over Assets
bank16 1.285 3.429 0.058 -0.990 24.497 (0.966) (3.509) (0.421) (6.101) (10.495)* bank17 3.191 10.109 0.620 6.419 7.492 (1.497)* (5.439) (0.653) (9.457) (16.268) bank18 1.534 3.389 0.456 -6.052 2.720 (1.156) (4.200) (0.504) (7.303) (12.564) bank19 0.395 0.838 -1.376 37.519 5.236 (2.473) (8.985) (1.078) (15.622)* (26.874) bank20 0.610 2.286 0.384 -12.939 -11.240 (0.870) (3.159) (0.379) (5.493)* (9.449) ln_dur 0.210 -0.891 -0.216 9.582 19.183 (0.298) (1.083) (0.130) (1.883)** (3.239)** ln_dur2 -0.018 0.237 0.031 -1.649 -3.098 (0.060) (0.218) (0.026) (0.379)** (0.652)** ln_size 0.846 2.046 -0.360 -3.886 3.227 (0.048)** (0.174)** (0.021)** (0.303)** (0.520)** ln_age 0.865 -6.738 0.075 -4.680 -4.963 (0.321)** (1.166)** (0.140) (2.028)* (3.489) ln_age2 -0.184 0.659 -0.052 0.440 -0.760 (0.056)** (0.205)** (0.025)* (0.356) (0.613) constant -9.118 -3.829 6.941 85.823 69.381 (0.930)** (3.379) (0.406)** (5.875)** (10.106)*
* observations 9996 9996 9996 9996 9996 r-squared 0.078 0.058 0.112 0.162 0.080 F-test numerator and denominator DF (2,9967) (a) no bank <0.001 <0.001 <0.001 <0.001 <0.001 (b) no duration <0.001 <0.001 <0.001 <0.001 <0.001 (c) no age <0.001 <0.001 <0.001 <0.001 <0.001
*significant at 5% level; ** significant at 1% level
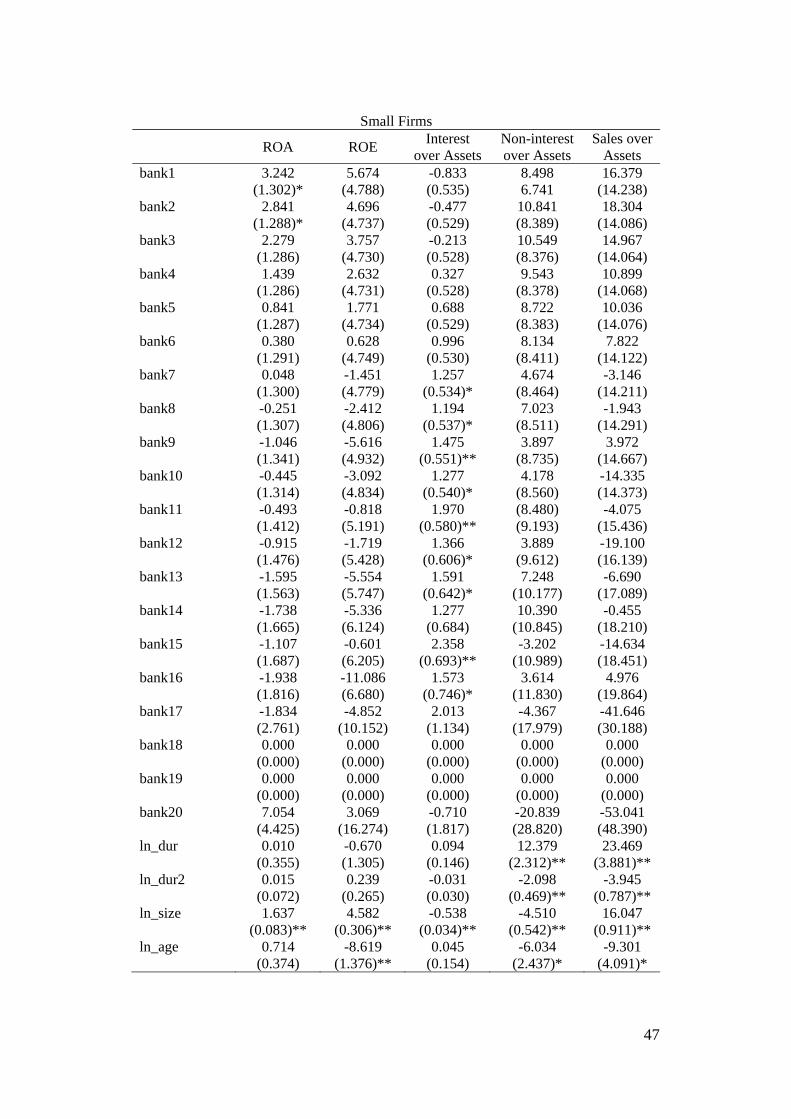
47
Small Firms
ROA ROE Interest
over Assets Non-interest over Assets
Sales over Assets
bank1 3.242 5.674 -0.833 8.498 16.379 (1.302)* (4.788) (0.535) 6.741 (14.238) bank2 2.841 4.696 -0.477 10.841 18.304 (1.288)* (4.737) (0.529) (8.389) (14.086) bank3 2.279 3.757 -0.213 10.549 14.967 (1.286) (4.730) (0.528) (8.376) (14.064) bank4 1.439 2.632 0.327 9.543 10.899 (1.286) (4.731) (0.528) (8.378) (14.068) bank5 0.841 1.771 0.688 8.722 10.036 (1.287) (4.734) (0.529) (8.383) (14.076) bank6 0.380 0.628 0.996 8.134 7.822 (1.291) (4.749) (0.530) (8.411) (14.122) bank7 0.048 -1.451 1.257 4.674 -3.146 (1.300) (4.779) (0.534)* (8.464) (14.211) bank8 -0.251 -2.412 1.194 7.023 -1.943 (1.307) (4.806) (0.537)* (8.511) (14.291) bank9 -1.046 -5.616 1.475 3.897 3.972 (1.341) (4.932) (0.551)** (8.735) (14.667) bank10 -0.445 -3.092 1.277 4.178 -14.335 (1.314) (4.834) (0.540)* (8.560) (14.373) bank11 -0.493 -0.818 1.970 (8.480) -4.075 (1.412) (5.191) (0.580)** (9.193) (15.436) bank12 -0.915 -1.719 1.366 3.889 -19.100 (1.476) (5.428) (0.606)* (9.612) (16.139) bank13 -1.595 -5.554 1.591 7.248 -6.690 (1.563) (5.747) (0.642)* (10.177) (17.089) bank14 -1.738 -5.336 1.277 10.390 -0.455 (1.665) (6.124) (0.684) (10.845) (18.210) bank15 -1.107 -0.601 2.358 -3.202 -14.634 (1.687) (6.205) (0.693)** (10.989) (18.451) bank16 -1.938 -11.086 1.573 3.614 4.976 (1.816) (6.680) (0.746)* (11.830) (19.864) bank17 -1.834 -4.852 2.013 -4.367 -41.646 (2.761) (10.152) (1.134) (17.979) (30.188) bank18 0.000 0.000 0.000 0.000 0.000 (0.000) (0.000) (0.000) (0.000) (0.000) bank19 0.000 0.000 0.000 0.000 0.000 (0.000) (0.000) (0.000) (0.000) (0.000) bank20 7.054 3.069 -0.710 -20.839 -53.041 (4.425) (16.274) (1.817) (28.820) (48.390) ln_dur 0.010 -0.670 0.094 12.379 23.469 (0.355) (1.305) (0.146) (2.312)** (3.881)** ln_dur2 0.015 0.239 -0.031 -2.098 -3.945 (0.072) (0.265) (0.030) (0.469)** (0.787)** ln_size 1.637 4.582 -0.538 -4.510 16.047 (0.083)** (0.306)** (0.034)** (0.542)** (0.911)** ln_age 0.714 -8.619 0.045 -6.034 -9.301 (0.374) (1.376)** (0.154) (2.437)* (4.091)*
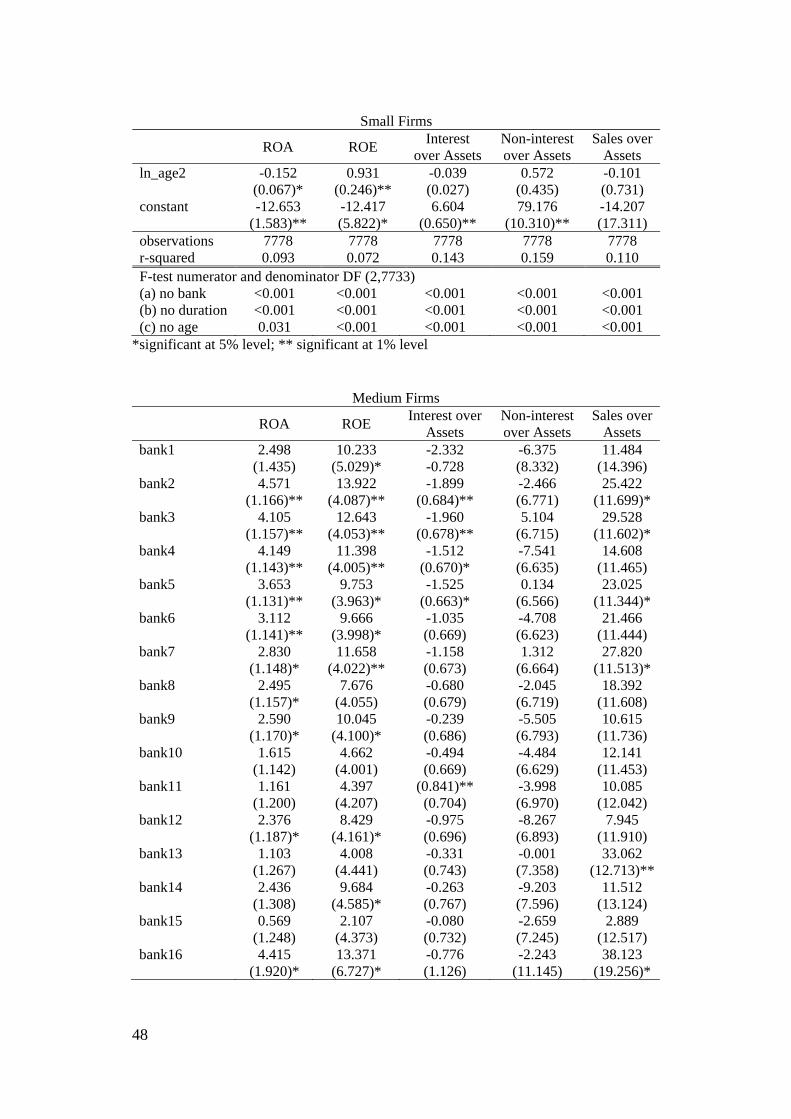
48
Small Firms
ROA ROE Interest
over Assets Non-interest over Assets
Sales over Assets
ln_age2 -0.152 0.931 -0.039 0.572 -0.101 (0.067)* (0.246)** (0.027) (0.435) (0.731) constant -12.653 -12.417 6.604 79.176 -14.207 (1.583)** (5.822)* (0.650)** (10.310)** (17.311) observations 7778 7778 7778 7778 7778 r-squared 0.093 0.072 0.143 0.159 0.110 F-test numerator and denominator DF (2,7733) (a) no bank <0.001 <0.001 <0.001 <0.001 <0.001 (b) no duration <0.001 <0.001 <0.001 <0.001 <0.001 (c) no age 0.031 <0.001 <0.001 <0.001 <0.001
*significant at 5% level; ** significant at 1% level
Medium Firms
ROA ROE Interest over
Assets Non-interest over Assets
Sales over Assets
bank1 2.498 10.233 -2.332 -6.375 11.484 (1.435) (5.029)* -0.728 (8.332) (14.396) bank2 4.571 13.922 -1.899 -2.466 25.422 (1.166)** (4.087)** (0.684)** (6.771) (11.699)* bank3 4.105 12.643 -1.960 5.104 29.528 (1.157)** (4.053)** (0.678)** (6.715) (11.602)* bank4 4.149 11.398 -1.512 -7.541 14.608 (1.143)** (4.005)** (0.670)* (6.635) (11.465) bank5 3.653 9.753 -1.525 0.134 23.025 (1.131)** (3.963)* (0.663)* (6.566) (11.344)* bank6 3.112 9.666 -1.035 -4.708 21.466 (1.141)** (3.998)* (0.669) (6.623) (11.444) bank7 2.830 11.658 -1.158 1.312 27.820 (1.148)* (4.022)** (0.673) (6.664) (11.513)* bank8 2.495 7.676 -0.680 -2.045 18.392 (1.157)* (4.055) (0.679) (6.719) (11.608) bank9 2.590 10.045 -0.239 -5.505 10.615 (1.170)* (4.100)* (0.686) (6.793) (11.736) bank10 1.615 4.662 -0.494 -4.484 12.141 (1.142) (4.001) (0.669) (6.629) (11.453) bank11 1.161 4.397 (0.841)** -3.998 10.085 (1.200) (4.207) (0.704) (6.970) (12.042) bank12 2.376 8.429 -0.975 -8.267 7.945 (1.187)* (4.161)* (0.696) (6.893) (11.910) bank13 1.103 4.008 -0.331 -0.001 33.062 (1.267) (4.441) (0.743) (7.358) (12.713)**bank14 2.436 9.684 -0.263 -9.203 11.512 (1.308) (4.585)* (0.767) (7.596) (13.124) bank15 0.569 2.107 -0.080 -2.659 2.889 (1.248) (4.373) (0.732) (7.245) (12.517) bank16 4.415 13.371 -0.776 -2.243 38.123 (1.920)* (6.727)* (1.126) (11.145) (19.256)*

49
Medium Firms
ROA ROE Interest over
Assets Non-interest over Assets
Sales over Assets
bank17 6.503 19.175 1.563 27.395 33.625 (3.907) (13.691) (2.291) (22.684) (39.192) bank18 0.415 1.295 0.855 -9.853 -23.529 (1.903) (6.668) (1.116) (11.047) (19.087) bank19 0.000 0.000 0.000 0.000 0.000 (0.000) (0.000) (0.000) (0.000) (0.000) bank20 1.299 2.598 -0.761 -21.954 -13.849 (1.467) (5.141) (0.860) (8.517)* (14.716) ln_dur 0.685 -0.285 -0.673 6.444 19.638 (0.693) (2.430) (0.407) (4.026) (6.956)** ln_dur2 -0.085 0.059 0.137 -1.289 -3.074 (0.136) (0.475) (0.080) (0.787) (1.361)* ln_size 1.251 3.319 -0.254 -7.248 8.171 (0.139)** (0.486)** (0.081)** (0.805)** (1.390)** ln_age -0.043 -5.065 0.186 -9.766 -4.951 (0.792) (2.774) (0.464) (4.596)* (7.941) ln_age2 -0.077 0.453 -0.072 1.398 0.163 (0.133) (0.465) (0.078) (0.770) (1.330) constant -12.566 -19.644 6.815 134.143 5.867 (2.272)** (7.960)* (1.332)** (13.188)** (22.786) observations 1709 1709 1709 1709 1709 r-squared 0.170 0.131 0.077 0.217 0.128 F-test numerator and denominator DF (2,1663) (a) no bank <0.001 <0.001 <0.001 <0.001 <0.001 (b) no duration <0.001 <0.001 <0.001 <0.001 <0.001 (c) no age 0.008 0.032 0.046 0.049 <0.001
*significant at 5% level; ** significant at 1% level
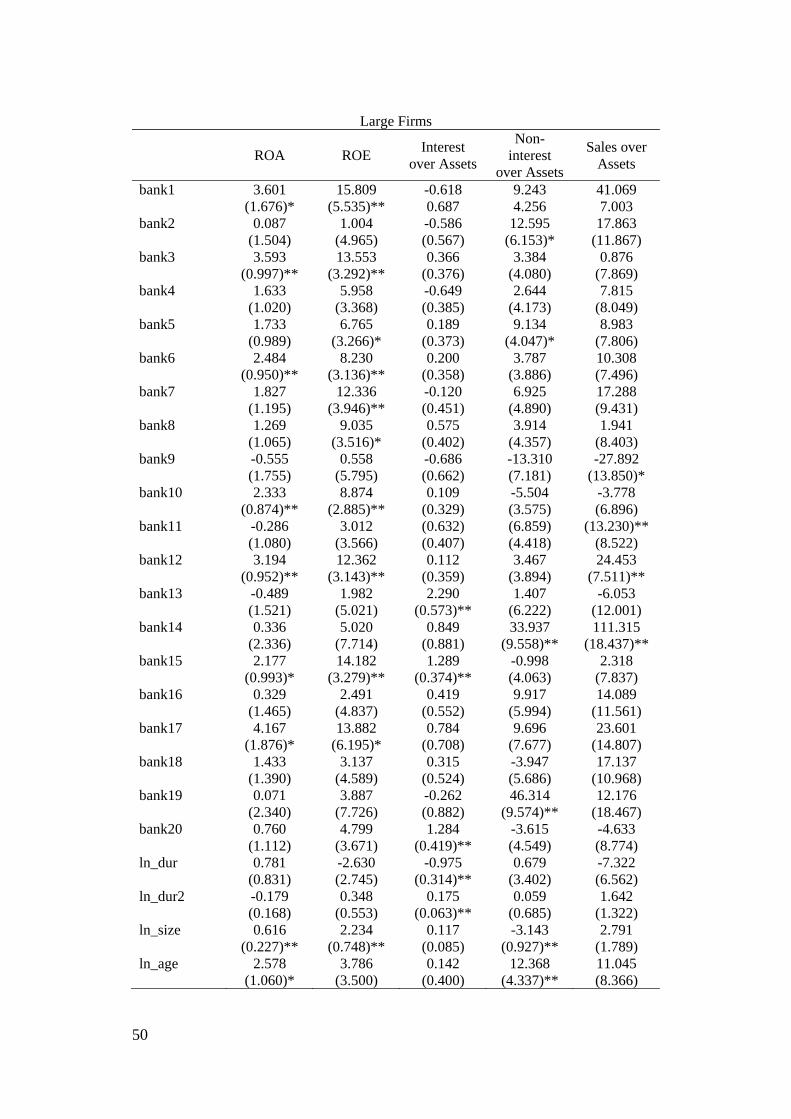
50
Large Firms
ROA ROE Interest
over Assets
Non-interest
over Assets
Sales over Assets
bank1 3.601 15.809 -0.618 9.243 41.069 (1.676)* (5.535)** 0.687 4.256 7.003 bank2 0.087 1.004 -0.586 12.595 17.863 (1.504) (4.965) (0.567) (6.153)* (11.867) bank3 3.593 13.553 0.366 3.384 0.876 (0.997)** (3.292)** (0.376) (4.080) (7.869) bank4 1.633 5.958 -0.649 2.644 7.815 (1.020) (3.368) (0.385) (4.173) (8.049) bank5 1.733 6.765 0.189 9.134 8.983 (0.989) (3.266)* (0.373) (4.047)* (7.806) bank6 2.484 8.230 0.200 3.787 10.308 (0.950)** (3.136)** (0.358) (3.886) (7.496) bank7 1.827 12.336 -0.120 6.925 17.288 (1.195) (3.946)** (0.451) (4.890) (9.431) bank8 1.269 9.035 0.575 3.914 1.941 (1.065) (3.516)* (0.402) (4.357) (8.403) bank9 -0.555 0.558 -0.686 -13.310 -27.892 (1.755) (5.795) (0.662) (7.181) (13.850)* bank10 2.333 8.874 0.109 -5.504 -3.778 (0.874)** (2.885)** (0.329) (3.575) (6.896) bank11 -0.286 3.012 (0.632) (6.859) (13.230)** (1.080) (3.566) (0.407) (4.418) (8.522) bank12 3.194 12.362 0.112 3.467 24.453 (0.952)** (3.143)** (0.359) (3.894) (7.511)** bank13 -0.489 1.982 2.290 1.407 -6.053 (1.521) (5.021) (0.573)** (6.222) (12.001) bank14 0.336 5.020 0.849 33.937 111.315 (2.336) (7.714) (0.881) (9.558)** (18.437)** bank15 2.177 14.182 1.289 -0.998 2.318 (0.993)* (3.279)** (0.374)** (4.063) (7.837) bank16 0.329 2.491 0.419 9.917 14.089 (1.465) (4.837) (0.552) (5.994) (11.561) bank17 4.167 13.882 0.784 9.696 23.601 (1.876)* (6.195)* (0.708) (7.677) (14.807) bank18 1.433 3.137 0.315 -3.947 17.137 (1.390) (4.589) (0.524) (5.686) (10.968) bank19 0.071 3.887 -0.262 46.314 12.176 (2.340) (7.726) (0.882) (9.574)** (18.467) bank20 0.760 4.799 1.284 -3.615 -4.633 (1.112) (3.671) (0.419)** (4.549) (8.774) ln_dur 0.781 -2.630 -0.975 0.679 -7.322 (0.831) (2.745) (0.314)** (3.402) (6.562) ln_dur2 -0.179 0.348 0.175 0.059 1.642 (0.168) (0.553) (0.063)** (0.685) (1.322) ln_size 0.616 2.234 0.117 -3.143 2.791 (0.227)** (0.748)** (0.085) (0.927)** (1.789) ln_age 2.578 3.786 0.142 12.368 11.045 (1.060)* (3.500) (0.400) (4.337)** (8.366)

51
Large Firms
ROA ROE Interest
over Assets
Non-interest
over Assets
Sales over Assets
ln_age2 -0.401 -0.647 -0.085 -1.942 -2.038 (0.179)* (0.590) (0.067) (0.731)** (1.410) constant -10.060 -24.554 1.834 62.680 82.684 (3.291)** (10.866)* (1.241) (13.465)** (25.971)** observations 509 509 509 509 509 r-squared 0.186 0.186 0.247 0.298 0.297
F-test numerator and denominator DF (2,463) (a) no bank 0.002 <0.001 <0.001 <0.001 <0.001
(b) no duration <0.001 <0.001 <0.001 <0.001 <0.001 (c) no age 0.048 0.546 <0.001 0.016 0.334
*significant at 5% level; ** significant at 1% level

BANK OF FINLAND RESEARCH
DISCUSSION PAPERS
ISSN 0785-3572, print; ISSN 1456-6184, online
1/2009 Leonardo Becchetti – Rocco Ciciretti – Iftekhar Hasan Corporate social
responsibility and shareholder’s value: an empirical analysis. 2009. 50 p.
ISBN 978-952-462-482-4, print; ISBN 978-952-462-483-1, online.
2/2009 Alistair Milne – Geoffrey Wood The bank lending channel reconsidered.
2009. 59 p. ISBN 978-952-462-484-8, print; ISBN 978-952-462-485-5, online.
3/2009 Peter Palmroos Effects of unobserved defaults on correlation between
probability of default and loss given default on mortgage loans. 2009. 28 p.
ISBN 978-952-462-486-2, print; ISBN 978-952-462-487-9, online.
4/2009 Sherrill Shaffer – Iftekhar Hasan – Mingming Zhou New small firms and
dimensions of economic performance. 2009. 35 p. ISBN 978-952-462-488-6,
print; ISBN 978-952-462-489-3, online.
5/2009 Seppo Honkapohja The 1990’s financial crises in Nordic countries. 2009.
29 p. ISBN 978-952-462-490-9, print; ISBN 978-952-462-491-6, online.
6/2009 Mervi Toivanen Financial interlinkages and risk of contagion in the Finnish
interbank market. 2009. 33 p. ISBN 978-952-462-492-3, print;
ISBN 978-952-462-491-6, online.
7/2009 Bill B Francis – Iftekhar Hasan – Xian Sun Political connections and the
process of going public: evidence from China. 2009. 49 p.
ISBN 978-952-462-494-7, print; ISBN 978-952-462-495-4, online.
8/2009 Giovanni Ganelli – Juha Tervala Public infrastructures, public consumption
and welfare in a new open economy macro model. 2009. 36 p.
ISBN 978-952-462-496-1, print; ISBN 978-952-462-497-8, online.
9/2009 Juha Kilponen Euler consumption equation with non-separable preferences
over consumption and leisure and collateral constraints. 2009. 33 p.
ISBN 978-952-462-500-5, print; ISBN 978-952-462-501-2, online.
10/2009 Risto Herrala Credit crunch? An empirical test of cyclical credit policy.
2009. 27 p. ISBN 978-952-462-502-9, print; ISBN 978-952-462-503-6, online.
11/2009 Jim Lee – Patrick M Crowley Evaluating the stresses from ECB monetary
policy in the euro area. 2009. 35 p. ISBN 978-952-462-504-3, print;
ISBN 978-952-462-505-0, online.

12/2009 Mikael Juselius – Moshe Kim – Staffan Ringbom Do markup dynamics
reflect fundamentals or changes in conduct? 2009. 45 p.
ISBN 978-952-462-506-7, print; ISBN 978-952-462-507-4, online.
13/2009 Iftekhar Hasan – Michael Koetter – Michael Wedow Regional growth and
finance in Europe: Is there a quality effect of bank efficiency? 2009. 27 p.
ISBN 978-952-462-508-1, print; ISBN 978-952-462-509-8, online.
14/2009 Markus Haavio – Heikki Kauppi House price fluctuations and residential
sorting. 2009. 56 p. ISBN 978-952-462-510-4, print; ISBN 978-952-462-511-1,
online.
15/2009 Juha Kilponen – Juuso Vanhala Productivity and job flows: heterogeneity of
new hires and continuing jobs in the business cycle. 2009. 48 p.
ISBN 978-952-462-514-2, print; ISBN 978-952-462-515-9, online.
16/2009 Juha-Pekka Niinimäki – Ville Mälkönen Blanket guarantee and
restructuring decisions for multinational banks in a bargaining model.
2009. 37 p. ISBN 978-952-462-516-6, print; ISBN 978-952-462-517-3, online.
17/2009 David G Mayes Early intervention and prompt corrective action in Europe.
2009. 41 p. ISBN 978-952-462-518-0, print; ISBN 978-952-462-519-7, online.
18/2009 Markku Lanne – Pentti Saikkonen Noncausal vector autoregression. 2009.
63 p. ISBN 978-952-462-520-3, print; ISBN 978-952-462-521-0, online.
19/2009 Juha-Pekka Niinimäki Screening in the credit market when the collateral
value is stochastic. 2009. 29 p. ISBN 978-952-462-522-7, print;
ISBN 978-952-462-523-4, online.
20/2009 Efrem Castelnuovo Testing the structural interpretation of the price puzzle
with a cost channel model. 2009. 34 p. ISBN 978-952-462-524-1, print;
ISBN 978-952-462-525-8, online.
21/2009 Peter Nyberg – Mika Vaihekoski A new value-weighted total return index
for the Finnish stock market. 2009. 61 p. ISBN 978-952-462-526-5, print;
ISBN 978-952-462-527-2, online.
22/2009 Mari Komulainen – Tuomas Takalo Does State Street lead to Europe? The
case of financial exchange innovations. 2009. 53 p. ISBN 978-952-462-528-9,
print; ISBN 978-952-462-529-6, online.
23/2009 Esa Jokivuolle – Ilkka Kiema – Timo Vesala Credit allocation, capital
requirements and procyclicality. 2009. 40 p. ISBN 978-952-462-530-2, print;
ISBN 978-952-462-531-9, online.

24/2009 George W Evans – Seppo Honkapohja Expectations, deflation traps and
macroeconomic policy. 2009. 35 p. ISBN 978-952-462-532-6, print;
ISBN 978-952-462-533-3, online.
25/2009 Alistair Milne – Mario Onorato Risk-adjusted measures of value creation in
financial institutions. 2009. 37 p. ISBN 978-952-462-538-8, print;
ISBN 978-952-462-539-5, online.
26/2009 Esa Jokivuolle – Matti Viren – Oskari Vähämaa Transmission of macro
shocks to loan losses in a deep crisis: the case of Finland. 2009. 31 p.
ISBN 978-952-462-540-1, print; ISBN 978-952-462-541-8, online.
27/2009 Laura Vajanne Inferring market power from retail deposit interest rates in
the euro area. 2009. 31 p. ISBN 978-952-462-542-5, print;
ISBN 978-952-462-543-2, online.
28/2009 Juha Tervala Export pricing and the cross-country correlation of stock
prices. 2009. 31 p. ISBN 978-952-462-544-9, print; ISBN 978-952-462-545-6,
online.
29/2009 Jukka Vauhkonen Bank safety under Basel II capital requirements. 2009.
33 p. ISBN 978-952-462-546-3, print; ISBN 978-952-462-547-0, online.
30/2009 Efrem Castelnuovo – Paolo Surico Monetary policy, inflation expectations
and the price puzzle. 2009. 35 p. ISBN 978-952-462-548-7, print;
ISBN 978-952-462-549-4, online.
31/2009 Martin T Bohl – David G Mayes – Pierre L Siklos The quality of monetary
policy and inflation performance: globalization and its aftermath. 2009.
51 p. ISBN 978-952-462-550-0, print; ISBN 978-952-462-551-7, online.
32/2009 Patrick M Crowley How do you make a time series sing like a choir? Using
the Hilbert-Huang transform to extract embedded frequencies from
economic or financial time series. 2009. 38 p. ISBN 978-952-462-552-4,
print; ISBN 978-952-462-553-1, online.
33/2009 Patrick C Crowley – Tony Schildt An analysis of the embedded frequency
content of macroeconomic indicators and their counterparts using the
Hilbert-Huang transform. 2009. 51 p. ISBN 978-952-462-554-8, print;
ISBN 978-952-462-555-5, online.
34/2009 Leonardo Becchetti – Andrea Carpentieri – Iftekhar Hasan The determinants
of option-adjusted delta credit spreads: a comparative analysis of the
United States, the United Kingdom and the euro area. 78 p.
ISBN 978-952-462-556-2, print; ISBN 978-952-462-557-9, online.

35/2009 Yuliya Demyanyk – Iftekhar Hasan Financial crises and bank failures: a
review of prediction methods. 34 p. ISBN 978-952-462-564-7, print;
ISBN 978-952-462-565-4, online.
36/2009 Annalisa Castelli – Gerald P Dwyer – Iftekhar Hasan Bank relationships and
firms’ financial performance: the Italian experience. 55 p.
ISBN 978-952-462-566-1, print; ISBN 978-952-462-567-8, online.

Suomen PankkiBank of FinlandP.O.Box 160FI-00101 HELSINKIFinland