bank of uganda · mainly a result of fiscal operations. bou was ... balance sheet repair so as to...
TRANSCRIPT
Bank of Uganda
Monetary Policy Report May 2012
Table of
Monetary Policy Report, May, 2012 Page 2
Contents
Overview .................................................................................................................................................... 3
1.Global Economic Developments and Prospects ............................................................................. 3
1.1 Real Economic Activity ...................................................................................................................................... 3
1.2 Global Inflation ................................................................................................................................................ 5
1.3 Global Financial and Commodities Markets .................................................................................................... 6
1.4 Global Economic Outlook ............................................................................................................................. 6
1.5 Regional Economic Outlook ......................................................................................................................... 8
1.6 Implications for the Ugandan economy ..................................................................................................... 9
2.0 Domestic economy ...................................................................................................................... 9
2.1 Monetary Policy Actions in April 2012 ..................................................................................................... 9
2.2 Financial Sector Developments .................................................................................................................. 10
2.3 Growth, Output and Aggregate Demand ................................................................................................. 17
2.3.3 External Demand ...........................................................................................................................................18
2.5 Exchange Rate Developments .................................................................................................................... 20
3.0 Inflation ........................................................................................................................................ 21
3.1 Inflation developments and determinants ....................................................................................................... 21
3.2 Inflation forecasts ............................................................................................................................................... 24
4. Policy Implications and Policy framework for May 2012. ........................................................ 25
Overview This report analyses the past and present economic and monetary aspects of both the Global and Domestic economy. It assesses the external and domestic risks to price stability as of end April 2012. The report also assesses the future prospects for inflation and economic activity based on the outlook on the evolvement of both domestic and external factors. It is upon this analysis that Bank of Uganda decides on a level of Central Bank Rate (CBR) that will serve to ensure of price stability. In April 2012, BOU maintained the Central Bank Rate (CBR) at 21 percent on account of the imminent risks to the downward trend in inflation observed for five months thus far. Risks to inflation arose from sustained increases in oil prices in Q1 2012, exchange rate depreciation and increasing food crop prices. Liquidity conditions in the banking system remained broadly consistent with the neutral stance keeping the money market rates within the CBR band throughout month. The developments in liquidity conditions were mainly a result of fiscal operations. BOU was active in the money market to fine tune short-term liquidity by injecting liquidity through the issuance of reverse REPOs. The global economic outlook looks more optimistic than it did a few months ago with America’s continued recovery and the European Central Bank’s interventions in the financial sector. The IMF’s forecasts for global growth in 2012 have also slightly improved. Despite the seemingly bright picture, there are still concerns about a spill over from a worsening of the European debt, geo-political factors like the on-going conflict between South and North Sudan and higher than anticipated oil prices oil.
On the domestic scene, inflation outturn in April was as projected although the disinflation pace has weakened. In addition, non-food inflation remains sticky downwards. Still on the downside, domestic demand remains subdued, real GDP growth is expected to continue slowing down and the outlook for money demand is uncertain. On the other hand, the reversal of the previous months’ supply and demand of credit reflects market confidence on policy stance. In addition, the stability of the exchange rate during April 2012 augurs well with the deceleration in inflation. Commercial banks’ lending rates and yields on securities which have remained high and as a result attracted portfolio flows that have helped in the stabilization of the exchange rate. The challenge for the central bank is the sustainability of these portfolio flows as most of which seem speculative and could result in volatility in the exchange rate. Also the challenge of balancing upside risks to inflation and implementing monetary policy without stagnating economic activity still persists. The remainder of this issue of the Monthly Monetary Policy Review contains four sections. The first section reviews recent global economic development in regard to economic activity, inflation and financial markets and the implications to Ugandan economy. The second section describes domestic developments in relation to aggregate demand and supply, and financial sector. The third section analyses inflation development and outlook and last section gives policy implications for the month.
1.Global Economic Developments and Prospects
1.1 Real Economic Activity Prospects of recovery and stabilisation have been observed in the financial markets although downside risks to full global economic recovery are still elevated. Economic activity has remained weak especially amongst the advanced
economies while growth in the emerging economies has remained fairly robust following a decline in the later part of 2011. Irrespective of the improvements in economic data, there are still eminent hurdles to full and speedy global

Monetary Policy Report, May, 2012 Page 4
economic recovery in the medium term. These include: complete resolution of the sovereign debt crisis; the need to address fundamental weaknesses in the labour and housing markets of the advanced economies and to complete the balance sheet repair so as to restore full global financial stability. Consumer confidence is also holding up better in the emerging than advanced economies. These developments are shown in figure 1.
Figure 1: Composite Leading Indicators.
Source: OECD Statistics
The JP Morgan global manufacturing Purchasing Manger Index (PMI) for March 2012 remained mostly unchanged at 51.1 in comparison to 51.2 in February 2012. Overall, for Q1 2012, modest expansion in production, new orders and employment were observed for the global manufacturing sector. On the other hand, input costs continued to increase due to high oil and transport costs.
The Eurozone composite output index fell to about 47.4 (flash estimate) in April 2012 from 49.1 and 49.3 in March and February 2012 respectively indicating a contraction in the Eurozone economy. The manufacturing PMI also declined to about 46 (flash estimate) in April 2012 from 47.7 and 49 in March and April 2012 respectively. Following these outcomes, Markit Economics forecasts that output in the Eurozone might have declined in Q1 2012 thus implying that the Eurozone might fall into a ‘technical recession’1 following a contraction of 0.3 percent in GDP during Q4 2011. The first estimate for U.K’s quarter on quarter GDP for Q1 2012 is a contraction of 0.2 percent following another contraction of 0.3 percent in Q4 2011 showing that the U.K economy is back in a recession.
Notably, there was a marked decline of 3 percent in the construction sector in Q1 2012 following a decline of 0.2 percent in Q4 2011. Similarly the output in production industries decreased by 0.4 percent during Q1 2012 following a decline of 1.3 percent in Q4 2011. Conversely, an increase of 0.1 percent was noted
1 A technical recession occurs when real GDP declines over two
consecutive quarters causing a contraction in the total volume of production in the economy.
in the output for services industries after a decline of 0.1 percent in Q4 2011. The decline in GDP could be attributed to the sovereign euro debt crisis, the ongoing austerity measures and high unemployment level of 8.3 percent. Following an expansion of 3 percent in Q4 2011, the U.S.A economy expanded at an annual rate of 2.2 percent in Q1 2012 although this is still below the expectations of 2.5 percent.
The positive GDP for Q1 2012 was attributed to higher personal consumption expenditure, exports private inventory and residential investment. The performance below expectations was due to decline in government spending and non residential fixed investment. Notably, input costs were higher during Q1 2012 due to rising oil prices though inflationary pressures remain tamed due to weak demand. Japan’s real GDP for Q1 2012 is expected to expand following a contraction of 0.6 percent (q-o-q) in Q4 2011. This outlook is based on the strong output growth observed in the private sector and positive manufacturing PMI data for the quarter. Markit Economics predicts that this growth might be sustained in Q2 2012 as new orders have risen fastest since September 2007.
China’s annual real GDP grew by 8.1 percent in Q1 2012 lower than growth of 8.9 percent observed in Q4 2011. Notably, fixed asset investment grew at its slowest since early 2003 implying that the investment led stimulus especially in property introduced during the financial crisis of 2008-2009 could be slowing down. The PMIs also indicated a decline in new orders during March 2012. In India, annual real
Monetary Policy Report, May, 2012 Page 5
GDP growth decreased to 6.3 percent in Q4 2011 from 6.7 percent in Q3 2011. This was attributed to a decline in the investment and export growth. Conversely, Brazil’s GDP for Q4 2011 increased 0.3 percent on a quarterly basis
following a contraction in Q3 2011. On an annual basis, an increase of 1.4 percent was observed for Q4 2011. Brazil’s composite output has shown continued recovery in Q1 2012.
1.2 Global Inflation
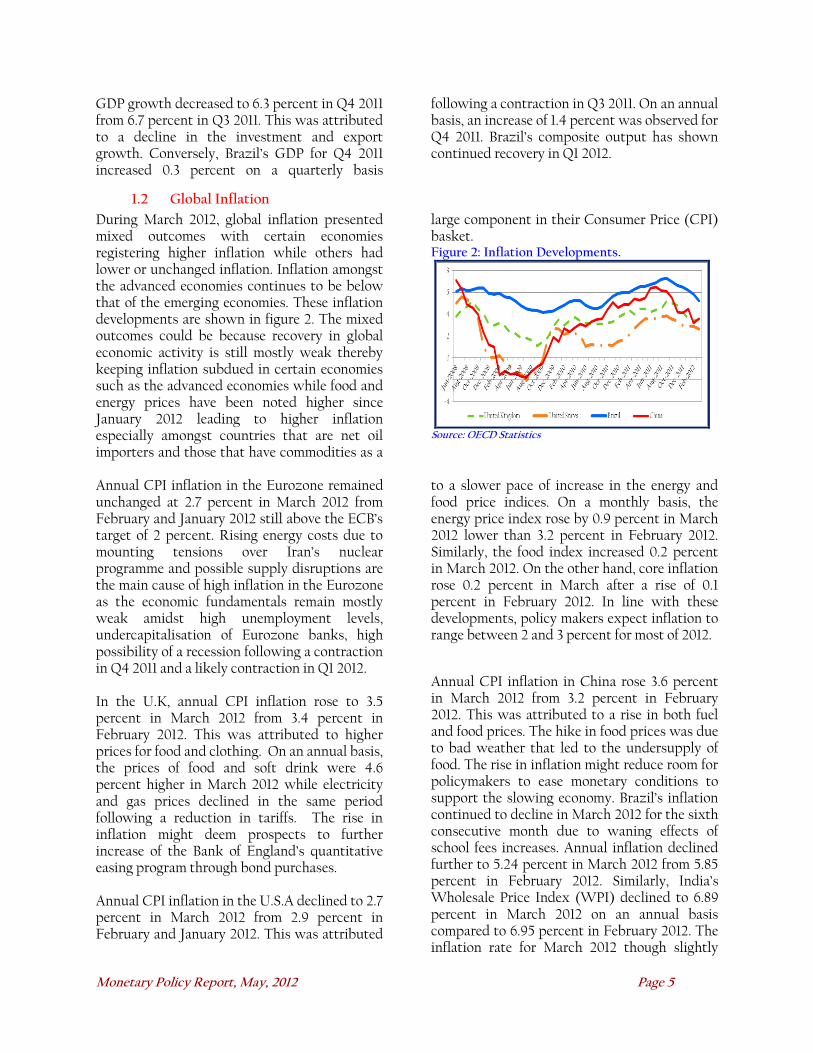
During March 2012, global inflation presented mixed outcomes with certain economies registering higher inflation while others had lower or unchanged inflation. Inflation amongst the advanced economies continues to be below that of the emerging economies. These inflation developments are shown in figure 2. The mixed outcomes could be because recovery in global economic activity is still mostly weak thereby keeping inflation subdued in certain economies such as the advanced economies while food and energy prices have been noted higher since January 2012 leading to higher inflation especially amongst countries that are net oil importers and those that have commodities as a
large component in their Consumer Price (CPI) basket. Figure 2: Inflation Developments.
Source: OECD Statistics
Annual CPI inflation in the Eurozone remained unchanged at 2.7 percent in March 2012 from February and January 2012 still above the ECB’s target of 2 percent. Rising energy costs due to mounting tensions over Iran’s nuclear programme and possible supply disruptions are the main cause of high inflation in the Eurozone as the economic fundamentals remain mostly weak amidst high unemployment levels, undercapitalisation of Eurozone banks, high possibility of a recession following a contraction in Q4 2011 and a likely contraction in Q1 2012. In the U.K, annual CPI inflation rose to 3.5 percent in March 2012 from 3.4 percent in February 2012. This was attributed to higher prices for food and clothing. On an annual basis, the prices of food and soft drink were 4.6 percent higher in March 2012 while electricity and gas prices declined in the same period following a reduction in tariffs. The rise in inflation might deem prospects to further increase of the Bank of England’s quantitative easing program through bond purchases. Annual CPI inflation in the U.S.A declined to 2.7 percent in March 2012 from 2.9 percent in February and January 2012. This was attributed
to a slower pace of increase in the energy and food price indices. On a monthly basis, the energy price index rose by 0.9 percent in March 2012 lower than 3.2 percent in February 2012. Similarly, the food index increased 0.2 percent in March 2012. On the other hand, core inflation rose 0.2 percent in March after a rise of 0.1 percent in February 2012. In line with these developments, policy makers expect inflation to range between 2 and 3 percent for most of 2012.
Annual CPI inflation in China rose 3.6 percent in March 2012 from 3.2 percent in February 2012. This was attributed to a rise in both fuel and food prices. The hike in food prices was due to bad weather that led to the undersupply of food. The rise in inflation might reduce room for policymakers to ease monetary conditions to support the slowing economy. Brazil’s inflation continued to decline in March 2012 for the sixth consecutive month due to waning effects of school fees increases. Annual inflation declined further to 5.24 percent in March 2012 from 5.85 percent in February 2012. Similarly, India’s Wholesale Price Index (WPI) declined to 6.89 percent in March 2012 on an annual basis compared to 6.95 percent in February 2012. The inflation rate for March 2012 though slightly

Monetary Policy Report, May, 2012 Page 6
lower, remained relatively high as food and energy prices were noted higher.
1.3 Global Financial and Commodities Markets Energy and non-energy prices rose in March 2012 though the pace of increase was lower than in February 2012. According to the World Bank, the energy price index rose by 3.7 percent in March 2012 in comparison to a rise of 4.4 percent in February 2012. The non-energy index rose 0.6 percent in March 2012 compared to a rise of 2.7 percent in February 2012. The rise in the non-energy index was largely attributed to a rise in food prices especially fats and oils.
The Food and Agricultural Organisation (FAO) food index which is a measure of monthly changes in international prices of a basket of food commodities rose slightly by 0.3 percent to an average of 215.86 in March 2012 from 215.27 points in February 2012 mostly representing a rise in the prices of oils. Other food commodities such as cereals, sugar and meat remained unchanged. The rise in prices was because of adverse weather conditions that affected supply in South America. Crude oil prices (World Bank average) rose by 4.5 percent to U.S. $ 117.8 per barrel in March 2012 from U.S $ 112.69 per barrel in February 2012. The rise in prices was due to current and expected losses in supply from Iran especially when the European Union
embargo on oil imports from Iran comes into effect in July 2012. Also, disruptions in production and sequentially supply are expected due to political unrest in South Sudan, Syria and Yemen. In tandem with the February 2012’s outlook, the International Energy Agency (IEA) still forecasts that oil demand for 2012 will be 0.9 percent higher than 2011 at 89.9 million barrels per day. The developments in the commodity indices are shown in figure 3.
Figure 3: Main Developments in Commodity prices.
Source: World Bank Database 2012
The implementation of appropriate policies by the ECB and governments of the Eurozone have been effective in improving global financial stability and thus reducing sovereign spreads, revamping equity prices and reopening bank funding markets. The Credit Default Swaps (CDS) which are agreements that guarantee that the seller of the swap will compensate the buyer of the swap in the event of loan default rates varied across most countries rose higher on average over concerns of Spain’s debt issues. According to the World Bank, Spain and Italy’s CDS rates had risen by 80 and 33 basis points by
April 3 2012. On the other hand, Portuguese and Irish bonds have reduced by 125 and 25 basis points respectively since March 1st 2012. Also, equity markets though largely stable have risen moderately by about 7 percent since February 2012 implying that the downside risks to global financial stability remain elevated. Improved global sentiments from the start of 2012 sent investors away from the U.S. dollar to more risky assets such as commodities and emerging market stocks and currencies. But the outlook is for a stronger U.S. dollar as the rival currency such as the euro might remain under pressure as the Eurozone seeks a lasting solution to the sovereign debt crisis.
1.4 Global Economic Outlook According to the IMF World Economic Outlook April 2012, the global economy is strengthening in 2012 with lower threats for a slowdown though downside risks remain. The observed
improvement in prospects for the global economy is attributed to better policies that have been put in place to manage the sovereign euro debt crisis and improvement in economic
Monetary Policy Report, May, 2012 Page 7
indicators for the U.S.A since H2 2011. The policies introduced to manage the sovereign debt crisis include: a three year longer term refinancing program by the ECB, reforms in the labour markets and fiscal adjustment programs.
Accordingly, the IMF forecasts that global growth might expand by 3.5 and 4.1 percent in 2012 and 2013 respectively up from 3.3 and 4 percent forecast in January 2012. This is attributed to improved stability in the global financial markets, the implementation of accommodative monetary policies in most economies and high expectations that fiscal consolidation might continue in most economies. Advanced economies might expand by 1.4 and 2 percent in 2012 and 2013 respectively up from 1.2 and 1.9 percent in earlier forecasts.
Emerging and developing economies are expected to grow by 5.7 and 6 percent in 2012 and 2013 up from 5.5 and 5.9 in earlier forecasts. Overall, because the outlook maintains that improvements in the global economy might remain fragile, the forecast for global growth in 2012 is still forecast lower at 3.5 percent than 2011’s outturn of 4 percent. Similarly, growth in the advanced, emerging and developing economies in 2012 is expected to remain below levels of 2011. The advanced economies are expected to recover weakest while emerging and developing economies might maintain robust growth. This is mainly because the Eurozone is still forecast to go into a mild recession in 2012 due to effects of the sovereign debt crisis, lower confidence in the markets and fiscal consolidation amongst economies in the euro area.
Following an expansion of 1.5 percent in 2011, the Eurozone’s GDP is forecast to contract by about 0.3 percent in 2012 rebounding to about 1 percent in 2013. On the other hand, GDP growth in the U.S.A. is expected to strengthen in 2011 rising to about 2 and 2.4 percent for 2012 and 2013. Similarly, Japan’s GDP growth for 2012 has been forecast higher than 2011 at about 2 percent in 2012 following recovery in production after the earthquake and tsunami. The major drag on full recovery amongst the advanced economies is the high level of
unemployment which requires for governments to provide more assistance in form of unemployment benefits and skills training. Emerging and developing economies are expected to maintain fairly robust growth of about 5.7 and 6 percent in 2012 and 2013, respectively, due to strong macroeconomic and structural policies though domestic economic weaknesses are growing. In emerging Asia, the fading effects of the floods in Thailand and recovery in production after the Japan earthquake might attribute to stronger growth in 2012 and 2013.
Amongst the Middle East and North Africa (MENA) region, the resumption of oil production in Libya should prompt growth though the political unrest poses a major risk to growth. Economic activity in Sub-Saharan Africa (SSA) is expected to remain strong due to rising production of minerals and crude oil. The main downside risks to speedy recovery of the global economy include: the possibility that there might be a further decline in global growth and output if the euro debt crisis worsens, oil prices might increase in the face of rising geopolitical tensions, since most economies are implementing tight macroeconomic policies this could trigger deflation and also weaker economic activity, the possibility that there might be a slowdown in commodity prices could trigger a slowdown in the emerging and developing economies that have reaped highly from high commodity prices and the possibility that economies such as Japan and U.SA that have large fiscal deficits could influence disruptions in the global economy.
The World Trade Organisation (WTO) forecasts that world trade growth might slow further in 2012 amidst increased downside risks. In 2011, global trade growth slowed to 5 percent from a high of 13.8 percent in 2010 and expectations are high that even slower growth of about 3.7 percent might be attained in 2012. The outlook for slower trade growth is attributed to high expectations that global growth might remain constrained until full resolution of the sovereign euro debt crisis is attained. Export growth for the developed and
Monetary Policy Report, May, 2012 Page 8
developing2 economies for 2012 is forecast at 2 and 5 percent respectively while import growth for developed and developing economies in 2012 is forecast at 1.9 and 6.2 percent respectively. The downside risks to this outlook are the possibility that the euro debt crisis worsens leading to constraints in the financial markets and that commodity prices continue to rise leading to subdued economic activity amongst countries that are net oil importers.
The upside risks include the possibility that the sovereign debt crisis eases, that the U.S.A. economy continues to recover strongly leading to an increase in import demand and also that the Japanese economy recovers faster restoring supply chains fully. For 2012 and 2013, the IMF forecasts that commodity prices are unlikely to increase at the same pace as they did in the past decade though risks to higher prices are elevated. This is because high expectations of a slower global economy and sequentially lower consumption and political unrest in oil producing regions might hamper sustained rises in commodity prices. On the other hand, the ECB (April 2012) predicts that pressures on oil prices might decline if strategic oil reserves are released and that Saudi Arabia increases production in the foreseeable future.
In the global food markets, prices are expected to remain relatively high. This is because demand is expected to continue outpacing supply amidst adverse weather conditions and other supply shocks. In addition, food inventories are noted lower and are below their average of the past forty years. According to the IMF, risks to global financial stability remain eminent irrespective of the implementation of appropriate policy actions to curb the sovereign debt crisis by the ECB and governments in the euro area. The risks to durable global financial stability remain high because pressures on European banks remain high as the euro area grapples with weak growth, increased need to rebuild the capital base of euro banks to improve investor confidence and ‘high rollover requirements’.
2 These include the Commonwealth of
Independent States
From the second half of 2011, inflation was noted lower in most economies because of declining commodity prices and lower global economic activity. Since the outlook for growth is varied amongst the advanced, emerging and developing economies, the outlook on inflation is mixed. In the advanced economies and the emerging economies of Asia and Europe, the IMF forecasts for easing of inflation in 2012 with the exception of India and Indonesia. Conversely, the IMF forecasts that inflation pressures are expected to remain high in parts of Sub-Saharan Africa, the Middle East and North Africa due to supply side disruptions and implementation of accommodative macroeconomic policies.
1.5 Regional Economic Outlook
In March 2012, annual inflation declined in
Kenya and Tanzania declined to 15.6 percent
and 19.0 percent from respective rates of 16.7
percent and 19.0 percent in the previous month.
On the other hand, inflation in Burundi and
Rwanda increased in March 2012 to 24.5
percent and 8.2 percent, respectively from 22.0
percent and 7.8 percent in February 2012 mainly
driven by a rise in food and utility prices.
All the East African Central Banks maintained a
neutral monetary policy during April 2012 in a
bid to rein in the second round effects of
inflation and maintain stability in the exchange
rate markets. The Central Bank of Kenya (CBK)
and National Bank of Rwanda maintained their
key lending rates at 18.0 percent and 7.0 percent,
respectively. The Central Banks of Tanzania and
Burundi maintained tight monetary policy
stances. Reflecting the Bank of Tanzania's tight
monetary policy stance, the monthly average
weighted annualized yields for the 91-day, 182-
day, and 364-day papers rose to 13.8, 13.9, and
14.9 percent, respectively during the month
from 12.8, 13.1, and 13.9 percent in the previous
month. However, the monthly average weighted
annualized yields for the 91-day, 182-day, and
364-day papers in Kenya declined to 15.8, 16.7,
and 16.9 percent, during the month from 17.3,
Monetary Policy Report, May, 2012 Page 9
18.0, and 17.0 percent in March 2012. Similarly,
respective rates in Rwanda declined to 7.4, 7.9,
and 8.5 percent from 7.6, 7.9, and 7.8 percent in
the previous month.
On a month-on-month basis, all the east African
currencies remained relatively stable in April
2012. The Kenya Shilling and Rwanda franc
remained relatively stable in April 2012,
depreciating by 0.4 percent and 0.1 percent,
respectively on a monthly basis to average
midrates of KES 83.2/US$ and RWF
606.94/US$. The Tanzania Shilling, however,
appreciated by 0.5 percent to an average
midrates of TZS 1,583.8/US$ in April 2012. On
annual basis, in April 2012 the Tanzania Shilling
and Rwanda Franc recorded annual
depreciations of 4.9 percent and 1.0 percent,
respectively while the Kenya shilling
appreciated by 0.8 percent over the same period.
Reflecting current economic developments in
the region, the IMF expects real GDP in Kenya
and Burundi to grow by 5.2 percent and 4.8
percent in 2012, compared to 5.0 percent and 4.2
percent, respectively in 2011 on account of a
rebound in agricultural output and electricity
generation. However, power shortages and
macroeconomic tightening to stem inflation
pressures are expected to lead to a decline in
real GDP growth in Rwanda and Tanzania to
6.4 percent and 7.6 percent in 2012 from 6.7
percent and 8.8 percent, respectively in 2011.
The uncertainty in the external environment
owing to weaker growth in trading partners,
lower aid flows, and high oil prices remain key
downside risks to the macroeconomic outlook
for the region.
1.6 Implications for the Ugandan economy Irrespective of the current signs of recovery in the global economy, downside risks still remain eminent. The continued slow recovery in the advanced economies might imply that recovery of Uganda’s Balance of Payments could remain weak. Specifically, the debt crisis and sequential lagged growth in the European Union which makes up 21.9 percent of our export market as at February 2012 might lead to lower export growth for Uganda. In addition, the WTO further emphasises that Africa’s volume of exports contracted 8.3 percent in 2011 indicating the need for Uganda like the rest of Africa to boost its own volume of exports and in the long run focus on promoting regional trade to cater for declining demand from the advanced economies.
A weak BoP might translate into higher depreciation pressures for the Uganda shilling, therefore there might be a need to boost international reserves to cater for volatility in the foreign exchange market. However, the boosting of reserves is conditional to the stability in the global financial markets.
Irrespective of the lower global inflation, the current hikes in oil prices imply that domestic inflationary pressures might become more persistent. Therefore, tighter monetary policies should be put in place to ensure macroeconomic stability. Specifically, policies should ensure a balance so as to bring down inflation without compromising economic growth.
2.0 Domestic economy
2.1 Monetary Policy Actions in April 2012
In April 2012, the inflation outlook pointed to a slower pace of disinflation mainly on account of food crops inflation. In support of this was the subdued aggregate demand, continued slowdown of the domestic economy, higher oil prices and uncertainty in money demand. This
was notwithstanding the stability in the exchange rate registered during the month. Given these developments, the Bank of Uganda (BOU) maintained the CBR at 21 percent in April 2012. The band on the CBR remained at plus/minus 3 percentage points and the margin
Monetary Policy Report, May, 2012 Page 10
on the rediscount rate was maintained at 4 percentage points on the CBR. Consequently, the rediscount rate and the Bank rate remained at 25 percent and 26 percent, respectively.
In a bid to align structural liquidity with levels consistent with the monetary policy stance for the month, BOU issued treasury securities. The average yields on the government papers rose with the exception of the 2-year Treasury bond, perhaps reflecting lower inflation expectations in the medium term.
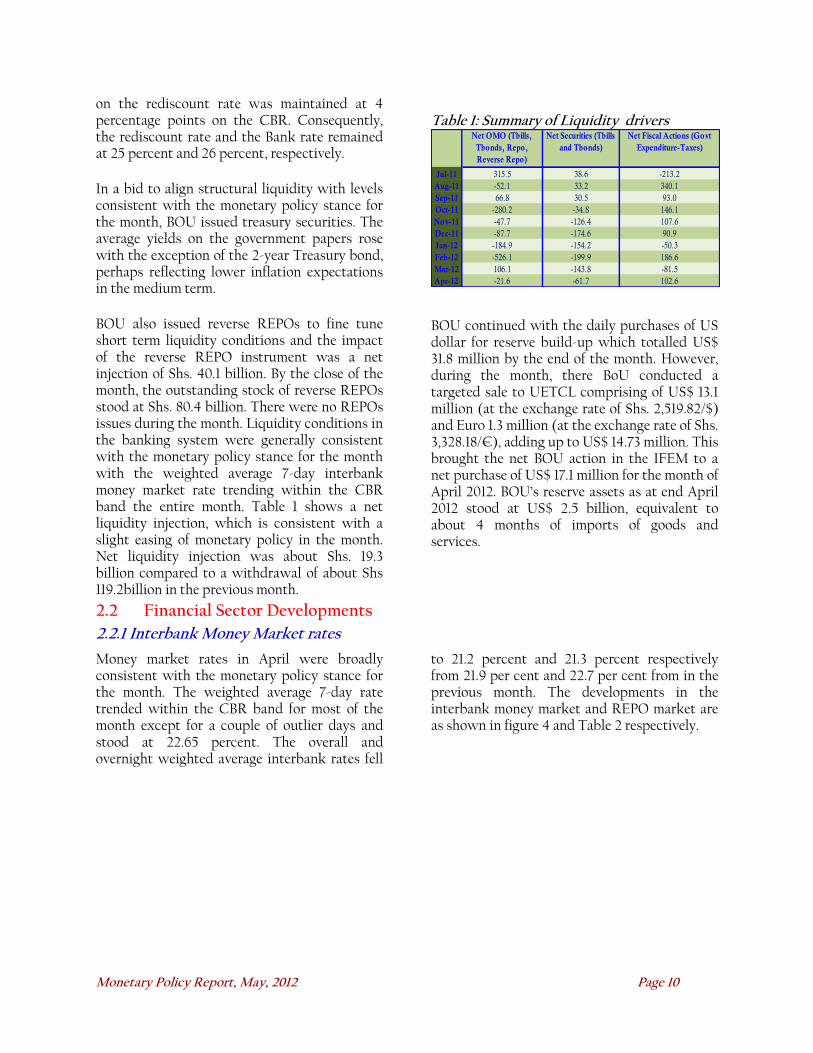
BOU also issued reverse REPOs to fine tune short term liquidity conditions and the impact of the reverse REPO instrument was a net injection of Shs. 40.1 billion. By the close of the month, the outstanding stock of reverse REPOs stood at Shs. 80.4 billion. There were no REPOs issues during the month. Liquidity conditions in the banking system were generally consistent with the monetary policy stance for the month with the weighted average 7-day interbank money market rate trending within the CBR band the entire month. Table 1 shows a net liquidity injection, which is consistent with a slight easing of monetary policy in the month. Net liquidity injection was about Shs. 19.3 billion compared to a withdrawal of about Shs 119.2billion in the previous month.
Table 1: Summary of Liquidity drivers
Net OMO (Tbills,
Tbonds, Repo,
Reverse Repo)
Net Securities (Tbills
and Tbonds)
Net Fiscal Actions (Govt
Expenditure-Taxes)
Jul-11 315.5 38.6 -213.2
Aug-11 -52.1 33.2 340.1
Sep-11 66.8 30.5 93.0
Oct-11 -280.2 -34.8 146.1
Nov-11 -47.7 -126.4 107.6
Dec-11 -87.7 -174.6 90.9
Jan-12 -184.9 -154.2 -50.3
Feb-12 -526.1 -199.9 186.6
Mar-12 106.1 -143.8 -81.5
Apr-12 -21.6 -61.7 102.6
BOU continued with the daily purchases of US dollar for reserve build-up which totalled US$ 31.8 million by the end of the month. However, during the month, there BoU conducted a targeted sale to UETCL comprising of US$ 13.1 million (at the exchange rate of Shs. 2,519.82/$) and Euro 1.3 million (at the exchange rate of Shs. 3,328.18/€), adding up to US$ 14.73 million. This brought the net BOU action in the IFEM to a net purchase of US$ 17.1 million for the month of April 2012. BOU’s reserve assets as at end April 2012 stood at US$ 2.5 billion, equivalent to about 4 months of imports of goods and services.
2.2 Financial Sector Developments
2.2.1 Interbank Money Market rates
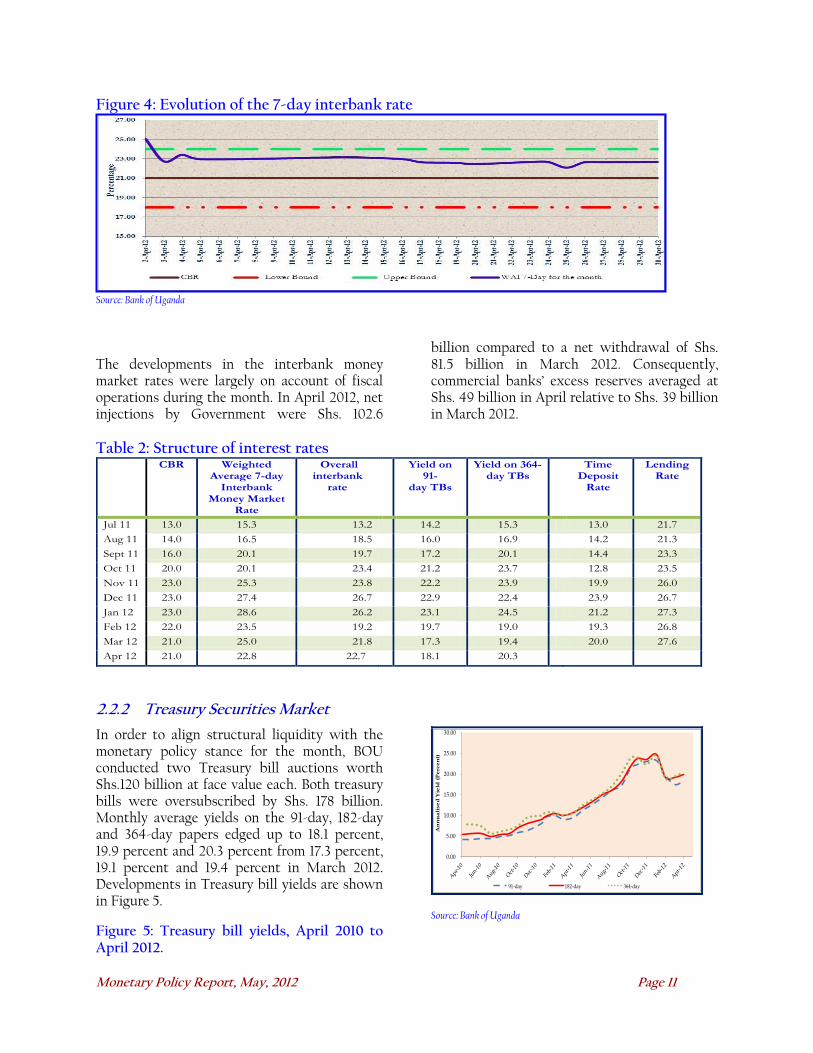
Money market rates in April were broadly consistent with the monetary policy stance for the month. The weighted average 7-day rate trended within the CBR band for most of the month except for a couple of outlier days and stood at 22.65 percent. The overall and overnight weighted average interbank rates fell
to 21.2 percent and 21.3 percent respectively from 21.9 per cent and 22.7 per cent from in the previous month. The developments in the interbank money market and REPO market are as shown in figure 4 and Table 2 respectively.
Monetary Policy Report, May, 2012 Page 11
Figure 4: Evolution of the 7-day interbank rate
Source: Bank of Uganda
The developments in the interbank money market rates were largely on account of fiscal operations during the month. In April 2012, net injections by Government were Shs. 102.6
billion compared to a net withdrawal of Shs. 81.5 billion in March 2012. Consequently, commercial banks’ excess reserves averaged at Shs. 49 billion in April relative to Shs. 39 billion in March 2012.
Table 2: Structure of interest rates
CBR Weighted Average 7-day
Interbank Money Market
Rate
Overall interbank
rate
Yield on 91-
day TBs
Yield on 364-day TBs
Time Deposit
Rate
Lending Rate
Jul 11 13.0 15.3 13.2 14.2 15.3 13.0 21.7
Aug 11 14.0 16.5 18.5 16.0 16.9 14.2 21.3
Sept 11 16.0 20.1 19.7 17.2 20.1 14.4 23.3
Oct 11 20.0 20.1 23.4 21.2 23.7 12.8 23.5
Nov 11 23.0 25.3 23.8 22.2 23.9 19.9 26.0
Dec 11 23.0 27.4 26.7 22.9 22.4 23.9 26.7
Jan 12 23.0 28.6 26.2 23.1 24.5 21.2 27.3
Feb 12 22.0 23.5 19.2 19.7 19.0 19.3 26.8
Mar 12 21.0 25.0 21.8 17.3 19.4 20.0 27.6
Apr 12 21.0 22.8 22.7 18.1 20.3
2.2.2 Treasury Securities Market
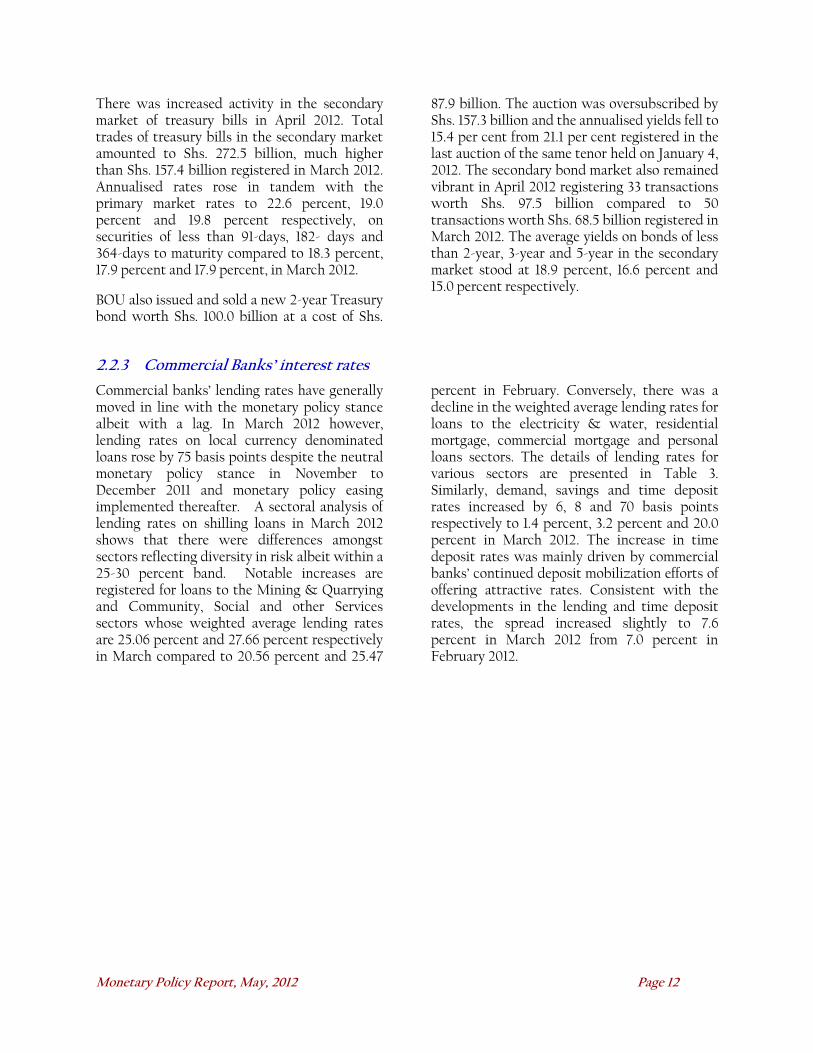
In order to align structural liquidity with the monetary policy stance for the month, BOU conducted two Treasury bill auctions worth Shs.120 billion at face value each. Both treasury bills were oversubscribed by Shs. 178 billion. Monthly average yields on the 91-day, 182-day and 364-day papers edged up to 18.1 percent, 19.9 percent and 20.3 percent from 17.3 percent, 19.1 percent and 19.4 percent in March 2012. Developments in Treasury bill yields are shown in Figure 5.
Figure 5: Treasury bill yields, April 2010 to April 2012.
0.00
5.00
10.00
15.00
20.00
25.00
30.00
An
nu
ali
se
d Y
ield
(P
erc
en
t)
91-day 182-day 364-day
Source: Bank of Uganda
Monetary Policy Report, May, 2012 Page 12
There was increased activity in the secondary market of treasury bills in April 2012. Total trades of treasury bills in the secondary market amounted to Shs. 272.5 billion, much higher than Shs. 157.4 billion registered in March 2012. Annualised rates rose in tandem with the primary market rates to 22.6 percent, 19.0 percent and 19.8 percent respectively, on securities of less than 91-days, 182- days and 364-days to maturity compared to 18.3 percent, 17.9 percent and 17.9 percent, in March 2012.
BOU also issued and sold a new 2-year Treasury bond worth Shs. 100.0 billion at a cost of Shs.
87.9 billion. The auction was oversubscribed by Shs. 157.3 billion and the annualised yields fell to 15.4 per cent from 21.1 per cent registered in the last auction of the same tenor held on January 4, 2012. The secondary bond market also remained vibrant in April 2012 registering 33 transactions worth Shs. 97.5 billion compared to 50 transactions worth Shs. 68.5 billion registered in March 2012. The average yields on bonds of less than 2-year, 3-year and 5-year in the secondary market stood at 18.9 percent, 16.6 percent and 15.0 percent respectively.
2.2.3 Commercial Banks’ interest rates
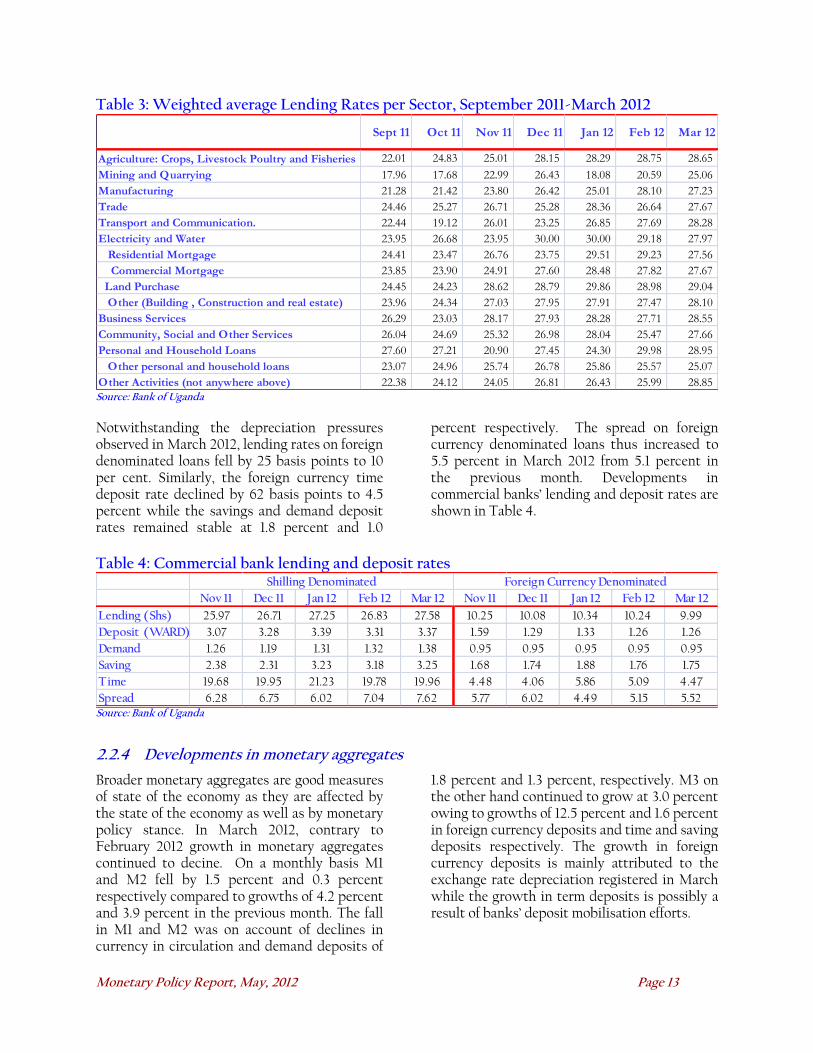
Commercial banks’ lending rates have generally moved in line with the monetary policy stance albeit with a lag. In March 2012 however, lending rates on local currency denominated loans rose by 75 basis points despite the neutral monetary policy stance in November to December 2011 and monetary policy easing implemented thereafter. A sectoral analysis of lending rates on shilling loans in March 2012 shows that there were differences amongst sectors reflecting diversity in risk albeit within a 25-30 percent band. Notable increases are registered for loans to the Mining & Quarrying and Community, Social and other Services sectors whose weighted average lending rates are 25.06 percent and 27.66 percent respectively in March compared to 20.56 percent and 25.47
percent in February. Conversely, there was a decline in the weighted average lending rates for loans to the electricity & water, residential mortgage, commercial mortgage and personal loans sectors. The details of lending rates for various sectors are presented in Table 3. Similarly, demand, savings and time deposit rates increased by 6, 8 and 70 basis points respectively to 1.4 percent, 3.2 percent and 20.0 percent in March 2012. The increase in time deposit rates was mainly driven by commercial banks’ continued deposit mobilization efforts of offering attractive rates. Consistent with the developments in the lending and time deposit rates, the spread increased slightly to 7.6 percent in March 2012 from 7.0 percent in February 2012.
Monetary Policy Report, May, 2012 Page 13
Table 3: Weighted average Lending Rates per Sector, September 2011-March 2012
Sept 11 Oct 11 Nov 11 Dec 11 Jan 12 Feb 12 Mar 12
Agriculture: Crops, Livestock Poultry and Fisheries 22.01 24.83 25.01 28.15 28.29 28.75 28.65
Mining and Quarrying 17.96 17.68 22.99 26.43 18.08 20.59 25.06
Manufacturing 21.28 21.42 23.80 26.42 25.01 28.10 27.23
Trade 24.46 25.27 26.71 25.28 28.36 26.64 27.67
Transport and Communication. 22.44 19.12 26.01 23.25 26.85 27.69 28.28
Electricity and Water 23.95 26.68 23.95 30.00 30.00 29.18 27.97
Residential Mortgage 24.41 23.47 26.76 23.75 29.51 29.23 27.56
Commercial Mortgage 23.85 23.90 24.91 27.60 28.48 27.82 27.67
Land Purchase 24.45 24.23 28.62 28.79 29.86 28.98 29.04
Other (Building , Construction and real estate) 23.96 24.34 27.03 27.95 27.91 27.47 28.10
Business Services 26.29 23.03 28.17 27.93 28.28 27.71 28.55
Community, Social and Other Services 26.04 24.69 25.32 26.98 28.04 25.47 27.66
Personal and Household Loans 27.60 27.21 20.90 27.45 24.30 29.98 28.95
Other personal and household loans 23.07 24.96 25.74 26.78 25.86 25.57 25.07
Other Activities (not anywhere above) 22.38 24.12 24.05 26.81 26.43 25.99 28.85 Source: Bank of Uganda
Notwithstanding the depreciation pressures observed in March 2012, lending rates on foreign denominated loans fell by 25 basis points to 10 per cent. Similarly, the foreign currency time deposit rate declined by 62 basis points to 4.5 percent while the savings and demand deposit rates remained stable at 1.8 percent and 1.0
percent respectively. The spread on foreign currency denominated loans thus increased to 5.5 percent in March 2012 from 5.1 percent in the previous month. Developments in commercial banks’ lending and deposit rates are shown in Table 4.
Table 4: Commercial bank lending and deposit rates
Nov 11 Dec 11 Jan 12 Feb 12 Mar 12 Nov 11 Dec 11 Jan 12 Feb 12 Mar 12
Lending (Shs) 25.97 26.71 27.25 26.83 27.58 10.25 10.08 10.34 10.24 9.99
Deposit (WARD) 3.07 3.28 3.39 3.31 3.37 1.59 1.29 1.33 1.26 1.26
Demand 1.26 1.19 1.31 1.32 1.38 0.95 0.95 0.95 0.95 0.95
Saving 2.38 2.31 3.23 3.18 3.25 1.68 1.74 1.88 1.76 1.75
Time 19.68 19.95 21.23 19.78 19.96 4.48 4.06 5.86 5.09 4.47
Spread 6.28 6.75 6.02 7.04 7.62 5.77 6.02 4.49 5.15 5.52
Shilling Denominated Foreign Currency Denominated
Source: Bank of Uganda
2.2.4 Developments in monetary aggregates
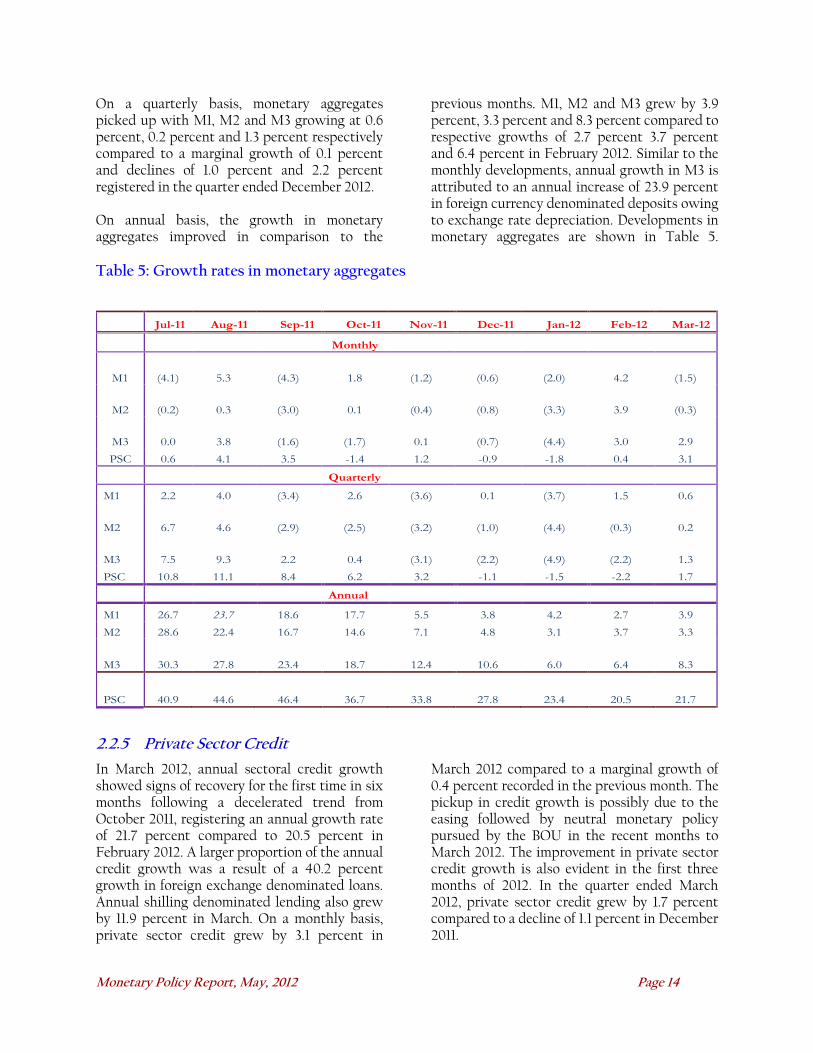
Broader monetary aggregates are good measures of state of the economy as they are affected by the state of the economy as well as by monetary policy stance. In March 2012, contrary to February 2012 growth in monetary aggregates continued to decine. On a monthly basis M1 and M2 fell by 1.5 percent and 0.3 percent respectively compared to growths of 4.2 percent and 3.9 percent in the previous month. The fall in M1 and M2 was on account of declines in currency in circulation and demand deposits of
1.8 percent and 1.3 percent, respectively. M3 on the other hand continued to grow at 3.0 percent owing to growths of 12.5 percent and 1.6 percent in foreign currency deposits and time and saving deposits respectively. The growth in foreign currency deposits is mainly attributed to the exchange rate depreciation registered in March while the growth in term deposits is possibly a result of banks’ deposit mobilisation efforts.
Monetary Policy Report, May, 2012 Page 14
On a quarterly basis, monetary aggregates picked up with M1, M2 and M3 growing at 0.6 percent, 0.2 percent and 1.3 percent respectively compared to a marginal growth of 0.1 percent and declines of 1.0 percent and 2.2 percent registered in the quarter ended December 2012. On annual basis, the growth in monetary aggregates improved in comparison to the
previous months. M1, M2 and M3 grew by 3.9 percent, 3.3 percent and 8.3 percent compared to respective growths of 2.7 percent 3.7 percent and 6.4 percent in February 2012. Similar to the monthly developments, annual growth in M3 is attributed to an annual increase of 23.9 percent in foreign currency denominated deposits owing to exchange rate depreciation. Developments in monetary aggregates are shown in Table 5.
Table 5: Growth rates in monetary aggregates
Jul-11 Aug-11 Sep-11 Oct-11 Nov-11 Dec-11 Jan-12 Feb-12 Mar-12
Monthly
M1 (4.1) 5.3 (4.3) 1.8 (1.2) (0.6) (2.0) 4.2 (1.5)
M2 (0.2) 0.3 (3.0) 0.1 (0.4) (0.8) (3.3) 3.9 (0.3)
M3 0.0 3.8 (1.6) (1.7) 0.1 (0.7) (4.4) 3.0 2.9
PSC 0.6 4.1 3.5 -1.4 1.2 -0.9 -1.8 0.4 3.1
Quarterly
M1 2.2 4.0 (3.4) 2.6 (3.6) 0.1 (3.7) 1.5 0.6
M2 6.7 4.6 (2.9) (2.5) (3.2) (1.0) (4.4) (0.3) 0.2
M3 7.5 9.3 2.2 0.4 (3.1) (2.2) (4.9) (2.2) 1.3
PSC 10.8 11.1 8.4 6.2 3.2 -1.1 -1.5 -2.2 1.7
Annual
M1 26.7 23.7 18.6 17.7 5.5 3.8 4.2 2.7 3.9
M2 28.6 22.4 16.7 14.6 7.1 4.8 3.1 3.7 3.3
M3 30.3 27.8 23.4 18.7 12.4 10.6 6.0 6.4 8.3
PSC 40.9 44.6 46.4 36.7 33.8 27.8 23.4 20.5 21.7
2.2.5 Private Sector Credit
In March 2012, annual sectoral credit growth showed signs of recovery for the first time in six months following a decelerated trend from October 2011, registering an annual growth rate of 21.7 percent compared to 20.5 percent in February 2012. A larger proportion of the annual credit growth was a result of a 40.2 percent growth in foreign exchange denominated loans. Annual shilling denominated lending also grew by 11.9 percent in March. On a monthly basis, private sector credit grew by 3.1 percent in
March 2012 compared to a marginal growth of 0.4 percent recorded in the previous month. The pickup in credit growth is possibly due to the easing followed by neutral monetary policy pursued by the BOU in the recent months to March 2012. The improvement in private sector credit growth is also evident in the first three months of 2012. In the quarter ended March 2012, private sector credit grew by 1.7 percent compared to a decline of 1.1 percent in December 2011.
Monetary Policy Report, May, 2012 Page 15
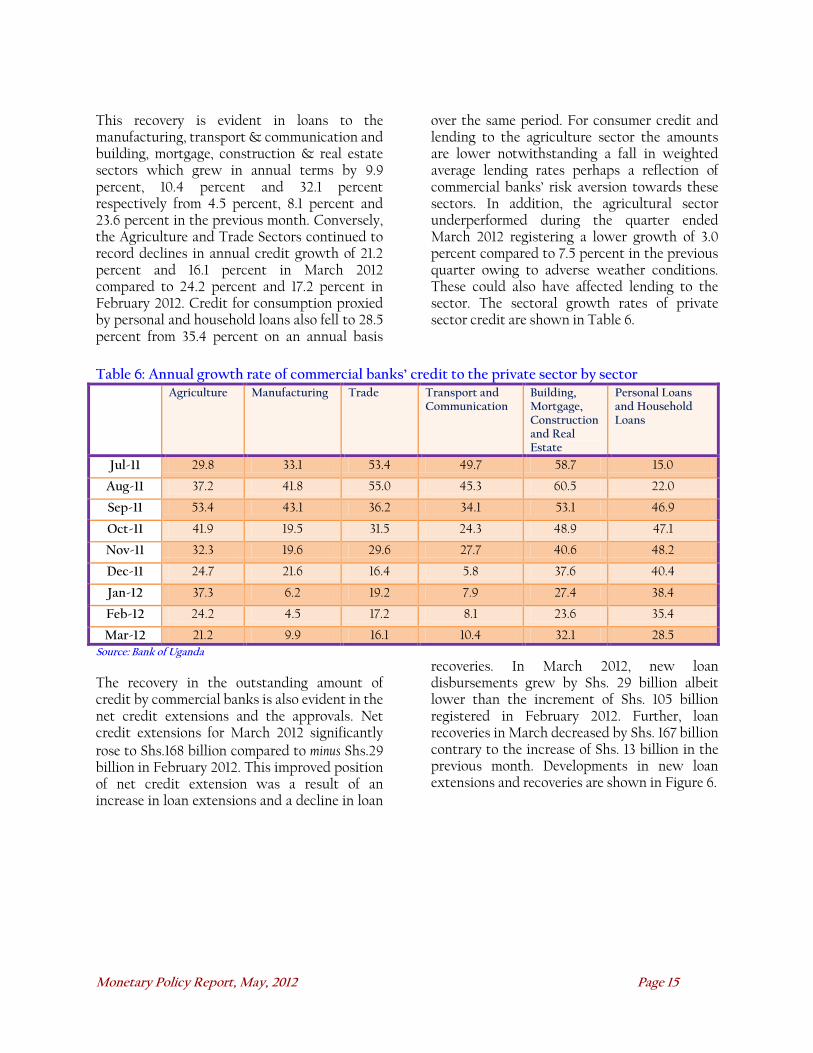
This recovery is evident in loans to the manufacturing, transport & communication and building, mortgage, construction & real estate sectors which grew in annual terms by 9.9 percent, 10.4 percent and 32.1 percent respectively from 4.5 percent, 8.1 percent and 23.6 percent in the previous month. Conversely, the Agriculture and Trade Sectors continued to record declines in annual credit growth of 21.2 percent and 16.1 percent in March 2012 compared to 24.2 percent and 17.2 percent in February 2012. Credit for consumption proxied by personal and household loans also fell to 28.5 percent from 35.4 percent on an annual basis
over the same period. For consumer credit and lending to the agriculture sector the amounts are lower notwithstanding a fall in weighted average lending rates perhaps a reflection of commercial banks’ risk aversion towards these sectors. In addition, the agricultural sector underperformed during the quarter ended March 2012 registering a lower growth of 3.0 percent compared to 7.5 percent in the previous quarter owing to adverse weather conditions. These could also have affected lending to the sector. The sectoral growth rates of private sector credit are shown in Table 6.
Table 6: Annual growth rate of commercial banks’ credit to the private sector by sector
Agriculture Manufacturing Trade Transport and Communication
Building, Mortgage, Construction and Real Estate
Personal Loans and Household Loans
Jul-11 29.8 33.1 53.4 49.7 58.7 15.0
Aug-11 37.2 41.8 55.0 45.3 60.5 22.0
Sep-11 53.4 43.1 36.2 34.1 53.1 46.9
Oct-11 41.9 19.5 31.5 24.3 48.9 47.1
Nov-11 32.3 19.6 29.6 27.7 40.6 48.2
Dec-11 24.7 21.6 16.4 5.8 37.6 40.4
Jan-12 37.3 6.2 19.2 7.9 27.4 38.4
Feb-12 24.2 4.5 17.2 8.1 23.6 35.4
Mar-12 21.2 9.9 16.1 10.4 32.1 28.5 Source: Bank of Uganda
The recovery in the outstanding amount of credit by commercial banks is also evident in the net credit extensions and the approvals. Net credit extensions for March 2012 significantly rose to Shs.168 billion compared to minus Shs.29 billion in February 2012. This improved position of net credit extension was a result of an increase in loan extensions and a decline in loan
recoveries. In March 2012, new loan disbursements grew by Shs. 29 billion albeit lower than the increment of Shs. 105 billion registered in February 2012. Further, loan recoveries in March decreased by Shs. 167 billion contrary to the increase of Shs. 13 billion in the previous month. Developments in new loan extensions and recoveries are shown in Figure 6.

Monetary Policy Report, May, 2012 Page 16
Figure 6: Credit Extensions and Recoveries
0
5
10
15
20
25
30
0
100
200
300
400
500
600
700
800
900
1000
Jul-1
1
Aug-1
1
Sep-
11
Oct-1
1
Nov-1
1
Dec-1
1
Jan-12
Feb-
12
Mar-
12
Lend
ing ra
tes (%
age)
Exten
sions
and R
ecov
eries
(billi
on sh
illing
s)
Extensions Recoveries Lending rate
Source: Bank of Uganda
Although the further improvement in net credit extensions augurs well with the motive behind the accommodative monetary policy stance by BOU towards the end of 2011, the lower amount of loan recoveries if sustained is a big downward risk to asset quality. A snapshot of some measures of asset quality indicates that non-
performing loans (NPLs) almost doubled in the quarter ended March 2012 relative to the previous quarter. Notwithstanding, the NPA (NPLs to Asset) ratio has slightly increased to 3.4 percent in the quarter ended March 2012 from 2.8 percent in the previous quarter. Details of NPLs are shown in Table 7.
Table 7: Non-performing loans by sector (Billions of shillings)
SECTOR June 11 September 11 December 11 March 12
Agriculture 7.1 9.8 14.4 22.3
Mining and Quarrying 5.0 5.1 3.7 5.6
Manufacturing 1.7 4.0 5.1 6.8
Trade and Commerce 14.9 16.8 31.3 79.0
Transport and Communication 3.5 5.1 4.6 7.0
Building, Construction and Real Estate 17.0 25.1 28.0 44.9
Electricity and Water 0.2 0.0 0.2 0.2
Business Services 3.2 6.4 8.8 11.7
Community, Social & Other Services 2.7 2.8 2.6 2.6
Personal Loan and Household Loans 15.7 17.9 19.3 21.8
Others Activities (Not Anywhere Above) 33.2 34.6 36.2 39.1
Staff Loans 0.6 0.4 0.5 0.6
NPA Ratio (%) 1.6 1.8 2.2 3.4 Source: Bank of Uganda
In terms of the numbers of loan applications received by commercial banks and loan approvals, which are proxies for loan demand and supply, respectively, number of loan applications increased by 282, while loan approvals increased by 386 in March 2012 compared to respective declines of 2280 and 1760 in February. While the highest recovery of
222 new loan applications is reflected in the trade sector, the personal loans and household sector registered a significant fall of 483. Similarly, for credit supply, the trade sector registered the highest new loan approvals of 145 contrary to the fall of 248 in new loan approvals in the personal loans and household loans sector. In volume terms, the amount of loan
Monetary Policy Report, May, 2012 Page 17
applications increased by Shs. 105 billion relative to the a decline of Shs. 128 billion in the preceding month, while the amount of loan approvals fell further by Shs. 24 billion relative to the preceding month’s increase of 153 billion. The highest rise in the volume of loan
applications was in the electricity & water and, building, construction & real estate sectors while the manufacturing and trade sectors registered the biggest fall in the volume of loan approvals.
2.3 Growth, Output and Aggregate Demand
2.3.1 Aggregate demand
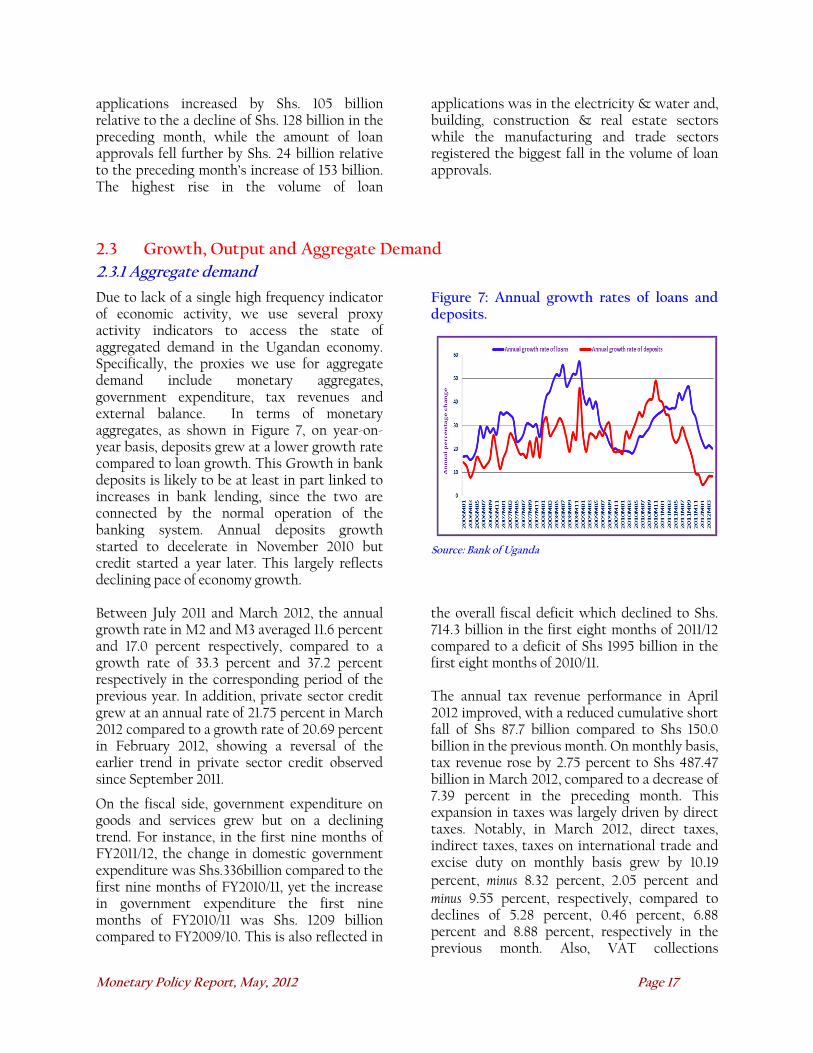
Due to lack of a single high frequency indicator of economic activity, we use several proxy activity indicators to access the state of aggregated demand in the Ugandan economy. Specifically, the proxies we use for aggregate demand include monetary aggregates, government expenditure, tax revenues and external balance. In terms of monetary aggregates, as shown in Figure 7, on year-on-year basis, deposits grew at a lower growth rate compared to loan growth. This Growth in bank deposits is likely to be at least in part linked to increases in bank lending, since the two are connected by the normal operation of the banking system. Annual deposits growth started to decelerate in November 2010 but credit started a year later. This largely reflects declining pace of economy growth.
Figure 7: Annual growth rates of loans and deposits.
Source: Bank of Uganda
Between July 2011 and March 2012, the annual growth rate in M2 and M3 averaged 11.6 percent and 17.0 percent respectively, compared to a growth rate of 33.3 percent and 37.2 percent respectively in the corresponding period of the previous year. In addition, private sector credit grew at an annual rate of 21.75 percent in March 2012 compared to a growth rate of 20.69 percent in February 2012, showing a reversal of the earlier trend in private sector credit observed since September 2011.
On the fiscal side, government expenditure on goods and services grew but on a declining trend. For instance, in the first nine months of FY2011/12, the change in domestic government expenditure was Shs.336billion compared to the first nine months of FY2010/11, yet the increase in government expenditure the first nine months of FY2010/11 was Shs. 1209 billion compared to FY2009/10. This is also reflected in
the overall fiscal deficit which declined to Shs. 714.3 billion in the first eight months of 2011/12 compared to a deficit of Shs 1995 billion in the first eight months of 2010/11. The annual tax revenue performance in April 2012 improved, with a reduced cumulative short fall of Shs 87.7 billion compared to Shs 150.0 billion in the previous month. On monthly basis, tax revenue rose by 2.75 percent to Shs 487.47 billion in March 2012, compared to a decrease of 7.39 percent in the preceding month. This expansion in taxes was largely driven by direct taxes. Notably, in March 2012, direct taxes, indirect taxes, taxes on international trade and excise duty on monthly basis grew by 10.19 percent, minus 8.32 percent, 2.05 percent and minus 9.55 percent, respectively, compared to declines of 5.28 percent, 0.46 percent, 6.88 percent and 8.88 percent, respectively in the previous month. Also, VAT collections

Monetary Policy Report, May, 2012 Page 18
decelerated by 7.82 percent on monthly basis in March 2012, compared to a growth rate of 3.46 percent in the previous month. However, tax revenues, on average grew by 19.3 percent on year-on-year basis in the first nine months of 2011/12 compared to 21 percent in the previous fiscal year yet average inflation rates
were 25.3 percent and 3.6 percent, respectively, in the same period. This shows that some of the increases in tax revenues were just inflation tax increases.
3.1.3 External Demand
Imports and exports both increased m-o-m (4.2% and 4.23% respectively), however, y-o-y imports still declined by 13.8%. Real growth in imports remains virtually flat. Current account deficit continues to be significant implying a net outflow of demand and income. Furthermore, trade balance for the first quarter of 2012 indicates that trade balance worsened by US$24 million. In the first nine months of FY 2011/12 the trade deficit averaged US$ 622 million compared to US$600 in the same period of the previous financial year. Average month-on-month growth for non-oil private sector imports averaged about 1.2 percent in the first nine months of 2011/12 compared to 3.2 percent in the first nine months of the previous financial year. The value of exports on the other hand grew on month-on-month average of 0.5 percent in the first nine months of 2011/12 compared to an average month-on-month growth of 3.2 percent in the same period of previous financial year. This reflects the impact of the global developments, especially from Euro area, which constitutes about 22 percent of Uganda’s exports. On a monthly basis, coffee export earnings which contribute 17 percent to total export earnings, decreased by 16.5 percent in March 2012 after an increase of 7.3 percent in February 2012. This decline was due to a 17 percent decline in coffee volumes as February and March are off harvest seasons for coffee.
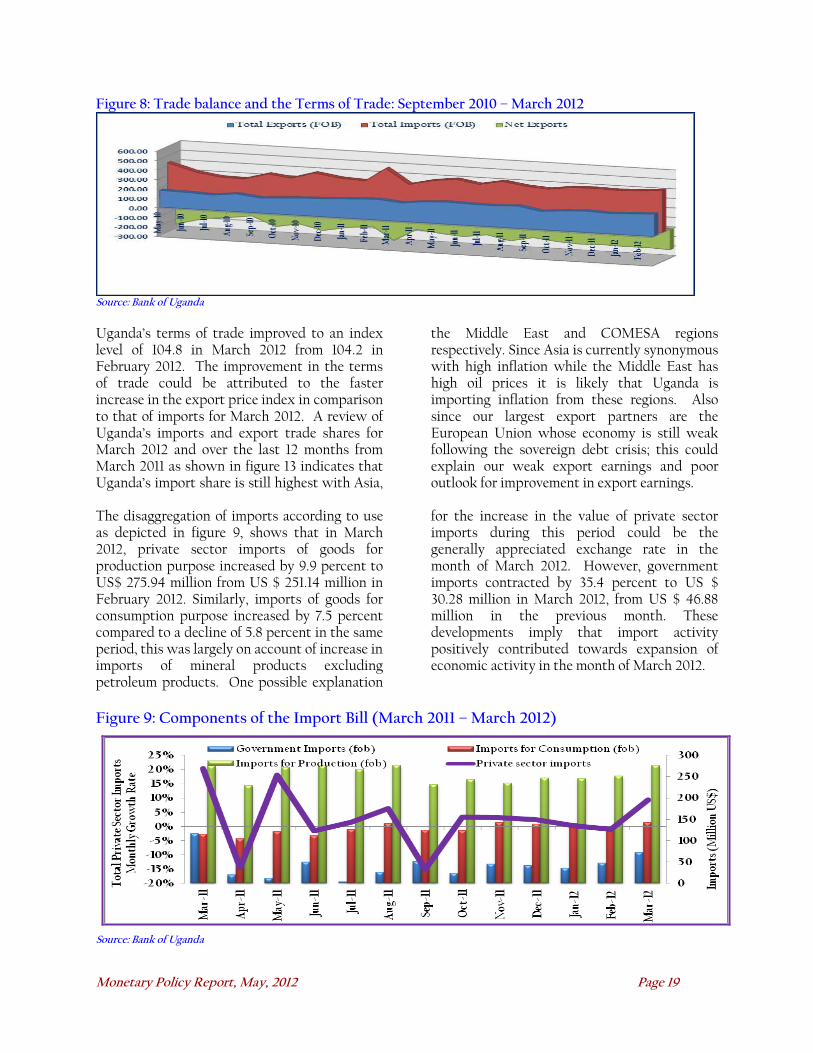
Also, non-coffee export earnings, which contribute 68 percent to the country’s total export earnings, increased by 8 percent month-on-month in March 2012 lower than the increase of 9.2 percent in February 2012 and also increased 11.5 percent on an annual basis. Uganda’s strong export growth in the recent past has in part supported the exchange rate. This export growth was a result of favourable international coffee prices but these have started to decline in expectation of a large harvest in Brazil. Going forward, export growth is expected to remain subdued reflecting a combination of weak external demand, Sudan conflict and declining coffee prices and this could cause the shilling to weaken further. Coffee unit value averaged 2.5 in July11-Mar12 compared to 2 in the same period in the previous FY. Because of a decline in the rate of increase in export earnings and an increase in the import bill during March 2012, there was an increase of 4.2 percent in the trade deficit to US$ 213.1 million from US$ 204.6 million in February 2012. This could have influenced for the depreciation of the Uganda shilling observed in March 2012. Figure 8 below shows the performance of exports and imports over the last 12 months.
Monetary Policy Report, May, 2012 Page 19
Figure 8: Trade balance and the Terms of Trade: September 2010 – March 2012
Source: Bank of Uganda
Uganda’s terms of trade improved to an index level of 104.8 in March 2012 from 104.2 in February 2012. The improvement in the terms of trade could be attributed to the faster increase in the export price index in comparison to that of imports for March 2012. A review of Uganda’s imports and export trade shares for March 2012 and over the last 12 months from March 2011 as shown in figure 13 indicates that Uganda’s import share is still highest with Asia,
the Middle East and COMESA regions respectively. Since Asia is currently synonymous with high inflation while the Middle East has high oil prices it is likely that Uganda is importing inflation from these regions. Also since our largest export partners are the European Union whose economy is still weak following the sovereign debt crisis; this could explain our weak export earnings and poor outlook for improvement in export earnings.
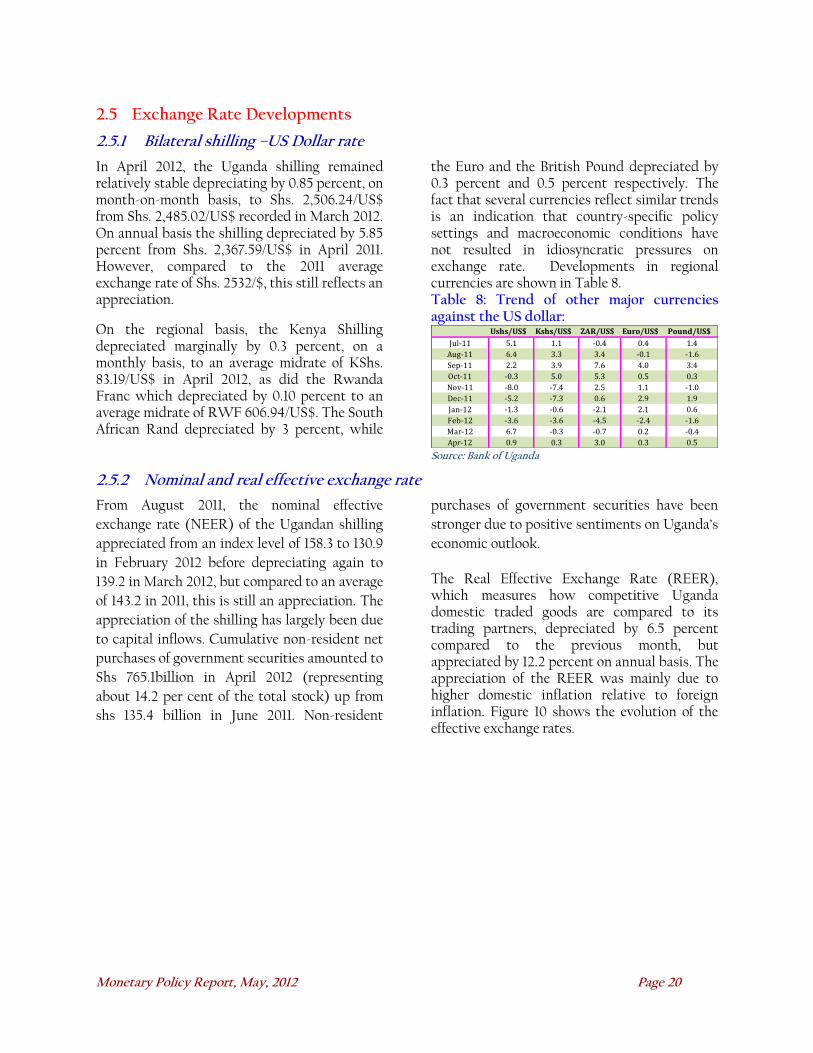
The disaggregation of imports according to use as depicted in figure 9, shows that in March 2012, private sector imports of goods for production purpose increased by 9.9 percent to US$ 275.94 million from US $ 251.14 million in February 2012. Similarly, imports of goods for consumption purpose increased by 7.5 percent compared to a decline of 5.8 percent in the same period, this was largely on account of increase in imports of mineral products excluding petroleum products. One possible explanation
for the increase in the value of private sector imports during this period could be the generally appreciated exchange rate in the month of March 2012. However, government imports contracted by 35.4 percent to US $ 30.28 million in March 2012, from US $ 46.88 million in the previous month. These developments imply that import activity positively contributed towards expansion of economic activity in the month of March 2012.
Figure 9: Components of the Import Bill (March 2011 – March 2012)
Source: Bank of Uganda
Monetary Policy Report, May, 2012 Page 20
2.5 Exchange Rate Developments
2.5.1 Bilateral shilling –US Dollar rate
In April 2012, the Uganda shilling remained relatively stable depreciating by 0.85 percent, on month-on-month basis, to Shs. 2,506.24/US$ from Shs. 2,485.02/US$ recorded in March 2012. On annual basis the shilling depreciated by 5.85 percent from Shs. 2,367.59/US$ in April 2011. However, compared to the 2011 average exchange rate of Shs. 2532/$, this still reflects an appreciation.
On the regional basis, the Kenya Shilling depreciated marginally by 0.3 percent, on a monthly basis, to an average midrate of KShs. 83.19/US$ in April 2012, as did the Rwanda Franc which depreciated by 0.10 percent to an average midrate of RWF 606.94/US$. The South African Rand depreciated by 3 percent, while
the Euro and the British Pound depreciated by 0.3 percent and 0.5 percent respectively. The fact that several currencies reflect similar trends is an indication that country-specific policy settings and macroeconomic conditions have not resulted in idiosyncratic pressures on exchange rate. Developments in regional currencies are shown in Table 8. Table 8: Trend of other major currencies against the US dollar:
Ushs/US$ Kshs/US$ ZAR/US$ Euro/US$ Pound/US$
Jul-11 5.1 1.1 -0.4 0.4 1.4
Aug-11 6.4 3.3 3.4 -0.1 -1.6
Sep-11 2.2 3.9 7.6 4.0 3.4
Oct-11 -0.3 5.0 5.3 0.5 0.3
Nov-11 -8.0 -7.4 2.5 1.1 -1.0
Dec-11 -5.2 -7.3 0.6 2.9 1.9
Jan-12 -1.3 -0.6 -2.1 2.1 0.6
Feb-12 -3.6 -3.6 -4.5 -2.4 -1.6
Mar-12 6.7 -0.3 -0.7 0.2 -0.4
Apr-12 0.9 0.3 3.0 0.3 0.5
Source: Bank of Uganda
2.5.2 Nominal and real effective exchange rate
From August 2011, the nominal effective
exchange rate (NEER) of the Ugandan shilling
appreciated from an index level of 158.3 to 130.9
in February 2012 before depreciating again to
139.2 in March 2012, but compared to an average
of 143.2 in 2011, this is still an appreciation. The
appreciation of the shilling has largely been due
to capital inflows. Cumulative non-resident net
purchases of government securities amounted to
Shs 765.1billion in April 2012 (representing
about 14.2 per cent of the total stock) up from
shs 135.4 billion in June 2011. Non-resident
purchases of government securities have been
stronger due to positive sentiments on Uganda’s
economic outlook.
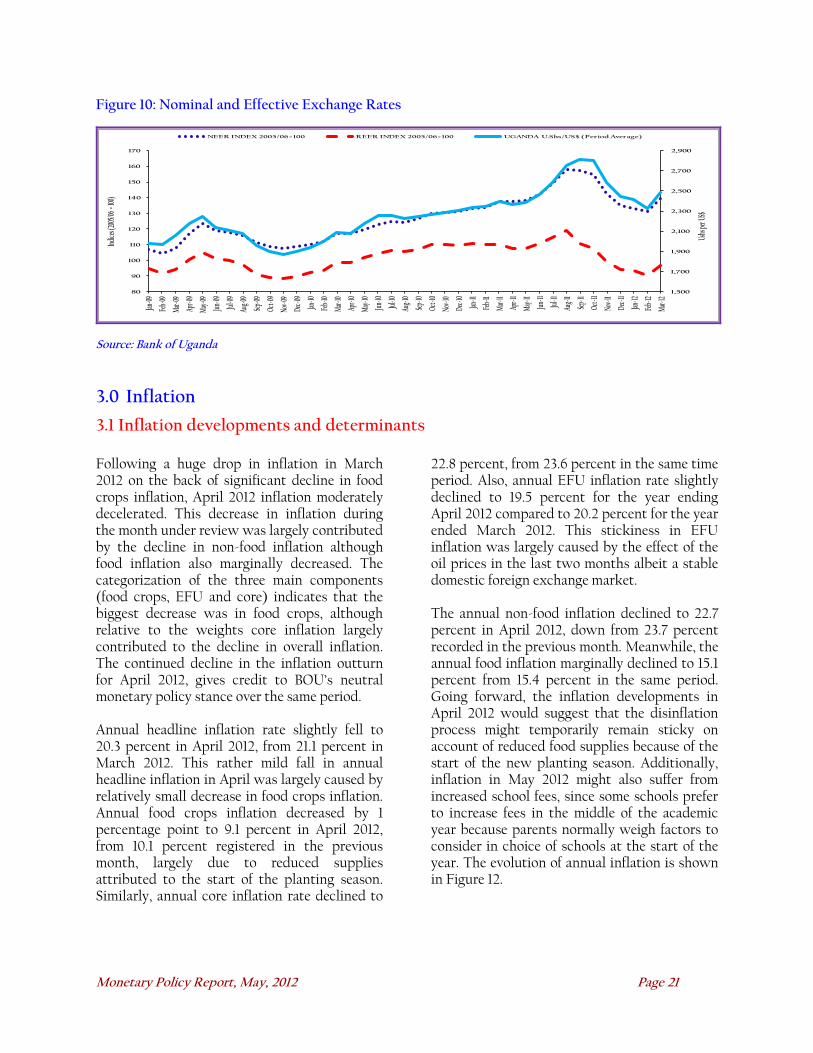
The Real Effective Exchange Rate (REER), which measures how competitive Uganda domestic traded goods are compared to its trading partners, depreciated by 6.5 percent compared to the previous month, but appreciated by 12.2 percent on annual basis. The appreciation of the REER was mainly due to higher domestic inflation relative to foreign inflation. Figure 10 shows the evolution of the effective exchange rates.
Monetary Policy Report, May, 2012 Page 21
Figure 10: Nominal and Effective Exchange Rates
1,500
1,700
1,900
2,100
2,300
2,500
2,700
2,900
80
90
100
110
120
130
140
150
160
170Jan
-09
Feb-
09
Mar-
09
Apr-0
9
May
-09
Jun-
09
Jul-0
9
Aug-
09
Sep-
09
Oct-0
9
Nov-
09
Dec-
09
Jan-10
Feb-
10
Mar-
10
Apr-1
0
May
-10
Jun-
10
Jul-1
0
Aug-
10
Sep-
10
Oct-1
0
Nov-
10
Dec-
10
Jan-11
Feb-
11
Mar-
11
Apr-1
1
May
-11
Jun-
11
Jul-1
1
Aug-
11
Sep-
11
Oct-1
1
Nov-
11
Dec-
11
Jan-12
Feb-
12
Mar-
12
Ushs
per U
S$
Indic
es (2
005/0
6 = 10
0)
NEER INDEX 2005/06=100 REER INDEX 2005/06=100 UGANDA U.Shs/US$ (Period Average)
Source: Bank of Uganda
3.0 Inflation
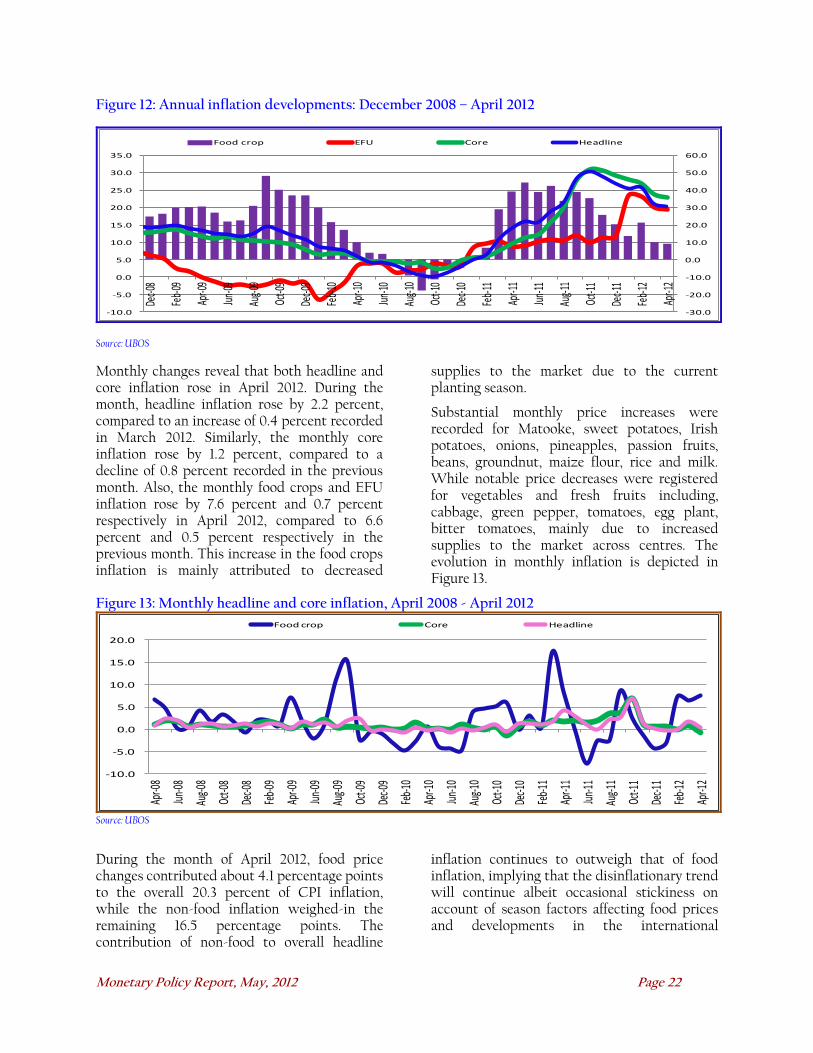
3.1 Inflation developments and determinants Following a huge drop in inflation in March 2012 on the back of significant decline in food crops inflation, April 2012 inflation moderately decelerated. This decrease in inflation during the month under review was largely contributed by the decline in non-food inflation although food inflation also marginally decreased. The categorization of the three main components (food crops, EFU and core) indicates that the biggest decrease was in food crops, although relative to the weights core inflation largely contributed to the decline in overall inflation. The continued decline in the inflation outturn for April 2012, gives credit to BOU’s neutral monetary policy stance over the same period. Annual headline inflation rate slightly fell to 20.3 percent in April 2012, from 21.1 percent in March 2012. This rather mild fall in annual headline inflation in April was largely caused by relatively small decrease in food crops inflation. Annual food crops inflation decreased by 1 percentage point to 9.1 percent in April 2012, from 10.1 percent registered in the previous month, largely due to reduced supplies attributed to the start of the planting season. Similarly, annual core inflation rate declined to
22.8 percent, from 23.6 percent in the same time period. Also, annual EFU inflation rate slightly declined to 19.5 percent for the year ending April 2012 compared to 20.2 percent for the year ended March 2012. This stickiness in EFU inflation was largely caused by the effect of the oil prices in the last two months albeit a stable domestic foreign exchange market. The annual non-food inflation declined to 22.7 percent in April 2012, down from 23.7 percent recorded in the previous month. Meanwhile, the annual food inflation marginally declined to 15.1 percent from 15.4 percent in the same period. Going forward, the inflation developments in April 2012 would suggest that the disinflation process might temporarily remain sticky on account of reduced food supplies because of the start of the new planting season. Additionally, inflation in May 2012 might also suffer from increased school fees, since some schools prefer to increase fees in the middle of the academic year because parents normally weigh factors to consider in choice of schools at the start of the year. The evolution of annual inflation is shown in Figure 12.
Monetary Policy Report, May, 2012 Page 22
Figure 12: Annual inflation developments: December 2008 – April 2012
-30.0
-20.0
-10.0
0.0
10.0
20.0
30.0
40.0
50.0
60.0
-10.0
-5.0
0.0
5.0
10.0
15.0
20.0
25.0
30.0
35.0De
c-08
Feb-
09
Apr-0
9
Jun-
09
Aug-0
9
Oct-0
9
Dec-0
9
Feb-
10
Apr-1
0
Jun-
10
Aug-1
0
Oct-1
0
Dec-1
0
Feb-
11
Apr-1
1
Jun-
11
Aug-1
1
Oct-1
1
Dec-1
1
Feb-
12
Apr-1
2
Food crop EFU Core Headline
Source: UBOS
Monthly changes reveal that both headline and core inflation rose in April 2012. During the month, headline inflation rose by 2.2 percent, compared to an increase of 0.4 percent recorded in March 2012. Similarly, the monthly core inflation rose by 1.2 percent, compared to a decline of 0.8 percent recorded in the previous month. Also, the monthly food crops and EFU inflation rose by 7.6 percent and 0.7 percent respectively in April 2012, compared to 6.6 percent and 0.5 percent respectively in the previous month. This increase in the food crops inflation is mainly attributed to decreased
supplies to the market due to the current planting season.
Substantial monthly price increases were recorded for Matooke, sweet potatoes, Irish potatoes, onions, pineapples, passion fruits, beans, groundnut, maize flour, rice and milk. While notable price decreases were registered for vegetables and fresh fruits including, cabbage, green pepper, tomatoes, egg plant, bitter tomatoes, mainly due to increased supplies to the market across centres. The evolution in monthly inflation is depicted in Figure 13.
Figure 13: Monthly headline and core inflation, April 2008 - April 2012
-10.0
-5.0
0.0
5.0
10.0
15.0
20.0
Apr-0
8
Jun-
08
Aug-0
8
Oct-0
8
Dec-0
8
Feb-
09
Apr-0
9
Jun-
09
Aug-0
9
Oct-0
9
Dec-0
9
Feb-
10
Apr-1
0
Jun-
10
Aug-1
0
Oct-1
0
Dec-1
0
Feb-
11
Apr-1
1
Jun-
11
Aug-1
1
Oct-1
1
Dec-1
1
Feb-
12
Apr-1
2
Food crop Core Headline
Source: UBOS
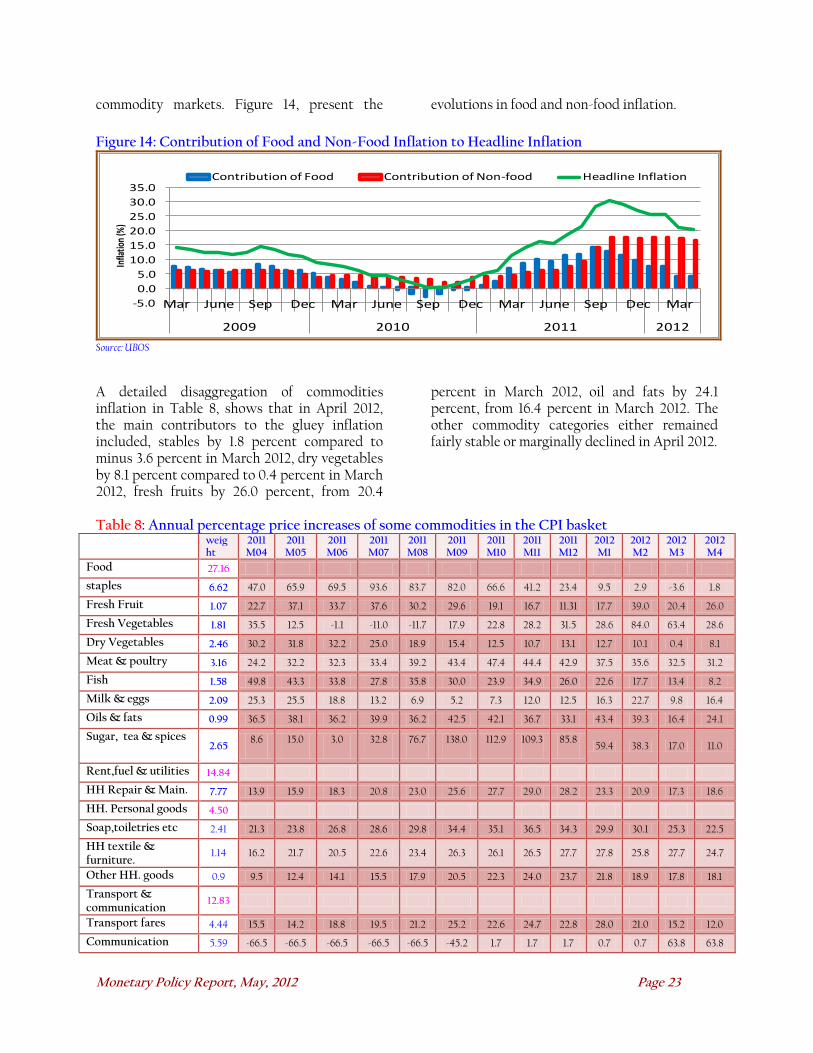
During the month of April 2012, food price changes contributed about 4.1 percentage points to the overall 20.3 percent of CPI inflation, while the non-food inflation weighed-in the remaining 16.5 percentage points. The contribution of non-food to overall headline
inflation continues to outweigh that of food inflation, implying that the disinflationary trend will continue albeit occasional stickiness on account of season factors affecting food prices and developments in the international
Monetary Policy Report, May, 2012 Page 23
commodity markets. Figure 14, present the evolutions in food and non-food inflation.
Figure 14: Contribution of Food and Non-Food Inflation to Headline Inflation
-5.0
0.0
5.0
10.0
15.0
20.0
25.0
30.0
35.0
Mar June Sep Dec Mar June Sep Dec Mar June Sep Dec Mar
2009 2010 2011 2012
Infla
tion
(%)
Contribution of Food Contribution of Non-food Headline Inflation
Source: UBOS
A detailed disaggregation of commodities inflation in Table 8, shows that in April 2012, the main contributors to the gluey inflation included, stables by 1.8 percent compared to minus 3.6 percent in March 2012, dry vegetables by 8.1 percent compared to 0.4 percent in March 2012, fresh fruits by 26.0 percent, from 20.4
percent in March 2012, oil and fats by 24.1 percent, from 16.4 percent in March 2012. The other commodity categories either remained fairly stable or marginally declined in April 2012.
Table 8: Annual percentage price increases of some commodities in the CPI basket
weight
2011M04
2011M05
2011 M06
2011 M07
2011 M08
2011M09
2011M10
2011M11
2011M12
2012M1
2012 M2
2012M3
2012 M4
Food 27.16
staples 6.62 47.0 65.9 69.5 93.6 83.7 82.0 66.6 41.2 23.4 9.5 2.9 -3.6 1.8
Fresh Fruit 1.07 22.7 37.1 33.7 37.6 30.2 29.6 19.1 16.7 11.31 17.7 39.0 20.4 26.0
Fresh Vegetables 1.81 35.5 12.5 -1.1 -11.0 -11.7 17.9 22.8 28.2 31.5 28.6 84.0 63.4 28.6
Dry Vegetables 2.46 30.2 31.8 32.2 25.0 18.9 15.4 12.5 10.7 13.1 12.7 10.1 0.4 8.1
Meat & poultry 3.16 24.2 32.2 32.3 33.4 39.2 43.4 47.4 44.4 42.9 37.5 35.6 32.5 31.2
Fish 1.58 49.8 43.3 33.8 27.8 35.8 30.0 23.9 34.9 26.0 22.6 17.7 13.4 8.2
Milk & eggs 2.09 25.3 25.5 18.8 13.2 6.9 5.2 7.3 12.0 12.5 16.3 22.7 9.8 16.4
Oils & fats 0.99 36.5 38.1 36.2 39.9 36.2 42.5 42.1 36.7 33.1 43.4 39.3 16.4 24.1
Sugar, tea & spices 2.65
8.6 15.0 3.0 32.8 76.7 138.0 112.9 109.3 85.8 59.4 38.3 17.0 11.0
Rent,fuel & utilities 14.84
HH Repair & Main. 7.77 13.9 15.9 18.3 20.8 23.0 25.6 27.7 29.0 28.2 23.3 20.9 17.3 18.6
HH. Personal goods 4.50
Soap,toiletries etc 2.41 21.3 23.8 26.8 28.6 29.8 34.4 35.1 36.5 34.3 29.9 30.1 25.3 22.5
HH textile & furniture.
1.14 16.2 21.7 20.5 22.6 23.4 26.3 26.1 26.5 27.7 27.8 25.8 27.7 24.7
Other HH. goods 0.9 9.5 12.4 14.1 15.5 17.9 20.5 22.3 24.0 23.7 21.8 18.9 17.8 18.1
Transport & communication
12.83
Transport fares 4.44 15.5 14.2 18.8 19.5 21.2 25.2 22.6 24.7 22.8 28.0 21.0 15.2 12.0
Communication 5.59 -66.5 -66.5 -66.5 -66.5 -66.5 -45.2 1.7 1.7 1.7 0.7 0.7 63.8 63.8
Monetary Policy Report, May, 2012 Page 24
weight
2011M04
2011M05
2011 M06
2011 M07
2011 M08
2011M09
2011M10
2011M11
2011M12
2012M1
2012 M2
2012M3
2012 M4
Other transport & communication costs
2.79 16.2 18.8
20.5
21.8 21.4 23.0 20.5 26.1 27.8 26.2 22.0 19.9 16.5
Health Entertainment & others
16.83
Meals in Restaurants
8.28 17.5 19.2 15.8 15.6 17.9 22.1 21.6 22.7 21.3 21.8 21.1 19.6 19.7
Source: UBOS
3.2 Inflation forecasts Inflationary pressures continued to abate in April 2012 to 20.3 percent and 22.8 percent for headline inflation and core inflation respectively. This is within the range of the previous forecast of between 19-22 percent for headline and 20-24 percent for core inflation. Inflation developments were mainly due to a decline in non food prices coupled with a marginal decline in food prices.
Although the downward trend in inflation is expected to persist in the next few months, the pace might be slower than projected in previous months. There are risks to inflation that could lead to a deviation of the actual inflation from the forecasts. The main risk is the upward surge in food prices observed since February 2012 mainly on account of the uncertainty in weather pattern. It is expected that food prices could rise further in between May and July 2012. A combination of weak external demand due to
the global economic slowdown and declining international coffee prices are pointers to a further weakening of the current account which could result in the depreciation of the exchange rate. Developments in oil prices remain a big factor in the direction of inflation and that is why the envisaged supply shocks which could cause a surge in oil prices is big risk to attaining the forecast inflation.
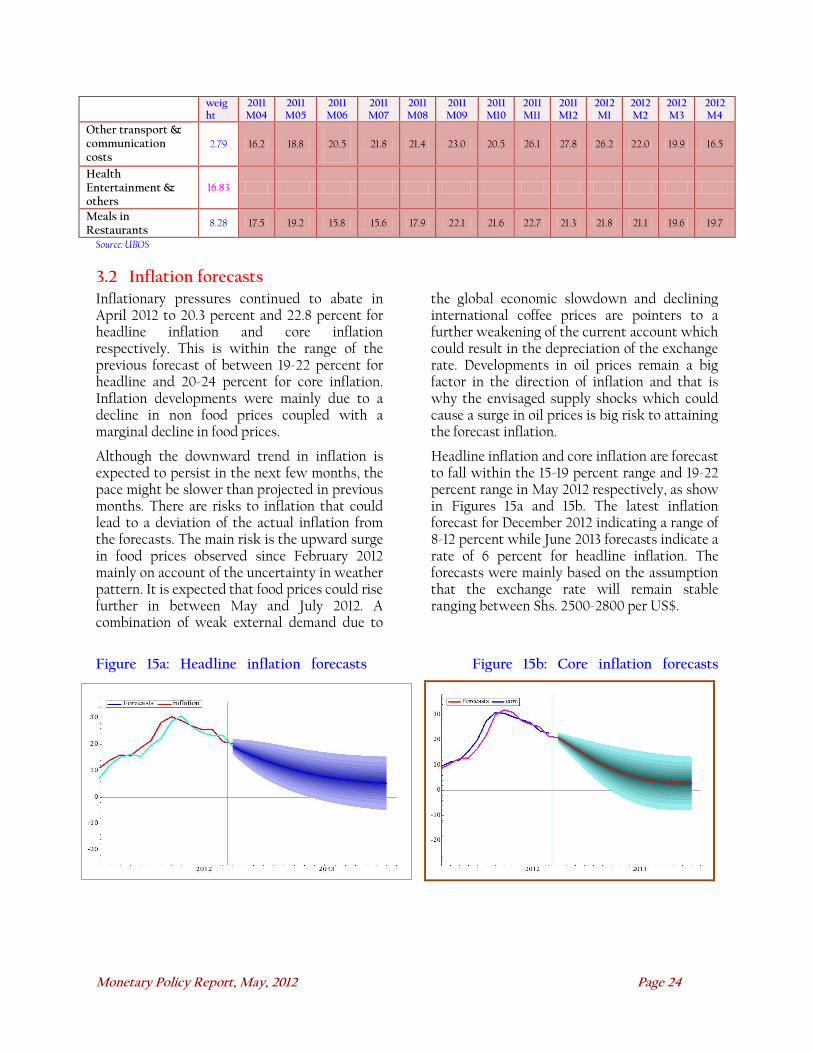
Headline inflation and core inflation are forecast to fall within the 15-19 percent range and 19-22 percent range in May 2012 respectively, as show in Figures 15a and 15b. The latest inflation forecast for December 2012 indicating a range of 8-12 percent while June 2013 forecasts indicate a rate of 6 percent for headline inflation. The forecasts were mainly based on the assumption that the exchange rate will remain stable ranging between Shs. 2500-2800 per US$.
Figure 15a: Headline inflation forecasts Figure 15b: Core inflation forecasts
Monetary Policy Report, May, 2012 Page 25
4. Policy Implications and Policy framework for May 2012. The global economic outlook looks brighter than it did a few months ago. The pointers being; the continuation of America’s fragile recovery, Japan being on track for a 2 percent growth in 2012 following a disastrous 2011 in part due to a boost from reconstruction spending and, the ECB’s interventions in the banking system in December and February that have pulled the Euro back from the brink. The IMF’s WEO published in April 2012 nudges up expected global growth in 2012 to 3.5 percent from 3.3 percent in January 2012. Notwithstanding the improved global economic performance, concerns about a spill over from a worsening of the European debt crisis and slowing down of economic activities in key emerging markets are putting a damper on consumer and business confidence.
Economic growth in emerging economies is moderating largely driven by China’s economic growth, which has eased; China’s performance is of critical importance to emerging markets. Oil prices developments remain a big factor for global growth and inflation. The oil prices eased in April after positive outcomes from the talks about Iran’s nuclear ambitions. Despite the ease in oil prices in April, the IMF has warned of a 20-30 percent oil price spike if Iranian exports are disrupted, either through the knock-on effect of financial sanctions or the possibility that Iran imposes a blockade of exports through the Straits of Hormuz, through which about 40 percent of global oil exports are shipped.
On the domestic scene, inflation outturn in April was within the forecast range. In particular, in the first quarter of 2012, Uganda was challenged by lower-than-expected domestic economic growth and high but softening of inflationary pressures, which have been accompanied by regular spikes in uncertainty and risk aversion arising out of Europe’s financial and debt travails. Although inflation remains high, well above the target level, the inflation outlook has improved and expected to be in single digit by the end of 2012 and around the target by mid-2013. The major drivers of inflation are food prices, which have
moderated recently, exchange rate depreciation and increases in the fuel prices, which reflects a combination of international oil prices and the exchange rate depreciation. Oil price levels remain high and risks to prices remain to the upside for the medium term. Both remain highly sensitive to global growth developments and, as a result oil prices and risk perceptions, will likely exhibit considerable volatility in the months ahead. The level of output remains low and growth itself below estimates of potential growth, which means that the demand pressures are muted.
Although the pace of consumer price increase has continued to slowdown, the disinflation pace has weakened. The month on month headline inflation accelerated largely driven by higher food crop inflation and EFU inflation originating from the increase in oil prices and exchange rate depreciation. In addition, non-food inflation remains sticky downwards. These inflation developments call for a cautious monetary policy as signs of renewed inflationary pressures and exchange rate depreciation have remained elevated.
In particular, the exchange rate remained relatively stable during in April 2011 but faced occasional depreciation pressures which fueled inflation. While further monetary policy tightening may lead to rapid appreciation which may subdue aggregate demand, a combination of policy intervention in emerging markets and high risks in developed markets means volatility in the shilling looks set to continue. In light of the high exchange rate pass through to domestic prices therefore, monetary policy should remain neutral. In line with the implications of the global and domestic economy developments, BOU will maintain the CBR at 21 percent in May 2012. The band on the CBR will remain at plus/minus 3 percentage points and the margin on the rediscount rate will be maintained at 4 percentage points on the CBR. Consequently, the rediscount rate and the Bank rate remain at 25 percent and 26 percent, respectively.
Central to the BoU’s approach is the objective of price stability implemented within a flexible
Monetary Policy Report, May, 2012 Page 26
inflation-targeting framework focused over the medium term to minimise the effect of temporary shocks on inflation and economic activity. Therefore, this policy-setting has taken into account the moderate economic recovery and the continued prevalence of underutilization of production capacity. Going forward, the balance of risks to domestic output conditions leans toward a much slower pace of economic activity given strong and
persistent global headwinds. The on-going conflict between South and North Sudan is an additional factor that could affect growth through a combination of weak exports and knock on effects arising from the conflict. Cost–push pressures emanating from international oil prices and the impact of changes in global risk perceptions on the exchange rate remain the central unknowns for monetary policy going forward, as they have been for the last couple of months.
Monetary Policy Report, May, 2012 Page 27
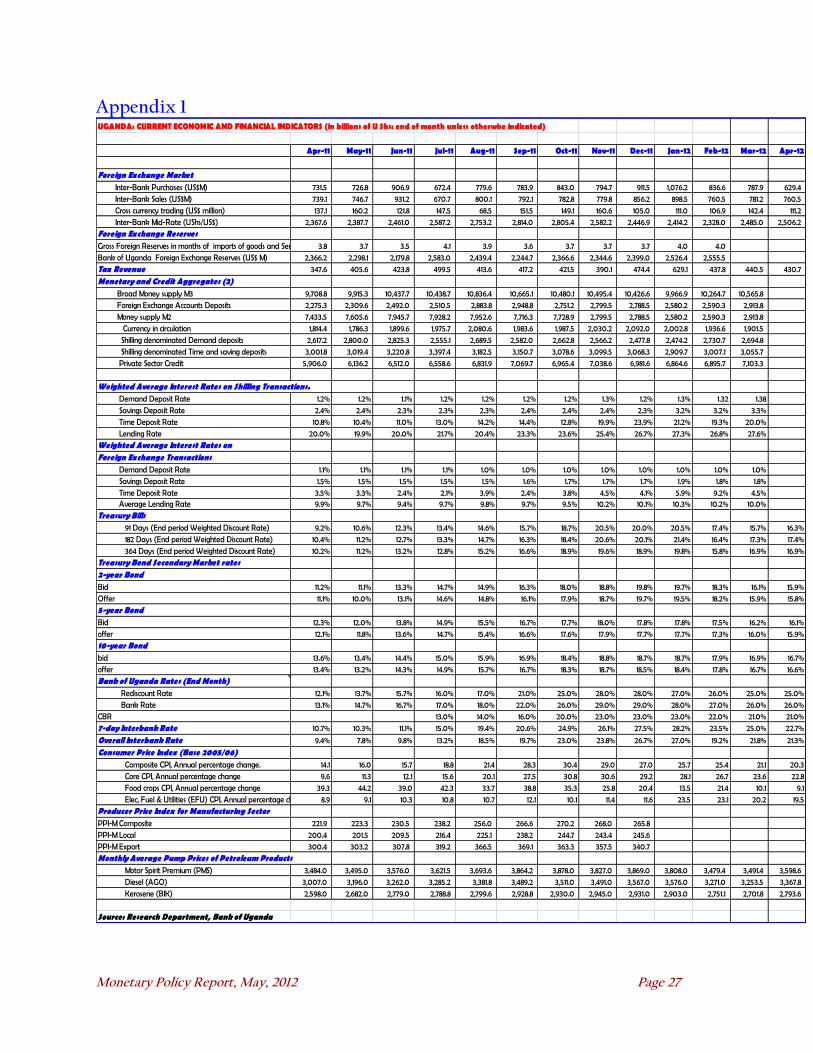
Appendix 1 UGANDA: CURRENT ECONOMIC AND FINANCIAL INDICATORS (in billions of U Shs: end of month unless otherwise indicated)
Apr-11 May-11 Jun-11 Jul-11 Aug-11 Sep-11 Oct-11 Nov-11 Dec-11 Jan-12 Feb-12 Mar-12 Apr-12
Foreign Exchange Market Inter-Bank Purchases (US$M) 731.5 726.8 906.9 672.4 779.6 783.9 843.0 794.7 911.5 1,076.2 836.6 787.9 629.4 Inter-Bank Sales (US$M) 739.1 746.7 931.2 670.7 800.1 792.1 782.8 779.8 856.2 898.5 760.5 781.2 760.5 Cross currency trading (US$ million) 137.1 160.2 121.8 147.5 68.5 151.5 149.1 160.6 105.0 111.0 106.9 142.4 111.2 Inter-Bank Mid-Rate (UShs/US$) 2,367.6 2,387.7 2,461.0 2,587.2 2,753.2 2,814.0 2,805.4 2,582.2 2,446.9 2,414.2 2,328.0 2,485.0 2,506.2Foreign Exchange ReservesGross Foreign Reserves in months of imports of goods and Services 3.8 3.7 3.5 4.1 3.9 3.6 3.7 3.7 3.7 4.0 4.0Bank of Uganda Foreign Exchange Reserves (US$ M) 2,366.2 2,298.1 2,179.8 2,583.0 2,439.4 2,244.7 2,366.6 2,344.6 2,399.0 2,526.4 2,555.5Tax Revenue 347.6 405.6 423.8 499.5 413.6 417.2 421.5 390.1 474.4 629.1 437.8 440.5 430.7
Monetary and Credit Aggregates (2) Broad Money supply M3 9,708.8 9,915.3 10,437.7 10,438.7 10,836.4 10,665.1 10,480.1 10,495.4 10,426.6 9,966.9 10,264.7 10,565.8 Foreign Exchange Accounts Deposits 2,275.3 2,309.6 2,492.0 2,510.5 2,883.8 2,948.8 2,751.2 2,799.5 2,788.5 2,580.2 2,590.3 2,913.8 Money supply M2 7,433.5 7,605.6 7,945.7 7,928.2 7,952.6 7,716.3 7,728.9 2,799.5 2,788.5 2,580.2 2,590.3 2,913.8 Currency in circulation 1,814.4 1,786.3 1,899.6 1,975.7 2,080.6 1,983.6 1,987.5 2,030.2 2,092.0 2,002.8 1,936.6 1,901.5 Shilling denominated Demand deposits 2,617.2 2,800.0 2,825.3 2,555.1 2,689.5 2,582.0 2,662.8 2,566.2 2,477.8 2,474.2 2,730.7 2,694.8 Shilling denominated Time and saving deposits 3,001.8 3,019.4 3,220.8 3,397.4 3,182.5 3,150.7 3,078.6 3,099.5 3,068.3 2,909.7 3,007.1 3,055.7 Private Sector Credit 5,906.0 6,136.2 6,512.0 6,558.6 6,831.9 7,069.7 6,965.4 7,038.6 6,981.6 6,864.6 6,895.7 7,103.3
Weighted Average Interest Rates on Shilling Transactions. Demand Deposit Rate 1.2% 1.2% 1.1% 1.2% 1.2% 1.2% 1.2% 1.3% 1.2% 1.3% 1.32 1.38 Savings Deposit Rate 2.4% 2.4% 2.3% 2.3% 2.3% 2.4% 2.4% 2.4% 2.3% 3.2% 3.2% 3.3% Time Deposit Rate 10.8% 10.4% 11.0% 13.0% 14.2% 14.4% 12.8% 19.9% 23.9% 21.2% 19.3% 20.0% Lending Rate 20.0% 19.9% 20.0% 21.7% 20.4% 23.3% 23.6% 25.4% 26.7% 27.3% 26.8% 27.6%Weighted Average Interest Rates on Foreign Exchange Transactions Demand Deposit Rate 1.1% 1.1% 1.1% 1.1% 1.0% 1.0% 1.0% 1.0% 1.0% 1.0% 1.0% 1.0% Savings Deposit Rate 1.5% 1.5% 1.5% 1.5% 1.5% 1.6% 1.7% 1.7% 1.7% 1.9% 1.8% 1.8% Time Deposit Rate 3.5% 3.3% 2.4% 2.1% 3.9% 2.4% 3.8% 4.5% 4.1% 5.9% 9.2% 4.5% Average Lending Rate 9.9% 9.7% 9.4% 9.7% 9.8% 9.7% 9.5% 10.2% 10.1% 10.3% 10.2% 10.0%Treasury Bills 91 Days (End period Weighted Discount Rate) 9.2% 10.6% 12.3% 13.4% 14.6% 15.7% 18.7% 20.5% 20.0% 20.5% 17.4% 15.7% 16.3% 182 Days (End period Weighted Discount Rate) 10.4% 11.2% 12.7% 13.3% 14.7% 16.3% 18.4% 20.6% 20.1% 21.4% 16.4% 17.3% 17.4% 364 Days (End period Weighted Discount Rate) 10.2% 11.2% 13.2% 12.8% 15.2% 16.6% 18.9% 19.6% 18.9% 19.8% 15.8% 16.9% 16.9%Treasury Bond Secondary Market rates2-year BondBid 11.2% 11.1% 13.3% 14.7% 14.9% 16.3% 18.0% 18.8% 19.8% 19.7% 18.3% 16.1% 15.9%Offer 11.1% 10.0% 13.1% 14.6% 14.8% 16.1% 17.9% 18.7% 19.7% 19.5% 18.2% 15.9% 15.8%5-year BondBid 12.3% 12.0% 13.8% 14.9% 15.5% 16.7% 17.7% 18.0% 17.8% 17.8% 17.5% 16.2% 16.1%offer 12.1% 11.8% 13.6% 14.7% 15.4% 16.6% 17.6% 17.9% 17.7% 17.7% 17.3% 16.0% 15.9%10-year Bondbid 13.6% 13.4% 14.4% 15.0% 15.9% 16.9% 18.4% 18.8% 18.7% 18.7% 17.9% 16.9% 16.7%offer 13.4% 13.2% 14.3% 14.9% 15.7% 16.7% 18.3% 18.7% 18.5% 18.4% 17.8% 16.7% 16.6%Bank of Uganda Rates (End Month) Rediscount Rate 12.1% 13.7% 15.7% 16.0% 17.0% 21.0% 25.0% 28.0% 28.0% 27.0% 26.0% 25.0% 25.0% Bank Rate 13.1% 14.7% 16.7% 17.0% 18.0% 22.0% 26.0% 29.0% 29.0% 28.0% 27.0% 26.0% 26.0%CBR 13.0% 14.0% 16.0% 20.0% 23.0% 23.0% 23.0% 22.0% 21.0% 21.0%7-day Interbank Rate 10.7% 10.3% 11.1% 15.0% 19.4% 20.6% 24.9% 26.1% 27.5% 28.2% 23.5% 25.0% 22.7%
Overall Interbank Rate 9.4% 7.8% 9.8% 13.2% 18.5% 19.7% 23.0% 23.8% 26.7% 27.0% 19.2% 21.8% 21.3%
Consumer Price Index (Base 2005/06) Composite CPI, Annual percentage change. 14.1 16.0 15.7 18.8 21.4 28.3 30.4 29.0 27.0 25.7 25.4 21.1 20.3 Core CPI, Annual percentage change 9.6 11.3 12.1 15.6 20.1 27.5 30.8 30.6 29.2 28.1 26.7 23.6 22.8 Food crops CPI, Annual percentage change 39.3 44.2 39.0 42.3 33.7 38.8 35.3 25.8 20.4 13.5 21.4 10.1 9.1 Elec, Fuel & Utilities (EFU) CPI, Annual percentage change 8.9 9.1 10.3 10.8 10.7 12.1 10.1 11.4 11.6 23.5 23.1 20.2 19.5Producer Price Index for Manufacturing SectorPPI-M Composite 221.9 223.3 230.5 238.2 256.0 266.6 270.2 268.0 265.8PPI-M Local 200.4 201.5 209.5 216.4 225.1 238.2 244.7 243.4 245.6PPI-M Export 300.4 303.2 307.8 319.2 366.5 369.1 363.3 357.5 340.7Monthly Average Pump Prices of Petroleum Products Motor Spirit Premium (PMS) 3,484.0 3,495.0 3,576.0 3,621.5 3,693.6 3,864.2 3,878.0 3,827.0 3,869.0 3,808.0 3,479.4 3,491.4 3,598.6 Diesel (AGO) 3,007.0 3,196.0 3,262.0 3,285.2 3,381.8 3,489.2 3,511.0 3,491.0 3,567.0 3,576.0 3,271.0 3,253.5 3,367.8 Kerosene (BIK) 2,598.0 2,682.0 2,779.0 2,788.8 2,799.6 2,928.8 2,930.0 2,945.0 2,931.0 2,903.0 2,751.1 2,701.8 2,793.6
Source: Research Department, Bank of Uganda
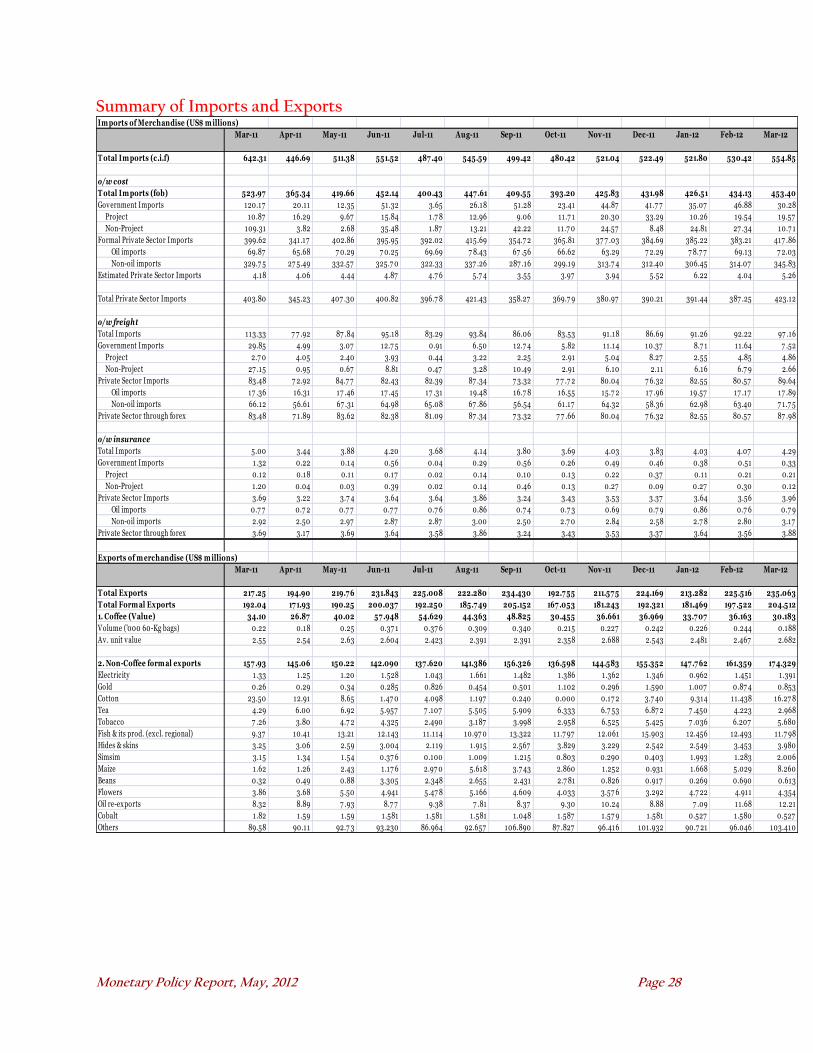
Monetary Policy Report, May, 2012 Page 28
Summary of Imports and Exports Im ports of Merchandise (US$ m illions)
Mar-11 Apr-11 May -11 Jun-11 Jul-11 Aug-11 Sep-11 Oct-11 Nov-11 Dec-11 Jan-12 Feb-12 Mar-12
T otal Im ports (c.i.f) 642.31 446.69 511.38 551.52 487 .40 545.59 499.42 480.42 521.04 522.49 521.80 530.42 554.85
o/w cost
T otal Im ports (fob) 523.97 365.34 419.66 452.14 400.43 447 .61 409.55 393.20 425.83 431.98 426.51 434.13 453.40
Government Imports 120.17 20.11 12.35 51.32 3.65 26.18 51.28 23.41 44.87 41.7 7 35.07 46.88 30.28
Project 10.87 16.29 9.67 15.84 1.7 8 12.96 9.06 11.7 1 20.30 33.29 10.26 19.54 19.57
Non-Project 109.31 3.82 2.68 35.48 1.87 13.21 42.22 11.7 0 24.57 8.48 24.81 27 .34 10.7 1
Formal Private Sector Imports 399.62 341.17 402.86 395.95 392.02 415.69 354.7 2 365.81 37 7 .03 384.69 385.22 383.21 417 .86
Oil imports 69.87 65.68 7 0.29 7 0.25 69.69 7 8.43 67 .56 66.62 63.29 7 2.29 7 8.7 7 69.13 7 2.03
Non-oil imports 329.7 5 27 5.49 332.57 325.7 0 322.33 337 .26 287 .16 299.19 313.7 4 312.40 306.45 314.07 345.83
Estimated Private Sector Imports 4.18 4.06 4.44 4.87 4.7 6 5.7 4 3.55 3.97 3.94 5.52 6.22 4.04 5.26
Total Private Sector Imports 403.80 345.23 407 .30 400.82 396.7 8 421.43 358.27 369.7 9 380.97 390.21 391.44 387 .25 423.12
o/w freight
Total Imports 113.33 7 7 .92 87 .84 95.18 83.29 93.84 86.06 83.53 91.18 86.69 91.26 92.22 97 .16
Government Imports 29.85 4.99 3.07 12.7 5 0.91 6.50 12.7 4 5.82 11.14 10.37 8.7 1 11 .64 7 .52
Project 2.7 0 4.05 2.40 3.93 0.44 3.22 2.25 2.91 5.04 8.27 2.55 4.85 4.86
Non-Project 27 .15 0.95 0.67 8.81 0.47 3.28 10.49 2.91 6.10 2.11 6.16 6.7 9 2.66
Private Sector Imports 83.48 7 2.92 84.7 7 82.43 82.39 87 .34 7 3.32 7 7 .7 2 80.04 7 6.32 82.55 80.57 89.64
Oil imports 17 .36 16.31 17 .46 17 .45 17 .31 19.48 16.7 8 16.55 15.7 2 17 .96 19.57 17 .17 17 .89
Non-oil imports 66.12 56.61 67 .31 64.98 65.08 67 .86 56.54 61.17 64.32 58.36 62.98 63.40 7 1.7 5
Private Sector through forex 83.48 7 1.89 83.62 82.38 81.09 87 .34 7 3.32 7 7 .66 80.04 7 6.32 82.55 80.57 87 .98
o/w insurance
Total Imports 5.00 3.44 3.88 4.20 3.68 4.14 3.80 3.69 4.03 3.83 4.03 4.07 4.29
Government Imports 1 .32 0.22 0.14 0.56 0.04 0.29 0.56 0.26 0.49 0.46 0.38 0.51 0.33
Project 0.12 0.18 0.11 0.17 0.02 0.14 0.10 0.13 0.22 0.37 0.11 0.21 0.21
Non-Project 1 .20 0.04 0.03 0.39 0.02 0.14 0.46 0.13 0.27 0.09 0.27 0.30 0.12
Private Sector Imports 3.69 3.22 3.7 4 3.64 3.64 3.86 3.24 3.43 3.53 3.37 3.64 3.56 3.96
Oil imports 0.7 7 0.7 2 0.7 7 0.7 7 0.7 6 0.86 0.7 4 0.7 3 0.69 0.7 9 0.86 0.7 6 0.7 9
Non-oil imports 2.92 2.50 2.97 2.87 2.87 3.00 2.50 2.7 0 2.84 2.58 2.7 8 2.80 3.17
Private Sector through forex 3.69 3.17 3.69 3.64 3.58 3.86 3.24 3.43 3.53 3.37 3.64 3.56 3.88
Exports of m erchandise (US$ m illions)
Mar-11 Apr-11 May -11 Jun-11 Jul-11 Aug-11 Sep-11 Oct-11 Nov-11 Dec-11 Jan-12 Feb-12 Mar-12
T otal Exports 217 .25 194.90 219.7 6 231.843 225.008 222.280 234.430 192.7 55 211.57 5 224.169 213.282 225.516 235.063
T otal Form al Exports 192.04 17 1.93 190.25 200.037 192.250 185.7 49 205.152 167 .053 181.243 192.321 181.469 197 .522 204.512
1. Coffee (Value) 34.10 26.87 40.02 57 .948 54.629 44.363 48.825 30.455 36.661 36.969 33.7 07 36.163 30.183
Volume ('000 60-Kg bags) 0.22 0.18 0.25 0.37 1 0.37 6 0.309 0.340 0.215 0.227 0.242 0.226 0.244 0.188
Av. unit value 2.55 2.54 2.63 2.604 2.423 2.391 2.391 2.358 2.688 2.543 2.481 2.467 2.682
2. Non-Coffee form al exports 157 .93 145.06 150.22 142.090 137 .620 141.386 156.326 136.598 144.583 155.352 147 .7 62 161.359 17 4.329
Electricity 1 .33 1.25 1.20 1.528 1.043 1.661 1.482 1.386 1.362 1.346 0.962 1.451 1.391
Gold 0.26 0.29 0.34 0.285 0.826 0.454 0.501 1.102 0.296 1.590 1.007 0.87 4 0.853
Cotton 23.50 12.91 8.65 1.47 0 4.098 1.197 0.240 0.000 0.17 2 3.7 40 9.314 11.438 16.27 8
Tea 4.29 6.00 6.92 5.957 7 .107 5.505 5.909 6.333 6.7 53 6.87 2 7 .450 4.223 2.968
Tobacco 7 .26 3.80 4.7 2 4.325 2.490 3.187 3.998 2.958 6.525 5.425 7 .036 6.207 5.680
Fish & its prod. (excl. regional) 9.37 10.41 13.21 12.143 11.114 10.97 0 13.322 11.7 97 12.061 15.903 12.456 12.493 11.7 98
Hides & skins 3.25 3.06 2.59 3.004 2.119 1.915 2.567 3.829 3.229 2.542 2.549 3.453 3.980
Simsim 3.15 1.34 1.54 0.37 6 0.100 1.009 1.215 0.803 0.290 0.403 1.993 1.283 2.006
Maize 1.62 1.26 2.43 1.17 6 2.97 0 5.618 3.7 43 2.860 1.252 0.931 1.668 5.029 8.260
Beans 0.32 0.49 0.88 3.305 2.348 2.655 2.431 2.7 81 0.826 0.917 0.269 0.690 0.613
Flowers 3.86 3.68 5.50 4.941 5.47 8 5.166 4.609 4.033 3.57 6 3.292 4.7 22 4.911 4.354
Oil re-exports 8.32 8.89 7 .93 8.7 7 9.38 7 .81 8.37 9.30 10.24 8.88 7 .09 11.68 12.21
Cobalt 1 .82 1.59 1.59 1.581 1.581 1.581 1.048 1.587 1.57 9 1.581 0.527 1.580 0.527
Others 89.58 90.11 92.7 3 93.230 86.964 92.657 106.890 87 .827 96.416 101.932 90.7 21 96.046 103.410