bank of america merrill lynch -...
TRANSCRIPT

November 29, 2017
Bank of America Merrill Lynch 2017 Leveraged Finance Conference
Keith Pitts, Vice Chairman

2 November 29, 2017
FORWARD-LOOKING STATEMENTS This presentation includes “forward-looking statements.” These statements relate to future events, including, but not limited to, statements with respect to our business outlook and forecasts with respect to our future earnings and financial position, as well as future developments in the healthcare regulatory environment and healthcare industry more generally. These forward-looking statements represent management’s current expectations, based on currently available information, as to the outcome and timing of future events, but, by their nature, address matters that are uncertain. Actual results and plans could differ materially from those expressed in any forward-looking statement.
Examples of factors that may cause our actual results, performance or achievements, or healthcare industry results, to be materially different from those expressed or implied by forward-looking statements include, but are not limited to, the following: (i) the timing and impact on our business of the repeal or significant modification of the Affordable Care Act, the enactment of a replacement omnibus healthcare law, if any, and the enactment of, or changes in, other statutes and regulations affecting the healthcare industry generally; (ii) the effect that adverse economic conditions have on our volumes and our ability to collect outstanding receivables on a timely basis, among other things; (iii) Adverse regulatory developments, government investigations or litigation; (iv) Adverse developments with respect to our ability to comply with the terms of the Non-Prosecution Agreement; (iv) Our ability to enter into managed care provider arrangements on acceptable terms, including our ability to mitigate the impact of national managed care contracts that expire and are not replaced; (v) Cuts to Medicare and Medicaid payment rates or changes in reimbursement practices; (vi) Competition; (vii) increases in wages and our ability to hire and retain qualified personnel, especially healthcare professionals; (vii) the impact of our significant indebtedness; (viii) the availability and terms of capital to fund the operation and expansion of our business; and our ability to comply with our debt covenants and, over time, reduce leverage; (ix) our ability to continue to expand and realize earnings contributions from our Ambulatory Care and Conifer segments; (x) our ability to achieve operating and financial targets, attain expected levels of patient volumes, and identify and execute on measures designed to save or control costs or streamline operations, including our ability to realize the savings under our recently announced cost reduction initiative; (xi) our success in divesting sub-scale businesses and completing other corporate development transactions; (xii) Increases in the amount and risk of collectability of uninsured accounts and deductibles and copays for insured accounts; (xiii) Changes in service mix, revenue mix and surgical volumes, including potential declines in the population covered under managed care agreements; (xiv) the timing and impact of potential changes in federal tax policies, and the outcome of pending and any future tax audits, disputes and litigation associated with our tax positions; and (xv) other factors discussed in our Form 10-K for the year ended December 31, 2016, subsequent Form 10-Q filings, and other filings with the SEC.
We assume no obligation to update any forward-looking statements or information which speak as of their respective dates and you are cautioned not to put undue reliance on these forward-looking statements.
NON-GAAP FINANCIAL INFORMATION This presentation contains non-GAAP financial measures. Reconciliations of these non-GAAP measures to the most comparable GAAP measure are included in the financial tables at the end of this presentation as well as at the end of the Company’s press release dated November 6, 2017.

3 November 29, 2017
Organic growth: Organic volume growth in hospitals, ambulatory facilities and Conifer
Quality and patient satisfaction: High quality care and improved patient satisfaction; greater part of 2018 management compensation
Expense management: Continuously improving cost structure (e.g., the recently announced $150 million cost reduction initiative)
Accountability and agility: Flattening the organization, definitive & measurable accountability, decision making at the right levels
Enhance shareholder value: Continue to review, analyze and pursue all options to enhance shareholder value
Delever and reducing net debt: Reduce ratio of net debt-to-EBITDA through growing EBITDA and reducing net debt
Board refreshment and CEO search: Ongoing refreshment process; permanent CEO search underway
Key Priorities

Business Overview

5 November 29, 2017
Tenet Healthcare Today
Acute Care: Leading Hospital Operator
High-quality, low-cost provider
Focused on high-acuity inpatient services
Expanding access points (e.g., micro-hospitals, freestanding EDs and urgent care centers)
#1 or #2 positions in 17 of our 24 markets
Exiting sub-scale markets
Conifer Health: Leading Provider of Revenue Cycle Management Services
Industry leader in growing markets
Hospital and physician revenue cycle management services
Value-based care solutions for providers, insurers and employers
Over 800 clients in 43 states
USPI: Leading Ambulatory Platform in the U.S.
Largest provider of ambulatory surgery in the United States
Higher-margin, faster-growing, more capital-efficient business
Preferred by patients and payers
Partnerships with over 50 not-for-profit health systems
Expanding the continuum of care in Tenet’s hospital markets

6 November 29, 2017
Leading Provider of Health Care Services Across the Continuum of Care
77 Acute Care Hospitals
20
FSEDs & Micro-hospitals
258 Ambulatory
Surgery Centers
~80% of Hospitals
in ACOs
20 Surgical
Hospitals
50+
Health System Partners
186 Urgent Care &
Imaging Centers
NOTE: As of 9/30/17 including facilities in the Hospital Operations and Other segment and the Ambulatory Care segment and excluding Aspen in the United Kingdom. 12 Tenet acute care hospital states are shaded blue.

7 November 29, 2017
Leading Provider of Revenue Cycle Management and Value-Based Care Solutions
800 Conifer Clients
43
States
135 Regional Markets
$21.5B Medically Managed
Spend
$30B Net Revenue
Processed
5.7M
Managed Lives
24M Patient Touch
Points
Revenue Cycle Management Value-Based Care

8 November 29, 2017
El Paso, TX • New teaching hospital • 106 beds, 6 ORs • Opened Jan. 2017
San Antonio, TX • New orthopedic institute • 63 beds, 10 ORs • Opened Oct. 2016
Delray Beach, FL • New patient tower • 96 beds • Opened July 2017
Tucson, AZ • Acquired majority interest in
3-hospital system • #2 market position • Sept. 2015
Birmingham, AL • Acquired majority interest in
5-hospital system • #1 market position • Oct. 2015
Troy, MI & Detroit, MI • Advanced pediatric services • New facility for pediatric outpatient
services (opened Feb. 2016) • New critical care tower (83 beds, 4
ORs; opened July 2017)
New facilities and JVs advancing service-lines and market leadership

9 November 29, 2017
Trusted Partner to Leading Not-for-Profit Health Systems
10 November 29, 2017
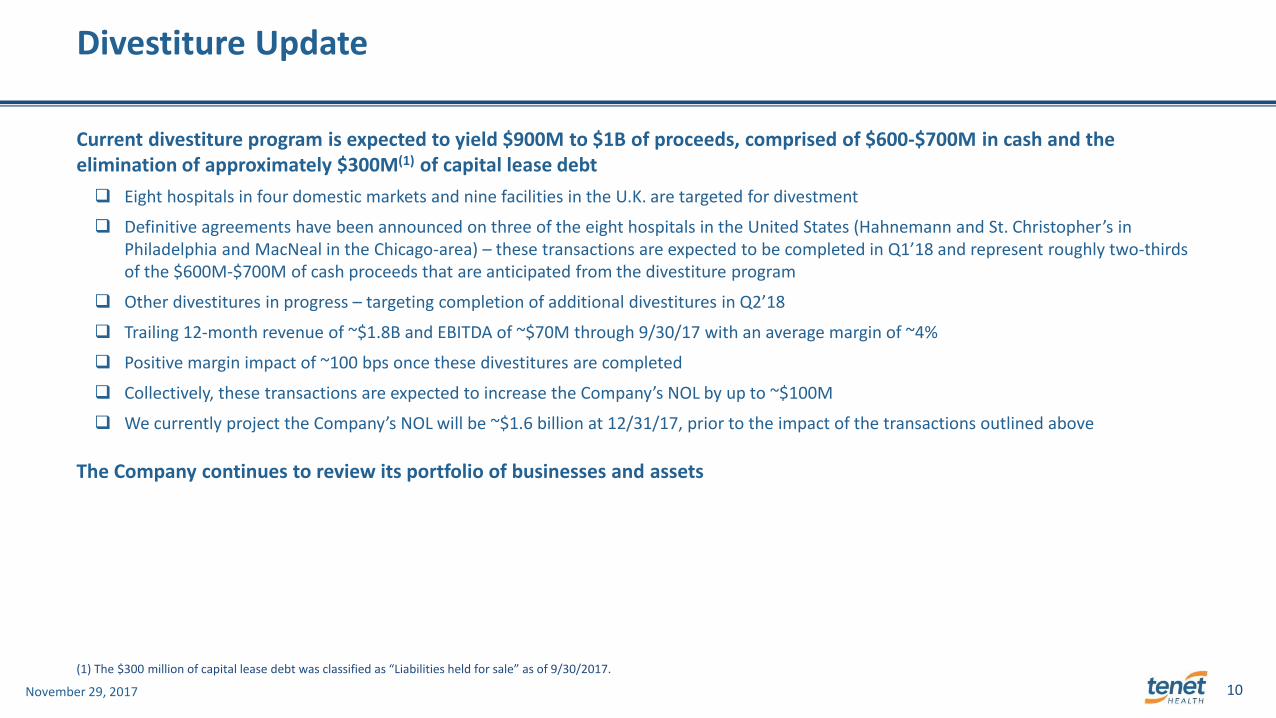
Current divestiture program is expected to yield $900M to $1B of proceeds, comprised of $600-$700M in cash and the elimination of approximately $300M(1) of capital lease debt
Eight hospitals in four domestic markets and nine facilities in the U.K. are targeted for divestment
Definitive agreements have been announced on three of the eight hospitals in the United States (Hahnemann and St. Christopher’s in Philadelphia and MacNeal in the Chicago-area) – these transactions are expected to be completed in Q1’18 and represent roughly two-thirds of the $600M-$700M of cash proceeds that are anticipated from the divestiture program
Other divestitures in progress – targeting completion of additional divestitures in Q2’18
Trailing 12-month revenue of ~$1.8B and EBITDA of ~$70M through 9/30/17 with an average margin of ~4%
Positive margin impact of ~100 bps once these divestitures are completed
Collectively, these transactions are expected to increase the Company’s NOL by up to ~$100M
We currently project the Company’s NOL will be ~$1.6 billion at 12/31/17, prior to the impact of the transactions outlined above
The Company continues to review its portfolio of businesses and assets
Divestiture Update
(1) The $300 million of capital lease debt was classified as “Liabilities held for sale” as of 9/30/2017.

Financial Overview

12 November 29, 2017
Adjusted EBITDA was $507 million and grew ~5% after normalizing for three items − The $75 million decline in Adjusted EBITDA, as compared to $582 million(1) in Q3’16, was primarily due to:
− $55 million of revenue being recorded under the California Provider Fee program in Q3’16 vs. no revenue in Q3’17 since the program has not yet been approved by CMS.
− $30 million of lower revenue and higher expenses related to Hurricanes Harvey and Irma.
− $20 million due to the sale of the Company’s hospitals in Houston, effective August 1, 2017.
Hospital segment same-hospital patient revenue declined 2.3% − Adjusted admissions declined 2.2% and were down 0.8% excluding the hurricanes and patients insured by Humana in both periods.
− Admissions declined 2.6% and were down 1.2% excluding the hurricanes and patients insured by Humana in both periods.
− Revenue per adjusted admission declined 0.2% and was up 1.3% after adjusting for the California Provider Fee.
− Adjusted EBITDA was $269 million and was down $77 million compared to $346 million in Q3’16, primarily driven by the California Provider Fee,
$20 million hurricane impact and the Houston sale.
Ambulatory Care same-facility system-wide revenue grew 0.9% − Cases declined 2.4% and revenue per case increased 3.4% on a same-facility system-wide basis.
− One less surgical day lowered case growth by ~100 basis points and Hurricanes Harvey and Irma lowered case growth by ~210 basis points.
− On a same-day basis and excluding the hurricane impact, same-facility system-wide revenue increased 4.0% and cases were up 0.7%.
− Adjusted EBITDA was $159 million, up 1.3% from $157 million in Q3’16; the hurricanes lowered EBITDA by ~$10 million.
− Adjusted EBITDA less facility-level NCI was $104 million, up 1.0% from $103 million in Q3’16; the hurricanes lowered this metric by ~$4 million.
Conifer’s revenue increased 0.8% to $401 million – third party revenue increased 5.4% − Adjusted EBITDA was flat year-over-year at $79 million, representing a margin of 19.7%.
(1) As noted in the Company’s Q4’16 earnings release, the results of the Company’s health plans are being excluded from Adjusted EBITDA in 2017 and prior periods. In Q3’17, the health plan business generated losses of $6 million as compared to losses of $6 million in Q3’16. In addition, the change in accounting for pension expense raised Adjusted EBITDA by $6 million in Q3’16. These changes resulted in a historical revision of the Company’s Q3’16 EBITDA to $582 million as compared to the $570 million that was originally reported.
Q3’17 Financial Highlights

13 November 29, 2017
Targeting $150 million of cost reductions
Ongoing actions through mid-2018 are expected to yield $150 million of annualized run-rate savings by the end of 2018
75% of the savings are expected to be achieved in the Hospital Operations and other segment, including corporate overhead
25% of the savings is expected to be achieved in the Ambulatory Care and Conifer segments, with a fairly even split between the two segments
Eliminating approximately 1,300 positions, including contractors, and renegotiating contracts with vendors and suppliers
Eliminated a regional management layer in the hospital business
Streamlining corporate overhead and centralized support functions
Actions will not be disruptive to patient care
Anticipate $40 million of restructuring costs related to this initiative to be recorded in the fourth quarter of 2017
Substantially all of these costs relate to employee severance payments that will begin in 4Q17 and continue into 2019
Cost Reduction Initiative

14 November 29, 2017
$ in millions, except EPS 2017 OutlookNet Revenue $18,900 - $19,100
Adjusted EBITDA (1) $2,375 - $2,425
Adjusted EBITDA Margin (1) 12.6% - 12.7%
Adjusted diluted E.P.S. from continuing operations (1) $0.59 - $0.74
Adjusted Cash Flow from Operations (1) $1,125 - $1,375
Capital Expenditures $675 - $725
Adjusted Free Cash Flow (1) $450 - $650
Assumptions:
Bad Debt Ratio 7.00% - 7.50%
Total Hospital Expenses per Adjusted Admission Growth 2.0% - 2.5%
Equity in Earnings of Unconsolidated Affiliates $140 - $150
Electronic Health Record Incentives $10
Depreciation and Amortization $860 - $870
Interest Expense $1,020 - $1,030
Effective Tax Rate (2) 10%
Net Income Attributable to Noncontrolling Interests (3) $370 - $380
Fully diluted weighted average shares outstanding 101
Note: The Outlook for 2017: a) assumes that the new California Provider Fee program is approved by December 31, 2017; and b) excludes approximately $50 million of negative
Adjusted EBITDA that the Company expects to incur in its health plan business in 2017.
(1) Please refer to slides 19 to 25 for additional information on these non-GAAP measures.
(2) The following formula can be used to estimate Tenet’s income tax expense in 2017: a) start with pre-tax income, which is estimated to be $475-$505 mill ion; b) subtract GAAP NCI expense, which is
estimated to be $370-$380 mill ion in 2017; c) add back permanent differences and non-deductible items, which are estimated to be approximately $10-$15 mill ion in 2017; d) add back approximately
$40 mill ion of non-cash NCI expense that Tenet is recognizing related to the portion of USPI that the company does not own; and, e) multiply the result by a 40% tax rate. In addition, in 2017, lower
income tax expense by approximately $20 mill ion related to other tax adjustments primarily related to Aspen. The result is an effective tax rate of approximately 10% on Tenet’s pre-tax income in 2017.
(3) This represents GAAP NCI expense to be recorded on the income statement, including approximately $40 mill ion related to the portion of USPI that Tenet does not own and approximately $50 mill ion
related to the portion of Conifer that Tenet does not own. Cash distributions paid to noncontrolling interests are expected to be $270-$290 mill ion.
Tenet Outlook for 2017*
On November 6, lowered the midpoint of the 2017 Adjusted EBITDA Outlook by $100 million to reflect:
~$60 million due to Hurricanes Harvey and Irma, prior to any insurance recoveries, with ~$30 million reflected in the results for Q3’17 and an additional ~$30 million included in the Outlook for Q4’17
~$17 million of executive severance and related stock-based compensation expense in Q4’17
~$15 million of lower-than-anticipated revenue from the Texas and Florida Medicaid programs
~$8 million from other items, primarily lower volume growth, higher bad debt and the timing of Ambulatory acquisitions, partially offset by the Company’s cost reduction initiatives
* The Outlook presented is as issued on November 6, 2017 and has not been updated to take into account events subsequent to the date of issuance.

15 November 29, 2017
Segment Outlook for 2017*
Adjusted EBITDA $1.430 - $1.450 billion Adjusted EBITDA $680 - $700 million Adjusted EBITDA $265 - $275 million
Noncontrolling Interest (1) ~$40 million Noncontrolling Interest (1) $280 - $290 million Noncontrolling Interest (1) ~$50 million
Net Patient Revenue Growth (2) 0% - 2% Net Revenue Growth (2) 4% - 6% Net Revenue Growth 2% - 3%
Pro forma Adjusted EBITDA Growth (3) (1%) - 0% Adjusted EBITDA Growth 11% - 14% Adjusted EBITDA Growth (4%) - (1%)
Adjusted Admissions Growth (2) (2.0%) - (1.0%) Adjusted EBITDA less NCI Growth (3) 11% - 14%
Net Revenue per Adjusted Admission (2) 2.5% - 3.5% Case Growth (2) 0.0% - 2.0%
Admissions Growth (2) (3.0%) - (2.0%) Net Revenue per Case Growth (2) 4.0% - 5.0%
Hospital Operations Ambulatory Conifer
and Other Segment Segment Segment
(1) Based on GAAP NCI expense.
(2) Growth rates on a same hospital basis.
(2) Growth rates on a same facility system wide basis.
(1) Based on GAAP NCI expense, including approximately $40 million
related to the portion of USPI that Tenet does not own.
(1) Based on GAAP NCI expense. Cash NCI distributions will be
zero.
(3) Calculated using $1.452 billion of EBITDA in 2016 and $1.435 billion to
$1.455 billion of EBITDA in 2017. These figures exclude: (i) Electronic health
record incentives of $32 million in 2016 and ~$10 million in 2017; (ii) $25
million of EBITDA in 2016 generated by the Company's former hospitals in
Atlanta, which have been divested; (iii) $37 million of health plan losses in
2016; (iv) $28 million in 2016 due to a change in pension accounting, (v) $77
million in 2016 and ~$25 million in 2017 generated by the Company's former
hospitals in Houston, which have been divested; and, (vi) ~$40 million of
incremental hurricane related impact in 2017 versus 2016.
(3) Represents the expected growth in EBITDA less facility-level NCI.
Calculated using $395 million of Ambulatory segment EBITDA less
facility level NCI in 2016. This calculation excludes $65 million of
NCI in 2016 and approximately $40 million in 2017 related to the
portion of USPI that Tenet does not own.
* The Outlook presented is as issued on November 6, 2017 and has not been updated to take into account events subsequent to the date of issuance.

16 November 29, 2017
2,300 1,900 1,870
750 1,410
500
300 2,800
1,900
500
430
1,000
$0
$1,000
$2,000
$3,000
$4,000
$5,000
2018 2019 2020 2021 2022 2023 2024 2025 2031
First Lien Secured Notes Second Lien Secured Notes Senior Unsecured Notes ABL Facility (undrawn)
Debt Maturity Profile (1)
1. As of 09/30/2017. Excludes Capital Leases and Mortgage Notes, Unamortized Note Discounts and Premiums and Letter of Credit Facility.
//
($ in millions)
Minimal Near-Term Debt Maturities

17 November 29, 2017
Taking near-term actions to lower costs while evaluating additional actions to improve long-term financial performance, with a focus on improving Tenet’s growth and margin trajectory
Not waiting for a new CEO to make the decisions that are necessary to move the Company forward
Continue to target net leverage of 5x EBITDA by the end of 2019
Committed to strong governance, adding three new directors since mid-October – Tenet’s board now consists of 12 directors, five of whom have joined the board since November 2016
The board and management will continue to evaluate and pursue all options available to enhance shareholder value
Summary

Appendix and Reconciliation of Non-GAAP Financial Measures
19 November 29, 2017
Adjusted EBITDA, a non-GAAP measure, is defined by the Company as net income (loss) attributable to Tenet Healthcare Corporation common shareholders before (1) the cumulative effect of changes in accounting principle, (2) net loss (income) attributable to noncontrolling interests, (3) income (loss) from discontinued operations, (4) income tax benefit (expense), (5) other non-operating income (expense), net, (6) gain (loss) from early extinguishment of debt, (7) interest expense, (8) litigation and investigation (costs) benefit, net of insurance recoveries, (9) net gains (losses) on sales, consolidation and deconsolidation of facilities, (10) impairment and restructuring charges and acquisition-related costs, (11) depreciation and amortization and (12) income (loss) from divested operations and closed businesses (i.e., the Company’s health plan businesses). Litigation and investigation costs do not include ordinary course of business malpractice and other litigation and related expense.
Adjusted net income (loss) from continuing operations attributable to Tenet Healthcare Corporation common shareholders, a non-GAAP measure, is defined by the Company as net income (loss) attributable to Tenet Healthcare Corporation common shareholders before (1) impairment and restructuring charges, and acquisition-related costs, (2) litigation and investigation costs, (3) gains on sales, consolidation and deconsolidation of facilities, (4) gain (loss) from early extinguishment of debt, (5) income (loss) from divested operations and closed businesses, (6) the associated impact of these five items on taxes and noncontrolling interests, and (7) net income (loss) from discontinued operations. Adjusted diluted earnings (loss) per share from continuing operations, a non-GAAP term, is defined by the Company as Adjusted net income (loss) from continuing operations attributable to Tenet Healthcare Corporation common shareholders divided by the weighted average primary or diluted shares outstanding in the reporting period.
Free Cash Flow, a non-GAAP measure, is defined by the Company as (1) net cash provided by (used in) operating activities, less (2) purchases of property and equipment from continuing operations.
Adjusted Free Cash Flow, a non-GAAP measure, is defined by the Company as (1) Adjusted net cash provided by (used in) operating activities from continuing operations, less (2) purchases of property and equipment from continuing operations. Adjusted net cash provided by (used in) operating activities, a non-GAAP measure, is defined by the Company as cash provided by (used in) operating activities prior to (1) payments for restructuring charges, acquisition-related costs and litigation costs and settlements, and (2) net cash provided by (used in) operating activities from discontinued operations.
The Company believes the foregoing non-GAAP measures are useful to investors and analysts because they present additional information on the Company’s financial performance. Investors, analysts, Company management and the Company’s Board of Directors utilize these non-GAAP measures, in addition to GAAP measures, to track the Company’s financial and operating performance and compare the Company’s performance to its peer companies, which utilize similar non-GAAP measures in their presentations. The Human Resources Committee of the Company’s Board of Directors also uses certain of these measures to evaluate management’s performance for the purpose of determining incentive compensation. Additional information regarding the purpose and utility of specific non-GAAP measures used in this release is set forth below.
(continued on the following page)
Non-GAAP Financial Measures
20 November 29, 2017
(continued from the prior page)
The Company believes that Adjusted EBITDA is a useful measure, in part, because certain investors and analysts use both historical and projected Adjusted EBITDA, in addition to other GAAP and non-GAAP measures, as factors in determining the estimated fair value of shares of the Company’s common stock. Company management also regularly reviews the Adjusted EBITDA performance for each operating segment. The Company does not use Adjusted EBITDA to measure liquidity, but instead to measure operating performance.
We use, and we believe investors and analysts use, Free Cash Flow and Adjusted Free Cash Flow as supplemental measures to analyze cash flows generated from our operations because we believe it is useful to investors in evaluating our ability to fund distributions paid to noncontrolling interests, acquisitions, purchasing equity interests in joint ventures or repaying debt.
These non-GAAP measures may not be comparable to similarly titled measures reported by other companies. Because these measures exclude many items that are included in our financial statements, they do not provide a complete measure of our operating performance. For example, the Company’s definitions of Free Cash Flow and Adjusted Free Cash Flow do not include other important uses of cash including (1) cash used to purchase businesses or joint venture interests, or (2) any items that are classified as Cash Flows From Financing Activities on the Company’s Consolidated Statement of Cash Flows, including items such as (i) cash used to repay borrowings, (ii) distributions paid to noncontrolling interests, or (iii) payments under the Put/Call Agreement for USPI redeemable noncontrolling interest, which are recorded on the Statement of Cash Flows as the purchase of noncontrolling interest. Accordingly, investors are encouraged to use GAAP measures when evaluating the Company’s financial performance.
A reconciliation of Adjusted EBITDA to net income (loss) attributable to Tenet Healthcare Corporation common shareholders, the most comparable GAAP measure, is set forth in Table #1 below for the three and nine months ended September 30, 2017 and 2016. A reconciliation of Adjusted net income from continuing operations attributable to Tenet Healthcare Corporation common shareholders to net income (loss) attributable to Tenet Healthcare Corporation common shareholders, the most comparable GAAP measure, is set forth in Table #2 below for the three and nine months ended September 30, 2017 and 2016. A reconciliation of Free Cash Flow and Adjusted Free Cash Flow to net cash provided by (used in) operating activities, the most comparable GAAP measure, is set forth in Table #3 below for the three and nine months ended September 30, 2017 and 2016.
Non-GAAP Financial Measures
21 November 29, 2017
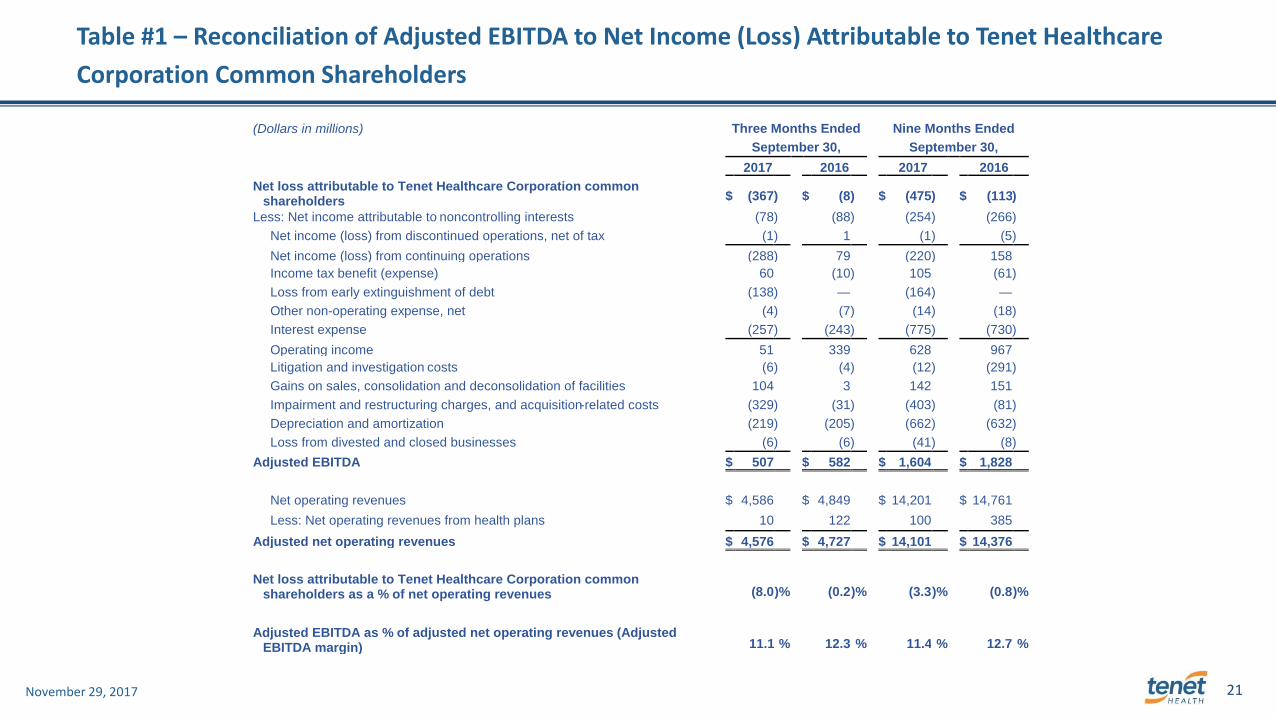
Table #1 – Reconciliation of Adjusted EBITDA to Net Income (Loss) Attributable to Tenet Healthcare
Corporation Common Shareholders
(Dollars in millions) Three Months Ended Nine Months Ended
September 30, September 30,
2017 2016 2017 2016
Net loss attributable to Tenet Healthcare Corporation common shareholders $ (367 ) $ (8 ) $ (475 ) $ (113 )
Less: Net income attributable to noncontrolling interests (78 ) (88 ) (254 ) (266 )
Net income (loss) from discontinued operations, net of tax (1 ) 1 (1 ) (5 )
Net income (loss) from continuing operations (288 ) 79 (220 ) 158
Income tax benefit (expense) 60 (10 ) 105 (61 )
Loss from early extinguishment of debt (138 ) — (164 ) —
Other non-operating expense, net (4 ) (7 ) (14 ) (18 )
Interest expense (257 ) (243 ) (775 ) (730 )
Operating income 51 339 628 967
Litigation and investigation costs (6 ) (4 ) (12 ) (291 )
Gains on sales, consolidation and deconsolidation of facilities 104 3 142 151
Impairment and restructuring charges, and acquisition-related costs (329 ) (31 ) (403 ) (81 )
Depreciation and amortization (219 ) (205 ) (662 ) (632 )
Loss from divested and closed businesses (6 ) (6 ) (41 ) (8 )
Adjusted EBITDA $ 507 $ 582 $ 1,604 $ 1,828
Net operating revenues $ 4,586 $ 4,849 $ 14,201 $ 14,761
Less: Net operating revenues from health plans 10 122 100 385
Adjusted net operating revenues $ 4,576 $ 4,727 $ 14,101 $ 14,376
Net loss attributable to Tenet Healthcare Corporation common shareholders as a % of net operating revenues (8.0 )% (0.2 )% (3.3 )% (0.8 )%
Adjusted EBITDA as % of adjusted net operating revenues (Adjusted EBITDA margin) 11.1 % 12.3 % 11.4 % 12.7 %

22 November 29, 2017
Table #2 – Pre-Tax, After-Tax and Earnings (Loss) Per Share Impact of Certain Items on Continuing
Operations
(Unaudited)
Three Months Ended Nine Months Ended
(Dollars in millions except per share amounts) September 30, September 30,
2017 2016 2017 2016
Adjustments to calculate Adjusted Diluted EPS Impairment and restructuring charges, and acquisition-related costs
(1) $ (329 ) $ (31 ) $ (403 ) $ (81 )
Litigation and investigation costs (6 ) (4 ) (12 ) (291 )
Gain on sales, consolidation and deconsolidation of facilities(2)
104 3 142 151
Loss from early extinguishment of debt(3)
(138 ) — (164 ) —
Loss from divested and closed businesses (6 ) (6 ) (41 ) (11 )
Pre-tax impact (375 ) (38 ) (478 ) (232 )
Tax impact of above items 26 10 65 37
Total after-tax impact (349 ) (28 ) (413 ) (195 )
Noncontrolling interests impact — (1 ) — (19 )
Total loss from items above $ (349 ) $ (29 ) $ (413 ) $ (214 )
Net loss attributable to common shareholders $ (367 ) $ (8 ) $ (475 ) $ (113 )
Less net income (loss) from discontinued operations, net of tax (1 ) 1 (1 ) (5 )
Net loss from continuing operations, net of tax (366 ) (9 ) (474 ) (108 )
Net loss from adjustments above 349 29 413 214
Adjusted net income (loss) from continuing operations attributable to common shareholders $ (17 ) $ 20
$ (61 ) $ 106
Weighted average dilutive shares outstanding (in thousands) 100,812 100,978 100,475 100,680
Diluted earnings (loss) per share from continuing operations $ (3.63 ) $ (0.09 ) $ (4.72 ) $ (1.09 )
Adjusted diluted earnings (loss) per share from continuing operations $ (0.17 ) $ 0.20 $ (0.61 ) $ 1.05
(1) Impairment and restructuring charges, and acquisition-related costs of $329 million in the three months ended September 30, 2017 were primarily
related to the write-down of assets held for sale in Philadelphia and the United Kingdom to their estimated fair value less the estimated costs to
sell. The Company’s results in the three months ended September 30, 2017 do not include restructuring charges related to the Company’s $150
million cost reduction initiative; these charges will be recorded in the three months ending December 31, 2017.
(2) Gain on sales, consolidation and deconsolidation of facilities of $104 million in the three months ended September 30, 2017 was primarily related to
a gain on sale of the Company’s former hospitals, physician practices and related assets in Houston, Texas and the surrounding area.
(3) Loss from early extinguishment of debt of $138 million in the three months ended September 30, 2017 was related to the Company’s refinancing
transactions and debt redemption in the quarter.

23 November 29, 2017
Table #3 – Reconciliations of Free Cash Flow and Adjusted Free Cash Flow
(Unaudited)
Three Months Ended Nine Months Ended
(Dollars in millions) September 30, September 30,
2017 2016 2017 2016
Net cash provided by operating activities $ 308 $ 269 $ 709 $ 851
Purchases of property and equipment (144 ) (201 ) (492 ) (614 )
Free cash flow $ 164 $ 68 $ 217 $ 237
Net cash provided by (used in) investing activities $ 535 $ (204 ) $ 227 $ (150 )
Net cash used in financing activities $ (889 ) $ (72 ) $ (1,223 ) $ (408 )
Net cash provided by operating activities $ 308 $ 269 $ 709 $ 851
Less: Payments for restructuring charges, acquisition-related costs, and litigation costs and settlements (26 ) (33 ) (88 ) (132 )
Net cash (used in) provided by operating activities from discontinued operations (1 ) 1
(3 ) 1
Adjusted net cash provided by operating activities – continuing operations 335
301
800
982
Purchases of property and equipment – continuing operations (144 ) (201 ) (492 ) (614 )
Adjusted free cash flow – continuing operations $ 191 $ 100 $ 308 $ 368

24 November 29, 2017
Table #4 – Reconciliation of Outlook Adjusted EBITDA to Outlook Net Income Attributable to Tenet Healthcare Corporation Common Shareholders
(Unaudited)
(Dollars in millions, except per share amounts) Q4 2017 2017
Low High Low High
Net income (loss) attributable to Tenet Healthcare Corporation common shareholders
$ 98
$ 108
$ (377 ) $ (367 )
Less: Net income attributable to noncontrolling interests (116 ) (126 ) (370 ) (380 )
Net income (loss) from discontinued operations, net of tax (4 ) 1 (5 ) —
Income (loss) from continuing operations 218 233 (2 ) 13
Income tax (expense) benefit (65 ) (60 ) 40 45
Income (loss) from continuing operations, before income taxes 283 293 (42 ) (32 )
Interest expense (245 ) (255 ) (1,020 ) (1,030 )
Loss on early extinguishment of debt — — (164 ) (164 )
Other non-operating expense, net (6 ) (6 ) (20 ) (20 )
Operating income 534 554 1,162 1,182
Gains on sales, consolidation and deconsolidation of facilities(1)
— — 142 142
Impairment and restructuring charges, acquisition-related costs and litigation costs and settlements
(2) (35 ) (45 ) (450 ) (460 )
Depreciation and amortization (198 ) (208 ) (860 ) (870 )
Loss from divested and closed businesses (4 ) (14 ) (45 ) (55 )
Adjusted EBITDA $ 771 $ 821 $ 2,375 $ 2,425
Net income (loss) from continuing operations $ 102 $ 107 $ (372 ) $ (367 )
Net income (loss) from continuing operations as a % of operating revenues 2.1 % 2.1 % (2.0 )% (1.9 )%
Net operating revenues $ 4,804 $ 5,014 $ 19,005 $ 19,215
Less: Net operating revenues from health plans 5 15 105 115
Adjusted net operating revenues $ 4,799 $ 4,999 $ 18,900 $ 19,100
Adjusted EBITDA as % of adjusted net operating revenues (Adjusted EBITDA margin) 16.1 % 16.4 % 12.6 % 12.7 %
Adjusted EBITDA $ 771 $ 821 $ 2,375 $ 2,425
Depreciation and amortization (198 ) (208 ) (860 ) (870 )
Interest expense (245 ) (255 ) (1,020 ) (1,030 )
Other non-operating expense, net (6 ) (6 ) (20 ) (20 )
Adjusted income from continuing operations before income taxes 322 352 475 505
Income tax benefit (expense) (85 ) (90 ) (45 ) (50 )
Adjusted income from continuing operations 237 262 430 455
Net income attributable to noncontrolling interests (116 ) (126 ) (370 ) (380 )
Adjusted net income from continuing operations attributable to common shareholders $ 121
$ 136
$ 60
$ 75
Basic weighted average shares outstanding (in millions) 101 101 101 101
Fully diluted weighted average shares outstanding (in millions) 101 101 101 101
Diluted earnings (loss) per share from continuing operations $ 1.01 $ 1.06 $ (3.68 ) $ (3.63 )
Adjusted diluted earnings (loss) per share from continuing operations $ 1.20 $ 1.35 $ 0.59 $ 0.74
(1) The Company does not forecast impairment and restructuring charges, acquisition-related costs and litigation costs and settlements and gains on
sales, consolidation and deconsolidation of facilities because the Company does not believe that it can forecast these items with sufficient accuracy
since some of these items are indeterminable at the time the Company provides its financial Outlook.
(2)
In conjunction with the Company's recently announced $150 million cost reduction initiative, the Company expects to recognize a pre-tax restructuring charge of approximately $40 million in the fourth quarter of 2017. Substantially all of these costs relate to employee severance.

25 November 29, 2017
Table #5 – Reconciliation of Outlook Adjusted Free Cash Flow for the Year Ending December 31, 2017
(Dollars in millions) 2017
Low High
Net cash provided by operating activities $ 1,017 $ 1,267
Less: Payments for restructuring charges, acquisition-related costs and
litigation costs and settlements(1)
(103 ) (108 )
Net cash used in operating activities from discontinued operations (5 ) —
Adjusted net cash provided by operating activities – continuing operations
1,125
1,375
Purchases of property and equipment – continuing operations (675 ) (725 )
Adjusted free cash flow – continuing operations(2)
$ 450 $ 650
(1) Company does not forecast impairment and restructuring charges, acquisition-related costs and litigation costs and settlements because the
Company does not believe that it can forecast these items with sufficient accuracy since some of these items may be indeterminable at the time the
Company provides its financial Outlook. In conjunction with the Company's recently announced $150 million cost reduction initiative, the Company
expects to recognize payments of approximately $15 million to $20 million in the fourth quarter of 2017. Substantially all of these payments relate to
employee severance.
(2) The Company's definition of Adjusted Free Cash Flow does not include other important uses of cash including (1) cash used to purchase
businesses or joint venture interests, or (2) any items that are classified as Cash Flows From Financing Activities on the Company's Consolidated
Statement of Cash Flows, including items such as (i) cash used to repay borrowings, (ii) distributions paid to noncontrolling interests, or (iii)
payments under the Put/Call Agreement for USPI redeemable noncontrolling interests, which are recorded on the Statement of Cash Flows as the
purchase of noncontrolling interests.
