bank of america merrill lynch global metals, mining & … of america merrill lynch global...
TRANSCRIPT

Bank of America Merrill LynchGlobal Metals, Mining & Steel Conference13-15 May 2014Fontainebleau Miami Beach

Disclaimer
The information presented in this presentation is of a general nature and the forward looking information, opinionsand beliefs of the Company and its affiliates are based on various market related assumptions. Changes in marketcircumstances after the production of the information may impact on the accuracy thereof. No assurance cantherefore be given as to the accuracy of any information after publication.
Before relying on the information, investors or potential investors should carefully evaluate the accuracy,completeness and relevance of the information and should preferably obtain professional relevant advice.
The Company, its directors, officers, managers or employees, advisers or representatives accept no responsibility orliability whatsoever for any loss howsoever arising from any use of this presentation or its contents or otherwisearising in connection with this presentation.
This presentation also includes market share and industry data obtained by the Company from industry publicationsand surveys and the Company does not have access to the facts and assumptions underlying the numerical data,market data and other information extracted from publicly available sources. As a result, the Company is unable toverify such numerical data, market data and other information. The Company assumes no responsibility for thecorrectness of any market share or industry data included in the materials and presentation.
2

Content
• Operational excellence
• Flexibility
• Organic growth
• Value enhancing opportunities
1. Overview of RBPlat
2. Growing organically - Styldrift
3. The industry landscape
4. RBPlat’s competitive position
5. Outlook
RBPlat
3

RBPLAT OVERVIEW
RESOURCESOPERATIONSPROJECTSSTUDIES
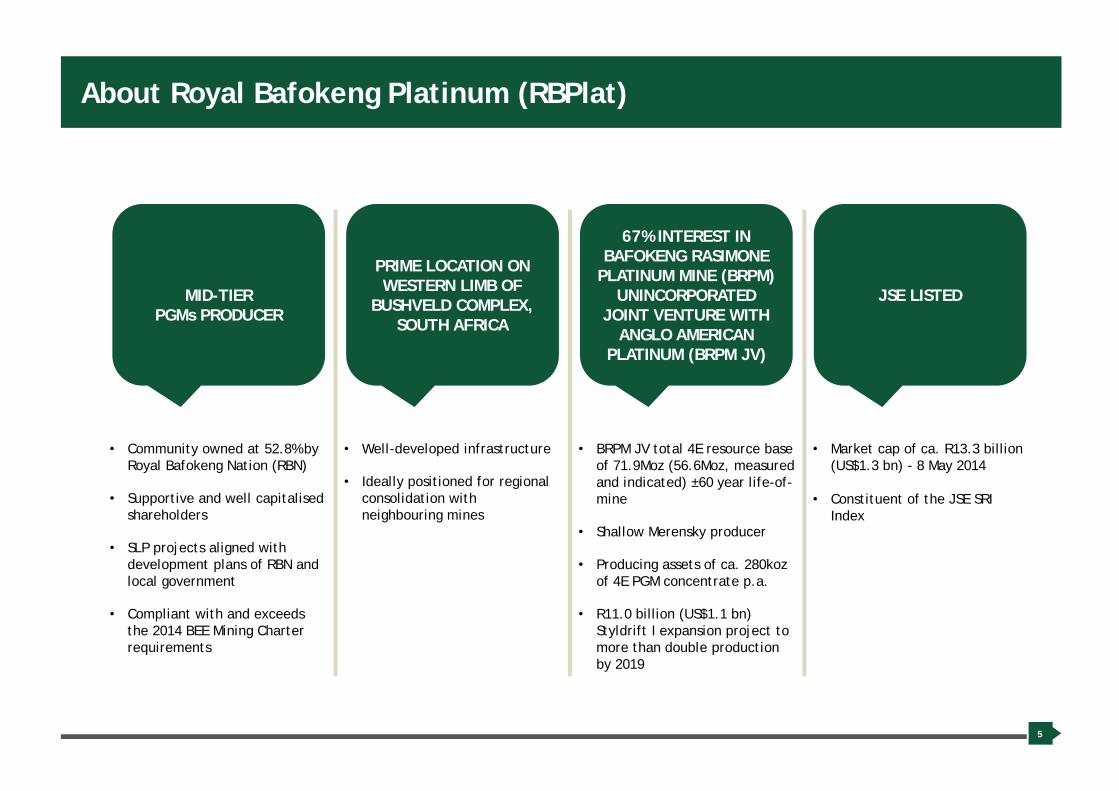
About Royal Bafokeng Platinum (RBPlat)
5
• Community owned at 52.8% by Royal Bafokeng Nation (RBN)
• Supportive and well capitalised shareholders
• SLP projects aligned withdevelopment plans of RBN and local government
• Compliant with and exceeds the 2014 BEE Mining Charter requirements
• Well-developed infrastructure
• Ideally positioned for regionalconsolidation withneighbouring mines
• BRPM JV total 4E resource base of 71.9Moz (56.6Moz, measured and indicated) ±60 year life-of-mine
• Shallow Merensky producer
• Producing assets of ca. 280koz of 4E PGM concentrate p.a.
• R11.0 billion (US$1.1 bn)Styldrift I expansion project to more than double productionby 2019
• Market cap of ca. R13.3 billion (US$1.3 bn) - 8 May 2014
• Constituent of the JSE SRI Index
MID-TIERPGMs PRODUCER
PRIME LOCATION ONWESTERN LIMB OF
BUSHVELD COMPLEX,SOUTH AFRICA
67% INTEREST INBAFOKENG RASIMONE
PLATINUM MINE (BRPM)UNINCORPORATED
JOINT VENTURE WITH ANGLO AMERICAN
PLATINUM (BRPM JV)
JSE LISTED

Quality resource with attractive prill splits
6
Description100% Inclusive Resource RBPlat 67%
Mt 4E g/t 4E Moz Mt 4E g/t 4E Moz
BRPM
Merensky
Measured 14.44 7.61 3.53 9.68 7.61 2.37
Indicated 7.62 6.97 1.71 5.11 6.97 1.14
Inferred 7.81 8.05 2.02 5.23 8.05 1.36
Merensky Total 29.88 7.56 7.26 20.02 7.56 4.87
UG2
Measured 43.38 5.40 7.54 29.07 5.40 5.05
Indicated 16.39 4.80 2.53 10.98 4.80 1.69
Inferred 10.91 4.67 1.64 7.31 4.67 1.10
UG2 Total 70.68 5.15 11.70 47.36 5.15 7.84
Total BRPM 100.56 5.87 18.97 67.38 5.87 12.71
Styldrift
Merensky
Measured 56.67 7.48 13.79 37.97 7.48 9.14
Indicated 51.00 6.98 11.47 34.17 6.98 7.67
Inferred 23.28 7.72 5.79 15.60 7.72 3.87
Merensky Total 130.94 7.33 31.05 87.73 7.33 20.68
UG2
Measured 30.98 5.19 5.54 20.76 5.19 3.47
Indicated 66.18 5.19 11.23 44.34 5.19 7.39
Inferred 34.04 5.39 5.43 22.81 5.39 3.95
UG2 Total 131.20 5.24 22.20 87.90 5.24 14.81
Total Styldrift 262.14 6.28 53.25 175.63 6.28 35.49
BRPM JV
Measured 145.48 6.39 29.88 97.47 6.39 20.02
Indicated 141.19 5.89 26.73 94.59 5.89 17.91
Inferred 76.04 6.27 15.33 50.95 6.27 10.27
Total BRPM JV 362.70 6.17 71.94 243.01 6.17 48.20
58.82%29.59%
11.03% 0.56%
UG2
Pt%
Pd%
Rh%
Au%
64.61%
26.84%
4.32% 4.23%
Merensky
Pt%
Pd%
Rh%
Au%

BRPM JV – Post Styldrift II
Quality high grade resource
7
-50
0
50
100
150
200
250
300
2 3 4 5 6 7
Reso
urce
size
, (M
oz4E
)
In-situ grade, 4E PGM g/t
Resources versus production Bubble size = 4E PGM production
Lonmin
Amandelbult
BokoniILA
RPM
Zimplats
ZondereindeMarula
ModikwaBRPM JV:71.9Moz6.17 g/t (4E)
BRPM JV – Pre Styldrift
BRPM JV – Post Styldrift ISource: SFA (Oxford), company reports

BRPM – Operational excellence and flexibility
16 years of operation
˃ Well-understood, defined geology
˃ Well-established, flexible mining platform• Merensky biased
• Ore reserves developed well in advance
• Appropriate spare panel flexibility (1.5)
• Access to UG2 established
˃ Experienced management team
˃ Full mining and concentrating infrastructure on BRPM site (200ktpm)
˃ Shallow depth - twin decline shaft complex at 500m
8
South shaft
North shaftConcentrator plant

STYLDRIFT I PROJECT
GROWING ORGANICALLY

Styldrift I project on track
Highlights
> A 230ktpm mechanised Merensky mine
> Steady state in 3Q 2018
> Overall progress 44.67% complete
> Project activities in 2014
> Sink Main and Service shaft to shaft bottom (758m)
> Lateral development – 1.5km
> Overland conveyor construction
> BRPM plant 250ktpm upgrade
> Capital budget of R11.014 billion, R2.753 billion capital spent to date
> Remain confident about further savings at project completion
0
2 000
4 000
6 000
8 000
10 000
12 000
0
500
1 000
1 500
2 000
2 500
3 000
3 500
2008 2009 2010 2011 2012 2013 2014 2015 2016 2017 2018 2019
R m
illio
n
R m
illio
n
Optimisation Revised processing strategy Cumulative revised processing strategy Cumulative Optimisation
Styldrift cashflow
11 014
11 386
10
Aerial view of the Styldrift I Project

STYLDRIFT II STUDY PROJECT
FUTURE GROWTH

Styldrift II study work progressing well
Key facts
> Resource area ± 24 million m2
> 40% of BRPM JV resource base
> Average depth 1 150m at average 90 dip
> Underlain by the Swartklip Facies , high grades, consistent mineralised envelope (104cm)
> Currently in pre-feasibility study
Pre-feasibility study focus
> Commenced in 2013, planned completion 4Q 2014
> Four options with a positive business case taken forward for further technical evaluation
> Primary focus areas• Primary access strategies and shaft location
• Production rates (200ktpm – 240ktpm)
• Mining method selection
• Engineering design
• Synergies with neighbouring properties
Exploration drilling
> Total exploration drilling at 84 holes (110 000m)• 313 Merensky intersections
• 270 UG2 intersections
• All intersections show a high degree of correlation with previous geological modelling
Approximate SD II #
Position
SD I # Position
12

Further growth optionality
13
Implementation of Styldrift I> Pay dividends post full ramp up (2018)
> Opportunity for UG2 dependant on market conditions
Develop Styldrift II> High quality Merensky orebody
> Explore synergies with other parties to develop
Value enhancing opportunities
> Regional • Consolidation• Royalty agreements
> Mergers and acquisitions • Not limited to region

THE INDUSTRY LANDSCAPE
14

Industry facing short-term headwinds
˃ Challenging macro economic conditions have resulted in constrained balance sheets
• Costs have tripled since 2003 - (ca. 14% p.a. since 2007)
• Producers forced to cut back capital expenditure
• Mine closures in the past two years
˃ Section 54 stoppages
˃ Instability in the labour force – unprecedented levels of industrial action
˃ Shortage of water and power as well as escalating power costs
˃ Threats to mining licences being revoked due to non-compliance with Mining Charter requirements
• 26% BEE ownership still a challenge for some companies
• Social and labour plan commitments
˃ Platinum mining companies have lost ca. 29% or R75.8 billion in market capitalisation during 2013 (Source: PWC SA Mine, 5th edition)
15

Widening disparity between Merensky and UG2 Reef profitability
˃ Majority of mines are getting deeper, industry average depth > 1 000 mbs within 10 years
˃ Reserve depletion from 2015 – project delays
˃ Merensky output and industry average head grades are declining
• 2000: 70% Merensky 30% UG2 ; 2012: 30% Merensky 70% UG2
• Average head grade down 20% since 2004 with UG2 dominance
• Production and productivity on the decline – per ounce produced
˃ Widening disparity between Merensky and UG2 Reef profitability
16

RBPLAT COMPETITIVELY POSITIONED
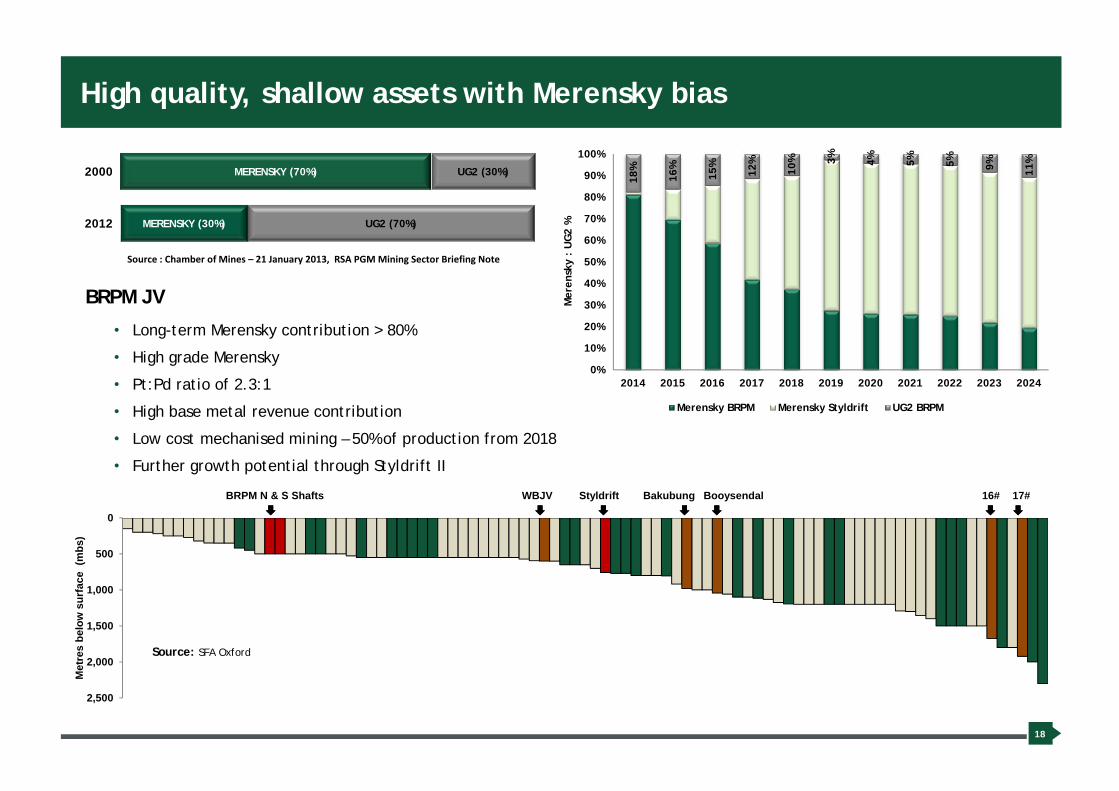
High quality, shallow assets with Merensky bias
UG2 (30%)MERENSKY (70%)2000
UG2 (70%)MERENSKY (30%)2012
Source : Chamber of Mines – 21 January 2013, RSA PGM Mining Sector Briefing Note
BRPM JV
• Long-term Merensky contribution > 80%
• High grade Merensky
• Pt:Pd ratio of 2.3:1
• High base metal revenue contribution
• Low cost mechanised mining – 50% of production from 2018
• Further growth potential through Styldrift II
Source: SFA Oxford
18%
16%
15%
12%
10% 3% 4% 5% 5% 9% 11%
0%
10%
20%
30%
40%
50%
60%
70%
80%
90%
100%
2014 2015 2016 2017 2018 2019 2020 2021 2022 2023 2024
Mer
ensk
y :
UG
2 %
Merensky BRPM Merensky Styldrift UG2 BRPM
18
0
500
1,000
1,500
2,000
2,500
Met
res
belo
w s
urfa
ce (
mbs
)
BRPM N & S Shafts Styldrift Bakubung Booysendal 16# 17#WBJV

Base metals in Merensky provide margins
Note: MSZ – Main Sulphide Zone
Source: SFA Oxford
19
0
200
400
600
800
1,000
1,200
1,400
1,600
1,800
Producer revenues (Southern Africa), 2012 ($/4E oz)
Base metal revenue PGM (6E) revenue
Production (4E oz)
75-100% UG2[2.4 moz 4E]
100% MER or MSZ[1.8 moz 4E]
Mixed reef or UG2 with high Pt:Pd ratio
[3.6 moz 4E]
Total revenues (PGMs + by-products)average $1,282/4E oz
Total revenues (PGMs + by-products)average $1,368/4E oz
Total revenues (PGMs + by-products)average $1,450/4E oz
Zimbabwean operations
BR
PM

Mog
alak
wen
a (P
PR
ust)
Zim
plat
s
Oth
ers
BR
PM
Mot
otol
oB
ooys
enda
lM
imos
a
Bat
hope
le
Kro
onda
l
Two
Riv
ers
Mod
ikw
aS
iphu
mel
ele
Bok
oni (
Lebo
wa)
Tum
ela
Dis
haba
Mar
ikan
a (L
onm
in)
Mar
ula
Nor
tham
(Zon
dere
inde
)
Them
bela
ni
Impa
la L
ease
Are
a
Uni
on
Ela
nd P
latin
um
Average Break-Even Price
Platinum Price
0% 10% 20% 30% 40% 50% 60% 70% 80% 90% 100%
0
500
1,000
1,500
2,000
2,500
3,000
Pric
e ($
/oz)
Competitive position on the industry cost curve
J.P. Morgan Cazenove Platinum Industry Break-even Analyser (Cash Cost + Maintenance Capex)
20
Source: J.P. Morgan Estimates – April 2014

Spending to grow
Expansion capital > Styldrift I
- Mining and Infrastructure
- Conveyor belt linking Styldrift to BRPM concentrator (2014/2015)
> BRPM concentrator upgrade to 250ktpm in 2015
> BRPM concentrator 100ktpm module commission in 2017
Replacement capital > Phase III : Expenditure forecast at R200 million p.a. until 2017
SIB capital > Forecast SIB at 8% -9% of operating cost for 2014
2.4
3.1
2.6
1.5
1.0
0.0
0.5
1.0
1.5
2.0
2.5
3.0
2014 2015 2016 2017 2018
R bi
llion
Capex forecast (incl. escalation and contingency)
SIB Replacement Expansion
21

High cash generative operation funding substantial portion of organic growth
22
> In excess of R3 billion of funding currently available to RBPlat comprising :
> Cash on hand
> Revolving credit facility (RCF) of R1 billion unutilized to date
> Successful equity capital raise of R1.5 billion completed
> Further R2.6 - R3 billion of term debt to be raised to replace R1 billion RCF
Capital (Expansion,
Replacement, SIB), 79%
Working capital, 12%
Interest, 9%
Source of funds (2014-2018) Application of funds (2014-2018)
Cash from operations, 46%
Cash resources, 8%
Equity, 17%
Debt, 29%

Strong financial performance
23
Unit 2013 2012 % Change
Average revenue basket price R/ Pt oz 17 927 16 404 9.3%
Operating cash cost R/ Pt oz 11 592 11 775 2%
Operating profit R’m 573.5 305.0 88%
Cash generated by operating activities R’m 907.8 732.6 23.9%
Capital expenditure (100% BRPM JV) R’m 1 059 1 192 11.%
EBITDA margin % 31.0 22.1 40.3%
Net asset value R/share 72.2 70.2 2.8%

OUTLOOK
RBPLAT WELL POSITIONED

Engagement with various stakeholders is key
˃ Safety is paramount
˃ Social partnerships to be strengthened
˃ Regular and meaningful engagement with labour and the communities
˃ Collaboration with other PGM players in order to implement social and labour plan programmes
˃ Producers need to invest in development and flexibility to sustain production
˃ Investment required in finding new ways of doing business
• Mechanisation
• Alternative sources for water and energy
• More efficient extraction and processing technologies to reduce production costs
25
Long-term PGM fundamentals remain strong
˃ South Africa’s PGM supply expected to drop in the short term
˃ Platinum market (excluding investment demand) to remain in balance in the short term while the deficit in the palladium market expected to increase
˃ Introduction of Euro 6 in September 2014 set to lift demand albeit not substantially
˃ Stricter emissions control in China and India will lead to increased PGM demand in the medium to long-term
˃ Growth of European and Chinese platinum recycling expected to lift global recycling rates to 5% p.a.
˃ Palladium demand expected to increase during 2014 with the launch of ABSA’s new palladium ETF
˃ Significant industry production not sustainable at current PGM prices
• Industry needs a minimum rhodium price of $2,000/oz with the increased UG2 production
• However, industry to be wary of pushing consumers (automakers) to look for alternatives
˃ RBPlat well positioned to benefit
• Long-term Merensky biased production with inherent UG2 flexibility
• Timing of Styldrift’s production is opportune 26

Contact detailsLindiwe MontshiwagaeInvestor Relations ManagerRoyal Bafokeng PlatinumThe Pivot, No 1 Monte Casino Boulevard,Block C, Floor 4, Fourways, 2021Tel: +27 (0) 10 590 4517Fax: +27 (0) 86 219 5131Mobile: +27 (0) 82 920 7803Email: [email protected]