bank of america ($bac) stock pitch
TRANSCRIPT
Bank of America ($BAC)Price as of 3/09/16: $13.14 (BUY @ $12.50)
Target Price: $17.50

Agenda- Company overview- Price Target- Investment Thesis- Valuation- Catalysts for growth- Risks- Comparables

Company Overview

Price TargetTangible book value per share = Total tangible assets - intangible assets/total number of shares outstanding
Book Value per share: $22.54
Tangible book value per share: ~ $17

“It’s far better to buy a wonderful company at a fair price, than to buy a fair company at a wonderful price.” - Warren Buffet
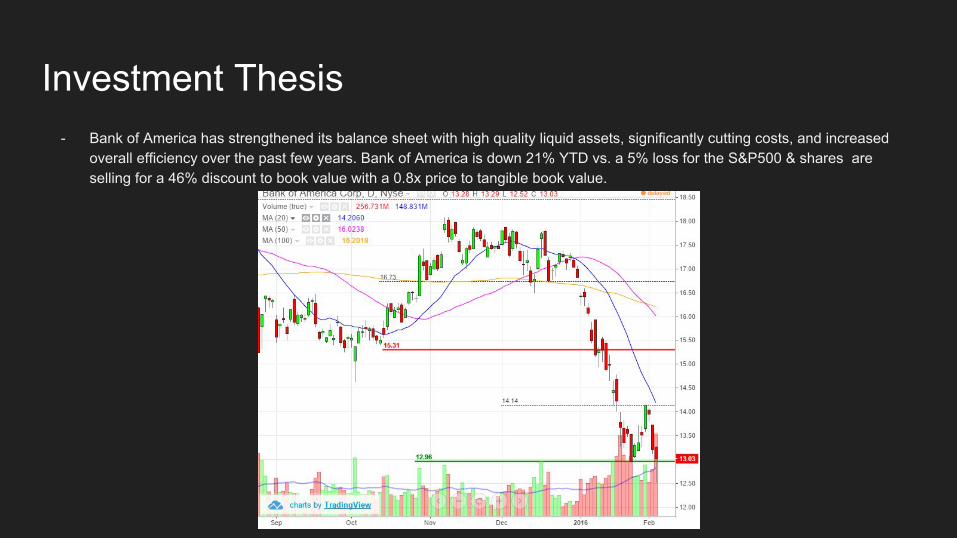
Investment Thesis- Bank of America has strengthened its balance sheet with high quality liquid assets, significantly cutting costs, and increased
overall efficiency over the past few years. Bank of America is down 21% YTD vs. a 5% loss for the S&P500 & shares are selling for a 46% discount to book value with a 0.8x price to tangible book value.

Valuation
Market Cap: $130BP/E:8.4 vs. industry avg: 15.84ROE: 6.97% vs. industry avg: 9.97%P/TBV: 0.8 vs. industry avg: 1.07 compared to WFC 1.38 and JPM 1.17Efficiency Ratio:67.1%
- most efficient banks are under 60%- decreased 4% in 4Q15 vs 4Q14 so there has been improvement
loan deposit ratio: 75.04%LCR: +$500B in liquid assetsCET1 ratio: 11.3%, on track for 11-12% or more for next 2017 requirement (Basel iii = > 6% to be considered ‘well capitalized’)NIM: 2.2%Price to intrinsic value: Projected FCF is ranked higher than 83% of all global banksTexas Ratio: 5.03%, dramatic decrease from 9.45% a year prior (This indicates that the balance sheet and financial strength for Bank of America has improved dramatically in recent periods)

Basel iii Common Equity Tier 1 requirements- “well capitalized” requirement - 6 %- Big banks - 10%- $500B in liquid assets

Catalysts for Growth
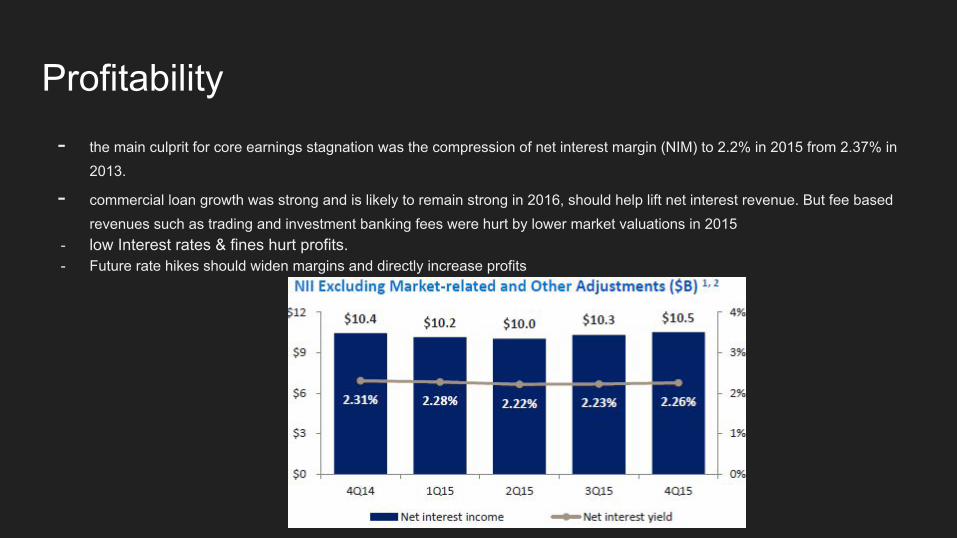
Profitability- the main culprit for core earnings stagnation was the compression of net interest margin (NIM) to 2.2% in 2015 from 2.37% in
2013.
- commercial loan growth was strong and is likely to remain strong in 2016, should help lift net interest revenue. But fee based revenues such as trading and investment banking fees were hurt by lower market valuations in 2015
- low Interest rates & fines hurt profits. - Future rate hikes should widen margins and directly increase profits
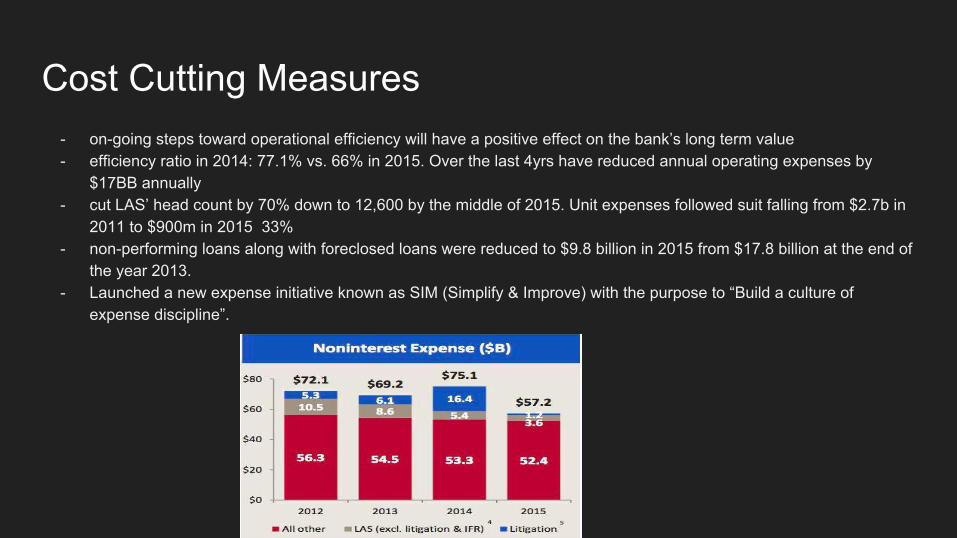
Cost Cutting Measures- on-going steps toward operational efficiency will have a positive effect on the bank’s long term value- efficiency ratio in 2014: 77.1% vs. 66% in 2015. Over the last 4yrs have reduced annual operating expenses by
$17BB annually- cut LAS’ head count by 70% down to 12,600 by the middle of 2015. Unit expenses followed suit falling from $2.7b in
2011 to $900m in 2015 33%- non-performing loans along with foreclosed loans were reduced to $9.8 billion in 2015 from $17.8 billion at the end of
the year 2013. - Launched a new expense initiative known as SIM (Simplify & Improve) with the purpose to “Build a culture of
expense discipline”.

Fines & Fees
Fines & fees- took majority of the penalties issued after the financial crisis - Over $90B in total fines and fees from financial crisis
- The acquisition of Countrywide and Merrill Lynch greatly affected BofA as they were forced to take on a lot of bad debt as well as punishments imposed
on both firms- As of 2016, 99% of litigations are behind them, leaving much more room to focus
on growth and improvement moving forward

PerformanceNet Income YoY: $15.9B (+30% increase from previous years $4.8B)
- Full yr revenues slipped 2% YoY but commercial loans increased by 4% in the 4th quarter. which drove 2% increase in net interest margin and better trading revenue than the same period in 2014
- Q4 reported sharp reduction in trading and mortgage - related revenue, even as strong loan growth and a jump in card activity partially mitigated the impact on total revenues
- LCR or Liquidity Coverage Ratio was a key factor in NIM compression last year. The bank continued to believe that managing costs would be crucial while continuing to invest in their business even while market conditions are difficult.

PerformanceNet Income YoY: $15.9B (+30% increase from previous years $4.8B)
a. Consumer Banking- consumer banking up 9% as client activity increased- average deposits grew 8%- total U.S. credit card spending up 5%
b. Global Banking & Markets- Sales & Trading revenue was lower overall. However improvement was shown in the last 3mo with FICC leading the way.- Positive reflection across products such as rates and credit-related products.

Risks & Concerns (Oil & Gas Exposure) Exposure Risks- 2.4% energy exposure of total loans, with a sum total of 21.3BB funded in outstanding debt in oil & gas. Bofa has $500MM of loan loss reserves allocated to that debt - compared to citigroup 3.3% and jpm 1.9%- estimates $700MM of loan losses if oil prices stay at the $30 level for 9mo

Risks & Concerns (Outstanding Derivatives)Total credit exposure to capital as a percentage or derivatives outstanding (derivative contracts that could potentially default, resulting in money lost), is the second lowest next to Wells Fargo who is known for generally being a more conservative bank.- China exposure at $10.5B
- relatively small compared to $181B in Tier 1 capital

Comparables
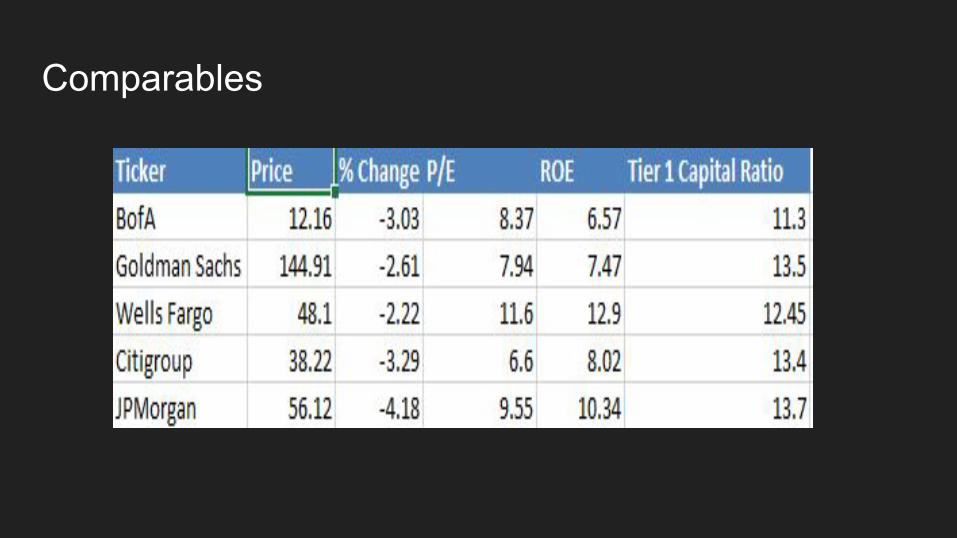
Comparables