bank norwegian
TRANSCRIPT

Bank Norwegian
Investor presentation
December 2020
2
Disclaimer
This Company Presentation has been produced by Norwegian Finans Holding ASA (the “Company” or “NOFI”) exclusively for information purposes and to be used at the presentation to investors. This document contains certain forward-looking statements relating to the business, financial performance and results of the Company and/or the industry in which it operates. Forward-looking statements concern future circumstances and results and other statements that are not historical facts, sometimes identified by the words “believes”, “expects”, “predicts”, “intends”, “projects”, “plans”, “estimates”, “aims”, “foresees”, “anticipates”, “targets”, and similar expressions. The forward-looking statements, contained in this Company Presentation, including assumptions, opinions and views of the Company or cited from third party sources are solely opinions and forecasts which are uncertain and subject to risks. A multitude of factors can cause actual events to differ significantly from any anticipated development. The Company nor any parent or any suchperson’s officers or employees guarantees that the assumptions underlying such forward-looking statements are free from errors nor does any of the foregoing accept any responsibility for the future accuracy of the opinions expressed in this Company Presentation or the actual occurrence of the forecasted developments.
No representation or warranty (express or implied) is made as to, and no reliance should be placed on, any information, including projections, estimates, targets and opinions, contained herein, and no liability whatsoever is accepted as to any errors, omissions or misstatements contained herein, and, accordingly, the Company or any parent or any such person’s officers or employees accepts any liability whatsoever arising directly or indirectly from the use of this document.
By attending this Company Presentation you acknowledge that you will be solely responsible for your own assessment of the marketand the market position of the Company and that you will conduct your own analysis and be solely responsible for forming your own opinion of the potential future performance of the Company’s business.
This Company Presentation contains financial figures from Norwegian Finans Holding Group (consolidated) and its entities. Presented figures and tables are labeled accordingly.

3
Snapshot of Bank Norwegian
Why invest in Bank Norwegian?
Appendix
Agenda

4
▪ Established November 2007
▪ Offers unsecured instalment loans, credit cards and savings
deposits in the Nordic consumer market
▪ Present in all four Nordic countries
– Expanded into Sweden in 2013 and Denmark & Finland
in 2015
– Further European expansion underway
▪ 91 FTEs, all based at the head office in Fornebu, Norway
▪ Listed on the Oslo Stock Exchange since June 2016
– Ticker: NOFI
Customers across Nordics 1.75m
Gross lending BNOK 44.8
Deposits BNOK 43.9
Net income (LTM) BNOK 2.0
Return on equity (LTM) 21.0%
CET1 ratio 21.4%
Rating BBB by S&P (Stable)
Q3 2020
Bank Norwegian –A leading Nordic consumer finance bank
Consumer lending72 %
Credit card lending28 % Total
BNOK 44.8
Norway39 %
Sweden18 %
Denmark14 %
Finland29 %
Total
BNOK 44.8
Gross lending by type
Gross lending by geography
5
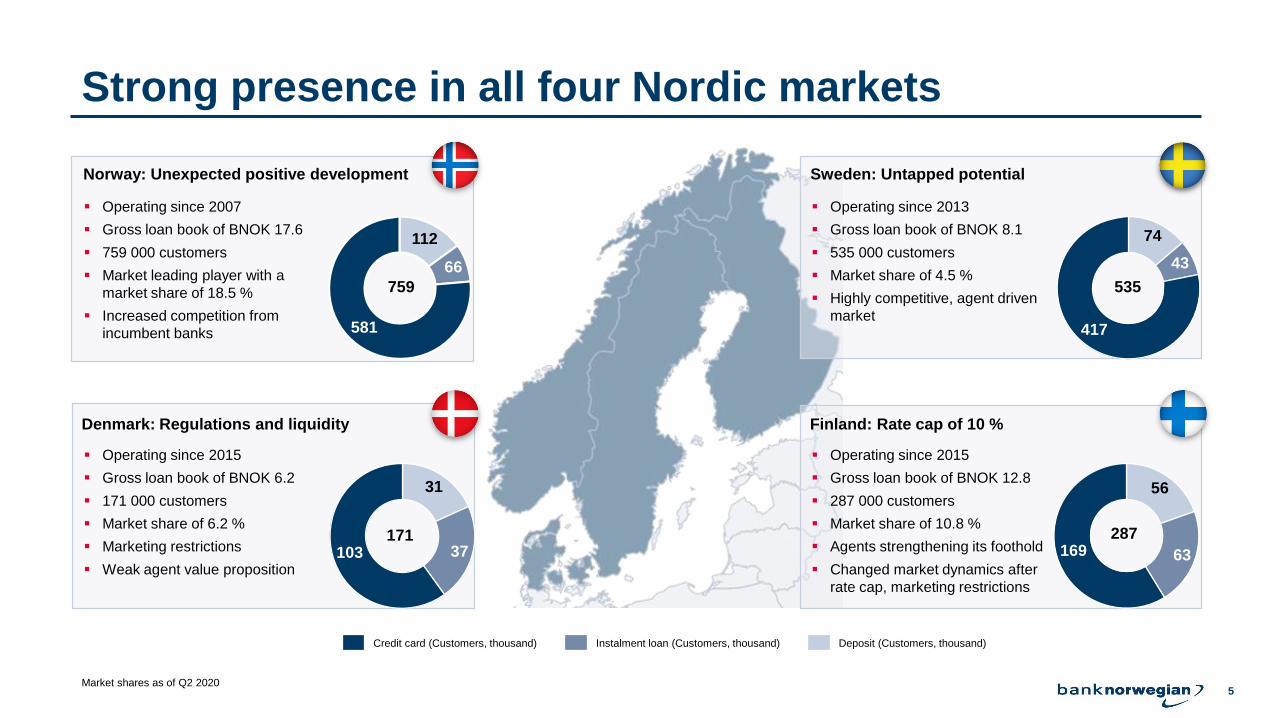
Strong presence in all four Nordic markets
Norway: Unexpected positive development Sweden: Untapped potential
Denmark: Regulations and liquidity Finland: Rate cap of 10 %
▪ Operating since 2007
▪ Gross loan book of BNOK 17.6
▪ 759 000 customers
▪ Market leading player with a
market share of 18.5 %
▪ Increased competition from
incumbent banks
▪ Operating since 2013
▪ Gross loan book of BNOK 8.1
▪ 535 000 customers
▪ Market share of 4.5 %
▪ Highly competitive, agent driven
market
▪ Operating since 2015
▪ Gross loan book of BNOK 6.2
▪ 171 000 customers
▪ Market share of 6.2 %
▪ Marketing restrictions
▪ Weak agent value proposition
▪ Operating since 2015
▪ Gross loan book of BNOK 12.8
▪ 287 000 customers
▪ Market share of 10.8 %
▪ Agents strengthening its foothold
▪ Changed market dynamics after
rate cap, marketing restrictions
759 535
287171
Credit card (Customers, thousand) Deposit (Customers, thousand)Instalment loan (Customers, thousand)
112
66
581 417
74
43
31
37103
56
63169
Market shares as of Q2 2020

6
A typical customer of Bank Norwegian
Urban areas, age between 30 – 60 with a yearly income of 400’
Age Income profile (NOK)
Age Income profile (NOK)
Age Income profile (NOK)
Age Income profile (NOK)
1. Viken 24.61 %2. Oslo 13.94 %3. Vestland 12.03 %4. Rogaland 8.62 %5. Telemark og Vestfold 7.38 %
0%
5%
10%
15%
20%
25%
30%
20-29 30-39 40-49 50-59 60-69 70-
0%
5%
10%
15%
20%
25%
100' 200' 300' 400' 500' 600' 700' 800' 900' 1000'
Urban areas, age between 30 – 60 with a yearly income of 300’
Urban areas, age between 40 – 60 with a yearly income of 400’ Urban areas, age between 30 – 60 with a yearly income of 300’
0%
10%
20%
30%
20-29 30-39 40-49 50-59 60-69 70-
0%
5%
10%
15%
20%
25%
30%
35%
40%
100' 200' 300' 400' 500' 600' 700' 800' 900' 1000'
1. Hovedstaden 35.55 %2. Sjælland 20.58 %3. Midtjylland 17.38 %4. Syddanmark 16.95 %5. Nordjylland 8.29 %
1. Stockholm 30.46 %2. Skåne 14.99 %3. Västra Götaland 14.32 %4. Uppsala 3.93 %5. Östergötland 3.03 %
0%
10%
20%
30%
40%
20-29 30-39 40-49 50-59 60-69 70-
0%
5%
10%
15%
20%
25%
30%
100' 200' 300' 400' 500' 600' 700' 800' 900' 1000'
0%
10%
20%
30%
20-29 30-39 40-49 50-59 60-69 70-
1. Nyland 38.60 %2. Birkaland 8.74 %3. Egentliga Finland 8.60 %4. Norra Österbotten 6.14 %5. Mellersta Finland 3.97 %
0%
5%
10%
15%
20%
25%
30%
100' 200' 300' 400' 500' 600' 700' 800' 900' 1000'
7
Snapshot of Bank Norwegian
Why invest in Bank Norwegian?
Appendix
Agenda

8
Bank Norwegian offers a compelling combination of growth, high ROE and capital return
Operating in a stable and resilient macro environment
Proven lean and scalable operating model with best-in-class efficiency
Strong capital and liquidity position with significant organic capital build driven by consistent, high ROE
Historic track record of attractive growth in assets translating into topline growth and profitability
Robust and prudent risk management
1
2
5
3
4
Considerable further growth potential from penetration of existing Nordic markets as well as targeted international expansion
6

9
Resilient macro economic backdrop despite Covid-19
1
Annual GDP growth1) Cumulative GDP growth1)
Unemployment1) Net government debt (% of GDP)2)
Source: 1) Moody’s Analytics, 2) IMF
2) 2)
2)

10
Well proven lean and scalable model...
One location Focused product portfolio
Born digital
~100 employees across
14 nationalities serving
~1.75 million customers
Focus and
simplicity
Digital on the inside
~30% of employees working
in IT and analytics enable
rapid adoption
Deep knowledge and
inspiring tasks drive
employee engagement
Digital on the outside
Credit cards
Personal loans
Deposits
2

11
…creates best-in-class operating efficiency
▪ Flexible cost base across the organization
▪ Higher digital marketing spend in Norway and
Denmark in Q3
▪ Increase in personnel cost due to seasonality with
low costs in Q2
▪ Lower credit card related IT costs
▪ Cost/income at 25%
Quarterly operating expenses, MNOK
23%24% 24% 19%
25%
0%
10%
20%
30%
40%
50%
350
0
250
50
300
400
100
150
200
18
209
28
25
4845
25
289
359
17
Q3 19
28
56
20
Q4 19 Q1 20
17
230
31
57
24
172
24
22
223
Q3 20Q2 20
207
32
23
48
23
345
324335
Marketing DepreciationOtherPersonnel IT Cost/income (rhs)
2

12
Improving asset quality results in increasing risk-adjusted yield…
Improving stage 3 coverage ratio
▪ Strong loan loss allowance indicates balance
sheet strength and conservative provisioning
policy
▪ Coverage ratio now above pre-pandemic
levels
Loan loss provisions normalizing
▪ Loan loss provision reducing from peak and now
below prior year levels
▪ Optimistic macro scenario still excluded from
provision calculation – net negative effect of
MNOK 62.1 in Q3
Additional / extraordinary provision
Increased risk-adjusted yield
▪ Resilient loan yields with credit card loan yield
normalized in Q3
▪ Lower average funding cost during the period
due to deposit interest rate reductions and
lower average debt securities cost
Loan loss allowance coverage ratio stage 3
0%
2%
4%
6%
8%
10%
12%
14%
16%
Q4 19 Q2 20
14.6%
1.3%
10.5%
1.3%
Q3 19
10.3%
14.6% 14.7%
8.7%
1.4%
Q1 20
14.8%
10.4%
1.3%
14.5%
10.8%
1.2%
Q3 20
Total loan yield
Risk-adjusted total loan yield
Total funding cost
30%
35%
40%
45%
Q2 20
40.0%
Q1 20
38.6%
Q3 19
35.9%
Q4 19
37.7%
40.4%
Q3 20Q1 20
3.9% 3.4%
Q3 20Q3 19
3.9%
2.0%
3.5%2.7%
Q4 19
0.5%
Q2 20
0.6%
3

13
…through continuously improved automated credit approval process supported by manual underwriting…
Policy
Scorecard
Budget model
Price and
conditionsManual underwriting
Loan
paid out
≈ 70%
Automatic decline> 20%
We turn down / Turn us down < 10%
Loans paid out
Automated process Individual underwriter
Application – credit approval process
• Request additional information
• Documentation control (salary, tax records)
• Final decision for approval or rejection of loan
• Main decline reasons underreporting of debt or overreporting of income
• Internal history
• Payment remarks
• Existing debt
• Age etc.
• Proprietary scorecards / PD models based on own, historic data
• Credit cards important source for data
• Data and model quality significantly improving over time
• Affordability
• Household debt service, income, costs, maintenance, child care etc.
• Based on score and affordability
• Conditional offer (to appr. 30 % applicants)
• ID-Control
3
AML, PEP, Fraud-screening

14
…and portfolios migrating to lower risk
Higher risk interest band for personal loans have declined as a share of origination
and loan book
Originated loans by risk interest rate band Loan book by risk interest rate band
Personal loans vintages show improved credit quality
Default rate by vintage
15%23%
37%
42%
48%
35%
2018 2020
12%
40%
38%
36%
50%
24%
2018 2019 2020
Lower risk interest band Higher risk interest bandMedium risk interest band
2 4 6 8 10 12 14 16 18 20 22 24
2018
2019
2020
2019
3
Months

15
Attractive growth profile supported by successful geographic expansion…
(000’s) BNOK BNOKCustomers Loans Deposits
0100200300400500600700800900
1 0001 1001 2001 3001 4001 5001 6001 7001 8001 900
Q311
Q312
Q313
Q314
Q315
Q316
Q317
Q318
Q319
Q320
02468
101214161820222426283032343638404244464850
Q311
Q312
Q313
Q314
Q315
Q316
Q317
Q318
Q319
Q320
02468
1012141618202224262830323436384042444648
Q311
Q312
Q313
Q314
Q315
Q316
Q317
Q318
Q319
Q320
1.75 million customers – BNOK 44.8 loans – Cost/Income at 25%
4

16
… translating into consistent topline growth which together with operating efficiency drives significant increase in earnings
Operating efficiency Earnings
MNOKMNOK
Total income
MNOK
4

17
0%
2%
4%
6%
8%
10%
12%
14%
16%
18%
20%
22%
24%
26%
28%
30%
2.1%
Q1 20
20.2%
1.6%
Q3 19
21.2% 0.5%
1.6%
17.5%
Q4 19
19.6%
1.25%
1.5%
2.0%
14.5%
20.7%
2.1%
1.5%
24.0%
Q2 20
21.4%
Q3 20
1.5%
CET1 requirement
25.0%
23.2%24.3%
14.8%
25.0%
14.1% 14.3% 13.9%
5.8%
3.0%
2.5%
4.5%
2.1%2.1%
Strong capital position with further excess capital accumulated during 2020
▪ 21.4% CET 1 capital ratio compared with
16.3% minimum requirement and 17.5% target
▪ CET 1 ratio includes 209 bps set aside for
dividends, according to upper-end of dividend
policy payout range
▪ Significant loss absorption capacity through
high internal capital generation and high capital
buffers
Capital ratios
* Current countercyclical buffers as of 30.09.2020: Norway 1.0% (2.5%), Sweden 0.0% (2.5%), Denmark 0.0% (1.0%) and Finland 0.0% (0.0%). Numbers in brackets are prior to Covid-19.
Common equity tier 1
Capital Conservation BufferTier 1 capital
Total capital Systemic Risk Buffer
Pillar 1 Minimum Requirement
Pillar 2 Guidance (P2G) and management buffer
Countercyclical Buffer *
Pillar 2 Requirement (P2R)
Leverage ratio
5

18
Highly attractive ROE despite strong capitalization levels
▪ Return on equity impacted by capital
requirements, surplus capital vs
requirements and dividends
according to upper-end of dividend
policy payout range
▪ Adjustment for overcapitalization
compared to CET 1 requirement (incl.
P2G and management buffer)
increases ROE by 3.7 pp
▪ Adjustment for dividend set aside
(assumed dividend payment)
increases ROE further by 2.2 pp
0%
5%
10%
15%
20%
25%
30%
35%
Q4 19 Q3 20Q1 20 Q2 20
15.7%
22.8%
25.6% 25.6%
24.0%
17.5% 17.8%
28.0%
29.5%
19.6%
23.4%
25.5%+3.7pp
+2.2pp
Adjusted ROE - 17.5 % CET1 and paid dividendsReported ROE Adjusted ROE - 17.5 % CET1
5

19
Resilient and highly liquid balance sheet with deposits as the main funding source
0
20
30
40
10
60
70
50
0.6
13.6
29.8
13.9
1.7
11.3
13.4
0.5
12.8
Q3 19
2.2
30.3
0.5
Q2 20Q4 19
3.1 3.4
13.8
33.4
0.5
Q1 20
16.8
31.9
2.5
21.1
12.6
32.3
0.6
Q3 20
14.7
Assets, BNOK
Liabilities and equity, BNOK
▪ Consistent balance sheet growth over the past five quarters
▪ Positive loan growth of MNOK 124, with growth in 3 out of 4 countries
▪ Currency adjusted loan growth was negative with MNOK 286 compared
with negative MNOK 1 276 in Q2
▪ Deposits increased MNOK 2 789. Adjusted for currency effects deposits
increased MNOK 2 439
▪ Liquid assets comprise 36.7% of total assets – significantly increased
due to strong deposit growth
Gross instalment loans 1
Securities
Cash and equivalents
Gross credit cards loans
Intangibles and other assets
Bank Norwegian AS1 Includes sales financing and other loans
20
30
60
50
70
0
10
40
0.8
Q3 20
39.2
3.51.3 2.9
8.8
Q3 19
40.1
6.86.5
43.9
0.89.3
Q4 19
39.6
1.1
Q1 20
0.910.29.6
2.1
41.1
6.7
0.9
Q2 20
6.62.10.9
10.7
Deposits from customers
Other liabilities
Debt securites issued
Equity and tier 1 capital
Sub debt
5

20
Significant room to continue Nordic growth
Nordic unsecured lending market
size is significant
Bank Norwegian has steadily
been gaining market share
492BNOK
Continued market share growth
through focused strategy
18.5%
4.5%6.2%
10.8%
% Bank Norwegian market share
Address untapped potential through
selective expansion of distribution
network
Share of total Nordic unsecured market
Evaluate services for the credit card to
increase customer value
Develop our digital bank and services
stand-alone and through partnerships
20192016 2017 2018 2020Q2
7.2%
8.4%
5.3%
8.9%9.1%
6

21
Ready for geographic expansion
▪ Improved governance and risk
models
▪ Strong capital position
▪ Proven expansion model
▪ Challenger in the Norwegian
market
▪ Digital pioneer
▪ Risk-based pricing
2007-2013
Establish Norwegian operation
2013-2020
Expansion to Sweden, Denmark
and Finland
2021-
Timing is right for European expansion
▪ Utilized Norwegian knowledge and
systems to scale profitably
▪ Low-cost expansion with low risk
Norway Nordic Europe
6

22
European expansion
Organic expansion to countries
with a good fit for our business
model
Market size and product mix
Digital adoption
Customer data availability
Well functioning recovery
environment
▪ Large markets with a good fit for
Bank Norwegian's strategy
▪ Address attractive market
segments
− Digital customers
− Customers in urban areas
▪ Limited market share required to
build presence similar to current
operations in e.g. Finland
▪ Effects of the pandemic on
individual countries will be
continuously assessed prior to
launch in 2H 2021
Two markets currently prioritized from shortlistLow-risk expansion model
▪ Industry-leading cost ratio
from highly scalable cost-
efficient operating model
▪ Truly digital operations
enabling analytics excellence
▪ Proven track record of low-
cost expansion and value
creation from previous
successful entries
Expansion criteria
Spain
Germany
Austria
Netherlands
6

23
Outlook
▪ Stable provision levels and good coverage ratios
▪ Deposit rate reductions
▪ Dividend payment according to policy between 30% and 60% supported by robust capital position
Optimize balance
sheet
▪ Focus on stable high ROE
▪ Nordic growth through increased loan distribution and enhanced services
▪ European expansion to commence in second half of 2021
Profitable growth
Continue strong
earnings
▪ Stable risk adjusted loan yield
▪ Lean operations with cost control
▪ Harmonized regulatory environment positive

25
Quarterly numbers
Asset quality
Relationship to Norwegian Airshuttle ASA (NAS)
Debt investors
Corporate governance and ESG
Agenda
Snapshot of Bank Norwegian
Why invest in Bank Norwegian?
Appendix
26
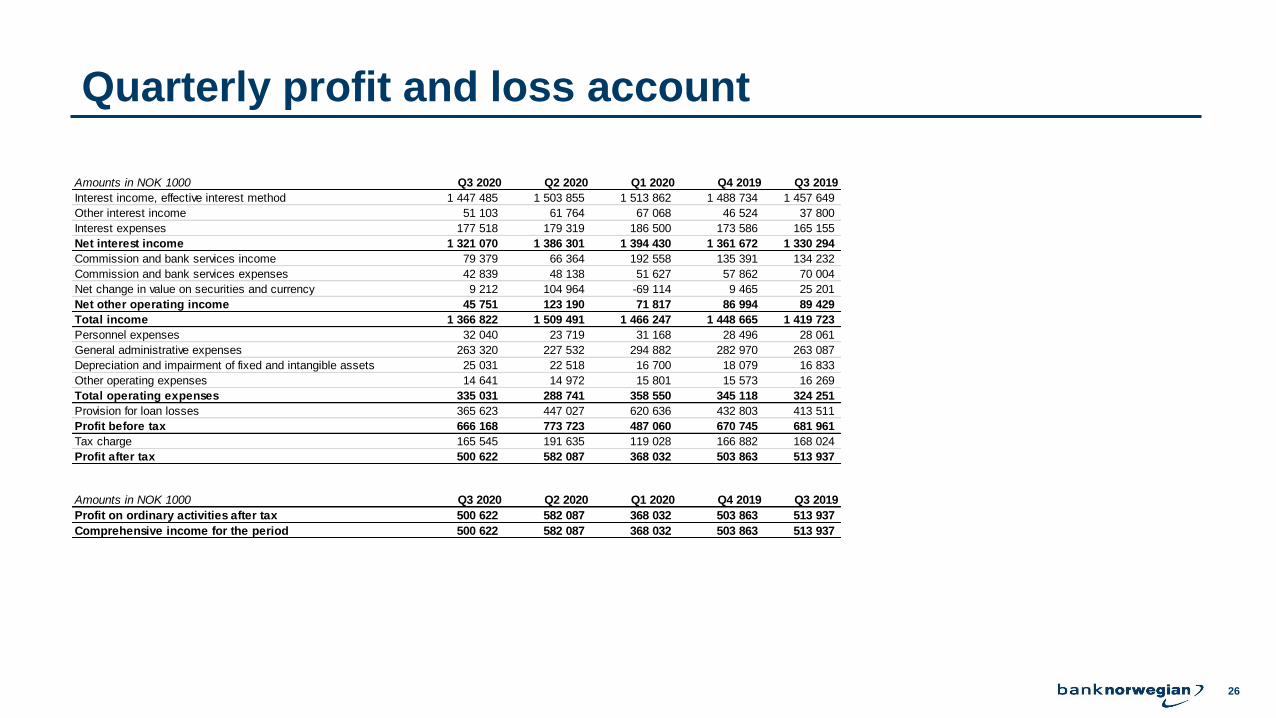
Quarterly profit and loss account
Amounts in NOK 1000 Q3 2020 Q2 2020 Q1 2020 Q4 2019 Q3 2019
Interest income, effective interest method 1 447 485 1 503 855 1 513 862 1 488 734 1 457 649
Other interest income 51 103 61 764 67 068 46 524 37 800
Interest expenses 177 518 179 319 186 500 173 586 165 155
Net interest income 1 321 070 1 386 301 1 394 430 1 361 672 1 330 294
Commission and bank services income 79 379 66 364 192 558 135 391 134 232
Commission and bank services expenses 42 839 48 138 51 627 57 862 70 004
Net change in value on securities and currency 9 212 104 964 -69 114 9 465 25 201
Net other operating income 45 751 123 190 71 817 86 994 89 429
Total income 1 366 822 1 509 491 1 466 247 1 448 665 1 419 723
Personnel expenses 32 040 23 719 31 168 28 496 28 061
General administrative expenses 263 320 227 532 294 882 282 970 263 087
Depreciation and impairment of fixed and intangible assets 25 031 22 518 16 700 18 079 16 833
Other operating expenses 14 641 14 972 15 801 15 573 16 269
Total operating expenses 335 031 288 741 358 550 345 118 324 251
Provision for loan losses 365 623 447 027 620 636 432 803 413 511
Profit before tax 666 168 773 723 487 060 670 745 681 961
Tax charge 165 545 191 635 119 028 166 882 168 024
Profit after tax 500 622 582 087 368 032 503 863 513 937
Amounts in NOK 1000 Q3 2020 Q2 2020 Q1 2020 Q4 2019 Q3 2019
Profit on ordinary activities after tax 500 622 582 087 368 032 503 863 513 937
Comprehensive income for the period 500 622 582 087 368 032 503 863 513 937

27
Quarterly balance sheet
Amounts in NOK 1000 30.9.20 30.6.20 31.3.20 31.12.19 30.9.19
Assets
Cash and deposits with the central bank 69 511 69 623 69 905 68 500 68 285
Loans and deposits with credit institutions 2 462 788 3 361 585 3 014 698 2 094 165 1 626 704
Loans to customers 39 962 311 40 101 034 42 378 471 40 560 502 40 067 806
Certificates and bonds 21 054 167 16 790 787 13 764 305 14 650 988 11 339 732
Financial derivatives 205 245 161 158 59 020 76 371 19 284
Shares and other securities 51 491 51 124 46 017 44 863 42 529
Intangible assets 470 235 490 433 506 426 510 840 508 638
Deferred tax asset 7 702 5 849 4 179 3 502 19 673
Fixed assets 1 184 1 082 1 153 819 953
Receivables 79 322 92 057 110 908 62 835 56 133
Total assets 64 363 956 61 124 733 59 955 081 58 073 384 53 749 736
Liabilities and equity
Loans from credit institutions 1 033 695 1 000 781 1 400 000 52 750 -
Deposits from customers 43 880 046 41 090 855 39 561 112 40 118 369 39 185 189
Debt securities issued 6 649 351 6 679 216 6 813 624 6 537 863 3 472 923
Financial derivatives 112 604 200 428 657 621 29 621 37 563
Tax payable 498 291 634 825 441 519 625 745 618 010
Deferred tax 3 821 3 821 3 821 3 821 -
Other liabilities 193 813 55 452 193 945 225 912 400 310
Accrued expenses 217 251 175 744 177 062 182 907 240 195
Subordinated loan 876 049 876 143 876 073 822 688 812 230
Total liabilities 53 464 921 50 717 265 50 124 777 48 599 677 44 766 421
Share capital 186 847 186 695 186 695 186 695 186 695
Share premium 978 201 972 295 972 295 972 295 972 295
Tier 1 capital 635 000 635 000 635 000 635 000 635 000
Paid, not registered capital - 6 058 - - -
Retained earnings and other reserves 9 098 987 8 607 419 8 036 314 7 679 717 7 189 324
Total equity 10 899 035 10 407 468 9 830 304 9 473 707 8 983 314
Total liabilities and equity 64 363 956 61 124 733 59 955 081 58 073 384 53 749 736

28
Quarterly key figures and alternative performance measures
1) Defined as alternative performance measure (APM). APMs are described on banknorwegian.no/OmOss/InvestorRelations.
2) The APMs “Non-performing loans to loans” and “Loan loss allowance to non-performing loans”, which has been in use since reporting under IAS 39, has in Q2 2020 been replaced by the new APMs “Stage 3 loans to loans” and
“Loan loss allowance coverage ratio stage 3” due to established market practice and reduced relevance after the implementation of IFRS9.
3) Updated definition for ROE based on established market practice. Previous periods are recalculated.
4) Updated definition for EPS based on establised market practice. EPS is calculated based on profit after tax excluding interest on additional Tier 1 capital. Previous periods are recalculated.
Q3 2020 Q2 2020 Q1 2020 Q4 2019 Q3 2019
Return on equity (ROE)1 3 19.6 % 24.0 % 15.7 % 22.8 % 24.8 %
Return on assets (ROA)1 3.2 % 3.9 % 2.5 % 3.6 % 3.9 %
Earnings per share (EPS)4 2.63 3.06 1.91 2.63 2.69
Common equity tier 1 (CET 1) 21.4 % 20.7 % 19.6 % 21.2 % 20.2 %
Leverage ratio 13.9 % 14.3 % 14.1 % 14.5 % 14.8 %
Liquidity coverage ratio (LCR) 494.4 % 385.5 % 233.5 % 449.6 % 203.2 %
Net interest margin (NIM)1 8.3 % 9.3 % 9.5 % 9.7 % 10.0 %
Cost/income ratio1 0.25 0.19 0.24 0.24 0.23
Loan loss provisions to average loans1 3.3 % 3.9 % 5.5 % 3.9 % 3.9 %
Stage 3 loans to loans1 2 22.3 % 21.3 % 19.8 % 17.3 % 15.4 %
Loan loss allowance coverage ratio stage 31 2 40.4 % 40.0 % 37.7 % 35.9 % 38.6 %
Loan loss allowance coverage ratio to loans1 10.9 % 10.3 % 9.9 % 8.1 % 7.2 %

29
Quarterly numbers
Asset quality
Relationship to Norwegian Airshuttle ASA (NAS)
Debt investors
Corporate governance and ESG
Agenda
Snapshot of Bank Norwegian
Why invest in Bank Norwegian?
Appendix
30
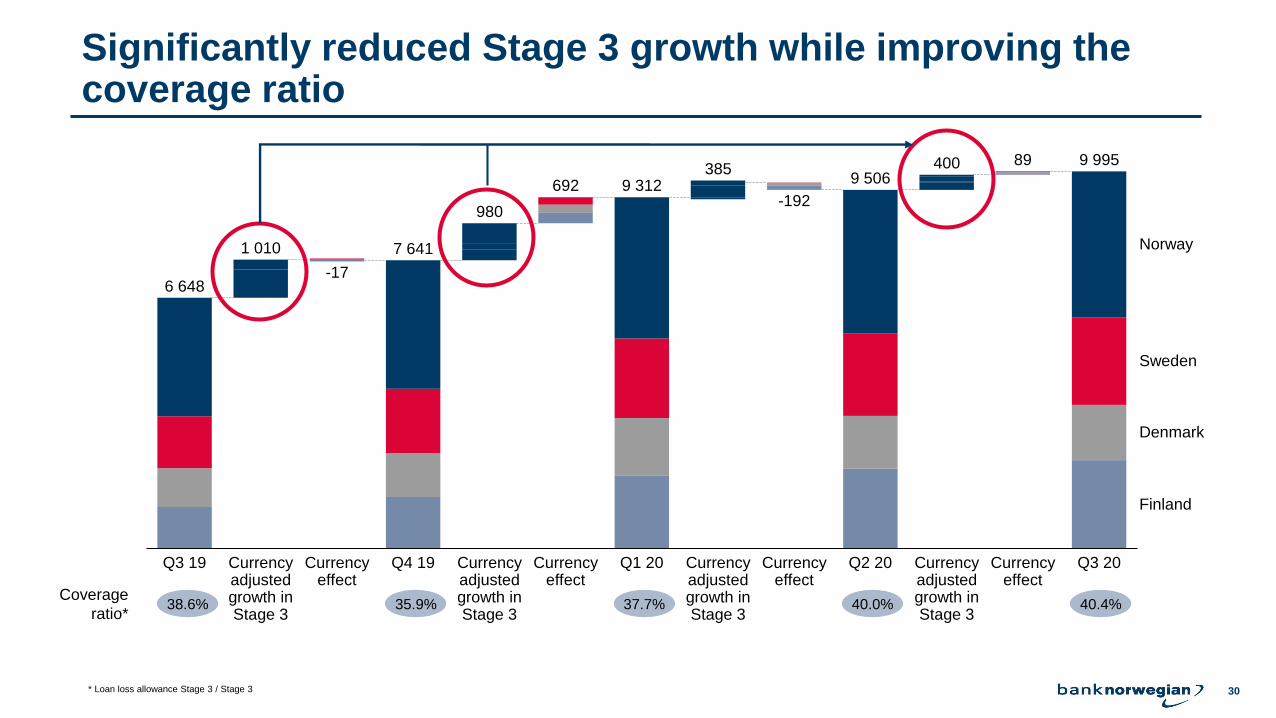
Significantly reduced Stage 3 growth while improving thecoverage ratio
Coverage
ratio*38.6% 35.9% 37.7% 40.0% 40.4%
9 995
Currency adjusted growth in Stage 3
Q1 20Currency adjusted growth in Stage 3
Currency effect
1 010
Q2 20
Denmark
Currency adjusted growth in Stage 3
Currency effect
Q3 20
Norway
Sweden
Finland
Currency effect
Currency effect
Q3 19
980
Currency adjusted growth in Stage 3
Q4 19
-192
6 648
9 312
-17
7 641
692
4003859 506
89
* Loan loss allowance Stage 3 / Stage 3

31
Comments on charge-off policies and «back-stop» regulations (EBA Capital Requirement Regulation (CRR) 2019/630)
▪ The bank implemented a charge-off policy in Q4 2019 and has calibrated the policy through 2020
− Charge-off is made on all defaulted loans with LGD > 70% - dynamic LGD models in all countries
− With a charge-off policy the customer claim remains but gross loan exposure is fully covered with loan loss provisions (100%
coverage ratio), and removed from the balance sheet – both from gross lending and loan loss allowance
− As such; an insignificant amount of defaulted exposures more than 3 years with LGD < 70%
▪ Based on the current credit models and the charge-off policy, the Bank has currently no significant «backlog» of exposures, that
would have been required written off according to the new back-stop regulations, had the back-stop regulations been effective
▪ As of 3Q 2020, the amount of lending granted after 29. April 2019 that has entered stage 3 is MNOK 480
▪ The charge-off policy will be calibrated with the back-stop regulations

32
Pre collection and collection
Reminder SMS
5-7 days after due
Reminder services and pre collection measures
Collection measures
Special handling
Combined invoice/reminder
Unpaid installments are added to
new invoices.
Termination warning
Final warning before the
agreement is terminated
Transfer to collection agency
Following an unsuccessful pre
collection process
Forbearance
Bank Norwegian may consider
easing in order to avoid serious
payment defaults.
Amicable collection
Try to reach out at an early stage
to all customers in order to
establish a payment plan.
Legal collection
Potential handling by enforcement
authority for execution. Wage
garnishing and pledge in assets.
Long-term debt surveillance
Claims not possible to collect in
the foreseeable future will be
subject to debt surveillance
International collection
A debtor emigrating will be subject
to amicable and, if suitable,
enforcement in the country they
reside.
Dispute handling
If suitable, the dispute will be
settled in court. All the Nordic
countries have well functioning
legal processes for dispute
settlements.
Debt restructuring
The Nordic countries all have legislation which regulates a
formal debt restructuring process, enabling individuals with
severe economic problems to handle their debts under certain
conditions.
Estate handling
If the debtor is deceased, the estate will be subject to collection
if there are any assets to cover the debt. On certain conditions,
the debt can be transferred to the estates heir.
Bankruptcy
The formal bankruptcy process is rarely carried out for
individuals in the Nordics, as there are seldom any
advantages for the creditor nor the debtor. Unpaid debts
remain after bankruptcy, and the process is costly.
Ex
ec
ute
d b
y
Ba
nk
No
rwe
gia
n
Ex
ec
ute
d b
y d
eb
t c
oll
ecti
on
ag
en
cy
(in
co
op
era
tio
n w
ith
Ba
nk
No
rwe
gia
n)

33
Purpose for instalment loans
Debt consolidation
Unforeseen expenses
Travel and vacation
Refurbishing
Car/Boat/MC acquisition
Help family and friends
Financing own business
Consumption
Health services
Home equity
Other 8.2%
44.0%
12.0%
11.6%
6.1%
4.7%
3.4%
3.0%
1.5%
2.8%
1.7%
84%
11%
Credit card/loan
Private debtOther debt
5%
18%
17%
16%
11%9%
8%
6%
14%
Damages
Help familyand friends
Other
Illness
Car repair
Familyseparation
Dentalexpenses
Back taxes
▪ Most important purpose is
debt consolidation –
lowering interest expenses
▪ Unforeseen expenses and
refurbishing represent
~24% of loans
▪ Home equity represents
only 1.5% of loans
Source: Bank Norwegian customer survey 2019 Norway n=5524. Distribution based on number of loans.

34
Non-performing loans (NPL) portfolio sales
Overview transactions (MNOK)
▪ Ad hoc transactions
▪ No forward flow agreements
364
840
451
1 521
-4
43
45
-20
December 2014, Norway
April 2017, Sweden
December 2018, Finland
August 2017, Norway
Gross volume
Net P&L effect

35
Quarterly numbers
Asset quality
Relationship to Norwegian Airshuttle ASA (NAS)
Debt investors
Corporate governance and ESG
Agenda
Snapshot of Bank Norwegian
Why invest in Bank Norwegian?
Appendix

36
2007 - Inception 2019 – The Nordics and Europe2007 – 2019 Norway and the Nordics
History of Bank Norwegian - and the dependency onNorwegian Air Shuttle ASA (NAS)
High NAS dependency Low
NAS related
agreements /
products
Ownership /
BoD
History and
customer
growth
• Norwegian Air Shuttle initiates the project
• Granted a banking license by the Ministry of
Finance (Finansdepartementet) in 2007
• Bank Norwegian launches operations with 30,000
pre-registered credit card customers in 2007
• Bank Norwegian entering the Swedish (2013),
Danish and Finnish markets (2016)
• Bank Norwegian reaches 500’ customers in 2015
• Bank Norwegian reaches 1 000’ customers in
2017
• December 2018 / May 2019 – Bank Norwegian
announces ambitions on European expansion and
transactions to secure European rights
• Bank Norwegian reaches 1 700’ customers in
november 2019
• The product offering consists of unsecured
consumer instalment loans, “Norwegian Reward”
credit cards issued on behalf of Terra Kort, on
demand deposit account and savings deposit
account, all offered through the internet
• Norwegian Prosjekt 01 AS – paid in equity of
MNOK 30
• NAS - 20% ownership (nw ownership regulations)
• NAS with significant influence through Board of
Directors and operational ties
• Listed on Oslo Stock Exchange in 2016
• NAS reduces its shareholding from 20 % to 16.4
% during 2017
• From 2017 NAS has not been represented in the
Board of Directors of NOFI
• Credit cards issuance (and balances) lifted from
Terra Kort to Bank Norwegian in 2010
• Credit card connected to the reward program and
customer growth – limited distribution through
NAS direct channels
• No operational ties between Bank Norwegian and
NAS other than through the credit card Reward
program
• The installment loan and savings business of
Bank Norwegian is not associated with NAS
• 12 years after inception of the bank, Norwegian
Air Shuttle ASA sells its remaining shareholding in
Norwegian Finans Holding ASA in August 2019
• No ownership or BoD ties between NAS and Bank
Norwegian
Marketing /
brand name
dependencies
• The Bank benefits from the association of the
Norwegian brand and the simple, “must-have”
credit card connected to Norwegian Reward
• NAS going through a period of strong expansion
with opening of its first international base in 2006
• Able to leverage off of NAS strong market position
and brand recognition in existing and new markets
• Both businesses emphasize the same operational
footprint, including digital solutions, automated
processes and a low-cost culture.
• Bank Norwegian has generated a stand alone
brand – Nordic champion – within the unsecured
lending market
• Limited distribution of credit cards through NAS
• Limited marketing dependencies on NAS
37
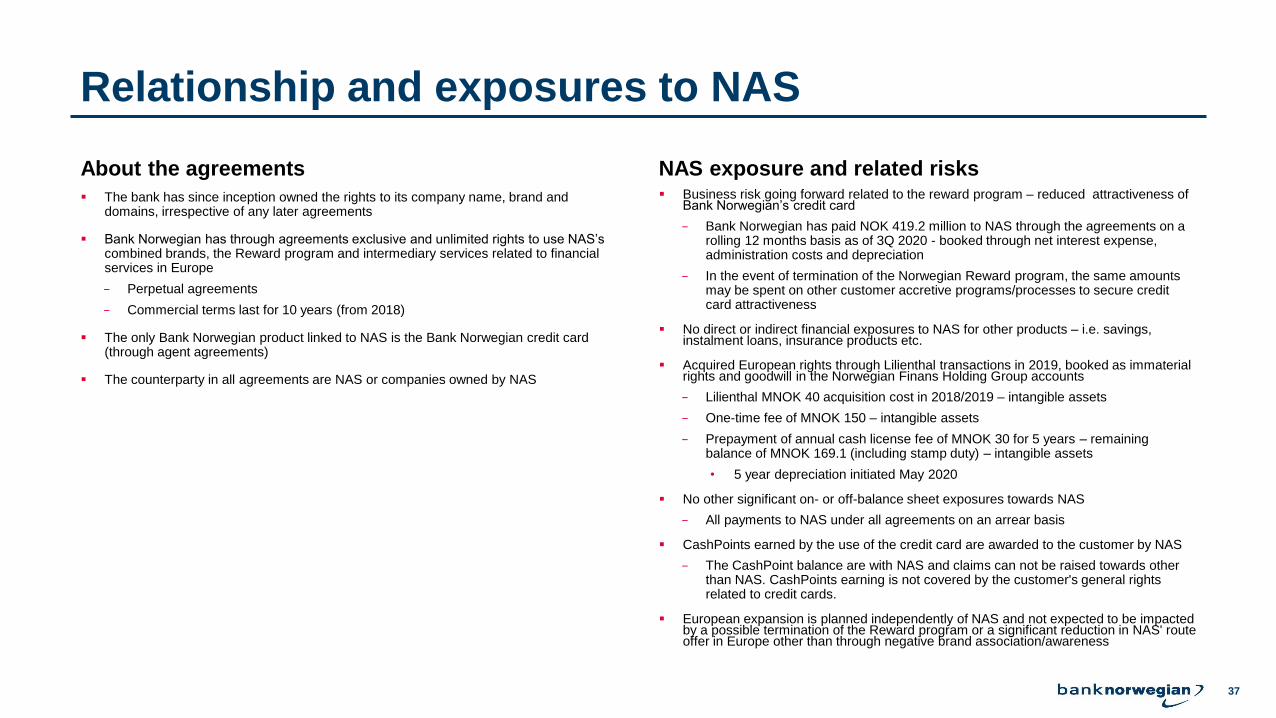
Relationship and exposures to NAS
About the agreements NAS exposure and related risks
▪ The bank has since inception owned the rights to its company name, brand and domains, irrespective of any later agreements
▪ Bank Norwegian has through agreements exclusive and unlimited rights to use NAS’s combined brands, the Reward program and intermediary services related to financial services in Europe
− Perpetual agreements
− Commercial terms last for 10 years (from 2018)
▪ The only Bank Norwegian product linked to NAS is the Bank Norwegian credit card (through agent agreements)
▪ The counterparty in all agreements are NAS or companies owned by NAS
▪ Business risk going forward related to the reward program – reduced attractiveness of Bank Norwegian’s credit card
− Bank Norwegian has paid NOK 419.2 million to NAS through the agreements on a rolling 12 months basis as of 3Q 2020 - booked through net interest expense, administration costs and depreciation
− In the event of termination of the Norwegian Reward program, the same amounts may be spent on other customer accretive programs/processes to secure credit card attractiveness
▪ No direct or indirect financial exposures to NAS for other products – i.e. savings, instalment loans, insurance products etc.
▪ Acquired European rights through Lilienthal transactions in 2019, booked as immaterial rights and goodwill in the Norwegian Finans Holding Group accounts
− Lilienthal MNOK 40 acquisition cost in 2018/2019 – intangible assets
− One-time fee of MNOK 150 – intangible assets
− Prepayment of annual cash license fee of MNOK 30 for 5 years – remaining balance of MNOK 169.1 (including stamp duty) – intangible assets
• 5 year depreciation initiated May 2020
▪ No other significant on- or off-balance sheet exposures towards NAS
− All payments to NAS under all agreements on an arrear basis
▪ CashPoints earned by the use of the credit card are awarded to the customer by NAS
− The CashPoint balance are with NAS and claims can not be raised towards other than NAS. CashPoints earning is not covered by the customer's general rights related to credit cards.
▪ European expansion is planned independently of NAS and not expected to be impacted by a possible termination of the Reward program or a significant reduction in NAS' route offer in Europe other than through negative brand association/awareness

38
Quarterly numbers
Asset quality
Relationship to Norwegian Airshuttle ASA (NAS)
Debt investors
Corporate governance and ESG
Agenda
Snapshot of Bank Norwegian
Why invest in Bank Norwegian?
Appendix

39
S&P: Bank Norwegian outlook revised from "Negative" to "Stable" on earnings resilience in downturn, 'BBB/A-2' ratings affirmed
S&P Global ratings comments: S&P Risk adjusted capital (RAC) ratio league table*
▪ Bank Norwegian's earnings performance in the first nine months of 2020 demonstrate resilience amid COVID-19 fallout, and its capital and provisions are strong enough to absorb losses even in a more adverse scenario.
▪ The bank's expansion to new markets planned to start late 2021 could diversify its revenues and loan portfolio, but only well beyond our outlook horizon.
▪ We are revising the outlook on Bank Norwegian to stable from negative and affirming the ratings at 'BBB/A-2'.
▪ The stable outlook reflects our view the bank will defend its high risk-adjusted profitability and maintain strong capital buffers through 2022.
*Source: S&P Global September 8, 2020. Nordic Banks' Strong Capital Deflects COVID-19 Impact

40
Minimum Requirements for Own funds and Eligible Liabilites(MREL)
2020
Sep Oct Nov Dec
October 27, 2020
Board decision for
application to Norwegian
FSA regarding merger
between Norwegian
Finans Holding ASA and
Bank Norwegian AS
2021
December 31, 2020
The bank estimates to
be compliant with the
MREL requirement
without issuing MREL-
eligible capital in 2020
October 15, 2020
Norwegian Ministry of Finance
announced a public hearing
regarding implementation of
the EU “Bank-package”
2021
Expect first issuance of MREL-
eligible debt following
clarifications on company
structure and updated
requirements
September 30, 2020
Compliant with the
MREL requirements
Jan

41
0
500
1 000
1 500
2 000
2 500
3 000
Q4 Q1 Q2 Q3 Q4 Q1 Q2 Q3 Q4 Q1 Q2 Q3 Q4 Q1 Q2 Q3 Q4
2020 2021 2022 2023 2024
Subordinated debt Senior debt
Debt maturity structure as of 30 November 2020
Debt maturity profile (MNOK)
▪ 2.0 years as of 30.11.2020
▪ 2.7 years as of 31.12.2019
▪ 1.6 years as of 31.12.2018
▪ 2.0 years as of 31.12.2017
▪ 1.5 years as of 31.12.2016
Average maturity of senior bonds outstanding
**
*
* Includes Additional Tier 1 (AT1) and subordinated loans. Maturity reflects the first possible call date
**Including MNOK 1 000 in 12 month f-loan maturing 18.03.2021

42
Quarterly numbers
Asset quality
Relationship to Norwegian Airshuttle ASA (NAS)
Debt investors
Corporate governance and ESG
Agenda
Snapshot of Bank Norwegian
Why invest in Bank Norwegian?
Appendix

43
Corporate Governance
Board of Directors
Board Sub-Committees(Risk-, Audit-, Remuneration- and Nomination Committee)
Executive Committees (Credit-, and Asset and Liability Committee)
1st line 2nd line 3rd line
Management
Business Units
Support Functions
Risk Management
Compliance
Internal Audit
Supervisory Authorities
External Audit
Management
The First Line of Defence:
• Senior Management with exception of Risk Management and
Compliance
• Business Units
• Support Functions
The Second Line of Defence:
• The Risk Management Function and Compliance Function form the
second line of defence. Heads of these internal control functions are
independent senior managers with distinct responsibility
• Both functions may intervene to ensure the modification of internal
control and risk management systems within the first line of defence
where necessary
The Third Line of Defence:
• The Internal Audit Function shall provide independent review and
objective assurance on the quality and effectiveness of the
implemented internal control system, the first and second lines of
defence and the risk governance framework

44
Risk Management Framework
Business StrategyTerms of
Reference
Risk Management
Framework
(including risk
appetite statement)
Code of Conduct
Capital
Management
Policy
Credit Risk
Policy
Liquidity and
Funding Risk
Policy
Market Risk
Policy
Operational
Risk and
Internal Control
Policy
Compliance
Risk Policy
Model Risk
Management
Framework
Outsourcing
Policy
Remuneration
Policy
Conduct Risk
Policy
Information
Security Policy
New Product
Approval
Policy (NPAP)
Budget and
capital plan Recovery Plan
Capital and
Liquidity
Contingency
Plan
AML/CTF
Policy
Conflicts of
interest PolicyDividend Policy
Crisis and
disaster
recovery plan
(CDRP)
Authorizations
for credit
granting
Contingency
plans
GDPR Policy
Whistleblowing
Routines
Sustainability
Policy
Level 1
Level 2
Level 3
Level 4Process
descriptions
Detailed
routines
Risk
Assessment
Procedures
Control and
Compliance
Plans
Check listsJob
Descriptions
Details of
credit
scorecards
Procedures for
debt collection
Procedures for
credit granting
Outsourcing
procedures
Reporting
Procedures
Division of
Labour –
Compliance
Routine for handling
inside information
and trading in
securities
Powers of
attorney
Insurance
Policy
Approved by the Board of Directors
Approved by Management

45
Identified ESG risks and assessed risk level Overview
Integrating ESG in the day-to-day operations
▪ Bank Norwegian has prepared special guidelines for corporate social responsibility and a board approved Sustainability Policy
▪ These were adopted in 2017 and have been integrated into our day-to-day operations. The Sustainability Policy was approved 25 March 2020
▪ Responsible lending, safeguarding customers’ privacy, preventing financial crime and looking after our employees are prioritized areas that entail long-term commitments and form the basis of our corporate social responsibility
▪ Link to Sustainability Report 2019
Integration and ongoing processes
▪ ESG included in all relevant processes
▪ Risk analyzes associated with ESG is an important and regular part of the annual internal control review, identifying any new risks and/ or weaknesses in established control measures
− Focus on understanding and managing business impacts, both positive and negative, on people and the society.
− Social sustainability involves identifying how the Bank may directly or indirectly affect its stakeholders and managing such impacts proactively.
▪ ESG materiality analysis ongoing – to be finalized ultimo 2020
ESG Very low Low Moderat High Very high Sum
Environment 9 7 2 0 0 18
Social 9 11 2 0 0 22
Governance 11 20 7 0 0 38
Sum 29 38 11 0 0 78
ESG risks
Environmental (E)
Climate risk
Environmental protection
Environmental reputation
Social (S)
Employee rights
Human rights
Conduct risk
Social reputation
Governance (G)
AML/CFT
Privacy
Corruption and bribery
Financial crime
Fraud
Internal control
Reputational risk

46
Board of directors (1/2)Klaus-Anders Nysteen, Chairman of the Board Norwegian Finans Holding ASA (NOFI) and Bank Norwegian (BN)
• Master of Science in Business Administration, Norwegian School of Economics (NHH). Member of the Board of Directors since 2020.
• Klaus-Anders Nysteen has been CEO of Hoist Finance since March 2018. He has previously worked in, among others, Nordic Capital, Lindorff Group, Entra Eiendom AS and Statoil Fuel & Retail ASA and as CEO at Storebrand Bank ASA. He has extensive experience from a number of board positions, among others in Webstep ASA and Asset Buyout Partner AS.
• Other on-going principal assignments: Member of the board of Asset Buyout Partner AS.
Christine Rødsæther, Board member (NOFI and BN)
• Master of Law, University of the Pacific, Sacramento, California and Cand. Jur., University of Bergen. Member of the Board of Directors since 2017.
• Christine Rødsæther has since 2002 been a partner in the law firm Simonsen Vogt Wiig AS and has extensive experience in banking and finance, contract law as well as shipping and offshore. She has previous experience from Wikborg, Rein & Co. and Andersen Legal ANS.
• Other on-going principal assignments: Board member of Odfjell SE. Member of the Governments counsel for maritime development (MARUT).
Izabella Kibsgaard-Petersen, Board member (NOFI and BN)
• Law degree from the University of Oslo and certified international auditor from BI Norwegian Business School. Member of the Board of Directors since 2020.
• Izabella Kibsgaard-Petersen has more than 15 years of experience in compliance, risk management and internal audit. She currently works as SVP Director of compliance at Veidekke ASA. In recent years, Izabella Kibsgaard-Petersen has worked with a comprehensive approach to business management and how functions such as compliance, risk management and internal auditing can contribute to good governance and control for value creation. She previously held positions at the Garantiinstituttet for eksportkreditt, Abbott / AbbVie and KPMG.
• Member of the board and board representative in the compliance network of IIA Norge.
Hans Larsson, Board member (NOFI and BN)
• BsC in Economics and Business Administration from University of Uppsala, Sweden. Advance Management Programme from Stockholm School of Economics. Board member since 2020.
• Hans Larsson is CEO of Linderyd Advisory AB, a consultancy firm, since 2014. He previously held the position as Deputy CEO and Head of Staff at Lindorff A/S, Norway, 2014-15. Prior to this he was a member of the Group Executive Committee of SEB in Sweden between 2006 and 2013 as Head of Group Staff, Business Development and M&A and prior to that Head of Capital Markets and Client Relationship Management within SEB. He has extensive experience of operative and international board assignments within the SEB Group.
• Board Member of Intrum AB, Nordnet AB/Bank AB and Swedish Export Credit Corporation (SEK AB).
Kjetil Garstad, Board member (NOFI)
• Member of the Board of Directors since 2019. Master of Science in business administration, Norwegian School of Economics.
• Kjetil Garstad has been an analyst at Stenshagen Invest AS since 2014. From 2007 to 2013, Garstad was an analyst at Arctic Securities AS and before that at Enskilda Securities AB. Between 2001 and 2003, Garstad worked in the corporate finance department of UBS in London.
• Chairman of the Board of Steel City AS. Member of the Board of Directors of Øgreid AS and Vininor AS. Deputy board member of B2Holding ASA.

47
Board of directors (2/2)Knut Arne Alsaker (NOFI)
• Master of Science in Economics and Business Administration from the Norwegian School of Economics. Member of the Board of Directors since 2019.
• Knut Arne Alsaker has been Group Chief Financial Officer of Sampo Group since 2019 and a member of the Group Executive Committee since 2014. He previously held various positions in Storebrand ASA (1998-2000) and If P&C Insurance Ltd (2000-2018).
• Board member of If P&C Insurance Holding Ltd and the vice chairman of the board of Mandatum Life Insurance Company Limited.
Anita M Hjerkinn Aarnæs, Board member (NOFI)
• Master of Public Administration, Harvard University. Member of the Board of Directors since 2007.
• Anita Hjerkinn Aarnæs is an experienced manager with broad international know-how, a comprehensive track record in business development, strategic planning and operational performance cross industries. Her current position is Managing Partner Scandinavia at The Board Practice. Prior to this she served as the HR Director at DNO ASA, as Partner-in Charge at Heidrick & Struggles and TripleA Consulting AS and as management consultant at PA Consulting Group for 20 years.
• Member of the Nomination Committee at DNO ASA.
John E. Høsteland, Board Member (BN)
• Dr. Scient. in Economics, Norwegian University of Life Sciences at Ås. Member of the Board of Directors since 2007.
• Owns of JH Consult, through which he offers advisory services targeted at the corporate market. He has previously held the role of CEO in a number of companies including Höegh Capital Management AS, Skogbrand Forsikring, First Securities ASA and Elcon Securities ASA, among others.
• Mr. Høsteland is a member of the board of directors of Höegh Capital Partners ASA, Guardian Corporate AS, First Fondene AS and Tekas AS and Fire Fondene AS. Chairman in Høst Verdieni Avfall AS and Koppang Landbruk- og næringsmegling AS.
Lars Ola Kjos, Board member (BN)
• BsC in business administration finance, University of Denver. Member of the Board of Directors since 2013.
• Lars Ola Kjos previously held position as VP of Norwegian Reward and Business Development for non-air project at Norwegian including the airline’s Bank Norwegian project.
• Chairman of the board of directors of Green 91 AS and Executive Vice President Commercial at Arctic Aviation Assets Ltd where he works with aircraft purchasing, financing and leasing.
Charlotte Ager, Board member (elected by the employees) (BN)
• Master of Law from University of Copenhagen. Member of the Board of Directors since 2020.
• Charlotte Ager has been employed at Bank Norwegian since March 2019. She is an analyst in the department for Disputes and Economic Crime. She is also part of the Banks AML-team. Previously she has been employed at the National Board of Appeal in Denmark..

48
Management team (1/2)Tine Wollebekk, Chief executive officer
• Master of science in business administration, Copenhagen Business School.
• SVP and global head of financial services, Telenor (2012-16), Board member SEB Privatbanken, Gjensidige ASA, Financial advisor to FSN Capital, CEO SEB Cards (N/DK), Management positions at SEB Norge and Diners Club Nordic
• More than 30 years of financial services experience. Employed in the bank since June 2017
Klara-Lise Aasen, Chief financial officer
• Stateauthorised Public Accountant (Master of Audit), Norwegian School of Economics, Bergen, Norway.
• Executive Vice President and Head of Group Financial Management in DNB from (2017-2020) and executive management positions in Nordea from 2006-2017, the latest four years as Global Head of Group Credit Risk and Financial Reporting Control and the previous four years as CFO for Nordea Bank Norway. Prior to joining financial services she worked in external audit, latest as Manager in EY (Ernst&Young). Previous board member in Nordea Life Holding, Nordea Pensionfund, DNB Northern Europe and DNB Life Insurance.
• More than 15 years of financial services experience. Employed in the bank since 2020.
Karstein Holen, Chief information officer
• Bachelor in Computer Science from Bergen College of Engineering and MBA from Edinburgh Business School, Heriot-Watt University.
• Mr Holen has been employed as Chief Information Officer (CIO) in Bank Norwegian since March 2020, and has more than 20 years of experience working with IT within financial services and telecom. Prior to joining Bank Norwegian, Mr. Holen worked 12 years in various IT positions at Norge Bank Investment Management (NBIM), most recently as Head of IT for the Real Estate investment branch in NBIM. Earlier assignments include DBA at NetCom (1999-2007) and database developer at EDB-Konsulent AS (1997-1999) and ATM AS (1995-1997).
• More than 20 years of experience working with IT within financial services and telecom. Employed in the bank since 2020.
Tore Andresen, Chief operating officer
• Associate degree in business administration, Norwegian School of Economics
• Managing Director at Aktiv Kapital Norge, Managing Director Lindorff Decision
• More than 30 years of financial services experience. Employed in the bank since June 2009
Peer Timo Andersen-Ulven, Chief risk officer
• Pre PhD in quantitative finance, Norwegian School of Economics (NHH)
• Partner KPMG, Financial Services and Financial Risk Management, Corporate Finance in Norse Securities and Aker Fonds
• More than 20 years of financial services experience. Engaged with the bank since October 2017.

49
Management team (2/2)Fredrik Mundal, Chief marketing officer
• Bachelor in Business Administration and IT, University of Agder
• Head of Customer Service/Product Manager credit card and Head of Credit at Bank Norwegian, previously at SEB Kort Credit Department
• More than 15 years of financial services experience. Employed in the bank since inception
Frode Bergland Bjørnstad, Chief legal and compliance officer
• Cand Jur (master of Law) University of Bergen. Chief legal and compliance officer in Bank Norwegian since may 2018.
• He has 16 years of legal commercial experience within privacy, compliance, financial services, IPR, marketing, commercial contracts, IT and tech. Lawyer and legal counsel in EVRY (2011-2018), where he was a member of the financial control committee for EVRY Card Service’s payment service. External lawyer in Føyen Torkildsen (2006-2011).
Kai-Harry Hansen, Head of risk management
• Head of risk management since 2019. Master’s degree in Economics and Business Administration, University of Tromsø (UiT). Practical Pedagogical Education (Lecturer), UiT.
• More than 10 years of risk experience from the banking sector. Risk Manager at SpareBank 1 Østlandet (2017-2019) and SpareBank 1 Oslo Akershus (2010-2017). Risk Analyst at SpareBank 1 Oslo Akershus (2008-2010) and as a Corporate Trainee at SpareBank 1 Gruppen (2006-2008). Has been teaching Martial Arts (Aikido and Kenjutsu) since 2001
Merete Gillund, New markets
• Master of science in information technology, University of Stavanger
• Hired in 2020 to lead the expansion into new markets in Bank Norwegian. CIO in Bank Norwegian from 2008 to 2019. Management positions at SEB Kort IT Oslo/Stockholm, IT consultant –developing credit card system applications
• More than 20 years of financial services experience. Employed in the bank 2008 – 2019 and since 2020.

50
Top 20 shareholders
▪ Management holds 0.95% of shares outstanding
As of December 7, 2020
SHAREHOLDER # OF SHARES
1 CIDRON XINGU LTD 30 646 498 16.40 %
2 FOLKETRYGDFONDET 18 485 852 9.89 %
3 BNP PARIBAS SECURITIES SERVICES NOMINEE 11 826 105 6.33 %
4 GOLDMAN SACHS & CO. LLC NOMINEE 10 344 693 5.53 %
5 BANQUE DEGROOF PETERCAM LUX. SA NOMINEE 7 904 243 4.23 %
6 BRUMM AS 5 273 482 2.82 %
7 STATE STREET BANK AND TRUST COMP NOMINEE 4 987 745 2.67 %
8 STENSHAGEN INVEST AS 4 551 416 2.44 %
9 STATE STREET BANK AND TRUST COMP NOMINEE 3 457 906 1.85 %
10 MP PENSJON PK 3 436 438 1.84 %
11 THE NORTHERN TRUST COMPANY, LONDON NOMINEE 3 312 292 1.77 %
12 GREEN 91 AS 2 964 900 1.59 %
13 JPMORGAN CHASE BANK, N.A., LONDON NOMINEE 2 621 641 1.40 %
14 STATE OF WISCONSIN INVESTMENT BOARD 2 300 868 1.23 %
15 VERDIPAPIRFONDET ALFRED BERG GAMBAK 2 004 022 1.07 %
16 TORSTEIN INGVALD TVENGE 2 000 000 1.07 %
17 NYE KM AVIATRIX INVEST AS 1 793 472 0.96 %
18 JPMORGAN CHASE BANK, N.A., LONDON NOMINEE 1 701 039 0.91 %
19 VERDIPAPIRFONDET KLP AKSJENORGE INDEKS 1 588 337 0.85 %
20 DIRECTMARKETING INVEST AS 1 500 000 0.80 %
Top 20 122 700 949 65.65 %
Total 186 904 268

51