bank distress and firm performance during the great
TRANSCRIPT

1
Bank Distress and Firm Performance during the Great Recession - Evidence from Ireland
By
Mariana Spatareanu Rutgers University
E-mail: [email protected]
Vlad Manole Rutgers University
E-mail: [email protected]
Ali Kabiri
University of Buckingham
Email: [email protected]
January 24, 2016
Abstract: This paper investigates the impact of bank distress on firms’ performance using
unique data during the Great Recession for Ireland. The results show that bank distress,
measured as banks’ credit default swap spreads (CDS) has negatively and statistically
significantly affected firms’ investment expenditures. Interestingly, firms with access to
alternative sources of external finance are not impacted by bank distress. The results are robust to
accounting for external finance dependence, demand and trade sensitivities, which affect firm
performance and the demand for credit.
Keywords: firm performance, bank distress, crisis
JEL classification: E44, E50, G20

2
1. Introduction
Does bank distress affect firms’ performance? In spite of the crucial importance of this question,
the evidence is still unclear. The recent financial crisis has spurred a renewed interest in better
understanding the role the banking system plays in the economy, and how financial sector crises
spread to the real economy. In this paper we analyze the impact of distress in the banking sector
on the real economy, in particular on the investment behavior of firms. We focus on the Irish
economy during the crisis years, 2008-2014, and make use of a unique database which provides
us information on the universe of Irish firms and their banking relations. Furthermore, an
important feature of our analysis is the use of market based indicators to quantify bank distress.
Banks’ Credit Default Swaps (CDS) capture bank fundamentals as well as risk premia, and thus
provide us with a much more comprehensive measure of banks’ conditions.
The Irish economy provides an interesting case to study not only due its small size but also its
notoriety as one of the “GIIPS”1countries that suffered the greatest distress during the European
Sovereign debt crisis, and the scale of the economic contraction it experienced from 2008-2013.
This experience was in stark contrast to the pre-crisis economic experience. Ireland had a
remarkable economic performance, growing at about 6% per year between 1990 and 2005,
which justifiably earned it the moniker the “Celtic tiger”. However, after the year 2000, the Irish
economy accommodated an unusually large credit bubble, with a massive increase in the volume
of mortgages. Kelly (2009) highlights that Ireland displayed marked increases in the level of
bank lending to households and firms of over 200% of GDP by 2008, the highest in developed
Europe, up from a modest base of 60% in 1997. This evolution of lending was complemented by
the banking sector’s increased reliance on non-deposit funding from 2003 on, with over half of
lending being non-deposit financed by 2007, and by the rise in house prices from 5 times
earnings to 12 times earnings from 1997 to 2007. The fragility of the business model used by
Irish banks was proved by the decline in the demand for mortgages, beginning at the end of
2006, leading to significant decreases in the price of real estate and by the effects of global
financial crisis on inter-bank borrowing and bond market in 2008, severely restricting the access
to funds for Irish banks. The crisis in the banking sector led to Irish government intervention,
nationalization, and recapitalization of several Irish banks. This in turn has translated into a
severe crisis that has derailed the “Celtic Tiger” from its remarkable previous growth.
The question we are interested in is to what extent the distress in the banking sector affected the
activity of Irish firms. This is an important question especially in the context of the recent
financial crisis, because the banking sector, by facilitating the flow of funds from investors to
borrowers, is an important contributor to economic growth. Disruptions that interfere with the
ability of the financial sector to intermediate financial flows might restrain economic activity. A
number of papers identify a “Bank lending channel”, where financial institutions could be the
source of important macroeconomic dynamics. Financial intermediaries are themselves
dependent on debt financing, so that if their condition deteriorates they face higher borrowing
costs, which may be passed on to borrowing firms. The bank may also respond to deterioration in
1 Greece, Ireland, Italy, Portugal and Spain

3
its condition by tightening lending standards as lower loan losses might allow it to rebuild its
capital.
The most recent crisis has revived the interest in the role of the bank lending channel. Popov and
Udell (2012) use a survey of small and medium enterprises in 16 emerging European countries to
analyze the link between firms’ credit supply and banks financial conditions between 2005 and
2008. In the absence of a direct connection between firm and bank, they build an index of
locality–specific bank distress corresponding to surveyed firms. Their results show that firms'
access to credit was affected by the changes in the financial conditions of their banks and was
sensitive to shocks in balance sheet conditions of foreign parent banks. Two recent papers use
data obtained from Thomson Reuters LPC's DealScan, which provides extensive coverage of the
syndicated loan market and provide firm-bank link. Due to the nature of syndicated loans, the
firms used by these papers are large or very large and most of them are publicly traded. The first
paper by Acharyaa et al (2014) explores the impact of European Sovereign Debt Crisis on loan
supply disruptions for GIIPS banks and the impact on the performance of European borrowers
that have a significant business relationship with these banks. The second paper, Carvalho et al
(2014), analyses 1,564 large and very large publicly traded firms in 34 countries and finds that,
during financial crises, firms with strong relationship with banks are affected by bank distress,
and that public debt markets do not mitigate the credit constraint for these firms. Evidence that
banks in poorer financial health charge more for loans comes from Hubbard et al (2002), who
show that less well capitalized banks tend to charge higher loan rates than well capitalized banks.
Dell'Ariccia et al (2008) examine, in a cross-country setting using 41 countries from 1980-2000,
whether banking crises exogenously hinder real activity. They found that sectors more dependent
on external finance perform relatively worse during banking crises. Important research on how
the bank-lending channel operates using a different methodological approach comes from
Halvorsen and Jacobsen (2009). They analyse the importance of bank lending shocks on real
activity in Norway and the UK, using structural VARs and based on quarterly data over 21 years.
They find that a negative bank lending shock causes output to contract. The significance of bank
lending shocks seems evident as they explain a substantial share of output gap variability. This
suggests that the banking sector is an important source of shocks to the real economy.
Our paper contributes to the literature on the transmission of shocks from the banking sector to
the real economy by analysing the effect of bank distress on firms’ investments using a large
number of Irish firms. While most other studies focus on large and very large firms,2 our sample
covers small and medium firms as well, which are likely to suffer the most, allowing us to
provide more precise estimates of the effects of the crises. Previous studies3 used syndicated
loans data to match firms with banks, therefore restricting their analysis to publicly traded, large
and very large firms, which often have access to alternative sources of external finance, therefore
underestimating the importance of the bank lending channel. Moreover, the measure of bank
distress is extremely important for the analysis – we use banks’ Credit Default Swap (CDS)
spreads, a market based indicator that which allows timely information on the default risk of
2 In Carvalho et al (2014) the mean of total assets for non-US firms is 12, 200 million, versus 121 million, the mean of total assets for the Irish firms from our data. 3 Acharyaa et al (2015), Carvalho et al (2014)
4
banks which is not subject to the delay in ratings agencies evaluation of risk. Arguably, market
based indicators, which combine banks’ balance-sheet data with measures of risk faced by the
bank’s creditors are preferable to the measures previously employed in the literature that are
based on banks’ balance sheet only. A major and persistent issue of bank lending channel studies
is disentangling the bank loan supply effect on firms’ investment from the effect of demand. This
perennial problem can be resolved in cases where credit data can be matched directly to firms
and data on both demand for, and supply of, loans exist. However, in countries such as Ireland
such data are not readily available and hence analysis requires substantial innovation. Another
contribution of our paper is that we carefully control for both domestic as well as foreign
demand, which is especially important for Irish firms, which are very integrated in world
markets. In addition we control for firms’ dependence of external finance, which influences the
degree to which firms respond to disruptions in the supply of bank loans. Finally, we account for
possible reverse causation in estimation by using instrumental variables.
We construct a unique dataset with information on borrowing firms and lending banks and the
connection between them. We find that bank distress negatively affects borrowing firm’s
investments. Our results also show that firms in industries that rely more on external finance for
investments will be more negatively affected by their bank’s distress; similarly, firms in
industries more sensitive to business cycles are also more influenced by the distress of their
lending bank. Interestingly, distress in the banking sectors affected firms with and without access
to alternative sources of finance differently. Those firms that can finance investments elsewhere
were able to avoid the negative impact of bank distress. This finding is consistent with the view
that public markets for firms in Ireland are substitutes to bank lending, and were able to offset
the negative shocks to the banking sector for borrowing firms during the crisis.
The paper is structured as follows: section 2 describes the data, and the econometric strategy.
Section 3 discusses the results. Section 4 provides robustness checks. Section 5 concludes.
2. Data Description and Econometric Strategy
2.1. Data Description
The data we use in this paper come from several sources: the Orbis database for detailed firm
level information, the Bankscope data for bank specific information, the Amadeus database for
the relationship between firms and their banks, and the Compustat data for calculating various
controls like external capital dependence, business cycles and trade sectoral dependence. In
addition, we used Data Stream and SNL financial databases to obtain Credit Default Swaps
(CDS) data, which we use as measures of bank distress.
An important advantage of the Amadeus database is that besides the unconsolidated balance
sheet and income statements for firms, it includes information on firms’ relationship bank(s),
which provides us with crucial information on firms-banks linkages. This information is essential
for investigating the effects of bank distress on firm performance. However, the Amadeus data
provides only the name of the banks firms have relationships with, and no bank identifier.
5
Therefore we had to manually search and match the names of each bank listed in Amadeus with
the names of the banks in Bankscope in order to also be able to retrieve information of those
banks. The vast majority of the firms in our sample report relation with one bank only. For the
very few that report more than one bank, we take the average of the CDS scores for the reported
banks. These firm-bank relationships tend to be very stable over time, as firms rarely if at all
change banks.4
The sample of Irish firms which report their bank relationships are spread over all sectors,
including manufacturing and services.5 We focus on firm level as well as bank level data for
Ireland for the crisis years, 2008-2014. After cleaning the data and constructing the relevant
variables we are left with 1644 firms in manufacturing and services sectors. Summary statistics
for the main variables in the regression are presented in Table A.
2.2 Econometric Methodology
Our basic specification links firms’ changes in capital expenditure to its determinants, including
bank distress. We use the following econometric model:
Δ(CapExp/Toas)ijt = β1Ageit + β2Sizeit + β3Cashit/Toasit + β4Bank Distresskt-2 + β5
ExternalFinanceDependancej + β6 BusinessCycleDependencej + β7 TradeDependencej + πt + εijt
where the dependent variable is the change in the ratio of firms’ capital expenditure divided by
total assets. We follow Claessens, Tong and Wei (2012) and use change in capital expenditure to
total assets in order to account for other firm characteristics, such as differences in profitability
before the crisis. We also account for various firm characteristics to capture other determinants
of changes in capital expenditure, like firms’ corporate policies, loan demand, etc. We thus
account for the age and the size of the firm, as well as the cash holdings/total assets.6 Firms’
cash holdings are particularly important and influence their investment level, especially during a
crisis, as Duchin et al. (2010) find. We calculate firms’ age as the difference between current
year and the year the firm was established. As firms’ size we use the logarithm of total assets.
The variable of interest which could potentially significantly impact firms’ capital expenditures
is bank distress. The recent crisis produced pronounced and severe bank distress coupled with a
very large decrease in economic activity by firms. Therefore, it is important to investigate to
4 Hubbard, Kuttner, and Palia (2002) emphasize the challenges that firms face when trying to obtain loans from other banks. Similarly, see Slovin, Sushka and Polonchek (1993) find that firms that rely on a bank lending relationship find it difficult and expensive to borrow elsewhere. 5 However, in the regressions we drop real estate, construction and finance because of the specific characteristics of
the Irish crisis which started primarily in the real estate sector. 6 Additionally, accounting for profitability does not change the results.

6
what extent the major drop in economic activity was driven by banking sector distress. Having a
timely and market based measure of bank distress, which can be readily applied across the
sample of banks is thus very important as it reflects the direct stress banks were under from
creditors.. We use a market-based measure of banks distress captured by using monthly CDS
spread data using the 5 year Tenor for Senior debt CDS only. CDS spreads are an important
metric of default risk—a higher spread on the CDS implies a greater risk of default by the
reference entity. The implicit connection we make is that credit supply is a function of the level
of the CDS swap spread. Since investment is a longer-term process and since banks distress may
not affect supply to finance firms’ investments immediately, we lag the bank distress variable in
all regressions. This also corrects for any possible issues of reverse causation.
Various factors, which may influence the relationship between bank distress and firms’
investments needed to be carefully controlled for to ensure the effect we are investing could be
clearly identified. The first and most obvious of these is external finance dependence. It may be
the case that firms industries that are more dependent on external finance rely more on their
banks to raise the capital needed for future investments, and would therefore be more affected by
negative shocks to their bank than firms in industries that rely less on external financing. In
order to account for this possibility we use detailed US firm level data from Compustat for 2000-
2006 and calculate industry level external finance sensitivities, using the methodology devised
by Rajan and Zingales (1998).7 The implicit assumption, common in the literature and used in
other studies as well,8 is that that the same sectoral external financing dependence applies to
firms in all other countries.
A second major variable that could possibly affect firms performance and which, if not included
in the regression could lead to an omitted variable bias, is the demand for credit. Especially
during recessions, firms face not only a decrease in their supply of credit but also negative
demand shocks. It is crucial therefore to properly disentangle the two shocks. We control for the
demand effect first, by accounting for firm specific variables in the regression. Second, we
construct and introduce in the regression an industry level business cycle sensitivity variable,
following the methodology developed by Tong and Wei (2008))9. We expect that firms in
industries that are more sensitive to business cycles experience a sharper decrease in their
economic activity, and therefore decrease their investments. Furthermore, this decrease in future
investments would reduce firms’ demand for loans. We account for this channel by including in
7 We use US data to construct a sector-level approximation of a firm's dependence on external finance for capital
investment following the methodology developed by Rajan and Zingales (1998). Specifically, we define:
Dependence on external finance for investment as: (capital expenditures – cashflow)/ capital expenditures for each
US firm during 2000-2006. We then take the median across all firms in each 3 digit USSIC industry to define the
industry level external finance dependence indicator. 8 Papers that have used such indexes include Claessens and Laeven, 2003; Raddatz, 2006; and Kroszner, Laeven,
and Klingebiel, 2007, Claessens, Tong, Wei, 2015. 9 We follow Tong and Wei (2008) and develop an industry-level business cycle sensitivity index using the stock
price reactions of US firms to the September 11, 2001 terrorist attack. We compute the change in the log stock price
for each US firm between September 10 and September 28, 2001. The measure of industry-level sensitivity to the
business cycle is then calculated as the median log stock price change over all firms in each three-digit USSIC
sector. This index captures the relative sensitivity of firms’ stock prices to unexpected business cycle shocks,
independent of firm's sensitivity to financial constraints or other shocks.

7
the regression an industry level business cycle dependence variable constructed again using the
US Compustat database. We rely on the sector characteristics of U.S. firms before the crisis,
which are exogenous to our sample of firms (see Rajan and Zingales, 1998), to proxy these
intrinsic industry characteristics.
We also take great care to account for a third channel which may impact firms’ behavior.
As the Great Recession started in the US and transmitted across international borders, it may be
that firms in industries that are more dependent on international trade are more adversely
affected than firms that serve domestic market. As exporting firms experience a decrease in their
economic activity they may choose to postpone further investments and decrease the demand for
their loans. This international demand channel could be particularly important for an economy as
integrated in world markets as Ireland. Not accounting for this possible channel may lead to a
spurious correlation bank distress and firm investments.10
In addition, introducing these three sensitivities allows us to check to what extent ex ante firms’
intrinsic characteristics (external financial dependence, sensitivity to domestic and foreign
demand) help explain changes in their ex post performance, i.e. investments during the crisis.
All regressions include year dummies. Regressions where no sectoral sensitivities are included
also contain industry dummies to account for any other industry specific shocks that may have
affected the credit demand of borrowing firms, their access to credit and firms’ investments.
3. Results
First we present the results from our baseline specification (Table 1), where changes in firms’
capital expenditures to total assets are regressed on firms’ size, age, and cash holdings. We find
that younger and larger firms invest more, the coefficients of both variables are statistically
significant at conventional levels. The level of cash holdings relative to total assets is also a
significant determinant of firms’ investments. Next, we introduce in the regression the main
variable of interest, our measure of bank distress, proxied by the value of bank CDS spreads. As
expected, bank distress negatively affects firms’ investments, confirming that negative shocks to
firms’ relationship banks negatively affect firms’ capital expenditures. The coefficient of the
CDS variable has the expected sign, it is negative and statistically significant. We next introduce
in the regression, one by one, industry specific sensitivities, to account for other possible factors
influencing firms’ investments and their demand for loans. We start with the external finance
dependence of the industry in which the firm operates. We expect that firms in industries that
rely more on external finance for investments will be more negatively affected by their banks’
distress. Indeed, the coefficient of the external finance dependence variable is negative and
10 The industry level measure of trade sensitivity is calculated by regressing the change in the log global exports at
the 3 digit industry level over the period 2000–2006 on the change in log global GDP (in US dollars) during the
same period. The coefficient of the global GDP variable is then used as the industry level sensitivity to global trade.
The above approaches assume that sensitivities to external finance, business cycle, respectively trade are intrinsic
properties of a sector; thus, sectoral indexes calculated using pre-crisis data can be used for other countries during
the crisis (Claessens, Tong, Wei, 2012).

8
statistically significant. Next, we account for the business cycle dependence, as firms in
industries more sensitive to business cycles may experience a sharper decrease in the demand for
their goods, a decrease in investments, and also a decrease in the demand for loans. Indeed, the
coefficient of the business cycle sensitivity variable is negative and statistically significant.
Finally, we also account for trade dependence - expecting firms in sectors more dependent on
trade to be affected more by the global recession. Again, the trade sensitivity variable is negative
and statistically significant, showing that firms in industries more integrated in world trade
decreased their investments more than firms in industries that are relatively less dependent on
global trade. Finally, we introduce in the regression all three sectoral sensitivities. The last
column of Table 1 shows the results. All sensitivities variables have the expected signs, are
negative and statistically significant. The bank distress variable of major interest remains
negative and statistically significant in all regressions. This suggests that even after accounting
for other possible factors that may have influenced firms’ investments, relationship banking is
very important and distress at firms’ banks was transmitted to their customers and negatively
affected their investments.
The size of the effect on Capital expenditure reduction is significant in magnitude as well. The
results indicate a 100 basis point increase in the level of the CDS swap spread on 5 Year Senior
Debt translated to $3.3 m fall in expenditure on investment.
4. Robustness checks
We first account for the fact that some firms might have anticipated the crisis, and hence could
have adjusted their balance sheets to insulate themselves as a precautionary measure by changing
their level of cash holdings or total assets, (see Claessens, Tong, Wei, 2012). Therefore, in the
regressions we use the pre-crisis values (i.e. we use year 2006) of age, size and cash
holdings/total assets. This specification will also correct for possible issues of reverse causality
between the change in capital expenditure and cash holdings. The results, presented in Table 2
are not substantially changed. The coefficient of bank distress, the variable of interest, remains
negative and statistically significant throughout all regressions, confirming our hypothesis that
supply-side banking shocks negatively affect firms’ investments.
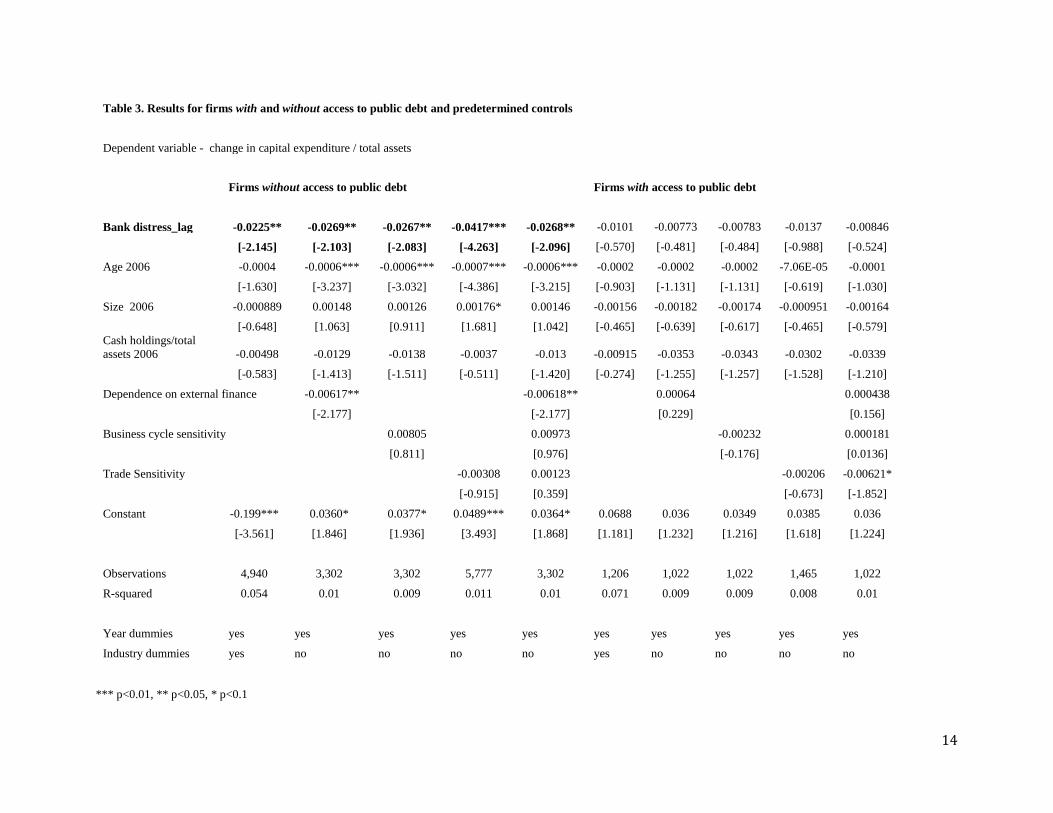
Secondly, to ensure that the negative effects of bank distress on firms’ investments are indeed
caused by bank loan supply reduction, we analyze separately whether firms without access to
public debt markets experience different impacts on their investments than firms with access to
alternative sources of finance. We follow Chava and Purnanandam (2011) and use the absence of
credit ratings as a proxy for firms without access to public debt markets. We test whether firms
without credit ratings are affected more by their bank distress than firms for which credit ratings
are available We thus rerun our regression on two different samples, firms with and without
credit ratings. As expected the regressions on firms without credit ratings, which rely primarily
or solely on their banks for external credit show consistent negative and statistically significant
coefficient of the banks distress variable. Interestingly, the results for firms with access to public
debt markets show that changes in the level of their capital expenditure is not impacted by bank

9
distress. This is however, not the case for firms without credit ratings, i.e, without access to other
sources of finance than their bank. In these cases the bank distress variable is negative and highly
statistically significant.
Finally, there may still be concerns about possible endogeneity in estimation. It is less probable
because our sample includes mostly small and medium size firms, so it is unlikely that their
difficulties may have impacted their banks; also, the banking crisis in Ireland was primarily
caused by their banks’ overexposure to less performing real estate mortgages, thus possibly
uncorrelated with their firms customers’ performance. However, to insure we obtain consistent
estimates we estimate a GMM regression (Blundell and Bond, 1998) and use the lag of bank
distress variable as an instrument together with the other variables in the regression. The results,
presented in Table 4, confirm our previous findings - banks distress is important and statistically
significantly affects firms’ capital expenditures.
5. Conclusions
In this paper we ask some important and previously unexplored question in the context of Ireland
- did bank distress restrict firms’ investments by transmitting a shock from the banking sector
into the real economy? We use unique data which allows us to connect firms with their
relationship banks. We are thus able to directly test whether distress at the firms’ banks hurt their
customers’ investments. The answers have several policy implications from the necessity of
banking stability to the maintenance of economic growth, the ability of firms to navigate bank
distress by access to public markets and issues of equity for the affected firms whose banks
suffered major losses.. We hypothesize that bank distress led to a contraction of loan supplies
and negatively impacted the Irish economy by hurting firms’ capital expenditures. We find that
indeed, bank distress, proxied by their market CDS spreads resulted in lower investments by
firms. The results are robust to accounting for various other firms’ characteristics and channels
through which the great recession spread across borders and impacted firms’ capital expenditure
and loan demand. We also find that in the context of Ireland bank distress negatively affected
firms’ investment but only in the case of firms dependent on banks for external finance, i.e. firms
with no access to public debt. These findings highlight the importance of the banking system as
provider of funds for firms’ investments.
References
Acharya, Viral V. and Eisert, Tim and Eufinger, Christian and Hirsch, Christian W., 2014. Real
Effects of the Sovereign Debt Crisis in Europe: Evidence from Syndicated Loans, CEPR
Discussion Paper No. DP10108.

10
Blundell, Richard, and Stephen Bond, 1998, Initial conditions and moment restrictions in
dynamic panel data model, Journal of Econometrics 87, 115-143.
Carvalho, D. R., Ferreira, M.A. and P. Matos. (2014). "Lending Relationships and the Effect of
Bank Distress: Evidence from the 2007-2008 Financial Crisis," Journal of Financial and
Quantitative Analysis, Forthcoming.
Chava, S., and A. Purnanandam. “The Effect of Banking Crisis on Bank Dependent Borrowers.”
Journal of Financial Economics, 99 (2011), 116–135.
Stijn Claessens & Luc Laeven, 2003. "Financial Development, Property Rights, and Growth,"
Journal of Finance, American Finance Association, vol. 58(6), pages 2401-2436
Claessens, Stijn & Tong, Hui & Wei, Shang-Jin, 2012. "From the financial crisis to the real
economy: Using firm-level data to identify transmission channels," Journal of International
Economics, Elsevier, vol. 88(2), pages 375-387.
Duchin R., Ozbas O. and Sensoy B.A., 2010, Costly external finance, corporate investment, and
the subprime mortgage credit crisis, Journal of Financial Economics 97, 418-435.
Jørn Inge Halvorsen & Dag Henning Jacobsen, 2009. "Are bank lending shocks important for
economic fluctuations?," Working Paper 2009/27, Norges Bank
Morgan Kelly, 2009. "The Irish credit bubble," Working Papers 200932, School of Economics,
University College Dublin.
Kroszner, Randall S. & Laeven, Luc & Klingebiel, Daniela, 2007. "Banking crises, financial
dependence, and growth," Journal of Financial Economics, Elsevier, vol. 84(1), pages 187-228,
April.
Hubbard, R Glenn & Kuttner, Kenneth N & Palia, Darius N, 2002. "Are There Bank Effects in
Borrowers' Costs of Funds? Evidence from a Matched Sample of Borrowers and Banks," The
Journal of Business, University of Chicago Press, vol. 75(4), pages 559-81, October.
Rajan, R., Zingales, L., 1998. Financial dependence and growth. American Economic Review 88
(3), 559–586.
Raddatz, Claudio, 2006. "Liquidity needs and vulnerability to financial underdevelopment,"
Journal of Financial Economics, Elsevier, vol. 80(3), pages 677-722, June.
Dell'Ariccia, Giovanni & Detragiache, Enrica & Rajan, Raghuram, 2008. "The real effect of
banking crises," Journal of Financial Intermediation, Elsevier, vol. 17(1), pages 89-112, January.
Tong, H., Wei, S.-J., 2008. Real effects of the subprime mortgage crisis: is it a demand or a
finance shock? NBER Working Paper No.14205, and IMF Working Paper 08/186.
Tong, H., Wei, S.-J., 2011. The composition matters: capital inflows and liquidity crunch during
a global economic crisis. Review of Financial Studies 24 (6), 2023–2052.

11
Table A. Summary statistics
Variables Obs Mean
Std.
Dev.
Change in Capital Expenditure/Total Assets 7230 0.01 0.15
Bank distress 7230 0.43 0.40
Age 7230 18.44 15.17
Size (log total assets) 7230 7.99 2.36
Cash holdings/total assets 7230 0.32 0.32
Dependence on external finance 5147 -0.07 0.79
Business Cycle Sensitivity 5147 -0.05 0.08
Trade Sensitivity 7230 0.12 0.44

12
Table 1. Regressions
Dependent variable - change in capital expenditure / total assets
Age -0.0006*** -0.0006*** -0.0009*** -0.0009*** -0.0010*** -0.0009***
[-4.834] [-4.455] [-6.672] [-6.602] [-7.755] [-6.594]
Size 0.001 0.001 0.00354*** 0.00341** 0.00373*** 0.00376***
[1.293] [0.719] [2.584] [2.495] [3.323] [2.706]
Cash holdings/total assets -0.0289*** -0.0320*** -0.0199** -0.0203** -0.0237*** -0.0198**
[-4.347] [-4.166] [-2.275] [-2.312] [-3.614] [-2.268]
Bank distress_lag
-0.0199* -0.0320** -0.0316** -0.0331*** -0.0328**
[-1.760] [-2.337] [-2.311] [-3.312] [-2.393]
Dependence on external
finance
-0.0042*
-0.0042*
[-1.798]
[-1.813]
Business cycle sensitivity
-0.0349**
-0.0311*
[-2.084]
[-1.887]
Trade Sensitivity
-0.0093*** -0.007***
[-3.586] [-2.668]
Constant -0.001 0.025 0.0433** 0.0425** 0.0439*** 0.0420**
[-0.0903] [1.297] [2.184] [2.144] [3.067] [2.114]
Observations 9,732 7,230 5,147 5,147 8,258 5,147
R-squared 0.051 0.062 0.017 0.017 0.019 0.018
year dummies yes yes yes yes yes yes
industry dummies yes yes no no no no
*** p<0.01, ** p<0.05, *
p<0.1

13
Table 1b. Regressions with predetermined controls
Dependent variable - change in capital expenditure / total assets
Age 2006 -0.0003** -0.0003** -0.0004*** -0.0004*** -0.0004*** -0.0004***
[-2.303] [-2.414] [-3.515] [-3.324] [-4.445] [-3.474]
Size 2006 -0.000255 -0.0011 0.000874 0.000682 0.001 0.000915
[-0.262] [-0.932] [0.749] [0.588] [1.139] [0.780]
Cash holdings/total assets 2006 -0.00443 -0.00785 -0.0147* -0.0159* -0.00514 -0.0147*
[-0.660] [-0.999] [-1.715] [-1.872] [-0.766] [-1.719]
Bank distress_lag
-0.0219** -0.0243** -0.0240** -0.0390*** -0.0242**
[-2.400] [-2.241] [-2.219] [-4.550] [-2.236]
Dependence on external finance
-0.00440**
-0.00443**
[-2.017]
[-2.028]
Business cycle sensitivity
-8.54E-05
0.0008
[-0.0102]
[0.0959]
Trade Sensitivity
-0.0030 -0.0014
[-1.216] [-0.560]
Constant 0.0507** 0.0145 0.0104 0.012 0.0389** 0.0102
[1.994] [0.832] [0.465] [0.534] [2.225] [0.457]
Observations 8,722 6,146 4,324 4,324 7,242 4,324
R-squared 0.035 0.045 0.008 0.008 0.009 0.008
year dummies yes yes yes yes yes yes
industry dummies yes yes no no no no
*** p<0.01, ** p<0.05, * p<0.1
14
Table 3. Results for firms with and without access to public debt and predetermined controls
Dependent variable - change in capital expenditure / total assets
Firms without access to public debt
Firms with access to public debt
Bank distress_lag -0.0225** -0.0269** -0.0267** -0.0417*** -0.0268** -0.0101 -0.00773 -0.00783 -0.0137 -0.00846
[-2.145] [-2.103] [-2.083] [-4.263] [-2.096] [-0.570] [-0.481] [-0.484] [-0.988] [-0.524]
Age 2006 -0.0004 -0.0006*** -0.0006*** -0.0007*** -0.0006*** -0.0002 -0.0002 -0.0002 -7.06E-05 -0.0001
[-1.630] [-3.237] [-3.032] [-4.386] [-3.215] [-0.903] [-1.131] [-1.131] [-0.619] [-1.030]
Size 2006 -0.000889 0.00148 0.00126 0.00176* 0.00146 -0.00156 -0.00182 -0.00174 -0.000951 -0.00164
[-0.648] [1.063] [0.911] [1.681] [1.042] [-0.465] [-0.639] [-0.617] [-0.465] [-0.579]
Cash holdings/total
assets 2006 -0.00498 -0.0129 -0.0138 -0.0037 -0.013 -0.00915 -0.0353 -0.0343 -0.0302 -0.0339
[-0.583] [-1.413] [-1.511] [-0.511] [-1.420] [-0.274] [-1.255] [-1.257] [-1.528] [-1.210]
Dependence on external finance -0.00617**
-0.00618**
0.00064
0.000438
[-2.177]
[-2.177]
[0.229]
[0.156]
Business cycle sensitivity 0.00805
0.00973
-0.00232
0.000181
[0.811]
[0.976]
[-0.176]
[0.0136]
Trade Sensitivity
-0.00308 0.00123
-0.00206 -0.00621*
[-0.915] [0.359]
[-0.673] [-1.852]
Constant -0.199*** 0.0360* 0.0377* 0.0489*** 0.0364* 0.0688 0.036 0.0349 0.0385 0.036
[-3.561] [1.846] [1.936] [3.493] [1.868] [1.181] [1.232] [1.216] [1.618] [1.224]
Observations 4,940 3,302 3,302 5,777 3,302 1,206 1,022 1,022 1,465 1,022
R-squared 0.054 0.01 0.009 0.011 0.01 0.071 0.009 0.009 0.008 0.01
Year dummies yes yes yes yes yes yes yes yes yes yes
Industry dummies yes no no no no yes no no no no
*** p<0.01, ** p<0.05, * p<0.1

15
Table 4. GMM regressions
Dependent variable: change in capital expenditure / total assets
Bank distress_lag -0.0317* -0.056*** -0.055*** -0.047*** -0.057*** -0.0292* -0.0426** -0.0423** -0.048*** -0.0426**
[-1.714] [-2.711] [-2.689] [-2.946] [-2.767] [-1.689] [-2.246] [-2.229] [-3.380] [-2.243]
Age -0.005*** -0.008*** -0.008*** -0.009*** -0.008***
[-3.485] [-5.714] [-5.649] [-6.532] [-5.632]
Size 0.0009 0.0033** 0.0030** 0.0035*** 0.0036**
[0.644] [2.360] [2.280] [2.981] [2.487]
Cash holdings/total assets -0.028*** -0.0179** -0.0183** -0.019*** -0.0179**
[-3.443] [-1.980] [-2.022] [-2.719] [-1.982]
Dependence on external finance -0.004 -0.00403 -0.00369 -0.00374
[-1.605] [-1.619] [-1.592] [-1.614]
Business cycle sensitivity -0.0312* -0.0272 0.000829 0.00198
[-1.829] [-1.614] [0.0948] [0.225]
Trade Sensitivity -0.008*** -0.007** -0.00297 -0.00229
[-2.968] [-2.529] [-1.134] [-0.862]
Age 2006 -0.0029* -0.004*** -0.004*** -0.004*** -0.004***
[-1.951] [-2.898] [-2.734] [-3.817] [-2.850]
Size 2006 -0.000441 0.00121 0.00106 0.00118 0.00128
[-0.364] [1.000] [0.875] [1.260] [1.049]
Cash holdings/total assets 2006 0.000194 -0.0105 -0.0115 0.000157 -0.0106
[0.0235] [-1.165] [-1.290] [0.0222] [-1.175]
Constant 0.0657 0.051 0.05 0.0393 0.0485 -0.00799 0.00932 0.0106 0.0373** 0.00908
[1.521] [1.378] [1.350] [1.594] [1.312] [-0.324] [0.410] [0.468] [2.104] [0.400]
Observations 5,974 4,253 4,253 6,796 4,253 5,041 3,546 3,546 5,939 3,546
R-squared 0.064 0.016 0.016 0.017 0.017 0.047 0.007 0.006 0.009 0.007
*** p<0.01, ** p<0.05, * p<0.1

16