bank bailouts, bail-ins, or no regulatory intervention? a ......capital decisions, rather than....
TRANSCRIPT

Bank Bailouts, Bail-ins, or No Regulatory Intervention? A Dynamic Model and Empirical
Tests of Optimal Regulation
The content of this paper is solely the responsibility of the authors and does not necessarily
represent the official views of Goldman Sachs or Federal Reserve Bank of Philadelphia.
Allen N. BergerUniversity of South Carolina
Wharton Financial Institutions CenterEuropean Banking Center
Charles P. HimmelbergGoldman Sachs & Co
Raluca A. RomanFederal Reserve Bank of Philadelphia
Sergey TsyplakovUniversity of South Carolina

Regulatory Resolution Regimes and Other Prudential Tools
The failure of large financial institutions can cause or worsen afinancial crisis and threaten the financial system and realeconomy.
Regulators design resolution regimes for handling capitalshortfalls and potential failure of large bank holding companies(BHCs) that pose systemic threats:• Bailouts (government provides capital).• Bail-ins (private sector provides capital).• No Regulatory Intervention (let them go bankrupt).
Regulators also employ other prudential regulatory tools as firstlines of defense to preempt the likelihood of distress:• Capital standards (backward-looking)• Stress Tests (forward-looking)
• We neglect these for this short presentation. 2

Regulatory Regimes in the US Prior to the financial crisis, very large U.S. BHCs likely
expected that they were “too big to fail,” and would be bailedout in the event of their financial distress.• During the crisis, these expectations were realized through
TARP and other bailouts. After the crisis, the 2010 Dodd-Frank Act introduced a bail-in
regime called the Orderly Liquidation Authority (OLA).• FDIC temporarily takes over, wipes out shareholders and fires
and replaces management.• BHC subsidiaries, including the banks, continue to operate.• Some debtholders have part of their debt claims turned into
equity, and the BHC is returned to the private sector. In 2017, the U.S. House of Representatives voted for the
Financial CHOICE Act, which would replace OLA with a noregulatory intervention regime.• BHCs would go bankrupt under a new Chapter 14. 3

This Paper We develop a dynamic theoretical model of the bailout, bail-
in, and no-regulatory-intervention regimes to address thefollowing questions:• How should these regimes be optimally designed?
• How aggressive should they be in taking actions againstdistressed banks?
• How does anticipation of different regimes affect the ex antecapital structure and recapitalization decisions of the BHCs?
• Which of the regimes is best? We also conduct an empirical analysis that tests some of the
important implications of the model.
4

Theoretical Contributions of our Paper There are a few dynamic theory papers on capital
requirements and stress tests.• In contrast, we dynamically model bailout, bail-in, and no
regulatory intervention regimes and their optimal terms. There are static models of optimal regulatory interventions.
• In contrast, our model is dynamic.• Our dynamic results are intuitive – such as that BHCs would
hold higher capital ratios in advance to avoid losing theirshares in a bail-in.
• Such results could not be derived using static models.
5

Empirical Contributions of our Paper In the empirical literature,
• Many studies of bailouts, mostly using U.S. data, and• Many studies of bail-ins using European data.
In contrast, we study the effects of expectations of bailoutspre-crisis and expectations of bail-in post crisis on BHCcapital decisions, rather than actual bailouts and bail-ins as inthe literature.
• Thus, we are able to see the effects of the bailout and bail-inregimes before any interventions occur.
6

Optimal Terms of Regulatory Regimes Regulators maximize a simple social welfare function:
Maxθ (MV of Bank - Expected External Disruption Costsfrom Default)
Optimal bailout regime is characterized by:• Bailout capital ratio trigger, θbailout*
Optimal bail-in regime:• Bail-in capital ratio trigger, θbail-in*
• Stress test critical capital ratio, θstress_test_bail-in*
Optimal no regulatory intervention regime:• Stress test critical capital ratio, θstress_test_no intervention*
The BHC optimizes its capital structure for the trigger pointsenforced by the regulator, and the regulator optimally sets thetrigger points, knowing how the BHC will react.
7

Solving the Model We solve the model for the different regimes numerically
using values that are calibrated to data for large BHCs.• Maxθ (MV of Bank - Expected External Disruption Costs from
Default)
• We initially assume that the expected external disruptioncosts to the financial system and real economy equal theexpected private costs of default to the bank’sstakeholders.
• Our findings are robust to a “Lehman-like” externaldisruption costs of 10 times the private costs of default.
8

Capital Structure of the Bank and BHC
ShareholdersBank Equity
Capital of BHC
SubDebt
Senior Senior Debt Debt
2%
91%
7%9%
91%
9
Amalgam of thecapital structureof the bank andthe BHC in whichthe capitalstructure of theBHC issuperimposedover the capital ofthe bank.

Bailout Regime
Negative ShockRegulator Injects
Equity
Shareholders'
GovernmentEquityEquity Stake
Shareholders Equity Shareholders EquitySub Sub SubDebt Debt Debt
Senior Senior Senior Debt Debt Debt
2%
Bailout Capital Ratio Trigger
2.9%
Initial Bank Capital
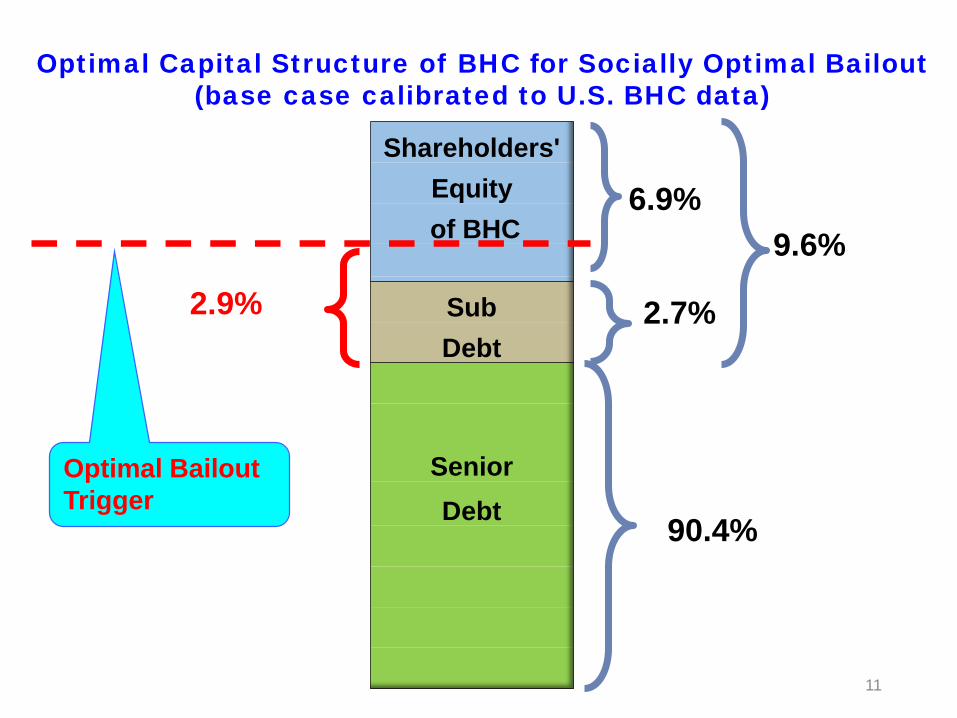
Optimal Capital Structure of BHC for Socially Optimal Bailout (base case calibrated to U.S. BHC data)
Shareholders'Equityof BHC
SubDebt
Senior Debt
2.7%
90.4%
6.9%9.6%
Optimal Bailout Trigger
2.9%
11

Negative Shock
Shareholders are wiped out.
Bank continues operations.
Shareholders'
Equity
Shareholders EquitySub Sub Sub DebtDebt Debt Converts to Equity
Senior Senior Senior Debt Debt Debt
Stress Test Critical Capital Ratio
3.6%
12
Bail-in Regime
Bail-in Capital Ratio Trigger
Initial Capital Ratio

Shareholders'Equityof BHC
SubDebt
Senior Debt
3.0%
87.7%
10.0%12.3%
Optimal Bail-In Trigger = 3.6% Capital
Optimal Stress Test Critical Capital Ratio =
7.1%3.6%
13
Optimal Capital Structure of BHC for Socially Optimal Bail-in (base case)

No Regulatory Intervention Regime
Negative ShockBHC is
Liquidated
Shareholders'
Equity
Sub
Debt Sub Debt
Senior Senior Senior Debt Debt Debt
RecoverBank Assets
Minus DefaultCosts
14
Initial Bank Capital
Stress Test Critical Capital Ratio

Optimal Capital Structure of BHC for Socially OptimalNo Intervention Regime (base case)
Shareholders'Equityof BHC
Sub Debt
Senior Debt
(deposits)
0.1%
87.3%
12.7%
Optimal Stress Test Capital Ratio
8.0%12.6%

Main Findings of Model (1)
Bail-ins provide superior capital incentives for financialinstitutions.
• Only the optimally-designed bail-in regime generatesincentives for BHCs to recapitalize preemptively duringfinancial distress to avoid having their equity shares wipedout in a bail-in.
• Optimal bail-ins also result in higher initial capital ratios thanoptimal bailouts, in part because optimal bail-ins aretriggered at higher capital ratios.
• These two model implications are tested and corroborated inour empirical analysis.
16

Main Findings of Model (2) Optimally-designed bailouts and bail-ins clearly dominate the
no-regulatory-intervention regime, which includes only astress test.
• The no-regulatory-intervention regime makes both the BHCshareholders and the rest of the society worse off.
• Suggests that the more intrusive regulatory tools like bailoutsand bail-ins are more effective than stress tests alone.
We also find that bailouts and bail-ins result in roughly similarsocial welfare values.
• However, optimal bailouts do relatively well in the modelbecause they are optimally designed with prompt regulatoryactions and involve no subsidies, and the simple socialwelfare function does not include all social costs of bailouts.
17

Main Findings of Model (3) When the simple social welfare function is altered and the
regulator re-optimizes to take into account other reasonablebailout costs of:
• Using and risking public taxpayers’ funds to bail out private-sector BHCs, and/or
• Transaction costs of raising and distributing these funds,
Optimal bail-ins produce higher social welfare values thanoptimal bailouts.
18

Empirical Tests of the Dynamic Model
We study the effects of switching from expectations ofbailouts pre-crisis to expectations of bail-ins post crisis.
The dynamic model predicts higher initial capital andsubsequent capital adjustments in the bail-in regimerelative to the bailout regime.
Thus, we test for higher capital ratios and faster speedsof adjustment resulting from the change in regime.
19

Timeline for Bailout and Bail-in Periods
?2007:Q3-2009:Q4
Bail-in Period
Crisis Period, TARP is Implemented
Bailout Period
NoRegulatoryIntervention
2010:Q3-2017:Q22000:Q3-2007:Q2
20

Data for Empirical Tests Data for the top 50 publicly traded U.S. BHCs for the bailout
(2000:Q3-2007:Q2) and bail-in (2010:Q3-2017:Q2) periods.
The 8 very large, complex U.S. banking organizationsdesignated as Globally Systemic Important Banks (G-SIBs) isthe treatment group.• G-SIBs are the most likely to be subject to bailouts and bail-ins.
o All received TARP bailouts and all but one were in the initialinvoluntary participant group for TARP.
o Since OLA, the rating agencies have removed most of the support or“uplift” from government guarantees from the G-SIB’s credit ratings,sometimes citing OLA as the reason.
Remaining 42 large BHCs are the control group.
21
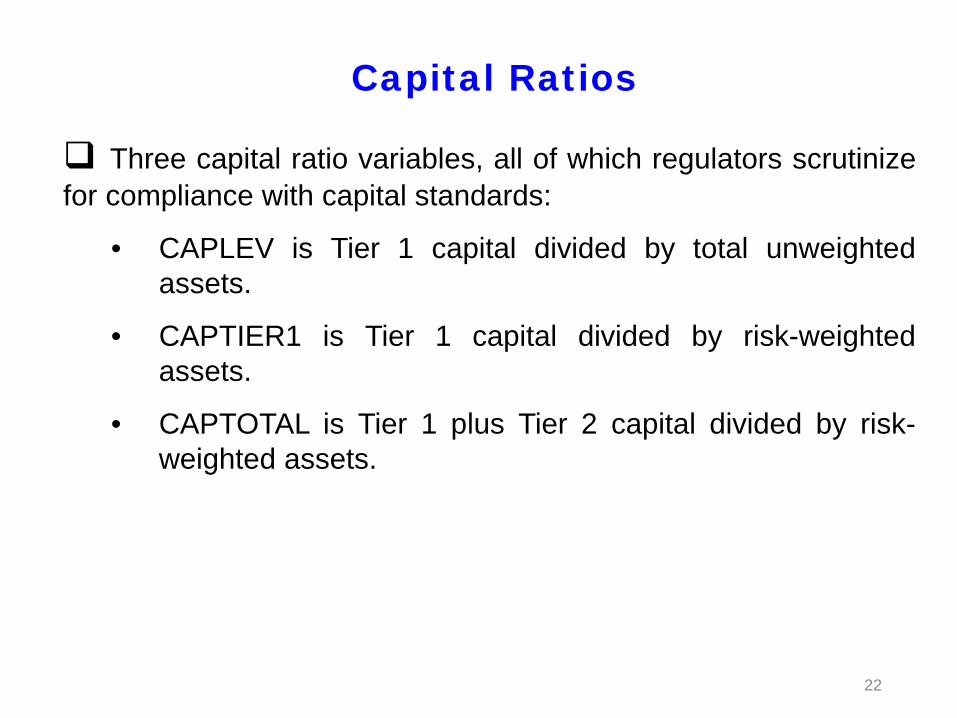
Capital Ratios
Three capital ratio variables, all of which regulators scrutinizefor compliance with capital standards:
• CAPLEV is Tier 1 capital divided by total unweightedassets.
• CAPTIER1 is Tier 1 capital divided by risk-weightedassets.
• CAPTOTAL is Tier 1 plus Tier 2 capital divided by risk-weighted assets.
22

Regression Models Difference-in-difference (DID) models to test model predictions
that in response to the change from bailout regime to bail-inregime, G-SIBs would increase capital ratios more than otherBHCs.
BANK CAPITALb,t = β1BAIL-IN PERIODt × TREATED_ BHCb
+ β2Xb,t-1 + β3TIMEt + β4 BHCb + ε b,t
• TREATED_BHC = 1 for G-SIBs, 0 for other BHCs.
• BAIL-IN PERIOD = 1 during 2010:Q3-2017:Q2.
• BAIL-IN PERIOD x TREATED_BHC captures the effect ofthe treatment (bail-in regime) on the treated BHCs (GSIBs).
o β1 > 0 would corroborate the model prediction that bail-insgenerate higher capital ratios.
• X is a vector of BHC characteristics, while TIME and BHCrepresent time and BHC fixed effects. 23

Regression ResultsDifference-in-Difference (DID) Analysis
(1) (2) (3)
VARIABLES CAPLEV CAPTIER1 CAPTOTAL
BAIL-IN PERIOD × G-SIB0.010***(6.79)
0.023***(11.37)
0.027***(13.10)
ROA 0.052** 0.087** 0.093**(2.070) (2.472) (2.569)
STDEVROA 0.176*** 0.351*** 0.420***(6.081) (8.754) (10.178)
MKTBOOK 0.025*** 0.029*** 0.003(6.210) (5.019) (0.437)
LNASSETS -0.010*** -0.012*** -0.013***(-9.447) (-8.474) (-9.094)
RETAILDEPOSITS -0.007*** -0.006* -0.007*(-2.636) (-1.646) (-1.725)
BUSINESSLOAN 0.016*** -0.028*** -0.015***(4.067) (-5.077) (-2.589)
LIQUIDITY 0.041*** 0.069*** 0.044***(5.371) (6.495) (4.011)
CDLOANS -0.031*** 0.011 0.033***(-3.700) (0.928) (2.789)
Other Controls YES YES YESTIME FE & BHC FE YES YES YESNo. Observations 2,796 2,796 2,796R-squared 0.928 0.917 0.899
24

Partial Adjustment Analysis The dynamic model also predicts that the bail-in regime
provides incentives for treated BHCs to rebuild capital priorto financial distress, whereas the bailout regime does not.• We operationalize this model prediction by testing whether
banks recapitalize faster to their targets in the bail-in periodthan the bailout period using a partial adjustment model.
• In the interest of brevity, we skip the setup of the partialadjustment model and go right to the empirical results andshow only the CAPLEV results.
o λ is the speed of adjustment toward target capital.
o λ increasing more for G-SIBs than for the control group fromthe bailout period to the bail-in period would corroborate themodel prediction.
25

Partial Adjustment Analysis
BAILOUT PERIOD (2000:Q3-2007:Q2)
BAIL-IN PERIOD (2010:Q3-2017:Q2)
Differences in
Regression Coefficients
(1) (2) (3) (4)
VARIABLES CAPLEV CAPLEV CAPLEV CAPLEV
𝜆𝜆 0.886*** 0.808***
(14.14) (23.52)
𝜆𝜆1 × G-SIB 0.388*** 0.926*** 0.538***(2.882) (29.754) (3.884)
𝜆𝜆2 × nonG-SIB 0.904*** 0.811*** -0.093
(14.5) (23.98) (-1.315)
Other BHC Controls YES YES YES YES
G-SIB × Other BHC Controls YES YES YES YES
No. Obs. 1,400 1,400 1,400 1,400 26
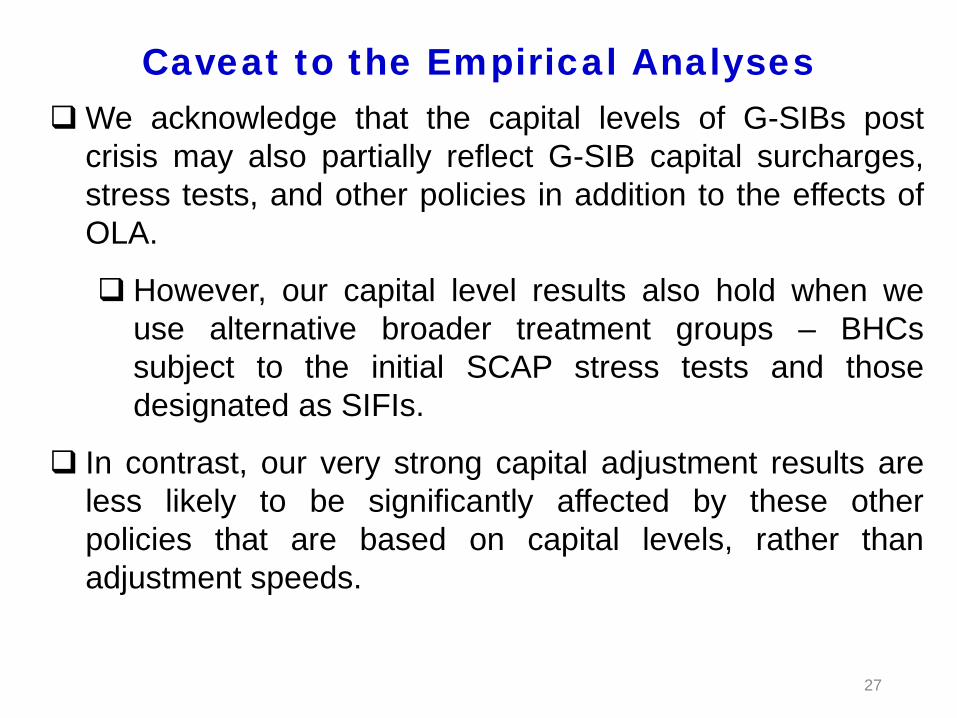
Caveat to the Empirical AnalysesWe acknowledge that the capital levels of G-SIBs post
crisis may also partially reflect G-SIB capital surcharges,stress tests, and other policies in addition to the effects ofOLA.
However, our capital level results also hold when weuse alternative broader treatment groups – BHCssubject to the initial SCAP stress tests and thosedesignated as SIFIs.
In contrast, our very strong capital adjustment results areless likely to be significantly affected by these otherpolicies that are based on capital levels, rather thanadjustment speeds.
27
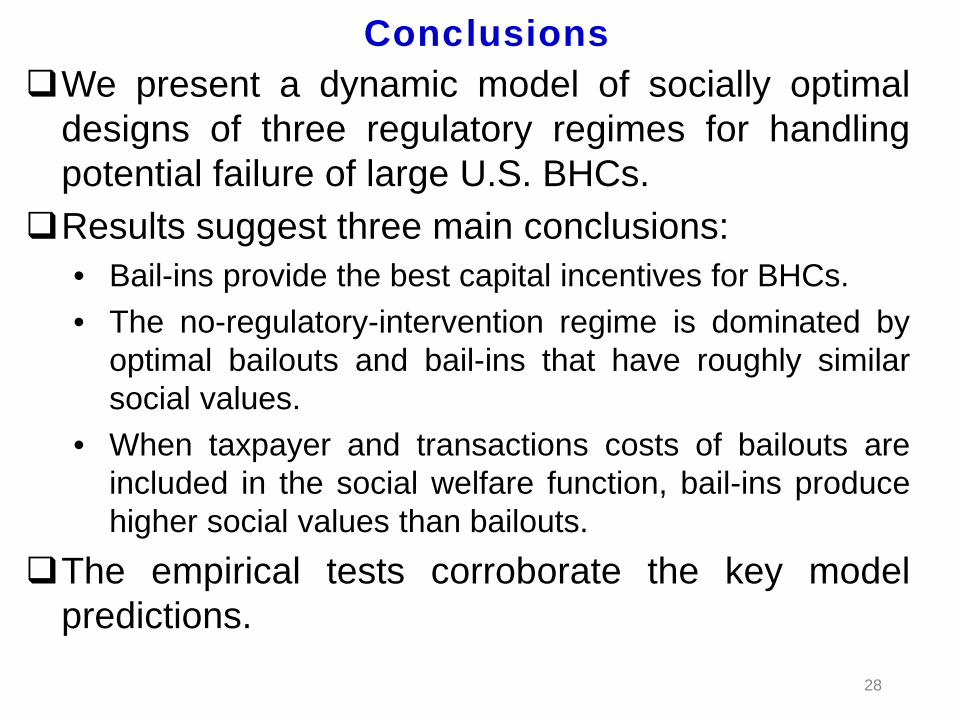
ConclusionsWe present a dynamic model of socially optimal
designs of three regulatory regimes for handlingpotential failure of large U.S. BHCs.
Results suggest three main conclusions:• Bail-ins provide the best capital incentives for BHCs.• The no-regulatory-intervention regime is dominated by
optimal bailouts and bail-ins that have roughly similarsocial values.
• When taxpayer and transactions costs of bailouts areincluded in the social welfare function, bail-ins producehigher social values than bailouts.
The empirical tests corroborate the key modelpredictions.
28

Policy ImplicationsOur results have clear policy implications.
• The no-regulatory-intervention regime is suboptimal.• Optimal resolution design requires a delicate balance in
terms of the “aggressiveness” of the regulator.• For example, bail-ins should be aggressive enough
to induce socially prudent behavior withoutsignificantly constraining banks’ abilities to operateefficiently.
• “One size fits all” resolution design is suboptimal.• Bailout, bail-in, and stress test triggers are best if
tailored to individual institutions.
29
Going Beyond the Model
Other factors outside the model may also matter for thecomparison of bailouts, bail-ins, and no regulatoryintervention.
Actual bailouts may perform significantly worse than inthe dynamic model.
• Optimal bailouts involve no subsidies or “free money”for BHCs, as regulators intervene in a timely fashionand dilute the claims of shareholders.
• In reality, regulators likely step in later than is optimaland provide government subsidies to BHCs inbailouts, rewarding BHCs that are too big to fail.
30

Going Beyond the Model (cont.)
Actual bail-ins may perform better or worse than in the model.
• Benefits: May better protect taxpayers, provide better marketdiscipline, improve asset allocations, level competitiveconditions across banks, and safeguard the financial system.
• Costs: May result in reduced credit supply to borrowers,impose losses on debtholders that do not understand theirexposures and are ill-prepared to monitor, be difficult toimplement under simultaneous distress of multiple largeinstitutions across countries.
Actual no-regulatory-intervention regime may also havebenefits outside of the model.
• Market participants may take bank risk more seriously andprovide better market discipline under this regime.
31