bangladesh quarterly economic update - september 2013 · 2014-04-10 · bangladesh development...
TRANSCRIPT
BANGLADESH
Quarterly
Economic
Update
September 2013

Bangladesh Resident Mission Asian Development Bank All rights reserved
Asian Development Bank September 2013
Bangladesh Resident Mission Plot E-31, Sher-e-Bangla Nagar Dhaka 1207 Bangladesh [email protected] BRM website: http://www.adb.org/BRM
ADB website: http://www.adb.org
The Quarterly Economic Update (QEU) is prepared by the Economics Unit of the Bangladesh Resident Mission, Asian
Development Bank (ADB). The views expressed in the QEU are those of the authors and do not necessarily reflect the
views of the ADB or its member governments. The QEU is published in March, June, September and December. In any designation of or reference to a particular territory or geographic area in this document, the Asian
Development Bank does not intend to make any judgments as to the legal or other status of any territory or area.

BANGLADESH
Quarterly Economic Update
September 2013
CONTENTS
Page
MACROECONOMIC DEVELOPMENTS 1
Highlights 1
Sector Performance and Economic Growth 1
Agriculture 5
Industry 8
Services 10
Inflation 11
Fiscal Management 12
Monetary and Financial Developments 14
Balance of Payments 17
Exchange Rate 20
Capital Market 20
NOTES
(i) The fiscal year (FY) of the government ends on 30 June. FY before a
calendar year denotes the year in which the fiscal year ends, e.g., FY2013 ends on 30 June 2013.
(ii) In this report, “$” refers to US dollars, and “Tk” refers to Bangladesh taka.
Vice-President B.N. Lohani, Vice-President-in-Charge, Operations 1
Director General J. Miranda, South Asia Department (SARD) Country Director M.T. Kho, Bangladesh Resident Mission (BRM), SARD Team leader M.Z. Hossain, Principal Country Economist, BRM, SARD Team members S. Viswanathan, Economist, BRM, SARD
S. Rahman, Senior Economics Officer, BRM, SARD M.G. Mortaza, Economics Officer, BRM, SARD B.K. Dey, Associate Economics Officer, BRM, SARD

1
-2
0
2
4
6
8
FY2009 FY10 FY11 FY12 FY13Estimate
Percentage points
Figure 1. Demand-side contributions to growthConsumption InvestmentNet exports Statistical discrepancyGDP growth
MACROECONOMIC DEVELOPMENTS Highlights • At 6.0%, GDP growth in FY2013 remained respectable
• Agriculture growth slowed to 2.2% as falling prices affected
crop production • Industry grew by 9.0%, led by stronger growth in
construction and small-scale manufacturing • Services growth declined to 5.7% because of stagnant
imports and slower trade and transport services growth • Inflation declined in FY2013, with the fall in food and
nonfood prices • Fiscal deficit in FY2013 remained within prudent limits • Sluggish business environment slowed private credit flow
• High remittance growth along with lower trade deficit raised
the FY2013 current account surplus
• A better business climate and higher private sector participation in infrastructure development needed to boost domestic and foreign investment
• More productive jobs needed to ensure inclusive economic growth
Political stability is critical for shifting the Bangladesh economy to a higher growth trajectory
Sector Performance and Economic Growth
1. The Bangladesh economy continues to maintain growth momentum. Although at 6.0%, gross domestic product (GDP) growth in FY2013 was lower than 6.2% in FY2012 (Figure 1), this quite respectable growth was attained in a challenging global and domestic environment. The slight moderation in growth was due to weaker aggregate demand, as private investment fell and consumption remained subdued, with imports remaining flat and
At 6.0%, GDP growth in
FY2013 was respectable

2
private credit growth slowing. The growing political uncertainty ahead of the national elections encouraged consumers to adopt a more cautious approach to spending and investors to postpone major investment decisions. However, robust remittance inflows and more exports to traditional markets and expansion into newer export destinations, such as Brazil, Canada, the People’s Republic of China (PRC), India, Japan, the Republic of Korea and South Africa, together with higher public investment, partly offset lower aggregate demand. 2. Agriculture growth in FY2013 slowed as falling rice prices affected crop production. Industry grew briskly, led by stronger growth in construction and small-scale manufacturing. Services growth slowed because of stagnant imports and frequent hartals (national strikes), which disrupted supply chains and trade and transport services. 3. Macroeconomic management remains sound. Monetary policy was able to stabilize inflation, as annual average inflation (with 2005/06 as the base year) slowed from 8.7% in FY2012 to 6.8% in FY2013. Fiscal policy remained broadly consistent with macroeconomic stability and debt sustainability, and the deficit was kept in check within the targeted 5.0% of GDP. Strong revenue performance, underpinned by tax policy and tax administration reforms, was reflected in a 1 percentage point rise in the revenue–GDP ratio. Public spending policy was consistent with the medium-term macroeconomic framework focusing on greater inclusion through larger development allocations. The subsidy bill was kept in check by raising fuel and power prices. Full delivery of the annual development program remains a key challenge. Debt sustainability indicators do not signal any risk for debt servicing for external and domestic debt. The current account recorded a large surplus due to lower imports and higher exports and remittance inflows. The foreign exchange market interventions of Bangladesh Bank (the central bank) prevented excessive taka appreciation. 4. Bangladesh’s growth prospects are held back by inadequate capital stock, and low labor productivity and total factor productivity (TFP) growth. Preliminary results from a recent study show that the country’s actual output closely follows the track of potential output, implying modest scope for pushing up GDP growth without creating inflationary pressures.1 The output gap, measured by the difference between actual and potential GDP, is quite small, suggesting limited policy maneuverability to shift the economy to sustained higher growth of 7%–8% envisaged in Bangladesh’s Sixth Five Year Plan. Unless the
1 S. Rahman, M.Z. Hossain, and S. Viswanathan. 2013. Study on Estimation of
Potential Output and Output Gap in Bangladesh, Draft report. Dhaka: Asian Development Bank.
Macroeconomic
management was sound
Bangladesh needs to raise productive capacity
Growth in agriculture and
services slowed

3
country’s productive capacity, as indicated by the potential output, is expanded by raising investment in infrastructure, skills development, and stimulation of TFP growth, attaining the medium-term growth targets while maintaining macroeconomic balance will be a challenge.
5. Bangladesh needs to raise investment as a share of GDP. A recent World Bank study shows that in FY2011 Bangladesh underinvested by 6.2 percentage points of GDP, with actual investment of 25.2% of GDP compared with the desired 31.4%.2 Experience of successful developing countries in Asia demonstrates that during the initial development stage, capital accumulation is the major driver of economic growth, with efficiency gains and TFP growth taking hold during more mature stages. Investment in Bangladesh is constrained by inadequate infrastructure and skills, the undeveloped finance sector, and the weak investment climate. Slow progress in capacity development and strengthening economic governance, and political uncertainties contribute to stagnating private investment, both domestic and foreign. 6. To boost private investment, Bangladesh needs to deepen policy reforms. Progress is needed in trade policy reforms. Average tariff rates are now lower but remain high by cross-country comparison. Nontariff barriers that distort trade need to be minimized. The government has initiated institutional changes for customs and trade facilitation, improving logistics, privatizing container handling, and establishing web-based electronic trade portals. More progress in these and related areas is needed to harness the full potential of trade for economic growth. The finance sector has expanded in terms of outreach and access, but its depth and efficiency remain low. Weak governance in state-owned commercial banks has undermined the sector’s strength and efficiency. A coherent set of reforms is being implemented to strengthen capital market policy, the institutional environment, and market oversight and surveillance; strengthen demand and supply; and stimulate market activities. Umbrella legislative frameworks and new institutional arrangements are supporting the development of public–private partnerships (PPPs); confidence in this area needs to be gained by starting to finalize PPP transactions. 7. Many more productive jobs are needed for the rapidly growing labor force. Boosting productive job opportunities and increasing returns to labor are the most direct ways of ensuring inclusive growth. Bangladesh is poised to reap the demographic dividend of the growing working age population. Most laborers are unskilled; the shortage of skilled laborers is acute. More
2 World Bank. 2013. Bangladesh Development Update. No. 76457. Dhaka: World
Bank.
Bangladesh underinvests by more than 6 percentage points of GDP
Deepening policy reforms needed to raise private investment
Bangladesh needs to create many more productive jobs for ensuring inclusive
economic growth

4
investment is needed in infrastructure and skills development to create the base for a dynamic industry sector, capable of creating productive job opportunities. 8. More foreign direct investment (FDI) is needed to support technological advances, increase productivity, and contribute to accelerated growth. FDI inflows can help deepen finance sector development, expand the export sector, and modernize the services sector. Net FDI inflows remain low ($1.3 billion in FY2013), despite the country’s advantageous geographic location, competitive labor costs, policies conducive to attracting FDI, and favorable credit ratings. Infrastructure deficits in terms of power, gas, and port and transport services contribute to the depressed FDI inflows. Bureaucratic delays, factor market (e.g., labor, finance and land) deficiencies, and skills shortages are also major hindrances.
9. Maintaining macroeconomic stability and efficiently managing aggregate demand are essential to provide the framework for encouraging private investment, stimulating economic activity, and supporting growth. The central bank’s focus on containing inflation, while ensuring adequate credit flows to the private sector, is a sound element of current monetary policy. Close coordination of monetary and fiscal policies is needed to strengthen demand management. Macroeconomic stability is inseparably linked to continued political stability. Broad bipartisan consensus on key development policy issues is an essential platform for advancing and sustaining critical growth-supporting reforms.
10. Supply-side constraints require attention. Power and gas shortages need to be addressed by increasing involvement of the private sector in infrastructure development, including through PPP. Skills development will require clear understanding of the current and potential skill needs of industries, closer linkages between industries and training providers, continued strong and coherent government policy, and institutional and logistical support. Measures to strengthen finance sector stability by adopting appropriate macroprudential policies while enhancing depth, efficiency, and access will need priority attention. While the more immediate task is to improve banking sector health and strengthen banking performance, developing the capital and bond markets as more dependable sources of industrial and long-term infrastructure financing is critical. To ensure judicious use of the county’s limited public financial resources, tax policy, tax administration, and subsidies must be reformed, and the productivity of public spending increased. In view of growing land shortages, land management system will need to be improved.
11. GDP growth in FY2014 is expected to be lower because of likely weaker exports, and stagnant consumption and investment
Macroeconomic stability is essential for investment and growth
Supply-side constraints need more attention
Higher FDI inflows are essential for accelerating growth
GDP growth in FY2014 will
be lower
5
2.3
12.8
18.8
1.02.2
12.9
18.8
1.3
0
5
10
15
20
Aus Aman Boro Wheat
Million tons
Figure 2. Food-grain production
FY2012 FY2013
demand. Rising political uncertainty may prompt consumers and investors to continue to maintain caution in their approaches to spending.
Agriculture 12. Agriculture growth in FY2013 fell to 2.2% from 3.1% in FY2012; crop and horticulture growth declined to 0.2% from 2.0%. Lower prices and higher production costs due to increased seed, fertilizer, irrigation, and transport costs contributed to the decreases. 13. If normal weather prevails, agriculture growth in FY2014 is expected to be higher because of the low base in FY2013. To encourage farmers to increase crop production, more attention needs to be given to ensuring they receive fair prices for their crops. The wide margin between a grower’s price and the retail price suggests that intermediaries are reaping disproportionately large benefits. Developing integrated supply and marketing networks, and strengthening agribusiness infrastructure, including storage facilities, will ensure better prices for farmers. More investment is needed for research and development in agriculture, and for developing transport and related infrastructure for establishing better farm-to-market linkages.
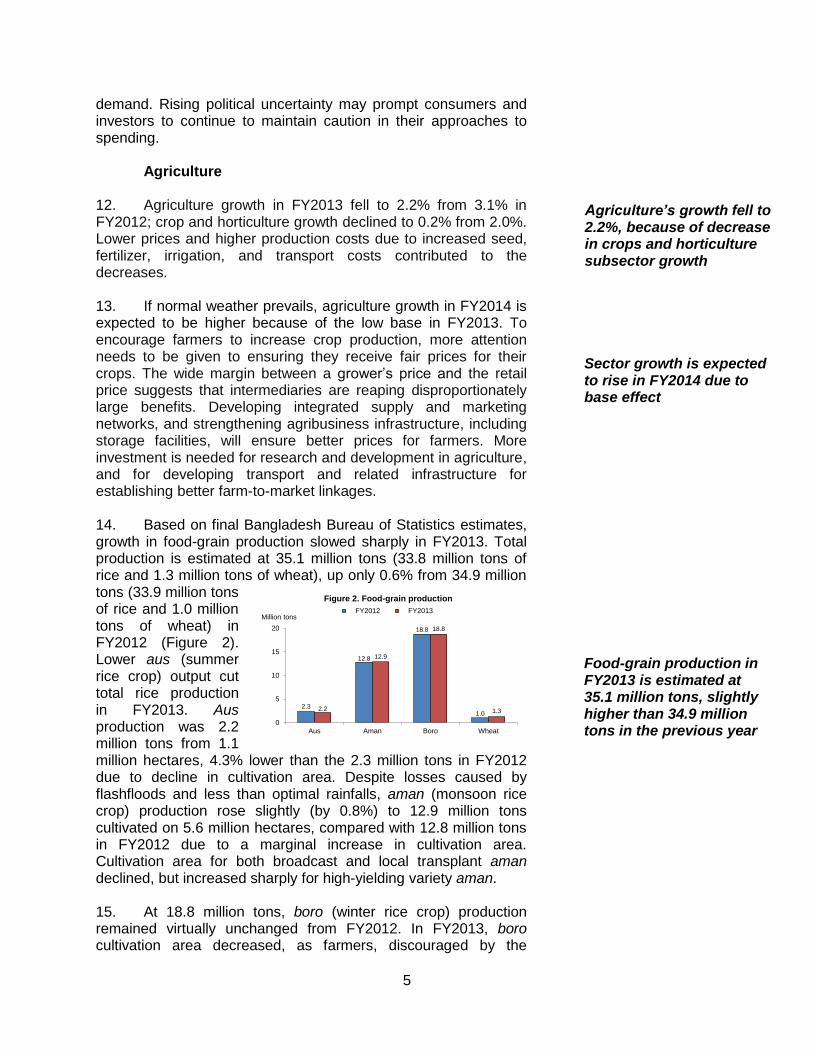
14. Based on final Bangladesh Bureau of Statistics estimates, growth in food-grain production slowed sharply in FY2013. Total production is estimated at 35.1 million tons (33.8 million tons of rice and 1.3 million tons of wheat), up only 0.6% from 34.9 million tons (33.9 million tons of rice and 1.0 million tons of wheat) in FY2012 (Figure 2). Lower aus (summer rice crop) output cut total rice production in FY2013. Aus production was 2.2 million tons from 1.1 million hectares, 4.3% lower than the 2.3 million tons in FY2012 due to decline in cultivation area. Despite losses caused by flashfloods and less than optimal rainfalls, aman (monsoon rice crop) production rose slightly (by 0.8%) to 12.9 million tons cultivated on 5.6 million hectares, compared with 12.8 million tons in FY2012 due to a marginal increase in cultivation area. Cultivation area for both broadcast and local transplant aman declined, but increased sharply for high-yielding variety aman.
15. At 18.8 million tons, boro (winter rice crop) production remained virtually unchanged from FY2012. In FY2013, boro cultivation area decreased, as farmers, discouraged by the
Agriculture’s growth fell to 2.2%, because of decrease in crops and horticulture subsector growth
Sector growth is expected to rise in FY2014 due to base effect
Food-grain production in FY2013 is estimated at 35.1 million tons, slightly higher than 34.9 million tons in the previous year

6
previous year’s lower price for rice, opted for cultivation of more profitable crops and vegetables. Although boro cultivation was initially affected by water shortages, the yield was still higher than in FY2012, favored by adequate water supply at the maturity stages, good weather conditions, and a balanced use of fertilizer. Aided by favorable weather, 1.3 million tons of wheat was produced on 0.4 million hectares of land, 30.0% higher than 1.0 million tons in FY2012. Despite the previous year’s lower prices, farmers cultivated wheat on a larger land area. The rise in urban consumption of wheat is encouraging farmers to produce more wheat. 16. The government’s total food-grain procurement declined by 1.4% in FY2013 to 1.4 million tons (1.3 million tons of rice and 0.1 million tons of wheat) from the previous year. During the current season, the government procured 0.3 million tons of aman at Tk26/kilogram (kg) for parboiled rice and Tk25/kg for white rice, 0.3 million tons of boro at Tk29/kg, and 0.1 million tons of wheat at Tk25/kg. It procured 0.7 million tons of boro from the previous season. 17. Total food-grain imports declined by 17.4% to 1.9 million tons (0.03 million tons of rice and 1.9 million tons of wheat) in FY2013 from 2.3 million tons in FY2012, as rice imports were negligible due to sufficient domestic supply. Wheat imports by the private sector dominated food-grain imports. Private food-grain import totaled 1.4 million tons, and public import totaled 0.5 million tons. In the FY2014 budget, the government plans to import (including aided import) 1.3 million tons of food grains (0.3 million tons of rice and 1.0 million tons of wheat). The major part of the public import will be wheat, intended to stabilize flour prices and to increase the share of wheat in the overall public food distribution system (PFDS) programs. 18. Under the PFDS, the government distributed 2.1 million tons of food grains in FY2013 (1.5 million tons of rice and 0.6 million tons of wheat), unchanged from FY2012. It distributed 0.7 million tons of food grains through monetized channels and 1.4 million tons through nonmonetized channels. In the FY2014 budget, the government plans to distribute more food grains than in FY2013 as part of continuous efforts to enhance food security and minimize hardships experienced by vulnerable groups.
19. At the end of FY2013, after food-grain distribution through monetized and nonmonetized channels, the public food-grain stock stood at 1.0 million tons (0.7 million tons of rice and 0.3 million tons of wheat), lower than the 1.3 million tons at the end of FY2012, due to higher PFDS distribution during the second half of FY2013.
The government procured 1.4 million tons of food grains in FY2013 from
domestic sources
Food-grain import declined to 1.9 million tons in FY2013 from
2.3 million tons in FY2012
Government distributed 2.1 million tons of food grains in FY2013 and plans to distribute more in FY2014 to ease the hardships of vulnerable groups
Public stock of food grains was 1.0 million tons at the end of FY2013 down from 1.3 million tons a year
earlier

7
20. While agriculture’s share in GDP (17.2% in FY2013) has been declining, the sector’s importance in the economy remains undiminished. More than half of the country’s population depends on agriculture for their livelihood. Agriculture sector diversification is a priority for increasing sector productivity and growth. Ensuring sustainable household food security will require commercial transformation of the country’s largely subsistence agriculture through diversification to high-value crop (HVC) production, given the continuous decrease in arable land as the population grows. Diversification can provide various benefits such as meeting the changing dietary preferences of consumers as their income grows, meeting the needs brought about through changing demographics, developing specialized export markets and allowing the market to be more responsive to emerging opportunities. 21. Agriculture diversification can transform the sector from one based on lower-value-added products to one with higher value-added, creating jobs and raising the sector’s contribution to GDP and farmers’ incomes. Diversification is also required to attain better diets and nutritional balance. Noncereal crops, such as pulses and oilseed, are more profitable for farmers than even modern rice and wheat cultivation. This is due to lower input use and production costs, and suitability for production under non- or semi-irrigated conditions. With a growing population and per capita income, demand for fruits, vegetables, dairy products, fats, and oils is creating new opportunities for diversifying agricultural production away from cereals. Diversification can also contribute to developing agro based industries and agribusiness activities.
22. Diversification will require shifting resources from a primary staple crop, namely rice, to other cereal crops, from cereal to noncereal crops, and from crop to noncrop (livestock, fisheries, and forestry) agriculture. Bangladesh needs to promote both horizontal diversification, e.g., crop intensification by adding new HVCs to existing cropping systems to improve overall productivity, and vertical diversification, e.g., adding value to products through processing, regional branding, packaging, merchandizing, or other efforts to enhance the product. 23. Progress in crop diversification has so far been limited. In the Sixth Five Year Plan, the government attached greater priority to (i) attaining self-sufficiency in food-grain production; (ii) increasing production of other nutritional crops; and (iii) promoting the export of vegetables and fruits, keeping in view domestic production and consumption. 24. The Northwest Crop Diversification Project was a successful initiative for implementing the government’s crop
Diversification of the agriculture sector is vital for increasing sector productivity and growth
Limited progress in
diversifying agriculture
Successful diversification will require both horizontal and vertical expansion in agriculture
Agriculture diversification offers multiple potential benefits
8
7.3 7.0 6.9
13.7 13.5 13.5
9.1
0
2
4
6
8
10
12
14
16
FY2008 FY09 FY10 FY11 FY12 Jul-MayFY12
Jul-MayFY13
%
Figure 3. Growth of medium- and large-scale manufacturing production
diversification program through HVC production.3 Project objectives included (i) mobilizing small-scale farmer groups to expand HVCs through training, technology transfer, and provision of extension support and services; (ii) increasing HVC yields by adopting modern technology; (iii) providing credit support for producing HVCs and agribusiness; (iv) carrying out location-based adaptive research on HVCs; (v) promoting and ensuring HVC marketing management; (vi) creating employment opportunities and boosting farm income for poverty reduction; and (vii) building sustainable partnerships between nongovernment organizations and public agencies in providing credit, training, and extension services. Income of the project’s small-scale farmers rose by 21%—56% during 2004-2010, depending on the HVCs that the farmers cultivated and as a result, the country’s north-west region’s economy also gained impetus.
Industry
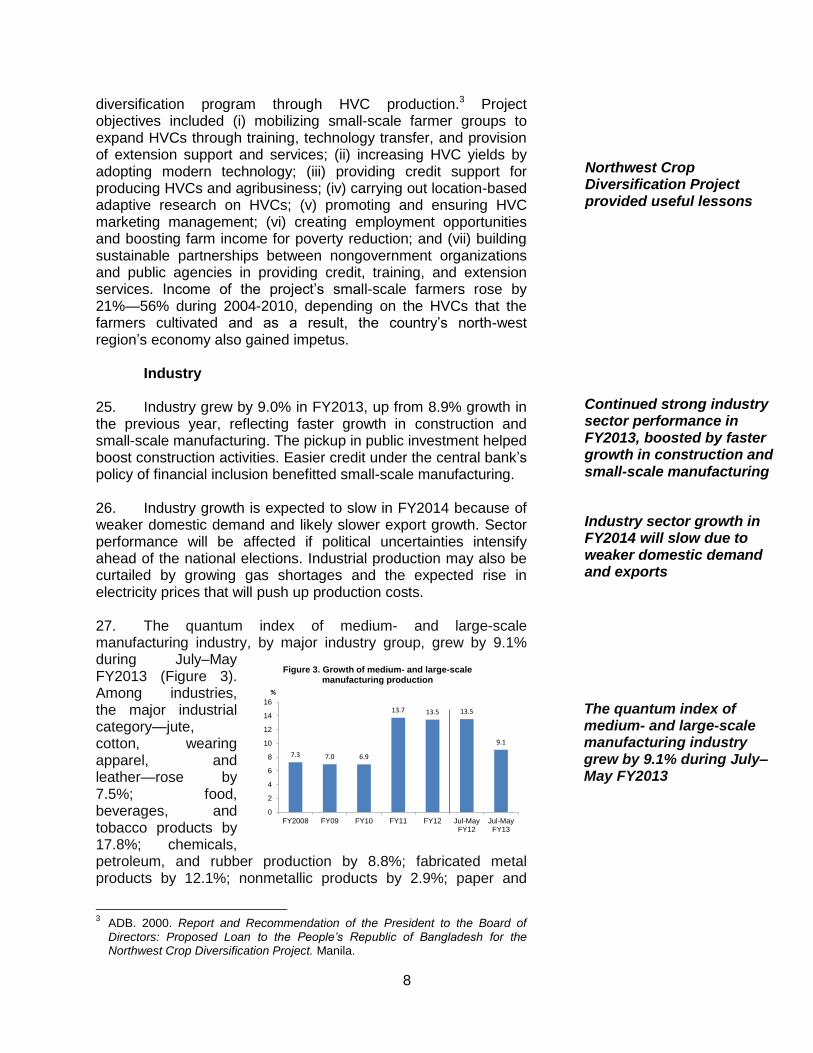
25. Industry grew by 9.0% in FY2013, up from 8.9% growth in the previous year, reflecting faster growth in construction and small-scale manufacturing. The pickup in public investment helped boost construction activities. Easier credit under the central bank’s policy of financial inclusion benefitted small-scale manufacturing. 26. Industry growth is expected to slow in FY2014 because of weaker domestic demand and likely slower export growth. Sector performance will be affected if political uncertainties intensify ahead of the national elections. Industrial production may also be curtailed by growing gas shortages and the expected rise in electricity prices that will push up production costs.
27. The quantum index of medium- and large-scale manufacturing industry, by major industry group, grew by 9.1% during July–May FY2013 (Figure 3). Among industries, the major industrial category—jute, cotton, wearing apparel, and leather—rose by 7.5%; food, beverages, and tobacco products by 17.8%; chemicals, petroleum, and rubber production by 8.8%; fabricated metal products by 12.1%; nonmetallic products by 2.9%; paper and
3 ADB. 2000. Report and Recommendation of the President to the Board of
Directors: Proposed Loan to the People’s Republic of Bangladesh for the Northwest Crop Diversification Project. Manila.
Continued strong industry sector performance in FY2013, boosted by faster growth in construction and small-scale manufacturing
Industry sector growth in FY2014 will slow due to weaker domestic demand and exports
The quantum index of medium- and large-scale manufacturing industry grew by 9.1% during July–May FY2013
Northwest Crop Diversification Project provided useful lessons
9
7.8
10.7
3.3
5.1
9.3
0
2
4
6
8
10
12
FY2009 FY10 FY11 FY12 FY13
%
Figure 4. Growth of small-scale manufacturing production
paper products by 1.8%; and basic metal products by 23.4%. Wood products, including furniture, declined by 3.9%.
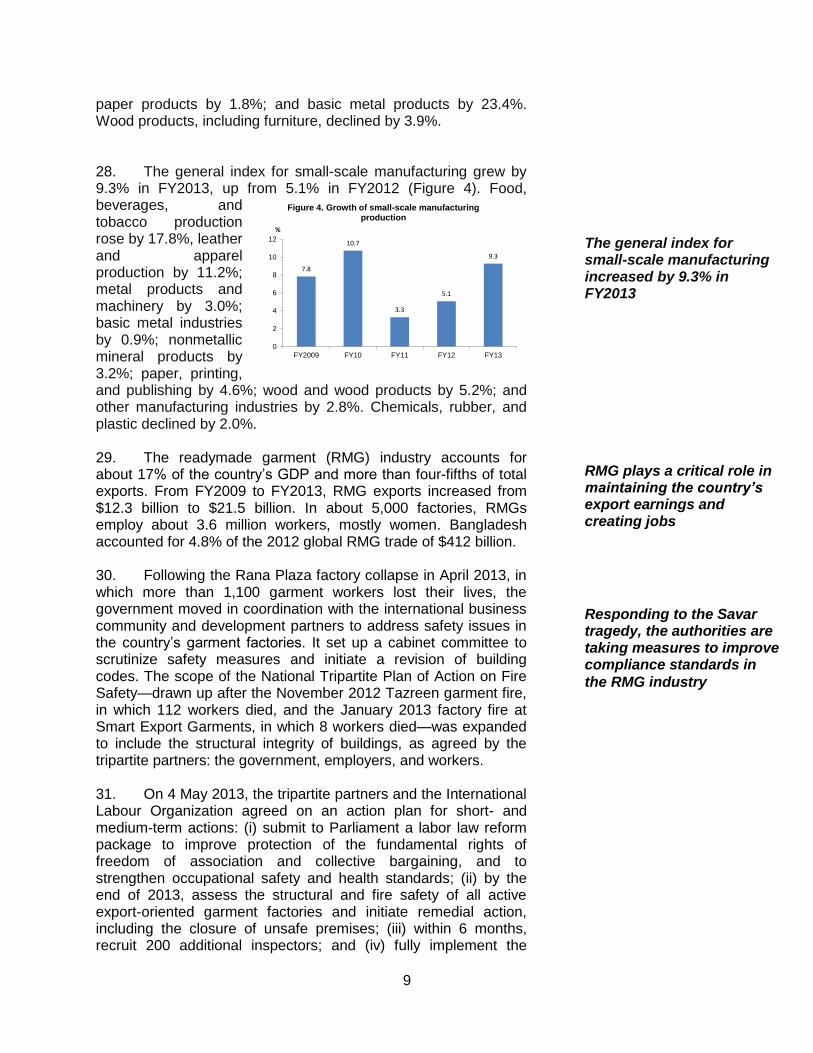
28. The general index for small-scale manufacturing grew by 9.3% in FY2013, up from 5.1% in FY2012 (Figure 4). Food, beverages, and tobacco production rose by 17.8%, leather and apparel production by 11.2%; metal products and machinery by 3.0%; basic metal industries by 0.9%; nonmetallic mineral products by 3.2%; paper, printing, and publishing by 4.6%; wood and wood products by 5.2%; and other manufacturing industries by 2.8%. Chemicals, rubber, and plastic declined by 2.0%. 29. The readymade garment (RMG) industry accounts for about 17% of the country’s GDP and more than four-fifths of total exports. From FY2009 to FY2013, RMG exports increased from $12.3 billion to $21.5 billion. In about 5,000 factories, RMGs employ about 3.6 million workers, mostly women. Bangladesh accounted for 4.8% of the 2012 global RMG trade of $412 billion. 30. Following the Rana Plaza factory collapse in April 2013, in which more than 1,100 garment workers lost their lives, the government moved in coordination with the international business community and development partners to address safety issues in the country’s garment factories. It set up a cabinet committee to scrutinize safety measures and initiate a revision of building codes. The scope of the National Tripartite Plan of Action on Fire Safety—drawn up after the November 2012 Tazreen garment fire, in which 112 workers died, and the January 2013 factory fire at Smart Export Garments, in which 8 workers died—was expanded to include the structural integrity of buildings, as agreed by the tripartite partners: the government, employers, and workers.
31. On 4 May 2013, the tripartite partners and the International Labour Organization agreed on an action plan for short- and medium-term actions: (i) submit to Parliament a labor law reform package to improve protection of the fundamental rights of freedom of association and collective bargaining, and to strengthen occupational safety and health standards; (ii) by the end of 2013, assess the structural and fire safety of all active export-oriented garment factories and initiate remedial action, including the closure of unsafe premises; (iii) within 6 months, recruit 200 additional inspectors; and (iv) fully implement the
The general index for small-scale manufacturing increased by 9.3% in FY2013
RMG plays a critical role in maintaining the country’s export earnings and creating jobs
Responding to the Savar tragedy, the authorities are taking measures to improve compliance standards in
the RMG industry

10
tripartite plan of action. On 15 July 2013, Parliament passed an amended labor law that provides workers with greater freedom to form trade unions. The law requires that sector-specific central welfare funds be set up for workers, with the involvement of buyers and company owners. On 11 May 2013, the government announced the creation of a wage board for fixing a new minimum wage for garment workers. 32. On 8 July 3013, the European Union (EU), the International Labour Organization, and the government adopted the Global Sustainability Compact, committing to several time-bound actions to improve labor, health, and safety conditions for workers and encourage responsible business conduct in the Bangladesh garment industry. Subsequently, the US declared association with the compact. Earlier, on 13 May 2013, the legally binding Accord on Fire and Building Safety in Bangladesh was signed by more than 70 European retailers engaged in the Bangladesh garment industry, as well as international labor federations and nongovernment organizations.
33. The 5-year accord requires rigorous safety inspections of the 1,200 factories in Bangladesh connected with the retailers within 9 months. The reports will be public, and retailers will ensure financing for required renovations and safety upgrades. Separately, on 10 July 2013, a group of about 20 North American apparel retailers founded the Alliance for Bangladesh Worker Safety. It requires about 500 factories to be inspected within a year for compliance with commonly agreed safety standards, with inspection results shared transparently. The retailers agreed to provide $42 million in grants and $100 million in low-interest loans to upgrade factory safety. 34. Unlike the European-sponsored accord, the alliance is legally binding only for the fulfillment of initial financial pledges, allowing members to opt out at any time thereafter. On 19 July 2013, the US government outlined its action plan to address worker rights and safety issues toward reinstating the Generalized System of Preferences. The Bangladesh garment industry now has a comprehensive institutional structure to ensure worker safety, but the global track record of factory inspections by companies hired to make these assessments reveals the extraordinary pressures that can compromise this crucial function. A wide-ranging, diligent, sustained, and transparent inspection process is thus essential for success.
Services 35. Services sector growth in FY2013 slowed to 5.7% from 6.0% in FY2012. Lower agriculture growth reduced activity in the sector. Growth in wholesale and retail trade, the major services subsector, fell to 4.7% from 5.6% in FY2012 because of weaker
Services sector growth slowed in FY2013 because of lower agriculture growth and slowdown in imports
The government in partnership with the EU and International Labour Organization adopted the Global Sustainability Compact

11
0
2
4
6
8
10
12
Jun12
Jul Aug Sep Oct Nov Dec Jan13
Feb Mar Apr May Jun Jul Aug
%
Figure 5. Inflation, 12-month moving average(Base: 2005-06=100)
Consumer price index Food Nonfood
0
2
4
6
8
10
12
14
16
Jul2011
Sep Nov Jan2012
Mar May Jul Sep Nov Jan2013
Mar May Jul
%
Figure 6. Inflation, point-to-point(Base: 2005-06=100)
Consumer price index Food Nonfood
domestic demand. Transport, communication, and storage services remained weak due to the slowdown in imports and work stoppages due to hartals. Lower financial services growth was caused by a slowdown in private credit and imports, and political unrest. 36. Services sector growth is expected to continue slowing in FY2014. While recovery of agriculture will help services growth, it will be partly offset by lower growth of the industry sector. Wholesale and retail trade is expected to weaken because of political unrest and lower domestic demand. Inflation
37. To reflect changing consumption patterns, in July 2012 Bangladesh Bureau of Statistics introduced a new consumer price index (CPI) series using 2005/06 as the base year. It included new consumption baskets and weights. By August 2013, the authorities had fully migrated to the new series. To reflect changing consumption habits when measuring inflation, the statistical agency considers the prices of 318 items in a rural basket and 422 items in an urban basket.
38. Annual average inflation, measured by the CPI using 2005/06 as the new base year, slowed from 8.7% in FY2012 to 6.8% in FY2013 (Figure 5) because of lower international food and commodity prices, and slower growth of private credit. Appreciation of the taka also contributed.
39. Year-on-year inflation slowed steadily to 5.0% in September 2012 from the peak of 12.7% in September 2011, because of the decline in food prices. Food inflation eased, as the new CPI assigns a higher weight to rice, the price of which declined. Nonfood prices also declined responding to slower growth in credit and appreciation of the taka. The headline rate rose slowly in subsequent months, reaching 8.1% in June 2013, as food prices rose following supply disruptions caused by
In FY2014, services sector growth is expected to
continue to slow
Inflation started to decline from the beginning of FY2014
New base year for measuring inflation
introduced
Inflation slowed to 6.8% in
FY2013 from 8.7% in FY2012

12
-10
0
10
20
FY09 FY10 FY11 FY12 FY13 FY14Budget
% of GDP
Figure 7. Fiscal deficit financing
Tax revenue Nontax revenue Current spendingDevelopment spending Domestic financing Foreign financing
national strikes and the rise in government-administered domestic fuel and power prices. Inflation started to soften again from July, reaching 7.4% in August (Figure 6) due to lower prices in the domestic and international markets.
40. After dropping to 1.8% in September 2012 from the peak of 14.9% a year earlier, year-on-year food inflation rose again, to 8.3% in June 2013. Food prices started moderating from July and reached 8.1% in August 2013. Nonfood inflation declined steadily to 7.8% in June 2013 from the peak of 11.8% in March 2012, and further to 6.4% in August 2013.
41. Urban inflation was higher than rural inflation. In August 2013, urban inflation was 8.3%, and rural inflation 6.9%. Urban food inflation was 9.5%, and nonfood inflation 7.1%, rural food inflation was 7.5%, and nonfood inflation 5.8%. 42. The expected rise in domestic fuel and power prices, and likely supply disruptions because of growing political unrest and the expected rise in public and private (garment) sector wages may put pressure on prices in the coming months. Wage increases may spill over into the rest of the economy creating demand pressures. Losses in crop production, if the weather becomes unfavorable, may lead to supply shortages and create price pressures.
Fiscal Management 43. Tax policy and administration reforms continued. Current spending was kept in check by lowering the subsidy bill. Implementation of the annual development program improved, although falling short of the budget target. The fiscal deficit was contained within the budget target. Bank borrowing was restrained avoiding crowding out private sector credit, and bank financing of the deficit did not exert any inflationary pressure. 44. Fiscal policy in FY2014 will be moderately expansionary, with public spending growing by 17.5%. Caution will be needed in utilizing the large “unallocated” item equaling 7.0% of revenues to ensure that it is not misspent on low-priority projects and activities. The fiscal deficit target is set at 4.6% of GDP, slightly tighter than the 4.8% recorded in FY2013, and entails trimming domestic borrowing to three-fifths of the deficit (Figure 7).
Fiscal management remains broadly prudent
Fiscal policy to remain moderately expansionary in
FY2014
Urban inflation continues to remain higher than rural
inflation
Both food and nonfood
inflation declining
Inflation is expected to rise
in the coming months

13
46.3 51.5
29.5
0.9
128.3
57.5 52.3
38.3
0.9
149.1
0
20
40
60
80
100
120
140
160
DomesticIndirect Taxes
Import Taxes IncomeTaxes
OtherTaxes
Total
Tk. billion
Figure 8. Revenue collection by the National Board of Revenue (July-August)
FY2013 FY2014
45. The FY2014 budget targets 19.9% growth in tax revenue to raise the revenue-to-GDP ratio by 0.6 percentage points. With nominal GDP forecast to grow by 14.5%, the higher revenue growth target could be difficult to reach unless discretionary measures are adopted. Tax collection may be affected by any disruption caused by political unrest.
46. During July-August 2013, total revenue collected by the National Board of Revenue (NBR) rose by 16.2% compared with July-August 2012 (Figure 8). Collection from income tax rose by 29.9%.
47. Domestic indirect taxes increased by 24.1% during July-August 2013 over July-August 2012, mainly because of the lower base in 2012. Domestic value-added tax (VAT) increased by 21.9% and domestic supplementary duty taxes by 30.4%. 48. The collapse in import growth affected import stage tax collection, as indicated by only 1.6% growth from import-based taxes achieved during July-August 2013, over the collection during July-August 2012. Tax collection from customs duties rose by 2.4% and import stage VAT collection by 3.2%; collection from supplementary duty on imports fell by 4.5%. 49. The authorities are seeking to boost revenue collection by strengthening tax administration. More taxpayers are being identified through nationwide surveys and by opening new tax offices. Tax compliance is expected to improve as better taxpayer services and a simplified tax return make compliance easier. An online process for registering taxpayer identification numbers uses information from national identity cards. 50. As a part of major policy reforms, the 2012 passage of a new VAT law (to be implemented in 2015) introduces a modern, computerized, business-friendly, and revenue-productive tax system. Moreover, in customs administration, ASYCUDA World software, generated by the United Nations-sponsored Automated System for Customs Data, is being introduced to upgrade procedures and augment revenue.
Political stability is vital for attaining fiscal targets
Fiscal revenue in July-August 2013 stands higher than July-August 2012
Domestic indirect taxes grew by 24.1% during July-August 2013
Collapse in import growth affected import-
based revenue collection
The authorities seek to strengthen tax administration reforms
Tax policy reforms are under way

14
-40
-20
0
20
40
60
80
Mar2010
Jul Nov Mar11
Jul Nov Mar12
Jul Nov Mar13
July
%
Figure 9. Growth of monetary indicators
Broad money Net credit to government
Credit to other public enterprises Credit to private sector
Monetary and Financial Developments 51. Although the central bank softened its monetary policy stance in early 2013, the change has had little impact in terms of stimulating money supply growth. Broad money (M2) growth moderated to 17.4% year-on-year in July 2013 from 18.1% in July 2012 (Figure 9), although slightly higher than the half- yearly monetary program growth target of 17.2% for FY2014. The lower M2 growth is driven by slower growth in domestic credit (13.7% compared with 19.8% in July 2012) due to lower credit demand from the government and the private sector. Domestic credit growth remained lower than the half-yearly target of 19.3%. Growth in net credit to the government declined to 23.1% in July 2013 from 23.6% in July 2012. The growth in private credit slowed to 11.6% in July 2013, and remained lower than the half-yearly target of 15.5% and actual growth of 20.3% a year earlier. However, growth in net foreign assets rose sharply to 39.2% in July 2013 from 15.7% in July 2012 because of the collapse in import growth and higher remittance inflows. 52. The growth of reserve money accelerated, reaching 20.3% year-on-year in July 2013 (higher than the half-yearly target of 15.5%) up from 10.2% in July 2012 because of the sharp rise in the central bank’s net foreign asset growth (46.2% compared with 17.5% in July 2012). This was aided by the strong remittance growth and lower import payments. At the end of July 2013, the reserve money multiplier rose marginally to 5.2 from 5.3 in July 2012. 53. In conducting monetary policy, Bangladesh Bank undertakes regular auctions of Treasury bills of different maturities with appropriate adjustments in their yields, and repo and reverse repo operations. Policy rates (repo and reverse repo) remained unchanged from rates set in February 2013. The weighted average yield on 91-day Treasury bills was 8.5% in September 2013, down from 11.1% in September 2012. Similarly, the yields on 182-day bills declined to 10.1% from 11.4%, on 364-day bills to 10.6% from 11.4%, and on 30-day bills to 7.7% from 9.4% in November 2012 when the auction was resumed after nearly 2 years. The lower Treasury bill yields and unchanged policy rates are consistent with the central bank’s objective of stimulating
Money supply growth moderated
Reserve money growth
accelerated
Bangladesh Bank adopts policy to stimulate growth

15
investment and growth, keeping in view downward inflationary trends. 54. The interbank call money market rate remained stable despite Eid festivals in August, as the central bank maintained close monitoring of the money market’s day-to-day liquidity position and credit demand was lower. On a weighted average basis, the interbank call money rate was 7.4% in September 2013, down from 9.8% in September 2012. Excess liquidity of the banking system increased as commercial banks kept lending rates high, and the sluggish business environment reduced demand for liquidity.
55. The tighter monetary policy, followed by Bangladesh Bank before January 2013, had little impact on the liquidity position: excess liquidity in the banking system remained high at Tk823.4 billion at the end of July 2013 up from Tk408.8 billion at the end of July 2012, reflecting the weakening of demand for liquidity. The government’s outstanding borrowing through sales of national savings certificates rose marginally to Tk651.4 billion at the end of July 2013 from Tk641.3 billion a year earlier, partly offsetting the decline in net credit growth to the government from the banking system.
56. The half-yearly monetary policy statement (MPS), July–December 2013 aimed to maintain inflation within 7.0%, while targeting a 6.2% GDP growth rate for FY2014, notably lower than the 7.2% growth target set by the government in the FY2014 budget. The MPS projects that year-on-year growth in M2 will rise to 17.2% in December 2013, and private sector credit to 15.5%. Although the MPS recognizes the need to limit government (including nonfinancial public enterprises) borrowing from the banking system, it allows scope for such borrowing to increase by up to 33.7%, up from 18.1% in June 2013. This understandably reflects the government’s likely need for higher borrowing in the event revenue collections fall short of target or expected external financing is not available. The MPS stresses the need to strengthen credit and debt markets to facilitate effective monetary policy transmission, and underscores the importance of improving corproate governance in banks. 57. The weighted average lending rate declined slightly to 13.6% at the end of August 2013 from 13.9% at the end of August 2012. The deposit rate rose to 8.6% from 8.3%, becoming positive in real terms because of lower inflation. The interest rate spread of the banking system narrowed from 5.6% in August 2012, but still remained high at 5.0% in August 2013, indicating continuing inefficiencies and market segmentation in the banking system. 58. Disbursement of industrial term lending stood at Tk425.3 billion in FY2013, 20.6% higher than the year earlier
Interest rate spread
narrowed
Excess liquidity in the banking system rose
Interbank call money rate
remained stable
Disbursements of industrial term loans rose
MPS aims to contain inflation while stimulating
growth

16
0
5
10
15
20
25
30
Q1 Q2 Q3 Q4 Q1 Q2 Q3 Q4 Q1 Q2
2011 2012 2013
%
Figure 10. Gross nonperforming loan ratios by type of bank
State-owned commercial banks Specialized banksPrivate commercial banks Foreign commercial banksAll banks
period. Disbursement to large-scale industries (65.7% of total industrial term lending) rose by 27.5%, medium-sized industries (27.2% of total funds) by 5.5%, and small and cottage industries by 25.4%. 59. Loans to agriculture and small and medium-sized enterprises (SMEs) were given priority, in line with central bank’s policy directives. While Tk141.3 billion was the target for credit disbursement to agriculture and nonfarm rural activity, actual disbursement was Tk146.7 billion in FY2013, an increase of 11.7% over FY2012. The government set a target of Tk146.0 billion for agriculture and nonfarm rural credit disbursement for FY2014; by August 2013, Tk15.5 billion had been disbursed. Outstanding loans to SMEs reached Tk1008.6 billion in June 2013, representing 8.3% growth over June 2012. The central bank set a Tk741.9 billion SME loan disbursement target (22.4% higher than for 2012) for 2013 for local and foreign banks and nonbanking financial institutions. 60. Financial soundness indicators for the banking system weakened in FY2013, especially for state-owned commercial banks. The ratio of gross nonperforming loans (NPLs) to total loans in the banking system rose to 11.9% at the end of June 2013 from 7.2% at the end of June 2012 (Figure 10). While the gross NPL ratio for state-owned commercial banks rose further to 26.4% at the end of June 2013 from 13.5% at the end of June 2012, the gross NPL ratio for private commercial banks rose to 6.6% from 3.8%, and for specialized banks to 26.2%, from 23.8%. The gross NPL ratio for foreign banks rose to 4.7% from 3.2% during the same period. The net NPL ratios for all banks rose to 4.4% at the end of June 2013 from 1.7% at the end of June 2012. 61. On 14 July 2013, Parliament passed the Bank Company (Amendment) Act, 2013 to enhance the central bank’s regulatory powers to help improve governance and strengthen discipline in the banking system. This gives Bangladesh Bank the authority to remove top executives of state-owned banks. A bank director can henceforth hold the position for a maximum of two successive 3-year terms and may return to the position after a gap of at least one term. A director can hold the same position in more than one financial company at the same time. The amendments ensure that banks will be allowed to invest in stocks not more than 25% of their regulatory capital, replacing the existing allowable limit of
Financial soundness
indicators weakened
Loans to agriculture and SMEs increased
Bank Company Act
amended

17
-20
-10
0
10
20
30
40
50
FY2009 FY10 FY11 FY12 FY13 Jul-AugFY13
Jul-AugFY14
%
Figure 11. Growth in exports and components
Knitwear products Woven garments Others Total
10% of their liabilities. Any current overexposure will have to be phased out within 3 years of enactment of the law. To prevent illegal banking activities by cooperative societies, the amendments authorize Bangladesh Bank to approve and monitor activities of nonbank organizations that collect deposits from the public. Balance of Payments 62. Export performance has been quite strong since the beginning of FY2014. Export earnings grew by 24.0% year-on-year in July 2013, although export growth slowed to 14.7% in the first 2 months of FY2014 (Figure 11). Exports actually declined by 6.9% in the year earlier period. Strong growth in RMG contributed to maintaining the good export performance. 63. RMG exports in July–August 2013—accounting for about 82.6% of total export earnings—grew by 17.1%, significantly better than the 7.0% decline in July–August 2012. Exports of woven garments rose by 17.0%, and export earnings from knitwear increased by 17.2%. Garment exports to the EU increased by 15.5% and to the US by 14.1%. Woven exports to the EU rose by 10.3% and knitwear exports by 18.8%, while woven exports to the US increased by 14.1% and knitwear exports by 13.9%. 64. Among other major export items, earnings from frozen food increased by 38.1%, leather 39.8%, and engineering products 32.4%; while export earnings from petroleum products declined by 26.1%, raw jute by 47.2%, and jute goods by 8.0%.
65. Export earnings from the EU—the main source of the country’s export earnings—grew by 19.0% in July–August 2013 to $2.7 billion (54.3% of total export earnings) and from the US by 10.1% to $977.6 million (19.4% of the total). Export earnings from newly discovered markets also increased significantly. In July–August 2013, export earnings from 13 countries increased by 10.9% to $967.2 million,4 which was 19.2% of total export earnings; garment export earnings rose by 15.1% to $651.7 million (12.9% of total garment export earnings).
4 Australia; Brazil; Canada; the People’s Republic of China; Hong Kong, China;
India; Japan; Republic of Korea; Russian Federation; South Africa; Thailand; Turkey; and the United Arab Emirates.
Garment exports rose by 17.1%
Exports grew by 14.7% during July–August 2013
Export earnings from the EU grew rapidly

18
-60
-30
0
30
60
90
120
150
180
FY2009 FY10 FY11 FY12 FY13 JulyFY13
JulyFY14
%
Figure 12. Growth in imports and components
Food grains Consumer goods Intermediate goods
Capital goods Others Total
-33.7 -34.3
2.8
57.4
-36.2
10.1
-38.9-60
-40
-20
0
20
40
60
80
FY2009 FY10 FY11 FY12 FY13 Jul-AugFY13
Jul-AugFY14
%
Figure 13. Out-of-country employment growth
66. The government set a $30.5 billion export target for FY2014, 12.8% higher than actual realization in FY2013. Attaining the target will be a challenge. Recovery in major economies remains slow and garment export expansion is expected to be weaker, in view of some unfavorable buyer reaction in the aftermath of the fatal factory fires last November and January, and the horrific factory collapse in April. The US suspension of the Generalized System of Preference over inadequate worker rights is also likely to suppress exports, although garments are not covered by the scheme. The less-competitive exchange rate due to the taka’s real appreciation will curtail exports. Ongoing political and labor unrest could disrupt production and distribution chains, and slow export growth. 67. Import payment (recorded by customs) increased by 8.0% in July 2013 over July 2012 (Figure 12). Among the import categories, import of food grains rose by 93.7%; textile and articles thereof by 14.2%; and iron, steel and other base metals by 20.7%. Imports of edible oil declined by 20.5%, petroleum by 20.3%, and raw cotton by 17.9%. Imports of capital machinery rose marginally by 1.7%. 68. In July 2013, the total value of import letters of credit opened rose by 29.8% because of an increase in letters of credit for industrial raw materials (2.7%), intermediate products (14.8%), petroleum products (141.3%), machinery for miscellaneous industries (39.3%), other consumer products (21.2%), capital machinery (62.5%) and food grains (209.7%). 69. Earnings from remittance inflows totaled $3.3 billion, a decline of 8.1% in the first 3 months of FY2014 over the corresponding period of FY2013 when they totaled $3.6 billion. Traditionally, remittances rise during festivals such as Eid, but this time such a trend was not observed ahead of the August festival. The growth in remittance inflows declined due to the large decline in out-of-country employment, especially in Middle Eastern countries.
Import letters of credit rose by 29.8% in July 2013
Remittance inflows declined by 8.1% during
July–September 2013
Attaining the export target
will be a challenge
Imports rose by 8.0% in
July 2013

19
70. Out-of-country jobs for Bangladeshi workers fell by 38.9% in July–August of 2013 (Figure 13) indicating a likely slowdown in remittance inflows in the remaining months of FY2014. A total of 65,046 Bangladeshis found jobs outside the country during that period, compared with 106,486 in the corresponding period of 2012, reflecting a sharp decline in recruitment in the United Arab Emirates (94.0%), Saudi Arabia (69.1%), and Oman (16.6%). Although small in terms of absolute numbers, jobs for Bangladeshi workers rose in Singapore by 6.9% and in Qatar by 107.3%. 71. Net FDI inflows increased, but net foreign assistance decreased. Net FDI rose to $144 million in July 2013 from $133 million in July 2012. Net foreign assistance fell to $41.8 million in July 2013, down from $156.8 million in July 2012. 72. The trade deficit narrowed to $129.0 million in July 2013 from $476.0 million in July 2012 because of lower growth of imports compared with exports. Despite higher services and primary income deficit during this period compared with a year earlier, the lower trade deficit raised the current account to a surplus of $754.0 million in July 2013 from a $284.0 million surplus in July 2012. 73. The combined capital and financial accounts recorded a deficit of $394.0 million in July 2013, significantly down from the surplus of $224.0 million in July 2012 because of a large deficit in short-term loans and net trade credit. As a result, the overall balance showed a lower surplus of $369.0 million in July 2013, down from the surplus of $553.0 million in July 2012.
74. According to the global competitiveness index (GCI), 2013–2014 of the World Economic Forum, Bangladesh recorded a gain in its competitiveness following the decline in 2012–2013 because of the improved ranking of infrastructure, macroeconomic stability, and market size.5 Bangladesh’s rank improved to 110 (of 148) from 118 (of 144) in the GCI, 2012–2013. The country’s overall competitiveness score rose by 1.6%. Of the 12 pillars, six showed growth: infrastructure, macroeconomic stability, health and primary education, market size, business sophistication, and innovation. Decline was observed in five pillars: public sector institutions, labor market efficiency, financial market sophistication, higher education and training, and technological readiness. The score for goods market efficiency remains unchanged. 75. Bangladesh Bank’s gross foreign exchange reserves rose to $16.2 billion (nearly 5 months of imports) at the end of
5 World Economic Forum. 2013.The Global Competitiveness Report, 2013–2014.
Geneva.
Gross foreign exchange
reserves rose
FDI rose, but foreign aid into Bangladesh declined
Overall balance shows a lower surplus
Current account moved to a surplus because of lower trade deficit
Growth of out-of-country jobs for Bangladeshi workers fell sharply

20
0
2
4
6
8
10
12
14
16
18
Jan2011
Apr Jul Oct Jan12
Apr Jul Oct Jan13
Apr Jul
$ billion
Figure 14. Gross foreign exchange reserves
75
80
85
90
95
100
105
11065
70
75
80
85
90
Jul2008
Jul09
Jul10
Jul11
Jul12
Jul13
IndexTaka/ $
Figure 15. Exchange rates
Nominal Real effective
September 2013 from $11.3 billion a year earlier (Figure 14). The central bank accumulated a large amount of foreign exchange through purchases from commercial banks to prevent the taka from appreciating and eroding the country’s export competitiveness. The rise in oil import-related credit and strong aid disbursements in FY2013 contributed to increasing the central bank’s foreign exchange reserves. Exchange Rate 76. The weighted average nominal (taka–dollar) exchange rate appreciated from Tk81.7 = $1.00 at the end of September 2012 to Tk77.8 = $1.00 at the end of September 2013 (an appreciation of about 5.0%) (Figure 15). In September 2013, the nominal effective exchange rate appreciated by 9.5% year-on-year, with demand for dollar weakening, as import growth was slower than export growth. Because of the higher nominal appreciation and higher domestic inflation relative to that of trading partners, Bangladesh’s real effective exchange rate appreciated by 14.6% year-on-year as of the end of September 2013, implying some loss in export competitiveness. Capital Market 77. Although rapid price corrections have taken place since July 2012 with significant volatility in major stock market indicators, the Dhaka Stock Exchange (DSE) indicator rebounded by mid-2013 following the government’s decision to refinance
Both nominal and real effective exchange rates
appreciated
Major stock market
indicators recover
0
2000
4000
6000
8000
10000
0
500
1000
1500
2000
2500
3000
3500
4000
Jan10
Apr Jul Oct Jan11
Apr Jul Oct Jan12
Apr Jul Oct Jan13
Apr Jul
IndexTk billion
Figure 16. Dhaka Stock Exchange: Market capitalization and general index
Market capitalization General index

21
stock market intermediaries. The DSE general index grew by 4.4% from July 2012 to July 2013, reaching 4,342.3 points (Figure 16). The market price–earnings ratio rose from 11.8 in July 2012 to 14.4 in July 2013, reflecting price recovery in the market. Since January 2013, 11 new companies have been listed in the stock exchange. DSE market capitalization rose by 6.3% by July 2013 from July 2012. Net foreign portfolio investment in July 2013 was $37.0 million, up from $22.0 million in July 2012. From August 2013, DSE has introduced DSE Broad Index using free float method, replacing DSE General Index. 78. The Chittagong Stock Exchange (CSE) has been calculating its indexes using free float method from February 2013. CSE selective categories index showed mixed trends. Although the CSE index fell by 3.1% by 31 July 2013 from 31 July 2012, CSE market capitalization rose by 8.0% during the same period. 79. Following enactment of the Demutualization Act, which Parliament passed in April 2013, Bangladesh Securities and Exchange Commission approved DSE and CSE demutualization schemes, which will separate their ownership from management and convert the stock exchanges into shareholder-owned corporate entities. The commission also amended the relevant provision of the Mutual Fund Rules, 2001 to allow closed-end mutual funds to issue stock dividends under reinvestment plans. Following the government’s announcement in March 2013 of a compensation package for investors who experienced losses from the 2010/11 stock market downturns, the Investment Corporation of Bangladesh asked merchant banks and brokerage firms to apply for loans under the capital market refinancing scheme by 30 November 2013.
DSE and CSE demutualization schemes approved
22
Asian Development Bank
Bangladesh Resident Mission
Plot E-31, Sher-e-Bangla Nagar
Dhaka 1207, Bangladesh w w w . a d b . o r g / B R M
Publication Stock No. 010401 Printed in Bangladesh
About the Asian Development Bank ADB’s vision is an Asia and Pacific region free of poverty. Its
mission is to help its developing member countries reduce poverty
and improve the quality of life of their people. Despite the region’s
many successes, it remains home to two thrids of the world’s poor.
Around 903 million people in the region live on $1.25 or less a day.
ADB is committed to reducing poverty through inclusive economic
growth, environmentally sustainable growth, and regional
integration.
Based in Manila, ADB is owned by 67 members, including 48 from the
region. Its main instruments for helping its developing member countries
are policy dialogue, loans, equity investments, guarantees, grants, and
technical assistance.