banducci substation project air quality report€¦ · banducci substation air quality project...
TRANSCRIPT

Prepared for
SOUTHERN CALIFORNIA EDISON
Prepared by
TERRY A. HAYES ASSOCIATES INC.
June 4, 2014
BANDUCCI SUBSTATIONAIR QUALITY
PROJECT REPORT
taha 2011-037
June 4, 2014
BANDUCCI SUBSTATION PROJECT
AIR QUALITY REPORT
Prepared for
SOUTHERN CALIFORNIA EDISON
Prepared by
TERRY A. HAYES ASSOCIATES INC.
8522 National Boulevard, Suite 102
Culver City, CA 90232
Banducci Substation Project Table of Contents Air Quality Report
i
TABLE OF CONTENTS
Page No. 1.0 SUMMARY OF FINDINGS .............................................................................................. 1 2.0 INTRODUCTION ............................................................................................................... 2 2.1 Purpose of Report ................................................................................................. 2
2.2 Project Description ................................................................................................ 2 3.0 AIR QUALITY ................................................................................................................... 5 3.1 Pollutants & Effects ............................................................................................... 5 3.2 Regulatory Setting ................................................................................................. 7
3.3 Existing Air Quality .............................................................................................. 15 3.4 Methodology and Significance Criteria ................................................................ 19
3.5 Environmental Impacts ........................................................................................ 23 3.6 Cumulative Impacts ............................................................................................. 27
LIST OF TABLES
Table 3-1 State and National Ambient Air Quality Standards for the Eastern Kern APCD ........... 9 Table 3-2 2008-2010 Ambient Air Quality Data in Project Vicinity .............................................. 17 Table 3-3 Estimated Annual Construction Emissions ................................................................. 24 Table 3-4 Estimated Annual Operational Emissions ................................................................... 26 Table 3-5 Estimated Annual Greenhouse Gas Emissions .......................................................... 29
LIST OF FIGURES
Figure 2-1 Regional Project Location .............................................................................................. 3 Figure 2-2 Local Project Location .................................................................................................... 4 Figure 3-1 Mojave Desert Air Basin .............................................................................................. 16 Figure 3-2 Air Monitoring Locations .............................................................................................. 18
APPENDICES
Appendix A Climate Information Appendix B CARB Data Appendix C Construction Regional Emission Calculations Appendix D Operational Emission Calculations Appendix E Greenhouse Gas Emission Calculations
Banducci Substation Project 1.0 Summary of Findings Air Quality Report
taha 2011-037 1
1.0 SUMMARY OF FINDINGS
Terry A. Hayes Associates Inc. has completed an air quality analysis for the Banducci Substation Project (Proposed Project). Key findings are listed below.
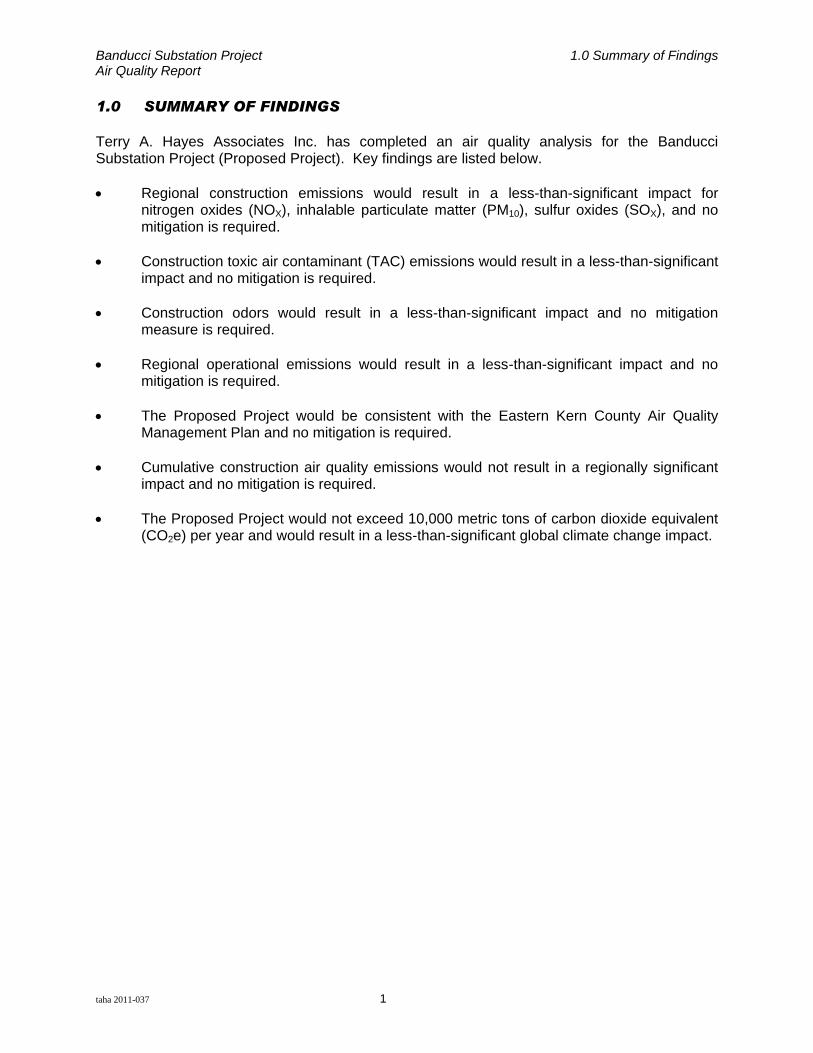
Regional construction emissions would result in a less-than-significant impact for nitrogen oxides (NOX), inhalable particulate matter (PM10), sulfur oxides (SOX), and no mitigation is required.
Construction toxic air contaminant (TAC) emissions would result in a less-than-significant impact and no mitigation is required.
Construction odors would result in a less-than-significant impact and no mitigation measure is required.
Regional operational emissions would result in a less-than-significant impact and no mitigation is required.
The Proposed Project would be consistent with the Eastern Kern County Air Quality Management Plan and no mitigation is required.
Cumulative construction air quality emissions would not result in a regionally significant impact and no mitigation is required.
The Proposed Project would not exceed 10,000 metric tons of carbon dioxide equivalent (CO2e) per year and would result in a less-than-significant global climate change impact.
Banducci Substation Project 2.0 Introduction Air Quality Report
taha 2011-037 2
2.0 INTRODUCTION
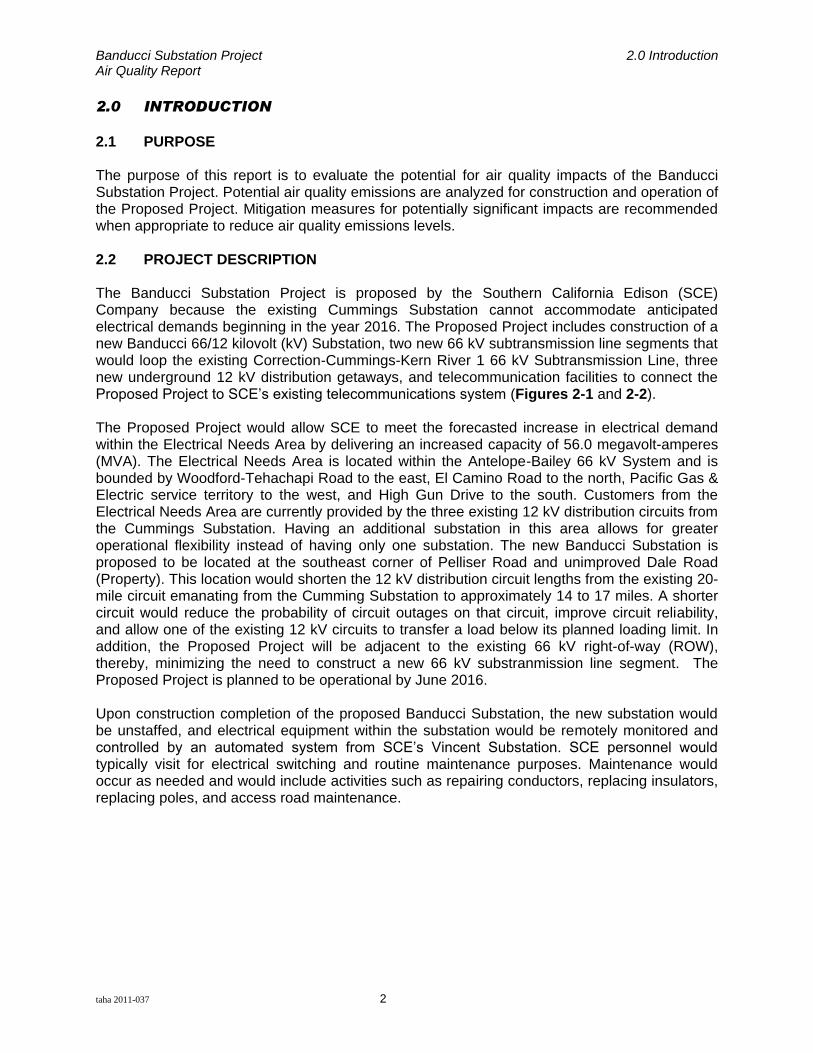
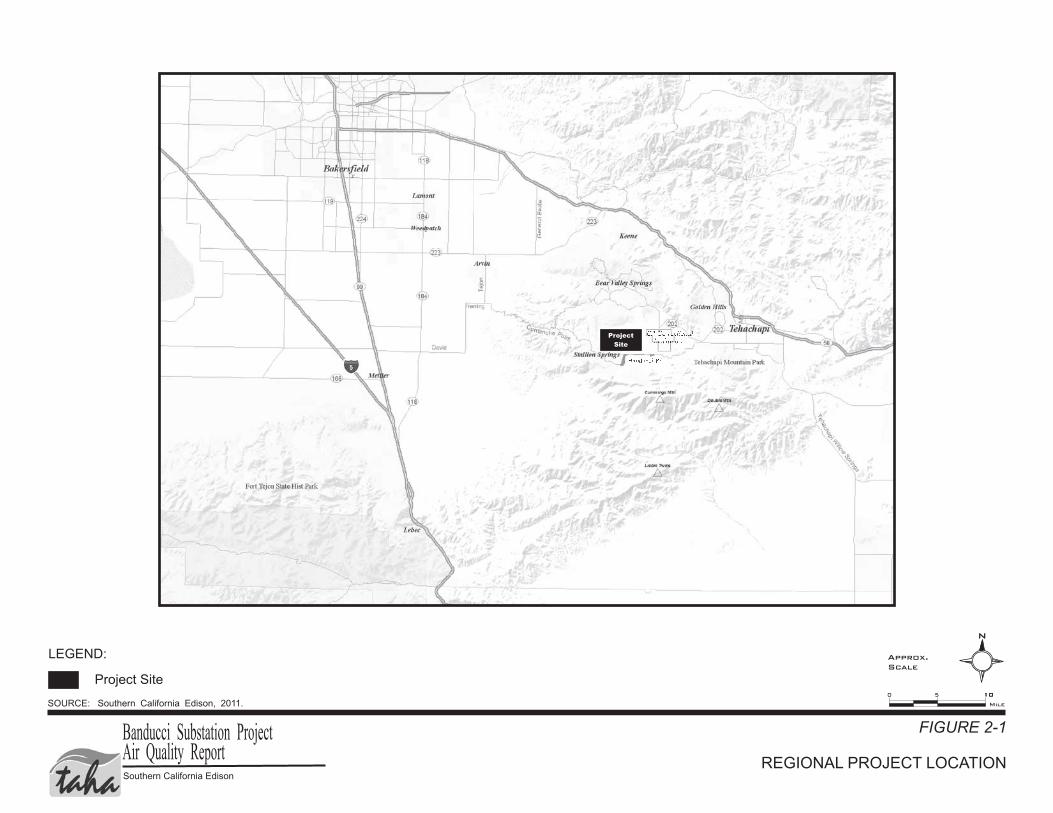
2.1 PURPOSE The purpose of this report is to evaluate the potential for air quality impacts of the Banducci Substation Project. Potential air quality emissions are analyzed for construction and operation of the Proposed Project. Mitigation measures for potentially significant impacts are recommended when appropriate to reduce air quality emissions levels. 2.2 PROJECT DESCRIPTION The Banducci Substation Project is proposed by the Southern California Edison (SCE) Company because the existing Cummings Substation cannot accommodate anticipated electrical demands beginning in the year 2016. The Proposed Project includes construction of a new Banducci 66/12 kilovolt (kV) Substation, two new 66 kV subtransmission line segments that would loop the existing Correction-Cummings-Kern River 1 66 kV Subtransmission Line, three new underground 12 kV distribution getaways, and telecommunication facilities to connect the Proposed Project to SCE’s existing telecommunications system (Figures 2-1 and 2-2). The Proposed Project would allow SCE to meet the forecasted increase in electrical demand within the Electrical Needs Area by delivering an increased capacity of 56.0 megavolt-amperes (MVA). The Electrical Needs Area is located within the Antelope-Bailey 66 kV System and is bounded by Woodford-Tehachapi Road to the east, El Camino Road to the north, Pacific Gas & Electric service territory to the west, and High Gun Drive to the south. Customers from the Electrical Needs Area are currently provided by the three existing 12 kV distribution circuits from the Cummings Substation. Having an additional substation in this area allows for greater operational flexibility instead of having only one substation. The new Banducci Substation is proposed to be located at the southeast corner of Pelliser Road and unimproved Dale Road (Property). This location would shorten the 12 kV distribution circuit lengths from the existing 20-mile circuit emanating from the Cumming Substation to approximately 14 to 17 miles. A shorter circuit would reduce the probability of circuit outages on that circuit, improve circuit reliability, and allow one of the existing 12 kV circuits to transfer a load below its planned loading limit. In addition, the Proposed Project will be adjacent to the existing 66 kV right-of-way (ROW), thereby, minimizing the need to construct a new 66 kV substranmission line segment. The Proposed Project is planned to be operational by June 2016. Upon construction completion of the proposed Banducci Substation, the new substation would be unstaffed, and electrical equipment within the substation would be remotely monitored and controlled by an automated system from SCE’s Vincent Substation. SCE personnel would typically visit for electrical switching and routine maintenance purposes. Maintenance would occur as needed and would include activities such as repairing conductors, replacing insulators, replacing poles, and access road maintenance.
Approx.
Scale
Mile
N
0 105
REGIONAL PROJECT LOCATION
FIGURE 2-1
SOURCE: Southern California Edison, 2011.
taha 2011-037 Southern California Edison
Banducci Substation ProjectAir Quality Report
LEGEND:
10
Project
Site
Project Site

Banducci Substation Project 3.0 Air Quality Air Quality Report
taha 2011-037 5
3.0 AIR QUALITY
This section examines the degree to which the proposed project may cause significant adverse changes to air quality. Short-term construction emissions occurring from activities such as site grading and haul truck trips are discussed in this section. This analysis focuses on air pollution from two perspectives: daily emissions and pollutant concentrations. “Emissions” refer to the quantity of pollutants released into the air, measured in pounds per day (ppd). “Concentrations” refer to the amount of pollutant material per volumetric unit of air, measured in parts per million (ppm) or micrograms per cubic meter (μg/m3). 3.1 POLLUTANTS & EFFECTS Criteria air pollutants are defined as pollutants for which the Federal and State governments have established ambient air quality standards for outdoor concentrations to protect public health. The Federal and State standards have been set at levels above which concentrations could be harmful to human health and welfare. These standards are designed to protect the most sensitive persons from illness or discomfort. Pollutants of concern include carbon monoxide (CO), ozone (O3), nitrogen dioxide (NO2), sulfur dioxide (SO2), particulate matter 2.5 microns or less in diameter (PM2.5), particulate matter ten microns or less in diameter (PM10), and lead (Pb). These pollutants are discussed below. Carbon Monoxide. CO is a colorless and odorless gas formed by the incomplete combustion of fossil fuels. CO is emitted almost exclusively from motor vehicles, power plants, refineries, industrial boilers, ships, aircraft, and trains. In urban areas such as the project location, automobile exhaust accounts for the majority of CO emissions. CO is a non-reactive air pollutant that dissipates relatively quickly, so ambient CO concentrations generally follow the spatial and temporal distributions of vehicular traffic. CO concentrations are influenced by local meteorological conditions, primarily wind speed, topography, and atmospheric stability. CO from motor vehicle exhaust can become locally concentrated when surface-based temperature inversions are combined with calm atmospheric conditions, a typical situation at dusk in urban areas between November and February.1 The highest levels of CO typically occur during the colder months of the year when inversion conditions are more frequent. In terms of health, CO competes with oxygen, often replacing it in the blood, thus reducing the blood’s ability to transport oxygen to vital organs. The results of excess CO exposure can be dizziness, fatigue, and impairment of central nervous system functions. Ozone. O3 is a colorless gas that is formed in the atmosphere when reactive organic gases (ROG), which includes volatile organic compounds (VOC), and nitrogen oxides (NOX) react in the presence of ultraviolet sunlight. O3 is not a primary pollutant; it is a secondary pollutant formed by complex interactions of two pollutants directly emitted into the atmosphere. The primary sources of ROG and NOX, the components of O3, are automobile exhaust and industrial sources. Meteorology and terrain play major roles in O3 formation. Ideal conditions for the creation of O3 occur during summer and early autumn, on days with low wind speeds or stagnant air, warm temperatures, and cloudless skies. The greatest source of smog-producing gases is the automobile. Short-term exposure (lasting for a few hours) to O3 at levels typically observed in Southern California can result in breathing pattern changes, reduction of breathing capacity, increased susceptibility to infections, inflammation of the lung tissue, and some immunological changes.
1Inversion is an atmospheric condition in which a layer of warm air traps cooler air near the surface of the earth,
preventing the normal rising of surface air.
Banducci Substation Project 3.0 Air Quality Air Quality Report
taha 2011-037 6
Nitrogen Dioxide. NO2, like O3, is not directly emitted into the atmosphere but is formed by an atmospheric chemical reaction between nitric oxide (NO) and atmospheric oxygen. NO and NO2 are collectively referred to as NOX and are major contributors to O3 formation. NO2 also contributes to the formation of PM10. High concentrations of NO2 can cause breathing difficulties and result in a brownish-red cast to the atmosphere with reduced visibility. There is some indication of a relationship between NO2 and chronic pulmonary fibrosis. Some increase of bronchitis in children (two and three years old) has also been observed at concentrations below 0.3 ppm. Sulfur Dioxide. SO2 is a colorless, pungent gas formed primarily by the combustion of sulfur-containing fossil fuels. Main sources of SO2 are coal and oil used in power plants and industries. Generally, the highest levels of SO2 are found near large industrial complexes. In recent years, SO2 concentrations have been reduced by the increasingly stringent controls placed on stationary source emissions of SO2 and limits on the sulfur content of fuels. SO2 is an irritant gas that attacks the throat and lungs. It can cause acute respiratory symptoms and diminished ventilator function in children. SO2 can also yellow plant leaves and erode iron and steel. Particulate Matter. Particulate matter pollution consists of very small liquid and solid particles floating in the air, which can include smoke, soot, dust, salts, acids, and metals. Particulate matter also forms when gases emitted from industries and motor vehicles undergo chemical reactions in the atmosphere. PM2.5 and PM10 represent fractions of particulate matter. Fine particulate matter, or PM2.5, is roughly 1/28 the diameter of a human hair. PM2.5 results from fuel combustion (e.g., motor vehicles, power generation, and industrial facilities), residential fireplaces, and wood stoves. In addition, PM2.5 can be formed in the atmosphere from gases such as SO2, NOX, and VOC. Inhalable particulate matter, or PM10, is about 1/7 the thickness of a human hair. Major sources of PM10 include crushing or grinding operations; dust stirred up by vehicles traveling on roads; wood burning stoves and fireplaces; dust from construction, landfills, and agriculture; wildfires and brush/waste burning; industrial sources; windblown dust from open lands; and atmospheric chemical and photochemical reactions. PM2.5 and PM10 pose a greater health risk than larger-size particles. When inhaled, these tiny particles can penetrate the human respiratory system’s natural defenses and damage the respiratory tract. PM2.5 and PM10 can increase the number and severity of asthma attacks, cause or aggravate bronchitis and other lung diseases, and reduce the body’s ability to fight infections. Very small particles of substances such as lead, sulfates, and nitrates can cause lung damage directly. These substances can be absorbed into the blood stream and cause damage elsewhere in the body. These substances can transport absorbed gases, such as chlorides or ammonium, into the lungs and cause injury. Whereas PM10 tends to collect in the upper portion of the respiratory system, PM2.5 is so tiny that it can penetrate deeper into the lungs and damage lung tissues. Suspended particulates also damage and discolor surfaces on which they settle, as well as produce haze and reduce regional visibility. Lead. Pb in the atmosphere occurs as particulate matter. Sources of lead include leaded gasoline; the manufacturing of batteries, paint, ink, ceramics, and ammunition; and secondary lead smelters. Prior to 1978, mobile emissions were the primary source of atmospheric lead. Between 1978 and 1987, the phase-out of leaded gasoline reduced the overall inventory of airborne lead by nearly 95 percent. With the phase-out of leaded gasoline, secondary lead smelters, battery recycling, and manufacturing facilities have become lead-emission sources of greater concern.

Banducci Substation Project 3.0 Air Quality Air Quality Report
taha 2011-037 7
Prolonged exposure to atmospheric lead poses a serious threat to human health. Health effects associated with exposure to lead include gastrointestinal disturbances, anemia, kidney disease, and in severe cases, neuromuscular and neurological dysfunction. Of particular concern are low-level lead exposures during infancy and childhood. Such exposures are associated with decrements in neurobehavioral performance, including intelligence quotient performance, psychomotor performance, reaction time, and growth. Toxic Air Contaminants. A substance is considered toxic if it has the potential to cause adverse health effects in humans. A toxic substance released into the air is considered a toxic air contaminant (TAC). TACs are identified by State and Federal agencies based on a review of available scientific evidence. In the State of California, TACs are identified through a two-step process that was established in 1983 under the Toxic Air Contaminant Identification and Control Act. This two-step process of risk identification and risk management was designed to protect residents from the health effects of toxic substances in the air. Greenhouse Gases. Greenhouse gas (GHG) emissions refer to a group of emissions that are generally believed to affect global climate conditions. The greenhouse effect compares the Earth and the atmosphere surrounding it to a greenhouse with glass panes. The glass panes in a greenhouse let heat from sunlight in and reduce the amount of heat that escapes. GHGs, such as carbon dioxide (CO2), methane (CH4), and nitrous oxide (N2O), keep the average surface temperature of the Earth close to 60 degrees Fahrenheit (°F). Without the greenhouse effect, the Earth would be a frozen globe with an average surface temperature of about 5°F. In addition to CO2, CH4, and N2O, GHGs include hydrofluorocarbons, perfluorocarbons, sulfur hexafluoride (SF6), and water vapor. SF6 is commonly used in the utility industry for insulation and current interruption in electric transmission and distribution equipment. Of all the GHGs, CO2 is the most abundant pollutant that contributes to climate change through fossil fuel combustion. CO2 comprised 83.3 percent of the total GHG emissions in California in 2002.2 The other GHGs are less abundant but have higher global warming potential than CO2. For example, SF6 is a very potent GHG with 23,900 times the global warming potential of CO2. According to the United States Environmental Protection Act (USEPA), one pound of SF6 has the same global warming impacts of 11 tons of CO2. To account for this higher potential, emissions of other GHGs are frequently expressed in the equivalent mass of CO2, denoted as CO2e. The CO2e of CH4 and N2O represented 6.4 and 6.8 percent, respectively, of the 2002 California GHG emissions. Other high global warming potential gases represented 3.5 percent of these emissions.3 In addition, there are a number of human-made pollutants, such as CO, NOX, non-methane VOC, and SO2, that have indirect effects on terrestrial or solar radiation absorption by influencing the formation or destruction of other climate change emissions. 3.2 REGULATORY SETTING Federal United States Environmental Protection Agency. The Federal Clean Air Act (CAA) governs air quality in the United States. The United States Environmental Protection Agency (USEPA) is responsible for enforcing the CAA. The USEPA is also responsible for establishing the National Ambient Air Quality Standards (NAAQS). NAAQS are required under the 1977 CAA and
2California Environmental Protection Agency, Climate Action Team Report to Governor Schwarzenegger and the
Legislature, March 2006, p. 11. 3Ibid.

Banducci Substation Project 3.0 Air Quality Air Quality Report
taha 2011-037 8
subsequent amendments. The USEPA regulates emission sources that are under the exclusive authority of the Federal government, such as aircraft, ships, and certain types of locomotives. The USEPA has jurisdiction over emission sources outside State waters (e.g., beyond the outer continental shelf) and establishes various emission standards, including those for vehicles sold in States other than California. Automobiles sold in California must meet stricter emission standards established by the California Air Resources Board (CARB). As required by the CAA, NAAQS have been established for seven major air pollutants: CO, NO2, O3, PM2.5, PM10, SO2, and Pb. The CAA requires the USEPA to designate areas as attainment, nonattainment, or maintenance (previously nonattainment and currently attainment) for each criteria pollutant based on whether the NAAQS have been achieved. These Federal standards are summarized in Table 3-1. The USEPA has classified the Mojave Desert Air Basin as nonattainment for 8-hour O3 and 24-hour PM10. The remaining pollutants are unclassified. State California Air Resources Board. In addition to being subject to the requirements of CAA, air quality in California is also governed by more stringent regulations under the California Clean Air Act (CCAA). In California, the CCAA is administered by the CARB at the State level and by the air quality management districts and air pollution control districts at the regional and local levels. The CARB, which became part of the California Environmental Protection Agency in 1991, is responsible for meeting the State requirements of the CAA, administering the CCAA, and establishing the California Ambient Air Quality Standards (CAAQS). The CCAA, as amended in 1992, requires all air districts in the State to endeavor to achieve and maintain the CAAQS. These CAAQS are generally more stringent than the corresponding Federal standards and incorporate additional standards for sulfates, hydrogen sulfide, vinyl chloride, and visibility-reducing particles. CARB regulates mobile air pollution sources such as motor vehicles. The CARB is responsible for setting emission standards for vehicles sold in California and for other emission sources, such as consumer products and certain off-road equipment. CARB established passenger vehicle fuel specifications, which became effective in March 1996. The CARB oversees the functions of local air pollution control districts and air quality management districts, which, in turn, administer air quality activities at the regional and county levels. The State standards are summarized in Table 3-1. The CCAA requires the CARB to designate areas within California as either attainment or nonattainment for each criteria pollutant based on whether the CAAQS have been achieved. Under the CCAA, areas are designated as nonattainment for a pollutant if air quality data show that a State standard for the pollutant was violated at least once during the previous three calendar years. Exceedances that are affected by highly irregular or infrequent events are not considered violations of a State standard and are not used as a basis for designating areas as nonattainment. Under the CCAA, the Kern County portion of the Basin is designated as a nonattainment area for O3, PM2.5, and PM10. The remaining pollutants are designated as attainment.

Banducci Substation Project 3.0 Air Quality Air Quality Report
taha 2011-037 9
TABLE 3-1: STATE AND NATIONAL AMBIENT AIR QUALITY STANDARDS AND ATTAINMENT STATUS FOR THE EASTERN KERN AIR POLLUTION CONTROL DISTRICT
Pollutant Averaging
Period
California Federal
Standards Attainment Status Standards Attainment Status
Ozone (O3)
1-hour 0.09 ppm
(180 µg/m3)
Nonattainment — —
8-hour 0.070 ppm
(137 µg/m3)
Nonattainment 0.075 ppm
(147 µg/m3)
Nonattainment
Respirable Particulate Matter (PM10)
24-hour 50 µg/m3 Nonattainment 150 µg/m
3 Nonattainment
Annual Arithmetic
Mean 20 µg/m
3 Nonattainment — —
Fine Particulate Matter (PM2.5)
24-hour — — 35 µg/m3 Attainment
Annual Arithmetic
Mean 12 µg/m
3 Attainment 12.0 µg/m
3 Attainment
Carbon Monoxide (CO)
8-hour 9.0 ppm
(10 mg/m3)
Attainment 9 ppm
(10 mg/m3)
Unclassified
1-hour 20 ppm
(23 mg/m3)
Attainment 35 ppm
(40 mg/m3)
Unclassified
Nitrogen Dioxide (NO2)
Annual Arithmetic
Mean
0.030 ppm
(57 µg/m3)
Attainment 53 ppb
(100 µg/m3)
Unclassified
1-hour 0.18 ppm
(338 µg/m3)
Attainment 100 ppb
(188 µg/m3)
—
Sulfur Dioxide (SO2)
24-hour 0.04 ppm
(105 µg/m3)
Attainment 0.14 ppm
(365 µg/m3)
Unclassified
1-hour 0.25 ppm
(655 µg/m3)
Attainment 75 ppb
(196 µg/m3)
Unclassified
Lead (Pb)
30-day average
1.5 µg/m3 Attainment — —
Calendar Quarter
— — 0.15 µg/m3 —
”—“ = not available
SOURCE: CARB, Ambient Air Quality Standards, and area designations maps/State and National, June 4, 2013.
USEPA, The Green Book Nonattainment Areas for Criteria Pollutants, March 6, 2014.
Local Eastern Kern Air Pollution Control District (EKAPCD). The EKAPCD has the primary responsibility for regulating stationary sources of air pollution situated within its jurisdictional boundaries. The EKAPCD implements air quality programs required by State and Federal mandates, enforces rules and regulations based on air pollution laws, and educates businesses and residents about their role in protecting air quality. Rules and regulations to control construction and operational emissions are established in Rules 401 and 402. These include:
Rule 401. Rule 401 states that a person shall not discharge into the atmosphere, from any single source of emission, any air contaminant for a period or periods aggregating more than three minutes in any one hour which is:
a) As dark or darker in shade as that designated as No. 1 on the Ringelmann Chart, as published by the United States Bureau of Mines; or
Banducci Substation Project 3.0 Air Quality Air Quality Report
taha 2011-037 10
b) Of such opacity as to obscure an observer’s view to a degree equal to or greater than does smoke described in Subsection A.
Rule 402. The purpose of Rule 402 is to reduce the amount of PM10 from significant man-made fugitive dust sources from large operations and in an amount sufficient to maintain National Ambient Air Quality Standards. A large operation is defined as “any active operation, including vehicle movement on unpaved roadways, on property involving in excess of 100 contiguous acres of disturbed surface area, or any earth-morning activity exceeding a daily volume of 7,700 cubic meters (10,000 cubic yards) three (3) times during the most recent 365-day period.” This Rule shall apply to specified bulk storage, earthmoving, construction and demolition, and man-made conditions resulting in wind erosion. The following requirements of Rule 402 are provided below.
a) A person shall not cause or allow emissions of fugitive dust from any active operation to remain visible in the atmosphere beyond the property line of the emission source. This Subsection shall not apply to unpaved roadways.
b) A person shall utilize one (1) or more Reasonably Available Control Measures to minimize fugitive dust emissions from each fugitive dust source type which is part of any active operation subject to this Rule, including unpaved roadways.
c) For any large operation, except those satisfying Subsection V.D.3. (implementation of RACM’s), a person shall not cause or allow downwind PM10 ambient concentrations to increase more than 50 micrograms per cubic meter above upwind concentrations as determined by simultaneous upwind and downwind sampling. High-volume particulate matter samplers, or other EPA-approved equivalent method(s) for PM10 monitoring shall be used.
d) No person shall conduct or authorize conducting a large operation subject to requirements of this Rule without either: (1) conducting on-site PM10 air quality monitoring and associated recordkeeping, or (2) filing for and obtaining an approved fugitive dust emissions control plan pursuant to Subsection V.D.3.
Kern County General Plan (KCGP). The purpose of the KCGP is to ensure that Kern County Air Pollution Control District is upholding its responsibility for managing and permitting existing, new, and modified sources or air emissions to conform with Federal, State, and local standards for air quality. The policies in the KCGP that are applicable to air quality as related to the Proposed Project are provided below.
Policy 18. The air quality implications of new discretionary land use proposals shall be considered in approval of major developments. Special emphasis will be replaced on minimizing air quality degradation in the desert to enable effective military operations and in the valley region to meet attainment goals.
Policy 19. In considering discretionary projects for which an EIR must be prepared pursuant to the CEQA, the appropriate decision making body, as part of its deliberations, will ensure that:
a) All feasible mitigation to reduce significant adverse air quality impacts have been adopted; and
b) The benefits of the proposed project outweigh any unavoidable significant adverse effects on air quality found to exist after inclusion of all feasible mitigation. This finding shall be made in a statement of overriding considerations and shall be supported by factual evidence to the extent that such a statement is required pursuant to the CEQA.

Banducci Substation Project 3.0 Air Quality Air Quality Report
taha 2011-037 11
Policy 20. The County shall include fugitive dust control measures as a requirement for discretionary projects and as required by the adopted rules and regulations of the San Joaquin Valley Unified Air Pollution Control District and the Kern County Air Pollution Control District on ministerial permits.
Policy 21. The County shall support air districts’ efforts to reduce PM10 and PM2.5 emissions.
Policy 22. Kern County shall continue to work with the San Joaquin Valley Unified Air Pollution Control District and the Kern County Air Pollution Control District toward air quality attainment with Federal, State, and local standards.
Policy 23. The County shall continue to implement the local government control measures in coordination with the Kern Council of Governments and the San Joaquin Valley Unified Air Pollution Control District.
Global Climate Change In response to growing scientific and political concern with global climate change, California has recently adopted a series of laws to reduce emissions of GHGs into the atmosphere. In September 2002, Assembly Bill (AB) 1493 was enacted, requiring the development and adoption of regulations to achieve “the maximum feasible reduction of greenhouse gases” emitted by noncommercial passenger vehicles, light-duty trucks, and other vehicles used primarily for personal transportation in the State. California Governor Arnold Schwarzenegger announced, on June 1, 2005, through Executive Order S-3-05, the following GHG emission reduction targets: by 2010, reduce GHG emissions to 2000 levels; by 2020, reduce GHG emissions to 1990 levels; and by 2050, reduce GHG emissions to 80 percent below 1990 levels. In response to the Executive Order, the Secretary of the California Environmental Protection Agency created the Climate Action Team (CAT), which, in March 2006, published the Climate Action Team Report to Governor Schwarzenegger and the Legislature (2006 CAT Report). The 2006 CAT Report identifies a recommended list of strategies that the State could pursue to reduce climate change GHG emissions. These are strategies that could be implemented by various State agencies to ensure that the Governor’s targets are met and can be met with existing authority of the State agencies.
Assembly Bill 32. In September 2006, Governor Arnold Schwarzenegger signed the California Global Warming Solutions Act of 2006, also known as AB 32, into law. AB 32 focuses on reducing GHG emissions in California and requires the CARB to adopt rules and regulations that would achieve greenhouse gas emissions equivalent to statewide levels in 1990 by 2020. To achieve this goal, AB 32 mandates that the CARB establish a quantified emissions cap, institute a schedule to meet the cap, implement regulations to reduce statewide GHG emissions from stationary sources, and develop tracking, reporting, and enforcement mechanisms to ensure that reductions are achieved. Because the intent of AB 32 is to limit 2020 emissions to the equivalent of 1990, it is expected that the regulations would affect many existing sources of GHG emissions and not just new general development projects. Senate Bill (SB) 1368, a companion bill to AB 32, requires the California Public Utilities Commission and the California Energy Commission to establish GHG emission performance standards for the generation of electricity. These standards will also apply to power that is generated outside of California and imported into the State.

Banducci Substation Project 3.0 Air Quality Air Quality Report
taha 2011-037 12
AB 32 charges the CARB with the responsibility to monitor and regulate sources of GHG emissions in order to reduce those emissions. On June 1, 2007, the CARB adopted three discrete early action measures to reduce GHG emissions. These measures involved complying with a low carbon fuel standard, reducing refrigerant loss from motor vehicle air conditioning maintenance, and increasing methane capture from landfills.4 On October 25, 2007, the CARB tripled the set of previously approved early action measures. The approved measures include improving truck efficiency (i.e., reducing aerodynamic drag), electrifying port equipment, reducing
perfluorocarbons from the semiconductor industry, reducing propellants in consumer products, promoting
proper tire inflation in vehicles, and reducing sulfur hexaflouride emission from the non-electricity sector. The CARB has determined that the total statewide aggregated greenhouse gas 1990 emissions level and 2020 emissions limit is 427 million metric tons of CO2e. The 2020 target reductions are currently estimated to be 174 million metric tons of CO2e. The CARB Assembly Bill 32 Scoping Plan (Scoping Plan) contains the main strategies to achieve the 2020 emissions cap. The Scoping Plan was developed by the CARB with input from the CAT and proposes a comprehensive set of actions designed to reduce overall carbon emissions in California, improve the environment, reduce oil dependency, diversify energy sources, and enhance public health while creating new jobs and improving the State economy. The GHG reduction strategies contained in the Scoping Plan include direct regulations, alternative compliance mechanisms, monetary and non-monetary incentives, voluntary actions, and market-based mechanisms such as a cap-and-trade system. Key approaches for reducing GHG emissions to 1990 levels by 2020 include:
Expanding and strengthening existing energy efficiency programs as well as building and appliance standards;
Achieving a Statewide renewable electricity standard of 33 percent;
Developing a California cap-and-trade program that links with other Western Climate Initiative partner programs to create a regional market system;
Establishing targets for transportation-related GHG emissions for regions throughout the State, and pursuing policies and incentives to achieve those targets; and
Adopting and implementing measures to reduce transportation sector emissions. CARB recently released the Proposed First Update to the Climate Change Scoping Plan.5This Update identifies the next steps for California’s leadership on climate change. The first Update to the initial Assembly Bill 32 Scoping Plan describes progress made to meet the near-term objectives of Assembly Bill 32 and defines California’s climate change priorities and activities for the next several years. It also frames activities and issues facing the State as it develops an integrated framework for achieving both air quality and climate goals in California beyond 2020. Specifically, the Update covers a range of topics:
An update of the latest scientific findings related to climate change and its impacts, including short-lived climate pollutants.
A review of progress-to-date, including an update of Scoping Plan measures and other State, federal, and local efforts to reduce GHG emissions in California.
Potential technologically feasible and cost-effective actions to further reduce GHG emissions by 2020.
4California Air Resources Board, Proposed Early Action Measures to Mitigate Climate Change in California, April 20,
2007. 5CARB, Proposed First Update to the Climate Change Scoping Plan, February 10, 2014.

Banducci Substation Project 3.0 Air Quality Air Quality Report
taha 2011-037 13
Recommendations for establishing a mid-term emissions limit that aligns with the State’s long-term goal of an emissions limit 80 percent below 1990 levels by 2050.
Sector-specific discussions covering issues, technologies, needs, and ongoing State activities to significantly reduce emissions throughout California’s economy through 2050.
As discussed above, in December 2007, CARB approved a total statewide GHG 1990 emissions level and 2020 emissions limit of 427 million metric tons of CO2e. As part of the Update, CARB is proposing to revise the 2020 Statewide limit to 431 million metric tons of CO2e, an approximately one percent increase from the original estimate. The 2020 business-as-usual (BAU) forecast in the Update is 509 million metric tons of CO2e. The State would need to reduce those emissions by 15 percent to meet the 431 million metric tons of CO2e 2020 limit. The CARB has also developed the greenhouse gas mandatory reporting regulation, which required reporting beginning on January 1, 2008 pursuant to requirements of AB 32. The regulations require reporting for certain types of facilities that make up the bulk of the stationary source emissions in California. The regulation language identifies major facilities as those that generate more than 25,000 metric tons of CO2 per year. Cement plants, oil refineries, electric generating facilities/providers, co-generation facilities, and hydrogen plants and other stationary combustion sources that emit more than 25,000 metric tons of CO2 per year, make up 94 percent of the point source CO2 emissions in California. CEQA Guideline Amendments. California Senate Bill (SB) 97 required the Governor’s Office of Planning and Research (OPR) to develop CEQA guidelines “for the mitigation of greenhouse gas emissions or the effects of greenhouse gas emissions.” The CEQA Guideline amendments provide guidance to public agencies regarding the analysis and mitigation of the effects of GHG emissions in CEQA documents. Noteworthy revisions to the CEQA Guidelines include:
Lead agencies should quantify all relevant GHG emissions and consider the full range of project features that may increase or decrease GHG emissions as compared to the existing setting;
Consistency with the CARB Scoping Plan is not a sufficient basis to determine that a project’s GHG emissions would not be cumulatively considerable;
A lead agency may appropriately look to thresholds developed by other public agencies, including the CARB’s recommended CEQA thresholds;
To qualify as mitigation, specific measures from an existing plan must be identified and incorporated into the project. General compliance with a plan, by itself, is not mitigation;
The effects of GHG emissions are cumulative and should be analyzed in the context of CEQA’s requirements for cumulative impact analysis; and
Given that impacts resulting from GHG emissions are cumulative, significant advantages may result from analyzing such impacts on a programmatic level. If analyzed properly, later projects may tier, incorporate by reference, or otherwise rely on the programmatic analysis.
Senate Bill 375. California Senate Bill (SB) 375, passed September 30, 2008, provides a means for achieving AB 32 goals through regulation of cars and light trucks. SB 375 aligns three critical policy areas of importance to local government: (1) regional long-range transportation plans and investments; (2) regional allocation of the obligation for cities and counties to zone for housing; and (3) a process to achieve greenhouse gas emissions reductions targets for the transportation sector. SB 375 establishes a process for CARB to develop the GHG emissions reductions targets for each region (as opposed to individual local

Banducci Substation Project 3.0 Air Quality Air Quality Report
taha 2011-037 14
governments or households). CARB must take certain factors into account before setting the targets, such as considering the likely reductions that will result from actions to improve the fuel efficiency of the Statewide fleet and regulations related to the carbon content of fuels (low carbon fuels). CARB must also convene a Regional Targets Advisory Committee, which includes representation from the League of California Cities, California State Association of Counties, metropolitan planning organizations, developers, planning organizations and other stakeholder groups. Furthermore, before setting the targets for each region, CARB is required to exchange technical information with the Metropolitan Planning Organizations (MPOs) for that region and with the affected air district. SB 375 provides that the MPOs may recommend a target for its region. SB 375 relies upon regional planning processes already underway in the 17 MPOs in the State to accomplish its objectives. The provisions related to GHG emissions only apply to the MPOs in the State, which includes 37 of the 58 counties. Most notably, the measure requires the MPO to prepare a Sustainable Communities Strategy (SCS) within the Regional Transportation Plan (RTP), which sets forth a vision for growth for the region taking into account the transportation, housing, environmental, and economic needs of the region. The SCS is the blueprint by which the region will meet its GHG emissions reductions target if there is a feasible way to do so. SB 375 indirectly addresses another longstanding issue: single purpose State agencies. The new law will require the cooperation of CARB, the California Transportation Commission (CTC), the California Department of Transportation (Caltrans) and the State Department of Housing and Community Development (HCD). For example, SB 375 takes a first step to counter this problem by connecting the Regional Housing Needs Allocation (RHNA) to the transportation planning process. While these State agencies will be involved in setting the targets and adopting new guidelines, local governments and the MPOs will not only provide input into setting the targets, but will serve as the lead on implementation. Member cities and counties working through their MPOs are tasked with development of the new integrated regional planning and transportation strategies designed to meet the GHG targets. SB 375 also includes a provision that applies to all regional transportation planning agencies in the State that recognizes the rural contribution towards reducing GHGs. More specifically, the bill requires regional transportation agencies to consider financial incentives for cities and counties that have rural areas or farmland, for the purposes of, for example, transportation investments for the preservation and safety of the city street or county road system, farm to market, and interconnectivity transportation needs. An MPO or county transportation agency shall also consider financial assistance for counties to address countywide service responsibilities in counties that contribute towards the GHG emissions reductions targets by implementing policies for growth to occur within their cities. SB 375 uses California Environmental Quality Act (CEQA) streamlining as an incentive to encourage residential projects, which help achieve AB 32 goals to reduce GHG emissions. Cities and counties that find the CEQA streamlining provisions attractive have the opportunity (but not the obligation) to align their planning decisions with the decisions of the region. SB 375 provides more certainty for local governments and developers by framing how AB 32’s reduction goal from transportation for cars and light trucks will be established. It should be noted, however, that SB 375 does not prevent CARB from adopting additional regulations under
Banducci Substation Project 3.0 Air Quality Air Quality Report
taha 2011-037 15
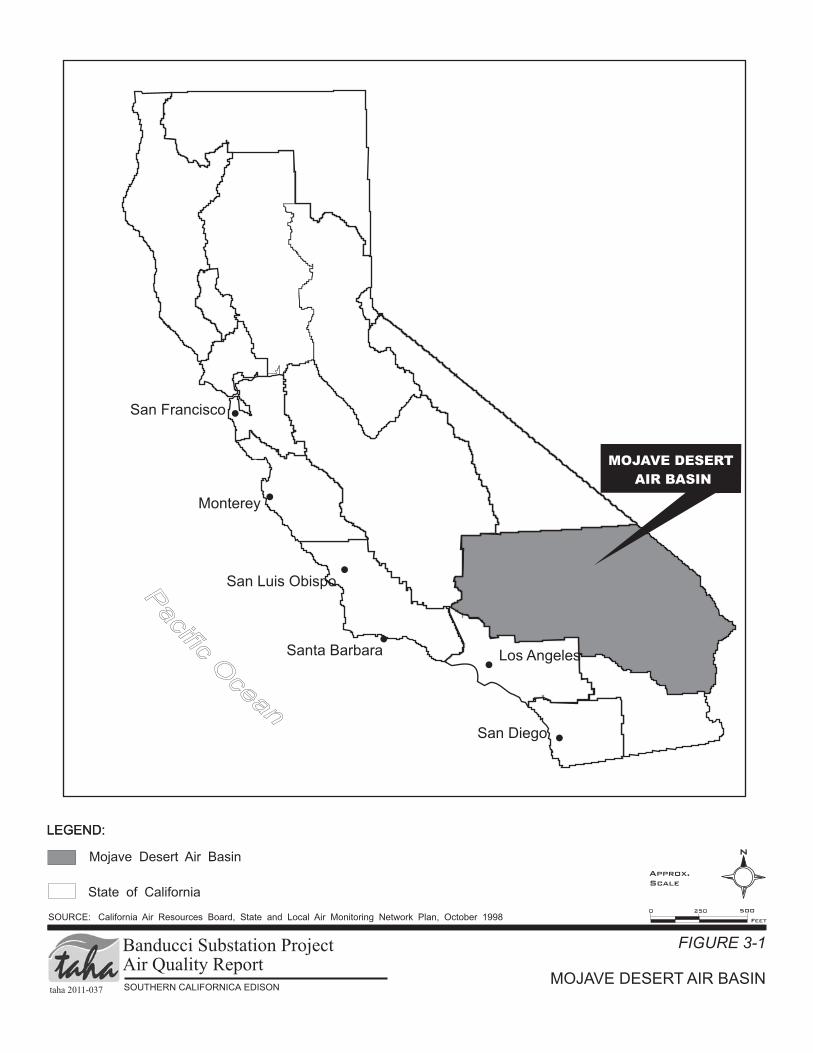
its AB 32 authority. However, based on the degree of consensus around SB 375 and early indications from CARB, such actions are not anticipated in the foreseeable future.6 CARB Guidance. The CARB has published draft guidance for setting interim GHG significance thresholds (October 24, 2008). The guidance is the first step toward developing the recommended Statewide interim thresholds of significance for GHG emissions that may be adopted by local agencies for their own use. The guidance does not attempt to address every type of project that may be subject to CEQA, but instead focuses on common project types that are responsible for substantial GHG emissions (i.e., industrial, residential, and commercial projects). The CARB believes that thresholds in these important sectors will advance climate objectives, streamline project review, and encourage consistency and uniformity in the CEQA analysis of GHG emissions throughout the State. 3.3 EXISTING AIR QUALITY 3.3.1 Air Pollution Climatology The project site is located within the Mojave Desert portion of the Basin. The Basin is comprised of four air districts: the Kern County APCD, the Antelope Valley Air Quality Management District (AQMD), the Mojave Desert AQMD, and the eastern portion of the South Coast AQMD. The Kern County APCD consists of the eastern portion of Kern County, Antelope Valley consists of the northeastern portion of Los Angeles County, the Mojave Desert AQMD includes San Bernardino County and the most eastern portion of Riverside County, and the portion of the South Coast AQMD includes the eastern part of Riverside County (Figure 3-1). The Basin covers more than 20,000 square miles and encompasses the majority of California’s high desert with typical hot, dry summers and cold winters with little precipitation. It is bounded by the San Gabriel and San Bernardino mountains to the south, which serves as the boundary separating the Mojave Desert Air Basin and the South Coast Air Basin. The Tehachapi Mountains serve as the northwest boundary separating the Mojave Desert Air Basin from the San Joaquin Air Basin. The majority of the population resides in the southeast area of the Mojave Desert Air Basin. Most of the Mojave Desert Air Basin is sparsely populated and, as a result, there is less industrial growth and fewer automobiles to generate pollution than other areas in California. During high wind conditions, air quality in the Mojave Desert Air Basin is also heavily influenced by airborne pollutants transported into the region from the San Joaquin Valley and South Coast Air Basins. 3.3.2 Local Climate The mountains and hills within the Basin contribute to the variation of rainfall, temperature, and winds throughout the region. Within the project site and its vicinity, the average wind speed, as recorded at the Oak Knolls Monitoring Station, is approximately 5.8 miles per hour. Wind in the vicinity of the project site predominately blows from the southwest.
6American Planning Association, California Chapter, Analysis of SB 375, http://www.calapa.org/-en/cms/?2841,
accessed September 26, 2011.
San Francisco
San Luis Obispo
Santa Barbara Los Angeles
San Diego
Monterey
MOJAVE DESERT
AIR BASIN
MOJAVE DESERT AIR BASIN
FIGURE 3-1
LEGEND:
SOURCE: California Air Resources Board, State and Local Air Monitoring Network Plan, October 1998
taha 2011-037
LEGEND:
Mojave Desert Air Basin
State of California
SOUTHERN CALIFORNICA EDISON
Approx.
Scale
N
Feet
0 500250
Banducci Substation ProjectAir Quality Report

Banducci Substation Project 3.0 Air Quality Air Quality Report
taha 2011-037 17
The annual average temperature in the project area is 68°F.7 The project area experiences an average winter temperature of approximately 53°F and an average summer temperature of approximately 84°F. Total precipitation in the project area averages approximately 11 inches annually. Precipitation occurs mostly during the winter and relatively infrequently during the summer. Precipitation averages approximately five inches during the winter, approximately three inches during the spring, approximately two inches during the fall, and less than one inch during the summer.8 3.3.3 Air Monitoring Data The EKAPCD currently has three permanent air quality monitoring stations. The nearest monitoring station to the project site is the Mojave – 923 Poole Street Monitoring Station, which is located approximately 35 miles southeast of the project (Figure 3-2). Historical data from the Mojave – 923 Poole Street Monitoring Station were used to characterize existing conditions in the vicinity of the project area. The Mojave – 923 Poole Street Monitoring Station was used to obtain O3, PM2.5 and PM10. However, the Mojave – 923 Poole Street Monitoring Station does not monitor CO or NO2. NO2 data was obtained from the Edison Monitoring Station, located 22 miles northwest of the project site. CO is not currently monitored in Kern County and no data has been presented. Table 3-2 shows pollutant levels, the State and Federal standards, and the number of exceedances. The summary table indicates that one-hour O3 concentrations, eight-hour O3 concentrations 24-hour PM10 concentrations, 24-hour PM2.5 concentrations exceeded standards between 2011 and 2013.
7Western Regional Climate Center, Historical Climate Information, available at http://www.wrcc.dri.edu, accessed June 4, 2014. 8Ibid.
TABLE 3-2: 2011-2013 AMBIENT AIR QUALITY DATA IN PROJECT VICINITY
Pollutant Pollutant Concentration & Standards
Mojave – 923 Poole Street and Edison Air Monitoring Stations /a/
Number of Days Above State Standard
2011 2012 2013
Ozone
Maximum 1-hr Concentration (ppm) Days > 0.09 ppm (State 1-hr standard) Days > 0.12 ppm (Federal 1-hr standard) Maximum 8-hr Concentration (ppm) Days > 0.07 ppm (State 8-hr standard) Days > 0.075 ppm (Federal 8-hr standard)
0.101 2 0
0.092
43 20
0.096 1 0
0.087
55 29
0.094 0 0
0.086
22 8
Nitrogen Dioxide
Maximum 1-hr Concentration (ppm) Days > 0.18 ppm (State 1-hr standard)
0.042 0
0.047 0
0.047 0
PM10 Maximum 24-hr Concentration (µg/m3) Days > 50 µg/m3 (State 24-hr standard)
79.4 18
96.6 18
113.4 22
PM2.5
Maximum 24-hr Concentration ( µg/m3) Days > 35 µg/m3 (National 24-hr standard) Annual Arithmetic Mean (µg/m3) Exceed State Standard (12 µg/m3) Exceed Federal Standard (15 µg/m3)
28.0 0
6.2
No No
67.7 2
6.5 No No
76.2 5
8.6 No No
/a/ Data provided by CARB Air Quality Data Statistics. Mojave – 923 Poole Street air monitoring station data was used for O3, PM10, and PM2.5 and Edison air monitoring station was used for NO2. Available at http://www.arb.ca.gov/adam/index.html, accessed May 28, 2014. SOURCE: CARB, Top 4 Summary, available at http://www.arb.ca.gov/adam/topfour/topfour1.php, accessed May 28, 2014.

Approx.
Scale
Mile
N
0 7.5
AIR QUALITY MONITORING STATIONS
FIGURE 3-2
SOURCE: Kern County, 2011.
taha 2011-037 Southern California Edison
Banducci Substation ProjectAir Quality Report
#
LEGEND:
1
2
3
. Mojave - 923 Poole Street
. Arvin-Bear Mountain
. Bakersfield-Golden State Highway15
1
3
2
Monitoring Stations
Banducci Substation Project 3.0 Air Quality Air Quality Report
taha 2011-037 19
3.3.4 Sensitive Receptors Some land uses are considered more sensitive to changes in air quality than others, depending on the population groups and the activities involved. The CARB has identified the following as being the groups most likely to be affected by air pollution: children under 14, the elderly over 65 years of age, athletes, and people with cardiovascular and chronic respiratory diseases. Sensitive receptors include residences, schools, playgrounds, child care centers, athletic facilities, long-term health care facilities, rehabilitation centers, convalescent centers, and retirement homes. The proposed Banducci Substation site would be located on approximately 5 to 8 acres situated on the northwesterly portion of an 80-acre parcel. This privately owned parcel is located at the southeast corner of Pelliser Road and the unimproved Dale Road (Property) in unincorporated Kern County. SCE has also considered an alternative to the Banducci Substation location, Site Alternative B. Site Alternative B would be located on approximately 5 to 8 acres situated on the southerly portion of a 20-acre parcel. This privately owned parcel is located on the northeast corner of Pelliser Road and the unimproved Highline Road in unincorporated Kern County. Sensitive receptors near the proposed Banducci Substation location and Site Alternative B include scattered rural residences, a California Correctional Institute located to the east, and the Cummings Valley School located northeast of these locations. There are also two proposed fiber optic telecommunications cables as part of the Proposed Project. One would connect the proposed Banducci Substation to the existing Cummings Substation and then continue on to the existing Monolith Substation. A second fiber optic telecommunications cable would connect the proposed Banducci Substation to the existing Monolith Substation. Sensitive receptors located near each telecommunications route include the California Correctional Institute, residences and various schools. 3.4 METHODOLOGY AND SIGNIFICANCE CRITERIA 3.4.1 Methodology Construction Regional criteria pollutant and GHG construction emissions were estimated using a spreadsheet methodology (see Appendix C, Construction Regional Emission Calculations). Construction emission factors used to estimate exhaust emissions were taken from a combination of CARB OFFROAD2011 and EMFAC2011 models. Fugitive dust associated with grading and bulldozing activities and processes such as truck dumping on a pile or loading out from the pile to a truck were also considered. The fugitive dust emissions were estimated using the methodology described in the USEPA AP-42 (Compilation of Air Pollutant Emission Factors). Sources of fugitive dust emissions include site preparation activity, earthmoving (dozing, grading, scraper, and material handling), road dust, and disturbed area windblown emissions. The windblown dust emissions were calculated according to the recommendations in Section 13.2.5 of the USEPA AP-42. The amount of windblown dust emissions is controlled by the amount of surface material available for entrainment. Based on wind speed data for City of Tehachapi, an average peak wind speed of 38 miles per hour was used in the analysis. Due to

Banducci Substation Project 3.0 Air Quality Air Quality Report
taha 2011-037 20
lack of information regarding surface structure of the soil, the friction velocity was assumed to be the lowest possible threshold at which windblown dust emissions are initiated at ground level. Therefore, the fugitive emissions results associated with windblown dust are very conservative. It was assumed that a maximum wind event could occur every five days. Construction calculations were made based upon the Proposed Project description. The components of the Proposed Project are described below. An anticipated construction schedule and equipment mix can be found in the appendix to this Study. Regional emissions were assessed based on CEQA significance criteria to determine project impact significance. Banducci Substation Construction. The Banducci Substation would be a new 66/12 kV unstaffed, automated, 56.0 MVA low-profile substation. Components to be included in the proposed substation are: 66 kV low-profile steel switchrack, 66/12 kV transformers, 12 kV low-profile steel switchrack, capacitor banks, mechanical and electrical room (MEER), and restroom facilities. In addition, the proposed substation would be enclosed on all sides by an 8-foot high perimeter wall and landscaping would be designed to filter views for the surrounding community. Approximately 6.3 acres of the Proposed Project site would be graded during construction of the Banducci Substation. Distribution Getaway Installation. The Proposed Project would include the construction of three new underground distribution getaways. The getaways would consist of cable, conduits and vaults. Each vault would be located outside the substation wall on proposed SCE property. For the construction of the vaults, excavation activities would generally be done using a backhoe. The anticipated dimensions for the trench would be approximately 24 inches wide by approximately 51 inches deep, and approximately a length of 125 or 375 feet. The conduits would then be installed using spacers to create a ductbank consisting of two columns of three stacked 5-inch conduits apiece. The conduits would be encased in concrete with a minimum encasement of 3 inches on all sides. Once the encasements hardened, the trench would be backfilled with 1.5 sacks and sand slurry, which is a mix of sand and water with 1.5 bags of cement added with no aggregate. After the completion of installing the ductbank, vaults, and vent pipes, SCE’s cable crews would install three single conductors 1,000 kcmil jacketed aluminum cross-linked polyethylene (CLP) cables per circuit run in one of the 5-inch conduits in the ductbank. Subtransmission Line Segment Installation. The proposed 66 kV subtransmission line route would entail opening the existing Corrections-Cummings-Kern River 1 66kV line on Pelliser Road south of Dale Road. Specifically, two independent source line segments would be created by looping in the existing Correction-Cummings-Kern River 1 66 kV Subtransmission Line, creating the new Banducci-Kern River 1 66 kV Subtransmission Line and the new Banducci-Correction-Cummings 66 kV Subtransmission Line.
To create the new Banducci-Corrections-Cummings 66kV subtransmission line, SCE would install two new wood poles in the existing right-of-way (ROW) on the east side of Pelliser Road north of the proposed Banducci Substation north block wall. The northernmost new wood pole would be installed approximately 30 feet north of the existing pole it is replacing to adjust and even out the span lengths. The first wood pole north of the new Banducci Substation would be installed approximately 75 feet north of the existing wood pole it is replacing to adjust and even out the span lengths. A TSP self-supporting guy stub pole will be installed on the west side of Pelliser Road and west of this wood pole in franchise to support an approximate 15 degree angle on the wood pole. A steel stranded cable (span guy) would connect the TSP guy stub to the wood pole to support the side strain on the wood pole. The new wood poles will be installed

Banducci Substation Project 3.0 Air Quality Air Quality Report
taha 2011-037 21
to reconfigure the existing subtransmission and distribution conductors to accommodate a distribution riser. A new TSP would be installed on SCE property but outside of the fence line of the new Banducci Substation. It would be installed in the northwest corner of the SCE parcel. This TSP would accommodate an approximately 105 degree turn in the line from the existing alignment and start the loop to the rear of the new Banducci Substation. Approximately 200 feet east of the TSP, SCE would install a LWS pole, the proposed line would continue east for approximately 200 feet to the north east corner of the proposed Banducci Substation where another TSP would be installed to accommodate a 90 degree turn and would continue south for approximately 115 feet to another TSP where the line would make another 90 degree turn and continue west to the substation switch rack. In order to create the proposed Banducci-Kern River 1 66 kV Subtransmission Line, SCE would install two new wood poles in the existing ROW on the east side of Pelliser Road south of the proposed Banducci Substation south block wall. The two new wood replacement poles would be installed approximately 3 feet from the existing wood poles. A TSP self-supporting guy stub pole would be installed on the west side of Pelliser Road and west of the first wood pole south of the new Banducci Substation in franchise to support an approximate 15 degree angle on the wood pole. A steel span guy would connect the TSP guy stub to the wood pole to support the side strain on the wood pole. The new wood poles would be installed to reconfigure the existing subtransmission and distribution conductors to accommodate a distribution riser. SCE would then install one TSP at the south west corner of the proposed Banducci Substation in order to accommodate an approximate 105 degree turn in the line from the existing alignment and start the loop to the rear of the new Banducci Substation. Approximately 200 feet east of the TSP, SCE would install a LWS pole, the proposed line would continue east for approximately 200 feet to the south east corner of the proposed Banducci Substation where another TSP would be installed to accommodate a 90 degree turn and continue north approximately 200 feet north to another TSP where the line would make another 90 degree turn and continue west to the substation switchrack. Energizing the new source lines is the final step in completing the 66 kV subtransmission construction. The Correction-Kern River 1 section of the existing Correction-Cummings-Kern River 1 66 kV Subtransmission Line would be de-energized in order to connect the new 66 kV subtransmission line segments to the existing system. To reduce the need for electrical service interruptions, de-energizing and re-energizing the existing subtransmission lines may occur at night when electrical demand is low. Therefore, no customers are expected to experience outages due to this action. Telecommunication Construction. Electrical equipment at the proposed Banducci Substation would be monitored through SCE’s existing telecommunications system. Telecommunication infrastructure would be added to connect the proposed Banducci Substation to SCE’s existing telecommunications system. The new telecommunication equipment would be installed within the MEER at the proposed Banducci Substation and within the existing MEER at the Monolith Substation. There are two proposed fiber optic telecommunications cable routes. One potential route would connect the proposed Banducci Substation to the existing Cummings Substation and then continue on to the existing Monolith Substation. The length of this route would be approximately 14.5 miles. The second route option would directly connect the fiber optic telecommunications cable from the proposed Banducci Substation to the existing Monolith Substation. The length of this route would be approximately 17.5 miles. Approximately 34 of the 751 existing wood poles on the proposed telecommunication routes would be replaced to support the Proposed Project.

Banducci Substation Project 3.0 Air Quality Air Quality Report
taha 2011-037 22
Operation Operational mobile source emissions were calculated using a spreadsheet method (see Appendix D, Operational Emissions Calculations). EMFAC2011, which was the latest model at the time this report was prepared, emissions rates were used to calculate vehicle emissions. This model reflects the CARB’s current understanding of how vehicles travel and how much they pollute. Assumptions used in the operational mobile source analysis include:
Number of on-site vehicles: 2
Number of days per year for subtransmission line inspection: 1
Number of days per year for substation site visit: 156
Distance travelled per subtransmission line inspection: 72 miles
Distance travelled per substation site visit: 60 miles 3.4.2 Significance Criteria In accordance with Appendix G of the State CEQA Guidelines, the proposed project would have a significant impact related to air quality if it would:
Conflict with or obstruct implementation of the applicable air quality plan;
Violate any air quality standard or contribute substantially to an existing or projected air quality violation;
Result in a cumulatively considerable net increase of any criteria pollutant for which the project region is non-attainment under an applicable federal or State ambient air quality standard (including releasing emissions which exceed quantitative thresholds for ozone precursors);
Expose sensitive receptors to substantial pollutant concentrations; and/or
Create objectionable odors affecting a substantial number of people. The EKAPCD has developed specific CEQA significance thresholds to assess construction and operational air quality impacts. The Proposed Project would have a significant impact related to air quality if:
Annual regional construction emissions were to exceed EKAPCD Rule 210.1 construction emissions threshold for VOC (25 tons per year), NOX (25 tons per year), SOX (27 tons per year), or PM10 (15 tons per year);
Daily operational emissions were to exceed EKAPCD Rule 210.1 operational emissions threshold for VOC and NOX (137 pounds per day);
The Proposed Project would generate significant emissions of TACs to nearby sensitive receptors; and/or
The Proposed Project would create an odor nuisance affecting a substantial number of people.
Greenhouse Gas Significance Criteria
In accordance with Appendix G of the State CEQA Guidelines, the Proposed Project would have a significant impact related to greenhouse gases if it would:
Generate greenhouse gas emissions, either directly or indirectly, that may have a significant impact on the environment; and/or
Banducci Substation Project 3.0 Air Quality Air Quality Report
taha 2011-037 23
Conflict with any applicable plan, policy, or regulation adopted for the purpose of reducing the emissions of greenhouse gases.
The EKAPCD has not formally adopted recommendations or official guidance to evaluate the significance of GHG emissions for projects within the Mojave Desert Air Basin in which the EKAPCD is not the lead agency. The EKAPCD has adopted an addendum to their EKAPCD CEQA Guidelines, Addressing GHG Emission Impacts for Stationary Source Projects When Serving as the Lead CEQA Agency. The recommended threshold for GHG emissions is 25,000 tons per year of CO2e.
In addition, the South Coast Air Quality Management District (SCAQMD) has adopted a more conservative interim operational significance threshold of 10,000 metric tons of CO2e per year for projects in which they are the lead agency. Given the Proposed Project site’s proximity to the SCAQMD, and to implement the most conservative approach, this analysis applies the SCAQMD’s significance threshold. A project’s contribution to cumulative impacts to global climate change is considered cumulatively considerable if the project would generate 10,000 metric tons CO2e per year. 3.5 ENVIRONMENTAL IMPACTS 3.5.1 Construction Phase Regional Impacts Construction of the Proposed Project has the potential to create air quality impacts through the use of heavy-duty construction equipment and through vehicle trips generated by construction workers traveling to and from the project site. Fugitive dust emissions would primarily result from site preparation (e.g., excavation) activity. NOX emissions would primarily result from the use of construction equipment. The assessment of construction air quality impacts considers each of these potential sources. Construction emissions can vary substantially from day to day, depending on the level of activity, the specific type of operation and, for dust, the prevailing weather conditions. It is mandatory for all construction projects in the Basin to comply with EKAPCD Rule 402 for Fugitive Dust. The purpose of this Rule is to reduce the amount of PM10 emitted from significant man-made fugitive dust sources. Rule 402 applies to specified bulk storage, earthmoving, construction and demolition, and man-made conditions resulting in wind erosion. Rule 402 control measures for each source category are identified below.
Unpaved Road. Reasonable available control measures for unpaved roads include, but are not limited to, improving road surface, controlling vehicular traffic speed, and/or applying dust suppressants.
Construction/Demolition Activity. Reasonable available control measures for construction or demolition activity include, but are not limited to, using wind breaks and/or apply dust suppressants.
Earth-moving or Open Storage Pile. Reasonable available control measures for this source include, but are not limited to, wind screens, enclosure around storage piles, and/or apply dust suppressant.

Banducci Substation Project 3.0 Air Quality Air Quality Report
taha 2011-037 24
Disturbed Surface Area. Reasonable available control measures for disturbed surface area include, but are not limited to, fences or barriers, vegetate, apply dust suppressants, cover the disturbed surface area with gravel, and/or compact the disturbed surface area.
Table 3-3 shows estimated annual emissions associated with each construction phase. Annual emissions of VOC (0.27), NOX (2.8), and PM10 (6.1) would be less than the thresholds of significance established by EKAPCD (see Appendix C, Construction Regional Emission Calculations).9 Therefore, the Proposed Project would result in a less-than-significant impact related to regional construction emissions.
TABLE 3-3: ESTIMATED CONSTRUCTION EMISSIONS
Total Tons
VOC NOX PM10
Construction Phase
Banducci Substation Construction 0.33 4.43 8.22
Distribution Getaway Installation 0.01 0.14 0.20
Subtransmission Line Segment Installation 0.19 1.14 2.9
Telecommunication Construction 0.05 0.60 2.9
Construction Emissions (Tons per Year) /a/ 0.27 2.8 6.1
Regional Significance Threshold 25 25 15 Exceed Threshold? No No No
/a/ Total tons averaged over 2.34 years.
SOURCE: TAHA, 2014; Appendix C, Construction Regional Emission Calculations.
Toxic Air Contaminant Impacts The greatest potential for TAC emissions during construction would be diesel particulate emissions associated with heavy equipment operations. Health effects from carcinogenic air toxics are usually described in terms of individual cancer risk. “Individual Cancer Risk” is the likelihood that a person continuously exposed to concentrations of TACs over a 70-year lifetime will develop cancer based on the use of standard risk assessment methodology. Given the short-term construction schedule of approximately one year, it is not anticipated that the Proposed Project would result in a long-term (i.e., 70-year) source of TAC emissions. In addition, construction-related health risk assessments are typically completed for large, stationary construction projects that generate high emissions in one location near sensitive land uses and often include high volumes of truck trips. The potential for continuous TAC exposure is low given the low-density rural area and the transient nature of subtransmission line construction activity. Therefore, the Proposed Project would result in a less-than-significant impact related to construction TAC emissions. Odor Impacts Potential sources that may emit odors during construction activities include equipment exhaust and architectural coatings. Odors from these sources would be localized and generally confined to the immediate area surrounding the project site. The Proposed Project would utilize typical
9After implementing the measures included in Rule 402, PM10 emissions associated with construction activities would
be further reduced by approximately 61 percent so that they would total only approximately 2.57 tons per year, which is even further below the 15 tons per year standard set by EKAPCD.
Banducci Substation Project 3.0 Air Quality Air Quality Report
taha 2011-037 25
construction techniques, and the odors would be typical of most construction sites and temporary in nature. Construction would not cause an odor nuisance since there are no sensitive receptors near the project site. Construction odors would result in a less-than-significant impact. Consistency with the Air Quality Attainment Plan The EKAPCD developed an ozone redesignation request and maintenance plan for the Federal one-hour ozone standard on January 9, 2003. The eastern portion of Kern County ozone nonattainment has experienced less than an average exceedance per year for the one-hour Federal Ozone National Ambient Air Quality Standard (NAAQS) over the last three years. The Ozone, Attainment Demonstration, Maintenance Plan, and Redesignation Request document concludes that an attainment of the one-hour ozone standard has been approved by the USEPA, and deemed a maintenance area. As of February 2008, the District has filed an Ozone Early Progress Plan to reclassify the eight-hour ozone standard, and USEPA is reconsidering the level of the Federal eight-hour ozone standard. The initial 8-hour ozone standard attainment plan is not yet due to the U.S. EPA. The one-hour ozone maintenance plan requires no new control measures for maintaining attainment of the one-hour standard. The EKAPCD California Clean Air Act Ozone Air Quality Attainment Plan (AQAP) was approved by the California Air Resources Board (CARB) on February 18, 1993. EKAPCD’s most recent Annual Implementation Progress Report for this attainment plan was completed in December 15, 2005. The implementation progress report notes that KCAPCD is recognized by CARB staff as a nonurbanized, moderate ozone nonattainment District overwhelmingly impacted by upwind transport. The majority of the ambient ozone pollution in the area are pollutants that have been transported by the wind from the San Joaquin Valley and South Coast Air Basins. The implementation progress report indicates that no additional control measures are required for attainment of the ozone California Ambient Air Quality Standards (CAAQS), attainment will occur by reducing the pollution in these adjacent air basins. As explained above, the Proposed Project would not result in significant regional construction emissions and, thus, would not interfere with the attainment of air quality standards. Construction activity would not conflict or obstruct implementation of the AQAP and would result in a less-than-significant impact. Construction Phase Mitigation Measures Impacts related to air quality emissions would be less than significant. No mitigation measures are required. Impacts After Mitigation Impacts related to construction-related regional air quality were determined to be less than significant without mitigation.
Banducci Substation Project 3.0 Air Quality Air Quality Report
taha 2011-037 26
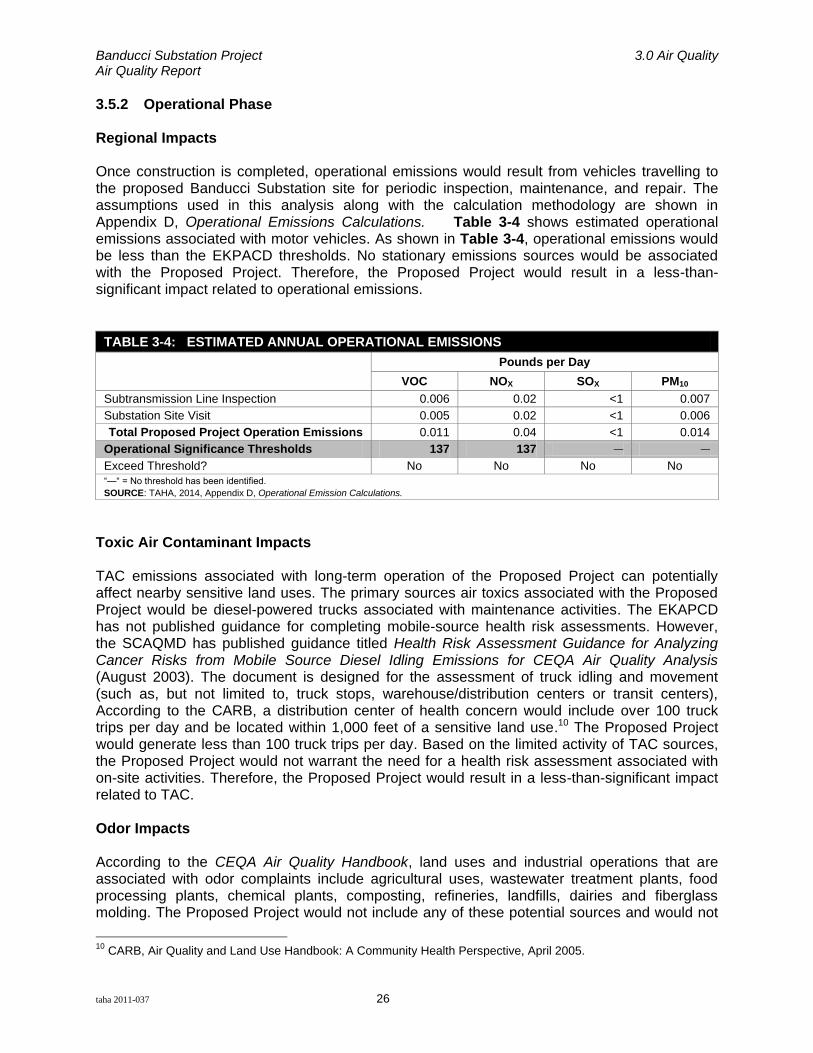
3.5.2 Operational Phase Regional Impacts Once construction is completed, operational emissions would result from vehicles travelling to the proposed Banducci Substation site for periodic inspection, maintenance, and repair. The assumptions used in this analysis along with the calculation methodology are shown in Appendix D, Operational Emissions Calculations. Table 3-4 shows estimated operational emissions associated with motor vehicles. As shown in Table 3-4, operational emissions would be less than the EKPACD thresholds. No stationary emissions sources would be associated with the Proposed Project. Therefore, the Proposed Project would result in a less-than-significant impact related to operational emissions.
TABLE 3-4: ESTIMATED ANNUAL OPERATIONAL EMISSIONS
Pounds per Day
VOC NOX SOX PM10
Subtransmission Line Inspection 0.006 0.02 <1 0.007
Substation Site Visit 0.005 0.02 <1 0.006
Total Proposed Project Operation Emissions 0.011 0.04 <1 0.014
Operational Significance Thresholds 137 137 — —
Exceed Threshold? No No No No
“—“ = No threshold has been identified.
SOURCE: TAHA, 2014, Appendix D, Operational Emission Calculations.
Toxic Air Contaminant Impacts TAC emissions associated with long-term operation of the Proposed Project can potentially affect nearby sensitive land uses. The primary sources air toxics associated with the Proposed Project would be diesel-powered trucks associated with maintenance activities. The EKAPCD has not published guidance for completing mobile-source health risk assessments. However, the SCAQMD has published guidance titled Health Risk Assessment Guidance for Analyzing Cancer Risks from Mobile Source Diesel Idling Emissions for CEQA Air Quality Analysis (August 2003). The document is designed for the assessment of truck idling and movement (such as, but not limited to, truck stops, warehouse/distribution centers or transit centers), According to the CARB, a distribution center of health concern would include over 100 truck trips per day and be located within 1,000 feet of a sensitive land use.10 The Proposed Project would generate less than 100 truck trips per day. Based on the limited activity of TAC sources, the Proposed Project would not warrant the need for a health risk assessment associated with on-site activities. Therefore, the Proposed Project would result in a less-than-significant impact related to TAC. Odor Impacts According to the CEQA Air Quality Handbook, land uses and industrial operations that are associated with odor complaints include agricultural uses, wastewater treatment plants, food processing plants, chemical plants, composting, refineries, landfills, dairies and fiberglass molding. The Proposed Project would not include any of these potential sources and would not
10
CARB, Air Quality and Land Use Handbook: A Community Health Perspective, April 2005.

Banducci Substation Project 3.0 Air Quality Air Quality Report
taha 2011-037 27
have a high potential to generate odor impacts. Therefore, the Proposed Project would result in a less-than-significant impact related to operation odors. Consistency with the Air Quality Attainment Plan A significant impact would occur if the Proposed Project conflict with or obstruct implementation of the applicable air quality plan. The determination of AQAP consistency is primarily concerned with the long-term influence of the Proposed Project on regional air quality. As mentioned above, the Proposed Project would not have a significant long-term impact on the region’s ability to meet the State and federal air quality standards. As such, the Proposed Project would not jeopardize the attainment standard. Operational activity would not conflict or obstruct implementation of the AQAP and would result in a less-than-significant impact. Operational Phase Mitigation Measures Impacts related to operational air quality emissions would be less than significant. No mitigation measures are required. Impacts After Mitigation Impacts related to operational air quality were determined to be less than significant without mitigation. 3.6 CUMULATIVE IMPACTS By its very nature, air pollution is largely a cumulative impact. No single project is sufficient in size to, by itself, result in nonattainment of ambient air quality standards. Instead, a project’s individual emissions contribute to existing cumulatively significant adverse air quality impacts. If a project exceeds the identified significance thresholds, its emissions may be cumulatively considerable, potentially resulting in significant adverse air quality impacts to the region’s existing air quality conditions. In that case, additional analysis to assess cumulative impacts would be necessary. The cumulative condition includes the Deteriorated Pole Program (DPP). DPP involves the removal and replacement of 79 poles in areas near the Project site. However, it is anticipated that the DPP work will be complete before construction begins for the Proposed Project. The Proposed Project would not result in a significant VOC, NOX, or PM10 impacts during construction or operation. Emissions from the Proposed Project are less than significant on a project basis and are not cumulatively considerable. The Proposed Project would not contribute to a cumulative impact. 3.6.2 Global Climate Change Greenhouse gas emissions associated with construction activities, SF6 leakage during project operations and on-road mobile vehicle operations were calculated. Greenhouse gas construction emissions were estimated in a similar manner and using the same assumptions as described above for regional construction emissions. As shown in Table 3-5, the Proposed Project would generate a total 840metric tons of CO2e during construction activity. The SCAQMD has developed guidance for the determination of significance of GHG construction emissions, and recommends that total emissions from construction be amortized over 30 years.
Banducci Substation Project 3.0 Air Quality Air Quality Report
taha 2011-037 28
The amortized construction emissions would result in a total annual emission of 30 metric tons CO2e. Operational emissions would result from on-road mobile vehicle operations and SF6 leakage. Mobile source operational emissions were estimated in a similar manner and using the same assumptions as described above for regional operational emissions. The two 66kV subtransmission line positions and the two 66kV transformer bank positions would each be equipped with a circuit breaker and three group-operated horizontal mount disconnect switches. Surge arresters and 66kV potential transformers (PTs) would be installed on the line positions only. The 66 kV bus tie position would be equipped with a circuit breaker and two group-operated horizontal mount disconnect switches. Three 66kV bus PTs would be connected to the operating bus through a three-phase group-operated disconnected switch. Although the Proposed Project would use the latest technology that limits leakage, some leakage would be anticipated over time as equipment ages or is accidently broken. GHG emissions associated with SF6 leakage were calculated using the following equation:
E = L/100 x MSF6 x 23,200 x 4.536 x 10-4
where:
E = GHG emissions from SF6 leakage (metric tons CO2 equivalent per year) L = SF6 leakage rate = 0.5 percent per year MSF6 = Total “weight” of SF6 in new circuit breakers = 155 pounds SF6 global warming potential = 23,200 Conversion factor for metric tons per pound = 4.536 x 10⁻⁴
As shown in Table 3-6, the estimated annual GHG emissions from the operational activities is eight (8) metric tons CO2e. These emissions would primarily be from SF6 leakage. The combined GHG emissions from construction activities (30 CO2e) and operational 11 CO2e would result in a total amortized emissions calculation of 41 CO2e of GHG (see Appendix E, Greenhouse Gas Emission Calculations). This amount would be considerably less than the 10,000 metric tons per year of CO2e significance threshold. In addition, SCE has made a significant investment in not only improving its SF6 gas management practices, but also in purchasing state-of-the-art gas handling equipment that minimizes SF6 leakage. The new equipment has improved sealing designs that virtually eliminate possible sources of leakage. SCE has also addressed SF6 leakage on older equipment by performing repairs and replacing antiquated equipment through its infrastructure replacement program. It is expected that the Proposed Project would have a minimal amount of SF6 leakage as a result of the installation of state-of-the-art equipment and SCE’s SF6 gas management practices. Pursuant to its existing practices, SCE would reduce potential GHG impacts resulting from the Proposed Project to the greatest extent practicable. Therefore, the Proposed Project would result in a less-than-significant impact related to GHG emissions.

Banducci Substation Project 3.0 Air Quality Air Quality Report
taha 2011-037 29
TABLE 3-5: ESTIMATED GREENHOUSE GAS EMISSIONS
Phase Carbon Dioxide Equivalent (Metric Tons)
Construction
Banducci Substation Construction 464
Distribution Getaway Installation 16
Subtransmission Line Segment Installation 114
Telecommunication Construction 74
Off-site Emissions 237
Total Construction Emissions 905
Construction Emissions Amortized /a/ 30
Operations
SF6 Leakage 8
Mobile Sources 3
Total Operational Emissions 11
Total Annual GHG Emissions 41
Significance Threshold 10,000
Exceed Threshold? No
/a/ The South Coast Air Quality Management District recommends annualizing construction emissions over 30 years in the GHG analysis. SOURCE: TAHA, 2014, Appendix E, Greenhouse Gas Emission Calculations.

Appendix A
Climate Information
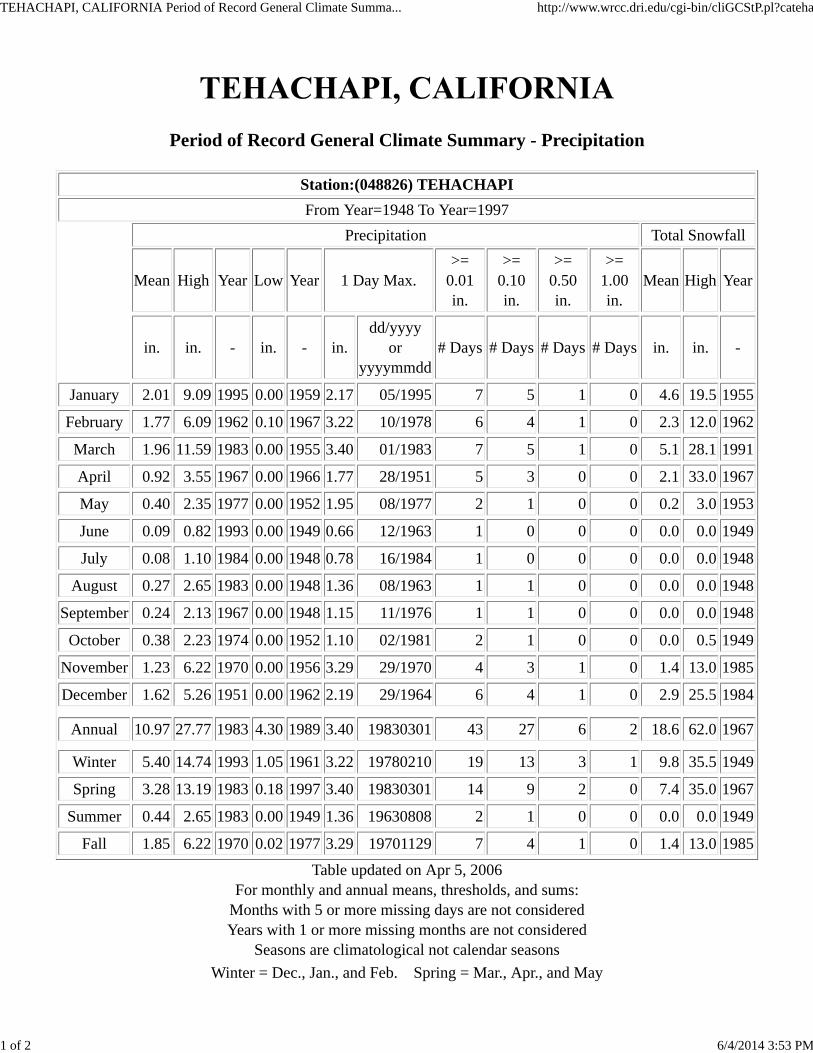
Period of Record General Climate Summary - Precipitation
Station:(048826) TEHACHAPI
From Year=1948 To Year=1997
Precipitation Total Snowfall
Mean High Year Low Year 1 Day Max.>=
0.01in.
>=0.10in.
>=0.50in.
>=1.00in.
Mean High Year
in. in. - in. - in.dd/yyyy
oryyyymmdd
# Days # Days # Days # Days in. in. -
January 2.01 9.09 1995 0.00 1959 2.17 05/1995 7 5 1 0 4.6 19.5 1955
February 1.77 6.09 1962 0.10 1967 3.22 10/1978 6 4 1 0 2.3 12.0 1962
March 1.96 11.59 1983 0.00 1955 3.40 01/1983 7 5 1 0 5.1 28.1 1991
April 0.92 3.55 1967 0.00 1966 1.77 28/1951 5 3 0 0 2.1 33.0 1967
May 0.40 2.35 1977 0.00 1952 1.95 08/1977 2 1 0 0 0.2 3.0 1953
June 0.09 0.82 1993 0.00 1949 0.66 12/1963 1 0 0 0 0.0 0.0 1949
July 0.08 1.10 1984 0.00 1948 0.78 16/1984 1 0 0 0 0.0 0.0 1948
August 0.27 2.65 1983 0.00 1948 1.36 08/1963 1 1 0 0 0.0 0.0 1948
September 0.24 2.13 1967 0.00 1948 1.15 11/1976 1 1 0 0 0.0 0.0 1948
October 0.38 2.23 1974 0.00 1952 1.10 02/1981 2 1 0 0 0.0 0.5 1949
November 1.23 6.22 1970 0.00 1956 3.29 29/1970 4 3 1 0 1.4 13.0 1985
December 1.62 5.26 1951 0.00 1962 2.19 29/1964 6 4 1 0 2.9 25.5 1984
Annual 10.97 27.77 1983 4.30 1989 3.40 19830301 43 27 6 2 18.6 62.0 1967
Winter 5.40 14.74 1993 1.05 1961 3.22 19780210 19 13 3 1 9.8 35.5 1949
Spring 3.28 13.19 1983 0.18 1997 3.40 19830301 14 9 2 0 7.4 35.0 1967
Summer 0.44 2.65 1983 0.00 1949 1.36 19630808 2 1 0 0 0.0 0.0 1949
Fall 1.85 6.22 1970 0.02 1977 3.29 19701129 7 4 1 0 1.4 13.0 1985
Table updated on Apr 5, 2006For monthly and annual means, thresholds, and sums:
Months with 5 or more missing days are not consideredYears with 1 or more missing months are not considered
Seasons are climatological not calendar seasons
Winter = Dec., Jan., and Feb. Spring = Mar., Apr., and May
TEHACHAPI, CALIFORNIA Period of Record General Climate Summa... http://www.wrcc.dri.edu/cgi-bin/cliGCStP.pl?cateha
1 of 2 6/4/2014 3:53 PM

Period of Record General Climate Summary - Temperature
Station:(048826) TEHACHAPI
From Year=1948 To Year=1997
MonthlyAverages
Daily Extremes Monthly ExtremesMax.Temp.
Min.Temp.
Max. Min. Mean High Date Low DateHighestMean
YearLowestMean
Year>=
90 F<=
32 F<=
32 F<=0 F
F F F Fdd/yyyy
oryyyymmdd
Fdd/yyyy
oryyyymmdd
F - F -#
Days#
Days#
Days#
Days
January 51.4 30.1 40.8 74 30/1971 0 16/1949 48.4 1986 27.7 1949 0.0 0.5 19.1 0.0
February 54.6 31.8 43.2 78 10/1951 6 13/1949 48.8 1995 36.3 1949 0.0 0.1 15.7 0.0
March 56.2 33.8 44.9 81 24/1956 9 02/1953 51.3 1972 39.3 1952 0.0 0.0 13.3 0.0
April 62.6 37.3 50.0 89 19/1950 17 12/1965 56.7 1989 40.2 1967 0.0 0.0 7.0 0.0
May 70.6 44.0 57.4 95 13/1976 26 06/1988 62.9 1997 50.7 1953 0.5 0.0 1.4 0.0
June 79.2 51.5 65.3 102 29/1950 29 03/1967 71.7 1981 58.8 1965 3.9 0.0 0.1 0.0
July 86.6 57.6 72.1 103 25/1980 36 05/1948 75.7 1970 67.2 1983 10.1 0.0 0.0 0.0
August 85.9 55.4 70.7 104 18/1950 38 20/1948 75.5 1967 65.6 1976 9.5 0.0 0.0 0.0
September 80.6 49.2 64.9 102 03/1950 22 26/1948 69.4 1974 58.6 1986 4.3 0.0 0.1 0.0
October 71.1 41.3 56.2 96 03/1980 19 29/1971 62.0 1988 50.6 1969 0.2 0.0 2.9 0.0
November 59.4 34.8 47.1 83 01/1965 6 17/1958 54.0 1949 40.0 1994 0.0 0.0 11.6 0.0
December 52.4 30.7 41.5 81 03/1958 -4 21/1967 49.1 1958 34.3 1971 0.0 0.5 18.9 0.0
Annual 67.5 41.5 54.5 104 19500818 -4 19671221 56.1 1980 52.6 1964 28.7 1.2 90.1 0.0
Winter 52.8 30.9 41.8 81 19581203 -4 19671221 46.5 1981 33.5 1949 0.0 1.2 53.7 0.0
Spring 63.1 38.4 50.7 95 19760513 9 19530302 54.4 1992 47.2 1991 0.5 0.0 21.7 0.0
Summer 83.9 54.9 69.4 104 19500818 29 19670603 73.7 1981 65.6 1963 23.6 0.0 0.1 0.0
Fall 70.4 41.8 56.1 102 19500903 6 19581117 59.6 1995 52.8 1994 4.6 0.0 14.6 0.0
Table updated on Apr 5, 2006For monthly and annual means, thresholds, and sums:
Months with 5 or more missing days are not consideredYears with 1 or more missing months are not considered
Seasons are climatological not calendar seasons
Winter = Dec., Jan., and Feb. Spring = Mar., Apr., and May
Summer = Jun., Jul., and Aug. Fall = Sep., Oct., and Nov.
Western Regional Climate Center, [email protected]
TEHACHAPI, CALIFORNIA Period of Record General Climate Summa... http://www.wrcc.dri.edu/cgi-bin/cliGCStT.pl?cateha
1 of 1 6/4/2014 3:52 PM

Appendix B
CARB Data
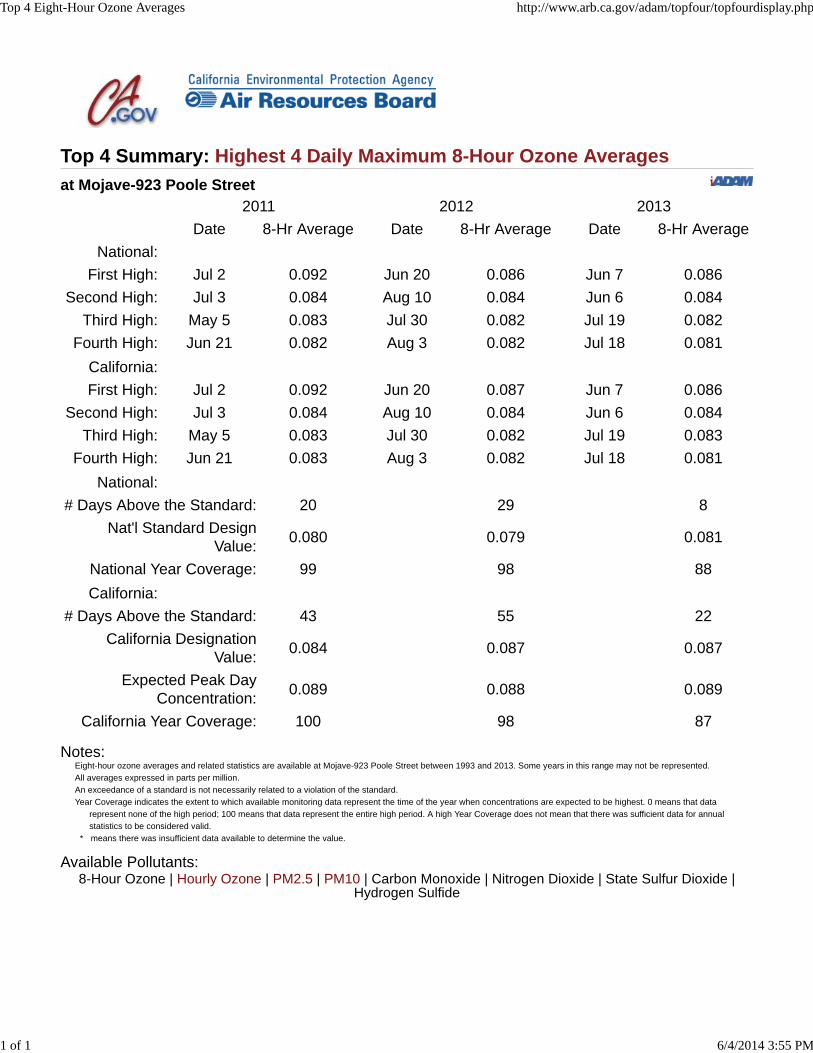
Top 4 Summary: Highest 4 Daily Maximum 8-Hour Ozone Averages
at Mojave-923 Poole Street2011 2012 2013
Date 8-Hr Average Date 8-Hr Average Date 8-Hr AverageNational:
First High: Jul 2 0.092 Jun 20 0.086 Jun 7 0.086Second High: Jul 3 0.084 Aug 10 0.084 Jun 6 0.084
Third High: May 5 0.083 Jul 30 0.082 Jul 19 0.082Fourth High: Jun 21 0.082 Aug 3 0.082 Jul 18 0.081
California:First High: Jul 2 0.092 Jun 20 0.087 Jun 7 0.086
Second High: Jul 3 0.084 Aug 10 0.084 Jun 6 0.084Third High: May 5 0.083 Jul 30 0.082 Jul 19 0.083
Fourth High: Jun 21 0.083 Aug 3 0.082 Jul 18 0.081National:
# Days Above the Standard: 20 29 8Nat'l Standard Design
Value: 0.080 0.079 0.081
National Year Coverage: 99 98 88California:
# Days Above the Standard: 43 55 22California Designation
Value: 0.084 0.087 0.087
Expected Peak DayConcentration: 0.089 0.088 0.089
California Year Coverage: 100 98 87
Notes:Eight-hour ozone averages and related statistics are available at Mojave-923 Poole Street between 1993 and 2013. Some years in this range may not be represented.All averages expressed in parts per million.An exceedance of a standard is not necessarily related to a violation of the standard.Year Coverage indicates the extent to which available monitoring data represent the time of the year when concentrations are expected to be highest. 0 means that data
represent none of the high period; 100 means that data represent the entire high period. A high Year Coverage does not mean that there was sufficient data for annualstatistics to be considered valid.
* means there was insufficient data available to determine the value.
Available Pollutants:8-Hour Ozone | Hourly Ozone | PM2.5 | PM10 | Carbon Monoxide | Nitrogen Dioxide | State Sulfur Dioxide |
Hydrogen Sulfide
Top 4 Eight-Hour Ozone Averages http://www.arb.ca.gov/adam/topfour/topfourdisplay.php
1 of 1 6/4/2014 3:55 PM
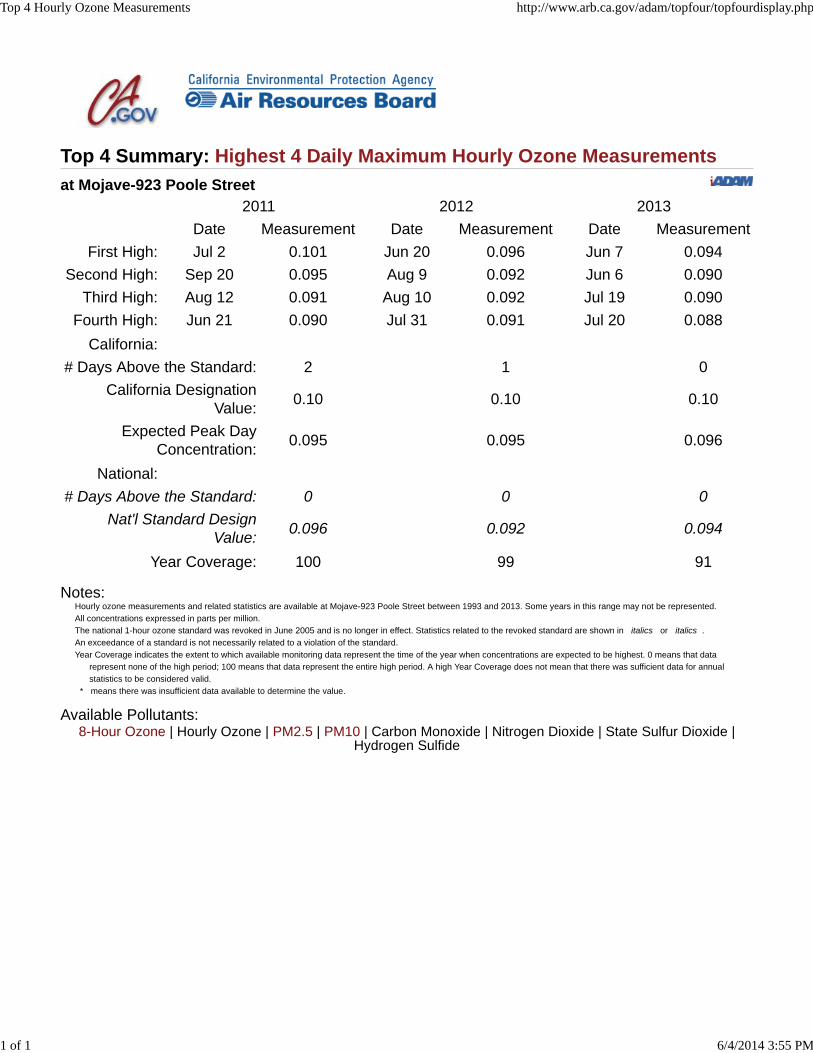
Top 4 Summary: Highest 4 Daily Maximum Hourly Ozone Measurements
at Mojave-923 Poole Street2011 2012 2013
Date Measurement Date Measurement Date MeasurementFirst High: Jul 2 0.101 Jun 20 0.096 Jun 7 0.094
Second High: Sep 20 0.095 Aug 9 0.092 Jun 6 0.090Third High: Aug 12 0.091 Aug 10 0.092 Jul 19 0.090
Fourth High: Jun 21 0.090 Jul 31 0.091 Jul 20 0.088California:
# Days Above the Standard: 2 1 0California Designation
Value: 0.10 0.10 0.10
Expected Peak DayConcentration: 0.095 0.095 0.096
National:# Days Above the Standard: 0 0 0
Nat'l Standard DesignValue:
0.096 0.092 0.094
Year Coverage: 100 99 91
Notes:Hourly ozone measurements and related statistics are available at Mojave-923 Poole Street between 1993 and 2013. Some years in this range may not be represented.All concentrations expressed in parts per million.The national 1-hour ozone standard was revoked in June 2005 and is no longer in effect. Statistics related to the revoked standard are shown in italics or italics .An exceedance of a standard is not necessarily related to a violation of the standard.Year Coverage indicates the extent to which available monitoring data represent the time of the year when concentrations are expected to be highest. 0 means that data
represent none of the high period; 100 means that data represent the entire high period. A high Year Coverage does not mean that there was sufficient data for annualstatistics to be considered valid.
* means there was insufficient data available to determine the value.
Available Pollutants:8-Hour Ozone | Hourly Ozone | PM2.5 | PM10 | Carbon Monoxide | Nitrogen Dioxide | State Sulfur Dioxide |
Hydrogen Sulfide
Top 4 Hourly Ozone Measurements http://www.arb.ca.gov/adam/topfour/topfourdisplay.php
1 of 1 6/4/2014 3:55 PM

Top 4 Summary: Highest 4 Daily 24-Hour PM2.5 Averages
at Mojave-923 Poole Street2011 2012 2013
Date 24-HrAverage Date 24-Hr
Average Date 24-HrAverage
National:First High: Aug 22 28.0 May 23 67.7 Mar 21 76.2
Second High: Oct 25 23.0 Apr 1 49.5 Apr 8 67.9Third High: May 26 22.8 Feb 25 34.1 Jun 2 53.6
Fourth High: Aug 21 20.3 May 1 27.2 Mar 22 47.9California:First High: May 27 34.0 Apr 1 49.5 Mar 21 76.2
Second High: Aug 22 28.0 Feb 25 34.1 Apr 8 67.9Third High: Oct 25 23.0 May 3 28.4 Jun 2 53.6
Fourth High: May 26 22.8 May 1 27.2 Mar 22 47.9National:
Estimated # Days >24-Hour Std: 0.0 2.1 6.6
Measured # Days >24-Hour Std: 0 2 5
24-Hour Standard DesignValue: * * 24
24-Hour Standard 98thPercentile: 17.6 21.8 33.7
Annual Standard DesignValue: * * 7.2
Annual Average: 6.2 6.5 8.6California:Annual Std Designation
Value: 5 7 7
Annual Average: * 6.6 *Year Coverage: 100 100 81
Notes:Daily PM2.5 averages and related statistics are available at Mojave-923 Poole Street between 1999 and 2013. Some years in this range may not be represented.All averages expressed in micrograms per cubic meter.An exceedance of a standard is not necessarily related to a violation of the standard.State statistics are based on California approved samplers, whereas national statistics are based on samplers using federal reference or equivalent methods. State and national
statistics may therefore be based on different samplers.Year Coverage indicates the extent to which available monitoring data represent the time of the year when concentrations are expected to be highest. 0 means that data
represent none of the high period; 100 means that data represent the entire high period. A high Year Coverage does not mean that there was sufficient data for annualstatistics to be considered valid.
* means there was insufficient data available to determine the value.
Top 4 Daily PM2.5 Averages http://www.arb.ca.gov/adam/topfour/topfourdisplay.php
1 of 2 6/4/2014 3:55 PM
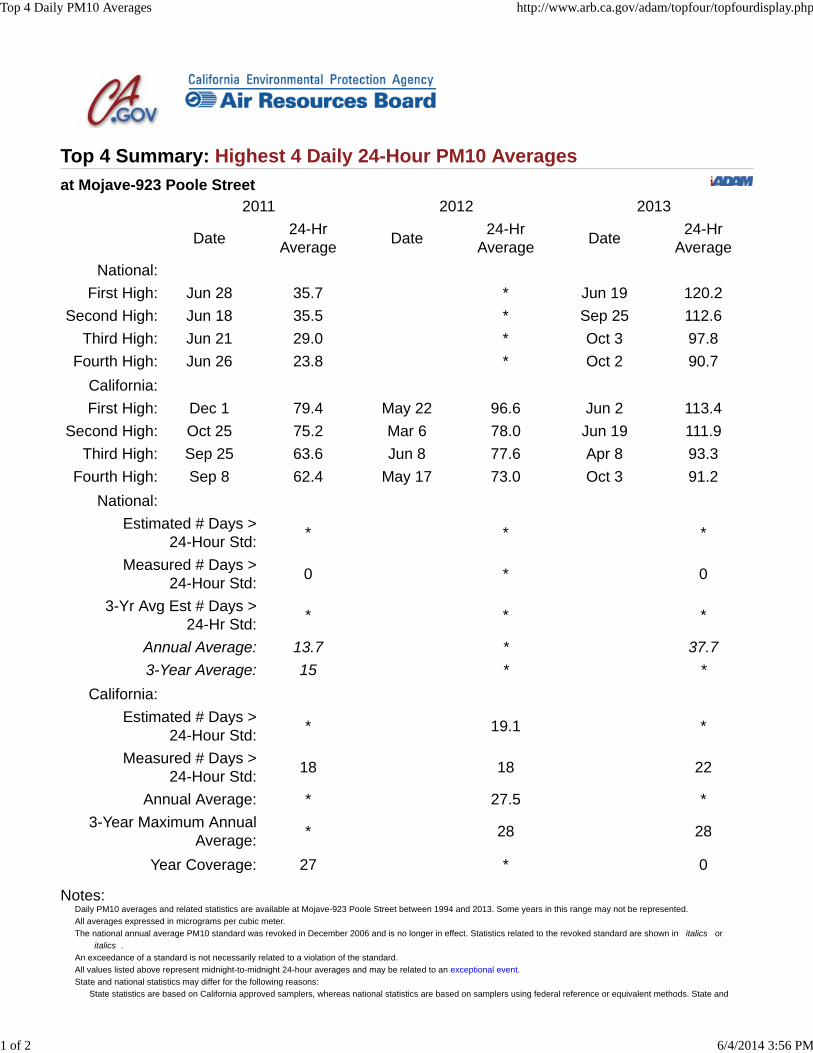
Top 4 Summary: Highest 4 Daily 24-Hour PM10 Averages
at Mojave-923 Poole Street2011 2012 2013
Date 24-HrAverage Date 24-Hr
Average Date 24-HrAverage
National:First High: Jun 28 35.7 * Jun 19 120.2
Second High: Jun 18 35.5 * Sep 25 112.6Third High: Jun 21 29.0 * Oct 3 97.8
Fourth High: Jun 26 23.8 * Oct 2 90.7California:First High: Dec 1 79.4 May 22 96.6 Jun 2 113.4
Second High: Oct 25 75.2 Mar 6 78.0 Jun 19 111.9Third High: Sep 25 63.6 Jun 8 77.6 Apr 8 93.3
Fourth High: Sep 8 62.4 May 17 73.0 Oct 3 91.2National:
Estimated # Days >24-Hour Std: * * *
Measured # Days >24-Hour Std: 0 * 0
3-Yr Avg Est # Days >24-Hr Std: * * *
Annual Average: 13.7 * 37.7
3-Year Average: 15 * *
California:Estimated # Days >
24-Hour Std: * 19.1 *
Measured # Days >24-Hour Std: 18 18 22
Annual Average: * 27.5 *3-Year Maximum Annual
Average: * 28 28
Year Coverage: 27 * 0
Notes:Daily PM10 averages and related statistics are available at Mojave-923 Poole Street between 1994 and 2013. Some years in this range may not be represented.All averages expressed in micrograms per cubic meter.The national annual average PM10 standard was revoked in December 2006 and is no longer in effect. Statistics related to the revoked standard are shown in italics or
italics .An exceedance of a standard is not necessarily related to a violation of the standard.All values listed above represent midnight-to-midnight 24-hour averages and may be related to an exceptional event.State and national statistics may differ for the following reasons:
State statistics are based on California approved samplers, whereas national statistics are based on samplers using federal reference or equivalent methods. State and
Top 4 Daily PM10 Averages http://www.arb.ca.gov/adam/topfour/topfourdisplay.php
1 of 2 6/4/2014 3:56 PM

Appendix C
Construction Regional Emission Calculations
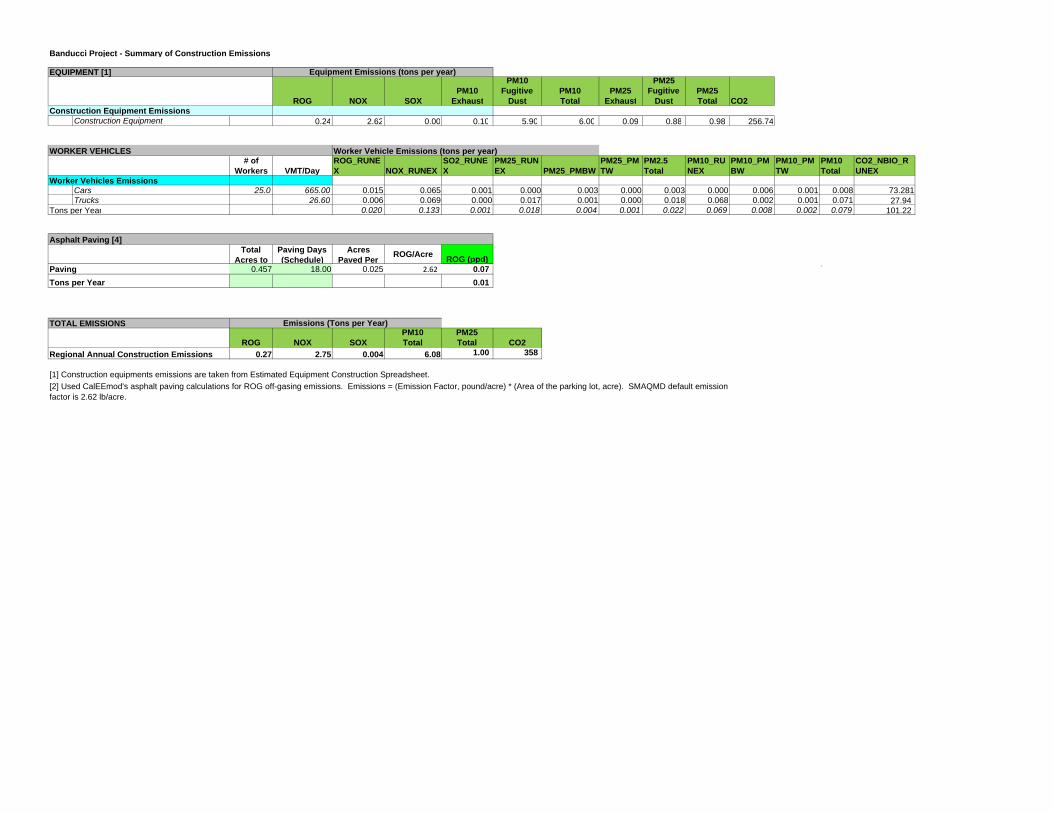
EQUIPMENT [1]
ROG NOX SOXPM10
Exhaust
PM10Fugitive
DustPM10Total
PM25Exhaust
PM25Fugitive
DustPM25Total CO2
Construction Equipment 0.24 2.62 0.00 0.10 5.90 6.00 0.09 0.88 0.98 256.74
WORKER VEHICLES Worker Vehicle Emissions (tons per year)# of
Workers VMT/DayROG_RUNEX NOX_RUNEX
SO2_RUNEX
PM25_RUNEX PM25_PMBW
PM25_PMTW
PM2.5 Total
PM10_RUNEX
PM10_PMBW
PM10_PMTW
PM10 Total
CO2_NBIO_RUNEX
Cars 25.0 665.00 0.015 0.065 0.001 0.000 0.003 0.000 0.003 0.000 0.006 0.001 0.008 73.281Trucks 26.60 0.006 0.069 0.000 0.017 0.001 0.000 0.018 0.068 0.002 0.001 0.071 27.94
0.020 0.133 0.001 0.018 0.004 0.001 0.022 0.069 0.008 0.002 0.079 101.22
Asphalt Paving [4]Total
Acres to Paving Days (Schedule)
Acres Paved Per
ROG/AcreROG (ppd)
Paving 0.457 18.00 0.025 2.62 0.07 `
Tons per Year 0.01
TOTAL EMISSIONS
ROG NOX SOXPM10Total
PM25Total CO2
Regional Annual Construction Emissions 0.27 2.75 0.004 6.08 1.00 358
Emissions (Tons per Year)
[1] Construction equipments emissions are taken from Estimated Equipment Construction Spreadsheet.[2] Used CalEEmod's asphalt paving calculations for ROG off-gasing emissions. Emissions = (Emission Factor, pound/acre) * (Area of the parking lot, acre). SMAQMD default emission factor is 2.62 lb/acre.
Tons per Year
Worker Vehicles Emissions
Banducci Project - Summary of Construction Emissions
Construction Equipment Emissions
Equipment Emissions (tons per year)

Emission Calculation Assumption
Equipm
ent T
ype
CalEEM
od Category
HP
Qty
Ope
ratin
g Hrs/W
D/each
Ope
ratin
g Hou
rs per Day/ No
of Rou
nd Trip
s for On‐road
# of m
iles for Onroa
d
Material loa
ding
throup
ut
(ton
s/da
y)
CO Rate (lb
s/hr)
ROG Rate (lb
s/hr)
NOX rate (lbs/hr)
SOX rate (lbs/hr)
PM2.5 rate (lbs/hr)
PM10
rate (lbs/hr)
CO2 rate (lbs/hr)
CH4 rate (lbs/hr)
Banducci Substation ConstructionSurvey ‐ 5 Work Days Survey Trucks 2 2.00 107.6Survey Emissions Total (lbs)Grading ‐ 30 Work Days Dozer Rubber Tired
Dozers Composite380 1 8.00 8.00 2.07 0.24 2.70 0.00 0.13 0.12 175.82 0.05
Loader Rubber Tired Loaders Composite
380 2 8.00 16.00 100.00 0.73 0.13 1.57 0.00 0.06 0.05 154.57 0.05
Scraper Scrapers Composite
400 1 8.00 8.00 1.65 0.20 2.64 0.00 0.11 0.10 218.99 0.06
Grader Graders Composite 400 1 8.00 8.00 0.65 0.11 1.34 0.00 0.05 0.05 187.06 0.06
Water Truck Other Construction Equipment Composite
250 1 4.00 4.00 0.40 0.05 0.74 0.00 0.03 0.03 84.42 0.02
4 X 4 Tamper Other Construction Equipment Composite
175 1 4.00 4.00 0.40 0.05 0.74 0.00 0.03 0.03 84.42 0.02
Tool Truck Other Construction Equipment Composite
175 1 4.00 4.00 0.40 0.05 0.74 0.00 0.03 0.03 84.42 0.02
Pick‐up Truck 4 4.00 107.6Grading Emissions Total (lbs)Fencing (Chain Link) ‐ 10 Work Days Bobcat Tractors/Loaders/B
ackhoes Composite250 1 8.00 8.00 0.28 0.07 1.00 0.00 0.03 0.03 105.06 0.03
Flatbed Truck Other Construction Equipment Composite
175 1 4.00 4.00 0.40 0.05 0.74 0.00 0.03 0.03 84.42 0.02
Crew Cab Truck 1 1.00 107.6Fencing Emissions Total (lbs)Civil ‐ 76 Work Days
Construction On‐site Emissions (lbs/hr)

Emission Calculation Assumption
Equipm
ent T
ype
CalEEM
od Category
HP
Qty
Ope
ratin
g Hrs/W
D/each
Ope
ratin
g Hou
rs per Day/ No
of Rou
nd Trip
s for On‐road
# of m
iles for Onroa
d
Material loa
ding
throup
ut
(ton
s/da
y)
CO Rate (lb
s/hr)
ROG Rate (lb
s/hr)
NOX rate (lbs/hr)
SOX rate (lbs/hr)
PM2.5 rate (lbs/hr)
PM10
rate (lbs/hr)
CO2 rate (lbs/hr)
CH4 rate (lbs/hr)
Construction On‐site Emissions (lbs/hr)
Excavator Excavators Composite
350 1 8.00 8.00 0.40 0.07 1.04 0.00 0.03 0.03 150.11 0.04
Foundation Auger Bore/Drill Rigs Composite
175 1 4.00 4.00 0.59 0.06 0.78 0.00 0.04 0.03 101.09 0.03
Backhoe Tractors/Loaders/Backhoes Composite
250 2 8.00 16.00 100.00 0.28 0.07 1.00 0.00 0.03 0.03 105.06 0.03
Dump Truck 1 1.00 26.6 Skip Loader Tractors/Loaders/B
ackhoes Composite250 1 8.00 8.00 100.00 0.28 0.07 1.00 0.00 0.03 0.03 105.06 0.03
Water Truck Other Construction Equipment Composite
250 1 8.00 8.00 0.40 0.05 0.74 0.00 0.03 0.03 84.42 0.02
Bobcat Skid Steer Skid Steer Loaders Composite
75 2 8.00 16.00 10.00 0.20 0.02 0.25 0.00 0.01 0.01 31.63 0.01
Forklift Forklifts Composite 100 1 4.00 4.00 0.18 0.04 0.30 0.00 0.03 0.02 22.75 0.01
17 Ton Crane Cranes Composite 250 1 4.00 4.00 0.66 0.08 0.99 0.00 0.04 0.04 82.03 0.02
Tool Truck Other Construction Equipment Composite
175 1 4.00 4.00 0.40 0.05 0.74 0.00 0.03 0.03 84.42 0.02
Pick‐up Truck 4 4.00 107.6Civil Emissions Total (lbs)MEER (Not Pre‐Built) ‐ 5 Work Days Pick‐up Truck 2 2.00 107.6 Stake Truck Other Construction
Equipment Composite
175 1 2.00 2.00 0.40 0.05 0.74 0.00 0.03 0.03 84.42 0.02
17 Ton Crane Cranes Composite 250 1 4.00 4.00 0.66 0.08 0.99 0.00 0.04 0.04 82.03 0.02
MEER Emissions Total (lbs)Electrical ‐ 66 Work Days Scissor Lifts Aerial Lifts
Composite120 1 4.00 4.00 0.26 0.02 0.28 0.00 0.01 0.01 42.13 0.01

Emission Calculation Assumption
Equipm
ent T
ype
CalEEM
od Category
HP
Qty
Ope
ratin
g Hrs/W
D/each
Ope
ratin
g Hou
rs per Day/ No
of Rou
nd Trip
s for On‐road
# of m
iles for Onroa
d
Material loa
ding
throup
ut
(ton
s/da
y)
CO Rate (lb
s/hr)
ROG Rate (lb
s/hr)
NOX rate (lbs/hr)
SOX rate (lbs/hr)
PM2.5 rate (lbs/hr)
PM10
rate (lbs/hr)
CO2 rate (lbs/hr)
CH4 rate (lbs/hr)
Construction On‐site Emissions (lbs/hr)
Manlift Aerial Lifts Composite
120 2 4.00 8.00 0.26 0.02 0.28 0.00 0.01 0.01 42.13 0.01
Reach Forklift Forklifts Composite 100 1 2.00 2.00 0.18 0.04 0.30 0.00 0.03 0.02 22.75 0.01
15 Ton Crane (Line Truck) Cranes Composite 250 1 4.00 4.00 0.66 0.08 0.99 0.00 0.04 0.04 82.03 0.02
Tool Trailer Other Construction Equipment Composite
175 1 8.00 8.00 0.40 0.05 0.74 0.00 0.03 0.03 84.42 0.02
Crew Truck 2 2.00 107.6 70 Ton Crane Cranes Composite 250 1 4.00 4.00 0.66 0.08 0.99 0.00 0.04 0.04 82.03 0.02
Electrical Emissions Total (lbs)Wiring ‐ 44 Work Days Manlift Aerial Lifts
Composite120 1 2.00 2.00 0.26 0.02 0.28 0.00 0.01 0.01 42.13 0.01
Tool Trailer Other Construction Equipment Composite
175 1 8.00 8.00 0.40 0.05 0.74 0.00 0.03 0.03 84.42 0.02
Wiring Emissions Total (lbs)

Emission Calculation Assumption
Equipm
ent T
ype
CalEEM
od Category
HP
Qty
Ope
ratin
g Hrs/W
D/each
Ope
ratin
g Hou
rs per Day/ No
of Rou
nd Trip
s for On‐road
# of m
iles for Onroa
d
Material loa
ding
throup
ut
(ton
s/da
y)
CO Rate (lb
s/hr)
ROG Rate (lb
s/hr)
NOX rate (lbs/hr)
SOX rate (lbs/hr)
PM2.5 rate (lbs/hr)
PM10
rate (lbs/hr)
CO2 rate (lbs/hr)
CH4 rate (lbs/hr)
Construction On‐site Emissions (lbs/hr)
Transformers ‐ 5 Work Days Crew Truck 2 2.00 107.6 Low Bed Truck Other Construction
Equipment Composite
175 1 2.00 2.00 0.40 0.05 0.74 0.00 0.03 0.03 84.42 0.02
Transformers Emissions Total (lbs)Maintenance Crew Equipment Check ‐ 22 Work Days Maintenance Truck Other Construction
Equipment Composite
175 2 2.00 4.00 0.40 0.05 0.74 0.00 0.03 0.03 84.42 0.02
Maintenance Crew Equipment Check Emissions Total (lbs)Testing ‐ 88 Work Days Crew Truck/Van 1 1.00 107.6Testing Emissions Total (lbs)Asphalting ‐ 10 Work Days Paving Roller Pavers Composite 100 1 4.00 4.00 0.35 0.06 0.57 0.00 0.04 0.04 47.11 0.01
Asphalt Paver Paving Equipment Composite
100 1 4.00 4.00 0.30 0.05 0.51 0.00 0.04 0.04 41.12 0.01
Stake Truck Other Construction Equipment Composite
175 1 2.00 2.00 0.40 0.05 0.74 0.00 0.03 0.03 84.42 0.02
Tractor Tractors/Loaders/Backhoes Composite
250 1 8.00 8.00 0.28 0.07 1.00 0.00 0.03 0.03 105.06 0.03
Dump Truck 1 1.00 26.6 Crew Trucks Other Construction
Equipment Composite
175 2 2.00 4.00 0.40 0.05 0.74 0.00 0.03 0.03 84.42 0.02
Asphalt Curb Machine Paving Equipment Composite
100 1 2.00 2.00 0.30 0.05 0.51 0.00 0.04 0.04 41.12 0.01
Asphalting Emissions Total (lbs)
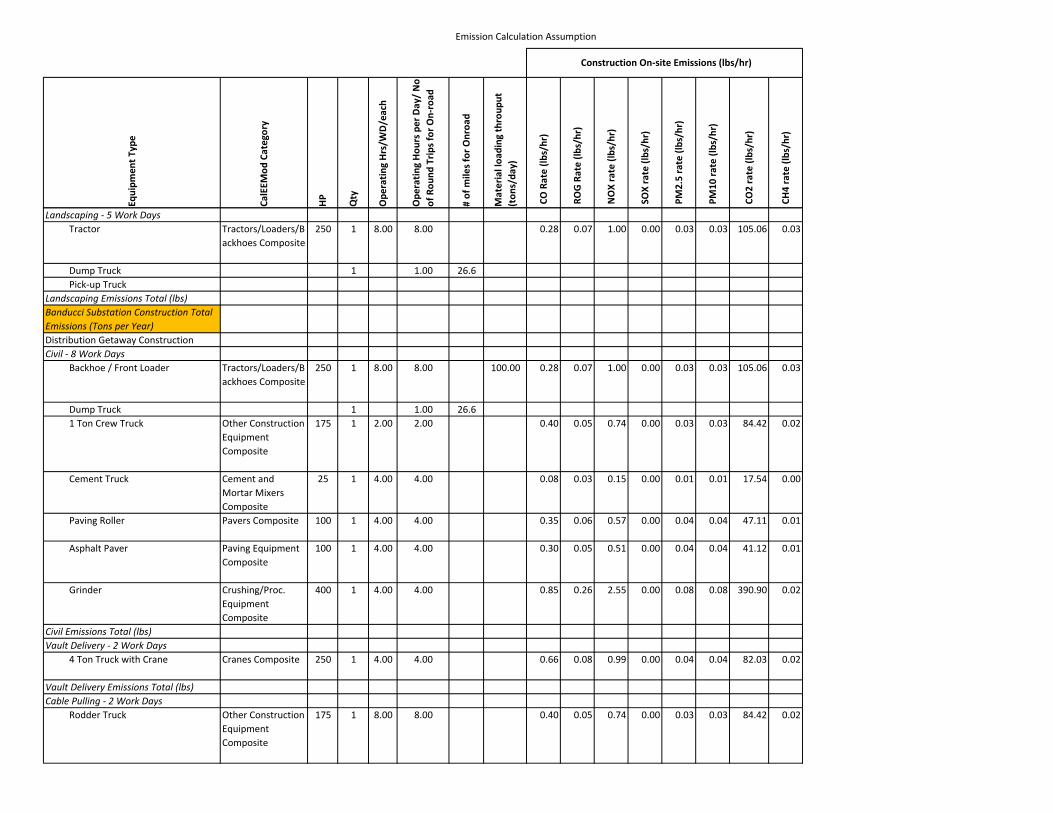
Emission Calculation Assumption
Equipm
ent T
ype
CalEEM
od Category
HP
Qty
Ope
ratin
g Hrs/W
D/each
Ope
ratin
g Hou
rs per Day/ No
of Rou
nd Trip
s for On‐road
# of m
iles for Onroa
d
Material loa
ding
throup
ut
(ton
s/da
y)
CO Rate (lb
s/hr)
ROG Rate (lb
s/hr)
NOX rate (lbs/hr)
SOX rate (lbs/hr)
PM2.5 rate (lbs/hr)
PM10
rate (lbs/hr)
CO2 rate (lbs/hr)
CH4 rate (lbs/hr)
Construction On‐site Emissions (lbs/hr)
Landscaping ‐ 5 Work Days Tractor Tractors/Loaders/B
ackhoes Composite250 1 8.00 8.00 0.28 0.07 1.00 0.00 0.03 0.03 105.06 0.03
Dump Truck 1 1.00 26.6 Pick‐up TruckLandscaping Emissions Total (lbs)Banducci Substation Construction Total Emissions (Tons per Year)Distribution Getaway ConstructionCivil ‐ 8 Work Days Backhoe / Front Loader Tractors/Loaders/B
ackhoes Composite250 1 8.00 8.00 100.00 0.28 0.07 1.00 0.00 0.03 0.03 105.06 0.03
Dump Truck 1 1.00 26.6 1 Ton Crew Truck Other Construction
Equipment Composite
175 1 2.00 2.00 0.40 0.05 0.74 0.00 0.03 0.03 84.42 0.02
Cement Truck Cement and Mortar Mixers Composite
25 1 4.00 4.00 0.08 0.03 0.15 0.00 0.01 0.01 17.54 0.00
Paving Roller Pavers Composite 100 1 4.00 4.00 0.35 0.06 0.57 0.00 0.04 0.04 47.11 0.01
Asphalt Paver Paving Equipment Composite
100 1 4.00 4.00 0.30 0.05 0.51 0.00 0.04 0.04 41.12 0.01
Grinder Crushing/Proc. Equipment Composite
400 1 4.00 4.00 0.85 0.26 2.55 0.00 0.08 0.08 390.90 0.02
Civil Emissions Total (lbs)Vault Delivery ‐ 2 Work Days 4 Ton Truck with Crane Cranes Composite 250 1 4.00 4.00 0.66 0.08 0.99 0.00 0.04 0.04 82.03 0.02
Vault Delivery Emissions Total (lbs)Cable Pulling ‐ 2 Work Days Rodder Truck Other Construction
Equipment Composite
175 1 8.00 8.00 0.40 0.05 0.74 0.00 0.03 0.03 84.42 0.02

Emission Calculation Assumption
Equipm
ent T
ype
CalEEM
od Category
HP
Qty
Ope
ratin
g Hrs/W
D/each
Ope
ratin
g Hou
rs per Day/ No
of Rou
nd Trip
s for On‐road
# of m
iles for Onroa
d
Material loa
ding
throup
ut
(ton
s/da
y)
CO Rate (lb
s/hr)
ROG Rate (lb
s/hr)
NOX rate (lbs/hr)
SOX rate (lbs/hr)
PM2.5 rate (lbs/hr)
PM10
rate (lbs/hr)
CO2 rate (lbs/hr)
CH4 rate (lbs/hr)
Construction On‐site Emissions (lbs/hr)
Cable Carousel Other Construction Equipment Composite
175 1 8.00 8.00 0.40 0.05 0.74 0.00 0.03 0.03 84.42 0.02
1 Ton Crew Truck 1 1.00 107.6Cable Pulling Emissions Total (lbs)Cable Splicing ‐ 8 Work Days Line Truck Other Construction
Equipment Composite
175 1 8.00 8.00 0.40 0.05 0.74 0.00 0.03 0.03 84.42 0.02
Crew Truck 1 1.00 107.6Cable Splicing Emissions Total (lbs)Distribution Getaway Construction Total Emissions (Tons per Year)

Emission Calculation Assumption
Equipm
ent T
ype
CalEEM
od Category
HP
Qty
Ope
ratin
g Hrs/W
D/each
Ope
ratin
g Hou
rs per Day/ No
of Rou
nd Trip
s for On‐road
# of m
iles for Onroa
d
Material loa
ding
throup
ut
(ton
s/da
y)
CO Rate (lb
s/hr)
ROG Rate (lb
s/hr)
NOX rate (lbs/hr)
SOX rate (lbs/hr)
PM2.5 rate (lbs/hr)
PM10
rate (lbs/hr)
CO2 rate (lbs/hr)
CH4 rate (lbs/hr)
Construction On‐site Emissions (lbs/hr)
Subtransmission ConstructionSurvey ‐ 2 Work Days 1 Ton Truck Other Construction
Equipment Composite
175 1 8.00 8.00 0.40 0.05 0.74 0.00 0.03 0.03 84.42 0.02
Survey Emissions Total (lbs)Marshalling Yard ‐ Duration of Project
1 Ton Truck Other Construction Equipment Composite
175 1 4.00 4.00 0.40 0.05 0.74 0.00 0.03 0.03 84.42 0.02
R/T Fork Lift Forklifts Composite 100 1 6.00 6.00 0.18 0.04 0.30 0.00 0.03 0.02 22.75 0.01
Boom Crane Truck Cranes Composite 250 1 2.00 2.00 0.66 0.08 0.99 0.00 0.04 0.04 82.03 0.02
Water Truck Other Construction Equipment Composite
250 1 8.00 8.00 0.40 0.05 0.74 0.00 0.03 0.03 84.42 0.02
Semi Tractor Truck Tractors/Loaders/Backhoes Composite
250 1 2.00 2.00 0.28 0.07 1.00 0.00 0.03 0.03 105.06 0.03
Marshalling Yard Emissions Total (lbs)
Right of Way Clearing ‐ 1 Work Day 1 Ton Truck Other Construction
Equipment Composite
175 1 8.00 8.00 0.40 0.05 0.74 0.00 0.03 0.03 84.42 0.02
Backhoe / Front Loader Tractors/Loaders/Backhoes Composite
250 1 6.00 6.00 100.00 0.28 0.07 1.00 0.00 0.03 0.03 105.06 0.03
Track Type Dozer Rubber Tired Dozers Composite
380 1 6.00 6.00 2.07 0.24 2.70 0.00 0.13 0.12 175.82 0.05
Motor Grader Graders Composite 400 1 6.00 6.00 0.65 0.11 1.34 0.00 0.05 0.05 187.06 0.06

Emission Calculation Assumption
Equipm
ent T
ype
CalEEM
od Category
HP
Qty
Ope
ratin
g Hrs/W
D/each
Ope
ratin
g Hou
rs per Day/ No
of Rou
nd Trip
s for On‐road
# of m
iles for Onroa
d
Material loa
ding
throup
ut
(ton
s/da
y)
CO Rate (lb
s/hr)
ROG Rate (lb
s/hr)
NOX rate (lbs/hr)
SOX rate (lbs/hr)
PM2.5 rate (lbs/hr)
PM10
rate (lbs/hr)
CO2 rate (lbs/hr)
CH4 rate (lbs/hr)
Construction On‐site Emissions (lbs/hr)
Water Truck Other Construction Equipment Composite
250 1 8.00 8.00 0.40 0.05 0.74 0.00 0.03 0.03 84.42 0.02
Lowboy Truck / Trailer Other Construction Equipment Composite
175 1 4.00 4.00 0.40 0.05 0.74 0.00 0.03 0.03 84.42 0.02
Right of Way Clearing Emissions Total (lbs)Roads & Landing Work ‐ 1 Work Day
1 Ton Truck Other Construction Equipment Composite
175 1 8.00 8.00 0.40 0.05 0.74 0.00 0.03 0.03 84.42 0.02
Backhoe/Front Loader Tractors/Loaders/Backhoes Composite
250 1 4.00 4.00 100.00 0.28 0.07 1.00 0.00 0.03 0.03 105.06 0.03
Track Type Dozer Rubber Tired Dozers Composite
380 1 4.00 4.00 2.07 0.24 2.70 0.00 0.13 0.12 175.82 0.05
Motor Grader Graders Composite 400 1 6.00 6.00 0.65 0.11 1.34 0.00 0.05 0.05 187.06 0.06
Water Truck Other Construction Equipment Composite
250 1 8.00 8.00 0.40 0.05 0.74 0.00 0.03 0.03 84.42 0.02
Drum Type Compactor Plate Compactors Composite
15 1 6.00 6.00 0.05 0.01 0.06 0.00 0.00 0.00 8.08 0.00
Excavator Excavators Composite
350 1 4.00 4.00 0.40 0.07 1.04 0.00 0.03 0.03 150.11 0.04
Lowboy Truck / Trailer Other Construction Equipment Composite
175 1 4.00 4.00 0.40 0.05 0.74 0.00 0.03 0.03 84.42 0.02
Roads & Landing Work Emissions Total (lbs)Removal of Existing Conductor ‐ 1 Work Day

Emission Calculation Assumption
Equipm
ent T
ype
CalEEM
od Category
HP
Qty
Ope
ratin
g Hrs/W
D/each
Ope
ratin
g Hou
rs per Day/ No
of Rou
nd Trip
s for On‐road
# of m
iles for Onroa
d
Material loa
ding
throup
ut
(ton
s/da
y)
CO Rate (lb
s/hr)
ROG Rate (lb
s/hr)
NOX rate (lbs/hr)
SOX rate (lbs/hr)
PM2.5 rate (lbs/hr)
PM10
rate (lbs/hr)
CO2 rate (lbs/hr)
CH4 rate (lbs/hr)
Construction On‐site Emissions (lbs/hr)
1 Ton Truck Other Construction Equipment Composite
175 2 4.00 8.00 0.40 0.05 0.74 0.00 0.03 0.03 84.42 0.02
Manlift / Bucket Truck Aerial Lifts Composite
120 2 8.00 16.00 0.26 0.02 0.28 0.00 0.01 0.01 42.13 0.01
Boom Crane Truck Cranes Composite 250 2 8.00 16.00 0.66 0.08 0.99 0.00 0.04 0.04 82.03 0.02
Bull Wheel Puller Other Construction Equipment Composite
175 1 6.00 6.00 0.40 0.05 0.74 0.00 0.03 0.03 84.42 0.02
Sock Line Puller Other Construction Equipment Composite
175 1 6.00 6.00 0.40 0.05 0.74 0.00 0.03 0.03 84.42 0.02
Static Truck / Tensioner Other Construction Equipment Composite
175 1 6.00 6.00 0.40 0.05 0.74 0.00 0.03 0.03 84.42 0.02
Lowboy Truck / Trailer Other Construction Equipment Composite
175 2 4.00 8.00 0.40 0.05 0.74 0.00 0.03 0.03 84.42 0.02
Removal of Existing Conductor Emissions Total (lbs)Wood Pole Removal ‐ 1 Work Day 1 Ton Truck Other Construction
Equipment Composite
175 2 8.00 16.00 0.40 0.05 0.74 0.00 0.03 0.03 84.42 0.02
Compressor Trailer Air Compressors Composite
400 1 4.00 4.00 0.51 0.15 1.46 0.00 0.05 0.05 240.55 0.01
Manlift / Bucket Truck Aerial Lifts Composite
120 1 6.00 6.00 0.26 0.02 0.28 0.00 0.01 0.01 42.13 0.01
Boom Crane Truck Cranes Composite 250 1 6.00 6.00 0.66 0.08 0.99 0.00 0.04 0.04 82.03 0.02

Emission Calculation Assumption
Equipm
ent T
ype
CalEEM
od Category
HP
Qty
Ope
ratin
g Hrs/W
D/each
Ope
ratin
g Hou
rs per Day/ No
of Rou
nd Trip
s for On‐road
# of m
iles for Onroa
d
Material loa
ding
throup
ut
(ton
s/da
y)
CO Rate (lb
s/hr)
ROG Rate (lb
s/hr)
NOX rate (lbs/hr)
SOX rate (lbs/hr)
PM2.5 rate (lbs/hr)
PM10
rate (lbs/hr)
CO2 rate (lbs/hr)
CH4 rate (lbs/hr)
Construction On‐site Emissions (lbs/hr)
Flat Bed Pole Truck Other Construction Equipment Composite
175 1 8.00 8.00 0.40 0.05 0.74 0.00 0.03 0.03 84.42 0.02
Wood Pole Removal Emissions Total (lbs)

Emission Calculation Assumption
Equipm
ent T
ype
CalEEM
od Category
HP
Qty
Ope
ratin
g Hrs/W
D/each
Ope
ratin
g Hou
rs per Day/ No
of Rou
nd Trip
s for On‐road
# of m
iles for Onroa
d
Material loa
ding
throup
ut
(ton
s/da
y)
CO Rate (lb
s/hr)
ROG Rate (lb
s/hr)
NOX rate (lbs/hr)
SOX rate (lbs/hr)
PM2.5 rate (lbs/hr)
PM10
rate (lbs/hr)
CO2 rate (lbs/hr)
CH4 rate (lbs/hr)
Construction On‐site Emissions (lbs/hr)
Install TSP Foundations ‐ 16 Work Days
3/4 Ton Truck Other Construction Equipment Composite
175 1 4.00 4.00 0.40 0.05 0.74 0.00 0.03 0.03 84.42 0.02
Boom Crane Truck Cranes Composite 250 1 4.00 4.00 100.00 0.66 0.08 0.99 0.00 0.04 0.04 82.03 0.02
Backhoe / Front Loader Tractors/Loaders/Backhoes Composite
250 1 6.00 6.00 0.28 0.07 1.00 0.00 0.03 0.03 105.06 0.03
Auger Truck Bore/Drill Rigs Composite
175 1 6.00 6.00 0.59 0.06 0.78 0.00 0.04 0.03 101.09 0.03
Water Truck Other Construction Equipment Composite
250 1 8.00 8.00 0.40 0.05 0.74 0.00 0.03 0.03 84.42 0.02
Dump Truck 1 1.00 26.6 Concrete Mixer Truck Cement and
Mortar Mixers Composite
25 3 4.00 12.00 0.08 0.03 0.15 0.00 0.01 0.01 17.54 0.00
Install TSP Foundations Emissions Total (lbs)TSP Haul ‐ 8 Work Days 3/4 Ton Truck Other Construction
Equipment Composite
175 1 8.00 8.00 0.40 0.05 0.74 0.00 0.03 0.03 84.42 0.02
Boom Crane Truck Cranes Composite 250 1 6.00 6.00 0.66 0.08 0.99 0.00 0.04 0.04 82.03 0.02
Flat Bed Pole Truck Other Construction Equipment Composite
175 1 8.00 8.00 0.40 0.05 0.74 0.00 0.03 0.03 84.42 0.02
TSP Haul Emissions Total (lbs)TSP Assembly ‐ 8 Work Days 3/4 Ton Truck Other Construction
Equipment Composite
175 2 4.00 8.00 0.40 0.05 0.74 0.00 0.03 0.03 84.42 0.02

Emission Calculation Assumption
Equipm
ent T
ype
CalEEM
od Category
HP
Qty
Ope
ratin
g Hrs/W
D/each
Ope
ratin
g Hou
rs per Day/ No
of Rou
nd Trip
s for On‐road
# of m
iles for Onroa
d
Material loa
ding
throup
ut
(ton
s/da
y)
CO Rate (lb
s/hr)
ROG Rate (lb
s/hr)
NOX rate (lbs/hr)
SOX rate (lbs/hr)
PM2.5 rate (lbs/hr)
PM10
rate (lbs/hr)
CO2 rate (lbs/hr)
CH4 rate (lbs/hr)
Construction On‐site Emissions (lbs/hr)
1 Ton Truck Other Construction Equipment Composite
175 2 4.00 8.00 0.40 0.05 0.74 0.00 0.03 0.03 84.42 0.02
Compressor Trailer Air Compressors Composite
400 1 6.00 6.00 0.51 0.15 1.46 0.00 0.05 0.05 240.55 0.01
Boom Crane Truck Cranes Composite 250 1 8.00 8.00 0.66 0.08 0.99 0.00 0.04 0.04 82.03 0.02
TSP Assembly Emissions Total (lbs)TSP Erection ‐ 8 Work Days 3/4 Ton Truck Other Construction
Equipment Composite
175 2 4.00 8.00 0.40 0.05 0.74 0.00 0.03 0.03 84.42 0.02
1 Ton Truck Other Construction Equipment Composite
175 2 4.00 8.00 0.40 0.05 0.74 0.00 0.03 0.03 84.42 0.02
Compressor Trailer Air Compressors Composite
400 1 4.00 4.00 0.51 0.15 1.46 0.00 0.05 0.05 240.55 0.01
Boom Crane Truck Cranes Composite 250 1 8.00 8.00 0.66 0.08 0.99 0.00 0.04 0.04 82.03 0.02
TSK Erection Emissions Total (lbs)Wood / LWS Haul ‐ 2 Work Day 3/4 Ton Truck Other Construction
Equipment Composite
175 1 8.00 8.00 0.40 0.05 0.74 0.00 0.03 0.03 84.42 0.02
Boom Crane Truck Cranes Composite 250 1 6.00 6.00 0.66 0.08 0.99 0.00 0.04 0.04 82.03 0.02
Flat Bed Pole Truck Other Construction Equipment Composite
175 1 8.00 8.00 0.40 0.05 0.74 0.00 0.03 0.03 84.42 0.02
Wood / LSW Pole Assembly Emissions Total (lbs)Wood / LSW Pole Assembly‐ 3 Work Day
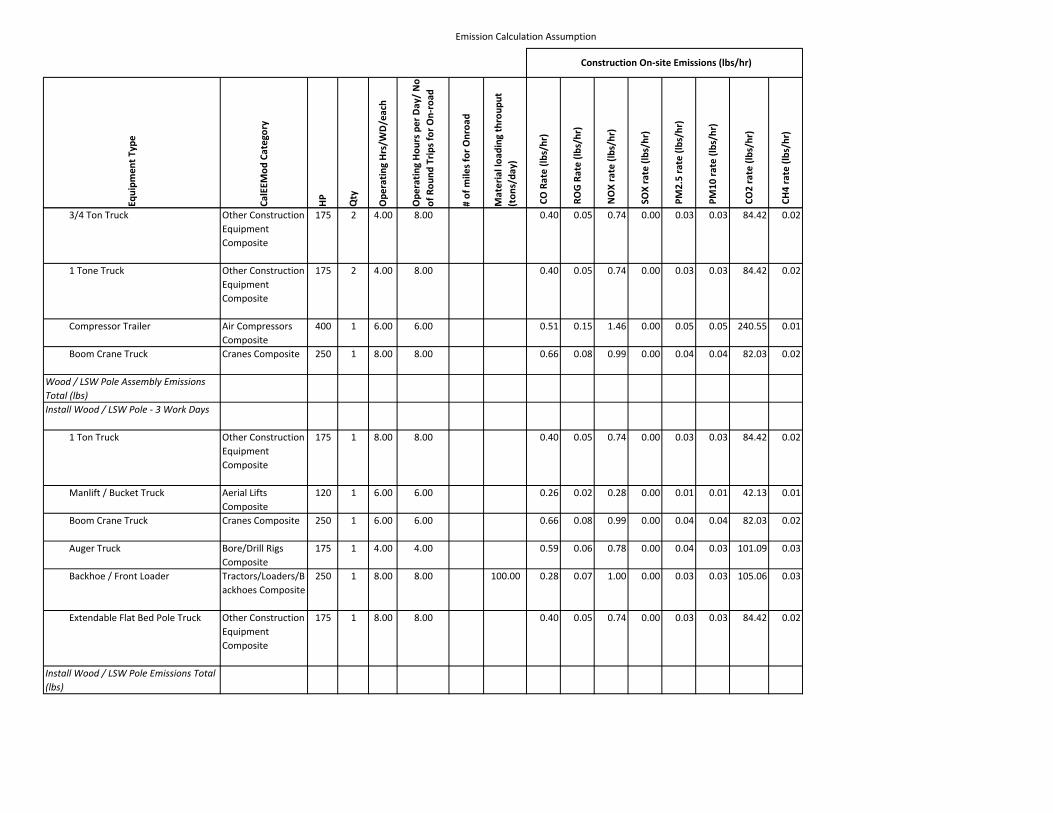
Emission Calculation Assumption
Equipm
ent T
ype
CalEEM
od Category
HP
Qty
Ope
ratin
g Hrs/W
D/each
Ope
ratin
g Hou
rs per Day/ No
of Rou
nd Trip
s for On‐road
# of m
iles for Onroa
d
Material loa
ding
throup
ut
(ton
s/da
y)
CO Rate (lb
s/hr)
ROG Rate (lb
s/hr)
NOX rate (lbs/hr)
SOX rate (lbs/hr)
PM2.5 rate (lbs/hr)
PM10
rate (lbs/hr)
CO2 rate (lbs/hr)
CH4 rate (lbs/hr)
Construction On‐site Emissions (lbs/hr)
3/4 Ton Truck Other Construction Equipment Composite
175 2 4.00 8.00 0.40 0.05 0.74 0.00 0.03 0.03 84.42 0.02
1 Tone Truck Other Construction Equipment Composite
175 2 4.00 8.00 0.40 0.05 0.74 0.00 0.03 0.03 84.42 0.02
Compressor Trailer Air Compressors Composite
400 1 6.00 6.00 0.51 0.15 1.46 0.00 0.05 0.05 240.55 0.01
Boom Crane Truck Cranes Composite 250 1 8.00 8.00 0.66 0.08 0.99 0.00 0.04 0.04 82.03 0.02
Wood / LSW Pole Assembly Emissions Total (lbs)Install Wood / LSW Pole ‐ 3 Work Days
1 Ton Truck Other Construction Equipment Composite
175 1 8.00 8.00 0.40 0.05 0.74 0.00 0.03 0.03 84.42 0.02
Manlift / Bucket Truck Aerial Lifts Composite
120 1 6.00 6.00 0.26 0.02 0.28 0.00 0.01 0.01 42.13 0.01
Boom Crane Truck Cranes Composite 250 1 6.00 6.00 0.66 0.08 0.99 0.00 0.04 0.04 82.03 0.02
Auger Truck Bore/Drill Rigs Composite
175 1 4.00 4.00 0.59 0.06 0.78 0.00 0.04 0.03 101.09 0.03
Backhoe / Front Loader Tractors/Loaders/Backhoes Composite
250 1 8.00 8.00 100.00 0.28 0.07 1.00 0.00 0.03 0.03 105.06 0.03
Extendable Flat Bed Pole Truck Other Construction Equipment Composite
175 1 8.00 8.00 0.40 0.05 0.74 0.00 0.03 0.03 84.42 0.02
Install Wood / LSW Pole Emissions Total (lbs)

Emission Calculation Assumption
Equipm
ent T
ype
CalEEM
od Category
HP
Qty
Ope
ratin
g Hrs/W
D/each
Ope
ratin
g Hou
rs per Day/ No
of Rou
nd Trip
s for On‐road
# of m
iles for Onroa
d
Material loa
ding
throup
ut
(ton
s/da
y)
CO Rate (lb
s/hr)
ROG Rate (lb
s/hr)
NOX rate (lbs/hr)
SOX rate (lbs/hr)
PM2.5 rate (lbs/hr)
PM10
rate (lbs/hr)
CO2 rate (lbs/hr)
CH4 rate (lbs/hr)
Construction On‐site Emissions (lbs/hr)
Install / Transfer Conductor ‐ 4 Work Days 1 Ton Truck Other Construction
Equipment Composite
175 3 4.00 12.00 0.40 0.05 0.74 0.00 0.03 0.03 84.42 0.02
Manlift / Bucket Truck Aerial Lifts Composite
120 4 8.00 32.00 0.26 0.02 0.28 0.00 0.01 0.01 42.13 0.01
Boom Crane Truck Cranes Composite 250 1 8.00 8.00 0.66 0.08 0.99 0.00 0.04 0.04 82.03 0.02
Dump Truck 1 1.00 26.6 Wire Truck / Trailer Other Construction
Equipment Composite
175 1 6.00 6.00 0.40 0.05 0.74 0.00 0.03 0.03 84.42 0.02
Sock Line Puller Other Construction Equipment Composite
175 1 6.00 6.00 0.40 0.05 0.74 0.00 0.03 0.03 84.42 0.02
Bull Wheel Puller Other Construction Equipment Composite
175 1 6.00 6.00 0.40 0.05 0.74 0.00 0.03 0.03 84.42 0.02
Static Truck / Tensioner Other Construction Equipment Composite
175 1 6.00 6.00 0.40 0.05 0.74 0.00 0.03 0.03 84.42 0.02
Backhoe / Front Loader Tractors/Loaders/Backhoes Composite
250 1 2.00 2.00 100.00 0.28 0.07 1.00 0.00 0.03 0.03 105.06 0.03
Lowboy Truck / Trailer Other Construction Equipment Composite
175 2 4.00 8.00 0.40 0.05 0.74 0.00 0.03 0.03 84.42 0.02
Install / Transfer Conductor Emissions Total (lbs)Restoration ‐ 1 Work Day

Emission Calculation Assumption
Equipm
ent T
ype
CalEEM
od Category
HP
Qty
Ope
ratin
g Hrs/W
D/each
Ope
ratin
g Hou
rs per Day/ No
of Rou
nd Trip
s for On‐road
# of m
iles for Onroa
d
Material loa
ding
throup
ut
(ton
s/da
y)
CO Rate (lb
s/hr)
ROG Rate (lb
s/hr)
NOX rate (lbs/hr)
SOX rate (lbs/hr)
PM2.5 rate (lbs/hr)
PM10
rate (lbs/hr)
CO2 rate (lbs/hr)
CH4 rate (lbs/hr)
Construction On‐site Emissions (lbs/hr)
1 Ton Truck Other Construction Equipment Composite
175 2 4.00 8.00 0.40 0.05 0.74 0.00 0.03 0.03 84.42 0.02
Backhoe / Front Loader Tractors/Loaders/Backhoes Composite
250 1 4.00 4.00 100.00 0.28 0.07 1.00 0.00 0.03 0.03 105.06 0.03
Motor Grader Graders Composite 400 1 6.00 6.00 0.65 0.11 1.34 0.00 0.05 0.05 187.06 0.06
Water Truck Other Construction Equipment Composite
250 1 8.00 8.00 0.40 0.05 0.74 0.00 0.03 0.03 84.42 0.02
Drum Type Compactor Plate Compactors Composite
15 1 8.00 8.00 0.05 0.01 0.06 0.00 0.00 0.00 8.08 0.00
Lowboy Truck / Trailer Other Construction Equipment Composite
175 1 4.00 4.00 0.40 0.05 0.74 0.00 0.03 0.03 84.42 0.02
Restoration Emissions Total (lbs)Subtransmission Construction Total Emissions (Tons per Year)Telecommunications Construction 1 4.00 4.00Telecom Construction Inside MEER ‐ 30 Work Days Pick‐up Truck 3 3.00 107Telecom Construction Inside MEER Emissions Total (lbs)Substructure Installation ‐ 34 Work Days Backhoe Tractors/Loaders/B
ackhoes Composite250 1 8.00 8.00 0.28 0.07 1.00 0.00 0.03 0.03 105.06 0.03
Dump Truck 175 1 1.00 26.6 Cement Truck Cement and
Mortar Mixers Composite
175 1 8.00 8.00 0.08 0.03 0.15 0.00 0.01 0.01 17.54 0.00
Substructure Installation Emissions Total (lbs)

Emission Calculation Assumption
Equipm
ent T
ype
CalEEM
od Category
HP
Qty
Ope
ratin
g Hrs/W
D/each
Ope
ratin
g Hou
rs per Day/ No
of Rou
nd Trip
s for On‐road
# of m
iles for Onroa
d
Material loa
ding
throup
ut
(ton
s/da
y)
CO Rate (lb
s/hr)
ROG Rate (lb
s/hr)
NOX rate (lbs/hr)
SOX rate (lbs/hr)
PM2.5 rate (lbs/hr)
PM10
rate (lbs/hr)
CO2 rate (lbs/hr)
CH4 rate (lbs/hr)
Construction On‐site Emissions (lbs/hr)
Wood Pole Replacement and Transfer Facilities ‐ 40 Work Days 1 Ton Truck Other Construction
Equipment Composite
175 2 2.00 4.00 0.40 0.05 0.74 0.00 0.03 0.03 84.42 0.02
Double Bucket Truck Other Construction Equipment Composite
175 1 8.00 8.00 0.40 0.05 0.74 0.00 0.03 0.03 84.42 0.02
Auger Truck Bore/Drill Rigs Composite
175 1 4.00 4.00 0.59 0.06 0.78 0.00 0.04 0.03 101.09 0.03
Boom Truck Other Construction Equipment Composite
175 1 8.00 8.00 0.40 0.05 0.74 0.00 0.03 0.03 84.42 0.02
Wood Pole Replacement and Transfer Facilities Emissions Total (lbs)
Fiber Optic Cable Installation ‐ 62 Work Days Pick‐up Truck 2 2.00 107 Manlift / Bucket Truck Aerial Lifts
Composite120 1 8.00 8.00 0.26 0.02 0.28 0.00 0.01 0.01 42.13 0.01
Fiber Optic Cable Installation Emissions Total (lbs)Telecommunications Construction Total Emissions (Tons per Year)Proposed Project Construction Emissions (Tons per Year)

Construction Emissions (On‐Site Emissions lb/day)
Equipm
ent T
ype
CalEEM
od Category
HP
Qty
Ope
ratin
g Hrs/W
D/each
Ope
ratin
g Hou
rs per Day/
No of Rou
nd Trip
s for On‐
road
# of m
iles for O
nroa
d
Material loa
ding
throup
ut
(ton
s/da
y)
ROG (lbs/day)
NOX (lb
s/da
y)
SOX (lb
s/da
y)
PM10
(lbs/day) T
OTA
L
PM10
(lbs/day) E
xhau
st
PM10
(lbs/day) Fugitive
Dust
PM2.5 (lb
s/da
y) TOTA
L
PM2.5 (lb
s/da
y) Exhau
st
PM2.5 (lb
s/da
y) Fugitive
CO2 (lb
s/da
y)
CH4 (lb
s/da
y)
Banducci Substation ConstructionSurvey ‐ 5 Work Days Survey Trucks 2 2 107.6Survey Emissions Total (lbs) 0Grading ‐ 30 Work Days Dozer Rubber Tired
Dozers Composite380 1 8 8 1.90 21.60 0.01 2.49 1.01 1.48 2.97 0.93 2.05 1407 0.42
Loader Rubber Tired Loaders Composite
380 2 8 16 100 2.03 25.07 0.02 3.67 0.94 2.73 1.28 0.87 0.41 2473 0.73
Scraper Scrapers Composite 400 1 8 8 1.62 21.11 0.02 35.02 0.85 34.17 4.47 0.78 3.69 1752 0.52
Grader Graders Composite 400 1 8 8 0.91 10.74 0.01 34.58 0.41 34.17 4.07 0.38 3.69 1496 0.44
Water Truck Other Construction Equipment Composite
250 1 4 4 0.21 2.96 0.00 0.11 0.11 0.10 0.10 338 0.10
4 X 4 Tamper Other Construction Equipment Composite
175 1 4 4 0.21 2.96 0.00 0.11 0.11 0.10 0.10 338 0.10
Tool Truck Other Construction Equipment Composite
175 1 4 4 0.21 2.96 0.00 0.11 0.11 0.10 0.10 338 0.10
Pick‐up Truck 4 4 107.6Grading Emissions Total (lbs) 212.96 2621.55 2.30 2282.86 106.27 2176.60 392.95 97.78 295.16 244233 72.18Fencing (Chain Link) ‐ 10 Work Days Bobcat Tractors/Loaders/B
ackhoes Composite250 1 8 8 0.53 8.03 0.01 0.26 0.26 0.24 0.24 840 0.25
Flatbed Truck Other Construction Equipment Composite
175 1 4 4 0.21 2.96 0.00 0.11 0.11 0.10 0.10 338 0.10
Crew Cab Truck 1 1 107.6Fencing Emissions Total (lbs) 7.47 109.86 0.11 3.68 3.68 3.38 3.38 11781 3.48Civil ‐ 76 Work Days
Construction Onsite Emission (lbs/day)
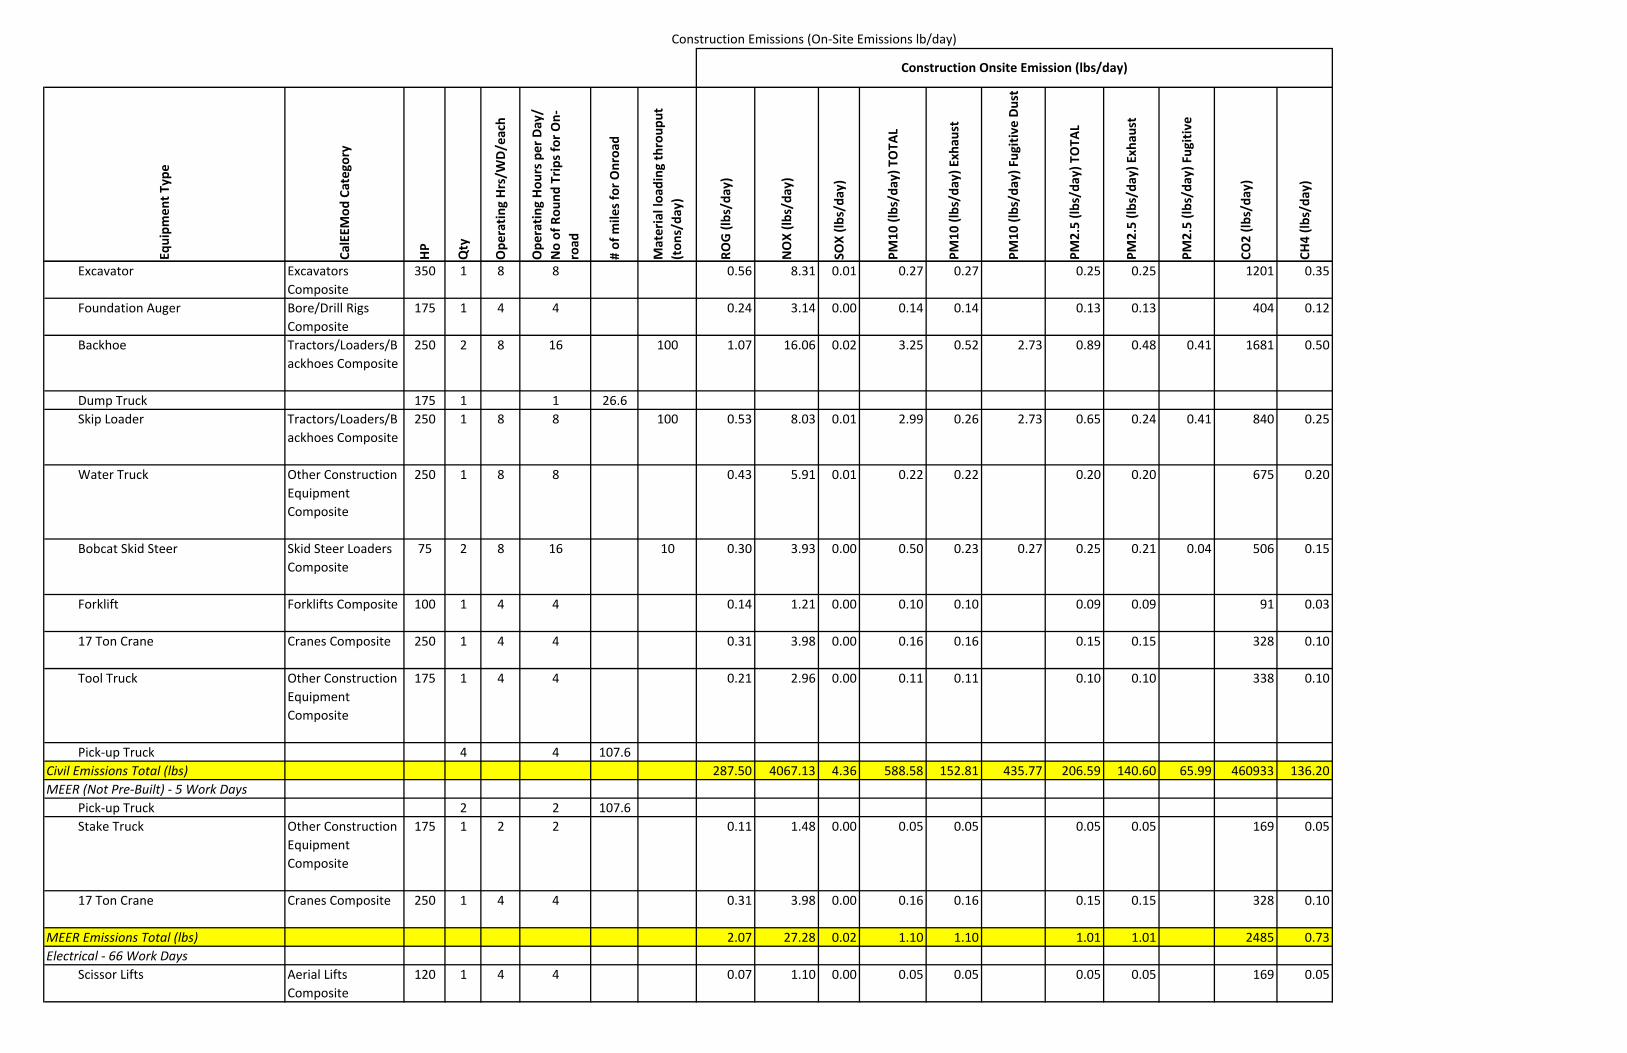
Construction Emissions (On‐Site Emissions lb/day)
Equipm
ent T
ype
CalEEM
od Category
HP
Qty
Ope
ratin
g Hrs/W
D/each
Ope
ratin
g Hou
rs per Day/
No of Rou
nd Trip
s for On‐
road
# of m
iles for O
nroa
d
Material loa
ding
throup
ut
(ton
s/da
y)
ROG (lbs/day)
NOX (lb
s/da
y)
SOX (lb
s/da
y)
PM10
(lbs/day) T
OTA
L
PM10
(lbs/day) E
xhau
st
PM10
(lbs/day) Fugitive
Dust
PM2.5 (lb
s/da
y) TOTA
L
PM2.5 (lb
s/da
y) Exhau
st
PM2.5 (lb
s/da
y) Fugitive
CO2 (lb
s/da
y)
CH4 (lb
s/da
y)
Construction Onsite Emission (lbs/day)
Excavator Excavators Composite
350 1 8 8 0.56 8.31 0.01 0.27 0.27 0.25 0.25 1201 0.35
Foundation Auger Bore/Drill Rigs Composite
175 1 4 4 0.24 3.14 0.00 0.14 0.14 0.13 0.13 404 0.12
Backhoe Tractors/Loaders/Backhoes Composite
250 2 8 16 100 1.07 16.06 0.02 3.25 0.52 2.73 0.89 0.48 0.41 1681 0.50
Dump Truck 175 1 1 26.6 Skip Loader Tractors/Loaders/B
ackhoes Composite250 1 8 8 100 0.53 8.03 0.01 2.99 0.26 2.73 0.65 0.24 0.41 840 0.25
Water Truck Other Construction Equipment Composite
250 1 8 8 0.43 5.91 0.01 0.22 0.22 0.20 0.20 675 0.20
Bobcat Skid Steer Skid Steer Loaders Composite
75 2 8 16 10 0.30 3.93 0.00 0.50 0.23 0.27 0.25 0.21 0.04 506 0.15
Forklift Forklifts Composite 100 1 4 4 0.14 1.21 0.00 0.10 0.10 0.09 0.09 91 0.03
17 Ton Crane Cranes Composite 250 1 4 4 0.31 3.98 0.00 0.16 0.16 0.15 0.15 328 0.10
Tool Truck Other Construction Equipment Composite
175 1 4 4 0.21 2.96 0.00 0.11 0.11 0.10 0.10 338 0.10
Pick‐up Truck 4 4 107.6Civil Emissions Total (lbs) 287.50 4067.13 4.36 588.58 152.81 435.77 206.59 140.60 65.99 460933 136.20MEER (Not Pre‐Built) ‐ 5 Work Days Pick‐up Truck 2 2 107.6 Stake Truck Other Construction
Equipment Composite
175 1 2 2 0.11 1.48 0.00 0.05 0.05 0.05 0.05 169 0.05
17 Ton Crane Cranes Composite 250 1 4 4 0.31 3.98 0.00 0.16 0.16 0.15 0.15 328 0.10
MEER Emissions Total (lbs) 2.07 27.28 0.02 1.10 1.10 1.01 1.01 2485 0.73Electrical ‐ 66 Work Days Scissor Lifts Aerial Lifts
Composite120 1 4 4 0.07 1.10 0.00 0.05 0.05 0.05 0.05 169 0.05

Construction Emissions (On‐Site Emissions lb/day)
Equipm
ent T
ype
CalEEM
od Category
HP
Qty
Ope
ratin
g Hrs/W
D/each
Ope
ratin
g Hou
rs per Day/
No of Rou
nd Trip
s for On‐
road
# of m
iles for O
nroa
d
Material loa
ding
throup
ut
(ton
s/da
y)
ROG (lbs/day)
NOX (lb
s/da
y)
SOX (lb
s/da
y)
PM10
(lbs/day) T
OTA
L
PM10
(lbs/day) E
xhau
st
PM10
(lbs/day) Fugitive
Dust
PM2.5 (lb
s/da
y) TOTA
L
PM2.5 (lb
s/da
y) Exhau
st
PM2.5 (lb
s/da
y) Fugitive
CO2 (lb
s/da
y)
CH4 (lb
s/da
y)
Construction Onsite Emission (lbs/day)
Manlift Aerial Lifts Composite
120 2 4 8 0.13 2.20 0.00 0.10 0.10 0.10 0.10 337 0.10
Reach Forklift Forklifts Composite 100 1 2 2 0.07 0.60 0.00 0.05 0.05 0.05 0.05 46 0.01
15 Ton Crane (Line Truck) Cranes Composite 250 1 4 4 0.31 3.98 0.00 0.16 0.16 0.15 0.15 328 0.10
Tool Trailer Other Construction Equipment Composite
175 1 8 8 0.43 5.91 0.01 0.22 0.22 0.20 0.20 675 0.20
Crew Truck Other Construction Equipment Composite
175 2 2 107.6
70 Ton Crane Cranes Composite 250 1 4 4 0.31 3.98 0.00 0.16 0.16 0.15 0.15 328 0.10
Electrical Emissions Total (lbs) 86.37 1173.06 1.17 49.86 49.86 45.87 45.87 124253 36.72Wiring ‐ 44 Work Days Manlift Aerial Lifts
Composite120 1 2 2 0.03 0.55 0.00 0.03 0.03 0.02 0.02 84 0.02
Tool Trailer Other Construction Equipment Composite
175 1 8 8 0.43 5.91 0.01 0.22 0.22 0.20 0.20 675 0.20
Wiring Emissions Total (lbs) 20.25 284.34 0.31 10.74 10.74 9.88 9.88 33422 9.87

Construction Emissions (On‐Site Emissions lb/day)
Equipm
ent T
ype
CalEEM
od Category
HP
Qty
Ope
ratin
g Hrs/W
D/each
Ope
ratin
g Hou
rs per Day/
No of Rou
nd Trip
s for On‐
road
# of m
iles for O
nroa
d
Material loa
ding
throup
ut
(ton
s/da
y)
ROG (lbs/day)
NOX (lb
s/da
y)
SOX (lb
s/da
y)
PM10
(lbs/day) T
OTA
L
PM10
(lbs/day) E
xhau
st
PM10
(lbs/day) Fugitive
Dust
PM2.5 (lb
s/da
y) TOTA
L
PM2.5 (lb
s/da
y) Exhau
st
PM2.5 (lb
s/da
y) Fugitive
CO2 (lb
s/da
y)
CH4 (lb
s/da
y)
Construction Onsite Emission (lbs/day)
Transformers ‐ 5 Work Days Crew Truck 2 2 107.6 Low Bed Truck Other Construction
Equipment Composite
175 1 2 2 0.11 1.48 0.00 0.05 0.05 0.05 0.05 169 0.05
Transformers Emissions Total (lbs) 0.53 7.39 0.01 0.27 0.27 0.25 0.25 844 0.25Maintenance Crew Equipment Check ‐ 22 Work Days Maintenance Truck Other Construction
Equipment Composite
175 2 2 4 0.21 2.96 0.00 0.11 0.11 0.10 0.10 338 0.10
Maintenance Crew Equipment Check Emissions Total (lbs)
4.70 65.03 0.07 2.40 2.40 2.20 2.20 7429 2.19
Testing ‐ 88 Work Days Crew Truck/Van 1 1 107.6Testing Emissions Total (lbs)Asphalting ‐ 10 Work Days Paving Roller Pavers Composite 100 1 4 4 0.25 2.27 0.00 0.18 0.18 0.16 0.16 188 0.06
Asphalt Paver Paving Equipment Composite
100 1 4 4 0.21 2.02 0.00 0.15 0.15 0.14 0.14 164 0.05
Stake Truck Other Construction Equipment Composite
175 1 2 2 0.11 1.48 0.00 0.05 0.05 0.05 0.05 169 0.05
Tractor Tractors/Loaders/Backhoes Composite
250 1 8 8 0.53 8.03 0.01 0.26 0.26 0.24 0.24 840 0.25
Dump Truck 1 1 26.6 Crew Trucks Other Construction
Equipment Composite
175 2 2 4 0.21 2.96 0.00 0.11 0.11 0.10 0.10 338 0.10
Asphalt Curb Machine Paving Equipment Composite
100 1 2 2 0.11 1.01 0.00 0.08 0.08 0.07 0.07 82 0.02
Asphalting Emissions Total (lbs) 14.26 177.68 0.17 8.30 8.30 7.64 7.64 17821 5.27

Construction Emissions (On‐Site Emissions lb/day)
Equipm
ent T
ype
CalEEM
od Category
HP
Qty
Ope
ratin
g Hrs/W
D/each
Ope
ratin
g Hou
rs per Day/
No of Rou
nd Trip
s for On‐
road
# of m
iles for O
nroa
d
Material loa
ding
throup
ut
(ton
s/da
y)
ROG (lbs/day)
NOX (lb
s/da
y)
SOX (lb
s/da
y)
PM10
(lbs/day) T
OTA
L
PM10
(lbs/day) E
xhau
st
PM10
(lbs/day) Fugitive
Dust
PM2.5 (lb
s/da
y) TOTA
L
PM2.5 (lb
s/da
y) Exhau
st
PM2.5 (lb
s/da
y) Fugitive
CO2 (lb
s/da
y)
CH4 (lb
s/da
y)
Construction Onsite Emission (lbs/day)
Landscaping ‐ 5 Work Days Tractor Tractors/Loaders/B
ackhoes Composite250 1 8 8 0.53 8.03 0.01 0.26 0.26 0.24 0.24 840 0.25
Dump Truck 1 1 26.6 Pick‐up TruckLandscaping Emissions Total (lbs) 2.67 40.15 0.04 1.29 1.29 1.19 1.19 4202 1.24Banducci Substation Construction Total Emissions (Tons per Year)
0.32 4.29 0.00 8.09 0.17 7.92 1.33 0.15 1.17 411.59 0.12
Distribution Getaway ConstructionCivil ‐ 8 Work Days Backhoe / Front Loader Tractors/Loaders/B
ackhoes Composite250 1 8 8 100 0.53 8.03 0.01 2.99 0.26 2.73 0.65 0.24 0.41 840 0.25
Dump Truck Dumpers/Tenders 175 1 1 26.6
1 Ton Crew Truck Other Construction Equipment Composite
175 1 2 2 0.11 1.48 0.00 0.05 0.05 0.05 0.05 169 0.05
Cement Truck Cement and Mortar Mixers Composite
25 1 4 4 0.10 0.59 0.00 0.03 0.03 0.03 0.03 70 0.01
Paving Roller Pavers Composite 100 1 4 4 0.25 2.27 0.00 0.18 0.18 0.16 0.16 188 0.06
Asphalt Paver Paving Equipment Composite
100 1 4 4 0.21 2.02 0.00 0.15 0.15 0.14 0.14 164 0.05
Grinder Crushing/Proc. Equipment Composite
400 1 4 4 1.04 10.19 0.01 0.33 0.33 0.33 0.33 1564 0.09
Civil Emissions Total (lbs) 17.97 196.62 0.22 29.91 8.07 21.84 10.96 7.66 3.31 23968 4.04Vault Delivery ‐ 2 Work Days 4 Ton Truck with Crane Cranes Composite 250 1 4 4 0.31 3.98 0.00 0.16 0.16 0.15 0.15 328 0.10
Vault Delivery Emissions Total (lbs) 0.61 7.96 0.01 0.33 0.33 27.06 0.30 26.76 656 0.19Cable Pulling ‐ 2 Work Days
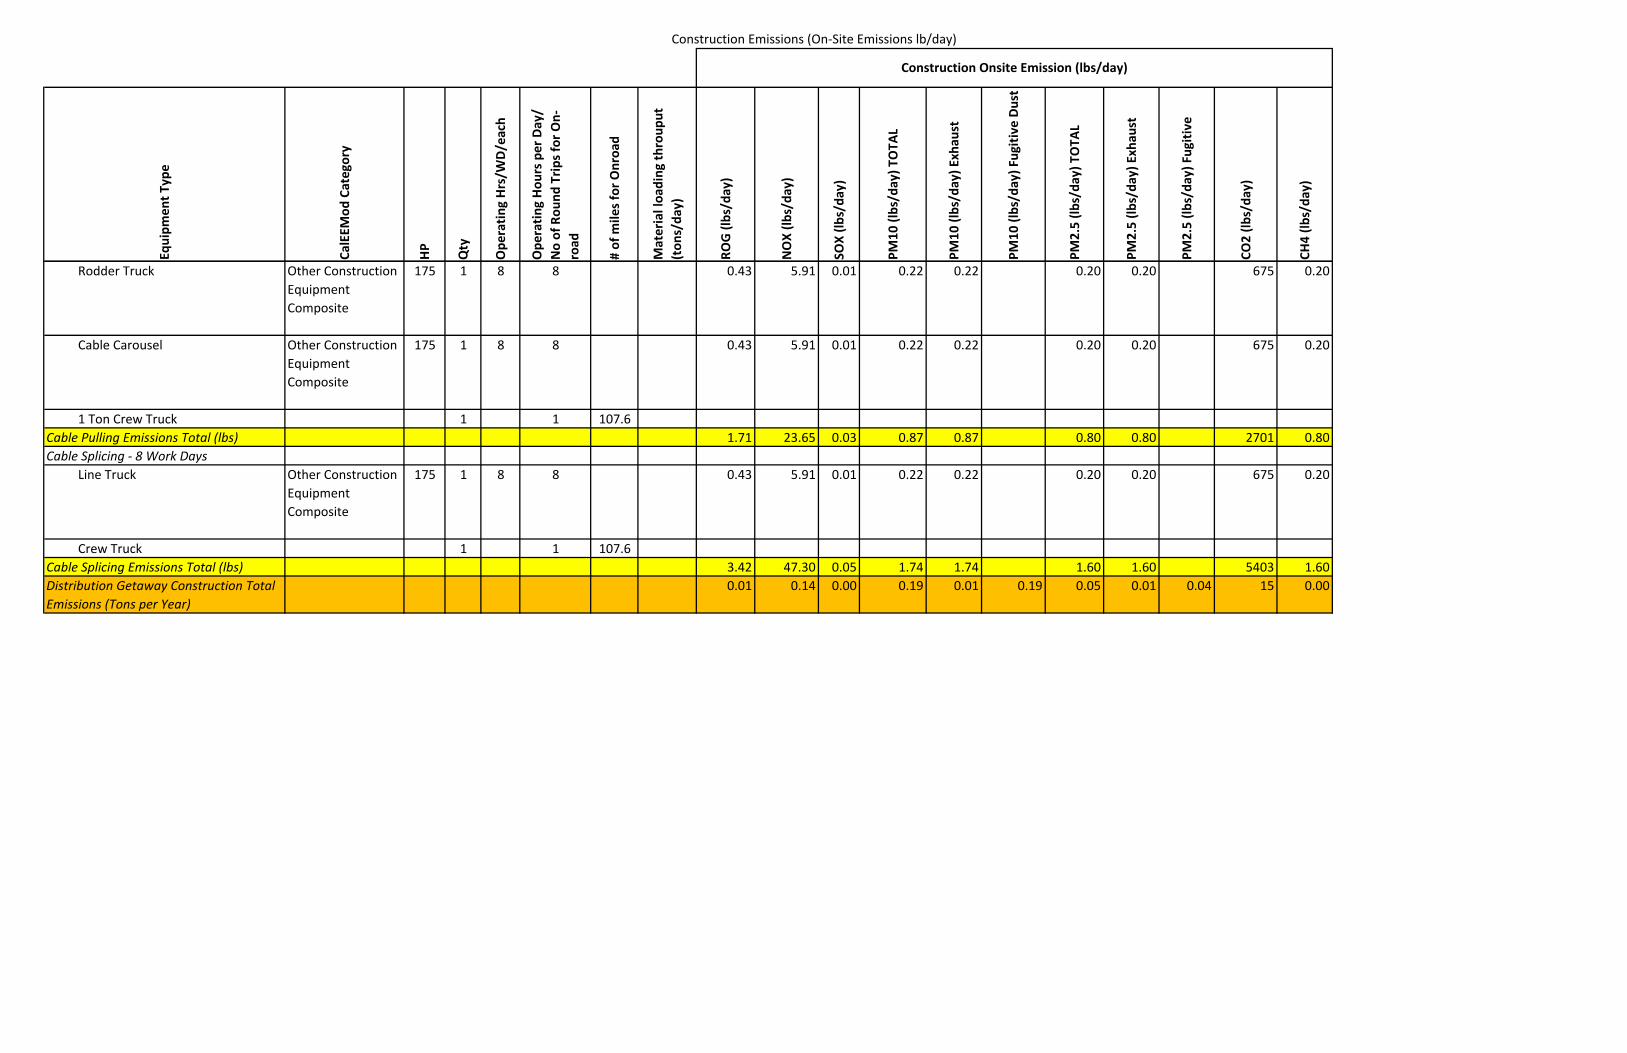
Construction Emissions (On‐Site Emissions lb/day)
Equipm
ent T
ype
CalEEM
od Category
HP
Qty
Ope
ratin
g Hrs/W
D/each
Ope
ratin
g Hou
rs per Day/
No of Rou
nd Trip
s for On‐
road
# of m
iles for O
nroa
d
Material loa
ding
throup
ut
(ton
s/da
y)
ROG (lbs/day)
NOX (lb
s/da
y)
SOX (lb
s/da
y)
PM10
(lbs/day) T
OTA
L
PM10
(lbs/day) E
xhau
st
PM10
(lbs/day) Fugitive
Dust
PM2.5 (lb
s/da
y) TOTA
L
PM2.5 (lb
s/da
y) Exhau
st
PM2.5 (lb
s/da
y) Fugitive
CO2 (lb
s/da
y)
CH4 (lb
s/da
y)
Construction Onsite Emission (lbs/day)
Rodder Truck Other Construction Equipment Composite
175 1 8 8 0.43 5.91 0.01 0.22 0.22 0.20 0.20 675 0.20
Cable Carousel Other Construction Equipment Composite
175 1 8 8 0.43 5.91 0.01 0.22 0.22 0.20 0.20 675 0.20
1 Ton Crew Truck 1 1 107.6Cable Pulling Emissions Total (lbs) 1.71 23.65 0.03 0.87 0.87 0.80 0.80 2701 0.80Cable Splicing ‐ 8 Work Days Line Truck Other Construction
Equipment Composite
175 1 8 8 0.43 5.91 0.01 0.22 0.22 0.20 0.20 675 0.20
Crew Truck 1 1 107.6Cable Splicing Emissions Total (lbs) 3.42 47.30 0.05 1.74 1.74 1.60 1.60 5403 1.60Distribution Getaway Construction Total Emissions (Tons per Year)
0.01 0.14 0.00 0.19 0.01 0.19 0.05 0.01 0.04 15 0.00

Construction Emissions (On‐Site Emissions lb/day)
Equipm
ent T
ype
CalEEM
od Category
HP
Qty
Ope
ratin
g Hrs/W
D/each
Ope
ratin
g Hou
rs per Day/
No of Rou
nd Trip
s for On‐
road
# of m
iles for O
nroa
d
Material loa
ding
throup
ut
(ton
s/da
y)
ROG (lbs/day)
NOX (lb
s/da
y)
SOX (lb
s/da
y)
PM10
(lbs/day) T
OTA
L
PM10
(lbs/day) E
xhau
st
PM10
(lbs/day) Fugitive
Dust
PM2.5 (lb
s/da
y) TOTA
L
PM2.5 (lb
s/da
y) Exhau
st
PM2.5 (lb
s/da
y) Fugitive
CO2 (lb
s/da
y)
CH4 (lb
s/da
y)
Construction Onsite Emission (lbs/day)
Subtransmission ConstructionSurvey ‐ 2 Work Days 1 Ton Truck Other Construction
Equipment Composite
175 1 8 8 0.43 5.91 0.01 0.22 0.22 0.20 0.20 675 0.20
Survey Emissions Total (lbs) 0.85 11.82 0.01 0.44 0.44 0.40 0.40 1351 0.40Marshalling Yard ‐ Duration of Project
1 Ton Truck Other Construction Equipment Composite
175 1 4 4 0.21 2.96 0.00 0.11 0.11 0.10 0.10 338 0.10
R/T Fork Lift Forklifts Composite 100 1 6 6 0.21 1.81 0.00 0.15 0.15 0.14 0.14 137 0.04
Boom Crane Truck Cranes Composite 250 1 2 2 0.15 1.99 0.00 0.08 0.08 0.08 0.08 164 0.05
Water Truck Other Construction Equipment Composite
250 1 8 8 0.43 5.91 0.01 0.22 0.22 0.20 0.20 675 0.20
Semi Tractor Truck Tractors/Loaders/Backhoes Composite
250 1 2 2 0.13 2.01 0.00 0.06 0.06 0.06 0.06 210 0.06
Marshalling Yard Emissions Total (lbs) 273.07 865.93 0.85 36.91 36.91 33.96 33.96 89898 26.56
Right of Way Clearing ‐ 1 Work Day 1 Ton Truck Other Construction
Equipment Composite
175 1 8 8 0.43 5.91 0.01 0.22 0.22 0.20 0.20 675 0.20
Backhoe / Front Loader Tractors/Loaders/Backhoes Composite
250 1 6 6 100 0.40 6.02 0.01 2.92 0.19 2.73 0.59 0.18 0.41 630 0.19
Track Type Dozer Rubber Tired Dozers Composite
380 1 6 6 1.42 16.20 0.01 1.87 0.76 1.11 2.23 0.70 1.53 1055 0.31
Motor Grader Graders Composite 400 1 6 6 0.68 8.06 0.01 25.94 0.31 25.63 3.05 0.28 2.77 1122 0.33
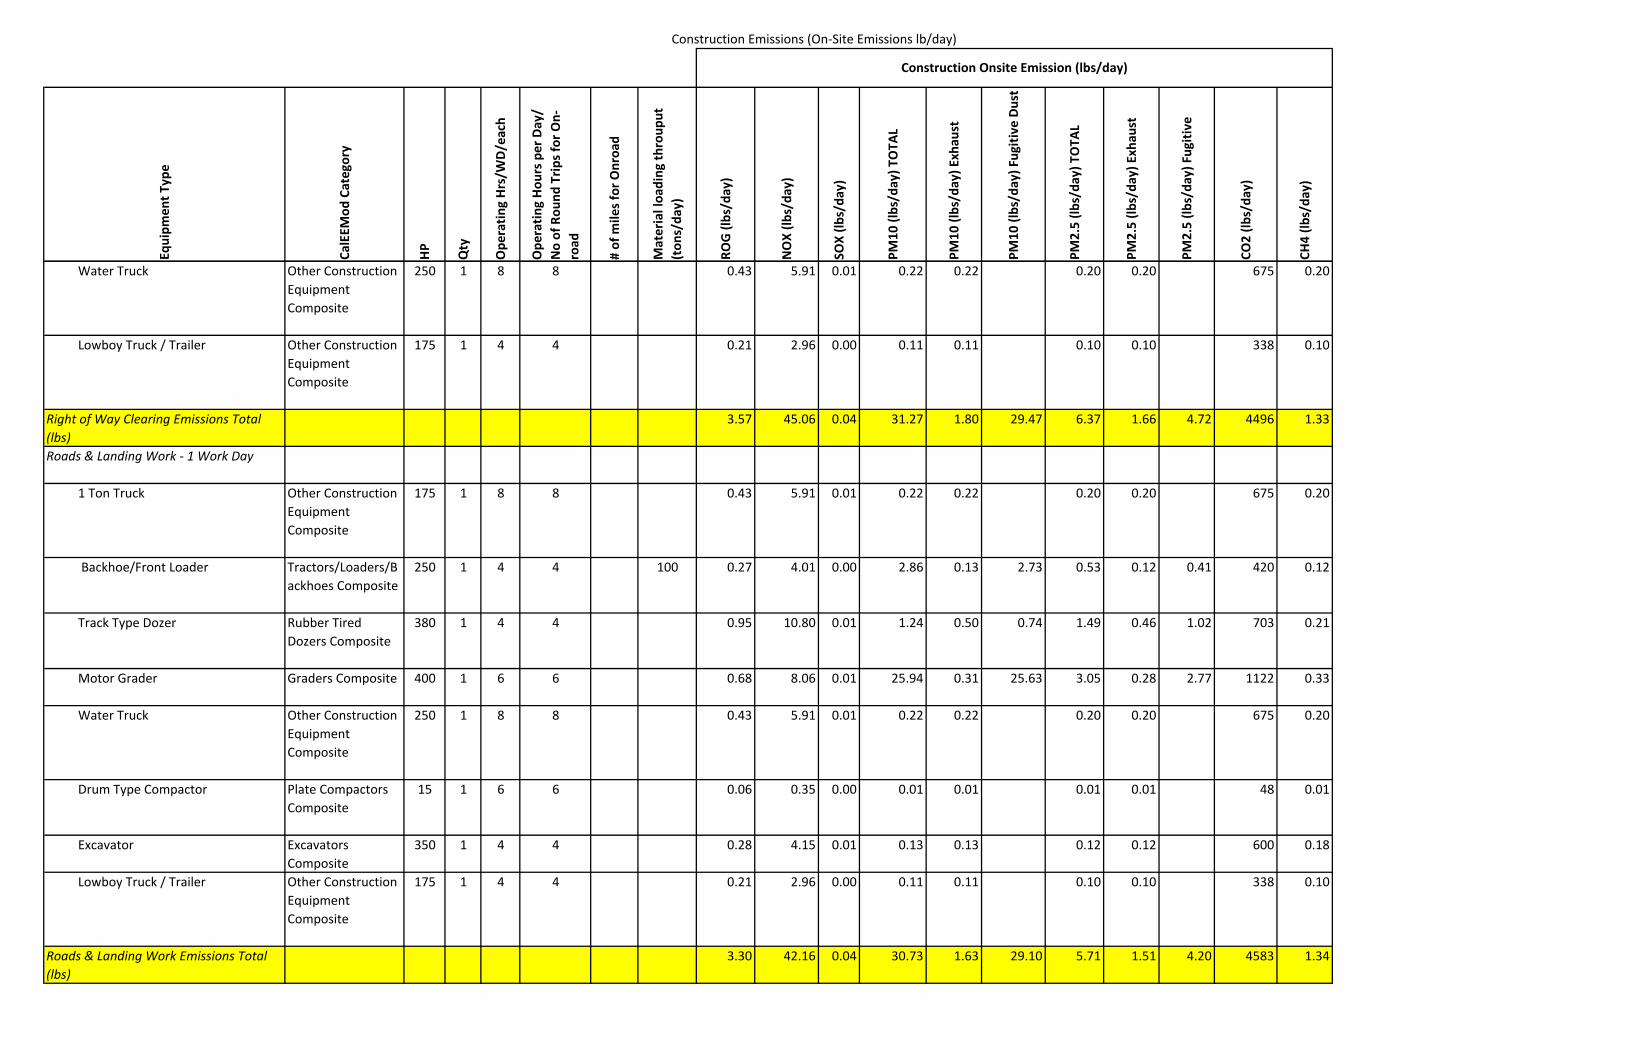
Construction Emissions (On‐Site Emissions lb/day)
Equipm
ent T
ype
CalEEM
od Category
HP
Qty
Ope
ratin
g Hrs/W
D/each
Ope
ratin
g Hou
rs per Day/
No of Rou
nd Trip
s for On‐
road
# of m
iles for O
nroa
d
Material loa
ding
throup
ut
(ton
s/da
y)
ROG (lbs/day)
NOX (lb
s/da
y)
SOX (lb
s/da
y)
PM10
(lbs/day) T
OTA
L
PM10
(lbs/day) E
xhau
st
PM10
(lbs/day) Fugitive
Dust
PM2.5 (lb
s/da
y) TOTA
L
PM2.5 (lb
s/da
y) Exhau
st
PM2.5 (lb
s/da
y) Fugitive
CO2 (lb
s/da
y)
CH4 (lb
s/da
y)
Construction Onsite Emission (lbs/day)
Water Truck Other Construction Equipment Composite
250 1 8 8 0.43 5.91 0.01 0.22 0.22 0.20 0.20 675 0.20
Lowboy Truck / Trailer Other Construction Equipment Composite
175 1 4 4 0.21 2.96 0.00 0.11 0.11 0.10 0.10 338 0.10
Right of Way Clearing Emissions Total (lbs)
3.57 45.06 0.04 31.27 1.80 29.47 6.37 1.66 4.72 4496 1.33
Roads & Landing Work ‐ 1 Work Day
1 Ton Truck Other Construction Equipment Composite
175 1 8 8 0.43 5.91 0.01 0.22 0.22 0.20 0.20 675 0.20
Backhoe/Front Loader Tractors/Loaders/Backhoes Composite
250 1 4 4 100 0.27 4.01 0.00 2.86 0.13 2.73 0.53 0.12 0.41 420 0.12
Track Type Dozer Rubber Tired Dozers Composite
380 1 4 4 0.95 10.80 0.01 1.24 0.50 0.74 1.49 0.46 1.02 703 0.21
Motor Grader Graders Composite 400 1 6 6 0.68 8.06 0.01 25.94 0.31 25.63 3.05 0.28 2.77 1122 0.33
Water Truck Other Construction Equipment Composite
250 1 8 8 0.43 5.91 0.01 0.22 0.22 0.20 0.20 675 0.20
Drum Type Compactor Plate Compactors Composite
15 1 6 6 0.06 0.35 0.00 0.01 0.01 0.01 0.01 48 0.01
Excavator Excavators Composite
350 1 4 4 0.28 4.15 0.01 0.13 0.13 0.12 0.12 600 0.18
Lowboy Truck / Trailer Other Construction Equipment Composite
175 1 4 4 0.21 2.96 0.00 0.11 0.11 0.10 0.10 338 0.10
Roads & Landing Work Emissions Total (lbs)
3.30 42.16 0.04 30.73 1.63 29.10 5.71 1.51 4.20 4583 1.34

Construction Emissions (On‐Site Emissions lb/day)
Equipm
ent T
ype
CalEEM
od Category
HP
Qty
Ope
ratin
g Hrs/W
D/each
Ope
ratin
g Hou
rs per Day/
No of Rou
nd Trip
s for On‐
road
# of m
iles for O
nroa
d
Material loa
ding
throup
ut
(ton
s/da
y)
ROG (lbs/day)
NOX (lb
s/da
y)
SOX (lb
s/da
y)
PM10
(lbs/day) T
OTA
L
PM10
(lbs/day) E
xhau
st
PM10
(lbs/day) Fugitive
Dust
PM2.5 (lb
s/da
y) TOTA
L
PM2.5 (lb
s/da
y) Exhau
st
PM2.5 (lb
s/da
y) Fugitive
CO2 (lb
s/da
y)
CH4 (lb
s/da
y)
Construction Onsite Emission (lbs/day)
Removal of Existing Conductor ‐ 1 Work Day 1 Ton Truck Other Construction
Equipment Composite
175 2 4 8 0.43 5.91 0.01 0.22 0.22 0.20 0.20 675 0.20
Manlift / Bucket Truck Aerial Lifts Composite
120 2 8 16 0.26 4.40 0.01 0.21 0.21 0.19 0.19 674 0.20
Boom Crane Truck Cranes Composite 250 2 8 16 1.23 15.91 0.01 0.66 0.66 0.61 0.61 1312 0.39
Bull Wheel Puller Other Construction Equipment Composite
175 1 6 6 0.32 4.43 0.00 0.16 0.16 0.15 0.15 507 0.15
Sock Line Puller Other Construction Equipment Composite
175 1 6 6 0.32 4.43 0.00 0.16 0.16 0.15 0.15 507 0.15
Static Truck / Tensioner Other Construction Equipment Composite
175 1 6 6 0.32 4.43 0.00 0.16 0.16 0.15 0.15 507 0.15
Lowboy Truck / Trailer Other Construction Equipment Composite
175 2 4 8 0.43 5.91 0.01 0.22 0.22 0.20 0.20 675 0.20
Removal of Existing Conductor Emissions Total (lbs)
3.31 45.44 0.05 1.79 1.79 1.65 1.65 4857 1.44
Wood Pole Removal ‐ 1 Work Day 1 Ton Truck Other Construction
Equipment Composite
175 2 8 16 0.85 11.82 0.01 0.44 0.44 0.40 0.40 1351 0.40
Compressor Trailer Air Compressors Composite
400 1 4 4 0.60 5.85 0.01 0.19 0.19 0.19 0.19 962 0.05
Manlift / Bucket Truck Aerial Lifts Composite
120 1 6 6 0.10 1.65 0.00 0.08 0.08 0.07 0.07 253 0.07
Boom Crane Truck Cranes Composite 250 1 6 6 0.46 5.97 0.00 0.25 0.25 0.23 0.23 492 0.15

Construction Emissions (On‐Site Emissions lb/day)
Equipm
ent T
ype
CalEEM
od Category
HP
Qty
Ope
ratin
g Hrs/W
D/each
Ope
ratin
g Hou
rs per Day/
No of Rou
nd Trip
s for On‐
road
# of m
iles for O
nroa
d
Material loa
ding
throup
ut
(ton
s/da
y)
ROG (lbs/day)
NOX (lb
s/da
y)
SOX (lb
s/da
y)
PM10
(lbs/day) T
OTA
L
PM10
(lbs/day) E
xhau
st
PM10
(lbs/day) Fugitive
Dust
PM2.5 (lb
s/da
y) TOTA
L
PM2.5 (lb
s/da
y) Exhau
st
PM2.5 (lb
s/da
y) Fugitive
CO2 (lb
s/da
y)
CH4 (lb
s/da
y)
Construction Onsite Emission (lbs/day)
Flat Bed Pole Truck Other Construction Equipment Composite
175 1 8 8 0.43 5.91 0.01 0.22 0.22 0.20 0.20 675 0.20
Wood Pole Removal Emissions Total (lbs) 2.44 31.20 0.03 1.17 1.17 1.09 1.09 3733 0.87
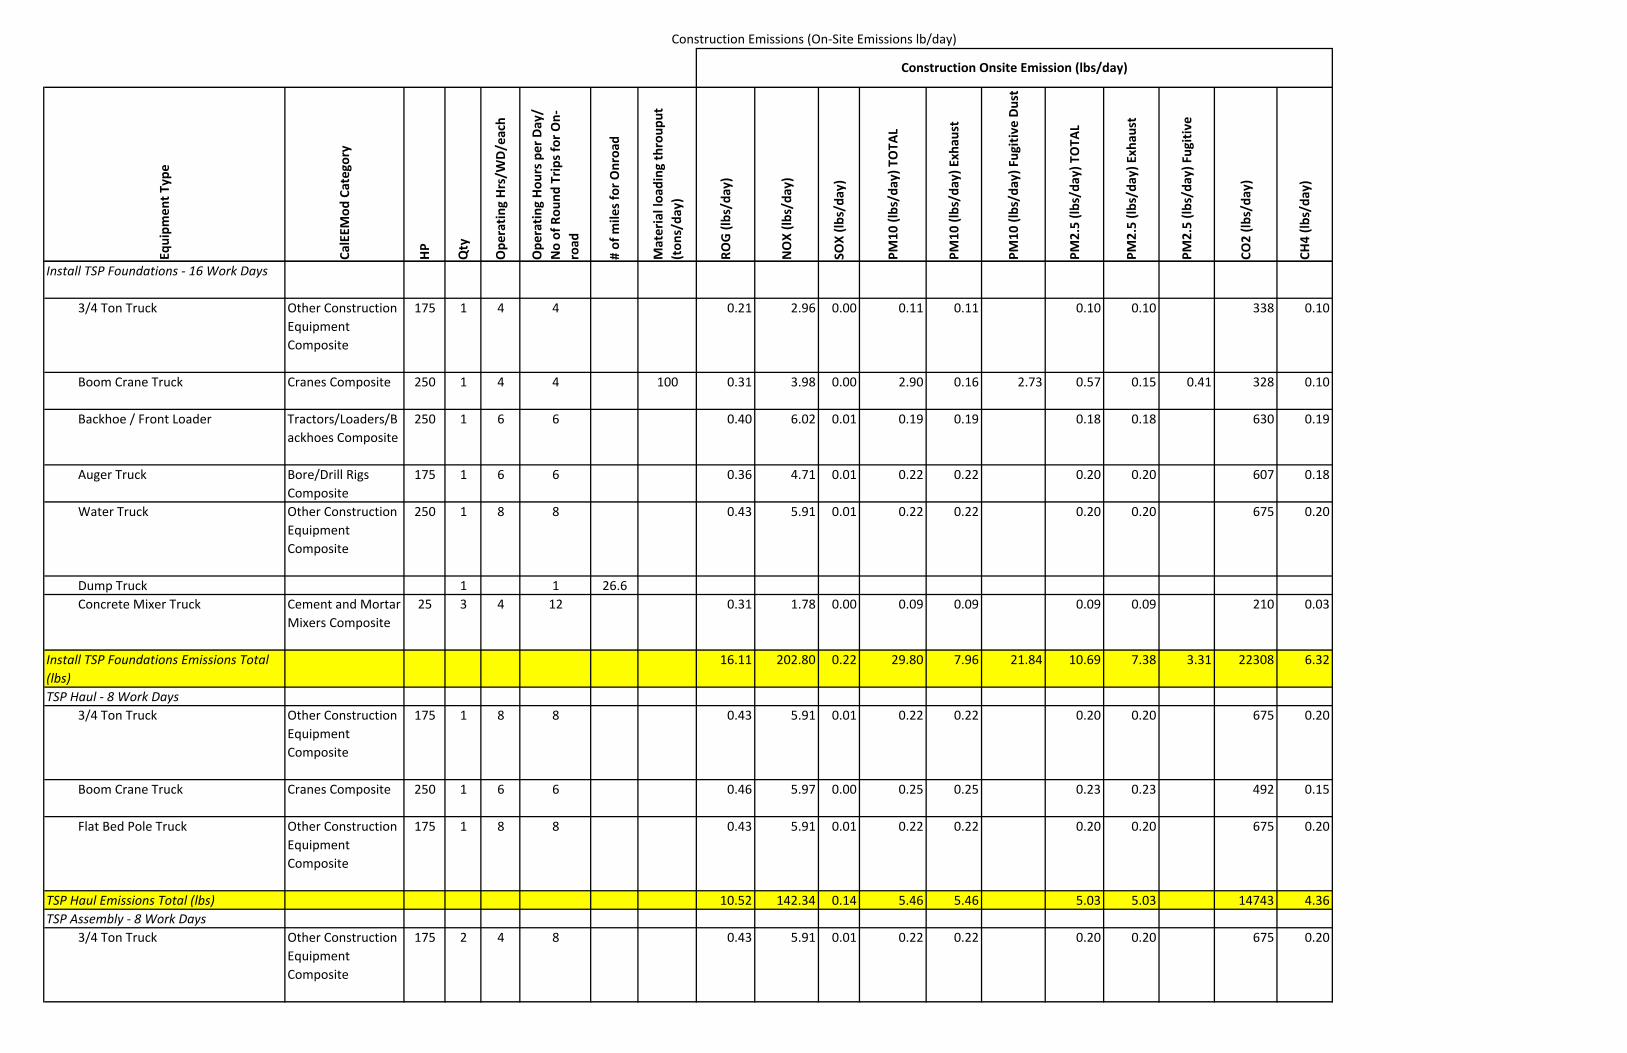
Construction Emissions (On‐Site Emissions lb/day)
Equipm
ent T
ype
CalEEM
od Category
HP
Qty
Ope
ratin
g Hrs/W
D/each
Ope
ratin
g Hou
rs per Day/
No of Rou
nd Trip
s for On‐
road
# of m
iles for O
nroa
d
Material loa
ding
throup
ut
(ton
s/da
y)
ROG (lbs/day)
NOX (lb
s/da
y)
SOX (lb
s/da
y)
PM10
(lbs/day) T
OTA
L
PM10
(lbs/day) E
xhau
st
PM10
(lbs/day) Fugitive
Dust
PM2.5 (lb
s/da
y) TOTA
L
PM2.5 (lb
s/da
y) Exhau
st
PM2.5 (lb
s/da
y) Fugitive
CO2 (lb
s/da
y)
CH4 (lb
s/da
y)
Construction Onsite Emission (lbs/day)
Install TSP Foundations ‐ 16 Work Days
3/4 Ton Truck Other Construction Equipment Composite
175 1 4 4 0.21 2.96 0.00 0.11 0.11 0.10 0.10 338 0.10
Boom Crane Truck Cranes Composite 250 1 4 4 100 0.31 3.98 0.00 2.90 0.16 2.73 0.57 0.15 0.41 328 0.10
Backhoe / Front Loader Tractors/Loaders/Backhoes Composite
250 1 6 6 0.40 6.02 0.01 0.19 0.19 0.18 0.18 630 0.19
Auger Truck Bore/Drill Rigs Composite
175 1 6 6 0.36 4.71 0.01 0.22 0.22 0.20 0.20 607 0.18
Water Truck Other Construction Equipment Composite
250 1 8 8 0.43 5.91 0.01 0.22 0.22 0.20 0.20 675 0.20
Dump Truck 1 1 26.6 Concrete Mixer Truck Cement and Mortar
Mixers Composite25 3 4 12 0.31 1.78 0.00 0.09 0.09 0.09 0.09 210 0.03
Install TSP Foundations Emissions Total (lbs)
16.11 202.80 0.22 29.80 7.96 21.84 10.69 7.38 3.31 22308 6.32
TSP Haul ‐ 8 Work Days 3/4 Ton Truck Other Construction
Equipment Composite
175 1 8 8 0.43 5.91 0.01 0.22 0.22 0.20 0.20 675 0.20
Boom Crane Truck Cranes Composite 250 1 6 6 0.46 5.97 0.00 0.25 0.25 0.23 0.23 492 0.15
Flat Bed Pole Truck Other Construction Equipment Composite
175 1 8 8 0.43 5.91 0.01 0.22 0.22 0.20 0.20 675 0.20
TSP Haul Emissions Total (lbs) 10.52 142.34 0.14 5.46 5.46 5.03 5.03 14743 4.36TSP Assembly ‐ 8 Work Days 3/4 Ton Truck Other Construction
Equipment Composite
175 2 4 8 0.43 5.91 0.01 0.22 0.22 0.20 0.20 675 0.20

Construction Emissions (On‐Site Emissions lb/day)
Equipm
ent T
ype
CalEEM
od Category
HP
Qty
Ope
ratin
g Hrs/W
D/each
Ope
ratin
g Hou
rs per Day/
No of Rou
nd Trip
s for On‐
road
# of m
iles for O
nroa
d
Material loa
ding
throup
ut
(ton
s/da
y)
ROG (lbs/day)
NOX (lb
s/da
y)
SOX (lb
s/da
y)
PM10
(lbs/day) T
OTA
L
PM10
(lbs/day) E
xhau
st
PM10
(lbs/day) Fugitive
Dust
PM2.5 (lb
s/da
y) TOTA
L
PM2.5 (lb
s/da
y) Exhau
st
PM2.5 (lb
s/da
y) Fugitive
CO2 (lb
s/da
y)
CH4 (lb
s/da
y)
Construction Onsite Emission (lbs/day)
1 Ton Truck Other Construction Equipment Composite
175 2 4 8 0.43 5.91 0.01 0.22 0.22 0.20 0.20 675 0.20
Compressor Trailer Air Compressors Composite
400 1 6 6 0.90 8.77 0.01 0.29 0.29 0.29 0.29 1443 0.08
Boom Crane Truck Cranes Composite 250 1 8 8 0.61 7.96 0.01 0.33 0.33 0.30 0.30 656 0.19
TSP Assembly Emissions Total (lbs) 18.94 228.45 0.25 8.42 8.42 7.93 7.93 27602 5.39TSP Erection ‐ 8 Work Days 3/4 Ton Truck Other Construction
Equipment Composite
175 2 4 8 0.43 5.91 0.01 0.22 0.22 0.20 0.20 675 0.20
1 Ton Truck Other Construction Equipment Composite
175 2 4 8 0.43 5.91 0.01 0.22 0.22 0.20 0.20 675 0.20
Compressor Trailer Air Compressors Composite
400 1 4 4 0.60 5.85 0.01 0.19 0.19 0.19 0.19 962 0.05
Boom Crane Truck Cranes Composite 250 1 8 8 0.61 7.96 0.01 0.33 0.33 0.30 0.30 656 0.19
TSK Erection Emissions Total (lbs) 16.54 205.05 0.22 7.65 7.65 7.16 7.16 23753 5.18Wood / LWS Haul ‐ 2 Work Day 3/4 Ton Truck Other Construction
Equipment Composite
175 1 8 8 0.43 5.91 0.01 0.22 0.22 0.20 0.20 675 0.20
Boom Crane Truck Cranes Composite 250 1 6 6 0.46 5.97 0.00 0.25 0.25 0.23 0.23 492 0.15
Flat Bed Pole Truck Other Construction Equipment Composite
175 1 8 8 0.43 5.91 0.01 0.22 0.22 0.20 0.20 675 0.20
Wood / LSW Pole Assembly Emissions Total (lbs)
2.63 35.59 0.03 1.37 1.37 1.26 1.26 3686 1.09
Wood / LSW Pole Assembly‐ 3 Work Day

Construction Emissions (On‐Site Emissions lb/day)
Equipm
ent T
ype
CalEEM
od Category
HP
Qty
Ope
ratin
g Hrs/W
D/each
Ope
ratin
g Hou
rs per Day/
No of Rou
nd Trip
s for On‐
road
# of m
iles for O
nroa
d
Material loa
ding
throup
ut
(ton
s/da
y)
ROG (lbs/day)
NOX (lb
s/da
y)
SOX (lb
s/da
y)
PM10
(lbs/day) T
OTA
L
PM10
(lbs/day) E
xhau
st
PM10
(lbs/day) Fugitive
Dust
PM2.5 (lb
s/da
y) TOTA
L
PM2.5 (lb
s/da
y) Exhau
st
PM2.5 (lb
s/da
y) Fugitive
CO2 (lb
s/da
y)
CH4 (lb
s/da
y)
Construction Onsite Emission (lbs/day)
3/4 Ton Truck Other Construction Equipment Composite
175 2 4 8 0.43 5.91 0.01 0.22 0.22 0.20 0.20 675 0.20
1 Tone Truck Other Construction Equipment Composite
175 2 4 8 0.43 5.91 0.01 0.22 0.22 0.20 0.20 675 0.20
Compressor Trailer Air Compressors Composite
400 1 6 6 0.90 8.77 0.01 0.29 0.29 0.29 0.29 1443 0.08
Boom Crane Truck Cranes Composite 250 1 8 8 0.61 7.96 0.01 0.33 0.33 0.30 0.30 656 0.19
Wood / LSW Pole Assembly Emissions Total (lbs)
7.10 85.67 0.09 3.16 3.16 2.97 2.97 10351 2.02
Install Wood / LSW Pole ‐ 3 Work Days
1 Ton Truck Other Construction Equipment Composite
175 1 8 8 0.43 5.91 0.01 0.22 0.22 0.20 0.20 675 0.20
Manlift / Bucket Truck Aerial Lifts Composite
120 1 6 6 0.10 1.65 0.00 0.08 0.08 0.07 0.07 253 0.07
Boom Crane Truck Cranes Composite 250 1 6 6 0.46 5.97 0.00 0.25 0.25 0.23 0.23 492 0.15
Auger Truck Bore/Drill Rigs Composite
175 1 4 4 0.24 3.14 0.00 0.14 0.14 0.13 0.13 404 0.12
Backhoe / Front Loader Tractors/Loaders/Backhoes Composite
250 1 8 8 100 0.53 8.03 0.01 2.99 0.26 2.73 0.65 0.24 0.41 840 0.25
Extendable Flat Bed Pole Truck Other Construction Equipment Composite
175 1 8 8 0.43 5.91 0.01 0.22 0.22 0.20 0.20 675 0.20
Install Wood / LSW Pole Emissions Total (lbs)
6.55 91.83 0.09 11.68 3.49 8.19 4.45 3.21 1.24 10021 2.96

Construction Emissions (On‐Site Emissions lb/day)
Equipm
ent T
ype
CalEEM
od Category
HP
Qty
Ope
ratin
g Hrs/W
D/each
Ope
ratin
g Hou
rs per Day/
No of Rou
nd Trip
s for On‐
road
# of m
iles for O
nroa
d
Material loa
ding
throup
ut
(ton
s/da
y)
ROG (lbs/day)
NOX (lb
s/da
y)
SOX (lb
s/da
y)
PM10
(lbs/day) T
OTA
L
PM10
(lbs/day) E
xhau
st
PM10
(lbs/day) Fugitive
Dust
PM2.5 (lb
s/da
y) TOTA
L
PM2.5 (lb
s/da
y) Exhau
st
PM2.5 (lb
s/da
y) Fugitive
CO2 (lb
s/da
y)
CH4 (lb
s/da
y)
Construction Onsite Emission (lbs/day)
Install / Transfer Conductor ‐ 4 Work Days 1 Ton Truck Other Construction
Equipment Composite
175 3 4 12 0.64 8.87 0.01 0.33 0.33 0.30 0.30 1013 0.30
Manlift / Bucket Truck Aerial Lifts Composite
120 4 8 32 0.53 8.80 0.01 0.42 0.42 0.39 0.39 1348 0.40
Boom Crane Truck Cranes Composite 250 1 8 8 0.61 7.96 0.01 0.33 0.33 0.30 0.30 656 0.19
Dump Truck 1 1 26.6 Wire Truck / Trailer Other Construction
Equipment Composite
175 1 6 6 0.32 4.43 0.00 0.16 0.16 0.15 0.15 507 0.15
Sock Line Puller Other Construction Equipment Composite
175 1 6 6 0.32 4.43 0.00 0.16 0.16 0.15 0.15 507 0.15
Bull Wheel Puller Other Construction Equipment Composite
175 1 6 6 0.32 4.43 0.00 0.16 0.16 0.15 0.15 507 0.15
Static Truck / Tensioner Other Construction Equipment Composite
175 1 6 6 0.32 4.43 0.00 0.16 0.16 0.15 0.15 507 0.15
Backhoe / Front Loader Tractors/Loaders/Backhoes Composite
250 1 2 2 100 0.13 2.01 0.00 2.80 0.06 2.73 0.47 0.06 0.41 210 0.06
Lowboy Truck / Trailer Other Construction Equipment Composite
175 2 4 8 0.43 5.91 0.01 0.22 0.22 0.20 0.20 675 0.20
Install / Transfer Conductor Emissions Total (lbs)
14.50 205.13 0.22 18.97 8.05 10.92 9.06 7.40 1.65 23715 7.01
Restoration ‐ 1 Work Day

Construction Emissions (On‐Site Emissions lb/day)
Equipm
ent T
ype
CalEEM
od Category
HP
Qty
Ope
ratin
g Hrs/W
D/each
Ope
ratin
g Hou
rs per Day/
No of Rou
nd Trip
s for On‐
road
# of m
iles for O
nroa
d
Material loa
ding
throup
ut
(ton
s/da
y)
ROG (lbs/day)
NOX (lb
s/da
y)
SOX (lb
s/da
y)
PM10
(lbs/day) T
OTA
L
PM10
(lbs/day) E
xhau
st
PM10
(lbs/day) Fugitive
Dust
PM2.5 (lb
s/da
y) TOTA
L
PM2.5 (lb
s/da
y) Exhau
st
PM2.5 (lb
s/da
y) Fugitive
CO2 (lb
s/da
y)
CH4 (lb
s/da
y)
Construction Onsite Emission (lbs/day)
1 Ton Truck Other Construction Equipment Composite
175 2 4 8 0.43 5.91 0.01 0.22 0.22 0.20 0.20 675 0.20
Backhoe / Front Loader Tractors/Loaders/Backhoes Composite
250 1 4 4 100 0.27 4.01 0.00 2.86 0.13 2.73 0.53 0.12 0.41 420 0.12
Motor Grader Graders Composite 400 1 6 6 0.68 8.06 0.01 25.94 0.31 25.63 3.05 0.28 2.77 1122 0.33
Water Truck Other Construction Equipment Composite
250 1 8 8 0.43 5.91 0.01 0.22 0.22 0.20 0.20 675 0.20
Drum Type Compactor Plate Compactors Composite
15 1 8 8 0.08 0.47 0.00 0.02 0.02 0.02 0.02 65 0.01
Lowboy Truck / Trailer Other Construction Equipment Composite
175 1 4 4 0.21 2.96 0.00 0.11 0.11 0.10 0.10 338 0.10
Restoration Emissions Total (lbs) 2.09 27.32 0.03 29.36 1.00 28.36 4.10 0.92 3.18 3296 0.96Subtransmission Construction Total Emissions (Tons per Year)
0.19 1.13 0.00 2.91 0.05 2.87 0.47 0.04 0.43 112.67 0.03
Telecommunications Construction 1 4 4Telecom Construction Inside MEER ‐ 30 Work Days Pick‐up Truck 3 3 107.0Telecom Construction Inside MEER Emissions Total (lbs)Substructure Installation ‐ 34 Work Days
Backhoe Tractors/Loaders/Backhoes Composite
250 1 8 8 0.53 8.03 0.01 0.26 0.26 0.24 0.24 840 0.25
Dump Truck 175 1 1 26.6 Cement Truck Cement and Mortar
Mixers Composite175 1 8 8 0.21 1.18 0.00 0.06 0.06 0.06 0.06 140 0.02
Substructure Installation Emissions Total (lbs)
25.16 313.24 0.33 10.93 10.93 10.22 10.22 33347 9.07

Construction Emissions (On‐Site Emissions lb/day)
Equipm
ent T
ype
CalEEM
od Category
HP
Qty
Ope
ratin
g Hrs/W
D/each
Ope
ratin
g Hou
rs per Day/
No of Rou
nd Trip
s for On‐
road
# of m
iles for O
nroa
d
Material loa
ding
throup
ut
(ton
s/da
y)
ROG (lbs/day)
NOX (lb
s/da
y)
SOX (lb
s/da
y)
PM10
(lbs/day) T
OTA
L
PM10
(lbs/day) E
xhau
st
PM10
(lbs/day) Fugitive
Dust
PM2.5 (lb
s/da
y) TOTA
L
PM2.5 (lb
s/da
y) Exhau
st
PM2.5 (lb
s/da
y) Fugitive
CO2 (lb
s/da
y)
CH4 (lb
s/da
y)
Construction Onsite Emission (lbs/day)
Wood Pole Replacement and Transfer Facilities ‐ 40 Work Days 1 Ton Truck Other Construction
Equipment Composite
175 2 2 4 0.21 2.96 0.00 0.11 0.11 0.10 0.10 338 0.10
Double Bucket Truck Other Construction Equipment Composite
175 1 8 8 0.43 5.91 0.01 0.22 0.22 0.20 0.20 675 0.20
Auger Truck Bore/Drill Rigs Composite
175 1 4 4 0.24 3.14 0.00 0.14 0.14 0.13 0.13 404 0.12
Boom Truck Other Construction Equipment Composite
175 1 8 8 0.43 5.91 0.01 0.22 0.22 0.20 0.20 675 0.20
Wood Pole Replacement and Transfer Facilities Emissions Total (lbs)
52.23 716.71 0.79 27.52 27.52 25.32 25.32 83708 24.73
Fiber Optic Cable Installation ‐ 62 Work Days Pick‐up Truck 2 2 107.0 Manlift / Bucket Truck Aerial Lifts
Composite120 1 8 8 0.13 2.20 0.00 0.10 0.10 0.10 0.10 337 0.10
Fiber Optic Cable Installation Emissions Total (lbs)
8.18 136.40 0.20 6.50 6.50 5.98 5.98 20896 6.18
Telecommunications Construction Total Emissions (Tons per Year)
0.04 0.6 0.0 2.9 0.0 2.8 0.4 0.0 0.4 62.6 0.0
Proposed Project Construction Emissions (Tons per Year)
0.24 2.62 0.00 6.0 0.10 5.90 0.98 0.09 0.88 257 0.07

Construction Emissions (Off‐Site Emissions lb/day)
Equipm
ent T
ype
Qty
Ope
ratin
g Hou
rs per Day/
No of Rou
nd Trip
s for O
n‐road
# of m
iles for O
nroa
d
Is veh
icle?
Trip
leng
th (m
iles)
Veh
icle Category
EMFA
C column #
CO Rate (lb
s/da
y)
ROG Rate (lb
s/da
y)
NOX rate (lbs/day)
SOX rate (lbs/day)
PM2.5 rate (lbs/day)
PM2.5 Break wear rate
(lbs/da
y)
PM2.5 Tire wear rate
(lbs/da
y)
PM2.5 road
dust rate
(lbs/da
y)
PM2.5 rate (lbs/day) T
OTA
L
PM10
rate (lbs/day)
PM10
Break wear rate
(lbs/da
y)
PM10
Tire
wear rate
(lbs/da
y)
PM10
road
dust rate
(lbs/da
y)
PM10
rate (lbs/day) T
OTA
L
CO2 rate (lbs/day)
CH4 rate (lbs/day)
Survey Trucks 2 2.00 107.6 TRUE 107.60 HHD 9.00 0.76 0.14 3.03 0.01 0.05 0.01 0.00 0.16 0.23 0.06 0.03 0.02 0.66 0.77 806 0.01Survey Emissions Total (lbs) 538.00 45.00 3.78 0.68 15.14 0.04 0.26 0.06 0.02 0.82 1.16 0.29 0.15 0.08 3.32 3.84 4028 0.03 Pick‐up Truck 4 4.00 107.6 TRUE 107.60 HHD 9.00 1.51 0.27 6.06 0.02 0.10 0.02 0.01 0.33 0.46 0.11 0.06 0.03 1.33 1.54 1611 0.01Grading Emissions Total (lbs) 45.40 8.10 181.67 0.47 3.15 0.75 0.25 9.79 13.94 3.42 1.75 1.02 39.88 46.07 48340 0.36 Crew Cab Truck 1 1.00 107.6 TRUE 107.60 LDT2 4.00 0.59 0.02 0.09 0.00 0.00 0.00 0.00 0.08 0.09 0.00 0.01 0.00 0.33 0.34 99 0.01Fencing Emissions Total (lbs) 5.86 0.20 0.87 0.01 0.01 0.04 0.00 0.82 0.86 0.01 0.09 0.02 3.32 3.44 988 0.05 Dump Truck 1 1.00 26.6 TRUE 26.60 HHD 9.00 0.09 0.02 0.37 0.00 0.01 0.00 0.00 0.02 0.03 0.01 0.00 0.00 0.08 0.09 100 0.00 Pick‐up Truck 4 4.00 107.6 TRUE 107.60 LDT2 4.00 2.34 0.08 0.35 0.00 0.00 0.01 0.00 0.33 0.35 0.00 0.03 0.01 1.33 1.37 395 0.02Civil Emissions Total (lbs) 185.18 7.27 54.98 0.41 0.65 1.25 0.18 26.33 28.42 0.70 2.92 0.74 107.29 111.65 37607 1.70 Pick‐up Truck 2 2.00 107.6 TRUE 107.60 LDT2 4.00 1.17 0.04 0.17 0.00 0.00 0.01 0.00 0.16 0.17 0.00 0.02 0.00 0.66 0.69 198 0.01MEER Emissions Total (lbs) 5.86 0.20 0.87 0.01 0.01 0.04 0.00 0.82 0.86 0.01 0.09 0.02 3.32 3.44 988 0.05 Crew Truck 2 2.00 107.6 TRUE 107.60 LDT2 4.00 1.17 0.04 0.17 0.00 0.00 0.01 0.00 0.16 0.17 0.00 0.02 0.00 0.66 0.69 198 0.01Electrical Emissions Total (lbs) 77.32 2.60 11.52 0.15 0.07 0.49 0.06 10.77 11.39 0.07 1.15 0.25 43.87 45.35 13043 0.71Wiring Emissions Total (lbs) Crew Truck 2 2.00 107.6 TRUE 107.60 LDT2 4.00 1.17 0.04 0.17 0.00 0.00 0.01 0.00 0.16 0.17 0.00 0.02 0.00 0.66 0.69 198 0.01Transformers Emissions Total (lbs) 5.86 0.20 0.87 0.01 0.01 0.04 0.00 0.82 0.86 0.01 0.09 0.02 3.32 3.44 988 0.05Maintenance Crew Equipment Check Emissions Total (lbs) Crew Truck/Van 1 1.00 107.6 TRUE 107.60 LDT2 4.00 0.59 0.02 0.09 0.00 0.00 0.00 0.00 0.08 0.09 0.00 0.01 0.00 0.33 0.34 99 0.01Testing Emissions Total (lbs) 51.55 1.74 7.68 0.10 0.04 0.33 0.04 7.18 7.59 0.05 0.77 0.17 29.25 30.23 8695 0.48 Dump Truck 1 1.00 26.6 TRUE 26.60 HHD 9.00 0.09 0.02 0.37 0.00 0.01 0.00 0.00 0.02 0.03 0.01 0.00 0.00 0.08 0.09 100 0.00Asphalting Emissions Total (lbs) 0.94 0.17 3.74 0.01 0.06 0.02 0.01 0.20 0.29 0.07 0.04 0.02 0.82 0.95 996 0.01Landscaping ‐ 5 Work Days Dump Truck 1 1.00 26.6 TRUE 26.60 HHD 9.00 0.09 0.02 0.37 0.00 0.01 0.00 0.00 0.02 0.03 0.01 0.00 0.00 0.08 0.09 100 0.00 Pick‐up Truck TRUE 107.60 LDT2 4.00Landscaping Emissions Total (lbs) 0.47 0.08 1.87 0.00 0.03 0.01 0.00 0.10 0.14 0.04 0.02 0.01 0.41 0.47 498 0.00Banducci Substation Construction Total Emissions (Tons per Year)
0.19 0.01 0.14 0.00 0.00 0.00 0.00 0.03 0.03 0.00 0.00 0.00 0.12 0.12 53 0.00
Dump Truck 1 1.00 26.6 TRUE 26.60 HHD 9.00 0.09 0.02 0.37 0.00 0.01 0.00 0.00 0.02 0.03 0.01 0.00 0.00 0.08 0.09 100 0.00Civil Emissions Total (lbs) 0.75 0.13 2.99 0.01 0.05 0.01 0.00 0.16 0.23 0.06 0.03 0.02 0.66 0.76 797 0.01Vault Delivery Emissions Total (lbs) 0 1 Ton Crew Truck 1 1.00 107.6 TRUE 107.60 LDT2 4.00 0.59 0.02 0.09 0.00 0.00 0.00 0.00 0.08 0.09 0.00 0.01 0.00 0.33 0.34 99 0.01Cable Pulling Emissions Total (lbs) 1.17 0.04 0.17 0.00 0.00 0.01 0.00 0.16 0.17 0.00 0.02 0.00 0.66 0.69 198 0.01 Crew Truck 1 1.00 107.6 TRUE 107.60 LDT2 4.00 0.59 0.02 0.09 0.00 0.00 0.00 0.00 0.08 0.09 0.00 0.01 0.00 0.33 0.34 99 0.01Cable Splicing Emissions Total (lbs) 4.69 0.16 0.70 0.01 0.00 0.03 0.00 0.65 0.69 0.00 0.07 0.02 2.66 2.75 790 0.04Distribution Getaway Construction Total Emissions (Tons per Year)
0.00 0.00 0.00 0.00 0.00 0.00 0.00 0.00 0.00 0.00 0.00 0.00 0.00 0.00 1 0.00
Survey Emissions Total (lbs) 0Marshalling Yard Emissions Total (lbs)
Right of Way Clearing Emissions Total (lbs)Roads & Landing Work Emissions Total (lbs)Removal of Existing Conductor Emissions Total (lbs)Wood Pole Removal Emissions Total (lbs) Dump Truck 1 1.00 26.6 TRUE 26.60 HHD 9.00 0.09 0.02 0.37 0.00 0.01 0.00 0.00 0.02 0.03 0.01 0.00 0.00 0.08 0.09 100 0.00
On‐Road Vehicle Emissions (lb/day)

Construction Emissions (Off‐Site Emissions lb/day)
Equipm
ent T
ype
Qty
Ope
ratin
g Hou
rs per Day/
No of Rou
nd Trip
s for O
n‐road
# of m
iles for O
nroa
d
Is veh
icle?
Trip
leng
th (m
iles)
Veh
icle Category
EMFA
C column #
CO Rate (lb
s/da
y)
ROG Rate (lb
s/da
y)
NOX rate (lbs/day)
SOX rate (lbs/day)
PM2.5 rate (lbs/day)
PM2.5 Break wear rate
(lbs/da
y)
PM2.5 Tire wear rate
(lbs/da
y)
PM2.5 road
dust rate
(lbs/da
y)
PM2.5 rate (lbs/day) T
OTA
L
PM10
rate (lbs/day)
PM10
Break wear rate
(lbs/da
y)
PM10
Tire
wear rate
(lbs/da
y)
PM10
road
dust rate
(lbs/da
y)
PM10
rate (lbs/day) T
OTA
L
CO2 rate (lbs/day)
CH4 rate (lbs/day)
On‐Road Vehicle Emissions (lb/day)
Install TSP Foundations Emissions Total (lbs)
1.50 0.27 5.99 0.02 0.10 0.02 0.01 0.32 0.46 0.11 0.06 0.03 1.31 1.52 1593 0.01
TSP Haul Emissions Total (lbs)TSP Assembly Emissions Total (lbs)TSK Erection Emissions Total (lbs)Wood / LSW Pole Assembly Emissions Total (lbs)Wood / LSW Pole Assembly Emissions Total (lbs)Install Wood / LSW Pole Emissions Total (lbs) Dump Truck 1 1.00 26.6 TRUE 26.60 HHD 9.00 0.09 0.02 0.37 0.00 0.01 0.00 0.00 0.02 0.03 0.01 0.00 0.00 0.08 0.09 100 0.00Install / Transfer Conductor Emissions Total (lbs)
0.37 0.07 1.50 0.00 0.03 0.01 0.00 0.08 0.11 0.03 0.01 0.01 0.33 0.38 398 0.00
Restoration Emissions Total (lbs)Subtransmission Construction Total Emissions (Tons per Year)
0.001 0.000 0.004 0.000 0.000 0.000 0.000 0.000 0.000 0.000 0.000 0.000 0.001 0.001 0.90 0.00
Pick‐up Truck 3 3.00 107 TRUE 107.00 LDT2 4.00 1.75 0.06 0.26 0.00 0.00 0.01 0.00 0.24 0.26 0.00 0.03 0.01 0.99 1.02 295 0.02Telecom Construction Inside MEER Emissions Total (lbs)
52.42 1.77 7.81 0.10 0.05 0.33 0.04 7.30 7.72 0.05 0.78 0.17 29.75 30.75 8843 0.48
Substructure Installation ‐ 34 Work Days
Dump Truck 1 1.00 26.6 TRUE 26.60 HHD 9.00 0.09 0.02 0.37 0.00 0.01 0.00 0.00 0.02 0.03 0.01 0.00 0.00 0.08 0.09 100 0.00Substructure Installation Emissions Total (lbs)
3.18 0.57 12.72 0.03 0.22 0.05 0.02 0.69 0.98 0.24 0.12 0.07 2.79 3.23 3386 0.03
Wood Pole Replacement and Transfer Facilities Emissions Total (lbs)
Pick‐up Truck 2 2.00 107 TRUE 107.00 LDT2 4.00 1.16 0.04 0.17 0.00 0.00 0.01 0.00 0.16 0.17 0.00 0.02 0.00 0.66 0.68 197 0.01Fiber Optic Cable Installation Emissions Total (lbs)
72.23 2.43 10.76 0.14 0.06 0.46 0.06 10.06 10.64 0.07 1.07 0.23 40.98 42.36 12184 0.67
Telecommunications Construction Total Emissions (Tons per Year)
0.06 0.00 0.02 0.00 0.00 0.00 0.00 0.01 0.01 0.00 0.00 0.00 0.04 0.04 11 0.00
Proposed Project Construction Emissions (Tons per Year)
0.11 0.01 0.07 0.00 0.00 0.00 0.00 0.02 0.02 0.00 0.00 0.00 0.07 0.07 28 0.00
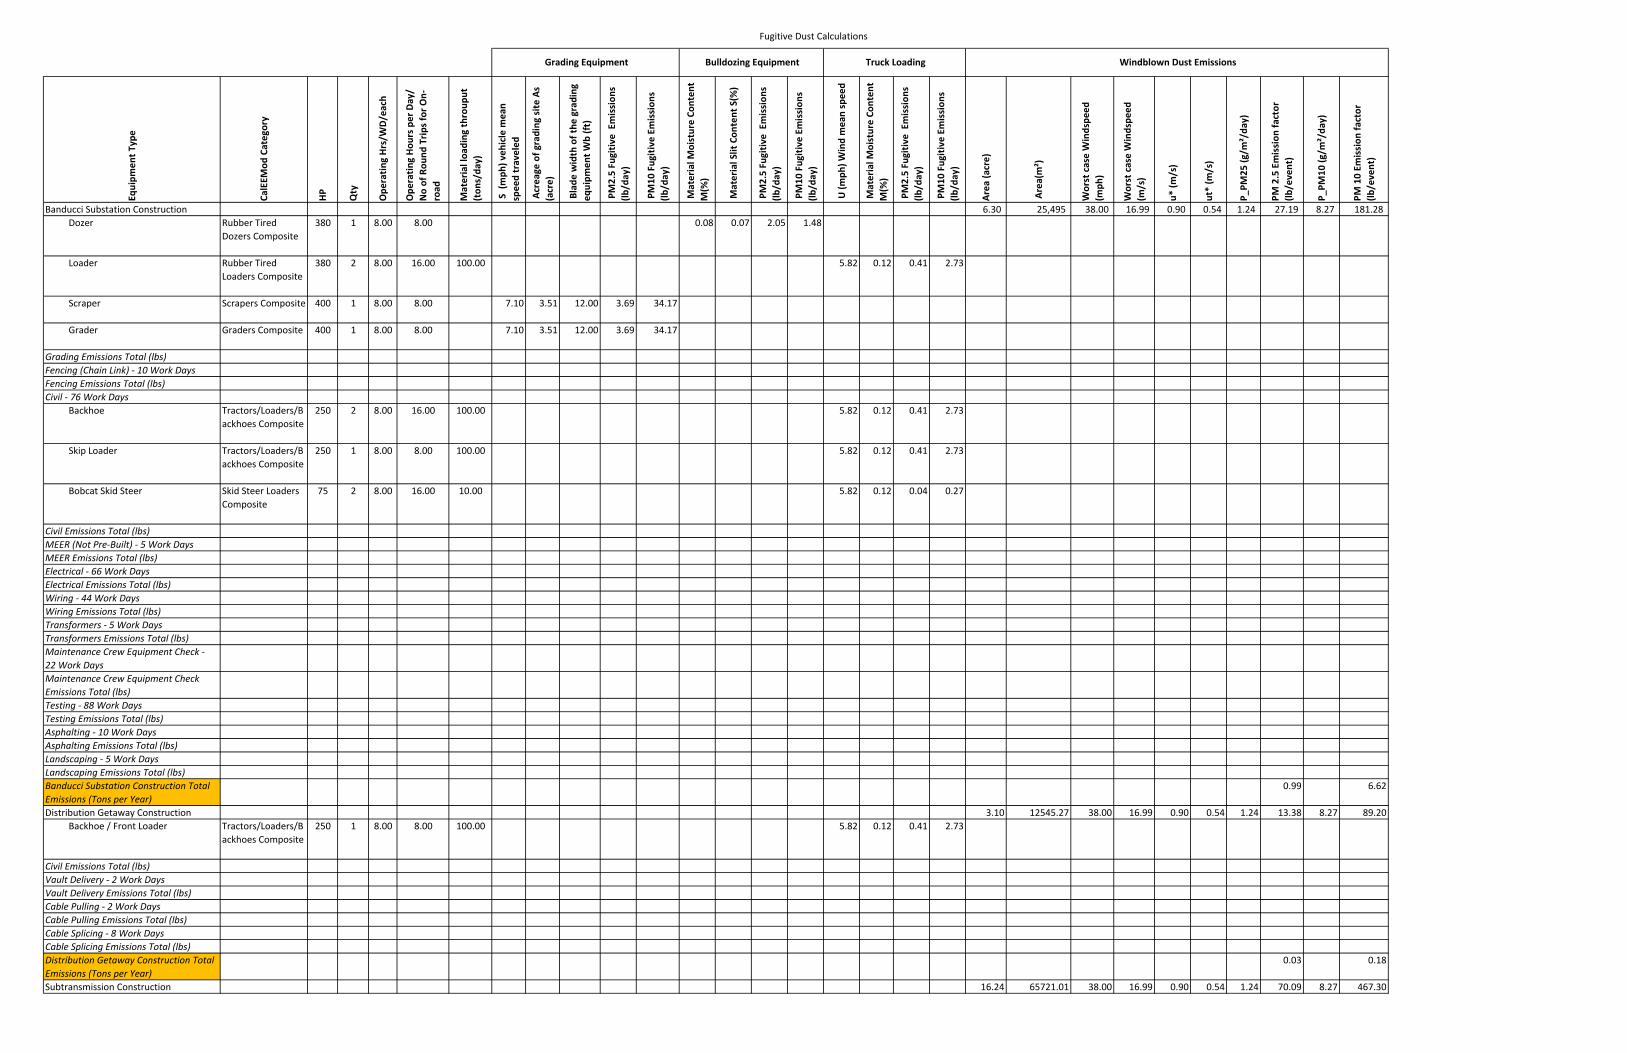
Fugitive Dust Calculations
Equipm
ent T
ype
CalEEM
od Category
HP
Qty
Ope
ratin
g Hrs/W
D/each
Ope
ratin
g Hou
rs per Day/
No of Rou
nd Trip
s for O
n‐road
Material loa
ding
throup
ut
(ton
s/da
y)
S (mph
) veh
icle m
ean
speed traveled
Acreage
of g
rading
site
As
(acre)
Blade
width of the
grading
eq
uipm
ent W
b (ft)
PM2.5 Fugitiv
e Emission
s (lb
/day)
PM10
Fug
itive
Emission
s (lb
/day)
Material M
oisture Co
nten
t M(%
)
Material Slit Con
tent S(%
)
PM2.5 Fugitiv
e Emission
s (lb
/day)
PM10
Fug
itive
Emission
s (lb
/day)
U (m
ph) W
ind mean speed
Material M
oisture Co
nten
t M(%
)
PM2.5 Fugitiv
e Emission
s (lb
/day)
PM10
Fug
itive
Emission
s (lb
/day)
Area
(acre)
Area(m²)
Worst case Windspe
ed
(mph
)
Worst case Windspe
ed
(m/s)
u* (m
/s)
ut* (m
/s)
P_PM
25 (g
/m²/da
y)
PM 2.5 Emission
factor
(lb/event)
P_PM
10 (g
/m²/da
y)
PM 10 Em
ission
factor
(lb/event)
Banducci Substation Construction 6.30 25,495 38.00 16.99 0.90 0.54 1.24 27.19 8.27 181.28 Dozer Rubber Tired
Dozers Composite380 1 8.00 8.00 0.08 0.07 2.05 1.48
Loader Rubber Tired Loaders Composite
380 2 8.00 16.00 100.00 5.82 0.12 0.41 2.73
Scraper Scrapers Composite 400 1 8.00 8.00 7.10 3.51 12.00 3.69 34.17
Grader Graders Composite 400 1 8.00 8.00 7.10 3.51 12.00 3.69 34.17
Grading Emissions Total (lbs)Fencing (Chain Link) ‐ 10 Work DaysFencing Emissions Total (lbs)Civil ‐ 76 Work Days Backhoe Tractors/Loaders/B
ackhoes Composite250 2 8.00 16.00 100.00 5.82 0.12 0.41 2.73
Skip Loader Tractors/Loaders/Backhoes Composite
250 1 8.00 8.00 100.00 5.82 0.12 0.41 2.73
Bobcat Skid Steer Skid Steer Loaders Composite
75 2 8.00 16.00 10.00 5.82 0.12 0.04 0.27
Civil Emissions Total (lbs)MEER (Not Pre‐Built) ‐ 5 Work DaysMEER Emissions Total (lbs)Electrical ‐ 66 Work DaysElectrical Emissions Total (lbs)Wiring ‐ 44 Work DaysWiring Emissions Total (lbs)Transformers ‐ 5 Work DaysTransformers Emissions Total (lbs)Maintenance Crew Equipment Check ‐ 22 Work DaysMaintenance Crew Equipment Check Emissions Total (lbs)Testing ‐ 88 Work DaysTesting Emissions Total (lbs)Asphalting ‐ 10 Work DaysAsphalting Emissions Total (lbs)Landscaping ‐ 5 Work DaysLandscaping Emissions Total (lbs)Banducci Substation Construction Total Emissions (Tons per Year)
0.99 6.62
Distribution Getaway Construction 3.10 12545.27 38.00 16.99 0.90 0.54 1.24 13.38 8.27 89.20 Backhoe / Front Loader Tractors/Loaders/B
ackhoes Composite250 1 8.00 8.00 100.00 5.82 0.12 0.41 2.73
Civil Emissions Total (lbs)Vault Delivery ‐ 2 Work DaysVault Delivery Emissions Total (lbs)Cable Pulling ‐ 2 Work DaysCable Pulling Emissions Total (lbs)Cable Splicing ‐ 8 Work DaysCable Splicing Emissions Total (lbs)Distribution Getaway Construction Total Emissions (Tons per Year)
0.03 0.18
Subtransmission Construction 16.24 65721.01 38.00 16.99 0.90 0.54 1.24 70.09 8.27 467.30
Grading Equipment Bulldozing Equipment Truck Loading Windblown Dust Emissions
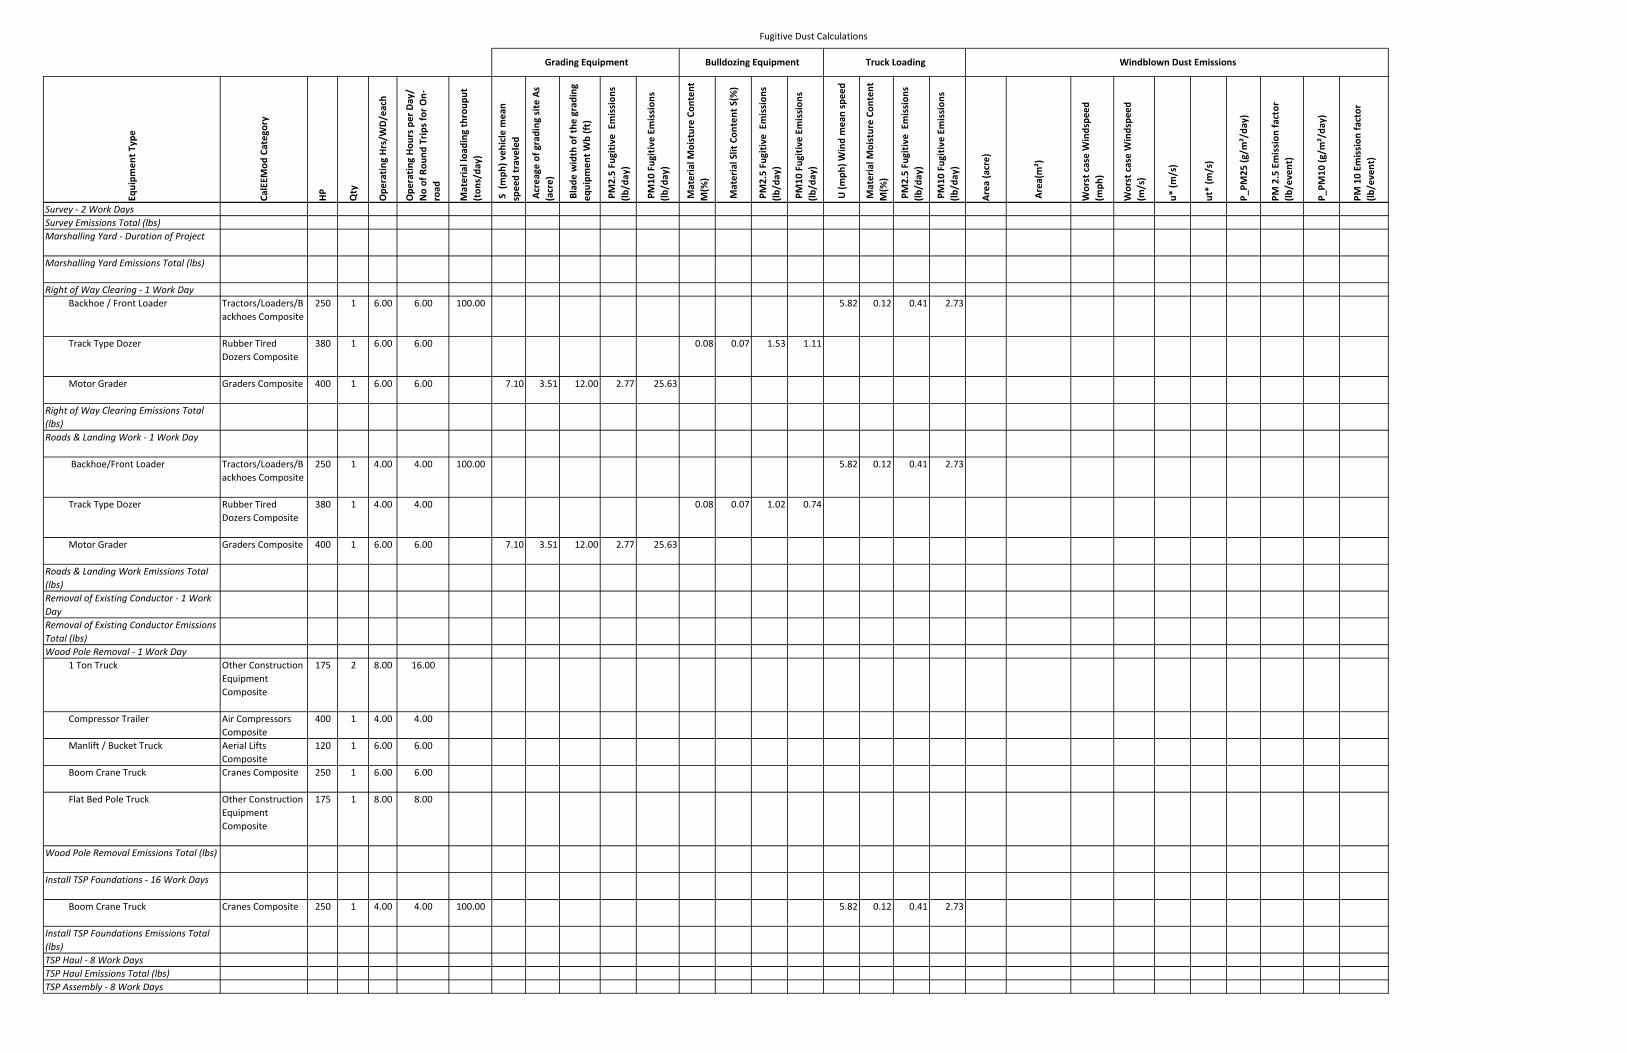
Fugitive Dust Calculations
Equipm
ent T
ype
CalEEM
od Category
HP
Qty
Ope
ratin
g Hrs/W
D/each
Ope
ratin
g Hou
rs per Day/
No of Rou
nd Trip
s for O
n‐road
Material loa
ding
throup
ut
(ton
s/da
y)
S (mph
) veh
icle m
ean
speed traveled
Acreage
of g
rading
site
As
(acre)
Blade
width of the
grading
eq
uipm
ent W
b (ft)
PM2.5 Fugitiv
e Emission
s (lb
/day)
PM10
Fug
itive
Emission
s (lb
/day)
Material M
oisture Co
nten
t M(%
)
Material Slit Con
tent S(%
)
PM2.5 Fugitiv
e Emission
s (lb
/day)
PM10
Fug
itive
Emission
s (lb
/day)
U (m
ph) W
ind mean speed
Material M
oisture Co
nten
t M(%
)
PM2.5 Fugitiv
e Emission
s (lb
/day)
PM10
Fug
itive
Emission
s (lb
/day)
Area
(acre)
Area(m²)
Worst case Windspe
ed
(mph
)
Worst case Windspe
ed
(m/s)
u* (m
/s)
ut* (m
/s)
P_PM
25 (g
/m²/da
y)
PM 2.5 Emission
factor
(lb/event)
P_PM
10 (g
/m²/da
y)
PM 10 Em
ission
factor
(lb/event)
Grading Equipment Bulldozing Equipment Truck Loading Windblown Dust Emissions
Survey ‐ 2 Work DaysSurvey Emissions Total (lbs)Marshalling Yard ‐ Duration of Project
Marshalling Yard Emissions Total (lbs)
Right of Way Clearing ‐ 1 Work Day Backhoe / Front Loader Tractors/Loaders/B
ackhoes Composite250 1 6.00 6.00 100.00 5.82 0.12 0.41 2.73
Track Type Dozer Rubber Tired Dozers Composite
380 1 6.00 6.00 0.08 0.07 1.53 1.11
Motor Grader Graders Composite 400 1 6.00 6.00 7.10 3.51 12.00 2.77 25.63
Right of Way Clearing Emissions Total (lbs)Roads & Landing Work ‐ 1 Work Day
Backhoe/Front Loader Tractors/Loaders/Backhoes Composite
250 1 4.00 4.00 100.00 5.82 0.12 0.41 2.73
Track Type Dozer Rubber Tired Dozers Composite
380 1 4.00 4.00 0.08 0.07 1.02 0.74
Motor Grader Graders Composite 400 1 6.00 6.00 7.10 3.51 12.00 2.77 25.63
Roads & Landing Work Emissions Total (lbs)Removal of Existing Conductor ‐ 1 Work DayRemoval of Existing Conductor Emissions Total (lbs)Wood Pole Removal ‐ 1 Work Day 1 Ton Truck Other Construction
Equipment Composite
175 2 8.00 16.00
Compressor Trailer Air Compressors Composite
400 1 4.00 4.00
Manlift / Bucket Truck Aerial Lifts Composite
120 1 6.00 6.00
Boom Crane Truck Cranes Composite 250 1 6.00 6.00
Flat Bed Pole Truck Other Construction Equipment Composite
175 1 8.00 8.00
Wood Pole Removal Emissions Total (lbs)
Install TSP Foundations ‐ 16 Work Days
Boom Crane Truck Cranes Composite 250 1 4.00 4.00 100.00 5.82 0.12 0.41 2.73
Install TSP Foundations Emissions Total (lbs)TSP Haul ‐ 8 Work DaysTSP Haul Emissions Total (lbs)TSP Assembly ‐ 8 Work Days
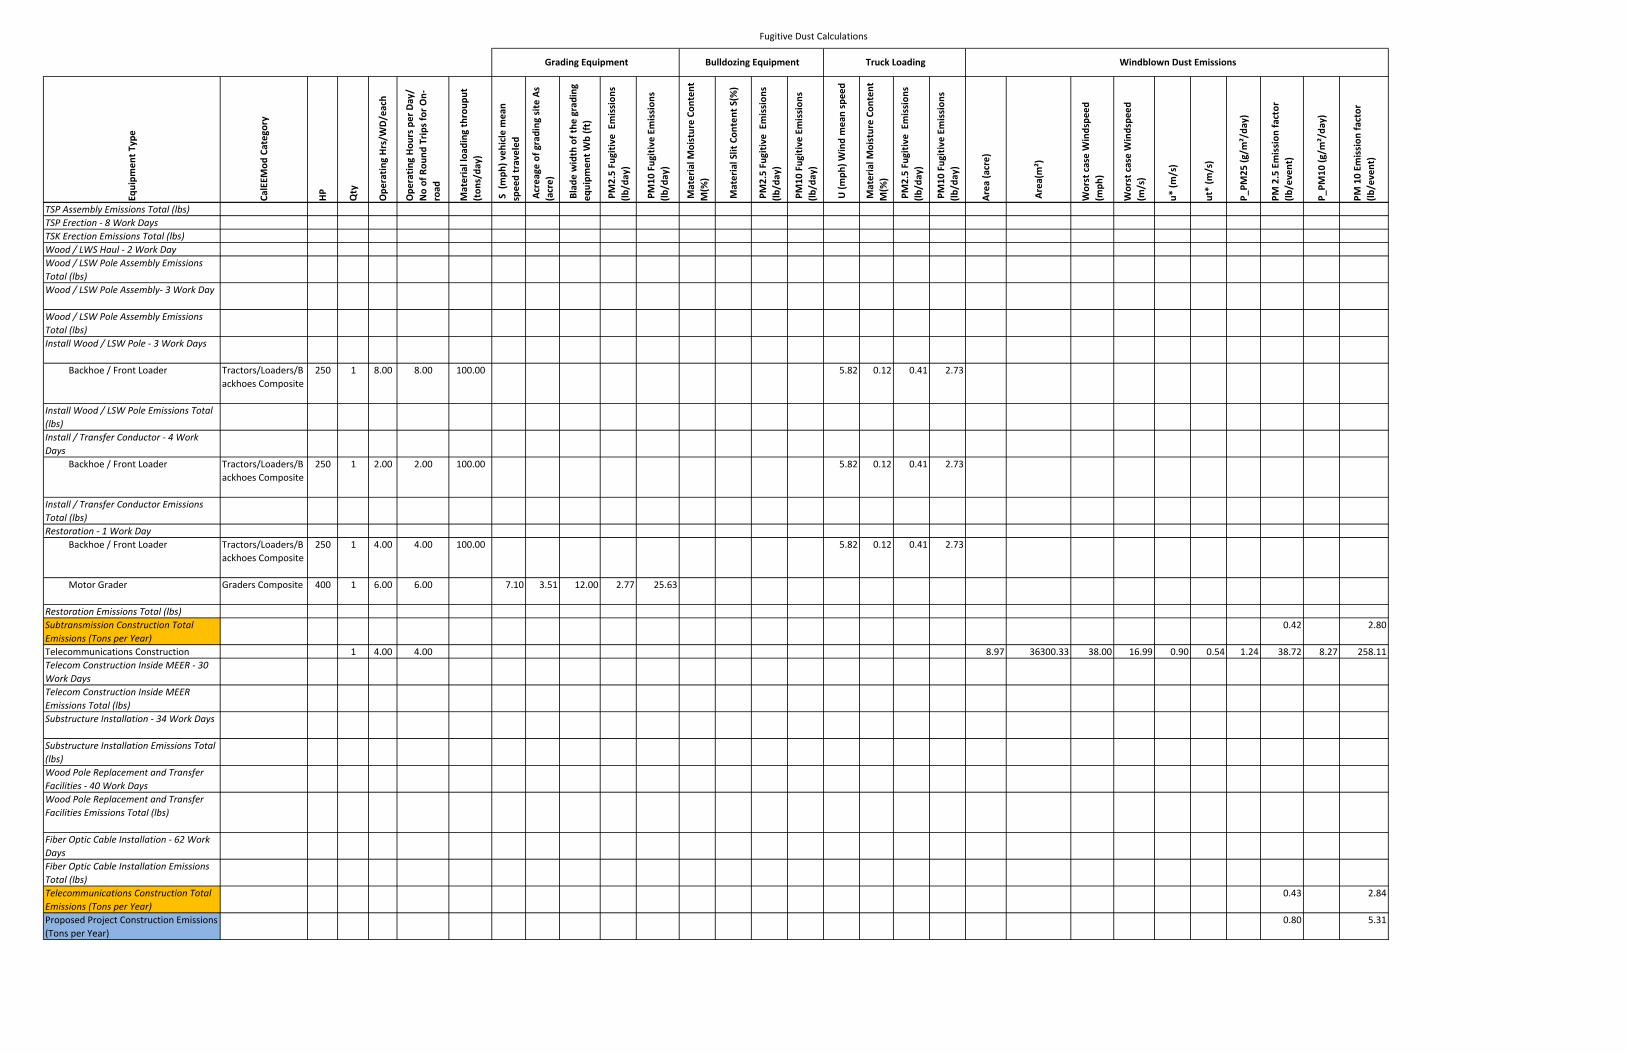
Fugitive Dust Calculations
Equipm
ent T
ype
CalEEM
od Category
HP
Qty
Ope
ratin
g Hrs/W
D/each
Ope
ratin
g Hou
rs per Day/
No of Rou
nd Trip
s for O
n‐road
Material loa
ding
throup
ut
(ton
s/da
y)
S (mph
) veh
icle m
ean
speed traveled
Acreage
of g
rading
site
As
(acre)
Blade
width of the
grading
eq
uipm
ent W
b (ft)
PM2.5 Fugitiv
e Emission
s (lb
/day)
PM10
Fug
itive
Emission
s (lb
/day)
Material M
oisture Co
nten
t M(%
)
Material Slit Con
tent S(%
)
PM2.5 Fugitiv
e Emission
s (lb
/day)
PM10
Fug
itive
Emission
s (lb
/day)
U (m
ph) W
ind mean speed
Material M
oisture Co
nten
t M(%
)
PM2.5 Fugitiv
e Emission
s (lb
/day)
PM10
Fug
itive
Emission
s (lb
/day)
Area
(acre)
Area(m²)
Worst case Windspe
ed
(mph
)
Worst case Windspe
ed
(m/s)
u* (m
/s)
ut* (m
/s)
P_PM
25 (g
/m²/da
y)
PM 2.5 Emission
factor
(lb/event)
P_PM
10 (g
/m²/da
y)
PM 10 Em
ission
factor
(lb/event)
Grading Equipment Bulldozing Equipment Truck Loading Windblown Dust Emissions
TSP Assembly Emissions Total (lbs)TSP Erection ‐ 8 Work DaysTSK Erection Emissions Total (lbs)Wood / LWS Haul ‐ 2 Work DayWood / LSW Pole Assembly Emissions Total (lbs)Wood / LSW Pole Assembly‐ 3 Work Day
Wood / LSW Pole Assembly Emissions Total (lbs)Install Wood / LSW Pole ‐ 3 Work Days
Backhoe / Front Loader Tractors/Loaders/Backhoes Composite
250 1 8.00 8.00 100.00 5.82 0.12 0.41 2.73
Install Wood / LSW Pole Emissions Total (lbs)Install / Transfer Conductor ‐ 4 Work Days Backhoe / Front Loader Tractors/Loaders/B
ackhoes Composite250 1 2.00 2.00 100.00 5.82 0.12 0.41 2.73
Install / Transfer Conductor Emissions Total (lbs)Restoration ‐ 1 Work Day Backhoe / Front Loader Tractors/Loaders/B
ackhoes Composite250 1 4.00 4.00 100.00 5.82 0.12 0.41 2.73
Motor Grader Graders Composite 400 1 6.00 6.00 7.10 3.51 12.00 2.77 25.63
Restoration Emissions Total (lbs)Subtransmission Construction Total Emissions (Tons per Year)
0.42 2.80
Telecommunications Construction 1 4.00 4.00 8.97 36300.33 38.00 16.99 0.90 0.54 1.24 38.72 8.27 258.11Telecom Construction Inside MEER ‐ 30 Work DaysTelecom Construction Inside MEER Emissions Total (lbs)Substructure Installation ‐ 34 Work Days
Substructure Installation Emissions Total (lbs)Wood Pole Replacement and Transfer Facilities ‐ 40 Work DaysWood Pole Replacement and Transfer Facilities Emissions Total (lbs)
Fiber Optic Cable Installation ‐ 62 Work DaysFiber Optic Cable Installation Emissions Total (lbs)Telecommunications Construction Total Emissions (Tons per Year)
0.43 2.84
Proposed Project Construction Emissions (Tons per Year)
0.80 5.31

OFFROAD2011 Emission FactorsSource: CalEEMod2013
g/bhp-hrCategory HP LF ROG CO NOX SOX PM10 PM2.5Aerial Lifts Composite 120 0.308 0.202 3.220 3.373 0.005 0.161 0.148Air Compressors Composite 400 0.480 0.354 1.198 3.455 0.005 0.113 0.113Bore/Drill Rigs Composite 175 0.500 0.308 3.040 4.066 0.005 0.186 0.171Cement and Mortar Mixers Composite 25 0.560 0.837 2.570 4.793 0.007 0.253 0.253Cranes Composite 250 0.288 0.483 4.177 6.264 0.005 0.260 0.239Crushing/Proc. Equipment Composite 400 0.780 0.377 1.230 3.702 0.005 0.121 0.121Excavators Composite 350 0.380 0.239 1.347 3.541 0.005 0.114 0.105Forklifts Composite 100 0.200 0.795 4.079 6.848 0.005 0.574 0.528Graders Composite 400 0.410 0.314 1.791 3.714 0.005 0.143 0.131Other Construction Equipment Composite 175 0.420 0.330 2.476 4.561 0.005 0.168 0.155Pavers Composite 100 0.415 0.683 3.773 6.199 0.005 0.483 0.444Paving Equipment Composite 100 0.360 0.677 3.837 6.370 0.005 0.486 0.447Plate Compactors Composite 15 0.430 0.661 3.469 4.142 0.008 0.161 0.161Rubber Tired Dozers Composite 380 0.400 0.707 6.165 8.058 0.005 0.376 0.346Rubber Tired Loaders Composite 380 0.360 0.421 2.407 5.194 0.005 0.196 0.180Scrapers Composite 400 0.480 0.479 3.898 6.233 0.005 0.251 0.231Skid Steer Loaders Composite 75 0.370 0.304 3.338 4.013 0.005 0.235 0.216Tractors/Loaders/Backhoes Composite 250 0.370 0.327 1.376 4.922 0.005 0.159 0.146Dumpers/Tenders 25 0.380 0.705 2.364 4.433 0.007 0.200 0.200

CO2 CH4516.703 0.153568.300 0.032524.052 0.155568.299 0.075516.578 0.153568.299 0.034511.945 0.151516.062 0.153517.377 0.153520.964 0.154514.377 0.152518.076 0.153568.299 0.059524.676 0.155512.510 0.152517.361 0.153517.062 0.153515.175 0.152568.300 0.063

EMFAC2011 emission factorsSource: CalEEMod2013Year: 2014, Kern County
(g/mile) LDA LDT1 LDT2 MDV LHD1 LHD2 MHDFleetMix 0.361 0.044 0.191 0.134 0.069 0.010 0.015CH4_IDLEX 0.000 0.000 0.000 0.000 0.001 0.001 0.010CH4_RUNEX 0.015 0.028 0.023 0.034 0.026 0.014 0.011CH4_STREX 0.018 0.038 0.029 0.041 0.025 0.010 0.000CO_IDLEX 0.000 0.000 0.000 0.000 0.155 0.105 2.033CO_RUNEX 1.642 4.314 2.469 3.664 2.893 1.685 2.856CO_STREX 3.542 7.127 6.061 8.107 5.629 1.834 37.842CO2_NBIO_IDLEX 0.000 0.000 0.000 0.000 9.245 10.364 603.153CO2_NBIO_RUNEX 296.819 347.930 416.536 544.569 737.901 597.576 1073.084CO2_NBIO_STREX 66.776 80.658 93.205 120.016 30.783 13.009 72.092NOX_IDLEX 0.000 0.000 0.000 0.000 0.095 0.162 7.445NOX_RUNEX 0.168 0.419 0.368 0.562 2.496 3.394 5.299NOX_STREX 0.242 0.378 0.540 0.757 1.044 0.381 2.998PM10_IDLEX 0.000 0.000 0.000 0.000 0.001 0.002 0.050PM10_PMBW 0.037 0.037 0.037 0.037 0.057 0.079 0.111PM10_PMTW 0.008 0.008 0.008 0.008 0.010 0.011 0.011PM10_RUNEX 0.002 0.004 0.002 0.003 0.029 0.039 0.145PM10_STREX 0.003 0.006 0.004 0.004 0.001 0.001 0.008PM25_IDLEX 0.000 0.000 0.000 0.000 0.001 0.002 0.046PM25_PMBW 0.016 0.016 0.016 0.016 0.024 0.034 0.048PM25_PMTW 0.002 0.002 0.002 0.002 0.003 0.003 0.003PM25_RUNEX 0.002 0.003 0.002 0.002 0.026 0.036 0.133PM25_STREX 0.003 0.005 0.004 0.004 0.001 0.001 0.007ROG_DIURN 0.085 0.188 0.124 0.119 0.003 0.001 0.005ROG_HTSK 0.171 0.320 0.220 0.220 0.070 0.029 0.272ROG_IDLEX 0.000 0.000 0.000 0.000 0.024 0.015 0.207ROG_RESTL 0.059 0.124 0.084 0.086 0.001 0.000 0.003ROG_RUNEX 0.058 0.193 0.083 0.123 0.287 0.221 0.365ROG_RUNLS 0.437 0.973 0.760 0.758 0.504 0.162 1.107ROG_STREX 0.307 0.631 0.509 0.720 0.434 0.165 2.903SO2_IDLEX 0.000 0.000 0.000 0.000 0.000 0.000 0.006SO2_RUNEX 0.003 0.004 0.005 0.006 0.007 0.006 0.010SO2_STREX 0.001 0.001 0.001 0.001 0.000 0.000 0.001TOG_DIURN 0.085 0.188 0.124 0.119 0.003 0.001 0.005TOG_HTSK 0.171 0.320 0.220 0.220 0.070 0.029 0.272TOG_IDLEX 0.000 0.000 0.000 0.000 0.026 0.016 0.235TOG_RESTL 0.059 0.124 0.084 0.086 0.001 0.000 0.003TOG_RUNEX 0.074 0.224 0.107 0.159 0.326 0.252 0.412TOG_RUNLS 0.437 0.973 0.760 0.758 0.504 0.162 1.107TOG_STREX 0.328 0.676 0.544 0.769 0.464 0.176 3.116* Emissions are in units of grams per mile

EMFAC2011 emission factorsSource: CalEEMod2013Year: 2014, Kern County
(g/mile)FleetMixCH4_IDLEXCH4_RUNEXCH4_STREXCO_IDLEXCO_RUNEXCO_STREXCO2_NBIO_IDLEXCO2_NBIO_RUNEXCO2_NBIO_STREXNOX_IDLEXNOX_RUNEXNOX_STREXPM10_IDLEXPM10_PMBWPM10_PMTWPM10_RUNEXPM10_STREXPM25_IDLEXPM25_PMBWPM25_PMTWPM25_RUNEXPM25_STREXROG_DIURNROG_HTSKROG_IDLEXROG_RESTLROG_RUNEXROG_RUNLSROG_STREXSO2_IDLEXSO2_RUNEXSO2_STREXTOG_DIURNTOG_HTSKTOG_IDLEXTOG_RESTLTOG_RUNEXTOG_RUNLSTOG_STREX* Emissions are in units of grams p
HHD OBUS UBUS MCY SBUS MH0.149 0.003 0.000 0.016 0.001 0.0060.023 0.023 0.000 0.000 0.005 0.0000.013 0.003 0.000 0.000 0.007 0.0000.000 0.000 0.000 0.000 0.000 0.0002.751 2.301 0.000 0.000 1.043 0.0001.595 3.914 1.798 41.880 3.364 7.440
141.563 21.274 10.220 10.836 28.375 13.094578.843 573.897 0.000 0.000 581.720 0.000
1698.150 1116.461 1493.874 159.358 1134.728 756.11276.859 41.020 88.079 46.076 126.191 33.6225.482 7.279 0.000 0.000 8.193 0.0006.382 6.092 5.861 1.364 8.036 2.1125.537 2.782 3.213 0.318 2.347 1.0430.019 0.059 0.000 0.000 0.028 0.0000.061 0.090 0.359 0.037 0.557 0.0510.036 0.010 0.008 0.008 0.011 0.0090.120 0.095 0.082 0.001 0.084 0.0350.008 0.002 0.000 0.003 0.005 0.0020.017 0.054 0.000 0.000 0.025 0.0000.026 0.038 0.154 0.016 0.239 0.0220.009 0.003 0.002 0.002 0.003 0.0020.111 0.087 0.075 0.001 0.078 0.0320.007 0.002 0.000 0.002 0.005 0.0020.005 0.001 0.005 1.049 0.028 1.5810.304 0.038 0.092 0.544 0.177 0.1010.499 0.490 0.000 0.000 0.116 0.0000.002 0.000 0.003 0.598 0.011 0.5070.285 0.358 0.181 3.467 0.482 0.2811.481 0.315 0.453 2.077 1.682 2.2636.542 1.419 1.940 2.415 2.090 0.8000.006 0.006 0.000 0.000 0.006 0.0000.016 0.011 0.015 0.002 0.011 0.0080.003 0.001 0.001 0.001 0.002 0.0010.005 0.001 0.005 1.049 0.028 1.5810.304 0.038 0.092 0.544 0.177 0.1010.568 0.558 0.000 0.000 0.132 0.0000.002 0.000 0.003 0.598 0.011 0.5070.324 0.407 0.217 3.762 0.531 0.3281.481 0.315 0.453 2.077 1.682 2.2637.027 1.520 2.071 2.598 2.232 0.857

Appendix D
Operational Emission Calculations
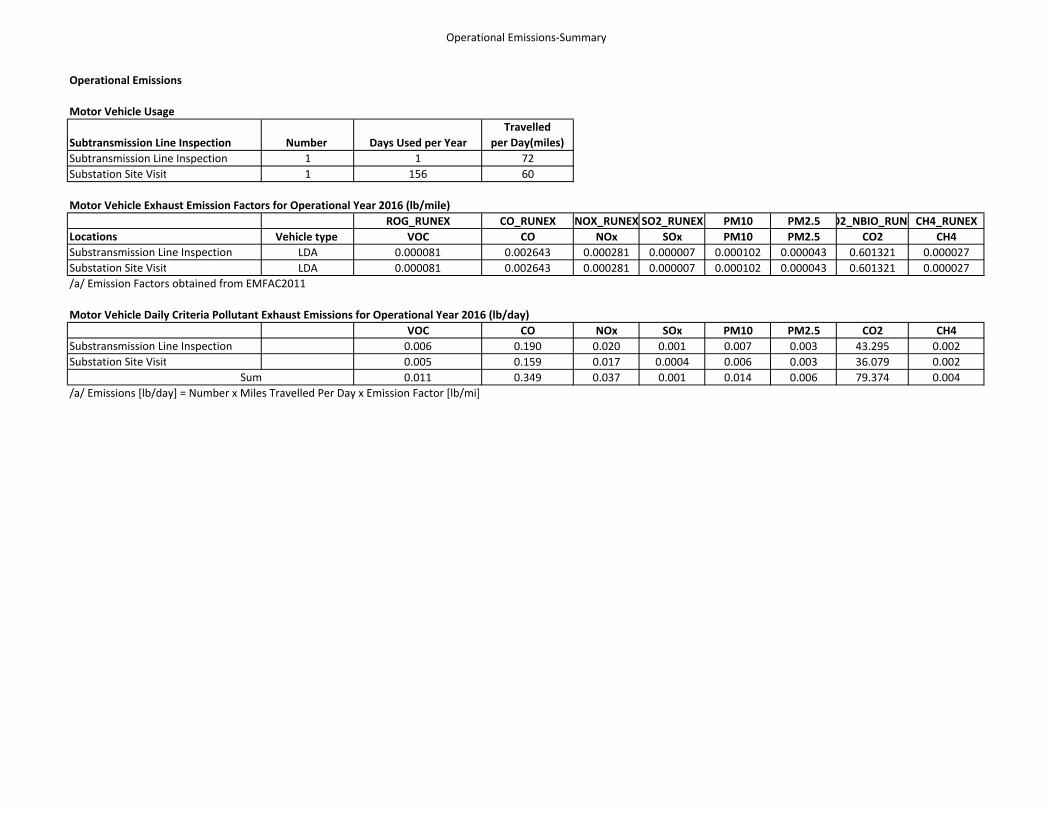
Operational Emissions‐Summary
Operational Emissions
Motor Vehicle Usage
Subtransmission Line Inspection Number Days Used per YearTravelled
per Day(miles)Subtransmission Line Inspection 1 1 72Substation Site Visit 1 156 60
Motor Vehicle Exhaust Emission Factors for Operational Year 2016 (lb/mile)ROG_RUNEX CO_RUNEX NOX_RUNEX SO2_RUNEX PM10 PM2.5 O2_NBIO_RUN CH4_RUNEX
Locations Vehicle type VOC CO NOx SOx PM10 PM2.5 CO2 CH4Substransmission Line Inspection LDA 0.000081 0.002643 0.000281 0.000007 0.000102 0.000043 0.601321 0.000027Substation Site Visit LDA 0.000081 0.002643 0.000281 0.000007 0.000102 0.000043 0.601321 0.000027/a/ Emission Factors obtained from EMFAC2011
Motor Vehicle Daily Criteria Pollutant Exhaust Emissions for Operational Year 2016 (lb/day)VOC CO NOx SOx PM10 PM2.5 CO2 CH4
Substransmission Line Inspection 0.006 0.190 0.020 0.001 0.007 0.003 43.295 0.002Substation Site Visit 0.005 0.159 0.017 0.0004 0.006 0.003 36.079 0.002
0.011 0.349 0.037 0.001 0.014 0.006 79.374 0.004/a/ Emissions [lb/day] = Number x Miles Travelled Per Day x Emission Factor [lb/mi]
Sum
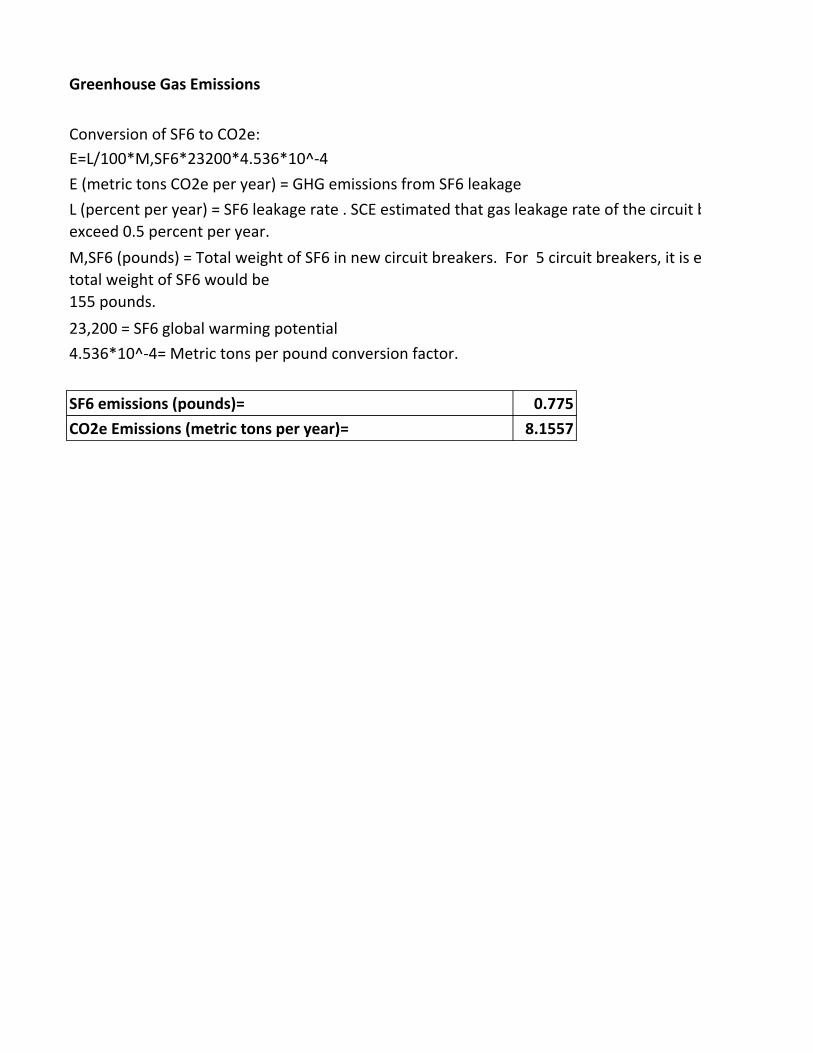
Greenhouse Gas Emissions
Conversion of SF6 to CO2e:
23,200 = SF6 global warming potential4.536*10^-4= Metric tons per pound conversion factor.
SF6 emissions (pounds)= 0.775CO2e Emissions (metric tons per year)= 8.1557
E=L/100*M,SF6*23200*4.536*10^-4E (metric tons CO2e per year) = GHG emissions from SF6 leakage
M,SF6 (pounds) = Total weight of SF6 in new circuit breakers. For 5 circuit breakers, it is e total weight of SF6 would be 155 pounds.
L (percent per year) = SF6 leakage rate . SCE estimated that gas leakage rate of the circuit b exceed 0.5 percent per year.
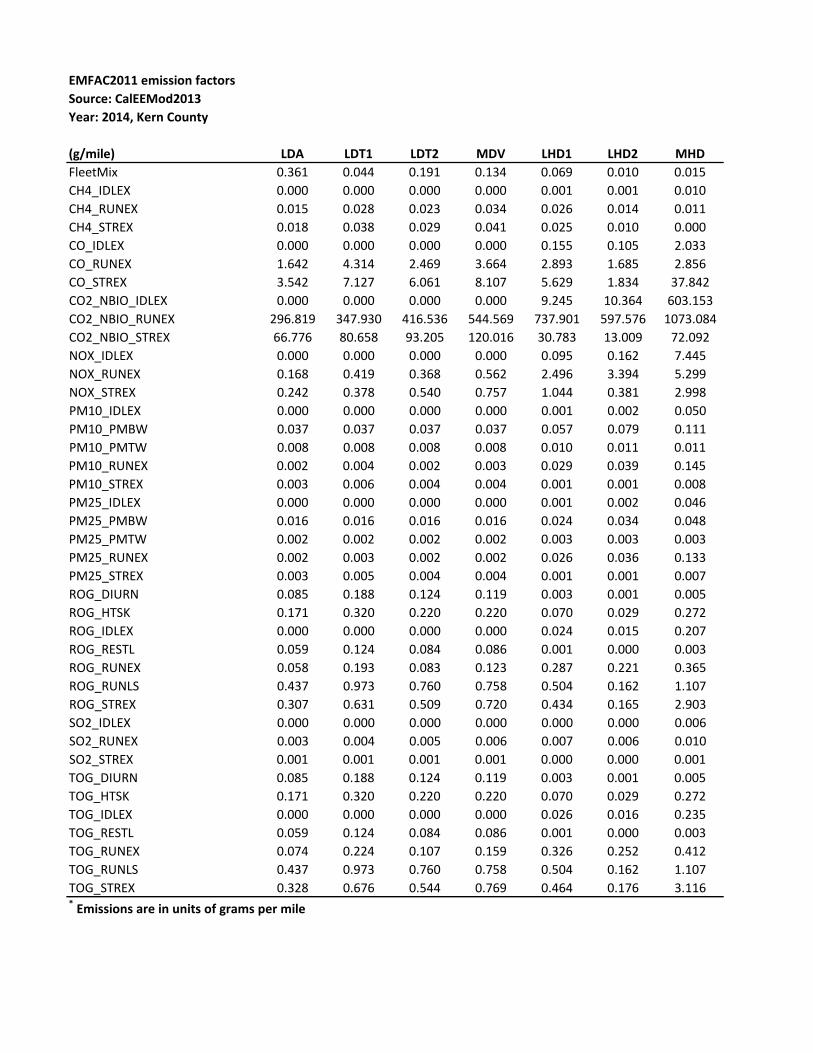
EMFAC2011 emission factorsSource: CalEEMod2013Year: 2014, Kern County
(g/mile) LDA LDT1 LDT2 MDV LHD1 LHD2 MHDFleetMix 0.361 0.044 0.191 0.134 0.069 0.010 0.015CH4_IDLEX 0.000 0.000 0.000 0.000 0.001 0.001 0.010CH4_RUNEX 0.015 0.028 0.023 0.034 0.026 0.014 0.011CH4_STREX 0.018 0.038 0.029 0.041 0.025 0.010 0.000CO_IDLEX 0.000 0.000 0.000 0.000 0.155 0.105 2.033CO_RUNEX 1.642 4.314 2.469 3.664 2.893 1.685 2.856CO_STREX 3.542 7.127 6.061 8.107 5.629 1.834 37.842CO2_NBIO_IDLEX 0.000 0.000 0.000 0.000 9.245 10.364 603.153CO2_NBIO_RUNEX 296.819 347.930 416.536 544.569 737.901 597.576 1073.084CO2_NBIO_STREX 66.776 80.658 93.205 120.016 30.783 13.009 72.092NOX_IDLEX 0.000 0.000 0.000 0.000 0.095 0.162 7.445NOX_RUNEX 0.168 0.419 0.368 0.562 2.496 3.394 5.299NOX_STREX 0.242 0.378 0.540 0.757 1.044 0.381 2.998PM10_IDLEX 0.000 0.000 0.000 0.000 0.001 0.002 0.050PM10_PMBW 0.037 0.037 0.037 0.037 0.057 0.079 0.111PM10_PMTW 0.008 0.008 0.008 0.008 0.010 0.011 0.011PM10_RUNEX 0.002 0.004 0.002 0.003 0.029 0.039 0.145PM10_STREX 0.003 0.006 0.004 0.004 0.001 0.001 0.008PM25_IDLEX 0.000 0.000 0.000 0.000 0.001 0.002 0.046PM25_PMBW 0.016 0.016 0.016 0.016 0.024 0.034 0.048PM25_PMTW 0.002 0.002 0.002 0.002 0.003 0.003 0.003PM25_RUNEX 0.002 0.003 0.002 0.002 0.026 0.036 0.133PM25_STREX 0.003 0.005 0.004 0.004 0.001 0.001 0.007ROG_DIURN 0.085 0.188 0.124 0.119 0.003 0.001 0.005ROG_HTSK 0.171 0.320 0.220 0.220 0.070 0.029 0.272ROG_IDLEX 0.000 0.000 0.000 0.000 0.024 0.015 0.207ROG_RESTL 0.059 0.124 0.084 0.086 0.001 0.000 0.003ROG_RUNEX 0.058 0.193 0.083 0.123 0.287 0.221 0.365ROG_RUNLS 0.437 0.973 0.760 0.758 0.504 0.162 1.107ROG_STREX 0.307 0.631 0.509 0.720 0.434 0.165 2.903SO2_IDLEX 0.000 0.000 0.000 0.000 0.000 0.000 0.006SO2_RUNEX 0.003 0.004 0.005 0.006 0.007 0.006 0.010SO2_STREX 0.001 0.001 0.001 0.001 0.000 0.000 0.001TOG_DIURN 0.085 0.188 0.124 0.119 0.003 0.001 0.005TOG_HTSK 0.171 0.320 0.220 0.220 0.070 0.029 0.272TOG_IDLEX 0.000 0.000 0.000 0.000 0.026 0.016 0.235TOG_RESTL 0.059 0.124 0.084 0.086 0.001 0.000 0.003TOG_RUNEX 0.074 0.224 0.107 0.159 0.326 0.252 0.412TOG_RUNLS 0.437 0.973 0.760 0.758 0.504 0.162 1.107TOG_STREX 0.328 0.676 0.544 0.769 0.464 0.176 3.116* Emissions are in units of grams per mile

EMFAC2011 emission factorsSource: CalEEMod2013Year: 2014, Kern County
(g/mile)FleetMixCH4_IDLEXCH4_RUNEXCH4_STREXCO_IDLEXCO_RUNEXCO_STREXCO2_NBIO_IDLEXCO2_NBIO_RUNEXCO2_NBIO_STREXNOX_IDLEXNOX_RUNEXNOX_STREXPM10_IDLEXPM10_PMBWPM10_PMTWPM10_RUNEXPM10_STREXPM25_IDLEXPM25_PMBWPM25_PMTWPM25_RUNEXPM25_STREXROG_DIURNROG_HTSKROG_IDLEXROG_RESTLROG_RUNEXROG_RUNLSROG_STREXSO2_IDLEXSO2_RUNEXSO2_STREXTOG_DIURNTOG_HTSKTOG_IDLEXTOG_RESTLTOG_RUNEXTOG_RUNLSTOG_STREX* Emissions are in units of grams p
HHD OBUS UBUS MCY SBUS MH0.149 0.003 0.000 0.016 0.001 0.0060.023 0.023 0.000 0.000 0.005 0.0000.013 0.003 0.000 0.000 0.007 0.0000.000 0.000 0.000 0.000 0.000 0.0002.751 2.301 0.000 0.000 1.043 0.0001.595 3.914 1.798 41.880 3.364 7.440
141.563 21.274 10.220 10.836 28.375 13.094578.843 573.897 0.000 0.000 581.720 0.000
1698.150 1116.461 1493.874 159.358 1134.728 756.11276.859 41.020 88.079 46.076 126.191 33.6225.482 7.279 0.000 0.000 8.193 0.0006.382 6.092 5.861 1.364 8.036 2.1125.537 2.782 3.213 0.318 2.347 1.0430.019 0.059 0.000 0.000 0.028 0.0000.061 0.090 0.359 0.037 0.557 0.0510.036 0.010 0.008 0.008 0.011 0.0090.120 0.095 0.082 0.001 0.084 0.0350.008 0.002 0.000 0.003 0.005 0.0020.017 0.054 0.000 0.000 0.025 0.0000.026 0.038 0.154 0.016 0.239 0.0220.009 0.003 0.002 0.002 0.003 0.0020.111 0.087 0.075 0.001 0.078 0.0320.007 0.002 0.000 0.002 0.005 0.0020.005 0.001 0.005 1.049 0.028 1.5810.304 0.038 0.092 0.544 0.177 0.1010.499 0.490 0.000 0.000 0.116 0.0000.002 0.000 0.003 0.598 0.011 0.5070.285 0.358 0.181 3.467 0.482 0.2811.481 0.315 0.453 2.077 1.682 2.2636.542 1.419 1.940 2.415 2.090 0.8000.006 0.006 0.000 0.000 0.006 0.0000.016 0.011 0.015 0.002 0.011 0.0080.003 0.001 0.001 0.001 0.002 0.0010.005 0.001 0.005 1.049 0.028 1.5810.304 0.038 0.092 0.544 0.177 0.1010.568 0.558 0.000 0.000 0.132 0.0000.002 0.000 0.003 0.598 0.011 0.5070.324 0.407 0.217 3.762 0.531 0.3281.481 0.315 0.453 2.077 1.682 2.2637.027 1.520 2.071 2.598 2.232 0.857

EMFAC 2011 Emission FactorsSource: CalEEMod2013Year: 2016, Kern County g/mile
LDA LDT1 LDT2 MDV LHD1 LHD2 MHD HHDColumn number: 2.000 3.000 4.000 5.000 6.000 7.000 8.000 9.000FleetMix 0.358 0.044 0.190 0.132 0.068 0.010 0.016 0.155PM2.5 0.019 0.020 0.020 0.020 0.050 0.070 0.133 0.113PM10 0.046 0.048 0.047 0.047 0.092 0.126 0.212 0.182CH4_IDLEX 0.000 0.000 0.000 0.000 0.001 0.001 0.008 0.025CH4_RUNEX 0.012 0.022 0.018 0.030 0.023 0.012 0.008 0.011CH4_STREX 0.012 0.027 0.022 0.035 0.022 0.008 0.000 0.000CO_IDLEX 0.000 0.000 0.000 0.000 0.153 0.105 1.843 3.001CO_RUNEX 1.199 2.982 1.875 3.031 2.391 1.383 1.925 1.379CO_STREX 2.698 5.644 4.669 6.991 4.943 1.524 31.000 119.670CO2_NBIO_IDLEX 0.000 0.000 0.000 0.000 9.057 10.153 604.141 566.973CO2_NBIO_RUNEX 272.755 322.972 390.483 516.960 722.967 586.061 1047.438 1653.981CO2_NBIO_STREX 61.761 74.304 87.920 114.794 30.361 12.514 63.848 66.487NOX_IDLEX 0.000 0.000 0.000 0.000 0.095 0.162 6.463 4.458NOX_RUNEX 0.127 0.313 0.274 0.468 2.127 2.928 3.781 4.378NOX_STREX 0.181 0.308 0.412 0.659 0.990 0.363 2.584 5.201PM10_IDLEX 0.000 0.000 0.000 0.000 0.001 0.002 0.027 0.011PM10_PMBW 0.037 0.037 0.037 0.037 0.057 0.079 0.111 0.061PM10_PMTW 0.008 0.008 0.008 0.008 0.010 0.011 0.011 0.036PM10_RUNEX 0.002 0.003 0.002 0.002 0.026 0.036 0.090 0.084PM10_STREX 0.003 0.005 0.004 0.004 0.001 0.000 0.006 0.005PM25_IDLEX 0.000 0.000 0.000 0.000 0.001 0.002 0.024 0.011PM25_PMBW 0.016 0.016 0.016 0.016 0.024 0.034 0.048 0.026PM25_PMTW 0.002 0.002 0.002 0.002 0.003 0.003 0.003 0.009PM25_RUNEX 0.002 0.003 0.002 0.002 0.024 0.033 0.083 0.078PM25_STREX 0.003 0.004 0.003 0.004 0.001 0.000 0.005 0.004ROG_DIURN 0.065 0.150 0.104 0.115 0.003 0.001 0.004 0.004ROG_HTSK 0.136 0.252 0.189 0.221 0.067 0.025 0.193 0.204ROG_IDLEX 0.000 0.000 0.000 0.000 0.024 0.015 0.165 0.534ROG_RESTL 0.047 0.101 0.074 0.086 0.001 0.000 0.002 0.002ROG_RUNEX 0.037 0.118 0.059 0.098 0.241 0.191 0.247 0.244ROG_RUNLS 0.331 0.792 0.625 0.735 0.483 0.141 0.831 0.998ROG_STREX 0.215 0.463 0.377 0.607 0.383 0.133 2.223 4.944SO2_IDLEX 0.000 0.000 0.000 0.000 0.000 0.000 0.006 0.006SO2_RUNEX 0.003 0.004 0.005 0.006 0.007 0.006 0.010 0.016SO2_STREX 0.001 0.001 0.001 0.001 0.000 0.000 0.001 0.003TOG_DIURN 0.065 0.150 0.104 0.115 0.003 0.001 0.004 0.004TOG_HTSK 0.136 0.252 0.189 0.221 0.067 0.025 0.193 0.204TOG_IDLEX 0.000 0.000 0.000 0.000 0.025 0.016 0.188 0.607TOG_RESTL 0.047 0.101 0.074 0.086 0.001 0.000 0.002 0.002TOG_RUNEX 0.049 0.142 0.078 0.129 0.276 0.219 0.280 0.278TOG_RUNLS 0.331 0.792 0.625 0.735 0.483 0.141 0.831 0.998TOG_STREX 0.230 0.495 0.403 0.649 0.409 0.142 2.383 5.304* Emissions are in units of grams per mile

EMFAC 2011 Emission Source: CalEEMod201Year: 2016, Kern Coun
Column number: FleetMixPM2.5PM10CH4_IDLEXCH4_RUNEXCH4_STREXCO_IDLEXCO_RUNEXCO_STREXCO2_NBIO_IDLEXCO2_NBIO_RUNEXCO2_NBIO_STREXNOX_IDLEXNOX_RUNEXNOX_STREXPM10_IDLEXPM10_PMBWPM10_PMTWPM10_RUNEXPM10_STREXPM25_IDLEXPM25_PMBWPM25_PMTWPM25_RUNEXPM25_STREXROG_DIURNROG_HTSKROG_IDLEXROG_RESTLROG_RUNEXROG_RUNLSROG_STREXSO2_IDLEXSO2_RUNEXSO2_STREXTOG_DIURNTOG_HTSKTOG_IDLEXTOG_RESTLTOG_RUNEXTOG_RUNLSTOG_STREX* Emissions are in unit
OBUS UBUS MCY SBUS MH10.000 11.000 12.000 13.000 14.0000.003 0.000 0.016 0.001 0.0060.088 0.227 0.018 0.320 0.0520.152 0.445 0.045 0.653 0.0900.019 0.000 0.000 0.005 0.0000.003 0.000 0.000 0.008 0.0000.000 0.000 0.000 0.000 0.0002.364 0.000 0.000 1.062 0.0003.004 1.744 37.503 3.115 4.949
18.810 10.220 11.047 26.431 10.685571.353 0.000 0.000 570.820 0.000
1096.045 1452.560 163.365 1110.494 740.04037.814 86.290 43.331 123.629 31.5005.938 0.000 0.000 8.092 0.0004.438 5.563 1.340 7.952 1.8102.555 3.237 0.318 2.230 0.9180.018 0.000 0.000 0.027 0.0000.091 0.359 0.037 0.557 0.0510.010 0.008 0.008 0.011 0.0090.051 0.078 0.001 0.086 0.0310.002 0.000 0.002 0.004 0.0020.016 0.000 0.000 0.025 0.0000.039 0.154 0.016 0.239 0.0220.003 0.002 0.002 0.003 0.0020.047 0.072 0.001 0.079 0.0280.001 0.000 0.001 0.004 0.0010.001 0.006 0.999 0.028 1.3550.031 0.102 0.470 0.170 0.0860.414 0.000 0.000 0.117 0.0000.000 0.004 0.563 0.011 0.4380.263 0.171 3.320 0.463 0.1970.264 0.550 1.675 1.553 2.1201.196 1.953 2.345 2.004 0.6170.006 0.000 0.000 0.006 0.0000.011 0.015 0.002 0.011 0.0080.001 0.001 0.001 0.002 0.0010.001 0.006 0.999 0.028 1.3550.031 0.102 0.470 0.170 0.0860.471 0.000 0.000 0.133 0.0000.000 0.004 0.563 0.011 0.4380.299 0.205 3.607 0.511 0.2340.264 0.550 1.675 1.553 2.1201.279 2.085 2.520 2.139 0.661
Appendix E
Greenhouse Gas Emission Calculations
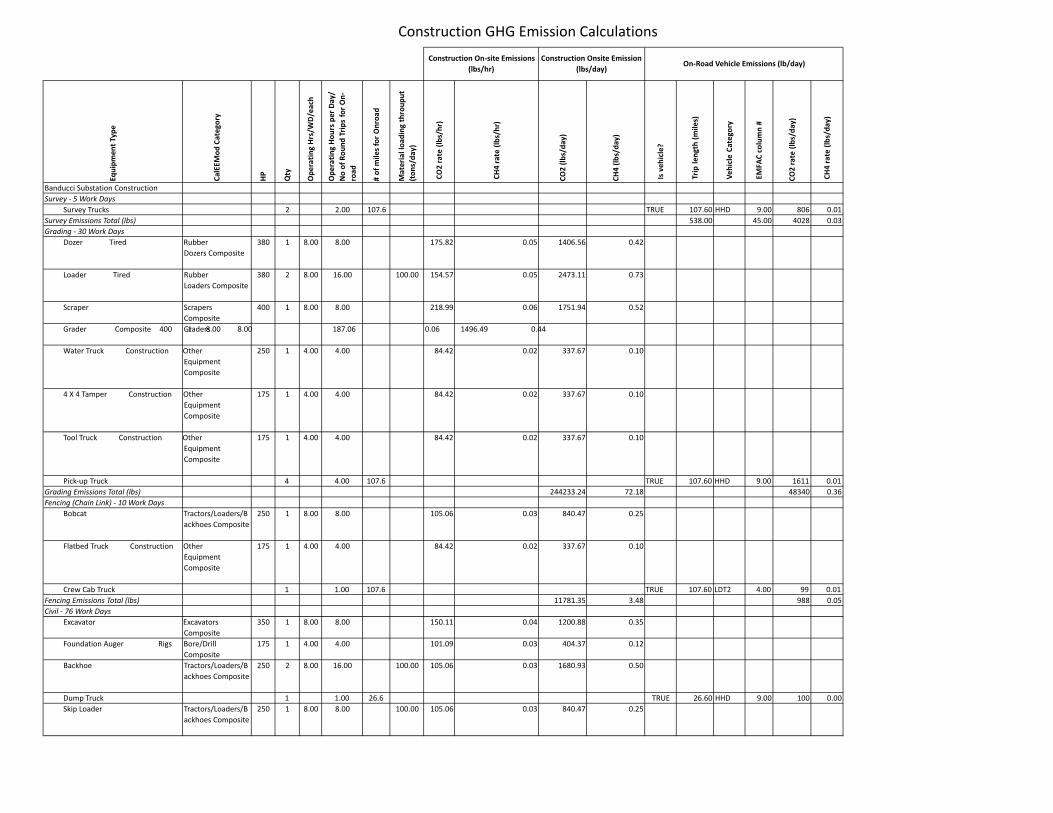
Construction GHG Emission Calculations
Equipmen
tType
CalEEModCatego
ry
HP
Qty
OperatingHrs/W
D/each
OperatingHours
per
Day/
NoofRoundTripsforOn‐
road
#ofmilesforOnroad
Materialload
ingthrouput
(tons/day)
CO2rate
(lbs/hr)
CH4rate
(lbs/hr)
CO2(lbs/day)
CH4(lbs/day)
Isvehicle?
Trip
length(m
iles)
Vehicle
Catego
ry
EMFA
Ccolumn#
CO2rate
(lbs/day)
CH4rate
(lbs/day)
Banducci Substation Construction
Survey ‐ 5 Work Days
Survey Trucks 2 2.00 107.6 TRUE 107.60 HHD 9.00 806 0.01
Survey Emissions Total (lbs) 538.00 45.00 4028 0.03
Grading ‐ 30 Work Days
Dozer Tired Rubber
Dozers Composite
380 1 8.00 8.00 175.82 0.05 1406.56 0.42
Loader Tired Rubber
Loaders Composite
380 2 8.00 16.00 100.00 154.57 0.05 2473.11 0.73
Scraper Scrapers
Composite
400 1 8.00 8.00 218.99 0.06 1751.94 0.52
Grader Composite 400 G1rader8s.00 8.00 187.06 0.06 1496.49 0.44
Water Truck Construction Other
Equipment
Composite
250 1 4.00 4.00 84.42 0.02 337.67 0.10
4 X 4 Tamper Construction Other
Equipment
Composite
175 1 4.00 4.00 84.42 0.02 337.67 0.10
Tool Truck Construction Other
Equipment
Composite
175 1 4.00 4.00 84.42 0.02 337.67 0.10
Pick‐up Truck 4 4.00 107.6 TRUE 107.60 HHD 9.00 1611 0.01
Grading Emissions Total (lbs) 244233.24 72.18 48340 0.36
Fencing (Chain Link) ‐ 10 Work Days
Bobcat Tractors/Loaders/B
ackhoes Composite
250 1 8.00 8.00 105.06 0.03 840.47 0.25
Flatbed Truck Construction Other
Equipment
Composite
175 1 4.00 4.00 84.42 0.02 337.67 0.10
Crew Cab Truck 1 1.00 107.6 TRUE 107.60 LDT2 4.00 99 0.01
Fencing Emissions Total (lbs) 11781.35 3.48 988 0.05
Civil ‐ 76 Work Days
Excavator Excavators
Composite
350 1 8.00 8.00 150.11 0.04 1200.88 0.35
Foundation Auger Rigs Bore/Drill
Composite
175 1 4.00 4.00 101.09 0.03 404.37 0.12
Backhoe Tractors/Loaders/B
ackhoes Composite
250 2 8.00 16.00 100.00 105.06 0.03 1680.93 0.50
Dump Truck 1 1.00 26.6 TRUE 26.60 HHD 9.00 100 0.00
Skip Loader Tractors/Loaders/B
ackhoes Composite
250 1 8.00 8.00 100.00 105.06 0.03 840.47 0.25
Construction On‐site Emissions
(lbs/hr)
Construction Onsite Emission
(lbs/day)On‐Road Vehicle Emissions (lb/day)
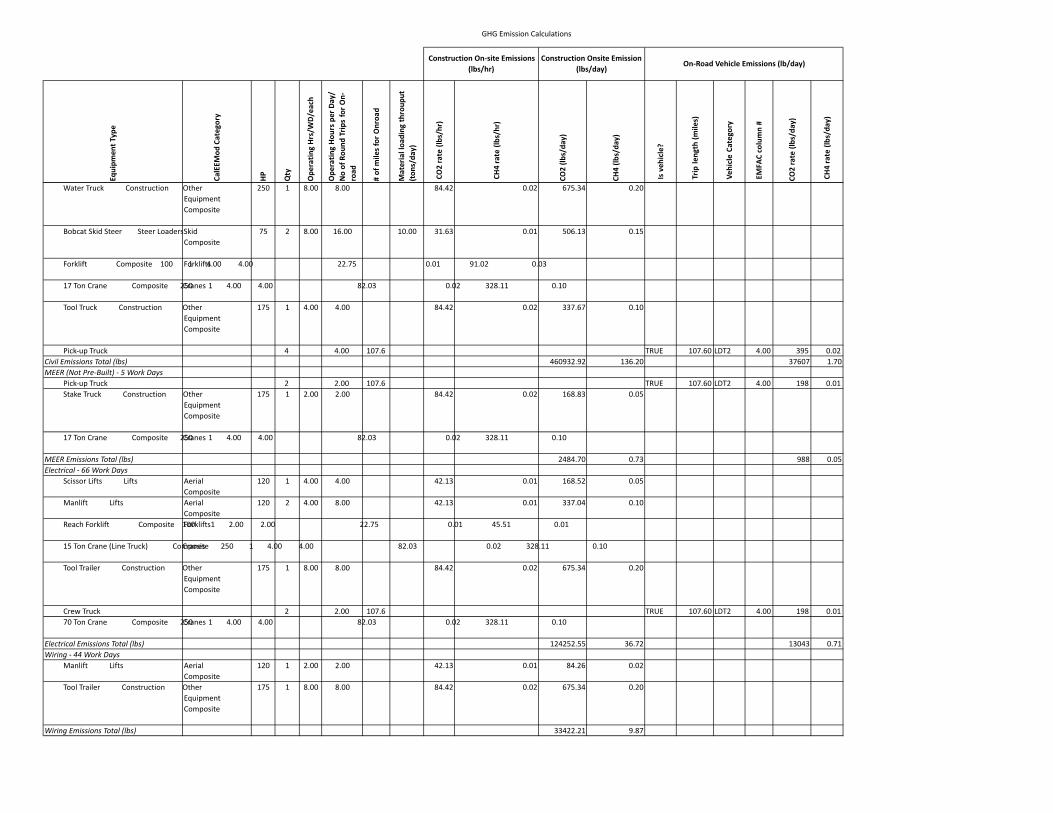
GHG Emission Calculations
Equipmen
tType
CalEEModCatego
ry
HP
Qty
OperatingHrs/W
D/each
OperatingHours
per
Day/
NoofRoundTripsforOn‐
road
#ofmilesforOnroad
Materialload
ingthrouput
(tons/day)
CO2rate
(lbs/hr)
CH4rate
(lbs/hr)
CO2(lbs/day)
CH4(lbs/day)
Isvehicle?
Trip
length(m
iles)
Vehicle
Catego
ry
EMFA
Ccolumn#
CO2rate
(lbs/day)
CH4rate
(lbs/day)
Construction On‐site Emissions
(lbs/hr)
Construction Onsite Emission
(lbs/day)On‐Road Vehicle Emissions (lb/day)
Water Truck Construction Other
Equipment
Composite
250 1 8.00 8.00 84.42 0.02 675.34 0.20
Bobcat Skid Steer Steer LoadersSkid
Composite
75 2 8.00 16.00 10.00 31.63 0.01 506.13 0.15
Forklift Composite 100 Fo1rklift4s.00 4.00 22.75 0.01 91.02 0.03
17 Ton Crane Composite 2C5r0anes 1 4.00 4.00 82.03 0.02 328.11 0.10
Tool Truck Construction Other
Equipment
Composite
175 1 4.00 4.00 84.42 0.02 337.67 0.10
Pick‐up Truck 4 4.00 107.6 TRUE 107.60 LDT2 4.00 395 0.02
Civil Emissions Total (lbs) 460932.92 136.20 37607 1.70
MEER (Not Pre‐Built) ‐ 5 Work Days
Pick‐up Truck 2 2.00 107.6 TRUE 107.60 LDT2 4.00 198 0.01
Stake Truck Construction Other
Equipment
Composite
175 1 2.00 2.00 84.42 0.02 168.83 0.05
17 Ton Crane Composite 2C5r0anes 1 4.00 4.00 82.03 0.02 328.11 0.10
MEER Emissions Total (lbs) 2484.70 0.73 988 0.05
Electrical ‐ 66 Work Days
Scissor Lifts Lifts Aerial
Composite
120 1 4.00 4.00 42.13 0.01 168.52 0.05
Manlift Lifts Aerial
Composite
120 2 4.00 8.00 42.13 0.01 337.04 0.10
Reach Forklift Composite 1F0o0rklifts1 2.00 2.00 22.75 0.01 45.51 0.01
15 Ton Crane (Line Truck) ComCrpaonseitse 250 1 4.00 4.00 82.03 0.02 328.11 0.10
Tool Trailer Construction Other
Equipment
Composite
175 1 8.00 8.00 84.42 0.02 675.34 0.20
Crew Truck 2 2.00 107.6 TRUE 107.60 LDT2 4.00 198 0.01
70 Ton Crane Composite 2C5r0anes 1 4.00 4.00 82.03 0.02 328.11 0.10
Electrical Emissions Total (lbs) 124252.55 36.72 13043 0.71
Wiring ‐ 44 Work Days
Manlift Lifts Aerial
Composite
120 1 2.00 2.00 42.13 0.01 84.26 0.02
Tool Trailer Construction Other
Equipment
Composite
175 1 8.00 8.00 84.42 0.02 675.34 0.20
Wiring Emissions Total (lbs) 33422.21 9.87
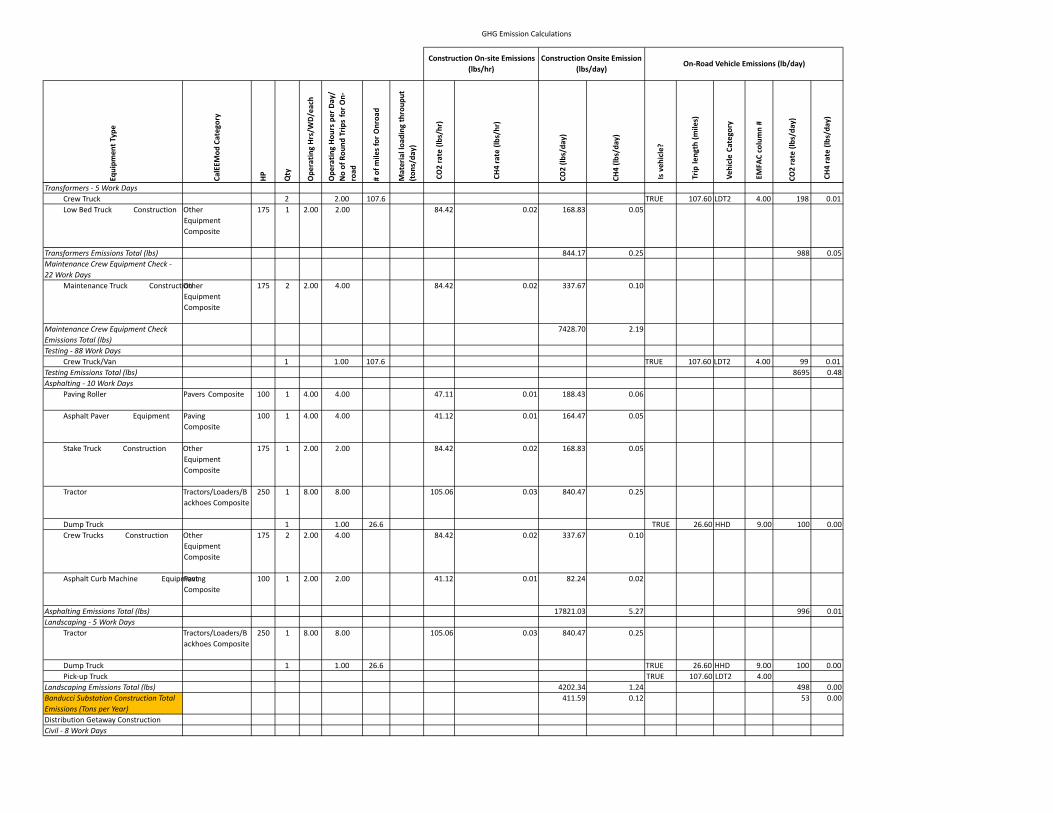
GHG Emission Calculations
Equipmen
tType
CalEEModCatego
ry
HP
Qty
OperatingHrs/W
D/each
OperatingHours
per
Day/
NoofRoundTripsforOn‐
road
#ofmilesforOnroad
Materialload
ingthrouput
(tons/day)
CO2rate
(lbs/hr)
CH4rate
(lbs/hr)
CO2(lbs/day)
CH4(lbs/day)
Isvehicle?
Trip
length(m
iles)
Vehicle
Catego
ry
EMFA
Ccolumn#
CO2rate
(lbs/day)
CH4rate
(lbs/day)
Construction On‐site Emissions
(lbs/hr)
Construction Onsite Emission
(lbs/day)On‐Road Vehicle Emissions (lb/day)
Transformers ‐ 5 Work Days
Crew Truck 2 2.00 107.6 TRUE 107.60 LDT2 4.00 198 0.01
Low Bed Truck Construction Other
Equipment
Composite
175 1 2.00 2.00 84.42 0.02 168.83 0.05
Transformers Emissions Total (lbs) 844.17 0.25 988 0.05
Maintenance Crew Equipment Check ‐
22 Work Days
Maintenance Truck ConstructiOonther
Equipment
Composite
175 2 2.00 4.00 84.42 0.02 337.67 0.10
Maintenance Crew Equipment Check
Emissions Total (lbs)
7428.70 2.19
Testing ‐ 88 Work Days
Crew Truck/Van 1 1.00 107.6 TRUE 107.60 LDT2 4.00 99 0.01
Testing Emissions Total (lbs) 8695 0.48
Asphalting ‐ 10 Work Days
Paving Roller Pavers Composite 100 1 4.00 4.00 47.11 0.01 188.43 0.06
Asphalt Paver Equipment Paving
Composite
100 1 4.00 4.00 41.12 0.01 164.47 0.05
Stake Truck Construction Other
Equipment
Composite
175 1 2.00 2.00 84.42 0.02 168.83 0.05
Tractor Tractors/Loaders/B
ackhoes Composite
250 1 8.00 8.00 105.06 0.03 840.47 0.25
Dump Truck 1 1.00 26.6 TRUE 26.60 HHD 9.00 100 0.00
Crew Trucks Construction Other
Equipment
Composite
175 2 2.00 4.00 84.42 0.02 337.67 0.10
Asphalt Curb Machine EquipmPeanvitng
Composite
100 1 2.00 2.00 41.12 0.01 82.24 0.02
Asphalting Emissions Total (lbs) 17821.03 5.27 996 0.01
Landscaping ‐ 5 Work Days
Tractor Tractors/Loaders/B
ackhoes Composite
250 1 8.00 8.00 105.06 0.03 840.47 0.25
Dump Truck 1 1.00 26.6 TRUE 26.60 HHD 9.00 100 0.00
Pick‐up Truck TRUE 107.60 LDT2 4.00
Landscaping Emissions Total (lbs) 4202.34 1.24 498 0.00
Banducci Substation Construction Total
Emissions (Tons per Year)
411.59 0.12 53 0.00
Distribution Getaway Construction
Civil ‐ 8 Work Days
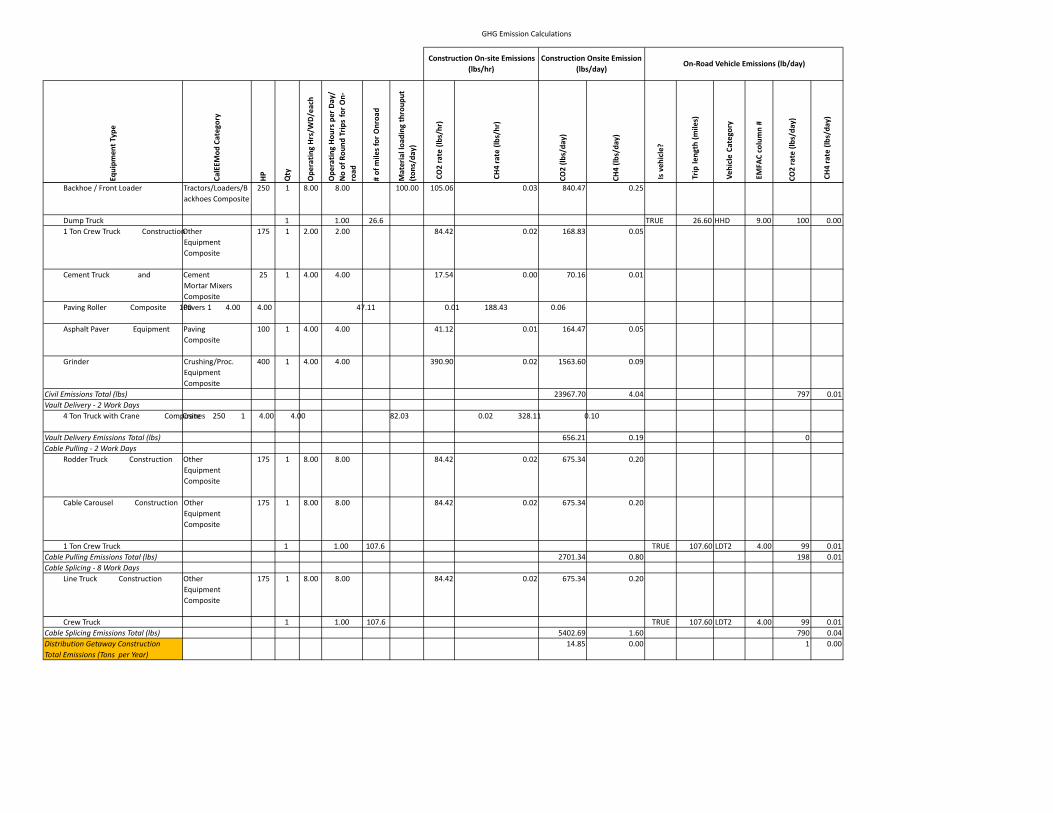
GHG Emission Calculations
Equipmen
tType
CalEEModCatego
ry
HP
Qty
OperatingHrs/W
D/each
OperatingHours
per
Day/
NoofRoundTripsforOn‐
road
#ofmilesforOnroad
Materialload
ingthrouput
(tons/day)
CO2rate
(lbs/hr)
CH4rate
(lbs/hr)
CO2(lbs/day)
CH4(lbs/day)
Isvehicle?
Trip
length(m
iles)
Vehicle
Catego
ry
EMFA
Ccolumn#
CO2rate
(lbs/day)
CH4rate
(lbs/day)
Construction On‐site Emissions
(lbs/hr)
Construction Onsite Emission
(lbs/day)On‐Road Vehicle Emissions (lb/day)
Backhoe / Front Loader Tractors/Loaders/B
ackhoes Composite
250 1 8.00 8.00 100.00 105.06 0.03 840.47 0.25
Dump Truck 1 1.00 26.6 TRUE 26.60 HHD 9.00 100 0.00
1 Ton Crew Truck ConstructionOther
Equipment
Composite
175 1 2.00 2.00 84.42 0.02 168.83 0.05
Cement Truck and Cement
Mortar Mixers
Composite
25 1 4.00 4.00 17.54 0.00 70.16 0.01
Paving Roller Composite 1P0a0vers 1 4.00 4.00 47.11 0.01 188.43 0.06
Asphalt Paver Equipment Paving
Composite
100 1 4.00 4.00 41.12 0.01 164.47 0.05
Grinder Crushing/Proc.
Equipment
Composite
400 1 4.00 4.00 390.90 0.02 1563.60 0.09
Civil Emissions Total (lbs) 23967.70 4.04 797 0.01
Vault Delivery ‐ 2 Work Days
4 Ton Truck with Crane CompCorsaintees 250 1 4.00 4.00 82.03 0.02 328.11 0.10
Vault Delivery Emissions Total (lbs) 656.21 0.19 0
Cable Pulling ‐ 2 Work Days
Rodder Truck Construction Other
Equipment
Composite
175 1 8.00 8.00 84.42 0.02 675.34 0.20
Cable Carousel Construction Other
Equipment
Composite
175 1 8.00 8.00 84.42 0.02 675.34 0.20
1 Ton Crew Truck 1 1.00 107.6 TRUE 107.60 LDT2 4.00 99 0.01
Cable Pulling Emissions Total (lbs) 2701.34 0.80 198 0.01
Cable Splicing ‐ 8 Work Days
Line Truck Construction Other
Equipment
Composite
175 1 8.00 8.00 84.42 0.02 675.34 0.20
Crew Truck 1 1.00 107.6 TRUE 107.60 LDT2 4.00 99 0.01
Cable Splicing Emissions Total (lbs) 5402.69 1.60 790 0.04
Distribution Getaway Construction
Total Emissions (Tons per Year)
14.85 0.00 1 0.00

GHG Emission Calculations
Equipmen
tType
CalEEModCatego
ry
HP
Qty
OperatingHrs/W
D/each
OperatingHours
per
Day/
NoofRoundTripsforOn‐
road
#ofmilesforOnroad
Materialload
ingthrouput
(tons/day)
CO2rate
(lbs/hr)
CH4rate
(lbs/hr)
CO2(lbs/day)
CH4(lbs/day)
Isvehicle?
Trip
length(m
iles)
Vehicle
Catego
ry
EMFA
Ccolumn#
CO2rate
(lbs/day)
CH4rate
(lbs/day)
Construction On‐site Emissions
(lbs/hr)
Construction Onsite Emission
(lbs/day)On‐Road Vehicle Emissions (lb/day)
Subtransmission Construction
Survey ‐ 2 Work Days
1 Ton Truck Construction Other
Equipment
Composite
175 1 8.00 8.00 84.42 0.02 675.34 0.20
Survey Emissions Total (lbs) 1350.67 0.40 0
Marshalling Yard ‐ Duration of Project
1 Ton Truck Construction Other
Equipment
Composite
175 1 4.00 4.00 84.42 0.02 337.67 0.10
R/T Fork Lift Composite 10F0orklift1s 6.00 6.00 22.75 0.01 136.53 0.04
Boom Crane Truck CompositeCran2e5s0 1 2.00 2.00 82.03 0.02 164.05 0.05
Water Truck Construction Other
Equipment
Composite
250 1 8.00 8.00 84.42 0.02 675.34 0.20
Semi Tractor Truck Tractors/Loaders/B
ackhoes Composite
250 1 2.00 2.00 105.06 0.03 210.12 0.06
Marshalling Yard Emissions Total (lbs) 89898.34 26.56
Right of Way Clearing ‐ 1 Work Day
1 Ton Truck Construction Other
Equipment
Composite
175 1 8.00 8.00 84.42 0.02 675.34 0.20
Backhoe / Front Loader Tractors/Loaders/B
ackhoes Composite
250 1 6.00 6.00 100.00 105.06 0.03 630.35 0.19
Track Type Dozer Tired Rubber
Dozers Composite
380 1 6.00 6.00 175.82 0.05 1054.92 0.31
Motor Grader Composite 4G0r0aders 1 6.00 6.00 187.06 0.06 1122.37 0.33
Water Truck Construction Other
Equipment
Composite
250 1 8.00 8.00 84.42 0.02 675.34 0.20
Lowboy Truck / Trailer ConstruOctthioenr
Equipment
Composite
175 1 4.00 4.00 84.42 0.02 337.67 0.10
Right of Way Clearing Emissions Total
(lbs)
4495.98 1.33
Roads & Landing Work ‐ 1 Work Day
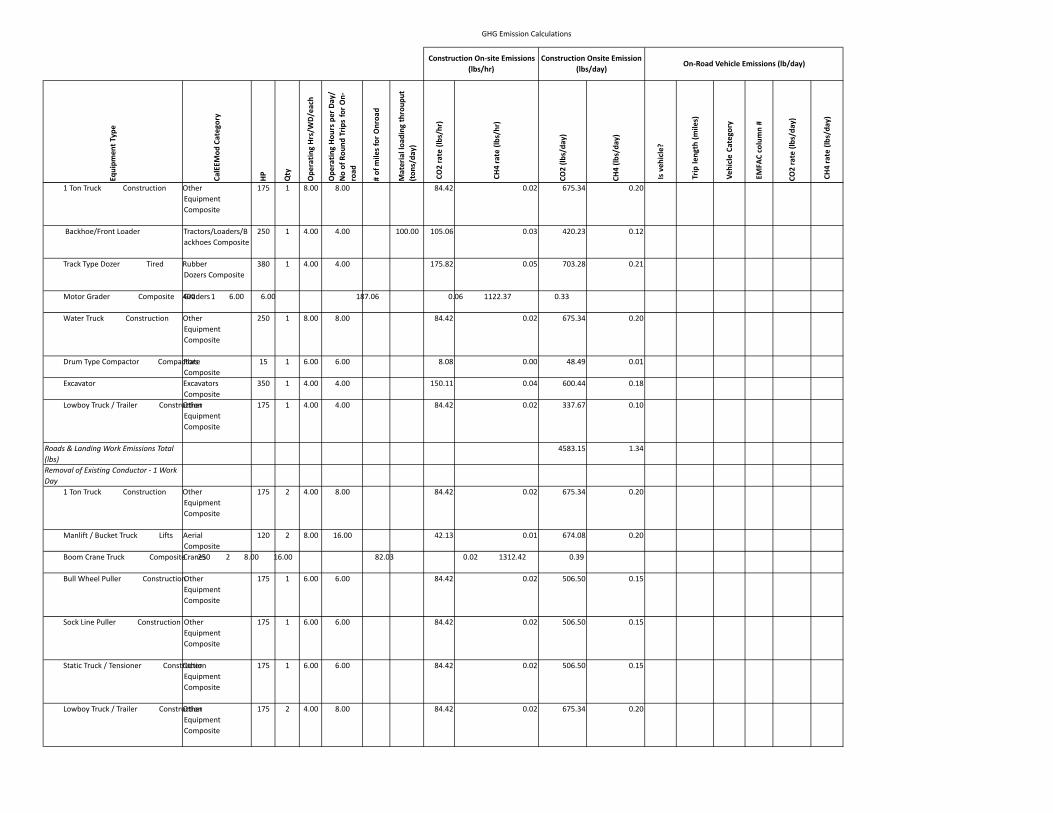
GHG Emission Calculations
Equipmen
tType
CalEEModCatego
ry
HP
Qty
OperatingHrs/W
D/each
OperatingHours
per
Day/
NoofRoundTripsforOn‐
road
#ofmilesforOnroad
Materialload
ingthrouput
(tons/day)
CO2rate
(lbs/hr)
CH4rate
(lbs/hr)
CO2(lbs/day)
CH4(lbs/day)
Isvehicle?
Trip
length(m
iles)
Vehicle
Catego
ry
EMFA
Ccolumn#
CO2rate
(lbs/day)
CH4rate
(lbs/day)
Construction On‐site Emissions
(lbs/hr)
Construction Onsite Emission
(lbs/day)On‐Road Vehicle Emissions (lb/day)
1 Ton Truck Construction Other
Equipment
Composite
175 1 8.00 8.00 84.42 0.02 675.34 0.20
Backhoe/Front Loader Tractors/Loaders/B
ackhoes Composite
250 1 4.00 4.00 100.00 105.06 0.03 420.23 0.12
Track Type Dozer Tired Rubber
Dozers Composite
380 1 4.00 4.00 175.82 0.05 703.28 0.21
Motor Grader Composite 4G0r0aders 1 6.00 6.00 187.06 0.06 1122.37 0.33
Water Truck Construction Other
Equipment
Composite
250 1 8.00 8.00 84.42 0.02 675.34 0.20
Drum Type Compactor CompacPtloartse
Composite
15 1 6.00 6.00 8.08 0.00 48.49 0.01
Excavator Excavators
Composite
350 1 4.00 4.00 150.11 0.04 600.44 0.18
Lowboy Truck / Trailer ConstruOctthioenr
Equipment
Composite
175 1 4.00 4.00 84.42 0.02 337.67 0.10
Roads & Landing Work Emissions Total
(lbs)
4583.15 1.34
Removal of Existing Conductor ‐ 1 Work
Day
1 Ton Truck Construction Other
Equipment
Composite
175 2 4.00 8.00 84.42 0.02 675.34 0.20
Manlift / Bucket Truck Lifts Aerial
Composite
120 2 8.00 16.00 42.13 0.01 674.08 0.20
Boom Crane Truck CompositeCran2e5s0 2 8.00 16.00 82.03 0.02 1312.42 0.39
Bull Wheel Puller ConstructionOther
Equipment
Composite
175 1 6.00 6.00 84.42 0.02 506.50 0.15
Sock Line Puller Construction Other
Equipment
Composite
175 1 6.00 6.00 84.42 0.02 506.50 0.15
Static Truck / Tensioner ConstrOutchteiorn
Equipment
Composite
175 1 6.00 6.00 84.42 0.02 506.50 0.15
Lowboy Truck / Trailer ConstruOctthioenr
Equipment
Composite
175 2 4.00 8.00 84.42 0.02 675.34 0.20

GHG Emission Calculations
Equipmen
tType
CalEEModCatego
ry
HP
Qty
OperatingHrs/W
D/each
OperatingHours
per
Day/
NoofRoundTripsforOn‐
road
#ofmilesforOnroad
Materialload
ingthrouput
(tons/day)
CO2rate
(lbs/hr)
CH4rate
(lbs/hr)
CO2(lbs/day)
CH4(lbs/day)
Isvehicle?
Trip
length(m
iles)
Vehicle
Catego
ry
EMFA
Ccolumn#
CO2rate
(lbs/day)
CH4rate
(lbs/day)
Construction On‐site Emissions
(lbs/hr)
Construction Onsite Emission
(lbs/day)On‐Road Vehicle Emissions (lb/day)
Removal of Existing Conductor
Emissions Total (lbs)
4856.68 1.44
Wood Pole Removal ‐ 1 Work Day
1 Ton Truck Construction Other
Equipment
Composite
175 2 8.00 16.00 84.42 0.02 1350.67 0.40
Compressor Trailer Compressors Air
Composite
400 1 4.00 4.00 240.55 0.01 962.22 0.05
Manlift / Bucket Truck Lifts Aerial
Composite
120 1 6.00 6.00 42.13 0.01 252.78 0.07
Boom Crane Truck CompositeCran2e5s0 1 6.00 6.00 82.03 0.02 492.16 0.15
Flat Bed Pole Truck ConstructioOnther
Equipment
Composite
175 1 8.00 8.00 84.42 0.02 675.34 0.20
Wood Pole Removal Emissions Total
(lbs)
3733.16 0.87

GHG Emission Calculations
Equipmen
tType
CalEEModCatego
ry
HP
Qty
OperatingHrs/W
D/each
OperatingHours
per
Day/
NoofRoundTripsforOn‐
road
#ofmilesforOnroad
Materialload
ingthrouput
(tons/day)
CO2rate
(lbs/hr)
CH4rate
(lbs/hr)
CO2(lbs/day)
CH4(lbs/day)
Isvehicle?
Trip
length(m
iles)
Vehicle
Catego
ry
EMFA
Ccolumn#
CO2rate
(lbs/day)
CH4rate
(lbs/day)
Construction On‐site Emissions
(lbs/hr)
Construction Onsite Emission
(lbs/day)On‐Road Vehicle Emissions (lb/day)
Install TSP Foundations ‐ 16 Work Days
3/4 Ton Truck Construction Other
Equipment
Composite
175 1 4.00 4.00 84.42 0.02 337.67 0.10
Boom Crane Truck CompositeCran2e5s0 1 4.00 4.00 100.00 82.03 0.02 328.11 0.10
Backhoe / Front Loader Tractors/Loaders/B
ackhoes Composite
250 1 6.00 6.00 105.06 0.03 630.35 0.19
Auger Truck Rigs Bore/Drill
Composite
175 1 6.00 6.00 101.09 0.03 606.55 0.18
Water Truck Construction Other
Equipment
Composite
250 1 8.00 8.00 84.42 0.02 675.34 0.20
Dump Truck 1 1.00 26.6 TRUE 26.60 HHD 9.00 100 0.00
Concrete Mixer Truck and Cement
Mortar Mixers
Composite
25 3 4.00 12.00 17.54 0.00 210.48 0.03
Install TSP Foundations Emissions Total
(lbs)
22307.98 6.32 1593 0.01
TSP Haul ‐ 8 Work Days
3/4 Ton Truck Construction Other
Equipment
Composite
175 1 8.00 8.00 84.42 0.02 675.34 0.20
Boom Crane Truck CompositeCran2e5s0 1 6.00 6.00 82.03 0.02 492.16 0.15
Flat Bed Pole Truck ConstructioOnther
Equipment
Composite
175 1 8.00 8.00 84.42 0.02 675.34 0.20
TSP Haul Emissions Total (lbs) 14742.65 4.36
TSP Assembly ‐ 8 Work Days
3/4 Ton Truck Construction Other
Equipment
Composite
175 2 4.00 8.00 84.42 0.02 675.34 0.20
1 Ton Truck Construction Other
Equipment
Composite
175 2 4.00 8.00 84.42 0.02 675.34 0.20
Compressor Trailer Compressors Air
Composite
400 1 6.00 6.00 240.55 0.01 1443.33 0.08
Boom Crane Truck Cranes Composite 250 1 8.00 8.00 82.03 0.02 656.21 0.19
TSP Assembly Emissions Total (lbs) 27601.69 5.39
TSP Erection ‐ 8 Work Days

GHG Emission Calculations
Equipmen
tType
CalEEModCatego
ry
HP
Qty
OperatingHrs/W
D/each
OperatingHours
per
Day/
NoofRoundTripsforOn‐
road
#ofmilesforOnroad
Materialload
ingthrouput
(tons/day)
CO2rate
(lbs/hr)
CH4rate
(lbs/hr)
CO2(lbs/day)
CH4(lbs/day)
Isvehicle?
Trip
length(m
iles)
Vehicle
Catego
ry
EMFA
Ccolumn#
CO2rate
(lbs/day)
CH4rate
(lbs/day)
Construction On‐site Emissions
(lbs/hr)
Construction Onsite Emission
(lbs/day)On‐Road Vehicle Emissions (lb/day)
3/4 Ton Truck Construction Other
Equipment
Composite
175 2 4.00 8.00 84.42 0.02 675.34 0.20
1 Ton Truck Construction Other
Equipment
Composite
175 2 4.00 8.00 84.42 0.02 675.34 0.20
Compressor Trailer Compressors Air
Composite
400 1 4.00 4.00 240.55 0.01 962.22 0.05
Boom Crane Truck CompositeCran2e5s0 1 8.00 8.00 82.03 0.02 656.21 0.19
TSK Erection Emissions Total (lbs) 23752.82 5.18
Wood / LWS Haul ‐ 2 Work Day
3/4 Ton Truck Other Construction
Equipment
Composite
175 1 8.00 8.00 84.42 0.02 675.34 0.20
Boom Crane Truck Cranes Composite 250 1 6.00 6.00 82.03 0.02 492.16 0.15
Flat Bed Pole Truck Other Construction
Equipment
Composite
175 1 8.00 8.00 84.42 0.02 675.34 0.20
Wood / LSW Pole Assembly Emissions
Total (lbs)
3685.66 1.09
Wood / LSW Pole Assembly‐ 3 Work
Day
3/4 Ton Truck Construction Other
Equipment
Composite
175 2 4.00 8.00 84.42 0.02 675.34 0.20
1 Tone Truck Construction Other
Equipment
Composite
175 2 4.00 8.00 84.42 0.02 675.34 0.20
Compressor Trailer Compressors Air
Composite
400 1 6.00 6.00 240.55 0.01 1443.33 0.08
Boom Crane Truck CompositeCran2e5s0 1 8.00 8.00 82.03 0.02 656.21 0.19
Wood / LSW Pole Assembly Emissions
Total (lbs)
10350.63 2.02
Install Wood / LSW Pole ‐ 3 Work Days
1 Ton Truck Construction Other
Equipment
Composite
175 1 8.00 8.00 84.42 0.02 675.34 0.20
Manlift / Bucket Truck Lifts Aerial
Composite
120 1 6.00 6.00 42.13 0.01 252.78 0.07
Boom Crane Truck CompositeCran2e5s0 1 6.00 6.00 82.03 0.02 492.16 0.15

GHG Emission Calculations
Equipmen
tType
CalEEModCatego
ry
HP
Qty
OperatingHrs/W
D/each
OperatingHours
per
Day/
NoofRoundTripsforOn‐
road
#ofmilesforOnroad
Materialload
ingthrouput
(tons/day)
CO2rate
(lbs/hr)
CH4rate
(lbs/hr)
CO2(lbs/day)
CH4(lbs/day)
Isvehicle?
Trip
length(m
iles)
Vehicle
Catego
ry
EMFA
Ccolumn#
CO2rate
(lbs/day)
CH4rate
(lbs/day)
Construction On‐site Emissions
(lbs/hr)
Construction Onsite Emission
(lbs/day)On‐Road Vehicle Emissions (lb/day)
Auger Truck Rigs Bore/Drill
Composite
175 1 4.00 4.00 101.09 0.03 404.37 0.12
Backhoe / Front Loader Tractors/Loaders/B
ackhoes Composite
250 1 8.00 8.00 100.00 105.06 0.03 840.47 0.25
Extendable Flat Bed Pole Truck OCthoenrstruction
Equipment
Composite
175 1 8.00 8.00 84.42 0.02 675.34 0.20
Install Wood / LSW Pole Emissions Total
(lbs)
10021.34 2.96

GHG Emission Calculations
Equipmen
tType
CalEEModCatego
ry
HP
Qty
OperatingHrs/W
D/each
OperatingHours
per
Day/
NoofRoundTripsforOn‐
road
#ofmilesforOnroad
Materialload
ingthrouput
(tons/day)
CO2rate
(lbs/hr)
CH4rate
(lbs/hr)
CO2(lbs/day)
CH4(lbs/day)
Isvehicle?
Trip
length(m
iles)
Vehicle
Catego
ry
EMFA
Ccolumn#
CO2rate
(lbs/day)
CH4rate
(lbs/day)
Construction On‐site Emissions
(lbs/hr)
Construction Onsite Emission
(lbs/day)On‐Road Vehicle Emissions (lb/day)
Install / Transfer Conductor ‐ 4 Work
Days
1 Ton Truck Construction Other
Equipment
Composite
175 3 4.00 12.00 84.42 0.02 1013.00 0.30
Manlift / Bucket Truck Lifts Aerial
Composite
120 4 8.00 32.00 42.13 0.01 1348.15 0.40
Boom Crane Truck CompositeCran2e5s0 1 8.00 8.00 82.03 0.02 656.21 0.19
Dump Truck 1 1.00 26.6 TRUE 26.60 HHD 9.00 100 0.00
Wire Truck / Trailer ConstructiOonther
Equipment
Composite
175 1 6.00 6.00 84.42 0.02 506.50 0.15
Sock Line Puller Construction Other
Equipment
Composite
175 1 6.00 6.00 84.42 0.02 506.50 0.15
Bull Wheel Puller ConstructionOther
Equipment
Composite
175 1 6.00 6.00 84.42 0.02 506.50 0.15
Static Truck / Tensioner Other Construction
Equipment
Composite
175 1 6.00 6.00 84.42 0.02 506.50 0.15
Backhoe / Front Loader Tractors/Loaders/B
ackhoes Composite
250 1 2.00 2.00 100.00 105.06 0.03 210.12 0.06
Lowboy Truck / Trailer ConstruOctthioenr
Equipment
Composite
175 2 4.00 8.00 84.42 0.02 675.34 0.20
Install / Transfer Conductor Emissions
Total (lbs)
23715.32 7.01 398 0.00
Restoration ‐ 1 Work Day
1 Ton Truck Construction Other
Equipment
Composite
175 2 4.00 8.00 84.42 0.02 675.34 0.20
Backhoe / Front Loader Tractors/Loaders/B
ackhoes Composite
250 1 4.00 4.00 100.00 105.06 0.03 420.23 0.12
Motor Grader Composite 4G0r0aders 1 6.00 6.00 187.06 0.06 1122.37 0.33
Water Truck Construction Other
Equipment
Composite
250 1 8.00 8.00 84.42 0.02 675.34 0.20
Drum Type Compactor CompacPtloartse
Composite
15 1 8.00 8.00 8.08 0.00 64.65 0.01
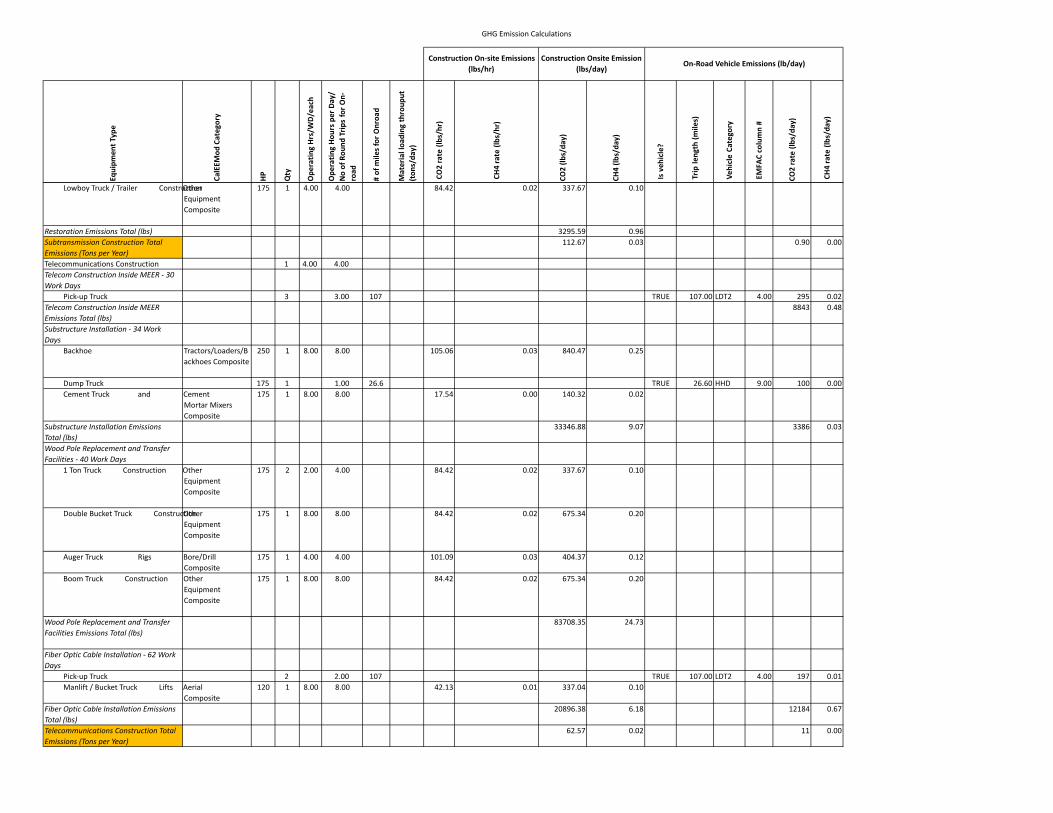
GHG Emission Calculations
Equipmen
tType
CalEEModCatego
ry
HP
Qty
OperatingHrs/W
D/each
OperatingHours
per
Day/
NoofRoundTripsforOn‐
road
#ofmilesforOnroad
Materialload
ingthrouput
(tons/day)
CO2rate
(lbs/hr)
CH4rate
(lbs/hr)
CO2(lbs/day)
CH4(lbs/day)
Isvehicle?
Trip
length(m
iles)
Vehicle
Catego
ry
EMFA
Ccolumn#
CO2rate
(lbs/day)
CH4rate
(lbs/day)
Construction On‐site Emissions
(lbs/hr)
Construction Onsite Emission
(lbs/day)On‐Road Vehicle Emissions (lb/day)
Lowboy Truck / Trailer ConstruOctthioenr
Equipment
Composite
175 1 4.00 4.00 84.42 0.02 337.67 0.10
Restoration Emissions Total (lbs) 3295.59 0.96
Subtransmission Construction Total
Emissions (Tons per Year)
112.67 0.03 0.90 0.00
Telecommunications Construction 1 4.00 4.00
Telecom Construction Inside MEER ‐ 30
Work Days
Pick‐up Truck 3 3.00 107 TRUE 107.00 LDT2 4.00 295 0.02
Telecom Construction Inside MEER
Emissions Total (lbs)
8843 0.48
Substructure Installation ‐ 34 Work
Days
Backhoe Tractors/Loaders/B
ackhoes Composite
250 1 8.00 8.00 105.06 0.03 840.47 0.25
Dump Truck 175 1 1.00 26.6 TRUE 26.60 HHD 9.00 100 0.00
Cement Truck and Cement
Mortar Mixers
Composite
175 1 8.00 8.00 17.54 0.00 140.32 0.02
Substructure Installation Emissions
Total (lbs)
33346.88 9.07 3386 0.03
Wood Pole Replacement and Transfer
Facilities ‐ 40 Work Days
1 Ton Truck Construction Other
Equipment
Composite
175 2 2.00 4.00 84.42 0.02 337.67 0.10
Double Bucket Truck ConstrucOtiothner
Equipment
Composite
175 1 8.00 8.00 84.42 0.02 675.34 0.20
Auger Truck Rigs Bore/Drill
Composite
175 1 4.00 4.00 101.09 0.03 404.37 0.12
Boom Truck Construction Other
Equipment
Composite
175 1 8.00 8.00 84.42 0.02 675.34 0.20
Wood Pole Replacement and Transfer
Facilities Emissions Total (lbs)
83708.35 24.73
Fiber Optic Cable Installation ‐ 62 Work
Days
Pick‐up Truck 2 2.00 107 TRUE 107.00 LDT2 4.00 197 0.01
Manlift / Bucket Truck Lifts Aerial
Composite
120 1 8.00 8.00 42.13 0.01 337.04 0.10
Fiber Optic Cable Installation Emissions
Total (lbs)
20896.38 6.18 12184 0.67
Telecommunications Construction Total
Emissions (Tons per Year)
62.57 0.02 11 0.00

GHG Emission Calculations
Equipmen
tType
CalEEModCatego
ry
HP
Qty
OperatingHrs/W
D/each
OperatingHours
per
Day/
NoofRoundTripsforOn‐
road
#ofmilesforOnroad
Materialload
ingthrouput
(tons/day)
CO2rate
(lbs/hr)
CH4rate
(lbs/hr)
CO2(lbs/day)
CH4(lbs/day)
Isvehicle?
Trip
length(m
iles)
Vehicle
Catego
ry
EMFA
Ccolumn#
CO2rate
(lbs/day)
CH4rate
(lbs/day)
Construction On‐site Emissions
(lbs/hr)
Construction Onsite Emission
(lbs/day)On‐Road Vehicle Emissions (lb/day)
Proposed Project Construction
Emissions (Tons per Year)
256.74 0.07 28 0.00
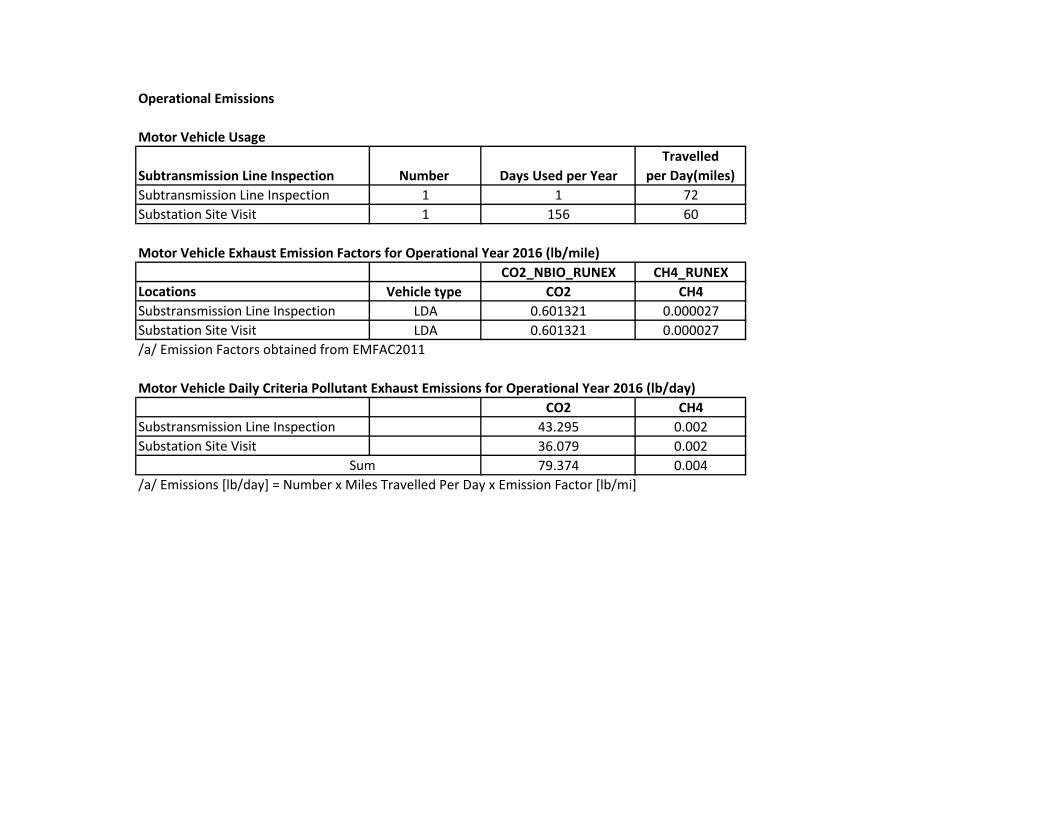
Operational Emissions
Motor Vehicle Usage
Subtransmission Line Inspection Number Days Used per YearTravelled
per Day(miles)Subtransmission Line Inspection 1 1 72Substation Site Visit 1 156 60
Motor Vehicle Exhaust Emission Factors for Operational Year 2016 (lb/mile)CO2_NBIO_RUNEX CH4_RUNEX
Locations Vehicle type CO2 CH4Substransmission Line Inspection LDA 0.601321 0.000027Substation Site Visit LDA 0.601321 0.000027/a/ Emission Factors obtained from EMFAC2011
Motor Vehicle Daily Criteria Pollutant Exhaust Emissions for Operational Year 2016 (lb/day)CO2 CH4
Substransmission Line Inspection 43.295 0.002Substation Site Visit 36.079 0.002
79.374 0.004/a/ Emissions [lb/day] = Number x Miles Travelled Per Day x Emission Factor [lb/mi]
Sum

EMFAC 2011 Emission FactorsSource: CalEEMod2013Year: 2016, Kern County g/mile
LDA LDT1 LDT2 MDV LHD1 LHD2 MHD HHDColumn number: 2.000 3.000 4.000 5.000 6.000 7.000 8.000 9.000FleetMix 0.358 0.044 0.190 0.132 0.068 0.010 0.016 0.155PM2.5 0.019 0.020 0.020 0.020 0.050 0.070 0.133 0.113PM10 0.046 0.048 0.047 0.047 0.092 0.126 0.212 0.182CH4_IDLEX 0.000 0.000 0.000 0.000 0.001 0.001 0.008 0.025CH4_RUNEX 0.012 0.022 0.018 0.030 0.023 0.012 0.008 0.011CH4_STREX 0.012 0.027 0.022 0.035 0.022 0.008 0.000 0.000CO_IDLEX 0.000 0.000 0.000 0.000 0.153 0.105 1.843 3.001CO_RUNEX 1.199 2.982 1.875 3.031 2.391 1.383 1.925 1.379CO_STREX 2.698 5.644 4.669 6.991 4.943 1.524 31.000 119.670CO2_NBIO_IDLEX 0.000 0.000 0.000 0.000 9.057 10.153 604.141 566.973CO2_NBIO_RUNEX 272.755 322.972 390.483 516.960 722.967 586.061 1047.438 1653.981CO2_NBIO_STREX 61.761 74.304 87.920 114.794 30.361 12.514 63.848 66.487NOX_IDLEX 0.000 0.000 0.000 0.000 0.095 0.162 6.463 4.458NOX_RUNEX 0.127 0.313 0.274 0.468 2.127 2.928 3.781 4.378NOX_STREX 0.181 0.308 0.412 0.659 0.990 0.363 2.584 5.201PM10_IDLEX 0.000 0.000 0.000 0.000 0.001 0.002 0.027 0.011PM10_PMBW 0.037 0.037 0.037 0.037 0.057 0.079 0.111 0.061PM10_PMTW 0.008 0.008 0.008 0.008 0.010 0.011 0.011 0.036PM10_RUNEX 0.002 0.003 0.002 0.002 0.026 0.036 0.090 0.084PM10_STREX 0.003 0.005 0.004 0.004 0.001 0.000 0.006 0.005PM25_IDLEX 0.000 0.000 0.000 0.000 0.001 0.002 0.024 0.011PM25_PMBW 0.016 0.016 0.016 0.016 0.024 0.034 0.048 0.026PM25_PMTW 0.002 0.002 0.002 0.002 0.003 0.003 0.003 0.009PM25_RUNEX 0.002 0.003 0.002 0.002 0.024 0.033 0.083 0.078PM25_STREX 0.003 0.004 0.003 0.004 0.001 0.000 0.005 0.004ROG_DIURN 0.065 0.150 0.104 0.115 0.003 0.001 0.004 0.004ROG_HTSK 0.136 0.252 0.189 0.221 0.067 0.025 0.193 0.204ROG_IDLEX 0.000 0.000 0.000 0.000 0.024 0.015 0.165 0.534ROG_RESTL 0.047 0.101 0.074 0.086 0.001 0.000 0.002 0.002ROG_RUNEX 0.037 0.118 0.059 0.098 0.241 0.191 0.247 0.244ROG_RUNLS 0.331 0.792 0.625 0.735 0.483 0.141 0.831 0.998ROG_STREX 0.215 0.463 0.377 0.607 0.383 0.133 2.223 4.944SO2_IDLEX 0.000 0.000 0.000 0.000 0.000 0.000 0.006 0.006SO2_RUNEX 0.003 0.004 0.005 0.006 0.007 0.006 0.010 0.016SO2_STREX 0.001 0.001 0.001 0.001 0.000 0.000 0.001 0.003TOG_DIURN 0.065 0.150 0.104 0.115 0.003 0.001 0.004 0.004TOG_HTSK 0.136 0.252 0.189 0.221 0.067 0.025 0.193 0.204TOG_IDLEX 0.000 0.000 0.000 0.000 0.025 0.016 0.188 0.607TOG_RESTL 0.047 0.101 0.074 0.086 0.001 0.000 0.002 0.002TOG_RUNEX 0.049 0.142 0.078 0.129 0.276 0.219 0.280 0.278TOG_RUNLS 0.331 0.792 0.625 0.735 0.483 0.141 0.831 0.998TOG_STREX 0.230 0.495 0.403 0.649 0.409 0.142 2.383 5.304* Emissions are in units of grams per mile

EMFAC 2011 Emission Source: CalEEMod201Year: 2016, Kern Coun
Column number: FleetMixPM2.5PM10CH4_IDLEXCH4_RUNEXCH4_STREXCO_IDLEXCO_RUNEXCO_STREXCO2_NBIO_IDLEXCO2_NBIO_RUNEXCO2_NBIO_STREXNOX_IDLEXNOX_RUNEXNOX_STREXPM10_IDLEXPM10_PMBWPM10_PMTWPM10_RUNEXPM10_STREXPM25_IDLEXPM25_PMBWPM25_PMTWPM25_RUNEXPM25_STREXROG_DIURNROG_HTSKROG_IDLEXROG_RESTLROG_RUNEXROG_RUNLSROG_STREXSO2_IDLEXSO2_RUNEXSO2_STREXTOG_DIURNTOG_HTSKTOG_IDLEXTOG_RESTLTOG_RUNEXTOG_RUNLSTOG_STREX* Emissions are in unit
OBUS UBUS MCY SBUS MH10.000 11.000 12.000 13.000 14.0000.003 0.000 0.016 0.001 0.0060.088 0.227 0.018 0.320 0.0520.152 0.445 0.045 0.653 0.0900.019 0.000 0.000 0.005 0.0000.003 0.000 0.000 0.008 0.0000.000 0.000 0.000 0.000 0.0002.364 0.000 0.000 1.062 0.0003.004 1.744 37.503 3.115 4.949
18.810 10.220 11.047 26.431 10.685571.353 0.000 0.000 570.820 0.000
1096.045 1452.560 163.365 1110.494 740.04037.814 86.290 43.331 123.629 31.5005.938 0.000 0.000 8.092 0.0004.438 5.563 1.340 7.952 1.8102.555 3.237 0.318 2.230 0.9180.018 0.000 0.000 0.027 0.0000.091 0.359 0.037 0.557 0.0510.010 0.008 0.008 0.011 0.0090.051 0.078 0.001 0.086 0.0310.002 0.000 0.002 0.004 0.0020.016 0.000 0.000 0.025 0.0000.039 0.154 0.016 0.239 0.0220.003 0.002 0.002 0.003 0.0020.047 0.072 0.001 0.079 0.0280.001 0.000 0.001 0.004 0.0010.001 0.006 0.999 0.028 1.3550.031 0.102 0.470 0.170 0.0860.414 0.000 0.000 0.117 0.0000.000 0.004 0.563 0.011 0.4380.263 0.171 3.320 0.463 0.1970.264 0.550 1.675 1.553 2.1201.196 1.953 2.345 2.004 0.6170.006 0.000 0.000 0.006 0.0000.011 0.015 0.002 0.011 0.0080.001 0.001 0.001 0.002 0.0010.001 0.006 0.999 0.028 1.3550.031 0.102 0.470 0.170 0.0860.471 0.000 0.000 0.133 0.0000.000 0.004 0.563 0.011 0.4380.299 0.205 3.607 0.511 0.2340.264 0.550 1.675 1.553 2.1201.279 2.085 2.520 2.139 0.661