ballastwater self monitoring - us epa · ballastwater self monitoring. ... if a ship is receiving...
TRANSCRIPT

United States Environmental Protection Agency Office of Wastewater Management Washington, DC 20460
Ballast Water Self Monitoring
EPA 800‐R‐11‐003 November 2011

Ballast Water Discharges from Vessels Contents
Contents
Page
1 INTRODUCTION .................................................................................................................... 1 1.1 What is Ballast Water? ............................................................................................ 1 1.2 Environmental Impacts of Ballast Water Discharges ............................................. 2 1.3 Current Ballast Water Discharge Regulations ........................................................ 3
2 BALLAST WATER TREATMENT TECHNOLOGIES .................................................................... 7
3 BALLAST WATER COMPLIANCE MONITORING ................................................................... 11 3.1 Physical-Chemical Indicators of Treatment Performance .................................... 11 3.2 Biological Indicators of Exceedances ................................................................... 17 3.3 Effluent Monitoring for Residual Biocides........................................................... 18 3.4 Effluent Monitoring for Biocide Derivatives ........................................................ 22 3.5 Ballast Water Sampling Methods ......................................................................... 22
4 BALLAST WATER TREATMENT MONITORING COSTS ......................................................... 23
5 REFERENCES ...................................................................................................................... 26
i

Ballast Water Discharges from Vessels List of Tables
LIST OF TABLES
Page
1 Select Ballast Water Discharge Standards for Organisms...................................................4
2 Anticipated Ballast Water Treatment System Sensors and Measurement Equipment for Physical/Chemical Indicator Monitoring ...................................................12
3 List of Possible Treatment Performance Measures and Analytical Methods for Biological Indicator Compliance Monitoring....................................................................17
4 Possible Biological Indicator Compliance Monitoring Analytical Methods and Effluent Limits ...................................................................................................................20
5 Residual Biocides Compliance Monitoring Sampling Analytical Methods and Possible Action Levels.......................................................................................................21
6 Biocide Derivative Monitoring Analytical Methods .........................................................22
7 Estimated Capital Cost for Vessels Needing Additional Ballast Water Treatment System Monitoring Equipment ..........................................................................................23
8 Estimated Labor and Analytical Costs for Ballast Water Treatment System Discharge Sampling ...........................................................................................................24
LIST OF FIGURES
Page
1 Generic Ballast Water Treatment Technology Options .......................................................7
The EPA technical contact for this document is Ryan Albert (202) 564-0763.
ii
Ballast Water Discharges from Vessels Section 1 - Introduction
SECTION 1
INTRODUCTION
The 2008 Vessel General Permit (VGP) regulates discharges incidental to the normal operation of vessels operating as a means of transportation. The VGP, like other general permits, is issued by the permitting authority (in this case, EPA) and covers multiple facilities within a specific category for a specific period of time (not to exceed 5 years). The 2008 VGP includes the following limits or requirements: general effluent limits; technology-based effluent limits applicable to 26 specific discharge streams; narrative water-quality based effluent limits; inspection, monitoring, recordkeeping, and reporting requirements; and additional requirements applicable to certain vessel types (USEPA, 2010b).
Because EPA plans to reissue the VGP, the Agency continues gathering information on vessel wastewater sources while examining treatment technologies that can be used before discharge into waters of the United States.1 This document contains updated information on both recent developments in ballast water treatment technologies and the monitoring requirements to verify ballast water treatment systems are functioning properly.
1.1 WHAT IS BALLAST WATER?
Ballast water is fresh or saltwater held in the ballast tanks and cargo holds of ships. It is used to provide stability and maneuverability during a voyage when ships are not carrying cargo, not carrying heavy enough cargo, or when more stability is required due to rough seas. Ballast water may also be used to add weight so that a ship sinks low enough in the water to pass under bridges and other structures. Ballast water is taken from port areas and transported with the ship to the next port of call where the water may be discharged. If a ship is receiving or delivering cargo to a number of ports, it may release or take on a portion of ballast water at each port. In such cases, the ships ballast water contains a mix of waters from multiple ports (MIT, 2002).
Large commercial vessels (e.g., container ships, bulk carriers, other cargo vessels, tankers, and passenger vessels) normally have ballast tanks dedicated to this purpose, and some vessels may also ballast empty cargo holds. The discharge volume varies by vessel type, ballast tank capacity, and type of deballasting equipment. Volumes of ballast water discharged are significant and can be several hundred or thousand cubic meters of water. For instance, passenger vessels have an average ballast capacity of about 2,600 cubic meters (about 686,850 gallons) while ultra large crude carriers (ULCCs) have an average ballast capacity of about 93,000 cubic meters (about 24,568,000 gallons) (USEPA, 2008). A modern tanker ship working on the Great Lakes can contain as much as 53,000 cubic meters (14,000,000 gallons) (USEPA, 2001). Its estimated that tank vessels like ULCCs account for approximately 40 percent of all ballast water discharged, followed by bulk carriers and container ships. Passenger vessels account for only about 1 percent of ballast water discharges (Faulkner, 2009).
1 “Waters of the United States” as defined in 40 CFR 122.2.
1

Ballast Water Discharges from Vessels Section 1 - Introduction
1.2 ENVIRONMENTAL IMPACTS OF BALLAST WATER DISCHARGES
Ballast water discharges have been cited as one of the primary sources or vectors for the spread of aquatic nuisance species (ANS) (Carlton et al., 1995). The transfer of alien water species in ships ballast tanks at modern rates, scales and shipping routes facilitates very fast and practically global distribution of some species (Kasyan, 2010). Depending on where ships take on ballast water, virtually all organisms in the water column, either swimming or stirred up from bottom sediments, can be taken into ships’ ballast tanks. These organisms include holoplakton (free-floating), meroplakton (larval stages of bottom dwelling organisms), upper water column nekton (active swimming), and demersal (near bottom dwelling nekton) organisms (California EPA, 2002). Well known examples of ANS or pathogens that have been introduced to U.S. waters include Hydrilla, European Loosestrife, Eurasian water milfoil, melaluca, salt cedar, and Viral Hemorrhagic Septicemia (VHS).
One of the best known examples of ANS is the zebra mussel (Dreissena polymorpha), which was introduced from the Black Sea to the Great Lakes in the mid-1980s and was discovered in California in 2008. This tiny striped mussel attaches to hard surfaces in dense populations that clog municipal water systems and electric generating plants, causing approximately $1 billion a year in damage and control for the Great Lakes alone (California State Lands Commission, 2010). In San Francisco Bay, the overbite clam (Corbula amurensis) is believed to be a major contributor to the decline of several pelagic fish species in the Sacramento-San Joaquin River Delta by reducing the plankton food base of the ecosystem (California State Lands Commission, 2010). Because of the global shipping network, it is possible that new ANS could arrive from virtually any port world-wide (Keller and Drake, 2011).
ANS can enter new aquatic environments when the vessel operator discharges ballast tanks. These organisms may also be released when vessel operators load ballast water into ballast tanks with residual water or sediment, mix the new ballast water with these residuals, and then later discharge this ballast water. On any given day, approximately 7,000 individual species may be “in motion” in ballast tanks (Carlton, 2001). There is no evidence that ship age, seasonal timing, or age of ballast water affects the abundance of individuals or species in the ballast tanks (Drake and Lodge, 2007).
When ANS in ballast tanks are transported between water bodies and discharged, they have the potential for establishing new, non-indigenous populations that have the potential to cause physical and behavioral disturbances to native organisms, out competing them for food, space and other valuable resources (Hayes and Landis, 2004). Although pelagic marine systems appear to be least susceptible to invasion by ANS, mixed island systems and lake, river and near-shore marine systems are especially vulnerable (Deines et al., 2005 and Perings, 2002). Potentially, this can cause severe economic and ecological damage (Lodge and Finnoff, 2008 and Lovell and Drake, 2009). Associated damages and costs of controlling aquatic invaders in the United States are estimated to be $9 billion annually (Pennsylvania Sea Grant, 2003). The spread of ANS can be mitigated if either their introduction to the receiving water is prevented, or if the ANS cannot establish a population.
2
Ballast Water Discharges from Vessels Section 1 - Introduction
1.3 CURRENT BALLAST WATER DISCHARGE REGULATIONS
A thorough evaluation of the availability of ballast water treatment technologies requires an understanding of the regulatory framework associated with the development and implementation of performance standards for the discharge of ballast water, including knowledge of mechanisms for the testing and evaluation of treatment systems to meet those standards. This section summarizes the ballast water regulations currently in effect. A more robust regulatory analysis of the current ballast water regulations is available in the Science Advisory Board’s Background and Issue Paper on the Availability and Efficacy of Ballast Water Treatment Technologies (Albert et al., 2010).
At the international level, ballast water discharges from vessels are primarily addressed under provisions established through the auspices of the International Maritime Organization (IMO). Beginning in 1991, the IMO, which is the principal UN body that addresses pollution from ships, adopted a series of resolutions containing recommended practices to help prevent the introduction of ANS by ballast water. The current resolution was adopted in 1997 and contains guidelines calling for mid-ocean ballast water exchange (BWE) and other ballast water management practices.
Following adoption of the resolution, a ballast water working group was regularly convened as part of the meetings of the IMO’s Marine Environment Protection Committee (“MEPC”), with a charge of developing legally binding requirements for a ballast water management treaty. Over the course of these meetings, there was a gradual evolution away from reliance on BWE as the primary control mechanism to one requiring compliance with ballast water discharge standards stated in the form of concentrations of organisms per unit of volume of ballast water discharged. The culmination of this effort was a Diplomatic Conference held at IMO, which adopted the International Convention for the Control and Management of Ships’ Ballast Water and Sediments in February 2004. Among its provisions, the Convention contains performance standards for the discharge of ballast water (Regulation D-2) with an associated implementation schedule based on vessel ballast water capacity and date of construction (see Table 1). During development of the 2004 Convention, the U.S. took a negotiating position that the discharge standards for the two larger size groupings of organisms in the D-2 regulation should be 1,000 times more stringent than adopted (see Table 1). As of November 30, 2011, the 2004 Convention is not in force, nor is the U.S. a party.
At the federal level, there are two principal statutes of interest: (1) the Nonindigenous Aquatic Nuisance Prevention and Control Act, as amended (“NANPCA,” 16 U.S.C. §§ 4701 et seq.); and (2) the Federal Water Pollution Control Act (commonly referred to as the Clean Water Act or “CWA,” 33 U.S.C. §§ 1251 et seq.). The principal ballast water management requirements under NANPCA and the applicable VGP requirements that implement the Clean Water Act presently rely on use of BWE. However, since ballast water exchange is of variable effectiveness and cannot always be carried out due to safety concerns, efforts are underway at the federal level to develop a regulatory regime that will phase out use of exchange in favor of treatment to meet a ballast water discharge standard specified in terms of concentrations of living organisms per unit of volume of ballast water discharged. The USCG issued proposed regulations in August, 2009 containing such standards, and these USCG proposed Phase I and Phase II standards are shown in Table 1.
3

Ballast Water Discharges from Vessels Section 1 - Introduction
Both NANPCA and the CWA preserve state authority to more stringently regulate ballast water discharges that occur in state waters. At the state level, regulation of ballast water discharges varies, as shown in Table 1.
Table 1. Select Ballast Water Discharge Standards for Organisms
Regulation Organism Size: ≥ 50
(µm)*
Organism Size: <
50µm, but ≥ 10 µm
Bacteria Viruses Lakers Covered?**
Compliance Date
IMO BW TREATY (Reg.
D-2)
< 10 “viable”
organisms per m3
< 10 “viable”
organisms per ml
Vibrio cholera < 1 CFU per 100 ml;
E. coli < 250 CFU per 100 ml; Intestinal
enterococci < 100 CFU per 100 ml
---- N/A 2009 – 2019 (varies by vessel
construction date/BW capacity/survey date
as per Reg B-3)
US NEGOTIATING
POSITION
< 0.01 “living”
organisms per m3
< 0.01 “living”
organisms per ml
Vibrio cholera < 1 CFU per 100 ml;
E. coli < 126 CFU per 100 ml; Intestinal
enterococci < 33 CFU per 100 ml
---- N/A ASAP
USCG PROPOSED
RULE (74 FR 44632)
PHASE 1 STANDARD
< 10 organisms
per m3
< 10 organisms
per ml
Vibrio cholera < 1 CFU per 100 ml;
E. coli < 250 CFU per 100 ml; Intestinal
enterococci < 100 CFU per 100 ml
---- Yes Vessels constructed on or after 01/01/12 on delivery; All other vessels varies by BW capacity & drydock
cycle with latest compliance date of 1st drydock after
01/01/16 PHASE 2 STANDARD
< 1 organism per 100 m3
< 1 organism per 100 ml
Vibrio cholera < 1 CFU per 100 ml;
E. coli < 126 CFU per 100 ml; Intestinal
enterococci < 33 CFU per 100 ml
< 103 “living” bacterial cells per 100 ml
< 104
viruses or viral-
like particles per 100
ml
Yes Vessels constructed on or after 01/01/16 on delivery; All other
vessels 1st drydocking after
01/01/2016, unless prior installation of Phase 1 BW system, in which case 5 years from such installation
California (VGP 401
cert)
INTERIM STANDARD
0 detectable “living”
organisms
US negotiating
position
Vibrio cholera IMO Reg D-2; E. coli US
negotiating position; Intestinal enterococci US
negotiating position < 103 bacteria per 100 ml
< 104
viruses per 100
ml
N/A 01/01/10 – 01/01/16 (varies by vessel
construction date/BW capacity)
FINAL STANDARD
0 detectable 0 detectable 0 detectable “living” 0 N/A 01/01/2020 “living” “living” organisms detectable
organisms organisms “living” organisms
4

Ballast Water Discharges from Vessels Section 1 - Introduction
Table 1. Select Ballast Water Discharge Standards for Organisms
Regulation Organism Size: ≥ 50
(µm)*
Organism Size: <
50µm, but ≥ 10 µm
Bacteria Viruses Lakers Covered?**
Compliance Date
Illinois (VGP 401
cert)
IMO Reg D2 (as daily average)
IMO Reg D2 (as daily average)
Vibrio cholera;a E. coli IMO Reg D-2 (as daily
average); Intestinal enterococci IMO Reg D
2 (as daily average)
---- Yes Vessels constructed before 01/01/12
01/01/16; Vessels constructed after 01/01/12 prior to
operation Indiana IMO Reg D IMO Reg D- Vibrio choleraa; ---- No Vessels constructed
(VGP 401 2b (as daily 2b (as daily E. coli IMO Reg D-2 (as before 01/01/12 cert) average) average) daily average); Intestinal
enterococci IMO Reg D2 (as daily average)
01/01/16; Vessels constructed after 01/01/12 prior to
operation Michigan Use a Use a Use a treatment process Use a No 01/01/07 (VGP 401 treatment treatment approved by MI DEQ treatment
cert) process approved by
MI DEQ
process approved by
MI DEQ
process approved
by MI DEQ
Minnesota (VGP 401
cert)
IMO Reg D2b (as daily
average)
IMO Reg D2b (as daily
average)
Vibrio choleraa; E. coli IMO Reg D-2 (as daily
average); Intestinal enterococci IMO Reg D
2 (as daily average)
--- Yes Vessels sonstructed before 01/01/12
01/01/16; Vessels constructed after 01/01/12 prior to
operation
New York (VGP 401
INTERIM STANDARD
< 1 “living” < 1 “living” Vibrio cholera IMO Reg ---- Yes 01/01/12 (extended to cert) organism per organism per D-2; (vessels August 1, 2013 in
10 m3 10 ml E. coli US negotiating position; Intestinal
enterococci US negotiating position
operating exclusively
within Lakes Ontario and
Erie are exempt)
subsequent state action)
FINAL STANDARD
Same as CA US Vibrio cholera IMO Reg Same as Yes (vessels Vessels constructed #s negotiating D-2; CA operating on or after 01/01/13
position E. coli US negotiating interim exclusively (extended to August position; Intestinal #s within Lakes 1, 2013 in subsequent
enterococci US Ontario and State action) negotiating position; Erie are Other bacteria CA exempt)
interim standard Ohio IMO Reg D IMO Reg D- Vibrio choleraa; E. coli --- Yes (in part -- Lakers “launched”
(VGP 401 2b (as daily 2b (as daily IMO Reg D-2 (as daily see column to after 01/01/16 cert) average) average) average); Intestinal
enterococci IMO Reg D2 (as daily average)
right) immediate; Non-Lakers “launched”
before 01/01/12 01/01/16; Non-
Lakers “launched” after 01/01/12 prior
to operation
5

Ballast Water Discharges from Vessels Section 1 - Introduction
Table 1. Select Ballast Water Discharge Standards for Organisms
Regulation Organism Size: ≥ 50
(µm)*
Organism Size: <
50µm, but ≥ 10 µm
Bacteria Viruses Lakers Covered?**
Compliance Date
Wisconsin (11/18/09
State Permit)
IMO Reg D2 (as daily average)
IMO Reg D2 (as daily average)
Vibrio choleraa; E. coli IMO Reg D-2 (as daily average); Intestinal enterococci IMO Reg D
2 (as daily average)
---- Noc Vessels constructed after 01/01/12d
immediate; Vessels constructed before 01/01/12d 01/01/14
Source: Modified from Albert et al., 2010. * For some standards, groupings are stated as organisms > 50 µm and organisms ≤ 50 µm but > 10 µm. For sake of simplicity, this table uses the IMO groupings throughout as the default column header. ** “Lakers” are vessels which generally voyage exclusively in the Great Lakes. a Indicator microbes specified by State do not include Vibrio cholera. b State has defined “viable” as living and able to reproduce. In contrast, IMO G8 (type approval) Guidelines (para 3.12) define viable as living. c Standards apply to oceangoing vessels only. However, WI permit does provide that Lakers shall implement BMPs as specified in § 2.2.3 of EPA’s 2008 VGP (uptake and discharge practices). d WI DNR conducted a review to determine if BWT technology was available to meet WI standards more stringent than those finalized in 2009; that review concluded such BWT technology was not available and therefore, Wisconsin instead determined that the IMO Reg D-2 standards applied (subject to footnotes a & b). ASAP – As soon as possible. BW – Ballast water. CA – California. N/A – Not applicable.
6
Ballast Water Discharges from Vessels Section 2 - Ballast Water Treatment Technologies
SECTION 2
BALLAST WATER TREATMENT TECHNOLOGIES
Two general platform types have been explored for the development of ballast water treatment technologies. Shore-side ballast water treatment would occur at a barge- or land-based facility following transfer from a vessel; to date, such shore side treatment facilities for ANS in ships’ ballast water do not exist at U.S. ports. Shipboard treatment occurs onboard vessels through the use of technologies that are integrated into the ballasting system; a number of such systems have been developed or are in development. The remaining discussions in this document address such shipboard treatment systems.
To be effective, ballast water treatment systems must operate under a wide range of challenging environmental conditions, including variable temperature, salinity, nutrients and suspended solids. They must also function under difficult operational constraints, including high flow-rates of ballast water pumps, large water volumes, and variable retention times (time ballast water is held in tanks). Treatment systems should be capable of eradicating a wide variety of organisms ranging from viruses and microscopic bacteria, to free-swimming plankton, and must operate so as to minimize or prevent impairment of the water quality conditions of the receiving waters. The development of effective treatment systems is further complicated by the variability of vessel types, shipping routes and port geography (California State Lands Commission, 2010).
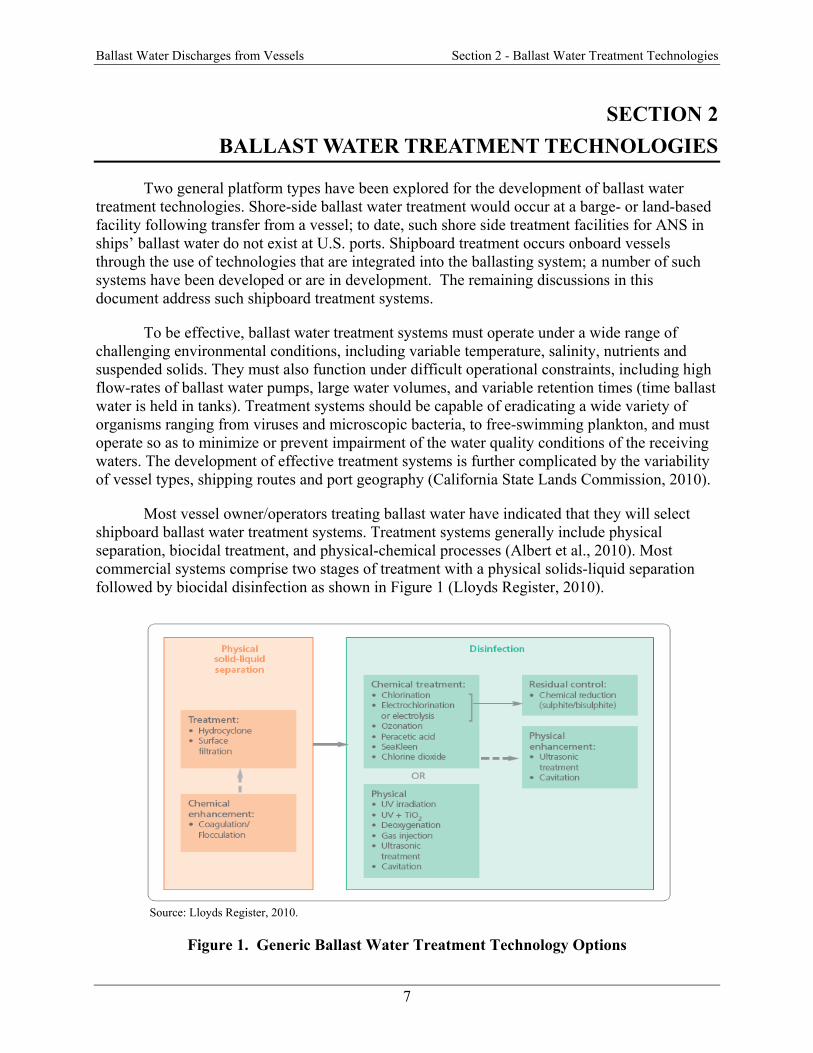
Most vessel owner/operators treating ballast water have indicated that they will select shipboard ballast water treatment systems. Treatment systems generally include physical separation, biocidal treatment, and physical-chemical processes (Albert et al., 2010). Most commercial systems comprise two stages of treatment with a physical solids-liquid separation followed by biocidal disinfection as shown in Figure 1 (Lloyds Register, 2010).
Source: Lloyds Register, 2010.
Figure 1. Generic Ballast Water Treatment Technology Options
7
Ballast Water Discharges from Vessels Section 2 - Ballast Water Treatment Technologies
Different treatment processes are more effective for certain types or size classes of organisms. Larger size classes of organisms typically require a filtration system or other physical process to limit their intake into the ships ballast tanks; however, smaller size classes of living organisms typically require additional chemical, physical or heat treatment to kill organisms that bypass the filtration system (Prince William Sound Regional Advisory Council, 2005).
The filtration processes used in ballast water treatment systems are generally of the automatic backwashing type using either discs or fixed screens. Removal of larger organisms such as plankton by filtration requires a filter of equivalent mesh size between 10 and 50 µm. Such filters are the most widely used solid-liquid separation process employed in ballast water treatment, and their effective operation relates mainly to the flow capacity attained at a given operating pressure. Maintaining the flow normally requires that the filter is regularly cleaned, and it is the balance between flow, operating pressure and cleaning frequency that determines the efficacy of the filtration process. In principle, surface filtration (membrane filtration) can remove sub micron (i.e., less than 1µm in size) micro-organisms; however, such processes are not viable for ballast water treatment due to the relatively low permeability of the membrane material (Lloyds Register, 2010).
Hydrocyclone technology is used as an alternative to filtration. This technology provides enhanced sedimentation by injecting the water at high velocity to impart a rotational motion which creates a centrifugal force, increasing the velocity of particles relative to the water, allowing them to be separated and removed. The effectiveness of the separation depends upon the difference in density of the particle and the surrounding water, the particle size, the speed of rotation and residence time.
A number of different chemical biocides or chemical processes have been employed in the ballast water treatment systems for disinfection including:
Chlorination Electrochlorination Ozonation Chlorine dioxide Peracetic acid Hydrogen peroxide Menadione/Vitamin K
The efficacy of these processes varies by water conditions such as pH, temperature and, most significantly, the type of organism. While relatively inexpensive, chlorine is a highly effective disinfectant for most organisms, but is virtually ineffective against cysts unless concentrations of at least 2 mg/l are used (Lloyds Register, 2010). Chlorine also reacts to form undesirable chlorinated byproducts, particularly chlorinated hydrocarbons and trihalomethanes. Ozone yields far fewer harmful byproducts, the most prominent being bromate, but requires relatively complex equipment to both produce ozone and dissolve it into the water. Chlorine dioxide is normally produced in situ, although this presents a challenge since the reagents used are themselves chemically hazardous. Peracetic acid and hydrogen peroxide (provided as a blend of the two chemicals in the form of the proprietary product Peraclean®) are infinitely soluble in water, produce few harmful byproducts and are relatively stable. However Peraclean® is
8
Ballast Water Discharges from Vessels Section 2 - Ballast Water Treatment Technologies
relatively expensive, is dosed at quite high levels, has been documented to have unacceptable toxicity in cold waters, and requires considerable storage facilities.
For all these chemicals, pre-treatment of the water using solid-liquid separation (i.e., filtration or hydrocyclones) is desirable to reduce the ‘demand’ on the disinfectant, because the chemical can also react with organic and other materials in the ballast water. In addition, while chemical biocides may be effective for disinfection of organisms in the water column, they may be relatively ineffective in disinfecting species buried in sediment in ballast tanks, especially invertebrates in resting stages (Raikow and Reid, 2006). Vessel owners/operators should consult with technology vendors to ensure the selected system is appropriate for the vessel of interest under normal ballasting conditions (Dobroski et al., 2009).
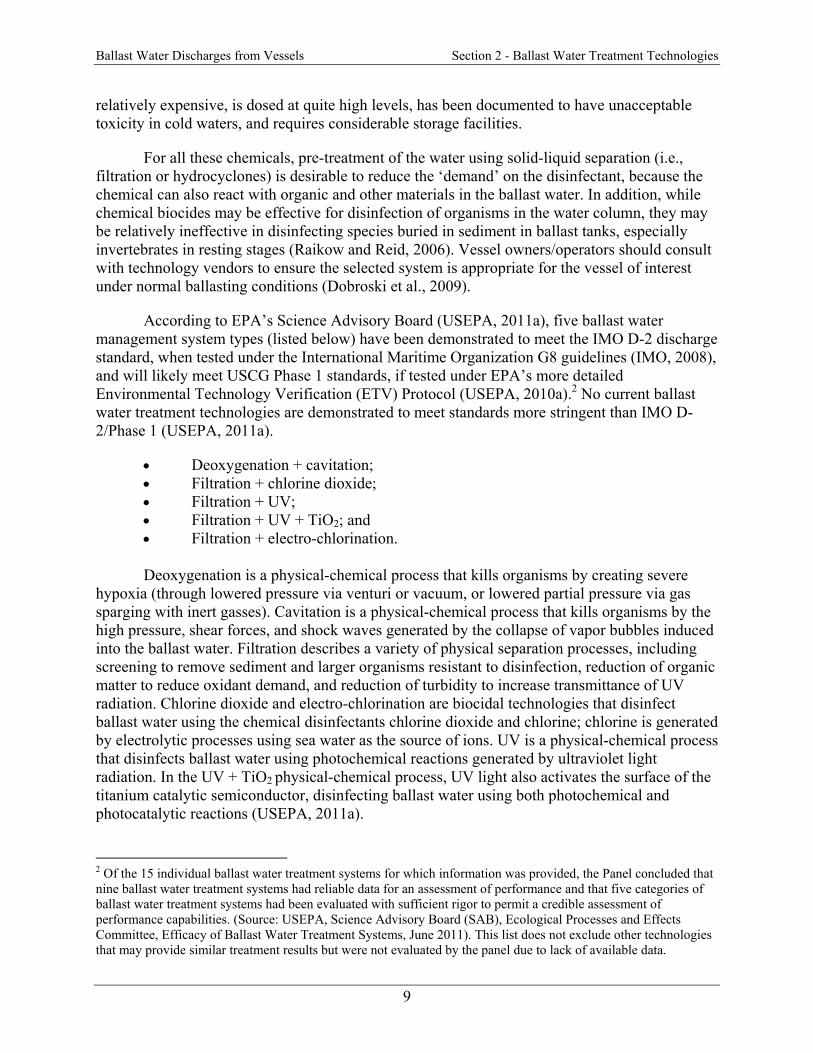
According to EPA’s Science Advisory Board (USEPA, 2011a), five ballast water management system types (listed below) have been demonstrated to meet the IMO D-2 discharge standard, when tested under the International Maritime Organization G8 guidelines (IMO, 2008), and will likely meet USCG Phase 1 standards, if tested under EPA’s more detailed Environmental Technology Verification (ETV) Protocol (USEPA, 2010a).2 No current ballast water treatment technologies are demonstrated to meet standards more stringent than IMO D2/Phase 1 (USEPA, 2011a).
Deoxygenation + cavitation; Filtration + chlorine dioxide; Filtration + UV; Filtration + UV + TiO2; and Filtration + electro-chlorination.
Deoxygenation is a physical-chemical process that kills organisms by creating severe hypoxia (through lowered pressure via venturi or vacuum, or lowered partial pressure via gas sparging with inert gasses). Cavitation is a physical-chemical process that kills organisms by the high pressure, shear forces, and shock waves generated by the collapse of vapor bubbles induced into the ballast water. Filtration describes a variety of physical separation processes, including screening to remove sediment and larger organisms resistant to disinfection, reduction of organic matter to reduce oxidant demand, and reduction of turbidity to increase transmittance of UV radiation. Chlorine dioxide and electro-chlorination are biocidal technologies that disinfect ballast water using the chemical disinfectants chlorine dioxide and chlorine; chlorine is generated by electrolytic processes using sea water as the source of ions. UV is a physical-chemical process that disinfects ballast water using photochemical reactions generated by ultraviolet light radiation. In the UV + TiO2 physical-chemical process, UV light also activates the surface of the titanium catalytic semiconductor, disinfecting ballast water using both photochemical and photocatalytic reactions (USEPA, 2011a).
2 Of the 15 individual ballast water treatment systems for which information was provided, the Panel concluded that nine ballast water treatment systems had reliable data for an assessment of performance and that five categories of ballast water treatment systems had been evaluated with sufficient rigor to permit a credible assessment of performance capabilities. (Source: USEPA, Science Advisory Board (SAB), Ecological Processes and Effects Committee, Efficacy of Ballast Water Treatment Systems, June 2011). This list does not exclude other technologies that may provide similar treatment results but were not evaluated by the panel due to lack of available data.
9

Ballast Water Discharges from Vessels Section 2 - Ballast Water Treatment Technologies
While ballast water treatment technologies reduce the probability of invasion of ANS, such treatment may introduce other water quality impacts, such as toxicity. For example, the addition or in-process generation of disinfecting chemicals may result in an effluent with some residual toxicity. Depending on the predicted or measured oxidant levels in the ballast water, a chemical neutralizing agent may need to be applied before ballast water discharge to comply with effluent limitations (USEPA, 2011a).
10
Ballast Water Discharges from Vessels Section 3 - Ballast Water Compliance Monitoring
SECTION 3
BALLAST WATER COMPLIANCE MONITORING
Ballast water treatment systems are designed to reduce the number of living organisms discharged in ballast water. Such reductions in these organisms will help reduce the risk of ANS establishing viable populations in new water bodies. To ensure the treatment systems are being operated properly once installed on a vessel, samples of ballast water effluent can be collected and analyzed, and specific treatment system operating parameters can be monitored, to indirectly verify the treatment system is achieving the intended effluent levels on an ongoing basis.
Measures of treatment performance for ballast water systems can include a variety of techniques ranging from collection of ballast water effluent samples for analysis of target organisms to monitoring operational parameters for the treatment technologies to verify they are within predetermined limits. Monitoring systems may also include features that provide automated operation and alarms, plus reporting and data logging to ensure treatment systems are continuously operating according to the manufacturer’s specifications (Hurley et al., 2001). The three categories of compliance monitoring are:
Physical/chemical indicators of treatment performance; Biological indicators of exceedances; and Effluent monitoring for residual biocides and biocide derivatives.
3.1 PHYSICAL-CHEMICAL INDICATORS OF TREATMENT PERFORMANCE
Physical/chemical indicators of treatment performance can be used to verify that the ballast water treatment system is operating according to the manufacturers’ requirements. Most ballast water treatment systems have control and self diagnostic equipment such as sensors that continuously measure treatment parameters to verify performance (Tamburri, 2011). Sensors commonly incorporated into the most frequently installed systems include flow meters, pH sensors, dissolved oxygen sensors, OPR and amperometric (TRO) sensors, and on-line chlorine analyzers (Tamburri, 2011). All of these meters and sensors have broad application in the water and wastewater treatment industry and are available off-the-shelf from many major equipment suppliers. Other ballast water treatment systems are provided with testing meters or kits, such as portable chlorine and dissolved ozone monitors, to verify adequate levels of treatment chemicals are being maintained within the ballast tanks. Vessel operators can monitor and record this data and make adjustments, maintenance, or repairs to the ballast water treatment system to ensure the equipment is functioning properly. Table 2 provides the anticipated control equipment and potential monitoring and reporting metrics for physical/chemical indicators by treatment technology.
11
Ballast Water Discharges from Vessels Section 3 - Ballast Water Compliance Monitoring
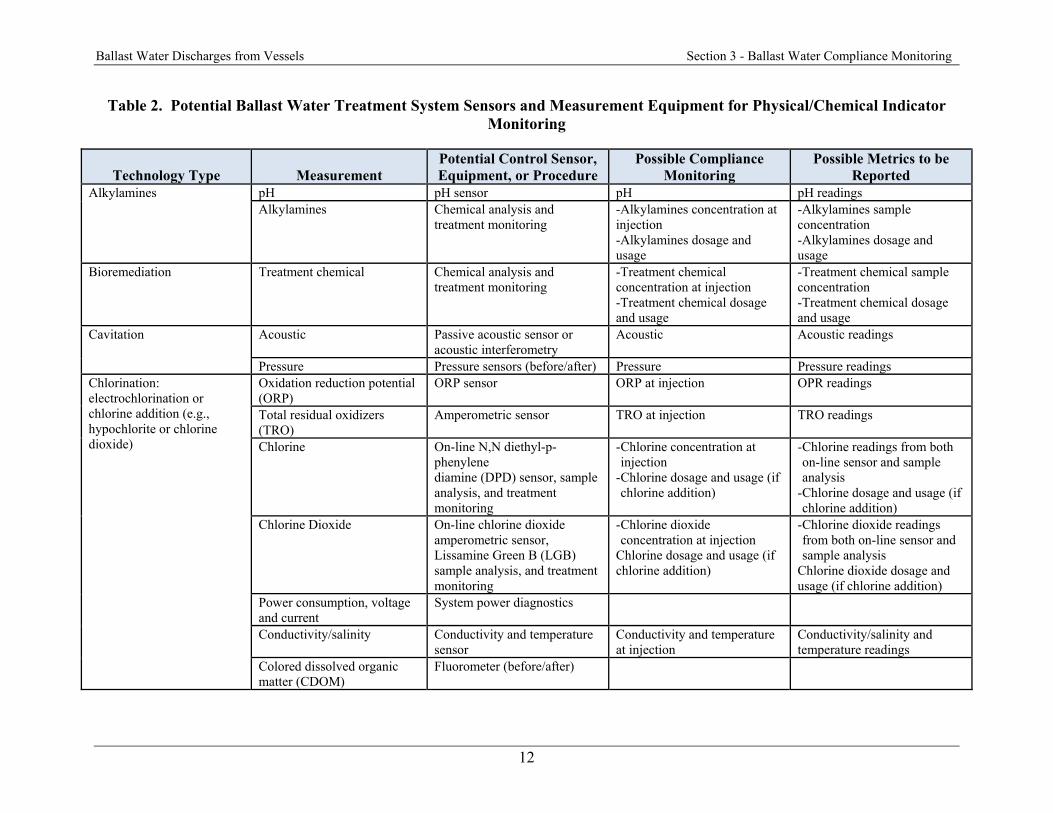
Table 2. Potential Ballast Water Treatment System Sensors and Measurement Equipment for Physical/Chemical Indicator Monitoring
Technology Type Measurement Potential Control Sensor, Equipment, or Procedure
Possible Compliance Monitoring
Possible Metrics to be Reported
Alkylamines pH pH sensor pH pH readings Alkylamines Chemical analysis and
treatment monitoring -Alkylamines concentration at injection -Alkylamines dosage and usage
-Alkylamines sample concentration -Alkylamines dosage and usage
Bioremediation Treatment chemical Chemical analysis and treatment monitoring
-Treatment chemical concentration at injection -Treatment chemical dosage and usage
-Treatment chemical sample concentration -Treatment chemical dosage and usage
Cavitation Acoustic Passive acoustic sensor or acoustic interferometry
Acoustic Acoustic readings
Pressure Pressure sensors (before/after) Pressure Pressure readings Chlorination: electrochlorination or chlorine addition (e.g., hypochlorite or chlorine dioxide)
Oxidation reduction potential (ORP)
ORP sensor ORP at injection OPR readings
Total residual oxidizers (TRO)
Amperometric sensor TRO at injection TRO readings
Chlorine On-line N,N diethyl-pphenylene diamine (DPD) sensor, sample analysis, and treatment monitoring
-Chlorine concentration at injection
-Chlorine dosage and usage (if chlorine addition)
-Chlorine readings from both on-line sensor and sample analysis
-Chlorine dosage and usage (if chlorine addition)
Chlorine Dioxide On-line chlorine dioxide amperometric sensor, Lissamine Green B (LGB) sample analysis, and treatment monitoring
-Chlorine dioxide concentration at injection
Chlorine dosage and usage (if chlorine addition)
-Chlorine dioxide readings from both on-line sensor and sample analysis
Chlorine dioxide dosage and usage (if chlorine addition)
Power consumption, voltage and current
System power diagnostics
Conductivity/salinity Conductivity and temperature sensor
Conductivity and temperature at injection
Conductivity/salinity and temperature readings
Colored dissolved organic matter (CDOM)
Fluorometer (before/after)
12

Ballast Water Discharges from Vessels Section 3 - Ballast Water Compliance Monitoring
Table 2. Potential Ballast Water Treatment System Sensors and Measurement Equipment for Physical/Chemical Indicator Monitoring
Technology Type Measurement Potential Control Sensor, Equipment, or Procedure
Possible Compliance Monitoring
Possible Metrics to be Reported
Coagulation (flocculent) Coagulant Chemical analysis and treatment monitoring
-Treatment chemical concentration at injection -Treatment chemical dosage and usage
- Treatment chemical sample concentration -Treatment chemical dosage and usage
Turbidity Turbidity sensor Coagulation effluent turbidity Coagulation effluent turbidities Deoxygenation Dose of inert gas (if used) Treatment monitoring Deoxygenation gas dosage and
usage Deoxygenation gas dosage and usage
pH (if CO2 used) pH sensor pH pH readings Dissolved Oxygen (DO) DO sensor Deoxygenation module
dissolved oxygen concentration
Dissolved oxygen concentrations
Electric pulse Power consumption, voltage and current
System power diagnostics Electric pulse module power consumption, voltage and current
Electric pulse module power consumption, voltage and current readings
Filtration Water clarity Sight glass, water sample, turbidity sensor, transmissometer
Filter effluent clarity Clarity readings
Flow rate Flow meter Filter effluent flow Flow readings Pressure Pressure sensors (before/after) Filter pressures (before/after) Filter pressures (before/after) Back flush frequency Treatment monitoring Filter backwash frequency Filter backwash frequencies
Heat Temperature Thermistors Treatment temperature Temperature readings Hydrocyclone Water clarity Sight glass, water sample,
turbidity sensor, transmissometers
Hydrocyclone effluent clarity Clarity readings
Back flush frequency Treatment monitoring Hydrocyclone back flush frequency
Hydrocyclone back flush frequencies
Power consumption, voltage and current
System power diagnostics Hydrocyclone power consumption, voltage and current
Hydrocyclone power consumption, voltage and current
Menadione/Vitamin K Menadione Chemical analysis and treatment monitoring
-Menadione/Vitamin K concentration at injection -Menadione/Vitamin K dosage and usage
-Menadione/Vitamin K concentration at injection -Menadione/Vitamin K dosage and usage
13

Ballast Water Discharges from Vessels Section 3 - Ballast Water Compliance Monitoring
Table 2. Potential Ballast Water Treatment System Sensors and Measurement Equipment for Physical/Chemical Indicator Monitoring
Technology Type Measurement Potential Control Sensor, Equipment, or Procedure
Possible Compliance Monitoring
Possible Metrics to be Reported
Ozone ORP ORP sensor ORP at ozone injection OPR readings TRO Amperometric sensor TRO at ozone injection TRO readings Ozone On-line ozone sensor (if used)
and sample analysis Ozone concentration at injection
Ozone readings from both online sensor (if used) and sample analysis
Bromate Sample analysis Bromate at ozone injection Bromate measurements Power consumption, voltage and current
System power diagnostics
Conductivity/salinity Conductivity and temperature sensor
Conductivity and temperature at injection
Conductivity/salinity and temperature readings
CDOM Fluorometer (before/after) Peracetic acid Hydrogen peroxide On-line sensor, chemical
analysis, treatment monitoring -Hydrogen peroxide concentration at injection -Hydrogen peroxide dosage and usage
-Hydrogen peroxide readings from both on-line sensor and sample analysis -Hydrogen peroxide dosage and usage
Peracetic acid On-line sensor, chemical analysis, treatment monitoring
-Peracetic acid concentration at injection -Peracetic acid dosage and usage
-Peracetic acid readings from both on-line sensor and sample analysis -Peracetic acid dosage and usage
pH pH sensor pH at injection pH readings CDOM Fluorometers (before/after)
Plasma pulse Power consumption, voltage and current
System power diagnostics Plasma pulse module power consumption, voltage and current
Plasma pulse module power consumption, voltage and current readings
Temperature Thermistors Treatment temperature Temperature readings Shear Acoustic Passive acoustic sensor or
acoustic interferometry Acoustic Acoustic readings
Pressure Pressure sensors (before/after) Pressure Pressure readings
14
Ballast Water Discharges from Vessels Section 3 - Ballast Water Compliance Monitoring
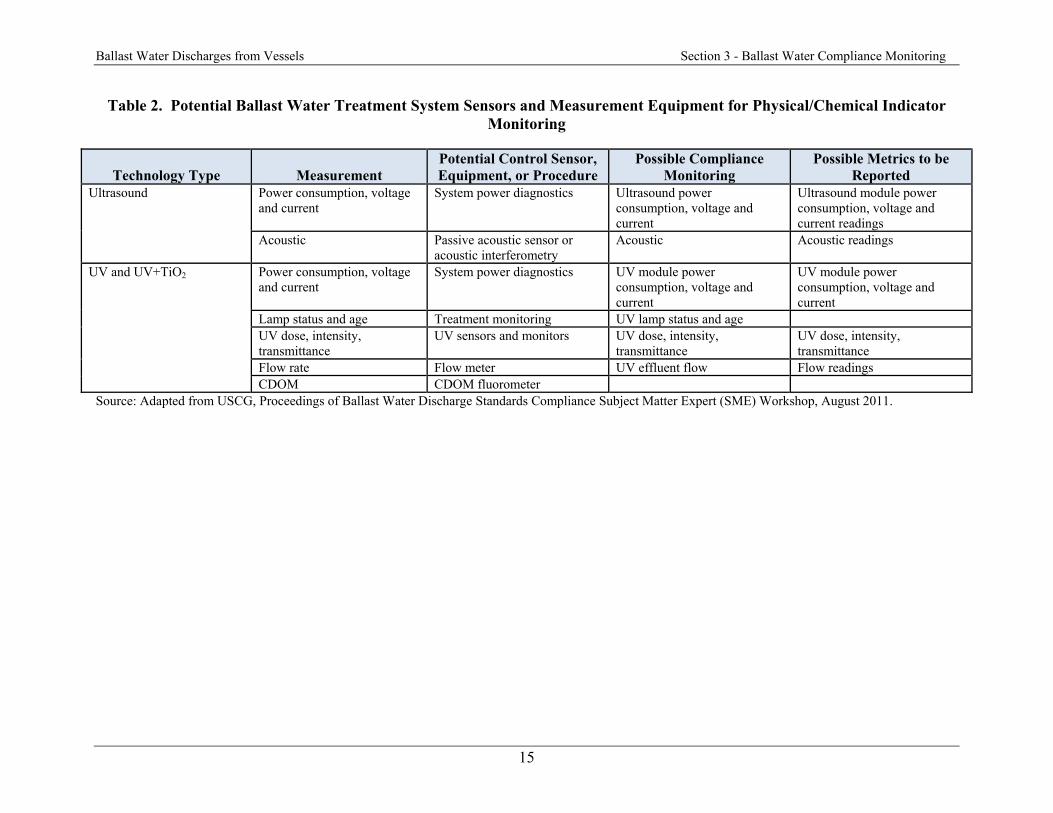
Table 2. Potential Ballast Water Treatment System Sensors and Measurement Equipment for Physical/Chemical Indicator Monitoring
Technology Type Measurement Potential Control Sensor, Equipment, or Procedure
Possible Compliance Monitoring
Possible Metrics to be Reported
Ultrasound Power consumption, voltage and current
System power diagnostics Ultrasound power consumption, voltage and current
Ultrasound module power consumption, voltage and current readings
Acoustic Passive acoustic sensor or acoustic interferometry
Acoustic Acoustic readings
UV and UV+TiO2 Power consumption, voltage and current
System power diagnostics UV module power consumption, voltage and current
UV module power consumption, voltage and current
Lamp status and age Treatment monitoring UV lamp status and age UV dose, intensity, transmittance
UV sensors and monitors UV dose, intensity, transmittance
UV dose, intensity, transmittance
Flow rate Flow meter UV effluent flow Flow readings CDOM CDOM fluorometer
Source: Adapted from USCG, Proceedings of Ballast Water Discharge Standards Compliance Subject Matter Expert (SME) Workshop, August 2011.
15

Ballast Water Discharges from Vessels Section 3 - Ballast Water Compliance Monitoring
Treatment Equipment Inspection and Maintenance
Ballast water treatment systems are designed and manufactured with various sensors and other control equipment to automatically monitor and adjust system operating conditions to ensure proper operation and to alert vessel personnel when intervention, maintenance, or repair is required. Sensors and other control equipment, interfaced to monitoring equipment to record operating parameters, also help vessel operators determine data trends while providing a mechanism for EPA to verify continuous compliance. The vendor’s Operating and Maintenance Manual typically specifies the applicable sensors and other control equipment for the ballast water treatment system, what constitutes a range of stable operating conditions for the system, factors that may affect operating conditions, and any adjustments required to reach or to maintain stable operating conditions (USEPA, 2010a). System monitoring and recording is expected to be continuous during discharge.
When alarms are initiated, or when sensors indicate the ballast water treatment system is not functioning properly, adherence with effluent limitations cannot be assured. To ensure effluent quality, consistent with vessel and crew safety, vessels should not discharge ballast water during alarm or upset conditions and should resume discharge only after correcting the problems with the system and reestablishing stable operating conditions.
Routine maintenance of the ballast water treatment system and troubleshooting procedures are typically defined in the system’s Operating and Maintenance Manual kept onboard the vessel. All maintenance activities related to the ballast water monitoring system and overboard discharge control unit can be recorded and the information can be retained on board for inspection purposes. In addition, vessel staff training could include familiarization with the operation and maintenance of the ballast water overboard discharge control and monitoring equipment. Ballast water treatment systems could be inspected on a monthly basis to determine both short-term and long-term maintenance needs as specified in the vendor’s Operating and Maintenance Manual.
Monitoring Equipment Calibration
All applicable sensors and other control equipment could be calibrated when warranted based on device drift and as recommended by sensor and equipment manufacturers, or by ballast water treatment system manufacturers. Due to the operating characteristics of sensors and control equipment, many sensor types (e.g., pH probes) may need to be calibrated on a more frequent basis to correct for instrument drift and ensure the measurement system is functioning properly. Calibration of the sensors and equipment could be conducted on-board the vessel, or the sensors and equipment could be removed and shipped to the manufacturer for calibration. During the period when the sensors are not installed and operating on the ballast water treatment system, the vessel should not discharge ballast water.
Ballast water treatment systems that are equipped with automated control systems that initiate a sequence to stop the overboard discharge of the effluent in alarm conditions could be subjected to an annual functional test to verify they are working correctly. The detailed program for a functional test of such equipment would typically be developed by the manufacturer, taking into account the features and functions of the specific design of the equipment and the operating
16
Ballast Water Discharges from Vessels Section 3 - Ballast Water Compliance Monitoring
and discharge conditions monitored. A copy of the functional test protocol could be carried onboard the vessel at all times so that functional testing can be conducted any time it is suspected the system is not operating as designed.
3.2 BIOLOGICAL INDICATORS OF EXCEEDANCES
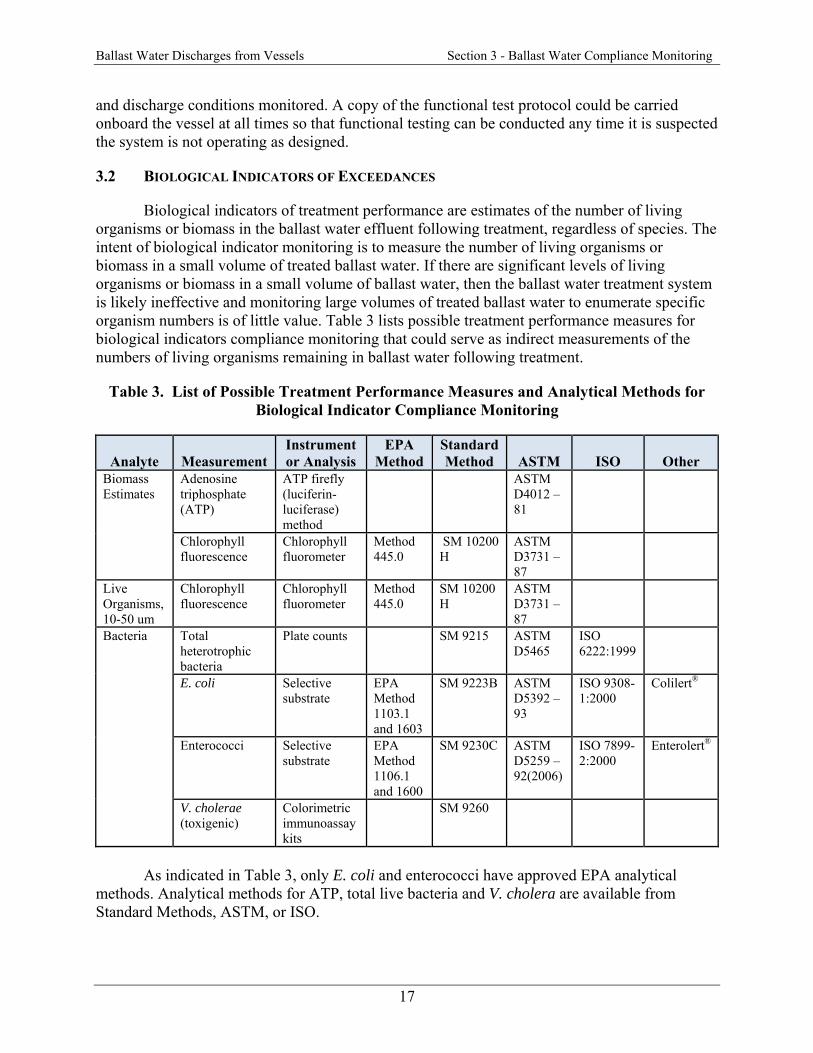
Biological indicators of treatment performance are estimates of the number of living organisms or biomass in the ballast water effluent following treatment, regardless of species. The intent of biological indicator monitoring is to measure the number of living organisms or biomass in a small volume of treated ballast water. If there are significant levels of living organisms or biomass in a small volume of ballast water, then the ballast water treatment system is likely ineffective and monitoring large volumes of treated ballast water to enumerate specific organism numbers is of little value. Table 3 lists possible treatment performance measures for biological indicators compliance monitoring that could serve as indirect measurements of the numbers of living organisms remaining in ballast water following treatment.
Table 3. List of Possible Treatment Performance Measures and Analytical Methods for Biological Indicator Compliance Monitoring
Analyte Measurement Instrument or Analysis
EPA Method
Standard Method ASTM ISO Other
Biomass Estimates
Adenosine triphosphate (ATP)
ATP firefly (luciferinluciferase) method
ASTM D4012 – 81
Chlorophyll fluorescence
Chlorophyll fluorometer
Method 445.0
SM 10200 H
ASTM D3731 – 87
Live Organisms, 10-50 um
Chlorophyll fluorescence
Chlorophyll fluorometer
Method 445.0
SM 10200 H
ASTM D3731 – 87
Bacteria Total heterotrophic bacteria
Plate counts SM 9215 ASTM D5465
ISO 6222:1999
E. coli Selective substrate
EPA Method 1103.1 and 1603
SM 9223B ASTM D5392 – 93
ISO 93081:2000
Colilert®
Enterococci Selective substrate
EPA Method 1106.1 and 1600
SM 9230C ASTM D5259 – 92(2006)
ISO 78992:2000
Enterolert®
V. cholerae (toxigenic)
Colorimetric immunoassay kits
SM 9260
As indicated in Table 3, only E. coli and enterococci have approved EPA analytical methods. Analytical methods for ATP, total live bacteria and V. cholera are available from Standard Methods, ASTM, or ISO.
17
Ballast Water Discharges from Vessels Section 3 - Ballast Water Compliance Monitoring
Care should be taken when collecting ballast water samples to enumerate living organisms. For example, sample volumes as large as 6,000 liters are necessary to measure organisms between 10 and 50 microns at levels as low as 0.01 individuals per milliliter (USEPA, 2010a). Due to the large sample volumes required for analysis and the anticipated costs when enumerating large organisms, self monitoring by counting large classes of living organisms of ballast water could be expensive, and it could be challenging to find sufficient numbers of qualified scientists and laboratories. For more information about the state of science enumerating living organisms in ballast water, see USEPA, 2010a or USEPA, 2011a.
Sampling for Exceedance
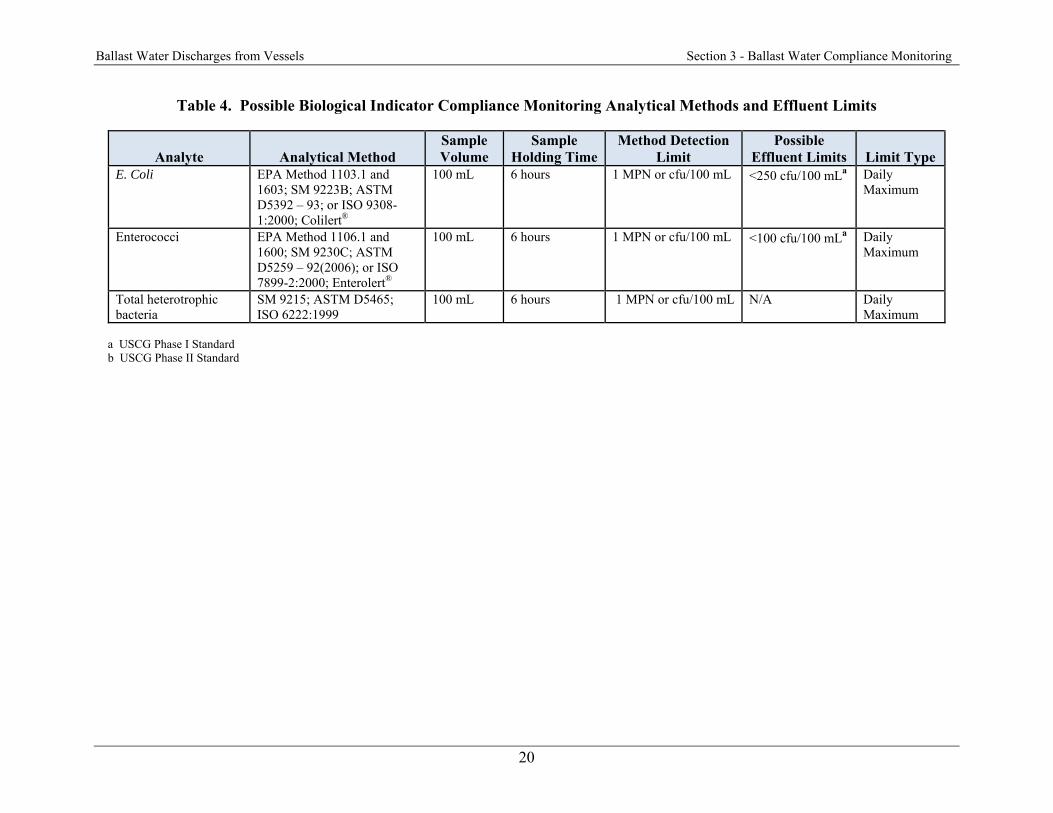
Biological indicator compliance monitoring sampling is intended to verify the treatment system is operating properly by collecting a small volume sample and analyzing the sample for concentrations of certain indicator parameters. Analysis of concentrations of indicator organisms should include at least E. coli and enterococci bacteria as these tests are cost effective and the methods are well developed. Biological indicator compliance monitoring sampling of ballast water effluent should be conducted over multiple sampling events to verify the system is operating properly. Vessels that enter U.S. waters on only a limited basis (e.g., one time per year), should conduct ballast water effluent monitoring within the previous three months and upon discharge into U.S. waters. Table 4 lists possible biological indicator compliance monitoring sampling analytical methods and the levels of indicator organisms (IMO, 2008) for treated ballast water. Vessel owners/operators could also sample and analyze ballast water discharges for other performance measures previously listed in Table 3.
If any of the biological indicator compliance monitoring effluent limits is exceeded, this is a clear indicator that the system is not meeting its discharge limits.
3.3 EFFLUENT MONITORING FOR RESIDUAL BIOCIDES
Some ballast water treatment systems generate or use biocides (e.g., chlorine dioxide) to reduce living organisms present in the ballast water tank. In the 2008 VGP, EPA required that any ballast water technology must not use any biocide that is a “pesticide” within the meaning of the Federal Insecticide, Fungicide, Rodenticide Act unless that biocide has been registered for use in ballast water treatment under such Act. Additionally, EPA required that vessels that used active substances must conduct additional monitoring as conditions of that permit (see Part 5.8 of the 2008 VGP) (USEPA, 2010b).
To assure that vessels are not discharging harmful quantities of active substances, for those vessels which have ballast water treatment systems that either add or generate biocides for treatment (e.g., chlorine, chlorine dioxide, ozone, etc.), the vessel should conduct monitoring of the vessel ballast water discharge for any residual biocides. For example, if chlorine is used as a biocide in ballast water treatment, the vessel owner/operator could test for residual chlorine in the vessel ballast water discharge. Table 5 provides a list of residual biocides and possible effluent limits3 for ballast water discharges. To verify residual biocide concentrations in ballast treatment effluent, vessel operators could initially collect a number of samples over the first few
3 Please see the 2013 proposed VGP fact sheet (EPA, 2011c) for discussion regarding the development of proposed effluent limits for the 2013 VGP.
18

Ballast Water Discharges from Vessels Section 3 - Ballast Water Compliance Monitoring
months of system operation (e.g., 3 to 5 samples spread over 3 months) and then continue to collect additional samples each year (e.g., 2 to 4 samples per year) to verify residual biocide levels are below discharge standards.
All sampling and testing for residual biocides should be conducted using sufficiently sensitive 40 CFR Part 136 methods or other methods if specifically listed to assure that high quality data are generated. Sensors or other test equipment that continuously monitor residual biocide in ballast water discharge would need to be sufficiently sensitive to measure biocide concentrations before and after any neutralization process to verify discharge concentrations and to control the neutralizer dose.
19
Ballast Water Discharges from Vessels Section 3 - Ballast Water Compliance Monitoring
Table 4. Possible Biological Indicator Compliance Monitoring Analytical Methods and Effluent Limits
Analyte Analytical Method Sample Volume
Sample Holding Time
Method Detection Limit
Possible Effluent Limits Limit Type
E. Coli EPA Method 1103.1 and 1603; SM 9223B; ASTM D5392 – 93; or ISO 93081:2000; Colilert®
100 mL 6 hours 1 MPN or cfu/100 mL <250 cfu/100 mLa Daily Maximum
Enterococci EPA Method 1106.1 and 1600; SM 9230C; ASTM D5259 – 92(2006); or ISO 7899-2:2000; Enterolert®
100 mL 6 hours 1 MPN or cfu/100 mL <100 cfu/100 mLa Daily Maximum
Total heterotrophic bacteria
SM 9215; ASTM D5465; ISO 6222:1999
100 mL 6 hours 1 MPN or cfu/100 mL N/A Daily Maximum
a USCG Phase I Standard b USCG Phase II Standard
20

Ballast Water Discharges from Vessels Section 3 - Ballast Water Compliance Monitoring
Table 5. Residual Biocides Compliance Monitoring Sampling Analytical Methods and Possible Action Levels
Biocide or Residual
Analytical Methods
Sample Volume
Sample Holding Time MDL
Possible Effluent
Limit Limit Type Alkylamines EPA Method
8360B and 8270D
25 mL (8260B) 14 days (8260B)
Varies by compound (8260D); 10 µg/L (8270C)
Report NA
Chlorine (expressed as Total Residual Oxidizers (TRO as TRC))
SM 4500-Cl G; ISO 7393/2
50 mL 15 minutes 10 µg/L, under ideal conditions
100 µg/L Instantaneous Maximum
Chlorine dioxide EPA Method 327.0-1; SM 4500 ClO2 E
16 mL (327.0-1) 4 hours (327.01); As soon as possible (SM)
Varies (327.0-1); 10 to 100 µg/L (SM)
200 µg/L Instantaneous Maximum
Ozone (expressed as Total Residual Oxidizers (TRO as TRC))
SM 4500-O3 B 50 mL As soon as possible
10 µg/L 100 µg/L Instantaneous Maximum
Peracetic Acid ISO / DIS 7157 25 ml As soon as possible
500 µg/L 500 µg/L Instantaneous Maximum
Hydrogen Peroxide (for systems using Peracetic Acid)
ISO / DIS 7157 25 ml As soon as possible
500 µg/L 1,000 µg/L Instantaneous Maximum
SM: Standard Methods MDL: Method detection limit NA: Not applicable
21
Ballast Water Discharges from Vessels Section 3 - Ballast Water Compliance Monitoring
3.4 EFFLUENT MONITORING FOR BIOCIDE DERIVATIVES
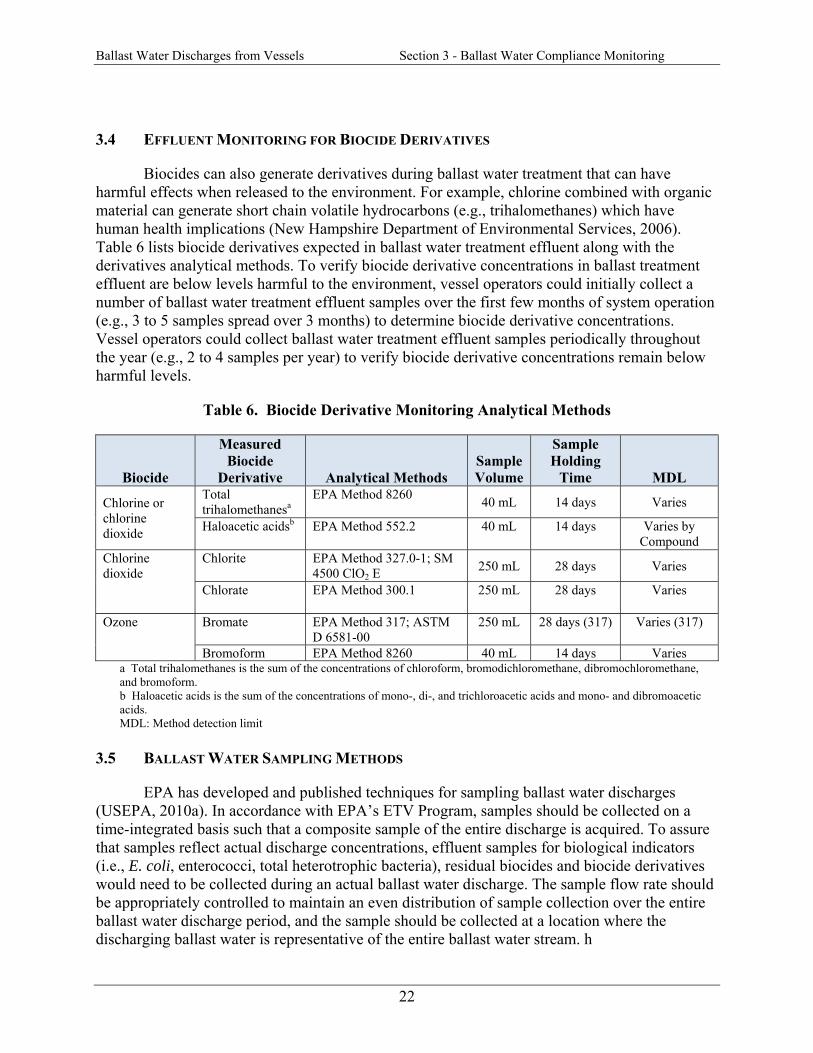
Biocides can also generate derivatives during ballast water treatment that can have harmful effects when released to the environment. For example, chlorine combined with organic material can generate short chain volatile hydrocarbons (e.g., trihalomethanes) which have human health implications (New Hampshire Department of Environmental Services, 2006). Table 6 lists biocide derivatives expected in ballast water treatment effluent along with the derivatives analytical methods. To verify biocide derivative concentrations in ballast treatment effluent are below levels harmful to the environment, vessel operators could initially collect a number of ballast water treatment effluent samples over the first few months of system operation (e.g., 3 to 5 samples spread over 3 months) to determine biocide derivative concentrations. Vessel operators could collect ballast water treatment effluent samples periodically throughout the year (e.g., 2 to 4 samples per year) to verify biocide derivative concentrations remain below harmful levels.
Table 6. Biocide Derivative Monitoring Analytical Methods
Biocide
Measured Biocide
Derivative Analytical Methods Sample Volume
Sample Holding
Time MDL
Chlorine or chlorine dioxide
Total trihalomethanesa
EPA Method 8260 40 mL 14 days Varies
Haloacetic acidsb EPA Method 552.2 40 mL 14 days Varies by Compound
Chlorine dioxide
Chlorite EPA Method 327.0-1; SM 4500 ClO2 E 250 mL 28 days Varies
Chlorate EPA Method 300.1 250 mL 28 days Varies
Ozone Bromate EPA Method 317; ASTM D 6581-00
250 mL 28 days (317) Varies (317)
Bromoform EPA Method 8260 40 mL 14 days Varies a Total trihalomethanes is the sum of the concentrations of chloroform, bromodichloromethane, dibromochloromethane, and bromoform. b Haloacetic acids is the sum of the concentrations of mono-, di-, and trichloroacetic acids and mono- and dibromoacetic acids. MDL: Method detection limit
3.5 BALLAST WATER SAMPLING METHODS
EPA has developed and published techniques for sampling ballast water discharges (USEPA, 2010a). In accordance with EPA’s ETV Program, samples should be collected on a time-integrated basis such that a composite sample of the entire discharge is acquired. To assure that samples reflect actual discharge concentrations, effluent samples for biological indicators (i.e., E. coli, enterococci, total heterotrophic bacteria), residual biocides and biocide derivatives would need to be collected during an actual ballast water discharge. The sample flow rate should be appropriately controlled to maintain an even distribution of sample collection over the entire ballast water discharge period, and the sample should be collected at a location where the discharging ballast water is representative of the entire ballast water stream. h
22
Ballast Water Discharges from Vessels Section 4 - Ballast Water Treatment Monitoring Costs
SECTION 4
BALLAST WATER TREATMENT MONITORING COSTS
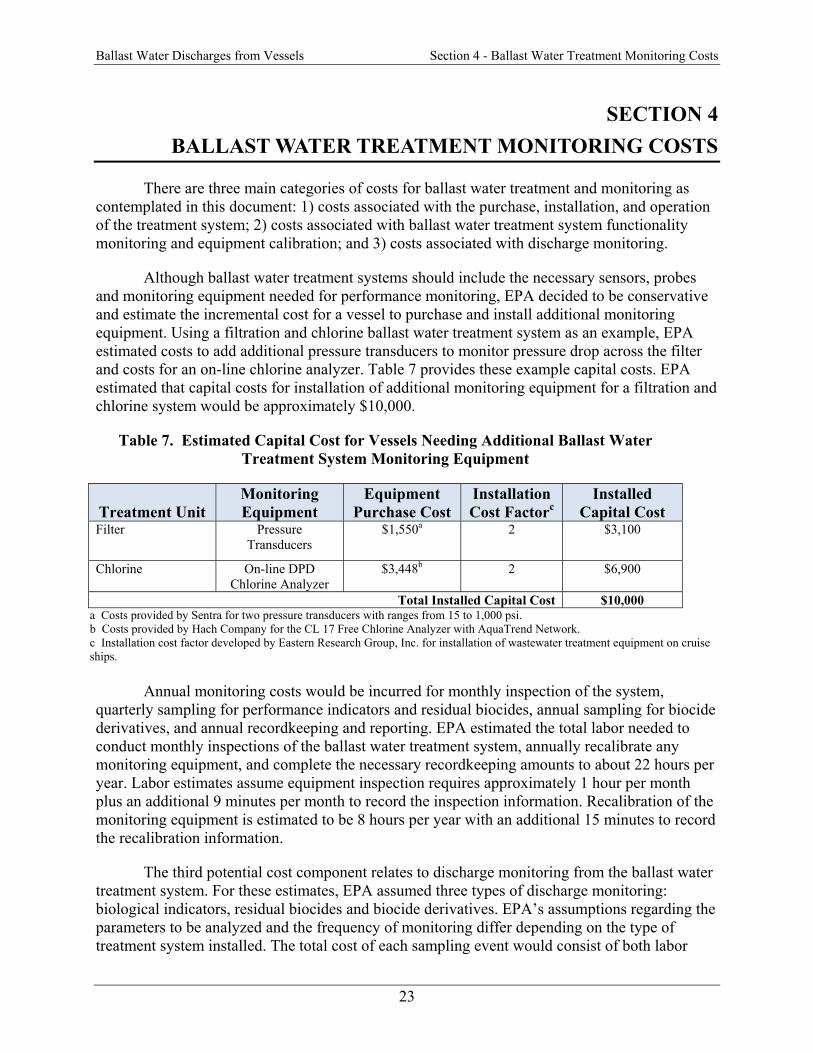
There are three main categories of costs for ballast water treatment and monitoring as contemplated in this document: 1) costs associated with the purchase, installation, and operation of the treatment system; 2) costs associated with ballast water treatment system functionality monitoring and equipment calibration; and 3) costs associated with discharge monitoring.
Although ballast water treatment systems should include the necessary sensors, probes and monitoring equipment needed for performance monitoring, EPA decided to be conservative and estimate the incremental cost for a vessel to purchase and install additional monitoring equipment. Using a filtration and chlorine ballast water treatment system as an example, EPA estimated costs to add additional pressure transducers to monitor pressure drop across the filter and costs for an on-line chlorine analyzer. Table 7 provides these example capital costs. EPA estimated that capital costs for installation of additional monitoring equipment for a filtration and chlorine system would be approximately $10,000.
Table 7. Estimated Capital Cost for Vessels Needing Additional Ballast Water Treatment System Monitoring Equipment
Treatment Unit Monitoring Equipment
Equipment Purchase Cost
Installation Cost Factorc
Installed Capital Cost
Filter Pressure Transducers
$1,550a 2 $3,100
Chlorine On-line DPD Chlorine Analyzer
$3,448b 2 $6,900
Total Installed Capital Cost $10,000 a Costs provided by Sentra for two pressure transducers with ranges from 15 to 1,000 psi. b Costs provided by Hach Company for the CL 17 Free Chlorine Analyzer with AquaTrend Network. c Installation cost factor developed by Eastern Research Group, Inc. for installation of wastewater treatment equipment on cruise ships.
Annual monitoring costs would be incurred for monthly inspection of the system, quarterly sampling for performance indicators and residual biocides, annual sampling for biocide derivatives, and annual recordkeeping and reporting. EPA estimated the total labor needed to conduct monthly inspections of the ballast water treatment system, annually recalibrate any monitoring equipment, and complete the necessary recordkeeping amounts to about 22 hours per year. Labor estimates assume equipment inspection requires approximately 1 hour per month plus an additional 9 minutes per month to record the inspection information. Recalibration of the monitoring equipment is estimated to be 8 hours per year with an additional 15 minutes to record the recalibration information.
The third potential cost component relates to discharge monitoring from the ballast water treatment system. For these estimates, EPA assumed three types of discharge monitoring: biological indicators, residual biocides and biocide derivatives. EPA’s assumptions regarding the parameters to be analyzed and the frequency of monitoring differ depending on the type of treatment system installed. The total cost of each sampling event would consist of both labor
23

Ballast Water Discharges from Vessels Section 4 - Ballast Water Treatment Monitoring Costs
hours for vessel staff to collect samples and either on-board sample analysis or send the samples to an onshore laboratory for analysis. EPA assumed that compliance testing of ballast water effluent would be conducted 2 times per year for vessels with type approved ballast water treatment systems and 4 times per year for non-type approved ballast water treatment systems.
EPA also assumed discharge testing for the presence of residual biocides and biocide derivatives, if applicable, several times during the initial 90 days of permit coverage, followed by maintenance monitoring thereafter. The number of sampling events assumed during the first 90 days (3 to 5 events) and the frequency of subsequent monitoring events (2 or 4 events per year) is dependent on the type of system.
EPA estimated that each sampling event would require 2 hours to complete and 0.5 hour to record. Additional sampling for biocides and biocide derivatives, in the case of vessels equipped with systems that have the potential to discharge residual biocides or biocide derivatives, is estimated to require an additional 1 hour to complete, and 0.5 hours to record. Table 8 presents the estimated costs for discharge sampling and analytical testing of ballast water discharges.
Table 8. Estimated Labor and Analytical Costs for Ballast Water Treatment System Discharge Sampling
Monitoring Requirement
Sample Collection Labor (hrs/event)
Sample Analysis and Incidentals
Cost ($/event)
Sampling Frequency (#
events/yr) Annual Costa
If using type approved ballast water treatment systems for which all type approval data is available Biological Indicator Sampling and Testingb 2.5 $150 2 $468
Initial Biocide Derivative Monitoringc,d 1.5 $150 3 $98e
Biocide Derivatives Monitoringd 1.5 $150 2 $401
If using non-type approved ballast water treatment systems or type approved systems which type approval data are not available
Biological Indicator Sampling and Testingb 2.5 $150 4 $937
Initial Biocide Derivative Monitoringc,d 1.5 $150 5 $196e
Biocide Derivatives Monitoringd 1.5 $150 4 $802
a Annual cost calculated as burden hours times the average labor rate of $33.72/hour plus lab and incidental costs times the frequency. b Costs for analysis of E. coli, enterococci and total live bacteria from Energy Laboratories c Analysis of residual biocide oxidizers such as chlorine, ozone and chlorine dioxide performed onboard due to short sample hold time d Cost for analysis of trihalomethanes or bromoform from Energy Laboratories e Annual cost represents one-time costs of initial testing annualized over 5 years of the VGP (assumes that the initial round of biocide sampling and testing replaces one periodic monitoring event).
24

Ballast Water Discharges from Vessels Section 4 - Ballast Water Treatment Monitoring Costs
Note that EPA assumed that vessels would test for the presence of residual biocides and their corresponding derivatives and analytes listed in Tables 5 and 6, namely: alkylamines, bromated, chlorate, chlorine or chlorine dioxide, hydrogen peroxide, ozone, and peracetic acid. More information on the costs associated with ballast water treatment system monitoring are provided in EPA’s Economic and Benefits Analysis of the 2013 Vessel General Permit (USEPA, 2011b).
25

Ballast Water Discharges from Vessels Section 5 - References
SECTION 5
REFERENCES
Albert, R., Everett, R., Lishman, J., and Smith, D. (2010). Availability and Efficacy of Ballast Water Treatment Technology: Background and Issue Paper. Prepared for Science Advisory Board, June 2010.
California State Lands Commission. (2010). 2010 Assessment of the Efficacy, Availability, and Environmental Impacts of Ballast Water Treatment Systems for Use in California Waters, August 2010.
California Environmental Protection Agency. (2002). Evaluation of Ballast Water Treatment Technology for Control of Nonindigenous Aquatic Organisms, December 2002.
Carlton, J.T. (2001). The Scale of Ecological Consequences of Biological Invasions in the Worlds Oceans. Invasive Species and Biodiversity Management. Kluwer Academic Publishers.
Carlton, J.T., Reid, D.M., and van Leeuwen, H. (1995). Shipping Study: The Role of Shipping in the Introduction of Nonindigenous Aquatic Organisms to the Coastal Waters of the United States (other than the Great Lakes) and an Analysis of Control Options (USCG Report No. CG-D-11-95).
Deines, A.M, Chen, V.C, and Landis, W.G. (2005). Modeling the Risks of Nonindigenous Species Introductions Using a Patch-Dynamics Approach Incorporating Contaminant Effects as a Disturbance. Risk Analysis, 25(6): 1637-1651.
Dobroski, N. Scianni, C., and Takata, L. (2009). October 2009 Update: Ballast Water Treatment Technologies for Use in California Waters. Prepared for the California State Lands Commission by the Marine Invasive Species Program, October 2009.
Drake, J.M., and Lodge, D.M. (2007). Rate of Species Introductions in the Great Lakes via Ships Ballast Water and Sediments. Canadian Journal of Fisheries and Aquatic Sciences, 64(3): 530 – 538.
Energy Laboratories. (2011). Energy Laboratories Pricing Guide. November 2011.
Faulkner, M. (2009). California Marine Invasive Species Program Update. Proceedings of the Pacific Ballast Water Group. Seattle, Washington, January 14, 2009.
Hach Company. (2011). CL17 Free Chlorine Analyzer with AquaTrend Network. October 2011.
Hayes, E.H. and Landis, W.G. (2004). Regional Ecological Risk Assessment of a Near Shore Marine Environment: Cherry Point, WA. Human and Ecological Risk Assessment, 10: 299 – 325.
26
Ballast Water Discharges from Vessels Section 5 - References
Hurley, W., Schilling, S.S, and Mackey, T. (2001). Contract Designs for Ballast Water Treatment Systems on Container Ship R.J. Pfeiffer and Tanker Polar Endeavor. Marine Environmental Engineering Technology Symposium (MEETS). Arlington, VA. June 1, 2001.
International Maritime Organization (IMO). (2008). Resolution Marine Environmental Protection Committee (MEPC) 174(58), Guidelines for Approval of Ballast Water Management Systems (G8).
Kasyan, V. (2010). Holoplankton of ship ballast water in the Port of Vladivostok. Russian Journal of Marine Biology. 36(3):167-175.
Keller, R.P. and Drake, J.M. (2011). Linking Environmental Conditions and Ship Movements To Estimate Invasive Species Transport Across the Global Shipping Network. Journal of Conservation Biogeography, 17, 1.
Lodge, D., and Finnoff, D. (2008). Invasive Species in the Great Lakes: Costing Us Our Future. Preliminary Results. University of Notre Dame.
Lovell, S.J., & Drake, L.A. (2009) Tiny stowaways: analyzing the economic benefits of a U.S. Environmental Protection Agency permit regulating ballast water discharges. Environmental Management, 43, 546-555.
Lloyd’s Register. (2010). Ballast water treatment technology: current status. London, England: Lloyd’s Register. February, 2010.
MIT Sea Grant. (2002). Marine Bio-Invasion Fact Sheet: Ballast Water. Retrieved from http://massbay.mit.edu/exoticspecies/ballast/fact.html
New Hampshire Department of Environmental Services. (2006). Trihalomethanes: Health Information Summary (ARD-EHP-13).
Pennsylvania Sea Grant. (2003). Proceedings Aquatic Invaders of the Delaware Estuary Symposium. Penn State Great Valley Campus.
Perrings, C. (2002). Biological Invasions in Aquatic Systems: The Economic Problem. Bulletin of Marine Science, 70(2), 541-552.
Prince William Sound Regional Citizens’ Advisory Council. (2005). Prince William Sound Alaska Crude Oil Tankers, Fact Sheet. Ballast Water Treatment Methods .
Raikow, D.F. and Reid, D. (2006). Sensitivity of Aquatic Invertebrate Eggs to SeaKleen: A Test of Potential Ballast Tank Treatment Options. Environmental Toxicology and Chemistry, 25, 2, 552-559.
Sentra. (2011). AccuSense Model ASM High Accuracy Pressure Transducer.
27

Ballast Water Discharges from Vessels Section 5 - References
Tamburri, M. (2011). Personal Communication. Maritime Environmental Resource Center (MERC), University of Maryland Chesapeake Biological Laboratory.
USCG. (2011). Draft Proceedings of Ballast Water Discharge Standards Compliance Subject Matter Expert (SME) Workshop.
USEPA. (2011a). Science Advisory Board (SAB), Ecological Processes and Effects Committee, Efficacy of Ballast Water Treatment Systems.
USEPA. (2011b). Economic and Benefits Analysis of the 2013 Vessel General Permit.
USEPA. (2010a) Generic Protocol for the Verification of Ballast Water Treatment Technologies (EPA/600/R-10/146). Environmental Technology Verification (ETV) Program
USEPA. (2010b) Vessel General Permit.
USEPA. (2008). Vessel General Permit Fact Sheet.
USEPA. (2001). Aquatic Nuisance Species in Ballast Water Discharges: Issues and Options.
USEPA. (1986). Quality Criteria for Water [Gold Book].
28