balanced scorecard for tpm maintenance...
TRANSCRIPT

Vol. 8 nº 2 December 2010 143Product: Management & Development
Balanced scorecard for TPM maintenance management
Eduardo Biasotto, Acires Dias, André OgliariSanta Catarina Federal University
e-mails: [email protected]; [email protected]; [email protected]
Abstract: This paper proposes the use of Balanced Scorecard (BSC), a strategic management methodology, for the improvement of the Planned Maintenance pillar of the Total Productive Maintenance (TPM) program once adopted by a pulp and paper plant in Brazil. The World Class Manufacturing pattern requires a high organizational level from the maintenance function in order to achieve an optimum plant performance. The TPM program provides the basis and culture for organization; however, it is necessary to make use of a strategic management method to assess the whole maintenance structure. The Balanced Scorecard allows the alignment of performance indicators to the proposed strategy for Planned Maintenance pillar (vision, mission and objectives) in four perspectives: financial, clients, internal process and learning & growth. Also, it provides a strategic map showing the dependency relationship (cause-effect) between the performance indicators to support actions (strategic initiatives) that the maintenance function must carry out in a continuous improvement cycle.
Keywords: balanced scorecard (BSC), maintenance management, total productive maintenance (TPM), performance indicators.
1. IntrodutionNowadays every company aims to increase, or at least
sustain, their profitability by controlling and reducing production costs. Maintenance activity is a fundamental pillar sustaining product high standards and plant availability. Without this viewpoint, the maintenance results remain restricted to the performance of each action, losing the overall perspective (DIAS, 2001).
The World Class Manufacturing (WCM) concept, originally introduced by Hayes and Wheelwright in 1984 (FLYNN; SCHROEDER; FLYNN, 1999), is characterized by high productivity, availability and flexibility. In order to achieve this higher development stage in the manufacturing processes, maintenance skills are a key element. The maintenance function adapted for the global competition environment characterizes World Class Maintenance.
Yamashina (2000) considered in his research on Japanese manufacturing companies that TPM (Total Productive Maintenance) maintenance management system along with the JIT (Just in Time) production system and TQM (Total Quality Management) are the path to reach the WCM concept in processes and innovative products.
Hendry (1998), Tsang (1998), Bond (1999), Liyanage and Kumar (2003) and Dunn (2003) assert that world class performance in the maintenance function depends on metrics that can be obtained by a benchmarking process. Therefore, performance indicator systems linked
to an organization strategy become essential to reaching excellence in maintenance processes.
Amendola (2003), Ahlmann (2002), Ellingsen et al., (2002) and Biasotto, Dias and Ogliari (2006a) recommend the Balanced Scorecard (BSC) methodology to integrate a specific maintenance strategy system to the whole plant evolution. Maintenance is a strategic function in companies business, particularly for those with a continuous process and high stoppage cost. BSC application has led to excellent results since its popularization in 1992 by its two authors Robert Kaplan and David Norton.
TPM is incapable to identify critical points in maintenance performance by treating financial indicators and performance indicators separately. This limitation motivated the research, proposing a BSC approach to the Planned Maintenance pillar in TPM program, bringing shop floor actions (autonomous maintenance) near to maintenance strategic plan and overall company results, fundamental issue to reach WCM pattern.
The article presents a brief introduction about TPM, BSC focused on maintenance and further discussions. Also, comments about TPM program case study released in 2006 by Biasotto (2006b) in a paper mill from Klabin S.A., a long-standing company in the pulp and paper business in Brazil, followed by the BSC proposal for its maintenance management system.

Balanced scorecard for TPM maintenance management Biasotto et al.144
2. TPM - Total Productive Maintenance
Total Productive Maintenance (TPM) is a worldwide known management system, born in 1971 in Nippon Denso, a Toyota division in Japan, which basic aims the loss elimination in plant processes by continuous training and machine control, improved quality activities, safety and environmental care. This methodology has been well received over the years. Its concepts are been increasing to all sectors of the company.
According to Palmeira (2000) the fourth TPM generation, after 1999, involves all organization sectors in the loss elimination concept, cost reduction and effi ciency maximization, including sales and product development integration, introducing a more strategic view for the administration process, including inventory, logistics and purchase process.
Although consider each particular culture in the TPM program implementation, some basic principles are common to all. These are called the TPM “pillars” (NAKAJIMA, 1989; PALMEIRA, 2002) and are described as follows:
• FocusedImprovementPillar:correctivemaintenanceconcept in equipment with chronical losses;
• Autonomous Maintenance Pillar: focused ontheoretical and practical employees training, teamwork spirit and continuous improvement of production and maintenance.
• PlannedMaintenancePillar:preventivemaintenanceroutines based on time (TBM) or on equipment condition (CBM), seeking the continuous improvement in availability and reliability besides maintenance cost reduction. (This pillar is the main subject in this article, where the case study was applied.)
• Training Pillar: technical and compartmentalqualifi cations for team leadership, fl exibility and autonomy;
• Product Development Pillar: based on preventivemaintenance concepts where all the previous equipment reports are used in the product development in order to build equipment with greater reliability and higher maintainability indexes.
• Quality Maintenance Pillar: interaction betweenequipment reliability, product quality and demand capacity.
• Safety, Health and the Environment Pillar: basedon the others pillars actions and consequences. This pillar focuses in better working conditions, safety and environmental risk reduction; and
• Administration Process Improvement Pillar:also known as TPM Offi ce, this pillar deals with organizational losses in administrative routines that somehow interfere in the production process and equipment effi ciency.
3. Balanced Scorecard (BSC)
Kaplan and Norton (1992) developed a strategic management system, based on performance indicators, called out the Balanced Scorecard (BSC). It translates the business view and strategy into more tangible objectives and targets for all organization levels by fi nancial and non fi nancial tendency indicators with internal and external perspectives. The BSC promotes balanced performance indicators based on four perspectives: fi nancial, internal business processes, learning and growth, and customer’s perspective, as shown in Figure 1.
Figure 1. The Main Framework of the Balanced Scorecard (KAPLAN; NORTON, 1996).
Vol. 8 nº 2 December 2010 145Product: Management & Development
According Kaplan and Norton (1996 apud TSANG, 2002) states that managers frequently consider the regular business strategies too abstract to lead day-to-day decisions. Using the BSC, the strategy is translated into something more tangible and operational – linking long-term objectives, performance metrics, their targets and action plans.
4. BSC methodology with maintenance focusDunn (2003) re-exams the Balanced Scorecard for
maintenance process in its four perspectives:• The ShareholdersView (financial) – measures of
interesting that should be developed here includes service costs and asset integrity risks.
• The CustomersView (costumers) – refers to theproduction line as the main “customer” from maintenance function. So, the maintenance performance could be measured by equipment availability and reliability, overall equipment efficiency, besides breakdown response times, maintenance workmanship quality, etc.
• TheInternalProcessView(internalbusinessprocess)– In this case, the concerns are about to measure planned work, scheduled task for labor productivity, the nature of “on-the-job” delays that have occurred, or the number of unpredicted failures, in other words, the maintenance department performance and efficiency;
• The Learning Organization view (Learning andGrowth) - cares about company specific needs about training, outsourcing and new techniques adoption.
To Wireman (1998), the grouping of perspectives according to management competences provides the connection between the strategy and the operation. There are countless methodologies available in the market to evaluate the specific processes in maintenance that should be in agreement with its importance to the overall company performance.
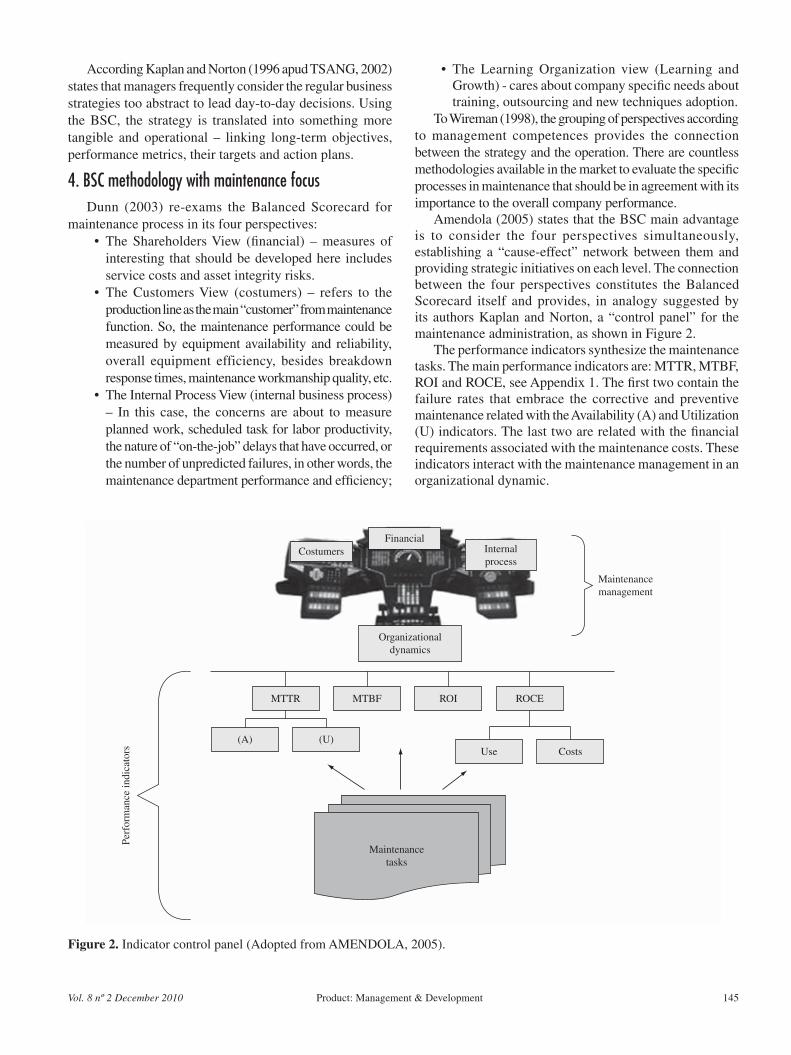
Amendola (2005) states that the BSC main advantage is to consider the four perspectives simultaneously, establishing a “cause-effect” network between them and providing strategic initiatives on each level. The connection between the four perspectives constitutes the Balanced Scorecard itself and provides, in analogy suggested by its authors Kaplan and Norton, a “control panel” for the maintenance administration, as shown in Figure 2.
The performance indicators synthesize the maintenance tasks. The main performance indicators are: MTTR, MTBF, ROI and ROCE, see Appendix 1. The first two contain the failure rates that embrace the corrective and preventive maintenance related with the Availability (A) and Utilization (U) indicators. The last two are related with the financial requirements associated with the maintenance costs. These indicators interact with the maintenance management in an organizational dynamic.
Figure 2. Indicator control panel (Adopted from AMENDOLA, 2005).

Balanced scorecard for TPM maintenance management Biasotto et al.146
According to Dias (2001), the complex systems that require a systematic maintenance must be well prepared. They need to conciliate technical knowledge with modern management techniques. Reliability becomes a good ally to acquire knowledge about spare parts and their management, being MTBF and MTTR the performance indicators representing the system reliability.
5. Discussion
According to McAdam and Bailie (2002), TPM program alone is not a real strategy contributor. It is based in basic operational delays and suffer a lack in developing leadership measures. However, it brings the strategy plan necessity to whole company, what is well evidenced in its principles.
In organizations where the TPM program has been adopted, routine servicing and periodic inspection of equipment are carried out by the operator, while the project revision and the main repairs are under maintenance unit responsibility. The phrase “What gets measured gets done” by Peters and Waterman (1982 apud TSANG, 1998) emphasizes how the performance measurement system infl uences employee’s behavior. Thus, it is desirable a measurement system linking the organizational strategy with the shop fl oor employee performance, in order to obtain the maximum impact.
The Overall Equipment Effectiveness (OEE), an index globally used to measure the results obtained with the TPM implantation based on equipment availability, operational performance and product quality, but it is not necessarily useful to evaluate the organization development. Tsang (2002) designates the BSC as a way to overcome the OEE inability to provide a holistic assessment for the whole maintenance organizational performance and its lack of forecast indicators, due to its equipment focus only. Tsang also notes that the OEE measure and the BSC methodology can be combined to create value in organizations without fi nancial restrictions.
In order to reach World Class pattern, Ahlmann (2002) emphasizes a considerable reduction in total lead time, from product development cycle until its order to sale. This can be achieved by greater availability and a transition from sequential planning to parallel modularized steps, inducing a reduction in development time from years to months and perhaps even weeks. The Balanced Scorecard replaces the traditional and one-dimensional fi nancial perspective for a balanced approach based on the four perspectives. MRP, TPM are the fi rst tactical step to guide production and obtain an overview. Their implementation is time-consuming and doubtful, requiring extraordinarily management dedication and personnel motivation. Experience shows that cash fl ow will decrease at the beginning of the TPM program. However, if the administration retains the strength to follow through, the cash fl ow will later increase and ensure a long-term profi t growth often impossible for the competitors to surpass.
With the maintenance objectives defi ned and compatible with the company’s strategic position, it is necessary to create instruments allowing to visualize how advanced the objectives comparing with the targets to be reached or, alternatively, whether they have undergone any deviations that require corrective actions. In terms of the objectives, in general, there is no fast and precise way for the manager to take action before the deviations reach a state which is diffi cult or impossible to recover.
6. Methodology
According to Amendola (2003), the methodological reference introduced by Kaplan and Norton can be applied in maintenance management systems in what Amendola calls a “Four-Stage Model”, as illustrated in Figure 3.
This implantation sequence has been adopted by several companies in business processes and should be able to succeed in maintenance. The model adapts the conceptual base from the BSC methodology to the actors involved, from the shop fl oor level up to the maintenance manager.
The four stages consist of the deployment of company strategic planning, starting from the maintenance mission in the company’s process up to the performance indicators and their popularization in a top-down manner. The products in each stage must consider the Success Critical Factors (SCF) from the maintenance mission, a cause-effect analysis between the objectives and their related performance indicators, all shown in strategic maps, the strongest tool in this method.
The sequence allows capturing maintenance strategic objectives, translating them into a measurement system through performance indicators, concerning a variety of strategic and operational situations that the maintenance structure can passing through.
Figure 3. Four-Stage Model (adopted from AMENDOLA, 2003).

Vol. 8 nº 2 December 2010 147Product: Management & Development
7. The TPM program in KlabinKlabin is the largest Brazil paper manufacturer and
exporter, being market leader in producing paper and board packaging, corrugated boxes and industrial sacks. It is also the biggest paper recycler in South America and it produces and sells wood in logs. Founded in 1899, today it has 17 industrial plants in Brazil, spread around eight states and one in Argentina. It is organized into four business units: forestry, paper, corrugated packaging and industrial sacks. The main plant is a paper and board packaging plant located in Telêmaco Borba town, in Parana state, called KPMA (Klabin Papéis, Monte Alegre).
The TPM implantation process in KPMA was driven by the necessity to compete at global excellence levels and, in the same way, to consolidate a management system that must be disseminated throughout the organization, based on problem solving, man hours and continuous improvement.
Seeking to align people and actions in the same direction, the TPM implantation process at KPMA was called “the SUPERAR program” (superar means to surpass in Portuguese), aiming to break limits and increase competitiveness.
The program main objective is to overcome problems and surpass limits continuously, through new tools dissemination, new resolution processes, team work, being the employees the main asset of the company. By that, the SUPERAR Program “Vision” was defined as – “engage employees, improve KPI and achieve the TPM Award”.
Since 1971, the JIPM (Japanese Institute of Plant Maintenance), the organization responsible for TPM global dissemination, which awards the companies, inside and outside Japan, by auditing excellence in the TPM implantation and sustaining (NAKAJIMA, 1989).
Figure 4 shows the SUPERAR sustaining pillars to reach the world class pattern in excellence, productive, quality, cost, delivery, morale and safety. The pillars are based on quality tools, OEE implement and other performance indicators in each specialized area and to identify the improvement points.
Proceeding with the TPM implantation plan, the Planned Maintenance Pillar was created, seeking to optimize the maintenance managerial process, establishing policies, methods, activities procedures, elimination of weak points; employee’s training, involving the production staff in machine control. Based on its activities the Maintenance Planned Pillar “Mission” was defined as: “Increase the availability and reliability of the machines and installations with safety and adequate costs.”
The pillar presents a lack in controlling and communicating means between the work done by the employee and the administration goals used to check the Planned Maintenance Pillar success in its defined mission, damaging the employee’s commitment with the program. That is the deficiency where the BSC can be used to link the shop floor results with the goals of the maintenance administration through interconnected performance indicators.
Figure 4. TPM Pillars (Superar Program, Klabin S.A.).

Balanced scorecard for TPM maintenance management Biasotto et al.148
A case study in KPMA plant will be presented below, in which the BSC was implemented in the Planned Maintenance Pillar. This case was developed aiming to optimize the pillar’s results and upgrade the whole TPM program concept.
8. Case studyIn way to apply the BSC methodology to a maintenance
structure based on the TPM system, the “Four-Stage Model” previously described was used. This methodology is suitable to manage the maintenance function, being simple and objective, showing how the BSC methodology can be applied in a TPM environment, by translating the Planned Maintenance Pillar strategy and showing the BSC contributions to the plant maintenance management.
This development process is expressed in Biasotto (2006b) in collaboration with the KPMA´s maintenance department.
The BSC adaptation proposal, its implantation method and problems related are detailed in the following sections.
8.1. Stage 1: StrategyThe fi rst stage is integrates the BSC with the Planned
Maintenance Pillar plan, highlighting the BSC contribution to visualizing the relationship between the shop fl oor and the top managerial strategic plan.
Figure 5 shows the BSC dynamic using questions to defi ne the Success Critical Factors – SCFs to reach the pillar’s“Mission”andconsequentlyits“Vision”,asdefinedin section 7. Beginning with the fi nancial perspective, all four BSC perspectives will take shape.
The SCFs are the line actuation where the pillar team must perform in order to succeed in its maintenance management. The SCFs defi ned by the pillar team seek to:
• Reduce,eliminateandpreventbreakdowns;• ImplementaPlannedMaintenanceSystem;• SupportthegroupsofAutonomousMaintenance;• SupporttheQualityGuaranteeSystem;and• Controlandreducethemaintenancecosts.
Once the SCFs have been identifi ed, a cause-effect analysis must be done, taking care with possible confl icts between perspectives, as well as some synergy. So, a strategic planning map for the pillar achieves its Mission can be established, as shown in Figure 6.
From this preliminary strategic map it is possible to see clearly that the control and reduction of the maintenance costs (financial perspective) will occur through the reduction, elimination and prevention of breakdowns jointly with a quality guarantee system for the plant operation (costumer perspective).
This will be possible with a planned maintenance system in the maintenance department (internal process) by training the autonomous maintenance teams (learning and growth), the staff responsible for plant operation and maintenance. With this relationship it can be noted that the SCF requiring an Autonomous Maintenance Team support, based on employees training and qualifi cation, characterizes the pillar base to obtain success in all other BSC perspectives.
The next step involves identify the strategic objectives where the Planned Maintenance Team must actuate to succeed.
Figure 5. BSC dynamic to defi ne the SCF.Figure 6. Planned Maintenance Pillar strategic planning map with its SCFs.

Vol. 8 nº 2 December 2010 149Product: Management & Development
8.2. Stage 2: Strategic objectivesProceeding with the strategy translation process,
according with the Amendola`s methodology, the strategic objectives are now identified, from the SCFs deployment considered in the previous stage.
The “strategic objectives” are the key actuation points where the pillar must act, as shown in Table 1, based on availability, reliability, costs, energy consumption, systemic improvement and employee characteristics. Now the key actuation points become objectives related to a strategy, specifying where the maintenance management pillar must act to succeed in its strategy.
8.3. Stage 3: Performance indicatorsPerformance indicators are introduced to evaluate
maintenance staff actions to accomplish the pillar strategy, related to each strategic objective defined. The performance indicators selected for the Planned Maintenance Pillar are given in Table 2.
Observing that the same performance indicator could refers to more than one strategic objective, like the “Replacement Pieces” indicator, that refers not only to a ideal maintenance policy (systemic improvement) in the internal process perspective but, also, it indicates a spare parts reduction (costs strategic objective) in the financial perspective.
The other internal process indicator, the “Monthly Number of Breakdowns per Machine” refers to a breakdown analysis system necessity (systemic improvement), as well as to breakdown prevention (reliability) and breakdown reduction (availability).
On the other hand, some strategic objectives, such as spare parts reduction and rework elimination (costs), in the BSC’s financial perspective, are not directly supported by an performance indicator but, generically assessed by cost indicators like the “Maintenance Cost (% cost based on costs of the base year 2002)” and “Specific Maintenance Cost”. Besides “TFG - General Accident Frequency Rate” and “Training” indexes, which measure the pillar management performance in the learning and growth strategic objectives of the BSC.
The Operational Availability (Ao), defined by
Blanchard,VermaandPeterson(1995),canbecalculatedas the MTBM (Mean Time between Maintenance) divided by the sum of MTBM plus MDT (Mean Downtime). Also the MTBM indicator can be approximated to MTBF (Mean Time Between Failures), then, the equation will be A
o = MTBF / MTBF + MDT. So, the “OEE – Availability
of Maintenance”, our operation availability measurement from the costumer perspective, is directly dependent on the MTBF and MDT, also performance indicators from the costumer’s perspective.
Table 1. Strategic objectives for the Planned Maintenance Pillar.
BSC´S perspectives Success critical factors – SCF Strategic objectives
FinancialControl and reduce the
maintenance costs
Costs•Materialwastereduction•Sparepartsreduction•Reworkelimination
Power consumption•Usageoptimization•Lossesreduction
CostumerSupport the Quality Guarantee
System & Reduce, eliminate and prevent breakdowns
Availability•Breakdownreduction•MDTandMTTRreduction•Maintenancescheduleimprovement
Reliability•IncreaseMTBF•Breakdownprevention•RCMandFMEA
Internal process
Implement a planned maintenance system
Systematic improvement•Idealpolicyofmaintenance•Breakdownanalysissystem•Supporttoautonomousmaintenance•Supporttoqualitysystem
Learning and growth
Support the groups of autonomous maintenance
Employees•Skill´sdevelopment(operatorandmaintenanceworker)•Occupationalaccidentsreduction

Balanced scorecard for TPM maintenance management Biasotto et al.150
Table 2. Planned Maintenance Pillar indicators.
BSC SCF Strategic objectives
Performance indicators Unity
FinancialControl and reduce the
maintenance costs
Costs
Maintenance Cost (% cost based on costs of the base year 2002)
%
Maintenance Specific Cost R$/t
Power consumption
Specific Consumption of Power MWh/t
Specific Consumption of Steam Gcal/t
Costumer
Support the Quality Guarantee System &
Reduce, eliminate and prevent breakdowns
AvailabilityOEE Fabric - Availability of Maintenance %
MDT per machine Hours
ReliabilityMTBF per machine Days
MTBF per plants Days
Internal process
Implement a planned maintenance system
Systematic improvement
Replacement pieces - average of time of permanence in stock
Years
Monthly number of breakdowns per machine Breakdown/machine
Learning and growth
Support the groups of autonomous maintenance
EmployeesTraining Hours training/man/year
TFG - General Accidents Frequency Rate Index
To clarify the dependency relation and functionality of each indicator, a strategic map is developed in Figure 7, showing the indicator’s compatibility with the pillar strategy, that is, its Mission, SCFs and strategic objectives in all BSC perspectives. The map also includes the inter-relations between the indicators, as stated by Kaplan and Norton (1997, p. 155)
[...] so that BSC reflects the organization strategies, it is fundamental that the four perspectives reflect the cause-effect relations between them, because the strategy is a set of hypotheses on cause and effect analyses.
The arrows on the strategic map of the Figure 7 demonstrate the cause-effect relations between the indicators. Which main function is to assist the pillar management in “strategic initiatives” to accomplish the pillar’s strategic objectives, as considered in Table 2.
For instance, the arrows on the map illustrate the strategic initiative to increase the employee training hours to reduce Monthly Number of Breakdowns per Machine (1), increasing the time between failures, the MTBF (2), promoting a greater plant availability, the OEE (3) and, consequently, lowering the Maintenance Specific Cost (4).
Also, more training hours leads to a lower accident index, the TFG (5), and, consequently, a higher availability index, OEE and shorter maintenance time, by MDT (6), consequence of the expertise acquired by the operators in their training, which, of course, will influence on “Maintenance Specific Cost”(4).
Linking the facts, “training hours” is a strategic initiative originated from the “Support to Autonomous
Maintenance” SCF, in Figure 6, which comes from the “Skills Development” objective, in Table 1. So, through this strategic initiative the pillar Mission “Increase the availability and the reliability of the machines and installations with safety and adequate costs”, could be accomplished.
Other example is the strategic initiative to purchase material according to the MTBF per Machine decreases the Average of Time of Permanence in Stock (7), in favor of the Maintenance Specific Cost (4) reduction. Also, through the strategic map it becomes visible that the plan availability, due to the number of breakdowns, will influence directly the energy consumption and consequently the related maintenance costs.
These and other cause-effect relations can be established between the indicators, helping managers to take decisions, identify deficiencies and to project scenarios for future improvements.
In analogy to Figure 1, the Balanced Scorecard for the Planned Maintenance Pillar now can be performed in Figure 8, in which it is possible to visualize in the BSC perspectives:
• Thepillar’svisionandstrategy;• Thepillar’sstrategicobjectives;• Theperformanceindicatorstoevaluatethesuccess
in accomplishing these objectives;• Thetargetsforeachindicator,hereexemplifyingthe
goals for 2006, the year when this work was carried out; and
• Thestrategicinitiativestoreachthegoalsproposedfor each indicator.

Vol. 8 nº 2 December 2010 151Product: Management & Development
Figure 7. Strategic map for indicators of the Planned Maintenance Pillar.
Figure 8. BSC for Planned Maintenance Pillar.

Balanced scorecard for TPM maintenance management Biasotto et al.152
With this model, the pillar’s management can be carried out from its performance indicators as foreseen in the BSC methodology, not just visualizing the reduction in the cost indicators (financial perspective), as the usual administration focus, but considering that this reduction will depend of plant’s availability and reliability (costumers).What will happen with lower number of breakdowns (internal process) by employee’s training (learning and growth). This logic promotes a strategic maintenance management for TPM program as detailed in Biasotto (2006b).
8.4. Stage 4: ImplantationTo succeed in this methodology, a “strategic learning
cycle” must be performed (KAPLAN; NORTON, 2000), comprises the following activities:
• Organizationaldeployment:indicatorsdisseminationin whole company, through workshops, besides scorecards and strategic maps exhibition;
• Popularization:inatop-downway,firsttohighestadministration until reach the entire staff;
• Automation:datastorageandperformanceindicatorfollow-up driven by the BSC logic.
• Meetings to try hypotheses: analyze theproposedstrategy by the TPM maintenance team based in data collection, always considering supplier needs,
external consulting or the benchmarking process; and possibly reevaluate the strategic plan (new vision, mission and strategic objectives) to meet new and future challenges that will arise through cost reduction, plant availability needs, etc;
• Communicationwith theadministration:meetings with the highest manager to show the BSC evolution; and
• Feedback:applythestrategicchangesneededina“continuous improvement process”, which represents the biggest BSC methodology contribution to the TPM program.
9. Managing the planned maintenance pillar using BSCThe “continuous improvement process” represents
the greatest BSC advantage by integrating both, tactical management (financial perspective) and strategic management in the BSC perspectives, in a continuous process, what is called out by its authors “strategic double loop” (KAPLAN; NORTON, 2000), as shown in Figure 9.
In the traditional management model practiced by the planned maintenance pillar in KPMA plant, the focus revolves around the financial perspective through budget control and managerial reports with maintenance cost indicators. The BSC strategic management, as shown in this
Figure 9. Strategic double loop for the Planned Maintenance Pillar.

Vol. 8 nº 2 December 2010 153Product: Management & Development
Figure 10. Comparison between the actual management model and BSC’s strategic management.
paper, transfers the proposed strategy to the maintenance pillar, in strategic objectives linked to performance indicators, where the management is focused not only on considering the financial perspective (maintenance costs), but also on the maintenance clients (production sector and its machines), the internal process (work flow), and the learning and growth perspective (training and innovation). This comparison becomes clearly visible in Figure10.
Kaplan and Norton (1997) consider that a typical project to construct a BSC can take sixteen weeks without, however, spending all the time working with the scorecard activities.
10. ConclusionsThe BSC implantation to orient the maintenance
management based in TPM philosophy, as shown, does not necessarily requires a whole organizational change or a great investment, but rather the holistic vision promoted by the BSC in meetings already held by the pillar team.
BSC represents a natural evolution, for organizations seeking by World Class Manufacturing concept,what is not characterized by a steady ideal in the processes, but rather a constantly improving state.
11. ReferencesAHLMANN, H. R. From traditional practice to the new
understanding: the significance of life cycle profit concept in the management of industrial enterprises. In: IFRIMMMM CONFERENCE,2002,VäxjöSweden.Proceedings…
AMENDOLA, L. Balanced scorecard en la gestión del mantenimiento. 2003. Available from: <http://internal.dstm.com.ar/sites/mmnew/bib/notas/Amendola1.pdf>.
AMENDOLA, L. Sistemas balanceados de indicadores en la gestión de activos “Maintenance Scorecard”. 2005. Available from: <http://internal.dstm.com.ar/sites/mmnew/bib/notas/SBI.pdf>.
BIASOTTO, E. BSC application on TPM management: a case study in process industry. Dissertation (Master)-Santa Catarina´s Federal University, Technological Center, Mechanical Engineering Department, Florianópolis, 2006b. Available from: <http://www.tede.ufsc.br/teses/PEMC0935.pdf >.
BIASOTTO, E.; DIAS, A. C.; OGLIARI, A. Indicadores de desempenho para gerenciamento da manutenção de classe mundial. In: CONGRESSO NACIONAL EM ENGENHARIA MECÂNICA - CONEM, 4., 2006, Recife, PB. Anais… 2006a, v. 1, p. 1-11. Cod 09-517.
BLANCHARD, B. S.;VERMA, D.; PETERSON, E. L.Maintainability: a key to effective serviceability and maintenance management. New York: Wiley Interscience, 1995. 537 p.
BOND, T. C. The role of performance measurement in continuous improvement. International Journal of Operations & Production Management, v. 19, n. 12, p. 1318-1334, 1999.

Balanced scorecard for TPM maintenance management Biasotto et al.154
DIAS, A. C. Confiabilidade na manutenção industrial. In: ENCONTRO DE MANUTENÇÃO - EMAN, 2., 2001, São João Del Rei. Anais... São João Del Rei: Fundação de Ensino Superior de São João Del Rei, 2001. 1 CD-ROM.
DUNN, S. Benchmarking as a maintenance performance measurement and improvement technique. Assetivity Pty Ltd, 2003. Available from: http://www.plant-maintenance.com/articles/Maintenance_Benchmarking.pdf.
ELLINGSEN, H. P. et al. Management of assets, resources and maintenance by using a balanced scorecard based performance framework. In: INTERNATIONAL MAINTENANCE CONFERENCE: EUROMAINTENANCE, 16., 2002. Proceedings… p. 203-11.
FLYNN, B. B.; SCHROEDER, R. G.; FLYNN, E. J. World class manufacturing: an investigation of Hayes and Wheelwright’s foundation. Journal of Operations Management, v. 17, p. 249-269, 1999.
HENDRY, C. L. Applying world class manufacturing to make-to-order companies: problems and solutions. International Journal of Operations & Production Management, v. 18, n. 11, p. 1086-1100, 1998.
KAPLAN, R. S.; NORTON, D. P. A estratégia em ação. Rio de Janeiro: Campus, 1997. 344 p.
KAPLAN, R. S.; NORTON, D. P. Organização orientada para a estratégia: como as empresas que adotaram o Balanced Scorecard prosperam no novo ambiente de negócios. 4. ed. Rio de Janeiro: Campus, 2000.
KAPLAN, R. S.; NORTON, D. P. The Balanced Scorecard – Measures that Drive Performance. Harvard Business Review, p. 71-79, 1992.
LIYANAGE, J. P.; KUMAR U. Towards a value-based view
on operations and maintenance performance management.
Journal of Quality in Maintenance Engineering, v. 9,
n. 4, p. 333-350, 2003.
McADAM, R.; BAILIE, B. Business performance measures
and alignment Impact on strategy: the role of business
improvement models. International Journal of Operations & Production Management, v. 22, n. 9, p. 972-996, 2002.
NAKAJIMA, S. TPM development program: implementing
total productive maintenance. New York, NY: Cambridge
Productivity Press, 1989.
PALMEIRA, J. N.; TENÖRIO, F. G. Flexibilização organizacional: aplicação de um modelo de produtividade
total.RiodeJaneiro:FGVEletronorte,2002.276p.
TSANG, A. H. C. A strategic approach to managing
maintenance performance. Journal of Quality in Maintenance Engineering, v. 4, n. 2, p. 87-94, 1998.
TSANG, A. H. C. Strategic dimensions of maintenance
management. Journal of Quality in Maintenance Engineering, v. 8, n. 1, p. 7-39, 2002.
WIREMAN, T. Developing performance indicators for managing maintenance. New York: Industrial Press Inc.,
1998. 195 p.
YAMASHINA, H. Challenge to world-class manufacturing.
Journal of Quality in Maintenance Engineering, v. 17,
n. 2, p. 132-143, 2000.
Appendix 1. Abreviations.
BSC Balanced Scorecard OEE Overall Equipment EffectivenessCBM Condition-Based Maintenance RCM Reliability-centered MaintenanceJIPM Japanese Institute of Plant Maintenance ROCE Return On Capital EmploymentKPI Key Performance Indicator ROI Return On Investment
MDT Mean Downtime SCF Success Critical FactorsMRP Material Requirements Planning TBM Time Based Maintenance
MTBF Mean Time Between Failures TFG General Accident Frequency RateMTTF Mean Time To Fail TPM Total Productive MaintenanceMTBM Mean Time Between Maintenance TQM Total Quality ManagementMTTR Mean Time to Repair WCM World Class Manufacturing