balanced scorecard automation system in higher … · after kaplan and norton article in 1992, a...
TRANSCRIPT

European Journal of Computer Science and Information Technology
Vol.5, No.4, pp.25-49, August 2017
___Published by European Centre for Research Training and Development UK (www.eajournals.org)
25 ISSN 2054-0957 (Print), ISSN 2054-0965 (Online)
BALANCED SCORECARD AUTOMATION SYSTEM IN HIGHER EDUCATION
INSTITUTIONS
Dina Khalid Al-Harthi, Prof. Dr. Ibrahim Albidewi
Faculty of Computing and Information Technology, King Abdulaziz University
ABSTRACT: Due to the importance of managing organizational performance in directing
organization towards achieving its goals, a lot of measuring tools were developed to measure
organizational performance. One of the most important measuring tools is Balanced Scorecard
(BSC) that balanced between measuring the performance from financial and non-financial
aspects of organizations. Although the BSC has been applied widely in many organizations, its
implementation was limited to a few studies in the public educational sector. Also, most of BSC
implementation was manual or through spreadsheet applications like Microsoft Excel, which
made the process of tracking the performance challenging and unorganized. Therefore, the
purpose of this work is using technology to solve a major managerial issue by automating the
BSC in a full-scale system that enables the user to track, monitor and evaluate the performance
continuously, to ensure that organization is moving in the right direction to achieve its goals.
The system applied in government higher education institutions, and specifically in King
Abdulaziz University (KAU).
KEYWORDS: Balanced Scorecard, BSC, organizational performance.
INTRODUCTION
The revolution of information technology in 21st century prompted organizations to develop a
strategic plan that can keep up with the rapid development of technology (Kaplan & Norton
1996). A lot of organizations become more focused on implementing an E-strategy that reflects
the future position of the organization taking advantage of latest technologies (Kaplan &
Norton 1996). E-strategy defined as a set of arranged policies and procedures that aim to
develop economic and social aspects of the organization by using Information and
Communication Technologies (ICT) (Kamel 2010). An important point must be clarified: E-
strategy is not an IT strategy it’s how to capitalize information technology to improve
organization’s performance and position in the market (Nayeri, Mashhadi & Mohajeri 2008).
One of the most effective management tools for implementing strategies and measuring
organizational performance is Balanced Scorecard (BSC) (Kaplan & Norton 2004). BSC is a
set of matrices that helps organizations to activate their strategies and turn them into actions.
BSC help to measure organizational performance through four different perspectives reflect
the financial and non-financial aspect of organizations. BSC perspectives are learning &
growth perspective, internal processes perspective, customer perspective and financial
perspective (Kaplan & Norton 2004). Each perspective in BSC gives managers an answer for
a critical question (Kaplan and Norton 1992):
Is the company able to develop and create value? This question represents learning and
growth perspective. The goal of the perspective is to set all organization's techniques,
infrastructures, and abilities that push organization toward achieving its goals.

European Journal of Computer Science and Information Technology
Vol.5, No.4, pp.25-49, August 2017
___Published by European Centre for Research Training and Development UK (www.eajournals.org)
26 ISSN 2054-0957 (Print), ISSN 2054-0965 (Online)
What should the company excel at? Represents internal processes perspective. The
perspective focuses on internal methods that organization use to reach customer
satisfaction, and control organization’s internal activities.
What are customers’ opinions about the company? Represents customer perspective.
The core of this perspective is to meet customers’ needs as well as prompt organization
image in the industry.
How does the company deal with shareholders? That represents financial perspective.
Financial perspective focuses on developing the relationship with the shareholder, and
improves the financial status of the organization. It should be mentioned here that the
non-profit organization focuses on this perspective on how to invest in its internal
resources to earn value (Chen, Yang and Shiau 2006).
The role of the BSC is translating strategy objectives into targets that represent numerical goals
to achieve, key performance indicators (KPIs) also called measures and represent the
measurable value of achieving objectives, and initiatives that represent action plans for the
objectives (Kaplan and Norton 1992).
Research problem:
A lot of studies conducted on BSC topic, and many profit organizations in different fields
adapting BSC matrix after formulating their strategies and objectives (Yu et al, 2009). But a
few studies focus on BSC implementation in nonprofit organizations and specifically in higher
education institutions (HEI) (Papenhausen & Einstein 2006). As the nations’ economy is based
mainly on education, HEIs have an important role in the renaissance of nations’ economy. So
any HEI should concern not only on formulating its strategic plan but also concerned about
how to activate it to reach HEI its future objectives and vision (Nayeri, Mashhadi & Mohajeri
2008).
By focusing on one of the biggest government universities in Saudi Arabia, which is King
Abdulaziz University (KAU) in Jeddah, found that KAU formulates its strategy and objectives
based on five important strategic themes. Strategic themes are: teaching & learning, social
responsibility, scientific research, entrepreneurship, leadership & management (Strategic Plan
II-King Abdulaziz University 2009). After conducting the strategic plan, the university
prepares different performance tracing forms supervised by the Strategic Plan Committee to
see the progress of implementing agreed projects & programs, and ensure achieving strategic
objectives (Strategic Plan II-King Abdulaziz University 2009). Performance tracing forms
adapted based on the concept of BSC. And despite that, it didn’t achieve the most important
goal of BSC which is monitoring and tracking the performance continuously from one
integrated source. Furthermore, it didn’t engage all university members to unify the efforts for
one purpose which is achieving university’s goals. All of that necessitating developing the
concept of BSC implementation and make it more dynamic and effective, by automating the
BSC in a full-scale system.
Research Objectives
The main goal of this work is developing BSC automated system that can be adapt in HEIs.
The system implemented in KAU as a model, to control the process of measuring university
performance through achieving its strategic objectives. The developed system aims to enable
the user to:

European Journal of Computer Science and Information Technology
Vol.5, No.4, pp.25-49, August 2017
___Published by European Centre for Research Training and Development UK (www.eajournals.org)
27 ISSN 2054-0957 (Print), ISSN 2054-0965 (Online)
1. Construct
Setting BSC objectives, KPIs, targets, and initiatives
Updating and modifying BSC objectives, KPIs, targets, and initiatives
Add new achievements
2. Track
Tracking KPIs achievements through indicators that show KPI status at the moment.
Monitoring the performance from different organizational level of the university.
3. Evaluate
Extracting periodical reports for performance.
LITERATURE REVIEW
Performance Measurement
Based on Kaplan and Norton (2004) principle "you can't manage what you can't measure", a
lot of researchers in the past few decades focused their studies and researches on how to
measure organizations performance to manage the business in the optimal way (Kaplan &
Norton 2004). Teague and Eilon (1973) explained the purpose of performance management
from helping the organization to reach its goals to control corganization processes. In addition,
performance management evaluates the performance of the organization as a whole or the
internal teams and individuals. Performance management depends on different metrics to
measure performance called performance measurements (Neely, Gregory and Platts 1995).
Neely, Gregory and Platts (1995) identified Performance measurements as the process of
measuring the efficiency and the effectiveness of certain job. Efficiency and effectiveness are
fundamental dimensions of performance, where efficiency refers to the degree of company
investment in resources, and effectiveness refers to the degree of customer satisfaction. (Neely,
Gregory and Platts 1995).
A lot of researches have emerged during the 1970s to 1980s, criticized the traditional way of
measuring the performance that focused only on financial perspectives and how to gain more
revenues (Kaplan, 2010). In the late 1980s, the process of measuring performance started to
change, and many researchers encouraged to concentrate more on non-financial measures like
quality, on time deliveries and employee ethics that benefit companies in the long term (Hoque
2014). Researchers' orientation at that time prompted Fitzgerald (1991) to come up with a
performance model consist of six measures that are: financial success, competitiveness, quality,
resource utilization, flexibility, and innovation.
Balanced Scorecard
After a year of study, Kaplan and Norton (1992) proposed to the world the idea of combining
financial and non-financial perspectives in one model called balanced scorecard (BSC) because
it balanced the view between financial and operational measures. Benefited from Fitzgerald
European Journal of Computer Science and Information Technology
Vol.5, No.4, pp.25-49, August 2017
___Published by European Centre for Research Training and Development UK (www.eajournals.org)
28 ISSN 2054-0957 (Print), ISSN 2054-0965 (Online)
(1991) model, Kaplan and Norton developed a model in 1992 collects all six measures into
four perspectives. The perspectives are learning and growth perspective, internal processes
perspective (it combines quality, resource utilization, and flexibility dimension), customer
perspectives, and financial perspectives. Kaplan and Norton defined BSC in their article as a
set of matrices that enables corporations to measure their performance more comprehensively
and from different aspects (Kaplan and Norton 1992).
After Kaplan and Norton article in 1992, a lot of private and public organizations started
implementing BSC as a part of its strategic management system and even admitted its value
and importance to achieve strategic goals. BSC helped organizations to (Kaplan & Norton
1996):
1. Make regular reviews on performance to improve and update company strategies.
2. Link short-term objectives with long-term objectives and annual targets.
3. Specify strategic initiatives to achieve company’s goals.
4. Align the goals of departments and individuals with organizational strategy.
In 1996a, Kaplan and Norton published a book called (The Balanced Scorecard: Translating
Strategy into Action). The concept of BSC model was developed to show objectives linked
together in cause and effect relation as drivers and outcomes.
Early in the second millennium, some statistics shows that half of US enterprises already
implemented BSC, which led to increasing the number of companies that provide services
helped in BSC implementation process (Marr & Neely 2003). One of the researchers claimed
that companies need only papers and pencil or spreadsheet program to implement BSC, but
managers found that is a long and slow process in BSC implementation (Marr & Neely 2003).
Balanced Scorecard Implementation
After reviewing BSC background and development phases, let’s take a deep review on BSC
implementation in HEIs, since the scope of this work focused on HEIs sector.
Although the proliferation of the BSC concept in the business industry, it is not applied widely
in the education sector (Chen, Yang and Shiau 2006). Universities around the world are seeking
for excellent academic staff and researchers, which resulting in the increase of universities
quality outcomes and improve its reliability and value proposition (Aljardali, Kaderi and
Tadjine 2012). For these reasons, some researchers turned to study how to measure universities
performance using the BSC.
One research examined the possibilities of BSC application in India and discussed the benefit
of implementing BSC in Indian universities, with the absence of any specific Indian case study
(Umashankar & Dutta 2007).
Papenhausen and Einstein (2006) highlighted an important point in their study about BSC
implementation in the college of business in the US, which is the lack of research that focused
on applying BSC in the non-profit organization especially educational organization. Therefore,
Papenhausen and Einstein (2006) relied in their implementation on what Kaplan and Norton
cited in (2004), that non-profit organizations don't focus on the financial perspective as a goal
and mission, instead these organizations can rearrange BSC perspectives to place customer

European Journal of Computer Science and Information Technology
Vol.5, No.4, pp.25-49, August 2017
___Published by European Centre for Research Training and Development UK (www.eajournals.org)
29 ISSN 2054-0957 (Print), ISSN 2054-0965 (Online)
perspective at the top, then internal process, learning and growth and at the bottom financial
perspective. But from another side, a study conducted in Taiwan believed that financial
perspective should be at the top, for both profit and non-profit organization. Because the non-
profit organization has to make sure that the organization has suitable mission and vision, then
in a good financial position to be able to maintain the stability of organization performance
(Chen, Yang and Shiau 2006). All of this shows that BSC perspectives can be personalized
based on individual needs and organization orientation and believes.
Although a few studies that have focused on BSC implementation in the Middle East, and
fewer studied BSC implementation in HEIs. Lebanese study emerged in 2012 taking advantage
of Kaplan and Norton (1992) BSC and Umashankar & Dutta (2007) framework for BSC
implementation. The study developed a model that is composed of four components which are:
BSC, Human Resources (HR), Information system (IS), and authority of university deans. The
proposed model is a conceptual framework with all essential elements that helps in the process
of implementing BSC in public HEIs (Aljardali, Kaderi and Tadjine 2012).
Balanced Scorecard Implementation in Saudi Arabia
By reviewing some of the latest research in the field of BSC in Saudi Arabia found that Al-
Aama (2013) published a paper addressed the importance of prioritizing BSC perspectives
based on the organization type: profit organization or nonprofit organization or government.
Al-Aama (2013) study how to develop BSC in IT Department at the Jeddah Municipality (JM),
by placing financial perspective at the bottom, and customer perspective at the top as the most
important outcome of the organization, to suit more JM orientation as a government
organization. The research also suggests two tools that can be used to support BSC
implementations. The first tool is Project and Strategic Objectives Matrix that is used to map
each initiative with one or more objectives in JM BSC. The other tool is Project and Budget
Planning Matrix, which focus on the weight of initiatives so that the higher initiatives priority
has a priority in funding.
Al thunaian (2013) conducted research to evaluate the implementation of BSC in King Faisal
Specialist Hospital and Research Centre (KFSH-RC). Al thunaian (2013) stated that BSC in
KFSH-RC consists of five perspectives which are: Medical Care, Education and Research,
Quality of Care, Financial, and Employees.
Technical Studies in Balanced Scorecard Implementation
Despite the development of studies in BSC implementation, but most of those studies focused
on manual or Excel sheet implementation of BSC through developing frameworks and
applying some measurement methods (Yu et al, 2009). BSC needs to be visualized in order to
take the most advantage of its implementation and to give managers more comprehensive and
materialize view of developed BSC. Therefore, a study was conducted in Malaysia to
developed e-BSC prototype that measures academic staff performance in universities by
aligning each lecturer objectives to university goals and strategy. E-BSC enables each lecturer
to identify his targets, and then monitor his performance in order to achieve the targets. The
users of the system are academic staff that is responsible for updating the system with
achievements, faculty dean who is responsible for setting facility KPIs based on university
KPIs, system administrator who manage and monitor the system and finally appraiser who
monitor individual and facility performance and assign performance scores. Researchers used
step-by-step workflow of the e-BSC to visualize the flow of system activities (Yu et al, 2009).

European Journal of Computer Science and Information Technology
Vol.5, No.4, pp.25-49, August 2017
___Published by European Centre for Research Training and Development UK (www.eajournals.org)
30 ISSN 2054-0957 (Print), ISSN 2054-0965 (Online)
As noticed through this literature review, in the last ten years a lot of organizations start to
focus more on BSC development and implementation. But in HEIs (especially non-profit ones)
studies shows that BSC application is not widely diffuse (Chen, Yang and Shiau 2006).
Furthermore, most of BSC implementation was manually implemented or applied in
spreadsheet applications like Microsoft Excel (Papalexandris et al, 2005). As been shown, by
focusing on the Middle East and particularly in Saudi Arabia found that BSC implementation
was limited to few studies (Al-Aama, 2013). All of this necessitating taking BSC
implementation to the next level by developing an automated full-scale BSC system that
measures the performance from one integrated source and directs the organization towards
achieving its goals. The system applied in KAU in Jeddah to develop the performance in one
of the biggest universities in Saudi Arabia.
RESEARCH METHODOLOGY
The goal of this work is to develop the process of measuring performance in HEI by using
BSC. The research implemented on KAU as a model. But first, it’s important to review all
possible BSC implementation approaches with advantages and limitations (Table 1) to make
sure that the chosen approach is the best approach to follow in BSC implementation.
Table 1: Summary of possible BSC implementation approaches
Advantages Limitations
Manual (pencil
& papers)
Easy to use
Low cost solution
Difficult to monitor & track the
performance
Not scalable
Lack of integrity
Spreadsheet
applications
(Microsoft
Excel)
Users familiarity with Microsoft
applications
Low cost solution
Difficult to monitor & track the
performance
Not scalable
Lack of integrity
Can’t display BSC dynamically
in GUI
BSC as a full
scale system
Scalable
High level of security
Continues monitor & track of the
performance.
Ability to extract periodical
performance reports.
Possibility to alter or edit BSC
components and list of credential
users
Flexible to suit organization
requirements.
Dynamic GUI
Communication between users and
developer is smooth and fast.
Complexity in development
Needs user training

European Journal of Computer Science and Information Technology
Vol.5, No.4, pp.25-49, August 2017
___Published by European Centre for Research Training and Development UK (www.eajournals.org)
31 ISSN 2054-0957 (Print), ISSN 2054-0965 (Online)
BSC software
packages
Scalable
Continues monitor & track of the
performance
Ability to extract periodical
performance reports
Possibility to alter or edit BSC
components and list of credential
users
Dynamic GUI
Costly solution
Needs user training with
software developers
Not flexible to suit organization
requirements.
Communication between users
and developer is difficult and
slow.
It can be concluded now that building a full-scale system is the best solution to adapt BSC
concept in any organization and specifically in HEIs
Analysis Phase
The first step of building BSC system is studying the current process of managing the
performance in HEI, and analyzing HEI strategic plan. After that, it’s important also to study
how to improve the way of measuring the performance in HEI (Papalexandris et al, 2005).
Understand HEI’s vision, strategy, and performance management system
Have a deep understanding of HEI’s vision, strategy and performance management system is
a critical stage in BSC automation project (Papalexandris et al, 2005). First, it’s important to
know HEI strategic directions, to be able to specify the suitable order of BSC perspectives in
the developed BSC. Since the system implemented in KAU it should be noted that KAU is
Government University, which means that government invests in citizens and provides
community services by allocating specific budget for the University (Al-Aama, 2013).
KAU vision is "Globally distinct sustainability of university and community partnership"
(Third Strategic Plan for King Abdulaziz University "TAZEEZ” 2015). The vision is seeking
to reach global excellence at all university levels (educational and institutional). Vision also
aims to focus on community service to achieve individuals, groups, privet or public
organization partnership. KAU vision conjoins five educational strategic themes (ESTs) that
university adopts in its strategic plan which is (Third Strategic Plan for King Abdulaziz
University "TAZEEZ” 2015):
Teaching and Learning, Scientific Research, Social Responsibility, Entrepreneurship and
Leadership and Management.
KAU Strategic plan formulates every five years and contains university mission, vision, values,
strategic objectives, initiatives (projects & programs to achieve university objectives), KPIs for
each initiative and responsible parties about achieving the KPIs (KPI owners) (Strategic Plan
II-King Abdulaziz University 2009). University objectives described the internal and external
environment of the university and divided over ESTs based on objective orientation.
Measuring performance process in KAU passed through several phases as followed (Third
Strategic Plan for King Abdulaziz University "TAZEEZ” 2015):

European Journal of Computer Science and Information Technology
Vol.5, No.4, pp.25-49, August 2017
___Published by European Centre for Research Training and Development UK (www.eajournals.org)
32 ISSN 2054-0957 (Print), ISSN 2054-0965 (Online)
Figure 1: Measuring Performance Process in KAU
After formulating university objectives, objective KPIs are defined to set measurable value for
each objective. Then initiatives are specified that contains actionable programs and projects to
be followed toward achieving university objectives. After that responsible individuals or
parties to achieve the objectives are assigned and timetable to follow is determined. Then
tracing performance forms are conducted to find out objective achievement percentage.
Tracing the performance works as a sequence of cause and effect, starts from tracking project
achievements that lead to program achievements then objective achievements and finally effect
on vision achievements as the highest level. After conducting tracing forms and starts working
on achieving university objectives, bi-annual achievement reports are prepared as a milestone
in performance measuring process. Then achievement reports are presented to the university
president.
The current process of measuring the performance in KAU is not accurate because it’s done
manually through paper forms and Excel spreadsheets, which make the process of monitoring
the performance and measuring the achievements very hard and takes a lot of time and effort
(Marr & Neely 2003). The developed system makes measuring the performance process
controllable, more effective, and from one integrated source that involved a larger segment of
university’s members. Figure 2 below shows how measuring performance process
implemented in the system.

European Journal of Computer Science and Information Technology
Vol.5, No.4, pp.25-49, August 2017
___Published by European Centre for Research Training and Development UK (www.eajournals.org)
33 ISSN 2054-0957 (Print), ISSN 2054-0965 (Online)
Figure 2: Measuring Performance Process in BSC Automation System
The first step is constructing the BSC with all its components objectives, KPIs, targets,
initiatives and objective duration. Then distributing objective target (goal value) and baseline
(current value) conducted over all university organizational levels. After that assigned staff
members starts adding new achievements that will reflect automatically over all university
levels. Then performance can be traced easily through colored indicators that represent status
of the objective, and by extracting performance reports from the system.
Data Collection
As mentioned earlier KAU plan conducted every five years, so the focus in the system was to
implement university strategic plan for 2016-2020 which titled (Strengthening of the national
transformation). BSC in the system depend on the four BSC perspectives and five. BSC
components distributed in a tree structure consist of different objectives on the intersection
between BSC perspective and EST. Under each objective there is one KPI and target, and
different initiatives that help to achieve the objective.
Objectives distributed over perspectives and ESTs based on the orientation of the objective and
what it serves. Figure 3 below clarifies the framework of the BSC in developed system.

European Journal of Computer Science and Information Technology
Vol.5, No.4, pp.25-49, August 2017
___Published by European Centre for Research Training and Development UK (www.eajournals.org)
34 ISSN 2054-0957 (Print), ISSN 2054-0965 (Online)
˸
Figure 3: BSC framework
It should be noted here that financial perspective at the top has been replaced into vision
perspective to suit KAU directions as a government HEI.
BSC automation system implemented in a hierarchy of four levels which are: BSC on
university level, BSC on faculties’ level, BSC on departments’ level and BSC on staff
members’ level. The hierarchy structure of the system helps faculty, department and staff
member levels to inhernet university’s (top level) objectives and KPIs. And that inheritance
helps all organizational level of the universiy to concentrate all efforts on achieving university’s
main objectives, even if the adopted programs and projects to achive these objectivs deffer.
System hirarchy structure also helps to distribute universty’s targets over faculties, then
distribute faculty’s targets over faculty’s departmets, and distribute department’s targets over
staff memebers who works under that department.
Since the system was implemented over all organizational levels of the university, it has been
taking into consideration all KAU faculties (20 faculty represent main faculties’ headquarters)
and departments (124 departments of the main headquarters faculties). As for staff member
level, it has been taking a sample of one to two staff members under each department, and that
sample represents staff members from different managerial level. Staff member could be:
academic administrator, institutional administrator, administrative employee and academy
professor.
Objective KPI Target
Initiative
Initiative

European Journal of Computer Science and Information Technology
Vol.5, No.4, pp.25-49, August 2017
___Published by European Centre for Research Training and Development UK (www.eajournals.org)
35 ISSN 2054-0957 (Print), ISSN 2054-0965 (Online)
BSC automation system implemented over a sample of most comprehensiveness objectives of
KAU. It has been focused on 20 objectives from KAU strategic plan for 2016-2020 (Third
Strategic Plan for King Abdulaziz University "TAZEEZ” 2015). The 20 objectives distributed
over the four BSC perspective and the five ESTs based on objective orientation. The table
below contains all university objectives applied in the system.
Table 2: BSC objectives in the system
Teaching &
Learning
Scientific
Research
Social
Responsibility Entrepreneurship
Leadership &
Management
Vision
Perspective
Increase Jobs
Opportunity
for
University
Graduates
Increase
access to
patents in
the
research
fields
Enhance
university
image in
community
Support and
activate business
incubators
Achieve global
excellence
Customer
Perspective
Qualify
students
intellectually
and
behaviorally
Increase
the
publication
of
scientific
research
Offer awards
for best
participation
in community
services
Qualify and
support talented
students
Achieve
academic
accreditation
standards for all
programs
Internal
Process
Perspective
Sustainability
of teaching
quality
Establish
support
and
assistance
unit for
researchers
Provide
courses and
advisory
services to
community
Develop talent
and innovation
programs
Develop
integrated quality
management
system with
international
standards
Learning &
Growth
Perspective
Attract
excellent
academic
staff
Sustainabil
ity of
scientific
research
Prepare social
responsibility
and
community
needs guide
Establish
innovation lab
Promote culture
of quality and
excellence
Under each objective there is KPI, baseline, target, initiative, objective duration and follow up
frequency. For example the table below (table 3) shows one of university objective and its
details
Table 3: Example, Objective details
Objective KPI Baseline Target Initiative Duration Follow-up
frequency
Increase the
publication
of scientific
research
Number of
scientific
research
460 1000
1- Support science
researches with
global achievements
2- Create mechanisms
to increase
university research
citation
2016-
2020 Monthly

European Journal of Computer Science and Information Technology
Vol.5, No.4, pp.25-49, August 2017
___Published by European Centre for Research Training and Development UK (www.eajournals.org)
36 ISSN 2054-0957 (Print), ISSN 2054-0965 (Online)
1. KPI: represents measurable value that shows how effective the objective achieved.
2. Baseline: represents the initial achieved value before start working on achieving the
objective.
3. Target: represents numerical value to achieve. Target and baseline values divided in the
system into five data types as followed:
Table 4: Target & Baseline Data Types
Data type KPI (Examples) Baseline
(Examples) Target
(Examples)
Number Number of published scientific research 400 1000
Percentage Percentage of developed educational
programs
20% 100%
Yes or No Existence of assistance unit for
researchers
No Yes
Ratio Number of activities taken by students 0.5:1 5:1
Ranking University ranking worldwide 300 120
4. Initiative: represents action plan, projects and programs to achieve the objective.
5. Duration: represents the time specified to achieve the objective, and since the work is
applied in HEI, (semester / year) time frame was adopted.
6. Follow-up frequency: represents recurrence duration for the user to enter the system and
add new achievement, and it could be: yearly, quarterly, monthly, half month, weekly
and daily, and it depends on objective nature.
How to measure the performance?
The main question in this work is how university performance will be measured through
developed system. Performance measuring in general depends on the following basic steps in
figure 5:
Figure 5: Performance Measurement Steps
Setting target relies on a series of processes, starting from formulating strategic plan to
identifying detailed objectives. The process of formulating strategic plan and objectives needs
a lot of studies and analyses to identify internal and external strength, weakness, opportunities
European Journal of Computer Science and Information Technology
Vol.5, No.4, pp.25-49, August 2017
___Published by European Centre for Research Training and Development UK (www.eajournals.org)
37 ISSN 2054-0957 (Print), ISSN 2054-0965 (Online)
and threats of organization. There is many technique that can help to formulate strategic plan
and objectives like SWOT analyses (strength, weakness, opportunities, threats) (Kamel 2010).
The details of all these processes will not address here, since it’s out of research scope. After
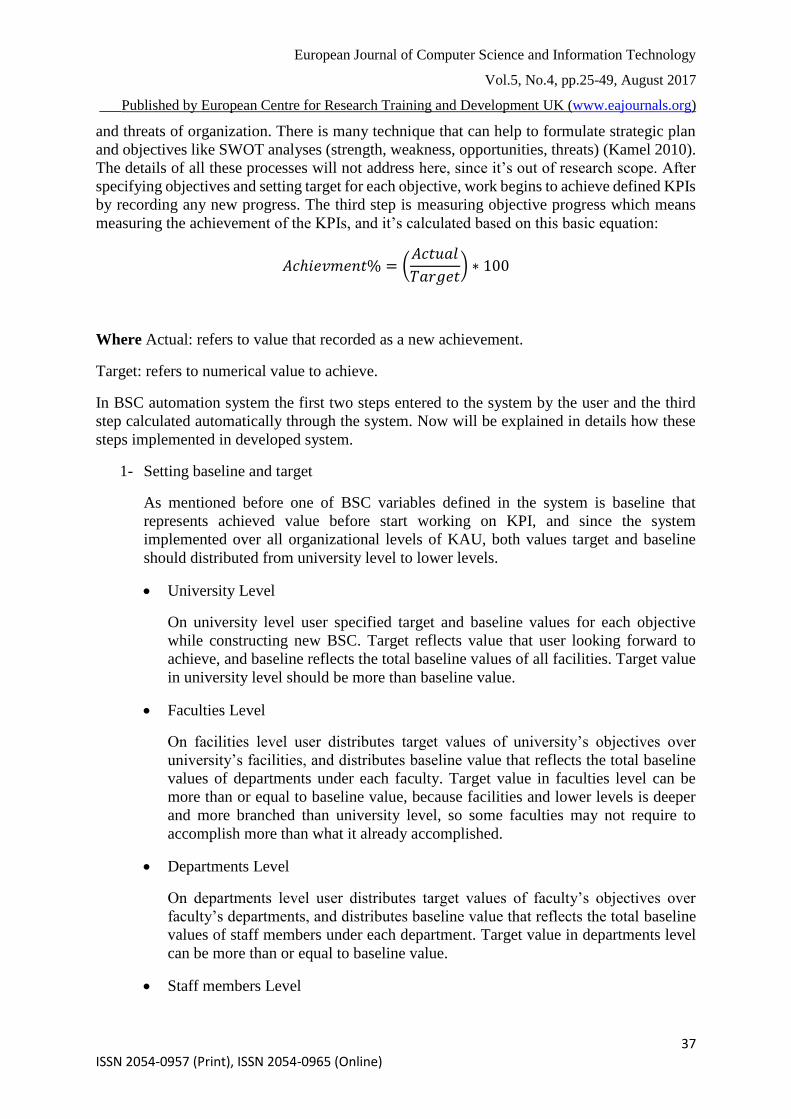
specifying objectives and setting target for each objective, work begins to achieve defined KPIs
by recording any new progress. The third step is measuring objective progress which means
measuring the achievement of the KPIs, and it’s calculated based on this basic equation:
𝐴𝑐ℎ𝑖𝑒𝑣𝑚𝑒𝑛𝑡% = (𝐴𝑐𝑡𝑢𝑎𝑙
𝑇𝑎𝑟𝑔𝑒𝑡) ∗ 100
Where Actual: refers to value that recorded as a new achievement.
Target: refers to numerical value to achieve.
In BSC automation system the first two steps entered to the system by the user and the third
step calculated automatically through the system. Now will be explained in details how these
steps implemented in developed system.
1- Setting baseline and target
As mentioned before one of BSC variables defined in the system is baseline that
represents achieved value before start working on KPI, and since the system
implemented over all organizational levels of KAU, both values target and baseline
should distributed from university level to lower levels.
University Level
On university level user specified target and baseline values for each objective
while constructing new BSC. Target reflects value that user looking forward to
achieve, and baseline reflects the total baseline values of all facilities. Target value
in university level should be more than baseline value.
Faculties Level
On facilities level user distributes target values of university’s objectives over
university’s facilities, and distributes baseline value that reflects the total baseline
values of departments under each faculty. Target value in faculties level can be
more than or equal to baseline value, because facilities and lower levels is deeper
and more branched than university level, so some faculties may not require to
accomplish more than what it already accomplished.
Departments Level
On departments level user distributes target values of faculty’s objectives over
faculty’s departments, and distributes baseline value that reflects the total baseline
values of staff members under each department. Target value in departments level
can be more than or equal to baseline value.
Staff members Level

European Journal of Computer Science and Information Technology
Vol.5, No.4, pp.25-49, August 2017
___Published by European Centre for Research Training and Development UK (www.eajournals.org)
38 ISSN 2054-0957 (Print), ISSN 2054-0965 (Online)
On staff members level user distributes target and baseline values of department’s
objectives over department’s staff. Staff member who get part of target distribution
is responsible to work on achieving that target based on his already achieved value
(baseline). Target value in staff member level can be more than or equal to baseline
value.
As mentioned earlier, BSC automation system enables user to enter baseline and target
values in different data types. Number, percentage and ratio data types distributed
normally over all levels lower that university level, based on size of faculty or
department. But yes/no and ranking data types have a special case in distribution, and
that is refers to their nature. Yes/no values can’t be distributed to lower levels, so it
takes the same value from upper level. As for ranking data type, it represents the rank
of university and the rank can’t be distributed to lower levels. what happens is that all
levels under university level takes the same value of ranking from university level, and
staff member level try to work on achieving higher rank for university that will reflects
automatically over all organizational levels of university.
2- Adding Achievements
In BSC automation system the process of adding new achievements to defined KPIs
happens from the lowest level of hierarchy. All staff members who get part of target
distribution from their departments are responsible to work on achieving these targets
and enter their achievement values to the system.
3- Measuring Achievement
Measuring the achievement% starts from the lowest level which is staff member level
then achievement reflects to upper levels.
Achievement% on staff members level
When staff member enter new achievement, system automatically calculate
achievement percentage. In BSC automation system baseline value was taken into
account along with target value in achievement% calculations. And the following
equation was adopted:
𝐴𝑐ℎ% = [𝐴𝑐𝑡𝑢𝑎𝑙
(𝑇𝑎𝑟𝑔𝑒𝑡 − 𝐵𝑎𝑠𝑒𝑙𝑖𝑛𝑒)] ∗ 100
Let’s take an example on how to calculate Ach% for each target data type. Below
table shows sample of KAU objectives and KPIs from 2016-2020 strategic plan
(Third Strategic Plan for King Abdulaziz University "TAZEEZ” 2015) with
baseline and target values in each data type.

European Journal of Computer Science and Information Technology
Vol.5, No.4, pp.25-49, August 2017
___Published by European Centre for Research Training and Development UK (www.eajournals.org)
39 ISSN 2054-0957 (Print), ISSN 2054-0965 (Online)
Table 5: Example, How to calculate Ach%?
Objective KPI Baseline Target
Number Attract excellent academic
staff
Number of excellent
academic staff 20 50
Percentage Sustainability of scientific
research
Percentage of stored
researches 60% 100%
Yes / No Establish assistance unit
for researchers Existence of a unit No (0%)
Yes
(100%)
Ratio
Qualify students
intellectually and
behaviorally
Number of activities taken
by students
0.5: 1 =
50%
5: 1 =
500%
Ranking Achieve global excellence Global university ranking rank 274 rank 100
Now based on variables in above table, the calculation of achievement% over a
period of time for all target data types was clarified in below table.
Table 6: Cont. Example, How to calculate Ach%?
Before
(Baseline) Jan Feb Mar Apr May
*B 20 *A 10 A 5 A 10 A 3 A 2
*Ach% 0 Ach% 33 Ach% 50 Ach% 83 Ach% 93 Ach% 100
B 60% A 10% A 15% A 5% A 10% A -
Ach% 0 Ach% 25 Ach% 63 Ach% 75 Ach% 100 Ach%
B 0% A Yes A - A - A - A -
Ach% 0 Ach% 100 Ach% Ach% Ach% Ach%
B 0.5:1 A 1:1 A 2:1 A 1:1 A 0.5:1 A -
Ach% 0 Ach% 22 Ach% 67 Ach% 89 Ach% 100 Ach%
B 274 A 170 A 145 A 130 A 110 A 100
Ach% 0 Ach% 60 Ach% 74 Ach% 83 Ach% 94 Ach% 100
* B: Baseline value, A: Actual value, Ach%: achievement%
The table shows that before start working on the KPI and records any achievements,
the ach% for all KPI types equal 0%. Once the user start enter new achievement
(A), Ach% value will increased based on Ach% equation. The actual value takes its
cumulated value over specified period of time.
Nu
mb
er
Per
cen
tage
Yes
/N
o
Rati
o
Ra
nk
ing

European Journal of Computer Science and Information Technology
Vol.5, No.4, pp.25-49, August 2017
___Published by European Centre for Research Training and Development UK (www.eajournals.org)
40 ISSN 2054-0957 (Print), ISSN 2054-0965 (Online)
Since the system implemented over all organizational level of university, there is a
variance in target distribution between entities from the same level. Therefore,
weighted achievement should be taken into consideration beside achievement%.
Weighted achievement depends on target weight that calculated based on university
target as followed equations:
University target weight = 100%
Faculty target weight: W Faculty = (T Faculty * 100) / T University
Department target weight: W Department = (T Department * 100) / T University
Staff target weight: W Staff = (T Staff * 100) / T University
Where W: weight and T: Target
As for weighted achievement equation it is:
𝑊𝑒𝑖𝑔ℎ𝑡𝑒𝑑 𝐴𝑐ℎ𝑖𝑒𝑣𝑒𝑚𝑒𝑛𝑡 = [𝐴𝑐𝑡𝑢𝑎𝑙
(𝑇𝑎𝑟𝑔𝑒𝑡 − 𝐵𝑎𝑠𝑒𝑙𝑖𝑛𝑒)] ∗ 𝑊
The figuer below shows how the wieght calculated in system herarchy by taking
Faculty of Computing and Informaton Technology (FCIT) and one of KAU
objectives from 2016-2020 strategic plan (Third Strategic Plan for King Abdulaziz
University "TAZEEZ” 2015) as an example. The objective is: Increase the
publication of scientific research, KPI is: Number of published scientific research.
T: Target, B: Baseline and W: Wieght.
Figure 6: Target, Baseline Distrbuting and wieght calculation
Achievement% on departments level
Achievement% for each department is the total actual values of staff members under
that department based on department target and baseline. The equation is:

European Journal of Computer Science and Information Technology
Vol.5, No.4, pp.25-49, August 2017
___Published by European Centre for Research Training and Development UK (www.eajournals.org)
41 ISSN 2054-0957 (Print), ISSN 2054-0965 (Online)
𝐴𝑐ℎ% =∑ 𝑠𝑡𝑎𝑓𝑓 𝐴𝑐𝑡𝑢𝑎𝑙 𝑠
(𝑇𝑎𝑟𝑔𝑒𝑡 − 𝐵𝑎𝑠𝑒𝑙𝑖𝑒𝑛)
For ranking and yes/no data types, achievement% from staff member level will
reflected as it is automatically on department level.
Achievement% on Faculties level
Achievement% for each faculty is the total actual values of departments under that
faculty based on faculty target and baseline. The equation is:
𝐴𝑐ℎ% =∑ 𝐷𝑒𝑝𝑎𝑟𝑡𝑚𝑒𝑛𝑡 𝐴𝑐𝑡𝑢𝑎𝑙 𝑠
(𝑇𝑎𝑟𝑔𝑒𝑡 − 𝐵𝑎𝑠𝑒𝑙𝑖𝑒𝑛)
For ranking and yes/no data types, achievement% from staff member level will
reflected as it is automatically on faculty level.
Achievement% on University level
Achievement% on university level is the total actual values of all faculties of
university based on university target and baseline, the equation is:
𝐴𝑐ℎ% =∑ 𝐹𝑎𝑐𝑢𝑙𝑡𝑖𝑒𝑠 𝐴𝑐𝑡𝑢𝑎𝑙 𝑠
(𝑇𝑎𝑟𝑔𝑒𝑡 − 𝐵𝑎𝑠𝑒𝑙𝑖𝑒𝑛)
For ranking and yes/no data types, achievement% from staff member level will
reflected as it is automatically on university level.
Performance Indicators
When KPI owner entered new achievement, colored indicators will occurred to show the level
of progress in KPI to achieve the target. A scale of 13 colors developed to facilitate the process
of monitoring the performance, and to motivate KPI owners to come up with greater
achievements. The scale of indicators is illustrated in figure below with Ach% result intervals.

European Journal of Computer Science and Information Technology
Vol.5, No.4, pp.25-49, August 2017
___Published by European Centre for Research Training and Development UK (www.eajournals.org)
42 ISSN 2054-0957 (Print), ISSN 2054-0965 (Online)
Figure 7: Performance Indicator Scale
As shown the scale starts with dark red as zero achievement up to dark green as 100%
achievement. Blue shades reflect achievements more than 100%, and black color means that
achievement doubled and exceeded the target.
Performance Evaluating
One of the basic goals of this work after measuring the performance is the ability to evaluate
it. Developed system enables the user to extract performance reports for analytical overview
and evaluating purpose. Performance report that system support are:
Overall View Reports
This view shows an overall performance through BSC objectives with its cross
ponding colored indicators. The view supports all system levels.
Objective Wise Reports
Objective view is more detailed view that shows the performance based on each
objective in BSC, and enables the user to make a comparison between objectives
in performance.
Perspective Wise Reports
It’s another detailed view that display the performance based on BSC
perspectives, by taking the average of all achievement% value under each
perspective. The view enables the user to make a comparison between
perspectives in performance.
ESTs Wise Reports

European Journal of Computer Science and Information Technology
Vol.5, No.4, pp.25-49, August 2017
___Published by European Centre for Research Training and Development UK (www.eajournals.org)
43 ISSN 2054-0957 (Print), ISSN 2054-0965 (Online)
This view provides reports in performance based on ESTs, and it takes the average
of achievement% value under each EST in BSC. The view enables the user to
make a comparison between ESTs in performance.
These are the basic reports currently supported by the system, and there is a possibility to add
more according to needs in the future.
Set up System Requirement
Moving to operational side of the work, BSC automation system developed as a web based
system. The developing environment of the system was visual studio, and C# was the
programming language, as well as SQL server for database.
Modeling Phase
To identify system users and visualized their interaction with the system, use case diagram was
conducted as follows in (figure 8).
Figure 8: Use case Diagram
The system includes five users’ categories, and their roles will be clarified as followed:
System Admin who’s responsible about identifying system users and specifying their
authorities, and adding new faculty and department under identified faculty.
University Agent who’s responsible about identifying new BSC according to university
plan, setting BSC details (objectives, KPIs, targets, baseline, initiatives, objective

European Journal of Computer Science and Information Technology
Vol.5, No.4, pp.25-49, August 2017
___Published by European Centre for Research Training and Development UK (www.eajournals.org)
44 ISSN 2054-0957 (Print), ISSN 2054-0965 (Online)
duration and follow up frequency), distributing target and baseline over university’s
faculties. University agent can also extract performance reports from the system for
evaluating purpose, and monitoring objectives achievement from university level.
Faculty Agents (agent for each faculty) responsible about distributing objective targets
over faculty’s departments, and can extract faculty performance reports and monitor
performance from faculty level.
Department Agents (agent for each department) responsible about distributing
objective targets over department’s staff. Department agent has also the ability to
extract department performance reports and monitor performance from department
level.
Staff members responsible about adding new achievements to objectives, extract staff
performance reports, and monitor performance from staff member level.
Research Results
BSC automation system developed as a web based system, and below screens shows the main
views in the system.
Define new user
Actor: System admin
In this page system admin can add new user, and give user access to the
system.
Construct new BSC
Actor: University agent
Here university agent can define new BSC by specifying its duration.

European Journal of Computer Science and Information Technology
Vol.5, No.4, pp.25-49, August 2017
___Published by European Centre for Research Training and Development UK (www.eajournals.org)
45 ISSN 2054-0957 (Print), ISSN 2054-0965 (Online)
Add objective
Actor: University agent
In this page university agent is able to set all objective details.
Set university objective
Actor: University agent
Here university agent can monitor objective achievement form university level
through colored indicators. The same view also supported on faculty level,
department level and staff member level for faculties’ agents, departments’
agents and for each staff member.

European Journal of Computer Science and Information Technology
Vol.5, No.4, pp.25-49, August 2017
___Published by European Centre for Research Training and Development UK (www.eajournals.org)
46 ISSN 2054-0957 (Print), ISSN 2054-0965 (Online)
o Distribute target over faculties
This page enable university agent to distribute university’s targets for each
objective over faculties. The same view supported to distribute faculties’
target over department, and departments’ target over staff members.
Add achievements
Actor: Staff member
This page enable staff member to add new achievement to selected objective,
then automatically calculates ach%.

European Journal of Computer Science and Information Technology
Vol.5, No.4, pp.25-49, August 2017
___Published by European Centre for Research Training and Development UK (www.eajournals.org)
47 ISSN 2054-0957 (Print), ISSN 2054-0965 (Online)
Evaluate performance
Here is an example of report views in the system.
o Overall view
o Objective view

European Journal of Computer Science and Information Technology
Vol.5, No.4, pp.25-49, August 2017
___Published by European Centre for Research Training and Development UK (www.eajournals.org)
48 ISSN 2054-0957 (Print), ISSN 2054-0965 (Online)
Research Boundaries
This work concerned about implementing BSC in HEIs, and focused on Appling ESTs over
institution objectives that is special for educational institutions only. The work also devoted on
implementing BSC in Government Universities, through changing financial perspective in
BSC to vision perspective to be more suitable for Government Universities. The developed
system implemented in KAU in Jeddah and can be adopted in any government university or
any non-profit HEI.
CONCLUSION
Since Kaplan and Norton first article about the concept of BSC that explained the importance
of measuring organizational performance from more comprehensive perspective, many
organizations adopted BSC matrix in its performance management system (Hoque 2014).
Despite the wide implementation of BSC in different profit organization, its implementation in
non-profit and government organizations was not so wide (Al-Aama, 2013). Also most of BSC
implementations were through peppers or spreadsheets application or through expensive BSC
shelf software (Marr & Neely 2003). All of this was an incentive to take BSC implementation
to another level that makes the process of measuring the performance in organizations more
effective and accurate.
This work focused on implementing BSC. And because educational institutions are considered
to be the cornerstone of any society, it’s important to focus on how these institutions monitor
its performance to reach its objectives.
The focus of this work was on developing BSC system that can measure the performance in
HEIs, and the system implemented on KAU as a model. The system was implemented in
hierarchy structure that covers all organizational levels of university, to ensure alignment of
objectives over all levels. The five ESTs were dropped over BSC matrix to make sure that
university’s objectives serve all these themes. BSC automation system enable large segment of

European Journal of Computer Science and Information Technology
Vol.5, No.4, pp.25-49, August 2017
___Published by European Centre for Research Training and Development UK (www.eajournals.org)
49 ISSN 2054-0957 (Print), ISSN 2054-0965 (Online)
university staff to be part of achieving university’s objectives. Users in the system can
construct new BSC, add objectives under perspectives and ESTs, distribute targets and baseline
values of university over lower levels, add new achievements and extract performance reports
that provide summary of performance results from different views.
REFERENCE
Al-Aama, A. (2013). Using Balanced Scorecards to Manage IT Strategies in Public
Organizations: The Case of Jeddah Municipality. Engineering Management Research,
2(1).
Aljardali H, Kaderi M, Tadjine T (2012) 'The Implementation of the Balanced Scorecard in
Lebanese Public Higher Education Institutions', Social and Behavioral
Sciences, 1877:0428 (62), pp. 98 – 108.
AL thunaian, S. (2013). Exploring the Use of the Balanced Scorecard (Bsc) In the Healthcare
Sector of the Kingdom Of Saudi Arabia: Rhetoric and Reality. School of Management
University of Bradford.
Hoque, Z. (2014). 20 years of studies on the balanced scorecard: Trends, accomplishments,
gaps and opportunities for future research. The British Accounting Review, 46(1), pp.33-
59.
Kamel, S. (2010). E-Strategies for Technological Diffusion and Adoption. 1st ed. United States
of America: Information Science Reference (IGI Global), p.69.
Kaplan, R. and Norton, D. (1992). The BSC-measures that drives performance. Harvard
Business Review, pp.71-79.
Kaplan, R. and Norton, D. (1996). Using the Balanced scorecard as a strategic management
system. Hard Business Review. pp.75-85
Kaplan, R. and Norton, D. (1996a). The Balanced Scorecard: Translating Strategy into Action,
Boston: HBS Press.
Kaplan, R. and Norton, D. (2004). Strategy maps: converting intangible assets into tangible
outcomes. Boston: Harvard Business School Press.
Kaplan, R. (2010). Conceptual Foundations of the Balanced Scorecard. SSRN Electronic
Journal.
King Abdulaziz University (2009). Executive summary: Strategic Plan II-King Abdulaziz
University. Retrieved from
http://www.kau.edu.sa/GetFile.aspx?id=199422&fn=Standard%207_Appendix%207.1.
King Abdulaziz University (2015). Third Strategic Plan for King Abdulaziz University
"TAZEEZ”.
Papalexandris A, Ioannou G, Prastacos G, Soderquist K. (2005). An Integrated Methodology
for Putting the Balanced Scorecard into Action. European Management Journal. 23 (2),
5-12
Papenhausen, C., Einstein, W. (2006), Implementing the Balanced Scorecard at a college of
business, Measuring Business Excellence, Vol. 10 Iss 3 pp. 15 – 22
Chen, S., Yang, C., Shiau, J. (2006),"The application of balanced scorecard in the performance
evaluation of higher education", The TQM Magazine, Vol. 18 Iss 2 pp. 190 – 205
Marr, B. and Neely, A. (2003). Automating the balanced scorecard -selection criteria to identify
appropriate software applications. Measuring Business Excellence, 7(3), pp.29-36.
Neely, A., Gregory, M. and Platts, K. (1995). Performance measurement system design. Int

European Journal of Computer Science and Information Technology
Vol.5, No.4, pp.25-49, August 2017
___Published by European Centre for Research Training and Development UK (www.eajournals.org)
50 ISSN 2054-0957 (Print), ISSN 2054-0965 (Online)
Jrnl of Op & Prod Mnagemnt, 25(12), pp.1228-1263.
Nayeri, M. D., Mashhadi, M. M., & Mohajeri K. (2008). Universities Strategic Evaluation
Using Balanced Scorecard. International Journal of Social, Behavioral, Educational,
Economic and Management Engineering, 2, 1st ser., 25-29
Teague, J and Eilon, S (1973), Productivity measurement: a brief survey, Applied Economics,
Vol. 5, pp. 133-145.
Umashankar, V., Dutta, K. (2007) 'Balanced scorecards in managing higher education
institutions: an Indian perspective', International Journal of Educational Management,
21 (1), pp. 54- 65. Accessed: 18 Sep 2015
Yu, M., Hamid, S., Ijab, M. and Soo, H. (2009). The e-balanced scorecard (e-BSC) for
measuring academic staff performance excellence. High Educ, 57(6), pp.813-828.
Zhang Y, Li L (2009). Study on Balanced Scorecard of Commercial Bank in Performance
Management System. ACADEMY PUBLISHER, pp.206-209.