balanced excitation and inhibition decorrelates visual ... · biosensor iglusnfr (borghuis et al.,...
TRANSCRIPT

1
Balanced excitation and inhibition decorrelates visual feature
representation in the mammalian inner retina
Katrin Franke1-4*
, Philipp Berens1-3,5*
, Timm Schubert1,3
, Matthias Bethge1,2,5,6
, Thomas Euler1-3§
and
Tom Baden1-3,7§
1 Centre for Integrative Neuroscience, University of Tübingen, Germany.
2 Bernstein Centre for Computational Neuroscience, Tübingen, Germany.
3 Institute for Ophthalmic Research, Tübingen, Germany.
4 Graduate School of Neural & Behavioural Sciences | International Max Planck Research School,
University of Tübingen, Germany.
5 Institute for Theoretical Physics, University of Tübingen, Germany.
6 Max Planck Institute of Biological Cybernetics, Tübingen, Germany.
7 School of Life Sciences, University of Sussex, Brighton, UK.
* Equal contributions
§ Correspondence at [email protected] and [email protected]
SUMMARY
The retina extracts visual features for transmission to the brain. Different types of bipolar cell
split the photoreceptor input into parallel channels and provide the excitatory drive for
downstream visual circuits. Anatomically, mouse bipolar cell types have been described
down to the ultrastructural level, but a similarly deep understanding of their functional
diversity is lacking. By imaging light-driven glutamate release from more than 11,000 bipolar
cell axon terminals in the intact retina, we here show that bipolar cell functional diversity is
generated by the balanced interplay of dendritic excitatory inputs and axonal inhibitory
inputs. The resultant centre and surround components of bipolar cell receptive fields interact
to decorrelate bipolar cell output in the spatial and temporal domain. Our findings highlight
the importance of inhibitory circuits in generating functionally diverse excitatory pathways
and suggest that decorrelation of parallel visual pathways begins already at the second
synapse of the mouse visual system.
.CC-BY-NC-ND 4.0 International licenseIt is made available under a (which was not peer-reviewed) is the author/funder, who has granted bioRxiv a license to display the preprint in perpetuity.
The copyright holder for this preprint. http://dx.doi.org/10.1101/040642doi: bioRxiv preprint first posted online Mar. 22, 2016;
2
INTRODUCTION
The retina is the first processing stage of the visual system. It extracts features like motion or
edges (Wässle, 2004; Masland, 2012a) and relays these to the brain through a highly
diverse set of retinal ganglion cells (RGCs) (Sanes and Masland, 2015; Baden et al., 2016).
This functional diversity starts to emerge already at the first retinal synapse, where the visual
signal is distributed from the photoreceptors onto ~14 bipolar cell (BC) types (reviewed in
(Euler et al., 2014)). Their axon terminals stratify at different depths of the inner plexiform
layer (IPL) and provide the excitatory drive for the feature extracting circuits of the retina.
Anatomically, the set of mouse BC types is well characterised (Ghosh et al., 2004; Wässle et
al., 2009b) and their exact number and ultrastructural connectivity are known (Helmstaedter
et al., 2013; Kim et al., 2014). Functionally, BCs have been classified mostly into broad
categories like On and Off, transient and sustained or chromatic and achromatic (Euler et al.,
1996; Awatramani and Slaughter, 2000; DeVries, 2000; Li and DeVries, 2006; Breuninger et
al., 2011); however, a deeper understanding of their functional diversity and its origin is
lacking.
Some of the observed differences between BC types including polarity and chromatic
selectivity are established in the outer retina through differences in the excitatory dendritic
input from photoreceptors (DeVries et al., 2006; Puller et al., 2013; Borghuis et al., 2014;
Lindstrom et al., 2014; Puthussery et al., 2014). In the inner retina, more than 40 types of
inhibitory amacrine cell (AC) modulate BC output at the level of their synaptic terminals
(Strettoi et al., 1990; Masland, 2012b; Helmstaedter et al., 2013). While a handful of AC
circuits have been studied at great detail (e.g. the A17 (Grimes et al., 2009) or the AII
network (Demb and Singer, 2012)), we do not understand the general principles by which
AC circuits help to decompose the visual scene into the parallel channels carried by the
BCs. This fundamentally requires recording from many BC terminals in the retina with long-
range connections preserved.
To address this important aspect, we took advantage of the recently developed glutamate
biosensor iGluSnFR (Borghuis et al., 2013; Marvin et al., 2013) and set out to systematically
characterise the complete glutamatergic output of mouse BCs at the level of individual axon
terminals in the whole-mounted retina. In contrast to presynaptic calcium, which has been
used to assess BC function in mouse and zebrafish (Dreosti et al., 2009; Baden et al., 2012;
Yonehara et al., 2013; Chen et al., 2014a), glutamate release represents the output
“currency” of BCs, not only accounting for presynaptic inhibition but also any release
dynamics of BC ribbon synapses (Burrone and Lagnado, 2000; Cho and von Gersdorff,
2012; Nikolaev et al., 2013). Combining systematic functional population recordings with
available anatomical information provides a rare opportunity to understand an entire class of
neurons at unprecedented depth.
RESULTS
Glutamate release units of the IPL
To survey light-driven glutamate release across the IPL of the whole-mounted mouse retina
we used time-lapsed two-photon imaging of the fluorescent glutamate biosensor iGluSnFR
(Borghuis et al., 2013; Marvin et al., 2013). Intravitreal injection of AAV9.iGluSnFR directed
at the naso-ventral retina (Fig. 1a, Methods) yielded homogenous ubiquitous expression
.CC-BY-NC-ND 4.0 International licenseIt is made available under a (which was not peer-reviewed) is the author/funder, who has granted bioRxiv a license to display the preprint in perpetuity.
The copyright holder for this preprint. http://dx.doi.org/10.1101/040642doi: bioRxiv preprint first posted online Mar. 22, 2016;

3
throughout the IPL (Fig. 1b), thus allowing for sampling of glutamate release at all IPL
depths (SFig. 1f). For each scan field, we registered the recording depth as its relative
distance to the two plexi of SR101-stained blood vessels. The error in estimating IPL depth
was <1 µm, as verified by comparison to TdTomato-positive ChAT bands (Famiglietti and
Tumosa, 1987) (Fig. 1c, Methods).
To objectively define individual glutamate “release units”, we placed regions-of-interest
(ROIs) in a single scan field (typically 48x12 µm at 32.125 Hz) using a custom algorithm
based on local image correlation over time (Fig. 1d, SFig. 1, Methods). This allowed us to
sample light-driven activity of 74±24 ROIs per scan field (SFig. 1e, SVid. 1). We verified the
performance of this algorithm using calcium imaging of BCs with the GCaMP6f biosensor
(Chen et al., 2013), where individual axon terminals could be easily resolved (SFig. 2a). Our
algorithm reliably detected individual terminals and rather assigned two ROIs to a single
terminal before merging two terminals into one ROI (SFig. 1d, SFig. 2a). In addition,
receptive field (RF, see below) sizes estimated from calcium signals of single terminals
closely fit those estimated from single iGluSnFR ROIs (SFig. 2c,d) and matched the
anatomical dimensions of BC dendritic fields (Wässle et al., 2009b; Behrens, Schubert,
Haverkamp, Euler and Berens, personal communication). Accordingly, each ROI likely
captured the light-driven glutamate signal of at most one BC axon terminal.
We used a standardised set of four light stimuli (Fig. 1e1, see also (Baden et al., 2016)) to
characterise BC output across the IPL: (i) local (100 µm diameter) and (ii) full-field (600x800
µm) “chirp”-stimuli to probe response polarity as well as contrast and frequency preference
of BC centre and centre-surround, respectively, (iii) 1 Hz full-field steps to study response
kinetics and (iv) binary dense noise to estimate receptive fields (Methods).
ROIs in a single scan field could typically be grouped into two or more distinct response
profiles (e.g. Fig. 1e2,3, red versus green ROIs), suggesting that multiple BC types could be
recorded at a single IPL depth as expected from their partial stratification overlap (Greene et
al., n.d.; Helmstaedter et al., 2013; Kim et al., 2014) (cf. Fig. 2a). Similarly, the reported tiling
of the retinal surface by neurons of the same type implies that more than one cell of a BC
type may contribute terminals to a single scan field (Wässle et al., 2009b). Indeed, ROIs that
shared a common response profile had RFs that either almost completely overlapped or
were spatially offset consistent with BC tiling (Wässle et al., 2009b) (Fig. 1f). For example,
the highly overlapping spatial RFs of the green ROIs suggest that they correspond to
terminals not only belonging to the same type of BC, but the same cell (Fig. 1f2, see also
SFig. 2a-c). In contrast, the red ROIs likely correspond to terminals of two neighbouring cells
of a second type (Fig. 1f1). Taken together, we therefore think that our ROIs reflect a reliable
measure of BC output at the level of individual axon terminals, the computational output unit
of the inner retina.
Anatomy-guided functional clustering of mouse BCs
In total, we recorded light-evoked BC glutamate release from 11,101 ROIs (n=150 scan
fields, n=29 mice) throughout the IPL, each scan field tagged to its precise IPL depth. For
the following analysis, we assumed that (i) BCs are the main source of glutamate in the inner
retina (Discussion) and (ii) the anatomical catalogue of BCs in the mouse retina is complete
at a count of 14 types (5 Off cone BCs (CBCs), 8 On CBCs and rod BC (RBC)), each
forming a complete and independent mosaic (Wässle et al., 2009b; Helmstaedter et al.,
2013; Kim et al., 2014; Greene et al., 2016). Following this assumption, the measured
.CC-BY-NC-ND 4.0 International licenseIt is made available under a (which was not peer-reviewed) is the author/funder, who has granted bioRxiv a license to display the preprint in perpetuity.
The copyright holder for this preprint. http://dx.doi.org/10.1101/040642doi: bioRxiv preprint first posted online Mar. 22, 2016;

4
glutamate signals must map onto these 14 types of BCs including RBCs (SFig. 2e,f). We
took advantage of available EM-reconstruction data on BC axonal stratification profiles (Kim
et al., 2014; Greene et al., 2016) to guide a functional clustering algorithm (Fig. 2a): For
each scan field taken at a specific IPL depth, a prior probability for cluster allocation was
computed from the relative axon terminal volume of all BC types in the respective IPL
stratum (Fig. 2b). For example, all ROIs of a scan field taken at an IPL depth of 1.7 were
likely to be sorted into clusters for CBC types 1 and 2 (Fig. 2b2, top), while a scan field taken
at a depth of 0 received a bias for CBC types 5-7 (Fig. 2b2, bottom). We then extracted
functional features from the glutamate responses that passed our quality criterion (76.1% of
ROIs) using sparse PCA (SFig. 3a) and clustered the ROIs using a modified Mixture of
Gaussian model (Methods).
This yielded a functional fingerprint of every anatomical BC type in the mouse retina (Fig. 2c,
SFig. 3b), including a detailed account of their response kinetics, RF structure and centre-
surround properties. ROIs allocated to each cluster originated from at least 10 scan fields
and 5 animals. Functional clusters were well-separated in feature space including pairs of
the same polarity (SFig. 3c) and individual scan fields routinely comprised ROIs allocated to
more than one cluster (SFig. 3d). Because some BC types have highly overlapping
stratification profiles, the assignment of our functional cluster to morphological types is not
bijective. This caveat pertains to clusters (C): C1,2, C3a,b,4, C5a-c,X and C8,9,R (SFig. 3b), which
might need to be permuted. For simplicity, we refer to functional clusters by the anatomical
BC profiles they originated from.
Organisational principles of the IPL
A fundamental principle of vertebrate inner retinal organisation is the subdivision into Off and
On cells (Werblin and Dowling, 1969; Nelson and Kolb, 1983; Euler et al., 1996). In
agreement, C1-4 increased activity at the offset of a step of light (Off BCs), while C5a-R
responded to the step’s onset (On BCs, Fig. 2g1). However, the segregation into On and Off
responses was not as clear-cut as expected: All Off BC clusters frequently responded with
delayed spike-like events during the On phase of the light step (Fig. 2d,g2). These On events
in Off BC clusters did not correspond to spontaneous activity (SFig. 3e). Due to the
variability in timing (SFig. 3f), On events were not evident in traces averaged across the
population of ROIs for each cluster (Fig. 2c). Notably, such delayed On events were also
observed in some Off-type RGCs (Baden et al., 2016). In contrast, On BCs only rarely
exhibited analogous Off responses (SFig. 3e).
A second fundamental principle of inner retinal organisation is the segregation into temporal
“transient” and “sustained” channels which map onto the IPL centre and borders,
respectively (Awatramani and Slaughter, 2000; Roska and Werblin, 2001; Baden et al.,
2012; Borghuis et al., 2013). While our results are broadly in line with this notion, the full
picture is more complex: For example, although spike-like events were observed most
frequently towards the IPL centre (Fig. 2e,g3, SFig. 3g) (Dreosti et al., 2011; Baden et al.,
2012; Saszik and DeVries, 2012; Puthussery et al., 2013), they could be found at all IPL
depths. In addition, all On but none of the Off cells showed a sustained plateau following an
initial fast peak (Fig. 2g4), making the most sustained Off cell (C1) nearly as transient as the
most transient On cell (CX, Fig. 2g5). Interestingly, a transient or spiking response was not
correlated with a short response delay (SFig. 3h,i): For example, C7 responses were
sustained but had a short delay, whereas C3a responses were transient with a moderate
.CC-BY-NC-ND 4.0 International licenseIt is made available under a (which was not peer-reviewed) is the author/funder, who has granted bioRxiv a license to display the preprint in perpetuity.
The copyright holder for this preprint. http://dx.doi.org/10.1101/040642doi: bioRxiv preprint first posted online Mar. 22, 2016;

5
delay. This suggests that temporal properties of BCs like response delay (“fast” vs. “slow”
onset) and transience (speed of response decay) can independently vary between BC types
- a key ingredient towards the computation of motion (Kim et al., 2014; Serbe et al., 2016).
Finally, we also found a spatial map across the IPL: RF size varied systematically among BC
clusters and significantly decreased with increasing stratification depth (Fig. 2f,g7; ρ=0.89,
p<0.001, n=14 clusters, linear correlation), such that RF diameters of Off BCs (66.3±3.5 µm,
mean±s.d.) were on average 10.4 µm larger than those of On BCs (55.9±5.3 µm). Despite
this overall trend, RF sizes within one IPL depth differed substantially: For example, C3b or
C5a had RF diameters nearly 10 µm larger than C4 or C7, respectively.
In summary, our results highlight important exceptions from fundamental principles of inner
retinal organisation and identify a new spatial organising principle. They indicate that
functionally opposite signals such as short and long delays or even On versus Off response
polarities co-exist at a single depth.
BC surround activation increases functional diversity
The organising principles discussed above were extracted from the responses to the local
chirp alone, yet responses to the full-field chirp were substantially more heterogeneous (Fig.
2c, Fig. 3). For both On and Off BC clusters, additional surround stimulation significantly
decorrelated chirp responses across clusters of the same polarity, and further anticorrelated
responses of opposite polarity (Fig. 3a; correlation ρlocal=0.9 vs. ρfull-field=0.7 and ρlocal=-0.3 vs.
ρfull-field=-0.5, p<0.001, n=14, Wilcoxon signed-rank test). This effect could be quite dramatic
(Fig. 3b): For example, Off clusters C2 and C3b responded nearly identical to the local chirp,
whereas their responses to the full-field chirp were effectively uncorrelated (ρlocal=0.7 vs. ρfull-
field=0.1). We saw similar differences between On cluster C6 and C9 responses (ρlocal=0.9 vs.
ρfull-field=0.4). This markedly broadened the response space covered by BC types (Fig. 3c,d,
cf. Fig. 2g). For example, during full-field stimulation some On BCs (e.g. C5a or C9) lost their
sustained plateau phase and became much more transient (Fig. 2c, Fig. 3d4,5). The
increased diversity is also evident in a two-dimensional representation of the response
means for centre-surround relative to centre-only activation (Fig. 3c, Methods). Accordingly,
the major type-specific differences in the final output of BCs appear to be determined by
concomitant centre and surround activation, rather than centre activation alone.
Different ACs mediate and gate BC surround
We next dissected the cellular components underlying the observed surround effects
pharmacologically. The two major groups of AC in the mammalian retina, small- and wide-
field ACs, use glycine and GABA as their primary neurotransmitter, respectively (Fig. 4a)
(Pourcho and Goebel, 1983; Menger et al., 1998). Both groups contact BC axon terminals
which in turn express GABA receptors and, in the case of Off BCs, also glycine receptors
(Lukasiewicz and Werblin, 1994; Pan and Lipton, 1995; Euler and Wässle, 1998; Euler and
Masland, 2000). In addition, there is extensive crosstalk among ACs (Roska et al., 1998;
Eggers and Lukasiewicz, 2006; Eggers et al., 2010). To test which of these interactions
modulate the BC surround, we pharmacologically blocked either GABA or glycine receptors
while monitoring light-evoked glutamate release. Representative for On and Off BCs, we
focused these measurements on the BC types overlapping with the On and Off ChAT band,
respectively.
.CC-BY-NC-ND 4.0 International licenseIt is made available under a (which was not peer-reviewed) is the author/funder, who has granted bioRxiv a license to display the preprint in perpetuity.
The copyright holder for this preprint. http://dx.doi.org/10.1101/040642doi: bioRxiv preprint first posted online Mar. 22, 2016;

6
Pharmacological manipulation had little effect on overall response shape for local stimuli, but
caused strong effects for full-field stimulation (Fig. 4). Blocking GABAA and GABAC receptors
(with 10 µM Gabazine (Gbz) and 75 µM TPMPA, respectively) lead to an increase in
response amplitude in both On and Off BCs (Fig. 4b1,c1, SFig. 4a; ρControl=0.44 vs.
ρDrug=0.93, p<0.001, n=9 clusters), consistent with attenuated surround inhibition (Roska et
al., 2000; Ichinose and Lukasiewicz, 2005; Buldyrev and Taylor, 2013). In addition, blocking
GABA receptors nearly eliminated the difference between local and full-field chirp responses
(Fig. 4d1,e1, SFig. 4b; ρControl=0.58 vs. ρDrug=0.8, p<0.05, n=10 clusters). This suggests that
the BC surround is largely generated by presynaptic inhibition from GABAergic ACs
(Discussion).
In contrast, blocking glycine receptors (with 0.5 µM Strychnine) reduced the response to full-
field flashes (Fig. 4b2,c2, SFig. 4a; ρControl=0.55 vs ρDrug=0.22, p<0.001, n=6 clusters),
consistent with an increase in surround strength. Notably, this effect reliably induced a
polarity switch in BC responses to full-field stimulation, thus anti-correlating local and full-
field chirp responses (Fig. 4d,e2, SFig. 4c; ρControl=0.6 vs. ρDrug=-0.24, p<0.001, n=8 clusters).
This suggests that glycinergic ACs primarily modulate BC output in an indirect way by
inhibiting GABAergic ACs, leading to decreased inhibition. In the absence of drugs, a polarity
switch could also be consistently induced by presenting an annulus chirp that excluded the
central 100 µm-spot (SFig. 4d) (Dacey et al., 2000). Accordingly, the BC surround not only
modulates an existing centre response, but can also act as an independent “input system”
that by itself is capable of driving glutamate release from BCs. One explanation is that
inhibition modulates a light-independent tonic release of glutamate, which appears to be a
common feature of BCs (Venkataramani and Taylor, 2016).
Additionally, we found that blocking GABA receptors increased the size of the BC RF centre,
whereas glycine receptor block had no detectable effect on RF size (Fig. 4f). This implies
that not only temporal, but also spatial properties of the BC centre depend on the state of the
GABAergic inhibitory network in the inner retina.
In summary, the two major groups of ACs of the mouse retina appear to act in tandem to set
the balance of excitation and inhibition, thereby increasing functional diversity among BC
types.
Differential centre-surround interactions underlie BC diversity
An increase in functional diversity upon surround stimulation is only possible if surround
networks of different BC types differentially process visual stimuli. Accordingly, it is important
to obtain precise estimates not only of centre but also of surround spatio-temporal RFs. To
this end, we estimated a series of linear time kernels at different distances from the BC RF
centre by presenting independently flickering narrow concentric rings (“ring noise”, Fig. 5a)
and isolated RF centre and surround space and time kernels for every BC cluster (Fig. 5b,c,
SFig. 5a-c, Methods).
Centre and surround time kernels of the same clusters were correlated with respect to width
and time to peak (Fig. 5d,e). Centre kernels were consistently broader than surround kernels
(Fig. 5d; 5.3±3.2 ms, mean±s.d.), while the time lag between centre and surround peaks was
more pronounced for cells with shorter time to peak for both On and Off clusters (Fig. 5e)
with the delay ranging from 1 to 5 ms. This indicates that BC types may not contribute
strongly to generating their own surround; if this had been the case, one should have
observed a slope of 1 (Fig. 5e). One possible mechanism is that ACs providing surround
.CC-BY-NC-ND 4.0 International licenseIt is made available under a (which was not peer-reviewed) is the author/funder, who has granted bioRxiv a license to display the preprint in perpetuity.
The copyright holder for this preprint. http://dx.doi.org/10.1101/040642doi: bioRxiv preprint first posted online Mar. 22, 2016;

7
inhibition to BCs with short delays are driven by BCs with longer delays. Moreover, the
spatial extent of surround kernels varied between types (Fig. 5f, range: 287-478 µm),
indicating that also different AC networks are involved in different BC circuits.
Next, we investigated how functional diversity may emerge from the observed differences in
centre-surround organisation. Using the spatial RFs, we first estimated the centre-surround
ratio (CSR) for circular stimuli of different sizes for each cluster (Fig. 5g, SFig. 5d, Methods).
For an example cluster (CX), a small stimulus (100 µm in diameter) resulted in a two-fold
stronger centre activation compared to the surround (CSR=2.3, “centre-dominant”). In
contrast, the surround was stronger than the centre for a full-field spot (500 µm in diameter,
CSR=0.8, “surround-dominant”). Although the exact CSRs slightly differed between BC
clusters for a given stimulus size, all clusters gradually switched from a centre-dominant to a
surround-dominant mode of operation between 200 and 600 µm-diameter stimuli (SFig. 5d).
We next used a simple model to predict how the temporal properties of BCs change with the
spatial extent of the stimulus (Fig. 5h). For example, the predicted kernel of CX “accelerated”
with stimulus size, approximately doubling its centre frequency and temporal bandwidth (Fig.
5i). The model predicted cluster-specific changes in the temporal coding properties with
increasing stimulus size, leading to an increase in the overall diversity across clusters (Fig.
5j). As a result, combined kernels for larger stimuli encompassed a much broader range of
temporal frequencies (Fig. 5i). To directly test this prediction experimentally, we recorded BC
responses to flickering spots at two different stimulus sizes (100 and 500 µm diameter,
respectively). In agreement with the model, time kernels consistently differed between
stimulus sizes (Fig. 5k), leading to lower time kernel correlations across clusters for centre-
surround compared to centre- or surround-only stimulation (Fig. 5l, cf. Fig. 3a, SFig. 5e). In
addition, the model predicts that this effect was strongest between ~200 and 500 µm (Fig.
5m), matching the distribution of RF centre sizes of RGCs in the mouse retina (Baden et al.
2016).
DISCUSSION
We systematically surveyed the visual response properties of mouse BCs by imaging their
glutamatergic output and arrive at a census of the excitatory signals that drive inner retinal
circuits. Beyond the expected mapping of “classical” functional BC properties like On and Off
or different response kinetics onto specific strata of the IPL (Awatramani and Slaughter,
2000; Roska and Werblin, 2001; Baden et al., 2012), we found that the overall functional
heterogeneity within individual IPL strata was larger than previously thought. We showed
how this temporal diversity is created by the interplay of the excitatory drive forwarded from
the dendrites and local axonal inputs from ACs, with the two input streams acting at different
spatial scales. As a result, the spatial structure of the visual input fundamentally sets the
balance between excitation and inhibition and thus the temporal encoding in BCs – and
consequently the visual system.
Sources of glutamate release in the IPL
One central assumption was that BC axon terminals are the source of glutamate release in
the IPL. However, some On BCs feature ectopic synapses along their axon (Dumitrescu et
al., 2009; Kim et al., 2012) which might contribute to observed On responses in the Off sub-
lamina (Fig. 2d,g2). Two findings strongly argue against this possibility: First, On responses
.CC-BY-NC-ND 4.0 International licenseIt is made available under a (which was not peer-reviewed) is the author/funder, who has granted bioRxiv a license to display the preprint in perpetuity.
The copyright holder for this preprint. http://dx.doi.org/10.1101/040642doi: bioRxiv preprint first posted online Mar. 22, 2016;

8
in the Off sub-lamina were always accompanied by a clear and dominant Off component
(Fig. 2d,g1). Second, they were delayed relative to On responses in the On layer (SFig. 3f),
suggesting a different origin. Instead, they likely either resulted from surround inhibition or
from intrinsic properties of some Off BC types, such as a depolarising rebound following
transient inhibition (Mitra and Miller, 2007a, 2007b).
In addition, the mouse retina harbours at least one AC type that uses glutamate as
neurotransmitter at conventional non-ribbon synapses (Lee et al., 2014). This glutamatergic
AC (GAC) stratifies between On and Off ChAT bands and receives inputs from both On and
Off BCs (Lee et al., 2014). Dendritic calcium imaging suggests that GACs process BC input
locally, resulting in On and Off responses in the On and Off sub-lamina, respectively (Lee et
al., 2015). These signals are expected to be very similar to the respective BC inputs and can
likely not be separated using our clustering method. Therefore, we took the conservative
approach and did not include the GAC in our analysis.
In contrast, we included RBCs as they displayed robust light-evoked calcium responses at
our stimulus intensities in the low-photopic regime (Fig. S2e,f). Under these conditions, rod
photoreceptors, which provide the excitatory synaptic input to RBCs (Dacheux and Raviola,
1986; Bloomfield and Dacheux, 2001; Keeley and Reese, 2010), are thought to be
saturated. However, recent evidence suggests that both rods (Tikidji-Hamburyan et al.,
2014) and RBCs (Chen et al., 2014b) can be active under photopic conditions. Perhaps
direct contacts between RBCs and cones identified at both the ultrastructural (Behrens,
Schubert, Haverkamp, Euler and Berens, personal communication) and functional level
(Pang et al., 2010) contribute to the observed responses, further challenging the view that
RBCs solely mediate vision in dim light.
The origin of BC functional diversity
We found that functional diversity amongst BCs is primarily driven by a change in the
balance of excitation and GABAergic inhibition, which in turn is set by glycinergic inhibition.
Specifically, GABAergic inhibition seems to be distinct for different BC types and can thus
act to decorrelate BC channels (Figs. 3-5).
The decorrelating surround effects are likely due to AC mediated inhibition in the inner
retina, rather than horizontal cell (HC) mediated inhibition in the outer retina: First, mouse
HCs (Peichl and González-Soriano, 1994) have little effect on BC (Purgert and Lukasiewicz,
2015) and RGC function (Cook and McReynolds, 1998; Taylor, 1999; Ichinose and
Lukasiewicz, 2005). Second, we found that the GABAergic BC surround was gated by
glycinergic signals (Fig. 4) which appear to be exclusive to the inner retina (Wässle et al.,
2009a).
Our results suggest that in the intact (whole-mounted) retina, glycinergic effects via serial
pathways – such as the gating of GABAergic inhibition to BCs – predominate over direct
inputs to BCs. While such serial inputs exist in salamander (Zhang et al., 1997; Roska et al.,
2000), available data for the mouse is less conclusive (Eggers and Lukasiewicz, 2006;
Majumdar et al., 2009). In mouse, glycinergic ACs were found to mainly mediate vertical
signalling (crossover inhibition) via direct inputs to Off BCs (Ivanova et al., 2006; Roska et
al., 2006; Chavez and Diamond, 2008; Eggers and Lukasiewicz, 2011). However, these
studies were performed in vertical slices where lateral connections are likely compromised.
.CC-BY-NC-ND 4.0 International licenseIt is made available under a (which was not peer-reviewed) is the author/funder, who has granted bioRxiv a license to display the preprint in perpetuity.
The copyright holder for this preprint. http://dx.doi.org/10.1101/040642doi: bioRxiv preprint first posted online Mar. 22, 2016;

9
The elementary computational unit of the IPL
The powerful effect of inner retinal inhibition on visual encoding in BCs bolsters the view that
the elementary computational unit of the IPL must be the individual BC synaptic terminal
(Eggers and Lukasiewicz, 2011; Oesch and Diamond, 2011; Odermatt et al., 2012; Baden
and Euler, 2013; Nikolaev et al., 2013). Clearly, BCs are not electrotonically compact units,
where the computational output can be assessed equally in each compartment (Oltedal et
al., 2006). Instead it is at the terminals where two input streams of comparable strength
combine: one feedforward pathway reflecting the integrated dendritic drive from the
photoreceptors and one indirect pathway reflecting the aggregate inhibitory AC network
activity. Critically, each input stream by itself can modulate or even drive BC synaptic
release.
This further raises the possibility that individual terminals of a single BC may signal
independently, if they receive differential inputs from ACs. To what extent such
heterogeneity at the level of the BC axon terminal (“presynaptic multiplexing”) matters is
actively debated (Euler et al., 2014). While direct evidence for heterogeneity at the level of
mouse BC terminal calcium is lacking (Fig. S2b) (Yonehara et al., 2013; Chen et al., 2014b),
electrical recordings in salamander retina showed that individual BCs can elicit different
responses in different postsynaptic RGCs (Asari and Meister, 2012, 2014). Although this
effect could be explained by presynaptic heterogeneity generated by differential AC inputs or
by differences in terminal size (Baden et al., 2014), it could also originate from selective
postsynaptic inhibition (Masland, 2012b). Additional diversity could come from type-specific
differences in the dendritic properties of postsynaptic neurons (Marc and Jones, 2002; Sun
et al., 2003; Oesch et al., 2005). For our recording conditions, type-specific functional
differences across mouse BCs appear to be more pronounced than any putative differences
across terminals of a single cell.
Decomposition of the visual signal in the inner retina
Why does the mouse retina split the visual signal into 14 parallel channels at the level of
BCs? The finding that small stimuli in the range of a BCs dendritic field evoke highly
correlated responses among types of the same response polarity implies that the set of BC
types is not optimised to decompose the visual signal at this scale. Instead, it is only upon
spatially extended stimulation that the rich functional diversity among BC types is revealed.
Our data suggests that this diversity is generated by the interaction of correlated yet not-
identical pairs of temporal BC centre and surround kernels. Differences between temporal
RFs of centre and surround are emphasised as increasing stimulus size shifts the balance
between centre- and surround-activation towards a stronger surround contribution. The
outcome is a new “mixed” temporal RF that is – up to a certain stimulus diameter –
increasingly distinct from similarly “mixed” temporal RFs of other centre-surround pairs (Fig.
5). Interestingly, the stimulus size leading to maximal diversity matches the average centre
size of RGC RFs (Baden et al., 2016). This also implies that a hypothetical RGC type driven
by only one BC type should receive temporally distinct inputs from its presynaptic partners
depending on the spatial aspects of the stimulus (cf. (Schwartz et al., 2012)).
The notion that an antagonistic centre-surround RF organisation can decorrelate neural
response properties is a fundamental principle in neuroscience (e.g. (Barlow, 1961; Atick
and Redlich, 1990, 1993)). For example, surround-mediated decorrelation of neurons has
.CC-BY-NC-ND 4.0 International licenseIt is made available under a (which was not peer-reviewed) is the author/funder, who has granted bioRxiv a license to display the preprint in perpetuity.
The copyright holder for this preprint. http://dx.doi.org/10.1101/040642doi: bioRxiv preprint first posted online Mar. 22, 2016;

10
been demonstrated for RGCs (Pitkow and Meister, 2012), neurons in primary visual cortex
(Vinje et al., 2007) as well as for neurons in other sensory systems (Wiechert et al., 2010).
However, these studies focused on decorrelation between neurons independent of cell type.
In contrast, less is known about the effect of surround inhibition in decreasing the
redundancy of the encoding in different neuronal cell types of the same class. Here, we
show that the balance between feedforward excitation and lateral inhibition in the IPL
decorrelates parallel signal channels formed by BC types. Such decorrelation is typically
linked to efficient coding (Denève and Machens, 2016) of visual stimuli and our data place
this computation already at the second synapse of the mouse visual system.
.CC-BY-NC-ND 4.0 International licenseIt is made available under a (which was not peer-reviewed) is the author/funder, who has granted bioRxiv a license to display the preprint in perpetuity.
The copyright holder for this preprint. http://dx.doi.org/10.1101/040642doi: bioRxiv preprint first posted online Mar. 22, 2016;

11
FIGURE LEGENDS
Figure 1 | Imaging light-driven glutamate release in the IPL. a, Whole-mounted retina of
a ChAT:Cre x AI9tdTomato mouse (tdTomato in white) with ubiquitous iGluSnFR expression
(green) in the naso-ventral retina following intravitreal injection of
AAV9.hSyn.iGluSnFr.WPRE.SV40. d: dorsal, v: ventral, n: nasal, t: temporal. Unless
indicated otherwise, vertical and horizontal scales are identical. b, Vertical projection of a
high resolution stack showing iGluSnFR expression (green) across the IPL, with blood
vessels visualised by SR101 (red). Grey plane illustrates scan field orientation. GCL:
Ganglion cell layer, IPL: Inner plexiform layer, INL: Inner nuclear layer. c, Position of ChAT
bands (white) relative to blood vessel plexi (red, c1) and their average depth profiles (± s.d.
shading, c2); n=9 stacks from 3 mice. d, Example scan field (64x16 pixels) with Region-of-
interest (ROI) mask overlaid. e, Glutamate traces of one ROI from (d) in response to (from
left to right) local and full-field chirp stimulus, full-field flashes, temporal and spatial receptive
field (e1, Methods). Glutamate traces represent relative glutamate release (d[Glut]). Individual
trials in grey (n=5 for chirps, n>30 for full-field flashes) with mean responses overlaid (black).
Dotted line in temporal RF indicates time point of response. e2,e3, Superimposed mean
glutamate traces in response to local (top) and full-field chirp (bottom) of red (e2) and green
(e3) ROIs from (d). f, Scan field and ROI mask from (d) with spatial RFs (2 s.d. outlines of
gauss fit, n=20 ROIs) of red (f1) and green (f2) ROIs color-coded in (d).
Figure 2 | Anatomy-guided clustering and functional organisation of the IPL. a, EM-
reconstructed and volume-rendered example BCs (a1, from (Helmstaedter et al., 2013)),
illustrate type-specific axonal stratification patterns relative to ChAT bands (dashed lines).
a2, Mean BC stratification profiles of all known BCs (5 Off CBCs, 8 On CBCs, 1 rod BC)
(Greene et al., n.d.; Kim et al., 2014). b, Exemplary distributions of prior probabilities for
cluster allocation (b2) taken from mean stratification profiles (b1) of scan fields recorded at
two different IPL depths (A: 1.7; B: 0). c, Normalised mean glutamate response of every
cluster to (from left to right) local and full-field chirp, full-field flashes and temporal kernels
estimated from the noise stimulus. d, Glutamate responses to the local chirp step stimulus of
single ROIs assigned to C2 and C9, respectively. Shown are responses to 3 trials and a
histogram of response amplitudes across each cluster´s 100 best responding ROIs. On
responses in Off BC cluster C2 are highlighted (arrows). e, As (d), showing “spiking” (C3b, CX)
and non-spiking (C1, CR) responses in clusters of either polarity. f, Spatial RFs of individual
ROIs assigned to C3a and C6, respectively. g, Response measures estimated for all ROIs
(n=8,448) plotted against IPL depth, with grey shading corresponding to median ± s.d. for
every IPL bin (n=13 bins). Cluster means (± s.d.) are overlaid. From left to right: Response
polarity (g1), opposite polarity events (g2), HF index (g3), plateau index (g4), response
transience (g5), response delay (g6) and RF diameter (g7). g1-6 were estimated from local
chirp step responses and g7 was estimated from spatial RFs obtained from the noise
stimulus.
Figure 3 | Surround activation increases functional diversity across BCs. a, Correlation
matrix between cluster means of local (a1, top) and full-field (a1, bottom) chirp responses,
with darker colours indicating higher (anti)correlation. a2, Mean correlation between local and
full-field chirp responses for each cluster with all other clusters of the same (top) and
opposite (bottom) polarity (ρlocal =0.9 vs. ρfull-field=0.7 and ρlocal =-0.3 vs. ρfull-field=-0.5, p<0.001,
n=14, non-parametric paired Wilcoxon signed-rank test). Mean ± s.d. in black. b, Mean chirp
responses of two Off (C2 and C3b, b1) and two On (C6 and C9, b2) clusters, with linear
.CC-BY-NC-ND 4.0 International licenseIt is made available under a (which was not peer-reviewed) is the author/funder, who has granted bioRxiv a license to display the preprint in perpetuity.
The copyright holder for this preprint. http://dx.doi.org/10.1101/040642doi: bioRxiv preprint first posted online Mar. 22, 2016;

12
correlation coefficient (ρ) of whole trace or contrast ramp indicated. c, Cluster means of local
(left) and full-field (right) chirp responses embedded in two-dimensional feature space based
on first and second principal components (PC). d, Response measures estimated from full-
field chirp responses for all ROIs plotted against IPL depth (cf. Fig. 2g).
Figure 4 | Opposite effects of GABA- and glycinergic ACs on BC output. a, Schematic
wiring of GABA- and glycinergic ACs with BC terminals (a1), illustrating the effects of
pharmacological GABA (TPMPA/Gbz; 75/10 µM) and glycine (Strychnine; 0.5 µM) receptor
block (a2). b, Mean responses (n=5 trials) of individual exemplary ROIs to alternating local
and full-field flashes under control conditions and with GABA (b1) or glycine (b2) receptor
block. c, Quantification of drug-induced changes in peak response amplitude across different
BC clusters upon blocking GABA (c1; p<0.001, n=9 clusters from 5 scan fields and 4 mice,
non-parametric paired Wilcoxon signed-rank test) and glycine receptors (c2; p<0.001, n=6
clusters from 5 scan fields and 4 mice). Mean ± s.d. in black. For (c-f), traces/RFs were
averaged across all ROIs from one scan field assigned to the same cluster (Methods). d,
Local (grey) and full-field (black) chirp responses for control and drug conditions (d1: GABA
receptor block; d2: glycine receptor block), with linear correlation coefficient (ρ) between
each pair indicated. e, Linear correlation coefficients of local and full-field chirp responses
across different clusters for GABA (e1; p<0.05, n=10 from 5 scan fields and 4 mice, non-
parametric paired Wilcoxon signed-rank test) and glycine (e2; p<0.001, n=8 from 4 scan
fields and 3 mice) receptor block. f, Spatial RFs with 2 s.d. outline of Gaussian fit shown in
red (left) and quantification of changes in RF diameter across different BC clusters (right)
upon blocking GABA (f1; p<0.05, n=6 cluster from 3 scan fields and 2 mice, non-parametric
paired Wilcoxon signed-rank test) and glycine receptors (f2; p>0.05, n=5 cluster from 3 scan
fields and 2 mice).
Figure 5 | Differential centre-surround organisation underlies BC functional diversity.
a, Schematic of ring noise stimulus, showing intensity distribution across rings (width: 25
µm) for the first three stimulus frames. b, Centre-surround maps of an example cluster (CX),
depicting temporal kernels of n=8 rings with increasing distance from the scan field centre.
From the average map of each cluster (left), surround (middle) and centre (right)
components were isolated using Singular value decomposition (SVD; Methods, cf. SFig. 5a).
Dashed lines at t = 0. c, Normalised time (top) and space (bottom) kernels of CX (c1) and all
On (c2) and Off (c3) BC clusters. Space kernels represent extrapolated Gauss fits of centre
and surround activation across rings shown in (b), with circles corresponding to the original
data points (Methods). d, Half-maximal width was consistently narrower for centre compared
to surround time-kernels (r=0.83, p<0.001, n=14, linear correlation; slope=0.93, p>0.05,
linear regression for slope=1). Black line corresponds to linear fit and for the dashed line the
slope=1. e, Time to peak of centre time kernels preceded peak of surround time kernels
(r=0.91, p<0.001, n=14, linear correlation). This effect was stronger for cells with shorter time
to peak (slope=0.65, p<0.001, linear regression for slope=1). f, Half-maximal width of
surround space kernels did not correlate with mean cluster IPL depth (r=0.06, p>0.05, n=14,
linear correlation). g, Space kernels of CX (g1), with predicted centre-surround activation
ratios (CSR) of a local (top) and full-field (bottom) spot stimulus obtained from the relative
activation of centre (light grey) and surround (dark grey). g2, Predicted CSRs of CX for
different spot diameters. h, Normalised effective time kernels of CX for different stimulus
diameters (left), obtained from a weighted addition of centre and surround time kernels
shown in (c1). Right, Normalised effective time kernels estimated for a stimulus diameter of
.CC-BY-NC-ND 4.0 International licenseIt is made available under a (which was not peer-reviewed) is the author/funder, who has granted bioRxiv a license to display the preprint in perpetuity.
The copyright holder for this preprint. http://dx.doi.org/10.1101/040642doi: bioRxiv preprint first posted online Mar. 22, 2016;

13
100 and 500 µm, respectively. Spectra in (i) and (j) were estimated from kernel fraction as
indicated by dashed rectangle. i, Predicted normalised spectra estimated from effective time
kernels shown in (h, right). j, Predicted normalised spectra of Off (top) and On (middle) BC
clusters during local (left) and full-field (right) stimulation. Average spectra across BC cluster
and s.d. shown in black and grey, respectively (bottom). k, Measured, normalised time
kernels (left) and normalised frequency spectra (right) estimated for a local and full-field spot
noise stimulus, exemplary shown for C1 and C6. l, Correlation of time kernels estimated from
the spot noise (p<0.001, n=13, non-parametric paired Wilcoxon signed-rank test) and
predicted by the model (for both p<0.001, n=14) for local, full-field and surround-only
stimulation. Mean ± s.d. in black. m, Average correlation across predicted cluster time
kernels for different stimulus diameters. Errors in s.e.m.
.CC-BY-NC-ND 4.0 International licenseIt is made available under a (which was not peer-reviewed) is the author/funder, who has granted bioRxiv a license to display the preprint in perpetuity.
The copyright holder for this preprint. http://dx.doi.org/10.1101/040642doi: bioRxiv preprint first posted online Mar. 22, 2016;

14
METHODS
Animals and tissue preparation
All animal procedures adhered to the laws governing animal experimentation issued by the
German Government. For all experiments, we used 3- to 12-week-old Chattm2(cre)Lowl (n=29;
“ChAT:Cre”, JAX 006410, The Jackson Laboratory, Bar Harbor, US) and Tg(Pcp2-cre)1Amc
(n=5; “Pcp2”, JAX 006207) mice of either sex. These transgenic lines were cross-bred with
the Cre-dependent red fluorescence reporter line Gt(ROSA)26Sortm9(CAG-tdTomato)Hze
(“Ai9tdTomato”, JAX 007905) for a subset of experiments.
Animals were housed under a standard 12 hr day/night rhythm. For recordings, animals
were dark-adapted for ≥1 h, then anesthetised with isoflurane (Baxter, Unterschleißheim,
Germany) and killed by cervical dislocation. The eyes were enucleated and hemisected in
carboxygenated (95% O2, 5% CO2) artificial cerebral spinal fluid (ACSF) solution containing
(in mM): 125 NaCl, 2.5 KCl, 2 CaCl2, 1 MgCl2, 1.25 NaH2PO4, 26 NaHCO3, 20 glucose, and
0.5 L-glutamine (pH 7.4). Then, the tissue was moved to the recording chamber of the
microscope, where it was continuously perfused with carboxygenated ACSF at ~37°C. The
ACSF contained ~0.1 µM Sulforhodamine-101 (SR101, Invitrogen, Darmstadt, Germany) to
reveal blood vessels and any damaged cells in the red fluorescence channel. All procedures
were carried out under very dim red (>650 nm) light.
Virus injection
A volume of 1 µl of the viral construct (AAV9.hSyn.iGluSnFr.WPRE.SV40 or
AAV9.CAG.Flex.iGluSnFr.WPRE.SV40 (referred to as “AAV9.iGluSnFr”) or
AAV9.Syn.Flex.GCaMP6f.WPRE.SV40, Penn Vector Core, Philadelphia, USA) was injected
into the vitreous humour of 3- to 8-week-old mice anesthetised with 10% ketamine (bela-
pharm GmbH & Co. KG, Vechta, Germany) and 2% xylazine (Rompun, Bayer Vital GmbH,
Leverkusen, Germany) in 0.9% NaCl (Fresenius, Bad Homburg, Germany). For the
injections, we used a micromanipulator (World Precision Instruments, Sarasota, USA) and a
Hamilton injection system (syringe: 7634-01, needles: 207434, point style 3, length 51 mm,
Hamilton Messtechnik GmbH, Hoechst, Germany). Due to the fixed angle of the injection
needle (15°), the virus was applied to the ventro-nasal retina. Imaging experiments were
performed 3 to 4 weeks after injection.
Pharmacology
All drugs were bath applied for at least ten minutes before recordings. The following drug
concentrations were used (in µM): 10 Gabazine (Tocris Bioscience, Bristol, UK) (Kemmler et
al., 2014), 75 TPMPA (1,2,5,6-Tetrahydropyridin-4-yl)methylphosphinic acid, Tocris
Bioscience) (Kemmler et al., 2014), and 0.5 strychnine (Sigma-Aldrich, Steinheim am
Albuch, Germany) (Schubert et al., 2008). Drug solutions were carboxygenated and warmed
to ~37°C before application. Pharmacological experiments were exclusively performed in the
On and Off ChAT-immunoreactive bands, which are labelled in red fluorescence in
ChAT:Cre x AI9tdTomato crossbred animals.
.CC-BY-NC-ND 4.0 International licenseIt is made available under a (which was not peer-reviewed) is the author/funder, who has granted bioRxiv a license to display the preprint in perpetuity.
The copyright holder for this preprint. http://dx.doi.org/10.1101/040642doi: bioRxiv preprint first posted online Mar. 22, 2016;

15
Two-photon imaging and light stimulation
We used a MOM-type two-photon microscope (designed by W. Denk, MPI, Heidelberg;
purchased from Sutter Instruments/Science Products, Hofheim, Germany). Design and
procedures were described previously (Euler et al., 2009). In brief, the system was equipped
with a mode-locked Ti:Sapphire laser (MaiTai-HP DeepSee, Newport Spectra-Physics,
Darmstadt, Germany), two fluorescence detection channels for iGluSnFR or GCaMP6f (HQ
510/84, AHF/Chroma Tübingen, Germany) and SR101/tdTomato (HQ 630/60, AHF), and a
water immersion objective (W Plan-Apochromat 20x/1,0 DIC M27, Zeiss, Oberkochen,
Germany). The laser was tuned to 927 nm for imaging iGluSnFr, GCaMP6f or SR101, and to
1,000 nm for imaging tdTomato. For image acquisition, we used custom-made software
(ScanM, by M. Müller, MPI, Martinsried, and T.E.) running under IGOR Pro 6.3 for Windows
(Wavemetrics, Lake Oswego, OR, USA), taking time-lapsed 64 x 16 pixel image scans (at
31.25 Hz) for glutamate and 32 x 32 pixel image scans (at 15.625 Hz) for calcium imaging.
For visualising morphology, 512 x 512 pixel images were acquired.
For light stimulation, we focused a DLP projector (K11, Acer) through the objective, fitted
with band-pass-filtered light-emitting diodes (LEDs) (“green”, 578 BP 10; and “blue”, HC 405
BP 10, AHF/Croma) to match the spectral sensitivity of mouse M- and S-opsins. LEDs were
synchronised with the microscope’s scan retrace. Stimulator intensity (as photoisomerisation
rate, 103 P*/s/cone) was calibrated as described previously (Euler et al., 2009) to range from
0.6 and 0.7 (black image) to 18.8 and 20.3 for M- and S-opsins, respectively. Due to
technical limitations, intensity modulations were weakly rectified below 20% brightness. An
additional, steady illumination component of ~104 P*/s/cone was present during the
recordings because of two-photon excitation of photopigments (for detailed discussion, see
(Euler et al., 2009) and (Baden et al., 2013)). The light stimulus was centred prior to every
experiment, such that its centre corresponded to the centre of the recording field. For all
experiments, the tissue was kept at a constant mean stimulator intensity level for at least 15
s after the laser scanning started and before light stimuli were presented. Four types of light
stimuli were used (Fig. 1): (i) Full-field (800x600 µm) and (ii) local (100 µm in diameter)
“chirp” stimuli consisting of a bright step and two sinusoidal intensity modulations, one with
increasing frequency (0.5-8 Hz) and one with increasing contrast, (iii) 1 Hz light flashes (500
µm in diameter, 50% duty cycle), and (iv) binary dense noise (20x15 matrix of 20x20 μm
pixels; each pixel displayed an independent, balanced random sequence at 5 Hz for 5
minutes) for space-time receptive field (RF) mapping. In a subset of experiments, we used
two additional stimuli: (v) A “ring noise” stimulus (10 annuli with increasing diameter, each
annulus 25 µm wide), with each ring’s intensity determined independently by a balanced 68
s random sequence at 60 Hz repeated four times, and (vi) a surround chirp stimulus
(annulus; Full-field chirp sparing the central 100 µm corresponding to the local chirp). For all
drug experiments, we showed in addition (vii) a stimulus consisting of alternating 2 s full-field
and local light flashes (500 and 100 µm in diameter, respectively). All stimuli were
achromatic, with matched photo-isomerisation rates for mouse M- and S-opsins.
Estimating recording depth in the IPL
For each scan field, we used the relative positions of the inner (ganglion cell layer) and outer
(inner nuclear layer) blood vessel plexus to estimate IPL depth. To relate these blood vessel
.CC-BY-NC-ND 4.0 International licenseIt is made available under a (which was not peer-reviewed) is the author/funder, who has granted bioRxiv a license to display the preprint in perpetuity.
The copyright holder for this preprint. http://dx.doi.org/10.1101/040642doi: bioRxiv preprint first posted online Mar. 22, 2016;

16
plexi to the ChAT bands, we performed separate experiments in ChAT:Cre x AI9tdTomato mice:
High resolution stacks throughout the inner retina were recorded in the ventro-nasal retina.
The stacks were then first corrected for warping of the IPL using custom-written scripts in
IGOR Pro. In brief, a raster of markers (7 x 7) was projected in the x-y plane of the stack and
for each marker the z positions of the On ChAT band was manually determined. The point
raster was used to calculate a smoothed surface, which provided a z offset correction for
each pixel beam in the stack. For each corrected stack, the z profiles of tdTomato and
SR101 labelling were extracted by manually drawing ROIs in regions where only blood
vessel plexi or the ChAT bands were visible. The two profiles were then matched such that 0
corresponded to the inner vessel peak and 1 corresponded to the outer vessel peak. We
averaged the profiles of n=9 stacks from 3 mice and determined the IPL depth of On and Off
ChAT band to be 0.48 ± 0.011 and 0.77 ± 0.014 (mean ± s.d.), respectively. The s.d.
corresponds to an error of 0.45 and 0.63 µm for On and Off ChAT band, respectively. In the
following, recording depths relative to blood vessel plexi were transformed into IPL depths
relative to ChAT bands for all scan fields (Fig. 1c), with 0 corresponding to the On ChAT
band and 1 corresponding to the Off ChAT band.
Data analysis
Data analysis was performed using Matlab 2015a (The Mathworks Inc., Ismaning,
Germany), and IGOR Pro. Data were organised in a custom written schema using the
DataJoint for Matlab framework (github.com/datajoint/datajoint-matlab) (Yatsenko et al.,
2015). All data as well as Matlab code including basic visualisation routines are available at
www.retinal-functomics.org.
Pre-processing
Regions-of-interest (ROIs) were defined automatically by a custom correlation-based
algorithm in IGOR Pro. For this, the activity stack in response to the dense noise stimulus
(64 x 16 x 10,000 pixels) was first de-trended by high-pass filtering the trace of each
individual pixel above ~0.1 Hz. For the 100 best responding pixels in each recording field
(highest s.d. over time), the trace of each pixel was correlated with the trace of every other
pixel in the field. Then, the correlation coefficient (ρ) was plotted against the distance of the
two pixels and the average across ROIs was computed (SFig. 1a1). A scan field-specific
correlation threshold (ρThreshold) was determined by fitting an exponential between the
smallest distance and 5 µm (SFig. 1a1). ρThreshold was defined as the correlation coefficient at
x = λ, where λ is the exponential decay constant (space constant; SFig. 1a2). Next, we
grouped neighbouring pixels with ρ > ρThreshold into one ROI (SFig. 1b). To match ROI sizes
with the size of BC axon terminals, we restricted ROI diameters (estimated as effective
diameter of area-equivalent circle) to range between 0.75 and 4 µm (SFig. 1a2,d). For
validation, the number of ROIs covering single axon terminals was quantified manually for
n=31 terminals from n=5 GCaMP6-expressing BCs (SFig. 1d, 2a).
The glutamate (or calcium) traces for each ROI were extracted (as F/F) using the image
analysis toolbox SARFIA for IGOR Pro (Dorostkar et al., 2010). A stimulus time marker
embedded in the recorded data served to align the traces relative to the visual stimulus with
2 ms precision. For this, the timing for each ROI was corrected for sub-frame time-offsets
.CC-BY-NC-ND 4.0 International licenseIt is made available under a (which was not peer-reviewed) is the author/funder, who has granted bioRxiv a license to display the preprint in perpetuity.
The copyright holder for this preprint. http://dx.doi.org/10.1101/040642doi: bioRxiv preprint first posted online Mar. 22, 2016;

17
related to the scanning. Stimulus-aligned traces for each ROI were imported into Matlab for
further analysis.
For the chirp and step stimuli, we then subtracted the baseline (median of first 20-64
samples), computed the median activity 𝑟(𝑡) across stimulus repetitions (5 repetitions for
chirp, 40-50 repetitions for step) and normalised it such that maxt(|r(t)|) = 1.
Receptive field mapping
We mapped the linear RFs of the neurons by computing the glutamate/calcium transient-
triggered average. To this end, we resampled the temporal derivative of the
glutamate/calcium response �̇�(𝑡) at 10-times the stimulus frequency and used Matlab’s
findpeaks function to detect the times 𝑡𝑖 at which transients occurred. We set the minimum
peak height to 1 s.d., where the s.d. was robustly estimated using:
�̅� =𝑚𝑒𝑑𝑖𝑎𝑛(|�̇�(𝑡)|)
0.6745.
We then computed the glutamate/calcium transient-triggered average stimulus, weighting
each sample by the steepness of the transient:
𝑭(𝑥, 𝑦, 𝜏) =1
𝑀∑ �̇�(𝑡𝑖)𝑺(𝑥, 𝑦, 𝑡𝑖 + 𝜏)
𝑀
𝑖=1
Here, 𝑺(𝑥, 𝑦, 𝑡) is the stimulus, 𝜏 is the time lag (ranging from approx. -297 to 1,267 ms) and
M is the number of glutamate/calcium events. We smoothed this raw RF estimate using a
3x3 pixel Gaussian window for each time lag separately. We used singular value
decomposition (SVD) to extract temporal and spatial RF kernels.
To extract the RF’s position and scale, we fitted it with a 2D Gaussian function using
Matlab’s lsqcurvefit. RF quality (RFqi) was measured as one minus the fraction of residual
variance not explained by the Gaussian fit �̅�𝑚𝑎𝑝,
𝑄𝑖RF = 1 −𝑉𝑎𝑟[𝐹𝑚𝑎𝑝−�̅�𝑚𝑎𝑝]
𝑉𝑎𝑟[𝐹𝑚𝑎𝑝].
Other response measures
Response quality index – To measure how well a cell responded to a stimulus (local and full-
field chirp, flashes), we computed the signal-to-noise ratio
𝑄𝑖 =𝑉𝑎𝑟[⟨𝑪⟩𝑟]𝑡
⟨𝑉𝑎𝑟[𝑪]𝑡⟩𝑟,
where C is the T by R response matrix (time samples by stimulus repetitions) and ⟨ ⟩𝑥 and
𝑉𝑎𝑟[ ]𝑥 denote the mean and variance across the indicated dimension, respectively (Baden
et al., 2016).
For further analysis, we used only cells that responded well to the local chirp stimulus
(𝑄𝑖𝐿𝑐ℎ𝑖𝑟𝑝 > 0.3) and resulted in good RFs (𝑄𝑖𝑅𝐹 > 0.2).
Polarity index– To distinguish between On and Off BCs, we calculated the Polarity index
(POi) from the step response to local and full-field chirp, respectively, as
.CC-BY-NC-ND 4.0 International licenseIt is made available under a (which was not peer-reviewed) is the author/funder, who has granted bioRxiv a license to display the preprint in perpetuity.
The copyright holder for this preprint. http://dx.doi.org/10.1101/040642doi: bioRxiv preprint first posted online Mar. 22, 2016;

18
𝑃𝑂𝑖 =∑ 𝑟(𝑡+𝑡𝑠𝑡𝑖𝑚 𝑜𝑛)b
t=0 − ∑ 𝑟(𝑡+𝑡𝑠𝑡𝑖𝑚 𝑜𝑓𝑓)bt=0
∑ 𝑟(𝑡+𝑡𝑠𝑡𝑖𝑚 𝑜𝑛)bt=0 + ∑ 𝑟(𝑡+𝑡𝑠𝑡𝑖𝑚 𝑜𝑓𝑓)b
t=0
,
where b = 2 s (62 samples). For cells responding solely during the On-phase of a step of
light POi = 1, while for cells only responding during the step´s Off-phase POi = -1.
Opposite polarity index – The number of opposite polarity events (OPi) was estimated from
individual trials of local and full-field chirp step responses (first 6 seconds) using IGOR Pro’s
FindPeak function. Specifically, we counted the number of events that occurred during the
first 2 seconds following the step onset and offset for Off and On BCs, respectively. For each
trial the total number of events was divided by the number of stimulus trials. If OPi = 1, there
was on average one opposite polarity event per trial.
High frequency index – The high frequency index (HFi) was used to quantify spiking (cf.
(Baden et al., 2012)) and was calculated from responses to individual trials of the local and
full-field chirp, respectively. For the first 6 seconds of each trial, the frequency spectrum was
calculated by fast Fourier transform (FFT) and spectra were averaged across trials for
individual ROIs. Then, HFi = log(F1/F2), where F1 and F2 are the mean power between 0.5-1
Hz and 2-16 Hz, respectively.
Response transience index – The step response (first 6 seconds) of local and full-field chirps
was used to calculate the response transience (RTi). Traces were up-sampled to 500 Hz and
the response transience was calculated as
RTi = 1 −𝑟(tmax+𝑎)
𝑟(tmax),
where α = 400 ms is the read-out time following the peak response tmax. For a transient cell
with complete decay back to baseline RTi =1, whereas for a sustained cell with no decay RTi
=0.
Response plateau index – Local and full-field chirp responses were up-sampled to 500 Hz
and the plateau index (RPi) was determined as:
RPi = 1 −𝑟(tmax+𝑎)
𝑟(tmax),
with the read-out time α = 2 s. A cell showing a sustained plateau has an RPi =1, while for a
transient cell RPi =0.
Response delay – The response delay (tdelay) was defined as the time from stimulus
onset/offset until response onset and was calculated from the up-sampled local chirp step
response. Response onset (tonset) and delay (tdelay) were defined as
𝑡onset = min[𝑡|𝑟(𝑡) > 4𝜎𝑏𝑎𝑠𝑒𝑙𝑖𝑛𝑒],
and
𝑡𝑑𝑒𝑙𝑎𝑦 = 𝑡𝑜𝑛𝑠𝑒𝑡 − 𝑡𝑠𝑡𝑖𝑚 𝑜𝑛/𝑜𝑓𝑓
respectively.
Feature extraction
We used sparse principal component analysis, as implemented in the SpaSM toolbox by
(Sjöstrand and Clemmensen, 2012), to extract sparse response features from the mean
responses across trials to the local (12 features) and full-field chirp (6 features), and the step
.CC-BY-NC-ND 4.0 International licenseIt is made available under a (which was not peer-reviewed) is the author/funder, who has granted bioRxiv a license to display the preprint in perpetuity.
The copyright holder for this preprint. http://dx.doi.org/10.1101/040642doi: bioRxiv preprint first posted online Mar. 22, 2016;

19
stimulus (6 features) (as described in (Baden et al., 2016), SFig. 3a). Before clustering, we
standardised each feature separately across the population of cells.
Anatomy-guided clustering
BC-terminal volume profiles were obtained from EM-reconstructions of the inner retina
(Greene et al., n.d.; Kim et al., 2014) To isolate synaptic terminals, we removed those parts
of the volume profiles which likely correspond to axons. We estimated the median axon
density for each type from the upper 0.06 units of IPL and subtracted twice that estimate
from the profiles, clipping at zero. Profiles were smoothed with a Gaussian kernel (s.d.=0.14
units IPL depth) to account for jitter in depth measurements of two-photon data.
We used a modified Mixture of Gaussian model (Szczurek et al., 2010) to incorporate the
prior knowledge from the anatomical BC profiles. For each ROI i with IPL depth 𝑑𝑖, we define
a prior over anatomical types c as
𝑝𝑖(𝑐) =𝐼𝑃𝐿(𝑑𝑖, 𝑐)
∑ 𝐼𝑃𝐿(𝑑𝑖 , 𝑘)𝑘
where 𝐼𝑃𝐿(𝑑, 𝑐) is the IPL terminal density profile as a function of depth and anatomical cell
type. The parameters of the Mixture of Gaussian model are estimated as usual, with the
exception of estimating the posterior over clusters. Here, the mixing coefficients are replaced
by the prior over anatomical types, resulting in a modified update formula for the posterior:
𝛾𝑖(𝑐) =𝑝𝑖(𝑐)𝑁(𝑥𝑖|𝜇𝑐 , Σ𝑐)
∑ 𝑝𝑖(𝑗)𝑁(𝑥𝑖|𝜇𝑗 , Σ𝑗)𝑗=1…𝐾
All other updates remain the same as for the standard Mixture of Gaussians algorithm
(Bishop, 2006). We constrained the covariance matrix for each component to be diagonal,
resulting in 48 parameters per component (24 for the mean, 24 for the variances). We further
regularised the covariance matrix by adding a constant (10−5) to the diagonal.
For each pair of clusters, we computed the direction in feature space that optimally
separated the clusters
𝑤 = 𝛴−1(𝑚1 − 𝑚2)
where 𝑚𝑖 are the cluster means in feature space and 𝛴 is the pooled covariance matrix. We
projected all data on this axis and standardised the projected data according to cluster 1 (i.e.
subtract the projected mean of cluster 1 and divide by its s.d.). We compute d’ as a measure
of the separation between the clusters:
𝑑′ = 𝑚2̅̅ ̅̅ − 𝑚1̅̅ ̅̅
where 𝑚𝑖̅̅̅̅ are the means of the two clusters in the projected, normalised space.
Further statistical analysis
Field entropy – Field entropy (SField) was used as a measure of cluster heterogeneity within
single recording fields and was defined as
𝑆Field = − ∑ 𝑝i𝑖 ∗ 𝑙𝑜𝑔2
𝑝i ,
where i is the number of clusters in one recording field and pi corresponds to the number of
ROIs assigned to the ith cluster. SField = 0 if all ROIs of one recording field are assigned to
.CC-BY-NC-ND 4.0 International licenseIt is made available under a (which was not peer-reviewed) is the author/funder, who has granted bioRxiv a license to display the preprint in perpetuity.
The copyright holder for this preprint. http://dx.doi.org/10.1101/040642doi: bioRxiv preprint first posted online Mar. 22, 2016;

20
one cluster and SField increases if ROIs are equally distributed across multiple clusters. In
general, high field-entropy indicates high cluster heterogeneity within a single field.
Analysis of response diversity – To investigate the similarity of local and full-field chirp
responses across clusters (Fig. 3), we determined the linear correlation coefficient between
any two cluster pairs. The analysis was performed on cluster means. For every cluster,
correlation coefficients were averaged across clusters with the same and opposite response
polarity, respectively. We used principal component analysis (using Matlab’s pca function) to
obtain a 2D embedding of the mean cluster responses. The PCA was computed on all 14
local and 14 full-field cluster means. If not stated otherwise, the non-parametric Wilcoxon
signed-rank test was used for statistical testing (Fig. 3-5, SFig. 2-5).
Pharmacology – To analyse drug-induced effects on BC clusters (Fig. 4, SFig. 4), response
traces and RFs of ROIs in one recording field belonging to the same cluster were averaged if
there were at least 5 ROIs assigned to this cluster. Spatial RFs were aligned relative to the
pixel with the highest s.d. before averaging.
Centre-surround properties – Ring maps of individual ROIs were aligned relative to its peak
centre activation and averaged across ROIs assigned to one cluster. For isolating BC
surround, centre rings (first 2 rings) were cut and the surround time and space components
were extracted by singular value decomposition (SVD). The surround space component was
then extrapolated across the centre by fitting a Gaussian and an extrapolated surround map
was generated. To isolate the BC centre, the estimated surround map was subtracted from
the average map and centre time and space components were extracted by SVD. Estimated
centre and surround maps were summed to obtain a complete description of the centre-
surround structure of BC RFs. Across clusters, the estimated centre-surround maps
captured 93.7 ± 1.4% of the variance of the original map.
The 1-dimensional gauss fits of centre and surround space activation were used to calculate
centre and surround ratios (CSRs) for various stimulus sizes. Specifically, the CSR was
defined as
𝐶𝑆𝑅 = ∑ 𝐹𝑖𝑡Centre(𝑥)𝑑𝑥𝑥=𝑆r
𝑥=−𝑆r
∑ 𝐹𝑖𝑡Surround(𝑥)𝑑𝑥𝑥=𝑆r
𝑥=−𝑆r
,
where Sr corresponds to the stimulus radius and ranged from 10 to 500 µm. Time kernels for
different stimulus sizes were generated by linearly mixing centre and surround time kernels,
weighted by the respective CSR.
BC spectra – Temporal spectra of BC clusters were calculated by Fourier transform of the
time kernels estimated for a local (100 µm in diameter) and full-field (500 µm in diameter)
light stimulus (see Centre-surround properties). Due to a lower S/N ratio of time kernels
estimated for the full-field stimulus, kernels were cut 100 ms before and at the time point of
response, respectively, still capturing 86.7 ± 14.7% of the variance of the original kernel. The
centre of mass (Centroid) was used to characterise spectra of different stimulus sizes and
was determined as
𝐶𝑒𝑛𝑡𝑟𝑜𝑖𝑑 = ∑ 𝑓(𝑛)𝑥(𝑛)𝑁−1
𝑛=0
∑ 𝑥(𝑛)𝑁−1𝑛=0
,
where x(n) corresponds to the magnitude and f(n) represents the centre frequency of the nth
bin.
.CC-BY-NC-ND 4.0 International licenseIt is made available under a (which was not peer-reviewed) is the author/funder, who has granted bioRxiv a license to display the preprint in perpetuity.
The copyright holder for this preprint. http://dx.doi.org/10.1101/040642doi: bioRxiv preprint first posted online Mar. 22, 2016;

21
Surround chirp and spot noise data – To investigate the effect of surround-only activation
and stimulus size on temporal encoding properties across BC clusters, response traces and
estimated kernels of ROIs in one recording field belonging to the same cluster were
averaged if there were at least 5 ROIs assigned to this cluster. Spectra for kernels estimated
from local and full-field spot noise stimuli were calculated as described above.
Time kernel correlation – To analyse the similarity of temporal kernels estimated for a
specific stimulus size (Fig. 5l,m), we computed the linear correlation coefficient of each
kernel pair from clusters of the same response polarity. We then calculated the average
correlation coefficient for every cluster (Fig. 5l) and further across all cluster averages (Fig.
5m).
.CC-BY-NC-ND 4.0 International licenseIt is made available under a (which was not peer-reviewed) is the author/funder, who has granted bioRxiv a license to display the preprint in perpetuity.
The copyright holder for this preprint. http://dx.doi.org/10.1101/040642doi: bioRxiv preprint first posted online Mar. 22, 2016;
22
REFERENCES
Asari H, Meister M (2012) Divergence of visual channels in the inner retina. Nat Neurosci 15:1581–1589.
Asari H, Meister M (2014) The projective field of retinal bipolar cells and its modulation by visual context. Neuron 81:641–652.
Atick JJ, Redlich AN (1990) Towards a theory of early visual processing. Neural Comput 320:1–13.
Atick JJ, Redlich AN (1993) Convergent Algorithm for Sensory Receptive Field Development. Neural Comput 5:45–60.
Awatramani GB, Slaughter MM (2000) Origin of transient and sustained responses in ganglion cells of the retina. J Neurosci 20:7087–7095.
Baden T, Berens P, Bethge M, Euler T (2012) Spikes in Mammalian Bipolar Cells Support Temporal Layering of the Inner Retina. Curr Biol 23:1–5.
Baden T, Berens P, Franke K, Román Rosón M, Bethge M, Euler T (2016) The functional diversity of retinal ganglion cells in the mouse. Nature 529:345–350.
Baden T, Euler T (2013) Early vision: Where (Some of) the magic happens. Curr Biol 23:R1096–R1098.
Baden T, Nikolaev A, Esposti F, Dreosti E, Odermatt B, Lagnado L (2014) A Synaptic Mechanism for Temporal Filtering of Visual Signals. PLoS Biol 12:e1001972.
Baden T, Schubert T, Chang L, Wei T, Zaichuk M, Wissinger B, Euler T (2013) A tale of two retinal domains: Near-Optimal sampling of achromatic contrasts in natural scenes through asymmetric photoreceptor distribution. Neuron 80:1206–1217.
Barlow H (1961) Possible principles underlying the transformations of sensory messages. Sens Commun 6:57–58.
Bishop CM (2006) Pattern Recognition and Machine Learning.
Bloomfield SA, Dacheux RF (2001) Rod vision: pathways and processing in the mammalian retina. Prog Retin Eye Res 20:351–384.
Borghuis BG, Looger LL, Tomita S, Demb JB (2014) Kainate Receptors Mediate Signaling in Both Transient and Sustained OFF Bipolar Cell Pathways in Mouse Retina. J Neurosci 34:6128–6139.
Borghuis BG, Marvin JS, Looger LL, Demb JB (2013) Two-photon imaging of nonlinear glutamate release dynamics at bipolar cell synapses in the mouse retina. J Neurosci 33:10972–10985.
Breuninger T, Puller C, Haverkamp S, Euler T (2011) Chromatic Bipolar Cell Pathways in the Mouse Retina. J Neurosci 31:6504–6517.
Buldyrev I, Taylor WR (2013) Inhibitory mechanisms that generate centre and surround properties in ON and OFF brisk-sustained ganglion cells in the rabbit retina. J Physiol 591:303–325.
Burrone J, Lagnado L (2000) Synaptic Depression and the Kinetics of Exocytosis in Retinal Bipolar Cells. J Neurosci 20:568–578.
.CC-BY-NC-ND 4.0 International licenseIt is made available under a (which was not peer-reviewed) is the author/funder, who has granted bioRxiv a license to display the preprint in perpetuity.
The copyright holder for this preprint. http://dx.doi.org/10.1101/040642doi: bioRxiv preprint first posted online Mar. 22, 2016;

23
Chavez AE, Diamond JS (2008) Diverse Mechanisms Underlie Glycinergic Feedback Transmission onto Rod Bipolar Cells in Rat Retina. J Neurosci 28:7919–7928.
Chen M, Lee S, Park SJH, Looger LL, Zhou ZJ (2014a) Receptive field properties of bipolar cell axon terminals in direction-selective sublaminas of the mouse retina. J Neurophysiol 112:1950–1962.
Chen M, Lee S, Park SJH, Looger LL, Zhou ZJ (2014b) Receptive field properties of bipolar cell axon terminals in the direction-selective sublaminas of the mouse retina. J Neurophysiol 112:1950–1962.
Chen T-W, Wardill TJ, Sun Y, Pulver SR, Renninger SL, Baohan A, Schreiter ER, Kerr RA, Orger MB, Jayaraman V, Looger LL, Svoboda K, Kim DS (2013) Ultrasensitive fluorescent proteins for imaging neuronal activity. Nature 499:295–300.
Cho S, von Gersdorff H (2012) Ca2+ influx and neurotransmitter release at ribbon synapses. Cell Calcium 52:208–216.
Cook PB, McReynolds JS (1998) Lateral inhibition in the inner retina is important for spatial tuning of ganglion cells. Nat Neurosci 1:714–719.
Dacey D, Packer OS, Diller L, Brainard D, Peterson B, Lee B (2000) Center surround receptive field structure of cone bipolar cells in primate retina. Vis Res 40:1801–1811.
Dacheux RF, Raviola E (1986) The rod pathway in the rabbit retina: a depolarizing bipolar and amacrine cell. J Neurosci 6:331–345.
Demb JB, Singer JH (2012) Intrinsic properties and functional circuitry of the AII amacrine cell. Vis Neurosci 29:51–60.
Denève S, Machens CK (2016) Efficient codes and balanced networks. 19:375–382.
DeVries SH (2000) Bipolar cells use kainate and AMPA receptors to filter visual information into separate channels. Neuron 28:847–856.
DeVries SH, Li W, Saszik S (2006) Parallel Processing in Two Transmitter Microenvironments at the Cone Photoreceptor Synapse. Neuron 50:735–748.
Dorostkar MM, Dreosti E, Odermatt B, Lagnado L (2010) Computational processing of optical measurements of neuronal and synaptic activity in networks. J Neurosci Methods 188:141–150.
Dreosti E, Esposti F, Baden T, Lagnado L (2011) In vivo evidence that retinal bipolar cells generate spikes modulated by light. Nat Neurosci 14:951–952.
Dreosti E, Odermatt B, Dorostkar MM, Lagnado L (2009) A genetically encoded reporter of synaptic activity in vivo. Nat Methods 6:883–889.
Dumitrescu ON, Pucci FG, Wong KY, Berson DM (2009) Ectopic retinal ON bipolar cell synapses in the OFF inner plexiform layer: Contacts with dopaminergic amacrine cells and melanopsin ganglion cells. J Comp Neurol 517:226–244.
Eggers ED, Lukasiewicz PD (2006) GABA(A), GABA(C) and glycine receptor-mediated inhibition differentially affects light-evoked signalling from mouse retinal rod bipolar cells. J Physiol 572:215–225.
Eggers ED, Lukasiewicz PD (2011) Multiple pathways of inhibition shape bipolar cell responses in the retina. Vis Neurosci 28:95–108.
.CC-BY-NC-ND 4.0 International licenseIt is made available under a (which was not peer-reviewed) is the author/funder, who has granted bioRxiv a license to display the preprint in perpetuity.
The copyright holder for this preprint. http://dx.doi.org/10.1101/040642doi: bioRxiv preprint first posted online Mar. 22, 2016;

24
Eggers ED, Lukasiewicz PD, Eggers ED, Lukasiewicz PD (2010) Interneuron Circuits Tune Inhibition in Retinal Bipolar Cells Interneuron Circuits Tune Inhibition in Retinal Bipolar Cells. :25–37.
Euler T, Hausselt SE, Margolis DJ, Breuninger T, Castell X, Detwiler PB, Denk W (2009) Eyecup scope-optical recordings of light stimulus-evoked fluorescence signals in the retina. Pflugers Arch Eur J Physiol 457:1393–1414.
Euler T, Haverkamp S, Schubert T, Baden T (2014) Retinal bipolar cells: elementary building blocks of vision. Nat Rev Neurosci 15:507–519.
Euler T, Masland RH (2000) Light-evoked responses of bipolar cells in a mammalian retina. J Neurophysiol 83:1817–1829.
Euler T, Schneider H, Wassle H (1996) Glutamate responses of bipolar cells in a slice preparation of the rat retina. J Neurosci 16:2934–2944.
Euler T, Wässle H (1998) Different contributions of GABAA and GABAC receptors to rod and cone bipolar cells in a rat retinal slice preparation. J Neurophysiol 79:1384–1395.
Famiglietti E V., Tumosa N (1987) Immunocytochemical staining of cholinergic amacrine cells in rabbit retina. Brain Res 413:398–403.
Ghosh KK, Bujan S, Haverkamp S, Feigenspan A, Wässle H (2004) Types of bipolar cells in the mouse retina. J Comp Neurol 469:70–82.
Greene MJ, Kim JS, Briggman KL, Seung HS (n.d.) Analogous convergence of sustained and transient inputs in parallel On and Off pathways for retinal motion computation.
Greene MJ, Kim JS, Seung HS (2016) Analogous Convergence of Sustained and Transient Inputs in Parallel On and Off Pathways for Retinal Motion Computation. Cell Rep:1–9.
Grimes WN, Li W, Chavez AE, Diamond JS (2009) BK channels modulate pre- and postsynaptic signaling at reciprocal synapses in retina. Nat Neurosci 12:585–592.
Helmstaedter M, Briggman KL, Turaga SC, Jain V, Seung HS, Denk W (2013) Connectomic reconstruction of the inner plexiform layer in the mouse retina. Nature 500:168–174.
Ichinose T, Lukasiewicz PD (2005) Inner and outer retinal pathways both contribute to surround inhibition of salamander ganglion cells. J Physiol 565:517–535.
Ivanova E, Muller U, Wassle H (2006) Characterization of the glycinergic input to bipolar cells of the mouse retina. Eur J Neurosci 23:350–364.
Keeley PW, Reese BE (2010) Role of afferents in the differentiation of bipolar cells in the mouse retina. J Neurosci 30:1677–1685.
Kemmler R, Schultz K, Dedek K, Euler T, Schubert T (2014) Differential regulation of cone calcium signals by different horizontal cell feedback mechanisms in the mouse retina. J Neurosci 34:11826–11843.
Kim H-L, Jeon JH, Koo T-H, Lee U-Y, Jeong E, Chun M-H, Moon J-I, Massey SC, Kim I-B (2012) Axonal synapses utilize multiple synaptic ribbons in the mammalian retina. PLoS One 7:e52295.
Kim JS, Greene MJ, Zlateski A, Lee K, Richardson M, Turaga SC, Purcaro M, Balkam M, Robinson A, Behabadi BF, Campos M, Denk W, Seung HS (2014) Space-time wiring specificity supports direction selectivity in the retina. Nature 509:331–336.
.CC-BY-NC-ND 4.0 International licenseIt is made available under a (which was not peer-reviewed) is the author/funder, who has granted bioRxiv a license to display the preprint in perpetuity.
The copyright holder for this preprint. http://dx.doi.org/10.1101/040642doi: bioRxiv preprint first posted online Mar. 22, 2016;

25
Lee S, Chen L, Chen M, Ye M, Seal RP, Zhou ZJ (2014) An Unconventional Glutamatergic Circuit in the Retina Formed by vGluT3 Amacrine Cells. Neuron 84:708–715.
Lee S, Chen M, Zhang Y, Chen L, Zhou ZJ (2015) Synaptic properties of vGluT3 amacrine cells in the mouse retina. Investig Ophthalmol Vis Sci 56.
Li W, DeVries SH (2006) Bipolar cell pathways for color and luminance vision in a dichromatic mammalian retina. Nat Neurosci 9:669–675.
Lindstrom SH, Ryan DG, Shi J, Devries SH (2014) Kainate receptor subunit diversity underlying response diversity in retinal Off bipolar cells. J Physiol 00:1–21.
Lukasiewicz PD, Werblin FS (1994) A novel GABA receptor modulates synaptic transmission from bipolar to ganglion and amacrine cells in the tiger salamander retina. J Neurosci 14:1213–1223.
Majumdar S, Weiss J, Wässle H (2009) Glycinergic input of widefield, displaced amacrine cells of the mouse retina. J Physiol 587:3831–3849.
Marc RE, Jones BW (2002) Molecular phenotyping of retinal ganglion cells. J Neurosci 22:413–427.
Marvin JS, Borghuis BG, Tian L, Cichon J, Harnett MT, Akerboom J, Gordus A, Renninger SL, Chen T-W, Bargmann CI, Orger MB, Schreiter ER, Demb JB, Gan W-B, Hires SA, Looger LL (2013) An optimized fluorescent probe for visualizing glutamate neurotransmission. Nat Methods 10:162–170.
Masland RH (2012a) The Neuronal Organization of the Retina. Neuron 76:266–280.
Masland RH (2012b) The tasks of amacrine cells. Vis Neurosci 29:3–9.
Menger N, Pow D V, Wässle H (1998) Glycinergic amacrine cells of the rat retina. J Comp Neurol 401:34–46.
Mitra P, Miller RF (2007a) Mechanism underlying rebound excitation in retinal ganglion cells. Vis Neurosci 24:709–731.
Mitra P, Miller RF (2007b) Normal and rebound impulse firing in retinal ganglion cells. Vis Neurosci 24:79–90.
Nelson R, Kolb H (1983) Synaptic patterns and response properties of bipolar and ganglion cells in the cat retina. Vision Res 23:1183–1195.
Nikolaev A, Leung K-M, Odermatt B, Lagnado L (2013) Synaptic mechanisms of adaptation and sensitization in the retina. Nat Neurosci 16:934–941.
Odermatt B, Nikolaev A, Lagnado L (2012) Encoding of Luminance and Contrast by Linear and Nonlinear Synapses in the Retina. Neuron 73:758–773.
Oesch N, Euler T, Taylor WR (2005) Direction-selective dendritic action potentials in rabbit retina. Neuron 47:739–750.
Oesch NW, Diamond JS (2011) Supplement : Ribbon synapses compute temporal contrast and encode luminance in retinal rod bipolar cells. Nat Neurosci 14:1555–1561.
Oltedal L, Morkve SH, Veruki ML, Hartveit E (2006) Patch-clamp investigations and compartmental modeling of rod bipolar axon terminals in an in vitro thin-slice preparation of the mammalian retina. J Neurophysiol 97:1171–1187.
.CC-BY-NC-ND 4.0 International licenseIt is made available under a (which was not peer-reviewed) is the author/funder, who has granted bioRxiv a license to display the preprint in perpetuity.
The copyright holder for this preprint. http://dx.doi.org/10.1101/040642doi: bioRxiv preprint first posted online Mar. 22, 2016;

26
Pan ZH, Lipton S a (1995) Multiple GABA receptor subtypes mediate inhibition of calcium influx at rat retinal bipolar cell terminals. J Neurosci 15:2668–2679.
Pang J-J, Gao F, Lem J, Bramblett DE, Paul DL, Wu SM (2010) Direct rod input to cone BCs and direct cone input to rod BCs challenge the traditional view of mammalian BC circuitry. Proc Natl Acad Sci 107:395–400.
Peichl L, González-Soriano J (1994) Morphological types of horizontal cell in rodent retinae: a comparison of rat, mouse, gerbil, and guinea pig. Vis Neurosci 11:501–517.
Pitkow X, Meister M (2012) Decorrelation and efficient coding by retinal ganglion cells. Nat Neurosci 15:628–635.
Pourcho R, Goebel D (1983) Neuronal subpopulations in cat retina which accumulate the GABA agonist, (3H)muscimol: a combined Golgi and autoradiographic study. J Comp Neurol 219:25–35.
Puller C, Ivanova E, Euler T, Haverkamp S, Schubert T (2013) OFF bipolar cells express distinct types of dendritic glutamate receptors in the mouse retina. Neuroscience 243:136–148.
Purgert RJ, Lukasiewicz PD (2015) Differential Encoding of Spatial Information among Retinal ON Cone Bipolar Cells. J Neurophysiol:jn.00287.2015.
Puthussery T, Percival K a, Venkataramani S, Gayet-Primo J, Grünert U, Taylor WR (2014) Kainate receptors mediate synaptic input to transient and sustained OFF visual pathways in primate retina. J Neurosci 34:7611–7621.
Puthussery T, Venkataramani S, Gayet-Primo J, Smith RG, Taylor WR (2013) NaV1.1 Channels in Axon Initial Segments of Bipolar Cells Augment Input to Magnocellular Visual Pathways in the Primate Retina. J Neurosci 33:16045–16059.
Roska B, Molnar A, Werblin FS (2006) Parallel processing in retinal ganglion cells: how integration of space-time patterns of excitation and inhibition form the spiking output. J Neurophysiol 95:3810–3822.
Roska B, Nemeth E, Orzo L, Werblin FS (2000) Three levels of lateral inhibition: A space-time study of the retina of the tiger salamander. J Neurosci 20:1941–1951.
Roska B, Nemeth E, Werblin FS (1998) Response to Change Is Facilitated by a Three-Neuron Disinhibitory Pathway in the Tiger Salamander Retina. J Neurosci 18:3451–3459.
Roska B, Werblin FS (2001) Vertical interactions across ten parallel, stacked representations in the mammalian retina. Nature 410:583–587.
Sanes JR, Masland RH (2015) The Types of Retinal Ganglion Cells: Current Status and Implications for Neuronal Classification. Annu Rev Neurosci.
Saszik S, DeVries SH (2012) A Mammalian Retinal Bipolar Cell Uses Both Graded Changes in Membrane Voltage and All-or-Nothing Na+ Spikes to Encode Light. J Neurosci 32:297–307.
Schubert T, Kerschensteiner D, Eggers ED, Misgeld T, Kerschensteiner M, Lichtman JW, Lukasiewicz PD, Wong RO (2008) Development of presynaptic inhibition onto retinal bipolar cell axon terminals is subclass-specific. J Neurophysiol 100:304–316.
Schwartz GW, Okawa H, Dunn FA, Morgan JL, Kerschensteiner D, Wong RO, Rieke F
.CC-BY-NC-ND 4.0 International licenseIt is made available under a (which was not peer-reviewed) is the author/funder, who has granted bioRxiv a license to display the preprint in perpetuity.
The copyright holder for this preprint. http://dx.doi.org/10.1101/040642doi: bioRxiv preprint first posted online Mar. 22, 2016;

27
(2012) The spatial structure of a nonlinear receptive field. Nat Neurosci 15:1572–1580.
Serbe E, Meier M, Leonhardt A, Borst A (2016) Comprehensive Characterization of the Major Presynaptic Elements to the Drosophila OFF Motion Detector. Neuron:1–13.
Sjöstrand K, Clemmensen L (2012) Spasm: A matlab toolbox for sparse statistical modeling. J Stat … VV.
Strettoi E, Dacheux RF, Raviola ELI (1990) Synaptic Connections of Rod Bipolar Cells i n the Inner Plexiform Layer of the Rabbit. 466:449–466.
Sun D, Rait JL, Kalloniatis M (2003) Inner retinal neurons display differential responses to N-methyl-D-aspartate receptor activation. J Comp Neurol 465:38–56.
Szczurek E, Biecek P, Tiuryn J, Vingron M (2010) Introducing knowledge into differential expression analysis. J Comput Biol 17:953–967.
Taylor WR (1999) TTX attenuates surround inhibition in rabbit retinal ganglion cells. Vis Neurosci 16:285–290.
Tikidji-Hamburyan A, Reinhard K, Seitter H, Hovhannisyan A, Procyk CA, Allen AE, Schenk M, Lucas RJ, Münch TA (2014) Retinal output changes qualitatively with every change in ambient illuminance. Nat Neurosci 18:66–74.
Venkataramani S, Taylor XWR (2016) Synaptic Mechanisms Generating Orientation Selectivity in the ON Pathway of the Rabbit Retina. 36:3336–3349.
Vinje WE, Vinje WE, Gallant JL (2007) Sparse Coding and Decorrelation in Primary Visual Cortex During Natural Vision. 1273:1273–1276.
Wässle H (2004) Parallel processing in the mammalian retina. Nat Rev Neurosci 5:747–757.
Wässle H, Heinze L, Ivanova E, Majumdar S, Weiss J, Harvey RJ, Haverkamp S (2009a) Glycinergic transmission in the Mammalian retina. Front Mol Neurosci 2:6.
Wässle H, Puller C, Muller F, Haverkamp S (2009b) Cone Contacts, Mosaics, and Territories of Bipolar Cells in the Mouse Retina. J Neurosci 29:106–117.
Werblin FS, Dowling JE (1969) Organization of the retina of the mudpuppy, Neturus maculosis. II. Intracellular recording. J Neurophysiol 32:339–355.
Wiechert MT, Judkewitz B, Riecke H, Friedrich RW (2010) Mechanisms of pattern decorrelation by recurrent neuronal circuits. Nat Neurosci 13:1003–1010.
Yatsenko D, Reimer J, Ecker AS, Walker EY, Sinz F, Berens P, Hoenselaar A, Cotton RJ, Siapas AS, Tolias AS (2015) DataJoint : managing big scientific data using MATLAB or Python. :1–10.
Yonehara K, Farrow K, Ghanem A, Hillier D, Balint K, Teixeira M, Jüttner J, Noda M, Neve RL, Conzelmann K-K, Roska B (2013) The First Stage of Cardinal Direction Selectivity Is Localized to the Dendrites of Retinal Ganglion Cells. Neuron 79:1078–1085.
Zhang J, Jung CS, Slaughter MM (1997) Serial inhibitory synapses in retina. Vis Neurosci 14:553–563.
.CC-BY-NC-ND 4.0 International licenseIt is made available under a (which was not peer-reviewed) is the author/funder, who has granted bioRxiv a license to display the preprint in perpetuity.
The copyright holder for this preprint. http://dx.doi.org/10.1101/040642doi: bioRxiv preprint first posted online Mar. 22, 2016;

28
ACKNOWLEDGMENTS
We thank G. Eske for technical support, C. Behrens for help with EM data, J. Jüttner from
the B. Roska lab (FMI for Biomedical Research, Basel) for help with the virus injection
protocol and X. Pitkow and R. Taylor for feedback on the manuscript. We thank Loren L.
Looger, the Janelia Research Campus of the Howard Hughes Medical Institute and the
Genetically-Encoded Neuronal Indicator and Effector (GENIE) Project for making the viral
constructs (AAV9.hSyn.iGluSnFr.WPRE.SV40, AAV9.CAG.Flex.iGluSnFr.WPRE.SV40 and
AAV9.Syn.Flex.GCaMP6f.WPRE.SV40) publically available. This work was supported by the
Deutsche Forschungsgemeinschaft (DFG; Werner Reichardt Centre for Integrative
Neuroscience Tübingen, EXC307 to M.B., T.S. and T.E; BA 5283/1-1 to T.B; BE 5601/1-1 to
P.B.), the German Federal Ministry of Education and Research (BMBF; BCCN Tübingen
FKZ 01GQ1002 to M.B and T.E), the BW-Stiftung (AZ 1.16101.09 to T.B.), the intramural
fortüne program of the University of Tübingen (2125-0-0 to T.B.), and the National Institute of
Neurological Disorders and Stroke (U01NS090562 to T.E.) as well as the National Eye
Institute (1R01EY023766 to T.E.) of the National Institutes of Health. The content is solely
the responsibility of the authors and does not necessarily represent the official views of the
funders.
AUTHOR CONTRIBUTIONS
KF, PB, TE and TB designed the study; KF performed experiments and pre-processing; KF
performed viral injections with help from TS; PB developed the clustering framework with
input from MB; KF, PB and TB analysed the data with input from TE; KF, PB, TE and TB
wrote the manuscript.
.CC-BY-NC-ND 4.0 International licenseIt is made available under a (which was not peer-reviewed) is the author/funder, who has granted bioRxiv a license to display the preprint in perpetuity.
The copyright holder for this preprint. http://dx.doi.org/10.1101/040642doi: bioRxiv preprint first posted online Mar. 22, 2016;

29
SUPPLEMENTARY DATA LEGENDS
SVideo 1 | Glutamate responses in the IPL. Background-subtracted and colour-coded
glutamate signals recorded in the On ChAT band (64x16 pixels @31.25 Hz), where yellow
corresponds to higher activity. Responses to the noise stimulus (exemplary 30 s, single trial)
and local chirp (mean across n=5 trials) are shown. Scan field corresponds to the one shown
in (Fig. 1d). Video in real-time.
SFigure 1 | ROI detection. a, Mean correlation (± s.d. shading, n=100 pixels) between
noise-response traces of two individual pixels from scan field shown in (Fig. 1d) plotted
against the distance of each pixel-pair (a1). Dotted line shows linear fit to the data above x =
10 µm and its extrapolation towards x = 0 µm. The space constant obtained from an
exponential fit (orange) for distances >5 µm was used to determine a scan field’s specific
correlation minimum for ROI detection (a2, zoomed-in version of a1). Blue shading indicates
the range of allowed ROI radii (0.375-2 µm). b, Scan field from (Fig. 1d), with each pixel
color-coded according to its correlation with the noise trace of pixel indicated in (b1). In b2,
the red shading corresponds to pixels with a correlation coefficient > correlation minimum
from (a2), resulting in red ROI in (b3). c, As (a1), averaged for n=71 scan fields recorded at
48x12 µm. d, Histogram of ROI (black) and BC axon terminal (red) area. Terminal area was
determined from BC axonal arborisations labelled in GCaMP6-injected PCP2 mice where
individual axon terminals can be distinguished (cf. SFig. 2a). Inset shows a histogram of the
number of ROIs per BC axon terminal. e, Distribution of ROI numbers per scan field. f,
Histogram illustrating sampling of ROIs against IPL depth. Data collected specifically for
drug experiments (cf. Fig 4; Methods) contributed to the “oversampling” of the two ChAT
bands.
SFigure 2 | GCaMP6 signals in mouse BC axon terminals. a, High resolution scan of
GCaMP6f-expressing BC axon terminal systems in the IPL of a Pcp2 mouse (a1) and
corresponding scan field (a2) with automatically generated ROI mask overlaid (a3, cf. SFig.
1). b, Exemplary mean local-chirp responses (n=5 trials) of individual ROIs shown in (a3) of
the two different BCs shown in a1. c, Scan field from (a3) with ROI mask and spatial RFs (2
s.d. outlines of gauss fit) overlaid. d, Distribution of RF diameters estimated from On BC
terminal calcium (GCaMP6) and glutamate release (iGluSnFr), respectively. Black dots
correspond to mean RF diameters (56.1 ± 10 µm for GCaMP6 and 57.5 ± 10.6 µm for
iGluSnFr). p>0.05, n=261 (GCaMP6) and n=3,540, non-parametric non-paired Wilcoxon
signed-rank test. e, High resolution scan of GCaMP6-expressing RBC axon terminals (e1)
and corresponding scan field (e2), with two individual terminals indicated. f, Mean responses
of terminals shown in (e2) to full-field flashes (f1, n=20 trials) and local chirp stimulus (f2, n= 5
trials).
SFigure 3 | Clustering. a, Temporal features extracted from glutamate traces in response to
local (n=6 features, top) and full-field (n=12 features, middle) chirp and full-field flashes (n=6
features, bottom). b, Heat maps of all recorded glutamate responses (n=14 clusters plus
ROIs discarded based on signal-to-noise (S/N) ratio) to the four visual stimuli (cf. Fig. 1);
n=11,101 ROIs from 29 retinas. Each line corresponds to the responses of individual ROIs
with activity colour-coded. Block height represents the number of included ROIs per cluster.
Within one cluster, ROIs are sorted based on the quality of their RFs and local chirp
response (Methods). Overlaid stratification profiles (left) illustrate overlap for some BC types.
.CC-BY-NC-ND 4.0 International licenseIt is made available under a (which was not peer-reviewed) is the author/funder, who has granted bioRxiv a license to display the preprint in perpetuity.
The copyright holder for this preprint. http://dx.doi.org/10.1101/040642doi: bioRxiv preprint first posted online Mar. 22, 2016;

30
c, Cluster separation was determined for every cluster pair using the sensitivity index d´
(c1,2). Dotted lines in (c1) illustrate transition between On and Off clusters and dotted line in
c2 at d´=2, which corresponds to about 15% FP/FN rates. c3, Separation of exemplary
cluster pairs with a low (d´=2.0, top) and an average (d´=4.5, bottom) sensitivity index,
respectively. d,. Distribution of field entropies (left, Methods). Two exemplary scan fields
(right) with ROIs colour-coded by cluster allocation illustrate low (1) and high (2) field
entropy, respectively. e, Percentage of ROIs with at least one opposite polarity event in
response to the local chirp step response for On and Off BC cluster. Dotted line illustrates
mean incidence of spontaneous events (<1%). f, Time to peak of On events observed in the
Off layer (grey) and On responses in On layer (red). Events were estimated from responses
to single trials of the local chirp stimulus. g, Mean spectra (n=5 trials) of local chirp step
responses for two Off (left) and two On (right) ROIs shown in (Fig. 2e), with HFi estimated
from the relative power of low (0.5-1 Hz) and high (2-16 Hz) frequencies (Methods). h, Mean
response transience of BC clusters is not correlated with mean response delay. r=0.01,
p>0.05, n=14, linear correlation. i, Mean HFi and mean response delay are not correlated
across BC clusters. r=0.3, p>0.05, n=14, linear correlation.
SFigure 4 | GABA and glycinergic inhibition differentially shapes BC responses. a,
Change of mean peak amplitudes (± s.d. shading) of n=15 ROIs originating from two scan
fields during wash-in of GABA and glycine receptor blockers, respectively (cf. Fig. 4c). b,c,
Local (grey) and full-field (black) chirp responses for control and drug conditions (b: GABA
receptor block; c: glycine receptor block), with linear correlation coefficient (ρ) between each
pair indicated. d, Local (grey) and surround (black) chirp responses for an exemplary On
(C7) and Off (C3a) BC cluster, respectively.
SFigure 5 | Centre-surround RFs of BC clusters. a, Centre-surround maps obtained from
the ring noise were averaged across ROIs assigned to one cluster (1). To isolate the
surround component, the innermost two rings which contained the majority of the centre
component were clipped (2) and the surround map estimated by SVD (3) was extrapolated
across the centre by fitting a Gaussian (4). Next, the extrapolated surround map was
subtracted from the average map and the centre component was extracted using SVD (6).
The resultant centre-surround map was then subtracted from the average map to estimate
the residual variance (7, Methods). Dotted lines at t=0. b, Time to peak of centre time
kernels correlated with response delay estimated from local chirp step responses (r=0.82,
p<0.001, n=14, linear correlation), indicating that centre kernels adequately reflect BC
responses to local stimuli c, Effect of GABA (c1) and glycine (c2) receptor block on centre-
surround RFs of two exemplary BC clusters. Centre-surround maps correspond to averages
on n>5 ROIs of one scan field. d, Predicted centre-surround ratios (CSRs) of BC clusters for
different stimulus diameters (cf. Fig. 5d). e, Normalised temporal kernels predicted for local
(100 µm diameter), full-field (500 µm diameter) and surround-only (500 and 100 µm outer
and inner diameter, respectively) stimulation for Off (top) and On (bottom) BC clusters (cf.
Fig. 5e), respectively.
.CC-BY-NC-ND 4.0 International licenseIt is made available under a (which was not peer-reviewed) is the author/funder, who has granted bioRxiv a license to display the preprint in perpetuity.
The copyright holder for this preprint. http://dx.doi.org/10.1101/040642doi: bioRxiv preprint first posted online Mar. 22, 2016;

5
462
3
1
5 µm
2
3
1
5 4
6
3
1 s
Local chirp Full-field chirp Full-field flashes Noise
d e1
e2 e32 s 1 s2 s
2 s 2 s
100 µm
d
v
nt
ChATiGluSnFr
Figure 1
Inner vesselsGCL somata
Outer vessels
INL somata
ChATBlood vessels
0 IPL
dept
h
a
IPL
c1 c2
f1 f2
b iGluSnFrBlood vessels
1 mm 10 µm 10 µm
1
2
3
-1
-2
20 µm
1+2+
3
4+5+
6
d[G
lut]
.CC-BY-NC-ND 4.0 International licenseIt is made available under a (which was not peer-reviewed) is the author/funder, who has granted bioRxiv a license to display the preprint in perpetuity.
The copyright holder for this preprint. http://dx.doi.org/10.1101/040642doi: bioRxiv preprint first posted online Mar. 22, 2016;

0 1Polarityindex
-1
-1
0
1
0.8 1.20.4Transience
indexPlateauindex
0 0.4-0.4 40 60 80RF diameter
(µm)
20 60 100Delay (ms)
-1HF index
-0.4-1.60 1Opposite
polarity index
IPL
dept
h
g1 g2 g3 g4 g5 g6 g7
Figure 2
Off ChAT
On ChAT
CBC5
0
1
2
IPL
dept
h[a
.u.]
-1
21
R
76
8/9
3a3b
4 5
a2
X
d
a1
c
2 s 2 s 1 s 1 s
C1
C2
C3a
C3b
C4
CR
C9
C8
C7
C6
C5t
C5o
C5i
CX
0
0.4
0.8
CBC1 ... RBC
0
0.2
0.4
IPL depth B
CBC1 ... RBC
Prio
rpro
babi
lity
IPL depth Ab1
0
1
2
-1
CBC1 ... RBC
IPL
dept
h(a
.u.)
A
B
b2CBC2
2s
C2 C9
C3b C1 CX CR
2s
C6C3a
100 µm
e
f
.CC-BY-NC-ND 4.0 International licenseIt is made available under a (which was not peer-reviewed) is the author/funder, who has granted bioRxiv a license to display the preprint in perpetuity.
The copyright holder for this preprint. http://dx.doi.org/10.1101/040642doi: bioRxiv preprint first posted online Mar. 22, 2016;
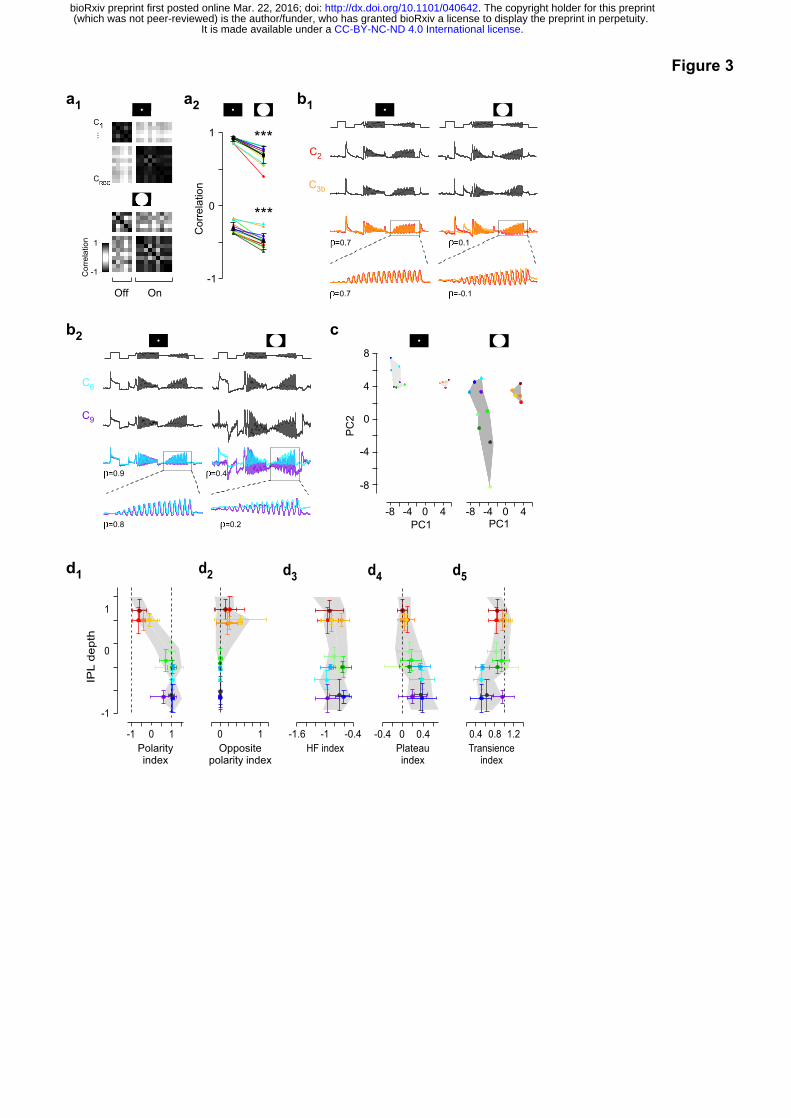
-8 -4 0 4
PC
2
PC1
-8
8
4
0
-4
-8 -4 0 4
b2
C6
C9
=0.9
=0.8
=0.4
=0.2
c
C2
C3b
=0.7
=0.7 =0.1
=-0.1
a1
Figure 3
Cor
rela
tion
-1
0
1 ***
***
-1
1
C1...
CRBC
Off On
Cor
rela
tion
b1
d3 d4 d5d2d1
Plateauindex
0 0.4-0.4 0.80.4Transience
index
1.2HF index
-0.4-1-1.60 1Opposite
polarity index
-1
0
1
IPL
dept
h
-1 10Polarityindex
a2
PC1
.CC-BY-NC-ND 4.0 International licenseIt is made available under a (which was not peer-reviewed) is the author/funder, who has granted bioRxiv a license to display the preprint in perpetuity.
The copyright holder for this preprint. http://dx.doi.org/10.1101/040642doi: bioRxiv preprint first posted online Mar. 22, 2016;

Control Drug
0
-1
1
Cor
rela
tion
0
-1
1
d1
Control
Control
+ Strychnine
e1
e2
RF
diam
eter
(µm
)
0
100
200
Control Drug
RF
diam
eter
(µm
)
0
100
200
Control Drug
f1 Control +TPMPA/Gbzf2
C4C5t
Control + Strychnine*
n.s.
+ TPMPA/Gbz
C5t
CX
2 s
*
***
Figure 4
b1
+ TPMPA/Gbz
+ Strychnine
Control
Control
0
Pea
k G/P
eak L
Control Drug
c1
c2
1
0
1
***
***
2 sb2
a1 BC small-fieldglycinergicAC
wide-fieldGABAergicAC
+ Strychnine+ TPMPA/Gbza2
=0.5 =0.8
=0.8 =-0.3
d2
80 µm
Pea
k G/P
eak L
Cor
rela
tion
.CC-BY-NC-ND 4.0 International licenseIt is made available under a (which was not peer-reviewed) is the author/funder, who has granted bioRxiv a license to display the preprint in perpetuity.
The copyright holder for this preprint. http://dx.doi.org/10.1101/040642doi: bioRxiv preprint first posted online Mar. 22, 2016;
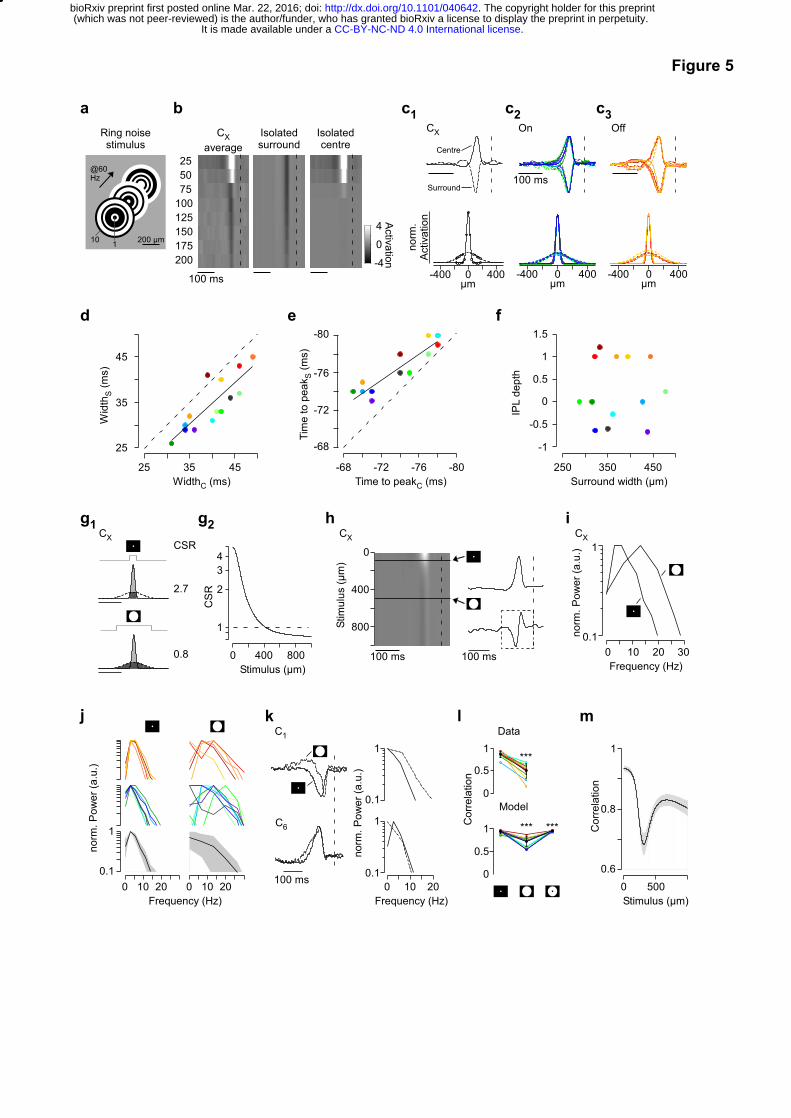
100 ms
Stim
ulus
(µm
)
0
400
800
100 ms
CSR
2.7
0.8Stimulus (µm)
0 400 800
CS
R
3
2
1
4
Figure 5
200 µm110
@60Hz
Centre
a
255075
100125
Ring noisestimulus
CXaverage
Isolatedsurround
Isolatedcentre
0 400-400µm
CX On Off
norm
.A
ctiv
atio
n
c1 c2 c3
100 ms
0 400-400µm
0 400-400µm
b
100 ms
4
0
-4
Activation
150175200
Time to peakC (ms)-68 -72 -76 -80
-68
-72
-76
-80
Tim
eto
peak
S(m
s)
25 35 45WidthC (ms)
25
35
45
Wid
thS
(ms)
e
-1
250 350 450Surround width (µm)
IPL
dept
h
d f
h
0 10 20 30Frequency (Hz)
norm
.Pow
er(a
.u.)
0.1
1
g1 i
j
norm
.Pow
er(a
.u.)
0.1
1
Frequency (Hz)0 10 20
Stimulus (µm)0 500
Cor
rela
tion
0.6
0.8
1
k
1
0
0.5
Cor
rela
tion
1
0
0.5
Data
Model
l
***
*** ***
mC1
C6
100 ms
Frequency (Hz)0 10 20
norm
.Pow
er(a
.u.)
1
0.1
0.1
1
Surround
0
1
-0.5
0.5
1.5
g2CX CX CX
0 10 20
.CC-BY-NC-ND 4.0 International licenseIt is made available under a (which was not peer-reviewed) is the author/funder, who has granted bioRxiv a license to display the preprint in perpetuity.
The copyright holder for this preprint. http://dx.doi.org/10.1101/040642doi: bioRxiv preprint first posted online Mar. 22, 2016;

5 µm
10 20 30 400
0
0.1
0.2
0.3
0.4
Cor
rela
tion
Distance (µm)
Distance (µm)
Correlationminimum
10 20 30 400
Cor
rela
tion
0
0.1
0.2
0.3
0.4
0.5
0 2 4 6 8Area (µm2)
RO
Is(*
103 )
0
2
1
d
10
3
0
10
Terminals
20
30
0 2 4ROIs/terminal
0
10
20
Term
inal
s
1 Correlation
0
0.1
0.2
0.3
0.4
0.5
0 102 4 6 8
Spaceconstantof fit
Distance (µm)
min - maxROI radius
SFigure 1
0.25 µm
a1 a2 b1
b2
b3
c e
0 40 80 120ROIs
0
10
20
30
Rec
ordi
ngfie
lds0.5
IPL depth2 1 0 -1
0
1
2
3
RO
Is(*
103 )
f
.CC-BY-NC-ND 4.0 International licenseIt is made available under a (which was not peer-reviewed) is the author/funder, who has granted bioRxiv a license to display the preprint in perpetuity.
The copyright holder for this preprint. http://dx.doi.org/10.1101/040642doi: bioRxiv preprint first posted online Mar. 22, 2016;

1
2
3
4
SFigure 2
3
4
1
2
2 s
n.s.
RF
diam
eter
(µm
)0
50
100
GCaMP6f iGluSnFr
a1
a2
1
2
34
Cell A
Cell B
a3
b
c
5 µm
d
1
2
1 s
5 µm
2 s
1
2
IPL: -0.9
e1
e2
f1 f2
.CC-BY-NC-ND 4.0 International licenseIt is made available under a (which was not peer-reviewed) is the author/funder, who has granted bioRxiv a license to display the preprint in perpetuity.
The copyright holder for this preprint. http://dx.doi.org/10.1101/040642doi: bioRxiv preprint first posted online Mar. 22, 2016;

Entropy (bits)0.0 1 2
Fiel
ds
0
10
10µm
1 2
20 1
2
SFigure 3
r=0.01, p>0.05
0.4 0.6 0.820
40
60
Transience
Del
ay(m
s)
1
10-3
Pow
er
1 10Frequency (Hz)
C1 = -1.5
CX = -0.5
CR = -1.3
1 10
r=-0.3, p>0.05
Del
ay(m
s)
20
40
60
HFi-1 -0.6-0.8
g h iC3b = -0.9
0
1
1,00
0R
OIs
disc
arde
ddu
eto
S/N
Act
ivity
2 s 2 s 1 s 1 s
C1
C2
C3a
C3b
C4
CR
C9
C8
C7
C6
C5t
C5oC5iCX
b
024Fe
atur
e
2s
02468
10
Feat
ure
024Fe
atur
e
0.5s
C1
CROff On
0
5
d´
...
2
d´ 4
0
8
Off On
0
2000
400
0-4 4 8d`
RO
Is
d’ = 2.0
d’ = 4.5
d
a c1
c2
c3
Time to peak (ms)
RO
Is(x
103 ) Events
0 400 8000
100
200
300
0
1
2f
Frequency (Hz)
Off BCs On BCs
Even
tinc
iden
ce(%
)
0
40
80
e
.CC-BY-NC-ND 4.0 International licenseIt is made available under a (which was not peer-reviewed) is the author/funder, who has granted bioRxiv a license to display the preprint in perpetuity.
The copyright holder for this preprint. http://dx.doi.org/10.1101/040642doi: bioRxiv preprint first posted online Mar. 22, 2016;
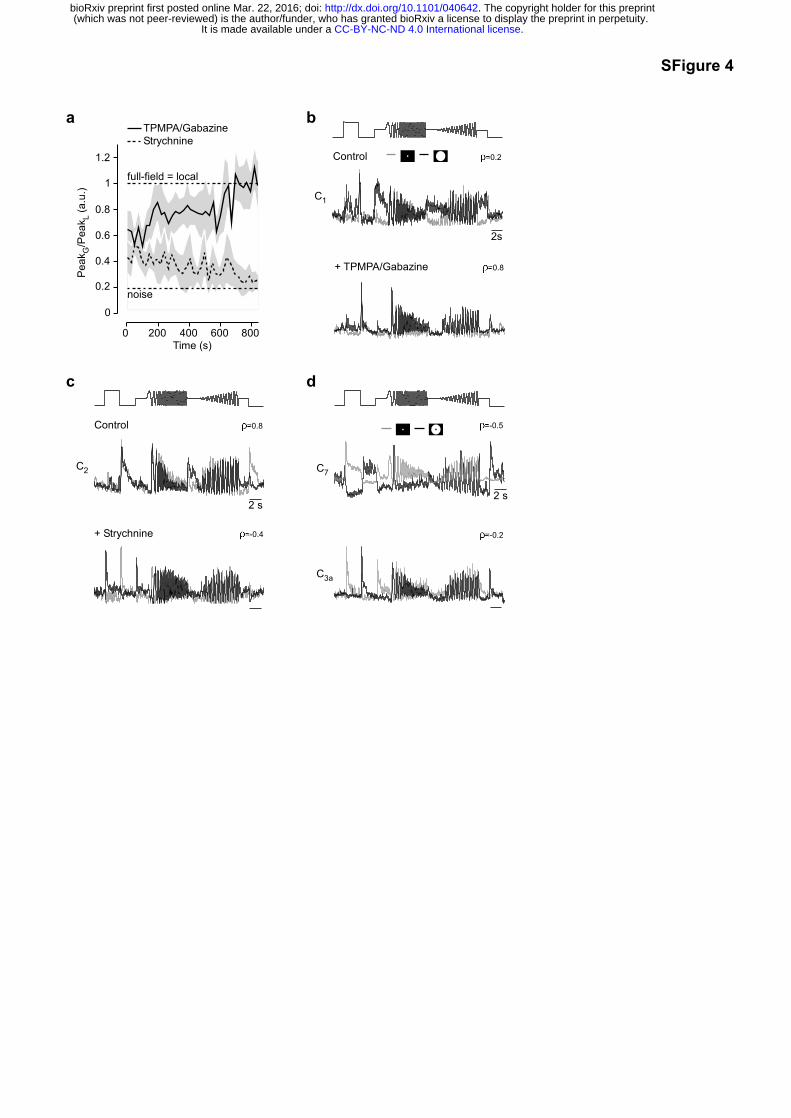
C3a
=-0.2
C7
=-0.5
c
Control =0.8
C2
+ Strychnine =-0.4
d
a
Control
C1
2s
=0.2
+ TPMPA/Gabazine =0.8
SFigure 4
TPMPA/GabazineStrychnine
noise
full-field = local
Time (s)0 200 400 600 800
0
0.2
0.4
0.6
0.8
1
1.2
Pea
k G/P
eak L
(a.u
.)
b
2 s2 s
.CC-BY-NC-ND 4.0 International licenseIt is made available under a (which was not peer-reviewed) is the author/funder, who has granted bioRxiv a license to display the preprint in perpetuity.
The copyright holder for this preprint. http://dx.doi.org/10.1101/040642doi: bioRxiv preprint first posted online Mar. 22, 2016;

SFigure 5
a
255075
100125150175200
CXaverage
1Extrapolatesurround
4Isolatecentre
6
100 ms
4
0
-4
Activation
Cut centrerings
2Isolate
surround
3 5
1 - 4 4 + 6
7 8
1 - 7
Stimulus (µm)0 400 800 0 400 800
CS
R
0.6
3
2
1
4
Stimulus (µm)
5
100 ms
e1
e2
d
Control +TPMPA/Gbz
C5i
100 ms
Control +Strychnine
C7
Peak-timeC (ms)-68 -72 -76 -80
25
35
45
55
Del
ay(m
s)
p<0.001r=0.82
b c1 c2
0.7
0
-0.6
Activation
.CC-BY-NC-ND 4.0 International licenseIt is made available under a (which was not peer-reviewed) is the author/funder, who has granted bioRxiv a license to display the preprint in perpetuity.
The copyright holder for this preprint. http://dx.doi.org/10.1101/040642doi: bioRxiv preprint first posted online Mar. 22, 2016;