balance of payment crises in nigeria: the …ijecm.co.uk/wp-content/uploads/2017/05/559.pdf ·...
TRANSCRIPT

International Journal of Economics, Commerce and Management United Kingdom Vol. V, Issue 5, May 2017
Licensed under Creative Common Page 119
http://ijecm.co.uk/ ISSN 2348 0386
BALANCE OF PAYMENT CRISES IN NIGERIA: THE ROLE
OF EXCHANGE RATE
Dayo Benedict Olanipekun
Department of Economics, Ekiti State University, Nigeria
Akindele John Ogunsola
Department of Economics, Ekiti State University, Nigeria
Abstract
The liberalization of the foreign exchange market in Nigeria in the mid-1980 had caused
persistent movement in exchange rate which had led to deleterious effect on the balance of
payment position in the country. This paper examines the effect of exchange rate on aggregate
balance of payment (BOP), current account balance and capital account. Earlier studies in the
country focused on the effect of exchange rate on aggregate BOP. Autoregressive Distributed
Lags (ARDL) approach to cointegration was adopted to estimate the models. This was followed
by the short-run error correction model. It was found that exchange rate appreciation had
adverse effect on BOP and current account balance. However, no statistically significant effect
of exchange rate on capital account was obtained. Additionally, inflation rate was found to have
negatively affected the BOP in the country. An effective management of the exchange rate by
the monetary authority is essential to yield a favourable balance of payment position in Nigeria.
Keywords: Exchange Rate, Current Account, Capital Account, Balance of Payment,
Autoregressive Distributed Lags
INTRODUCTION
There is an ongoing debate by policy makers and academics on the appropriate exchange rate
regime to achieve macroeconomic objectives of developing and emerging economies. The
choice of exchange rate regime has as a wide range of effects on macroeconomic performance
© Olanipekun & Ogunsola
Licensed under Creative Common Page 120
and balance of payment position of a country. Deliberate exchange rate appreciation by the
monetary authority in an economy with less export could have detrimental effect on real sector,
general price level and trade. Since the breakdown of the Bretton Woods’ system in 1973, many
developed and developing countries had adopted floating exchange rate system. The floating
exchange rate regime though has its merits, however, it has resulted to several episodes of
volatility in exchange rate with some implications for trade, external reserves, inflation, money
supply and economic growth.
Nigeria has witnessed several exchange rate policies and regimes; however, these
policies had not led to the achievement of a favourable balance of payment position in the
country. After the adoption of the Structural Adjustment Program (SAP) in Nigeria in 1986, the
foreign exchange market was deregulated. The deregulation policies led to fluctuation in
exchange rate. However, the monetary authority frequently intervenes in the foreign exchange
market to reduce the extent of depreciation of naira. During the SAP period the balance of
payment (BOP) statistics recorded some deficits. Naira to dollar exchange rate depreciated from
N0.99 per dollar in 1986 to N9.00 per dollar in 1990. During the same period, BOP recorded
deficits. For instance, between 1985 and 1990, BOP deficits increased from N339.60 million to
N4.51 billion. Although the current account was in surplus mainly through the revenue derived
from the export of crude oil, a large amount of the deficits incurred were from the capital
account. The deficits in the BOP were due to increase importation of food products, textiles,
automobiles, machinery and equipments (Central Bank of Nigeria annual reports and statement
of account, 2005).
In the mid-1980, when Nigeria started recording huge balance of payments deficits and
depletion of the foreign reserve, policy makers were in favour of devaluation of naira. This was
expected to reduce pressure on external reserve as well as BOP. However, after the
devaluation of naira, the economy was far from recovery. Available statistics from the Central
bank of Nigeria (CBN) show that both the current and capital account recorded deficits in 1987,
1988 and 1989. Hence, exchange rate devaluation did not significantly improve external
reserve, trade and economic performance in the country.
Due to the continuous exchange rate volatility and deficits in balance of payment in
Nigeria, the investigation on exchange rate dynamics and balance of payment in Nigeria is still
subject to further findings because the persistence changes in exchange rate has increased
uncertainty in international trade transactions in the country. Previous empirical studies in
Nigeria, notably, Oladipupo and Onotaniyohuwo (2011), Iyoboyi and Muftau (2014), Tijani
(2014) generally focused on the effect of exchange rate on the aggregate balance of payments
without considering the various components of the balance of payments. Our study intends to fill

International Journal of Economics, Commerce and Management, United Kingdom
Licensed under Creative Common Page 121
the gap by investigating the effect of exchange rates on various components of BOP and the
aggregate BOP. This will help to determine the magnitude of the impact of exchange rate on
various components of BOP.
Therefore, this study aims to examine the effect of exchange rate dynamics on BOP and
its components in Nigeria. Specifically, the study will investigate the effect of exchange rate on
current account, capital account and the overall BOP in the country. This study covers the
period between 1971 and 2014 due to persistent reforms in the foreign exchange market and
more importantly, erratic balance of payment positions. Availability of data also informed the
choice of the period.
The rest of the paper is organized as follows: section two is on overview of exchange
rate regimes and balance of payment profile of Nigeria. Section three is on literature review.
Here, theories on exchange rate and balance of payment will be reviewed. Some empirical
findings in the previous studies will be documented. Next is the theoretical framework and
methodology in section four. Section five is on analysis of data and discussion of results.
Section five concludes the paper.
OVERVIEW OF EXCHANGE RATE AND BALANCE OF PAYMENT PROFILE IN NIGERIA
Development in Nigeria’s Exchange Rate
After the establishment of the Central Bank of Nigeria (CBN) in 1958 and the enactment of
exchange control acts in 1968, Nigeria operated fixed exchange rate regime. Over a decade,
after the establishment of CBN, Nigeria’s pound was used as the medium of exchange with
easy convertibility to British pounds (Egwaikhide et al, 2015). In 1973, Nigeria’s pound was
changed to naira due to the devaluation of British pounds in 1967. The over-valuation of naira
that resulted during the exchange control regime led to massive importation of finished products
which had deleterious effect on balance of payment, external reserves and domestic production
of the country. Under the exchange control acts, Naira was subjected to administrative
management and control by the CBN. Between 1961 and 1970, Naira-Dollar exchange rates
were fixed at 0.7143.
The development in the oil sector led to huge foreign exchange earnings in the country
in the early 1970s. There was increased in foreign exchange receipts in the foreign exchange
market (FEM). By 1975, Naira appreciated against US Dollar following the increased capacity of
the CBN to manage foreign exchange from the proceeds derived from oil exploration. Also, the
CBN embarked on deliberate action on Naira appreciation to enable the industrial sector to
source its inputs from abroad and for the implementation of the Import Substitution
Industrialization (ISI) strategy. The exchange rate as at 1980 was 0.54 naira to a dollar.

© Olanipekun & Ogunsola
Licensed under Creative Common Page 122
The oil glut in early 1980s, led to crisis in the foreign exchange market. There was excessive
demand for foreign exchange with low supply in the foreign exchange market due to the sharp
fall in price of crude oil in the international market. At this time, the CBN realized it cannot
continue to operate a fixed foreign exchange regime this led to the abolishment of exchange
control and some steps were taken to deregulate the foreign exchange market.
In 1986, Two tiers of foreign exchange market were introduced, namely, the first tier and
second tier foreign exchange markets. The first tier was administratively managed by the CBN
and the prices were referred to as the official rate. The second tier foreign exchange market was
established as part of the federal government strategies towards Structural Adjustment
Programme (SAP). In the second tier foreign exchange market the allocation and determination
of exchange rate were conducted using the market auction system. The objectives of exchange
rate policy under the SAP were to preserve the value of the domestic currency, enhancing
competitiveness of domestic industries and to promote local production as well as diversify the
economy (CBN, 1990).
Further, the CBN introduced the Bureau de Change in 1989 to deal with the foreign
exchange needs of the private sector. Exchange rate depreciated from N3.32 per dollar in 1985
to N9.00 per dollar in 1990 (see table 1). Due to the depreciation of naira, the CBN pegged the
official foreign exchange rate to US dollar in 1994. Consequently, the Bureau de Change was
restricted as the only agent for foreign exchange transaction (The parallel market was affirmed
by the CBN to be illegal) in the Second tier market.
Some notable development occurred in the foreign exchange market in the 1990s. One
is the introduction of Autonomous foreign exchange market in 1995 for the sales of foreign
exchange to end users through authorized dealers by the CBN. Second, in 1999, the foreign
exchange market was further liberalized by the establishment of Inter-Bank foreign exchange
market (IFEM). The IFEM was devised to boost the supply of foreign exchange in the economy
and facilitate the funding of inter-bank operations through the privately earned foreign exchange
(CBN, 2002).
In 2002, the Dutch Auction System (DAS) was introduced due to pressure on the
demand for foreign exchange and fall in external reserve. The operation of the DAS allowed the
CBN to determine the amount of foreign exchange to be sold in the price that buyer quoted
(Omojimite and Akpokodje, 2010). Further development in the FEM led to the introduction of
whole sale Dutch Auction system in 2006 which was in operation till 2008. By 2009, retail Dutch
Auction System (RDAS) was introduced as a result of increased depletion in external reserve
and to further ration the allocation of foreign exchange. CBN maintained the rDAS as the
mechanism for the management of foreign exchange. During the last quarter of 2014, high

International Journal of Economics, Commerce and Management, United Kingdom
Licensed under Creative Common Page 123
exchange rate volatility was witnessed due to excessive demand pressure and other
development in the external sector, mainly the sudden crash of crude oil price in the
international market. Between 2005 and 2014 exchange rate depreciated from N129 per dollar
to 155.74 (CBN, 2014).
Table 1 shows the evolution of Nigeria’s exchange rate, external reserves and crude oil
prices. Since exchange rate movement has strong implication on external reserve and oil price,
it is pertinent to present the data that shows the development of the economic variables.
Additionally, the dynamics of nominal exchange rate is depicted in figure 1. Several reforms in
the foreign exchange market were responsible for the trends in exchange rate that is presented.
Table 1: Exchange Rate, External Reserves and Crude Oil Prices
Years
NER
(N/$)
External Reserve
US$'Million
Crude Oil Price
USD/ Barrel
1971-1975 0.63 1238.56 5.53
1976-1980 0.63 3014.29 20.32
1981-1985 2.93 1549.53 30.13
1986-1990 13.74 3863.21 17.01
1991-1995 21.89 4472.18 17.16
1996-2000 52.09 5571.04 19.29
2001-2005 125.58 12512.30 32.44
2006 128.65 37456.09 61.00
2007 125.83 45394.31 69.04
2008 118.57 58474.38 94.10
2009 148.90 77152.31 60.86
2010 150.29 37358.71 77.38
2011 153.86 32639.80 107.46
2012 157.50 43830.00 109.45
2013 157.31 42850.00 105.87
2014 158.55 37220.33 63.28
Source: Compiled by the authors’ based on data from CBN and OPEC
In figure 1, notable changes in nominal exchange rate are observed between 1984 and 1986 as
well as 1998 and 2001. Some of the factors that led to high depreciation in exchange rate during
the periods include, depletion in external reserves, oil price shocks and erratic government
policies occasioned by frequent changes in government. Nominal exchange rate shows gradual
depreciation in most of the years considered.

© Olanipekun & Ogunsola
Licensed under Creative Common Page 124
Figure 1: Nominal Exchange Rate Dynamics
Balance of Payment Profile of Nigeria
An analytical summary of BOP is presented in Table 2. Also, figure 2 illustrate the movement in
the current account balance, capital account balance and overall BOP balance as percentage of
GDP. The charts show evolution of current account balance, capital account balance and
overall balance of payment position of Nigeria between 1971 and 2014.
The disequilibrium in the BOP will be better appreciated when expressed as percentage
of GDP. The current account, capital account and BOP as percentage of GDP are depicted in
the table 2. The balance of payment recorded surpluses from 1971 to 1980; this was majorly
attributed to the oil sector which revenue increased the buoyancy of the external position.
Although the capital account recorded surplus between 1981 and 1985, the overall balance of
payment witnessed a deficits averaged N2,749.10 million (see table 2). In the reference period,
the BOP deficit was 4.78% of GDP.
Nigeria’s external position worsen between 1986 and 1990, the capital account deficit
averaged N16,258.36 million. This resulted to a BOP deficit of 8.14% of GDP. Further,
development in external sector led to capital and financial account deficits between 1996 and
2000 (see table 2). However, the overall BOP position as a percentage of GDP was 2.3 from
2001 to 2005. The improvement in the BOP was reflected in the current account balance
through the contributions of the oil sector. Consequently, in 2006 and 2007, the BOP posted a
substantial surplus as it was 9.63% and 5.46% of GDP, respectively. Remarkable improvement
in the current account during these periods contributed significantly to the overall BOP balance.
-50
0
50
100
150
200
250
300
350N
airi
a/D
olla
r, %
Years
Nominal Exchange Rate MovementsNominal Exchange Rate Changes

International Journal of Economics, Commerce and Management, United Kingdom
Licensed under Creative Common Page 125
Conversely, in 2009 and 2010, external sector statistics shows BOP deficits of 6.31% and
2.73% of GDP, respectively (see figure 2). A marginal surplus was posted in 2011; this could be
attributed to the improvement in the current account. The deficits of N1,949 billion recorded in
2012 on the capital account was offset by surplus of N2,736 billion posted on the current
account. This development was as a result of the increase in the volume of merchandise export.
The decline in oil price in the international market from $105.9 per barrel to $63.3 per barrel
(see table 1) between 2013 and 2014 resulted to BOP deficits of 0.19% and 1.66% of GDP
obtained during period. In this period, increased in average import from 10.9% of GDP to 12.3%
of GDP worsen the overall BOP position in the country (CBN, 2014).
Table 2: Analytical Statement of BOP
Years
Current
Account
Balance
(N'Million)
Capital Account
Balance
(N'Million)
Overall Balance
(N'Million)
Current
Account
Balance as
% of GDP
Capital
Account
Balance as
% of GDP
Overall
Balance
as % of
GDP
1971-1975 842.94 166.72 1029.58 3.5 2.1 5.85
1976-1980 4,084.38 215.12 4290.34 8.5 0.6 9.08
1981-1985 (4,031.54) 1,222.80 (2,749.10) (7.5) 2.6 (4.78)
1986-1990 (5,499.50) (16,258.36) (12,704.62) (0.1) (6.2) (8.14)
1991-1995 (41,159.9) (35,596.12) (79,355.56) (1.1) (9.3) (7.36)
1996-2000 213,450.0 (265,025.74) (57,048.45) 5.6 (7.8) (3.10)
2001-2005 1,555,699.0 (983,083.13) 84621.0 12.1 (8.5) 2.3
2006 4,698,047.1 (2,491,546.58) - 25.3 (13.4) 9.63
2007 3,478,374.8 (1,666,525.44) -2.32831E-10 16.8 (8.1) 5.46
2008 3,455,650.3 (992,280.30) 2.32831E-09 14.2 (4.1) 0.81
2009 2,064,890.2 1,862,597.81 -9.77889E-09 8.3 7.5 (6.31)
2010 1,970,592.1 305,561.31 - 3.6 0.6 (2.73)
2011 1,641,463.2 (831,406.39) 3.0268E-09 2.6 (1.3) 0.07
2012 2,736,448.3 (1,949,196.86) -4.19095E-09 3.8 (2.7) 2.44
2013 2,996,627.0 1,209,069.77 - 3.7 1.5 (0.19)
2014 201,098.7 2,064,778.97 9.31323E-10 0.3 2.6 (1.66)
Source: Authors’ computation based on data gathered from CBN bulletin

© Olanipekun & Ogunsola
Licensed under Creative Common Page 126
Figure 2: Current Account, Capital Account and BOP as Percentage of GDP
LITERATURE REVIEW
Theories of balance of payment and exchange rate proliferate in the economic literature. The
orthodox theories of balance of payment include the elasticity approach, absorption approach
and monetary approach to balance of payment. The theories show the various implications of
devaluation of a single country’s currency in the world economy on real income and balance of
payments.
The elasticity approach to balance of payment provides explanation on the effect of
devaluation on current account balance. Two direct effects of devaluation on the current
account balance could be drawn from this approach. One works to reduce the deficits; the other
makes the deficits worse. If the sum of the foreign elasticity of demand for export and the home
country elasticity of demand for import is greater than unity, devaluation will improve the current
account. However, if the sum of the foreign elasticity and home country elasticity is less than
unity devaluation will result to deterioration of the balance of payment (Pilbeam, 1998). The
elasticity approach to balance of payment has been criticized to neglect income and expenditure
effects of exchange rate changes. It focused on partial equilibrium analysis and ignores supply
conditions and cost changes due to devaluation.
Absorption approach to balance of payment was originally developed by Alexander
(1952) and extended by Johnson (1958). This approach allows for the introduction of income
effects to the analysis of the effects of devaluation. Current account balance can be viewed as
the difference between domestic output and domestic spending. In this approach, the effect of
devaluation on balance of payment works through marginal propensity to absorb. If the marginal
-40.0
-30.0
-20.0
-10.0
0.0
10.0
20.0
30.0
40.0
%
Years
Current Account as % of GDP Capital Account as % of GDP BOP as % of GDP

International Journal of Economics, Commerce and Management, United Kingdom
Licensed under Creative Common Page 127
propensity to absorb is less than unity, an increase in income will raise income to absorption
ratio, hence, leads to improvement in the current account.
The monetary approach to balance of payment pioneered by Whitman (1975), Frenkel
and Johnson (1976) suppresses the traditional distinction between exports, imports and non-
traded goods. The balance of payment is considered as a monetary flow that can only be
explained by disequilibrium in the stock. It focuses on the disequilibrium between the demand
for and supply of money that leads to balance of payments deficits or surpluses. Hence, balance
of payment disequilibrium is a reflection of disequilibrium in the money market. A major criticism
of the absorption and monetary approaches to balance of payment is that it suggests that an
improvement in trade balance implies an improvement in balance of payment due to inflows of
international money. These theories emphasize on stock adjustment process, and not flow
disequilibrium.
Krugman (1979) developed a theoretical model of balance of payment crises. He
showed that speculative attack on reserves occurs when investors change the composition of
their portfolios, reducing the proportion of domestic currency and raising the proportion of
foreign currency. These activities produce variation in the relative yields of domestic and foreign
currencies. When government is no longer able to defend the exchange rate the domestic
currency begins to depreciate.
In the same vein, Obstfeld (1983) advanced the Krugman’s theory and demonstrated
how expectation of subsequent devaluation affects the timing of balance of payment crises. In
the model, the timing of balance of payment crisis is a function of the expected devaluation and
the length of the transitional period of floating before new exchange parity begins. It was argued
that speculative attack on the currency could emanate when the market realizes that the current
exchange rate cannot be defended.
Empirical studies on the relationship between exchange rate and balance of payment
had shown mixed findings. The variation in the results depends on exchange rate regime of the
economy under consideration as well as the proportion of export, import in the balance of trade
and exchange rate. Lane and Milesi-Ferratti (2002) explored the long-run links between net
foreign asset position, the trade balance and the real exchange rate. The analysis focused on a
sample of 20 OECD countries between 1970 and 1998. The result revealed a negative long-run
relationship between the trade balance and real exchange rate. The study highlighted the
significant of difference in rates of returns on external assets and liabilities in determining the
dynamics of net foreign assets. In a panel study of 22 developing countries, Santas-Paulino and
Thirlwall (2004) estimated the effect of trade liberalization on export growth, import growth, the

© Olanipekun & Ogunsola
Licensed under Creative Common Page 128
balance of trade and the balance of payment. It was found that liberalization stimulated export
growth, but increased import worsen of balance of trade and payments.
Husain, Mody and Rogoff (2005) focused on regime durability of exchange rate among
advanced, emerging and developing economies. It was noted that pegs were favourable for
durability and relative low inflation in developing countries. However, for developed economies,
floats were durable and led to higher growth. Regime neutrality and managed float system
seems to be favourable in emerging markets. Pooled regression was used by Shambaugh
(2004) to investigate the effect of fixed exchange rate on monetary policy. Countries considered
were classified as pegged and nonpegged. It was reported that fixed exchange rate forced
countries to follow the monetary policy of the base country more closely than floating rate
countries.
The interaction of exchange rate fluctuation and balance of payment of industrialized and
developing countries was examined by Kandil (2009). It was reported that in industrial countries
with flexible exchange rate system, exchange rate depreciation reduces imports and increases
capital flows. However, exchange rate appreciation increases imports and worsen the current
account balance across developing countries.
In the quest to validate empirically the monetary approach to balance of payment in
Mexico, Martinez (1999) employed Mexico quarterly data between the first quarter of 1971 and
the second quarter of 1988. The monetary approach to balance of payment was not supported
in the study. It was found that monetary authority adjusts domestic assets to neutralize
exogenous balance of payments deficits. In a similar study on Mexican economy, Ibarra and
Blecker (2015) revealed that the impact of exchange rate changes on trade balance is negligible
due to the increasing integration of export industries into global supply chains.
Some studies in Nigeria have provided mixed results on the relationship between
exchange rate and balance of payments, notably, Oladipupo and Onotaniyohuwo (2011)
investigated the impact of exchange rate on the Nigerian external sector between 1970 and
2008 using an ordinary least square (OLS) technique. It was reported that exchange rate has a
significant impact on the balance of payments position. Iyoboyi and Muftau (2014) employed the
vector error correction model to investigate the impact of exchange rate depreciation on the
balance of payments. The result shows evidence of bidirectional causality between balance of
payment and exchange rate. Further, the variance decomposition indicates that exchange rate
changes does not account for a significant variation in balance of payments. Similarly, Tijani
(2014) empirically examined balance of payment adjustment mechanisms focusing on the
monetary channel in Nigeria between 1970 and 2010. A positive relationship between the
balance of payment, domestic credit, exchange rate and balance of trade was obtained. The

International Journal of Economics, Commerce and Management, United Kingdom
Licensed under Creative Common Page 129
study show that monetary measures contribute greatly to the balance of payment position.
Earlier empirical works in Nigeria failed to examine the effect of exchange rate on various
components of balance of payments, such as, current account and capital account.
RESEARCH METHODOLOGY
Model
A model of exchange rate and balance of payment crisis that was developed by Kouri (1976)
with slight modification by Krugman (1979) provides a useful framework for this study. Two
exchange rate regimes were considered in the model. First, the freely floating exchange rate;
where the exchange rate is determined by the market. Second is the fixed exchange rate, where
government holds reserve of foreign currency and exchanges foreign for domestic money at a
rate. Under the floating exchange rate system, changes in expectation are observed in the
changes in exchange rate. However, under fixed exchange rate regime, it is reflected in
changes in government reserves.
The reasons for exchange rate changes in a flexible exchange rate system are three
folds: increase in domestic money supply, a change in private holdings of domestic assets or a
change in expected rate of inflation. Exchange rate appreciation is proportional to the real
money supply and negatively to the balance of payment. Hence, in a flexible exchange rate
system, exchange rate appreciation would negatively affect balance of payment position.
In a fixed exchange rate system, government holds a stock of foreign money and uses to
stabilize the exchange rate. However, government reserves cannot be reduced to zero, hence,
it is impossible to peg the exchange rate forever. Pegging option of the government will be
distorted during balance of payment crisis or dwindle reserve.
The Marshall-Lerner condition posits that exchange rate depreciation would lead to
improvement in balance of payment through the expansion of output and export provided that
the sum of price elasticity of demand for export and demand for import are greater than unity.
Hence, in the empirical model for this study, we expect depreciation to improve the balance of
payments.
There are five major variables that could significantly affect the balance of payments and
its components (current account and capital account); these are real effective exchange rate,
money supply, inflation and oil price. Here, all these variables are considered in the analysis.
Based on the relationship between the variables of interest, the empirical model for the study
can be expressed as follows:
),,,( OilpInfMSreerfBOP (1)

© Olanipekun & Ogunsola
Licensed under Creative Common Page 130
),,,( OilpInfMSreerfCA (2)
),,,( OilpInfMSreerfKA (3)
Where, the dependent variable in equation 1 is balance of payment BOP ; reer is the real
effective exchange rate; MS is the broad money supply; Inf is the inflation rate; Oilp is oil
price. The dependent variables in equation 2 and equation 3 are current account (CA ) and
capital account ( KA ), respectively. Oil price is included in the model due to the dependency of
Nigeria’s economy on crude oil. Essentially, balance of payment positions are affected by crude
oil prices.
Estimation Technique
Autoregressive Distributed Lags Model
The Autoregressive Distributed Lags (ARDL) approach of Pesaran and Shin (2001) is employed
to examine the relationship between balance of payment, exchange rate and other variables of
interest. ARDL is used to test the existence of long run relationship and to determine the
elasticities of the variables. This procedure is appropriate to determine cointegration among
variables that are stationary at level and first difference as in the case of this study. It involves
the estimation of the following Unrestricted Error Correction Model (UECM):
)4(11514131211
0
5
0
4
0
3
0
2
1
10
tttttt
it
n
i
iit
n
i
iit
n
i
iit
n
i
iit
n
i
it
uOilpInfMSreerBOP
OilpInfMSreerBOPBOP
)5(21514131211
0
5
0
4
0
3
0
2
1
10
tttttt
it
n
i
iit
n
i
iit
n
i
iit
n
i
iit
n
i
it
uOilpInfMSreerBOP
OilpInfMSreerCACA
)6(31514131211
0
5
0
4
0
3
0
2
1
10
tttttt
it
n
i
iit
n
i
iit
n
i
iit
n
i
iit
n
i
it
uOilpInfMSreerBOP
OilpInfMSreerKAKA
ARDL bound testing procedure is based on the Wald statistics (F-statistics) for cointegration
analysis. The null hypothesis of no cointegration is tested under the asymptotic distribution of
the F-statistics. Given the ARDL model in equations 4, 5 and 6, the null and the alternative
hypotheses can be expressed as follows:

International Journal of Economics, Commerce and Management, United Kingdom
Licensed under Creative Common Page 131
543211543210
543211543210
543211543210
;
;
;
HH
HH
HH
Two sets of critical values were reported by Pesaran et al (2001) and Narayan (2005). One
requires that all variables in the ARDL model are I(0), while, the other is based on the
assumptions that variables are I(1). The null hypothesis of no cointegration would be rejected if
the computed F-statistic exceeds the upper bound [I(1)] of the critical value. However, if the falls
below the lower bound, then the null hypothesis of no cointegration cannot be rejected. The test
is inconclusive if the F-statistic falls between the within the bounds.
Although the ARDL model will show the existence of long run relationship among the
variables, the short run dynamics of the model will be estimated using the error correction model
(ECM). Engle and Granger (1987) suggest that ECM captures disequilibrium situation among
the variables, mainly when combining variables that are stationary at levels and first difference.
The error correction model for this study take the following forms:
tt
n
i
iit
n
i
iit
n
i
iit
n
i
iit
n
i
it
ECM
OilpInfMSreerBOPBOP
111
0
5
0
4
0
3
0
2
1
10
tt
it
n
i
iit
n
i
iit
n
i
iit
n
i
iit
n
i
it
ECM
OilpInfMSreerCACA
212
0
5
0
4
0
3
0
2
1
10
tt
it
n
i
iit
n
i
iit
n
i
iit
n
i
iit
n
i
it
ECM
OilpInfMSreerKAKA
313
0
5
0
4
0
3
0
2
1
10
Where,
321 , and are the parameters for the speed of adjustment. 1tECM
is the lagged error
correction term.
Data Sources and Measurement
The data used were obtained from various publications. Data on balance of payment, current
account, capital account, money supply and inflation were obtained from the Central Bank of
Nigeria statistical bulletin. The data on crude oil prices were collected from Energy Information
Association (EIA). Crude oil prices are measured in dollars per barrel. Real effective exchange
rate was obtained from International Monetary Fund’s International Financial Statistics. The real

© Olanipekun & Ogunsola
Licensed under Creative Common Page 132
effective exchange rate was computed by adjusting for relative prices of home and foreign
countries.
RESULTS AND DISCUSSION
Unit Root Test
The result of the unit root test is presented in table 3. All variables of interest are tested at level
and first difference. Also, the series were tested at both constant as well as constant and trend.
It was found that balance of payment (BOP), current account balance, (CA), capital account
balance (KA) and inflation (Inf) were stationary at level. Other variables to be employed in the
analysis, namely, real effective exchange rate (reer), money supply (MS) and oil price were
stationary at first difference. Thus, the null hypothesis of non stationarity can be rejected at 5%
significance level for BOP, CA, KA and Inf. However, we do not reject the null hypothesis of no
stationarity for reer, ms and oilp at 5% significance level. The result obtained from the
stationarity test indicate a combination of I(0) and I(I) variables in the series, hence, the
autoregressive distributed lags approach to cointegration and the error correction model will be
appropriate for this study.
Table 3: Augmented Dickey-Fuller Unit Root Test
Series Level
Constant
Level
Constant & trend
First Diff.
Constant
First Diff.
Constant & trend
Decisions
BOP -6.538798*** -7.187913*** -6.795366*** -6.702335*** I(0)
CA -3.963145*** -4.744578** -7.011951*** -6.909107*** I(0)
KA -3.908733*** -3.829878*** -8.335478*** -5.807303 I(0)
reer -2.748511* -3.050007 -4.027470*** -4.278916 I(1)
MS -2.753959* -3.072233 -7.402294*** -7.286133*** I(1)
Inf -3.058519** -3.316542* -5.651128*** -5.614566*** I(0)
Oilp -1.366384 -1.909703 -4.677168 -4.575781 I(1)
*, **, *** represent statistical significance at 10%, 5% and 1% levels respectively.
Cointegration Test and Error Correction Model Estimation
The ARDL bound testing approach was used to test the existence of cointegration among the
variables employed in the study. In addition, the error correction model was conducted to
determine the short-run dynamics of the variables. The estimations were divided into three,
based on the objectives of the study. Similarly, discussion of results are in three panels; namely,

International Journal of Economics, Commerce and Management, United Kingdom
Licensed under Creative Common Page 133
panel A, B and C. First panel examines the relationship between balance of payment, real
effective exchange rate, money supply, inflation and oil price. Second is on the relationship
between current account, real effective exchange rate, money supply, inflation and oil price. The
third panel investigates the relationship between capital account, real effective exchange rate,
money supply, inflation and oil price.
In the ARDL results, the null hypothesis of no cointegration will be rejected if the F-
statistics is higher than the upper bound. However, if the F-statistics is below the lower bound
the null hypothesis of no cointegration cannot be rejected. The result will be inconclusive if the
F-statistics is between the lower and upper bound.
Panel A
The analysis of the long-run relationship between balance of payment, real effective exchange
rate, money supply, inflation and oil price gives the F-statistics of 9.94, which is above the upper
bound of the Pesearan’s table at 5% significance level (see Appendix A). This indicates the
existence of long run relationship between balance of payment, real effective exchange rate,
money supply, inflation and oil price. Hence, the null hypothesis of no long run relationship can
be rejected.
Table 4: ARDL Bounds Test (E-view 9.5 output)
Null Hypothesis: No long-run relationships exist
Test Statistic Value K
F-statistic 9.942793 4
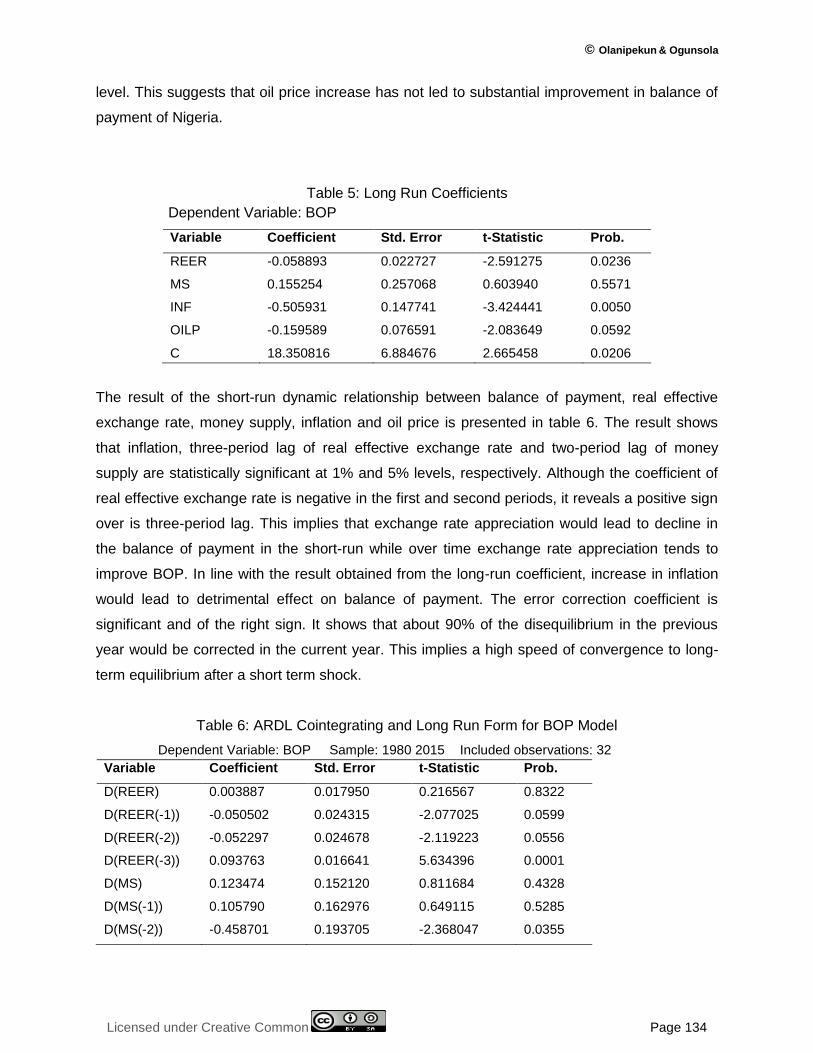
The long run coefficients of the ARDL estimates are presented in table 5. In the estimate,
balance of payment is the dependent variable. It can be observed that real effective exchange
rate, inflation and oil price exert significant effect on balance of payment. Accordingly, the
coefficients of the parameters suggest that a 10% appreciation of domestic currency leads 0.6%
deterioration of balance of payment position. Inflation results to a deleterious effect of balance of
payment. Its coefficient shows that a 10% increase in inflation, can worsen balance of payment
position by 5%.
Noteworthy is the negative coefficient of the oil price, which is contrary to expectation
since the country is an oil exporting economy. Here, a 10% increase in oil price can lead to
about 1.6% deterioration of balance of payment. However, this value is only significant at 10%
© Olanipekun & Ogunsola
Licensed under Creative Common Page 134
level. This suggests that oil price increase has not led to substantial improvement in balance of
payment of Nigeria.
Table 5: Long Run Coefficients
Dependent Variable: BOP
Variable Coefficient Std. Error t-Statistic Prob.
REER -0.058893 0.022727 -2.591275 0.0236
MS 0.155254 0.257068 0.603940 0.5571
INF -0.505931 0.147741 -3.424441 0.0050
OILP -0.159589 0.076591 -2.083649 0.0592
C 18.350816 6.884676 2.665458 0.0206
The result of the short-run dynamic relationship between balance of payment, real effective
exchange rate, money supply, inflation and oil price is presented in table 6. The result shows
that inflation, three-period lag of real effective exchange rate and two-period lag of money
supply are statistically significant at 1% and 5% levels, respectively. Although the coefficient of
real effective exchange rate is negative in the first and second periods, it reveals a positive sign
over is three-period lag. This implies that exchange rate appreciation would lead to decline in
the balance of payment in the short-run while over time exchange rate appreciation tends to
improve BOP. In line with the result obtained from the long-run coefficient, increase in inflation
would lead to detrimental effect on balance of payment. The error correction coefficient is
significant and of the right sign. It shows that about 90% of the disequilibrium in the previous
year would be corrected in the current year. This implies a high speed of convergence to long-
term equilibrium after a short term shock.
Table 6: ARDL Cointegrating and Long Run Form for BOP Model
Dependent Variable: BOP Sample: 1980 2015 Included observations: 32
Variable Coefficient Std. Error t-Statistic Prob.
D(REER) 0.003887 0.017950 0.216567 0.8322
D(REER(-1)) -0.050502 0.024315 -2.077025 0.0599
D(REER(-2)) -0.052297 0.024678 -2.119223 0.0556
D(REER(-3)) 0.093763 0.016641 5.634396 0.0001
D(MS) 0.123474 0.152120 0.811684 0.4328
D(MS(-1)) 0.105790 0.162976 0.649115 0.5285
D(MS(-2)) -0.458701 0.193705 -2.368047 0.0355

International Journal of Economics, Commerce and Management, United Kingdom
Licensed under Creative Common Page 135
D(INF) -0.451193 0.069660 -6.477063 0.0000
D(OILP) 0.080185 0.082738 0.969145 0.3516
D(OILP(-1)) -0.030146 0.100070 -0.301253 0.7684
D(OILP(-2)) 0.091414 0.082672 1.105748 0.2905
CointEq(-1) -0.908291 0.160972 -5.642528 0.0001
Panel B
In panel B, the ARDL bound test on the relationship between current account balance, real
effective exchange rate, money supply, inflation and oil price is presented in table 7. A long run
relationship was obtained for the variables used. The result of the F-statistics is greater than the
critical value of the upper bound in the Pesearan table (see appendix). Accordingly, the null
hypothesis of no long-run relationship can be rejected at 1% level of significance.
Table 7: ARDL Bounds Test
Null Hypothesis: No long-run relationships exist
Test Statistic Value k
F-statistic 7.269522 4
The long run coefficients of the variables are depicted in table 8. Here, only real effective
exchange rate exerts statistically significant effect on current account balance in Nigeria. This
implies that a 10% appreciation in exchange rate reduces the current account balance by 0.5%.
Hence, exchange rate appreciation would cause more deficits in the current account balance in
Nigeria. Other determinants of current account balance used in the study, namely, money
supply, inflation and oil price are not statistically significant at the conventional levels.
Table 8: Long Run Coefficients
Dependent Variable: Current account (CA)
Variable Coefficient Std. Error t-Statistic Prob.
REER -0.046380 0.018804 -2.466463 0.0203
MS -0.118184 0.247977 -0.476592 0.6375
INF -0.186217 0.134864 -1.380773 0.1787
OILP -0.005029 0.079449 -0.063300 0.9500
C 17.685420 8.754684 2.020109 0.0534
Table 9 presents the estimates of the short-run dynamic relationship between current account
balance and other variables of interest in this study. Similar to the long run result obtained, the
real effective exchange rate shows a statistically significant effect on current account. Hence,

© Olanipekun & Ogunsola
Licensed under Creative Common Page 136
both in the short-run and long-run, exchange rate appreciation could affect the current account
balance negatively. However, the magnitude of the long-run coefficient exceeds its short-run.
Further, the coefficient of inflation in the result is negative and significant. This indicates that a
rise in price level could adversely affect the current account position in the country. The error
correction coefficient is significant and it has the right sign. The coefficient suggest about 73% of
the disequilibrium in the previous year would be corrected in the current year.
Table 9: ARDL Cointegrating and Long Run Form
Dependent Variable: CA
Sample: 1980 2015
Included observations: 35
Variable Coefficient Std. Error t-Statistic Prob.
D(REER) -0.034067 0.013698 -2.487016 0.0194
D(MS) -0.086808 0.180198 -0.481736 0.6339
D(INF) -0.269603 0.104337 -2.583956 0.0155
D(OILP) 0.164822 0.114960 1.433734 0.1631
CointEq(-1) -0.734514 0.142154 -5.167031 0.0000
Panel C
The discussions of the relationship between capital account, real effective exchange rate,
money supply, inflation and oil price are presented in panel C. Table 10 shows the F-statistic of
the ARDL model. The value of the F-statistic is greater than the upper bound of the critical value
in the Pesaran’s table (see appendix). Hence, the null hypothesis of no long-run relationship
between the variables can be rejected at 1% significant level.
Table 10: ARDL Bounds Test
Null Hypothesis: No long-run relationships exist
Test Statistic Value k
F-statistic 7.275471 4
Table 11 presents the long-run coefficients of the variables under study. Here, oil price exerts a
statistically significant effect on capital account. The coefficient shows that a percentage
increase in oil price leads to 0.14% increase in the country’s capital account. However, other
variables employed in the study, namely, real effective exchange rate, money supply and

International Journal of Economics, Commerce and Management, United Kingdom
Licensed under Creative Common Page 137
inflation are not statistically significant at the conventional levels. The significance of the oil price
in the nation economy and its contribution to the capital account are shown in these findings.
Table 11: Long Run Coefficients
Dependent Variable: Capital Account (KA)
Variable Coefficient Std. Error t-Statistic Prob.
REER 0.017261 0.015153 1.139139 0.2688
MS 0.192484 0.145905 1.319244 0.2028
INF 0.063862 0.087207 0.732306 0.4729
OILP 0.141197 0.049509 2.851935 0.0102
C -19.875330 5.069010 -3.920949 0.0009
The result of the short-run dynamics and long-run form of the effect of real effective exchange
rate, money supply, inflation and oil price on capital account is presented in table 12. A
statistically significant relationship was obtained for real effective exchange rate and capital
account at its three period lag. Contrary to theory, the positive coefficient of the real effective
exchange rate at its third lag suggests that exchange rate appreciation could improve capital
account position of the country. Although, the coefficients of real effective exchange rate are
negative in the first and second lag, no statistically significant relationship was obtained. This
suggests a moderate effect of exchange rate on capital account in the short-run. A high speed
of adjustment was obtained in the model given the coefficient of the error correction term in
table 12.
Table 12: ARDL Cointegrating and Long Run Form
Dependent Variable: KA
Sample: 1980 2015
Included observations: 35
Variable Coefficient Std. Error t-Statistic Prob.
D(REER) 0.005761 0.022891 0.251684 0.8040
D(REER(-1)) -0.013311 0.035944 -0.370330 0.7152
D(REER(-2)) -0.062997 0.034669 -1.817123 0.0850
D(REER(-3)) 0.044344 0.021366 2.075405 0.0518
D(MS) 0.212721 0.156489 1.359332 0.1900

© Olanipekun & Ogunsola
Licensed under Creative Common Page 138
D(INF) -0.066767 0.105396 -0.633493 0.5340
D(OILP) -0.087165 0.098558 -0.884402 0.3875
D(OILP(-1)) -0.151925 0.107882 -1.408252 0.1752
CointEq(-1) -1.105135 0.202090 -5.468533 0.0000
CONCLUSION
Theories and empirical studies have explained the role of exchange rate in the balance of
payment position of a country. In this study, three equations were estimated by using ARDL
procedure to examine the effect of exchange rate, money supply, inflation and oil price on the
aggregate balance of payment, current account and capital account in Nigeria. The F-statistics
obtained from the bound cointegration test shows a stable long run relationship among BOP,
current account, capital account, exchange rate and other variables of interest.
The coefficients of the long run model show that a 10% appreciation in exchange rate
would lead to 0.5% and 0.4% deterioration in the balance of payment and current account
balance, respectively. However, the effect of exchange rate on capital account was not
statistically significant. In the short-run error correction model, exchange rate was found to be
statisitically significant at various lags in the BOP equation and at level in the current account
equation.
Nigeria’s monetary authority efforts should be directed towards effective exchange rate
management that would lead to favourable consequence on the balance payment position in the
country.
REFERENCES
Alexander, S.S. (1952). The Effects of a Devaluation on a Trade Balance. International Monetary Staff Paper, 2(2), 263-278.
CBN (1990). Central Bank of Nigeria Annual Reports and Statement of Accounts, CBN Abuja, Nigeria.
CBN (2002). Central Bank of Nigeria Annual Reports and Statement of Accounts, CBN Abuja, Nigeria.
CBN (2005). Central Bank of Nigeria Annual Reports and Statement of Accounts, CBN Abuja, Nigeria.
CBN (2014). Central Bank of Nigeria Annual Reports and Statement of Accounts, CBN Abuja, Nigeria
Egwaikhide F.O, Oyinlola M., Adeniyi O. & Olanipekun D.B. (2015). Empirical Exposition of Monetary Policy under Fixed and Managed Float Regime: Any Lessons for Nigeria (CBN Economic and Financial Review, Forthcoming)
Engel, R. F. & Granger, C. W. J. (1987). Co-integration and Error Correction: Representation, Estimation and Testing. Econometrica, 55(2), 251-276.
Frenkel, J. & Johnson, H. (1976). The Monetary Approach to the Balance of Payments: Essentials Concepts and Historical Origins in J. Frenkel & H. Johnson(ed). The Monetary Approach to the Balance of Payments.
International Journal of Economics, Commerce and Management, United Kingdom
Licensed under Creative Common Page 139
Husain, A. M., Mody, A. & Rogoff, K. S. (2005). Exchange Rate Regime Durability and Performance in Developing versus Advanced Economies. Journal of Monetary Economics, 52(1), 35-64.
Ibarra, C. A. & Blecker, R. A. (2015). Structural Change, the Real Exchange Rate and the Balance of Payments in Mexico, 1960-2012. Cambridge Journal of Economics, 40(2), 507-539.
Ibarra, C. A. & Blecker, R. A. (2015). Structural Change, the Real Exchange Rate and the Balance of Payments in Mexico, 1960-2012. 40(2), 507-539.
Iyoboyi, M. & Muftau, O. (2014). Impact of Exchange Rate Depreciation on the Balance of Payments: Empirical Evidence from Nigeria. Cogent Economics & Finance, 2(9), 1-23.
Johnson, H. G. (1958). Towards a General Theory of the Balance of Payments: International Trade and Economic Growth. Cambridge: Cambridge University Press.
Kandil, M. (2009), Exchange Rate Fluctuations and the Balance of Payments: Channels of Interaction in Developing and Developed Countries. Journal of Economics Integration, 24(1), 151-174.
Kouri P. J. K. (1976), The Exchange Rate and Balance of Payment in the Short Run and in the Long Run: A Monetary Approach. Scandinavian Journal of Economics 78(2), 280-304
Krugman, P. (1979). A model of Balance of Payments Crises. Journal of Money, Credit and Banking, 11(3), 311-325.
Lane, P. R. & Milesi-Ferretti, G. M. (2002). External Wealth, the Trade Balance and the Real Exchange Rate. International Monetary Fund Working Paper 02/51
Martinez, J. D. L. C. (1999). Mexico's Balance of Payments and Exchange Rates: A Cointegration Analysis. North American Journal of Economics and Finance, 10, 401-421
Narayan P. K. (2005), The Savings and Investment Nexus for China: Evidence from Cointegration Tests. Applied Economics, 37(17), 1979-1990
Obstfeld, M. (1983). Balance-of-Payments Crises and Devaluation NBER Working Paper Series 1103. April 1983.
Oladipupo, A. O. & Onotaniyohuwo, F. O. (2011). Impact of Exchange Rate on Balance of Payment in Nigeria. Africa Research Review: An International Multidisciplinary Journal, Ethiopia, 5(4), 73-88.
Omojimite, B. U. & Akpokodje, G. (2010). A comparative Analysis of the Effect of Exchange Rate Volatility on Exports in the CFA and non-CFA Countries of Africa. Journal of Social Sciences, 24(1), 23-31.
Pesaran M. H., Shin Y. and Smith R. J. (2001). Bound Testing Approaches to the Analysis of Level Relationship. Journal of Applied Econometrics, 16(3), 289-326
Pilbeam, K. (1998). International Finance, 2nd Edition. Palgrave Macmillan Texts in Economics, Macmillan, London.
Santos-Paulino, Amelia, U. & Thirlwall, A. P. (2004). The Impact of Trade Liberalization on Exports, Imports and the Balance of Payments of Developing Countries. Economic Journal, 114(493), 50-72
Shambaugh, J. C., (2004). The Effects of Fixed Exchange Rate on Monetary. Quarterly Journal of Economics, 119(1), 301-352.
Tijani, J.O. (2014). Empirical Analysis of Balance of Payment Adjustment Mechanisms: Monetary Channel in Nigeria, 1970-2010. Mediterranean Journal of Social Sciences, 5(4), 67-76.
Whitman, Marina V. N. (1975). The Payments Adjustment Process and the Exchange Rate Regime: What Have We Learned? The American Economic Review, 65(2), 133-146.
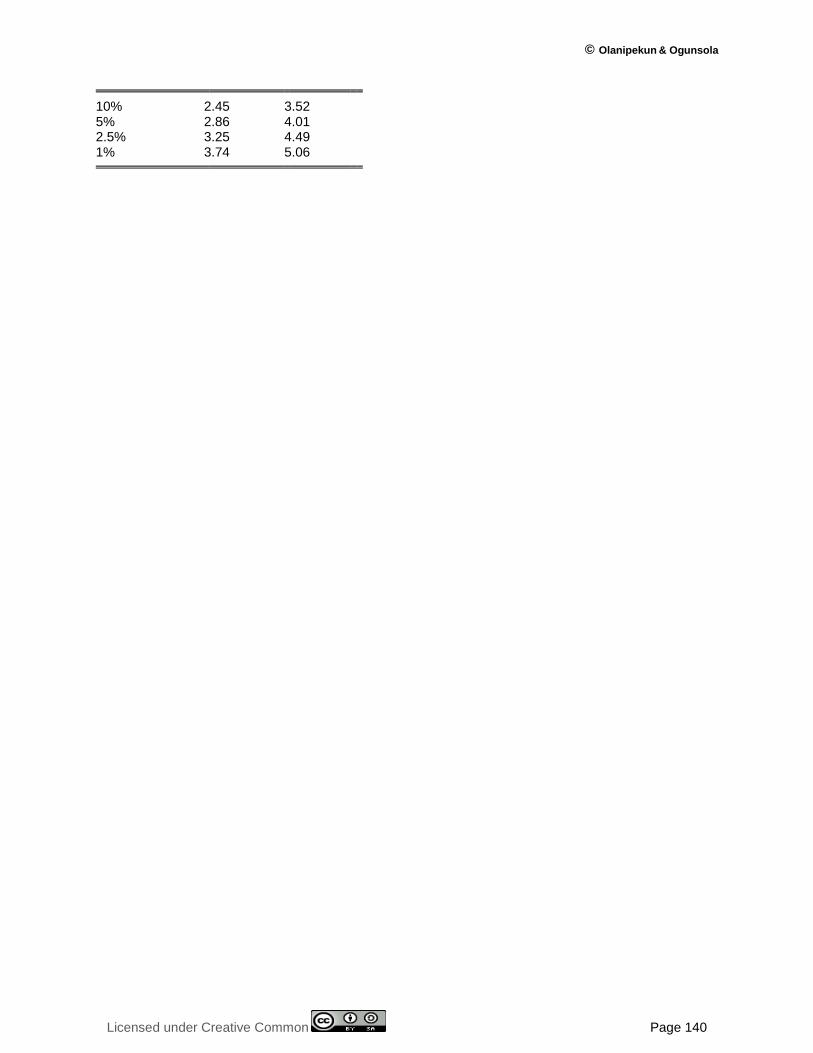
APPENDIX
Critical Value Bounds Test Significance I0 Bound I1 Bound
© Olanipekun & Ogunsola
Licensed under Creative Common Page 140
10% 2.45 3.52 5% 2.86 4.01 2.5% 3.25 4.49 1% 3.74 5.06