bakken update – february 2013€“_february_2013.pdf · 2012 q3 nd sales numbers north dakota...
TRANSCRIPT

Bakken UpdateFebruary 2013
Feb 2013

Updated Bakken Numbers• December 2012 Production:
• Oil Production (23,834,431 Barrels = 768,853 barrels/day) – NEW RECORD
• Natural Gas Production (24,976,855 MCF = 805,705 MCF/day) – NEW RECORD
• Number of producing wells – 8,224 – NEW RECORD
• January 2012 Drilling Permits - 218
• January 2012 Oil Rig Count - 185• North Dakota Department of Mineral Resources
projects drilling rigs will climb above 200 again in 2013Feb 2013

North Dakota Oil Growth
Feb 2013
Daily Oil Production Growth
Well Growth
2011 to 2012: 43.5%
2011 to 2012: 32.2%

2012 Q3 ND Sales NumbersNorth Dakota oil cities continue to see substantial sales growth.
Looking at 3rd quarter sales data for 6 major North Dakota oil cities, there has been an aggregate increase of 250% from 2008 to 2012. These cities represent about 90% of total sales from North Dakota’s 17 oil counties.
Williston, now the largest city in ND by taxable sales and purchases, has seen a 350% increase in sales over this same 2008-2012 period.
*These are all cities where Oppidan is currently working on developmentsFeb 2013
City 2008 2009 2010 2011 2012 08-12 % ∆Minot $226,436,743 $247,605,437 $292,908,514 $387,126,306 $434,443,169 91.86%Williston $209,666,888 $150,306,296 $378,972,293 $733,918,816 $952,804,340 354.44%Watford City $11,912,052 $13,034,885 $20,348,092 $34,029,752 $49,921,606 319.08%Tioga $36,658,332 $27,478,006 $78,607,295 $187,309,601 $304,702,124 731.19%Stanley $7,914,644 $9,379,899 $16,470,728 $37,485,462 $41,998,778 430.65%Dickinson $97,283,717 $95,492,002 $133,360,678 $212,284,928 $279,631,436 187.44%Total $589,872,376 $543,296,525 $920,667,600 $1,592,154,865 $2,063,501,453 249.82%
ND Q3 Taxable Sales and Purchases

Bakken DevelopmentThrough November 2012, building permit valuations in the three largest North Dakota oil cites were all up more than 35% year over year.
As the chart to the left illustrates, The Bakkenhas seen substantial growth within the development and construction loan industry as compared to the rest of the United States. The two most recent quarters of data, from 3/31/2012 to 9/30/2012, show construction and land development loans increasing 64%, from $107 million to $176 million.
Feb 2013
City 2011 2012 YoY % ∆Dickinson $120,034,296 $277,111,723 130.86%Minot $154,055,000 $207,614,236 34.77%Williston $276,221,999 $388,734,625 40.73%
Total Building Permits - YTD November 2012Total Valuation

Bakken EmploymentAs of November 2012
Bakken oil counties employee 83.9 thousand people, 23.1% more than last year and 60% more than in 2009.
Feb 2013
Bakken oil counties unemployment rate was 1.7%, a .5% drop from a year earlier.
• North Dakota ranked #1 in the 2012 Gallop Job Creation Index with a +34 net hiring index. This is the best in the country and 16 points above the national average. North Dakota has led this index 4 years running.

ND Job SustainabilityNorth Dakota expects to sustain 50,000+ oil industry jobs through 2050.• This is a 2000+ workforce increase in sustained oil industry jobs as compared to previous updates.
TODAY
Courtesy of North Dakota Department of Mineral Resources, January 2013
Feb 2013

2012 ND Housing Needs AssessmentIn September 2012, North Dakota State University recently completed the 2012 North Dakota Statewide Housing Needs Assessment.
The assessment has three main goals:1. Put prospective on the current housing situation based on recent trends2. Forecast housing demand based on shifts in population3. Place the forecast of housing demand within the context of projected
residential change
We are going to focus on 5 counties that encompass 6 of the major oil cities in The Bakken
McKenzie (Watford City)Mountrail (Stanley)Stark (Dickinson)Ward (Minot)Williams (Williston, Tioga)
Feb 2013
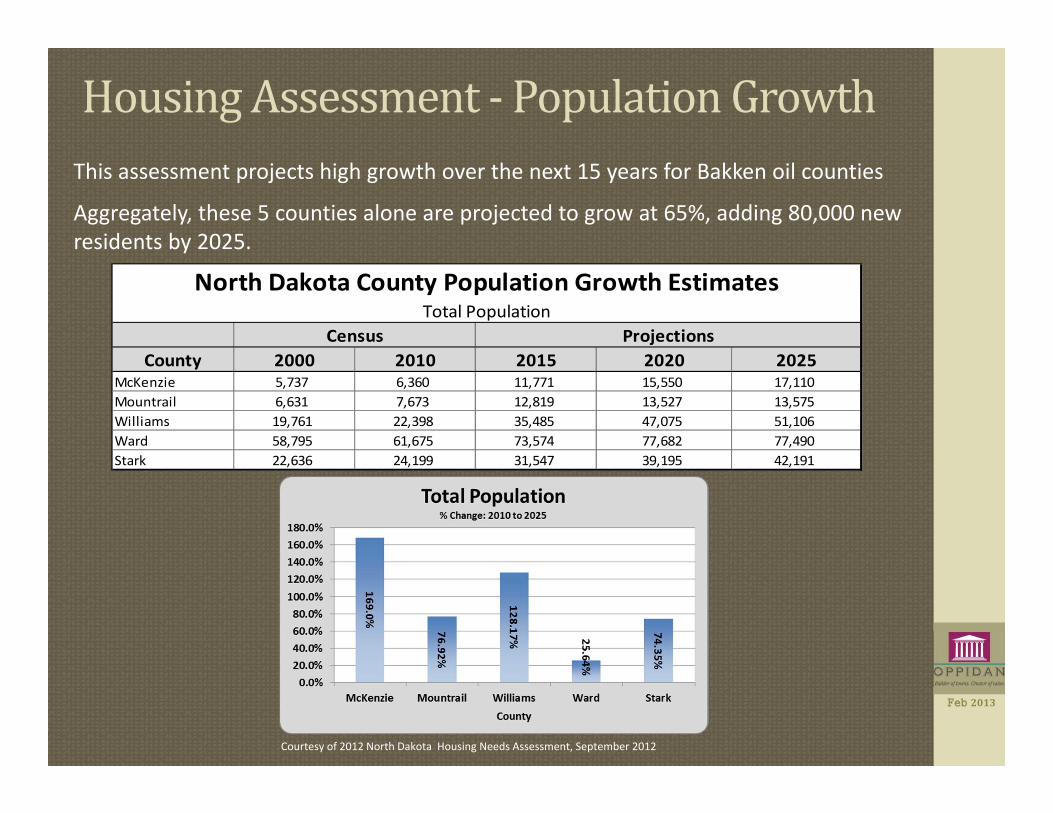
Housing Assessment - Population GrowthThis assessment projects high growth over the next 15 years for Bakken oil counties
Aggregately, these 5 counties alone are projected to grow at 65%, adding 80,000 new residents by 2025.
Feb 2013
County 2000 2010 2015 2020 2025McKenzie 5,737 6,360 11,771 15,550 17,110Mountrail 6,631 7,673 12,819 13,527 13,575Williams 19,761 22,398 35,485 47,075 51,106Ward 58,795 61,675 73,574 77,682 77,490Stark 22,636 24,199 31,547 39,195 42,191
North Dakota County Population Growth EstimatesTotal Population
Census Projections
Courtesy of 2012 North Dakota Housing Needs Assessment, September 2012

Housing Assessment - Housing GrowthLooking at Housing Supply Model 2, which is based on projected demand, these 5 counties will add 38,589 housing units by 2025, a 71% overall increase.
Courtesy of 2012 North Dakota Housing Needs Assessment, September 2012
Feb 2013
County 2000 2010 2015 2020 2025McKenzie 2,719 3,019 5,576 7,192 7,856Mountrail 3,438 3,949 5,836 6,135 6,199Williams 9,680 10,184 16,863 22,457 25,042Ward 25,097 26,294 33,290 35,692 35,251Stark 9,722 10,528 13,821 16,947 18,215
North Dakota County Housing Supply ProjectionsTotal Housing Units
Census Projections

Pad Drilling Technology
• Pad Drilling Technology is creating many benefits• Continental Resources says a 6 will pad reduced costs by 35%• Whiting Petroleum says its saves up to $2MM per well• Smaller surface footprint and less infrastructure• Increased efficiencies – Companies looking at 14, 16 and 18 well pads
Feb 2013
• Pad drilling is becoming a widely used technique in The Bakken. It’s a series of vertical wells drilled in very close proximity. Each well has long horizontal laterals that are drilled and fracked in multiple parallel and/or diverging directions thus opening up large portions of tight formations from a single surface location.

Oil Production AdvancementsContinental Resources (CLR) is the #1 Oil Producer in the Williston Basin with 1.1MM net acres as of 12.20.12
As this slide from a recent CLR presentation shows, they have discovered additional zones into the three forks that increases the OOIP by 57%. TF2 and TF3 test wells have shown strong initial results.
Link to the Continental Resources January 2013 Investor Updatehttp://phx.corporate-ir.net/phoenix.zhtml?c=197380&p=irol-EventDetails&EventId=4889415
Feb 2013

New Dickinson Oil Refinery
Feb 2013
Dickinson, North Dakota is planning to build a new oil refinery capable of processing 20,000 barrels per day of Bakken crude – 7,000 barrels being diesel fuel.• The project is a joint venture between MDU Resources and Calumet Specialty
Products Partners.• 318 Acre site, 4 miles west of Dickinson• Have final permits approved and plan to begin construction by early April 2013• Cost approximately $300 Million and take 20 months to build.• Create 300-500 temporary jobs during construction and 100 permanent jobs upon
completion.• Will utilize the new $30 Million Dickinson wastewater treatment facility currently
under construction by buying some 175,000 gallons of treated water daily.
According to the U.S. Energy Information Administration, the last major refinery built in the lower 48 states began operating in 1977 in Garyville, La.
The Tesoro refinery in Mandan is currently North Dakota’s only refinery
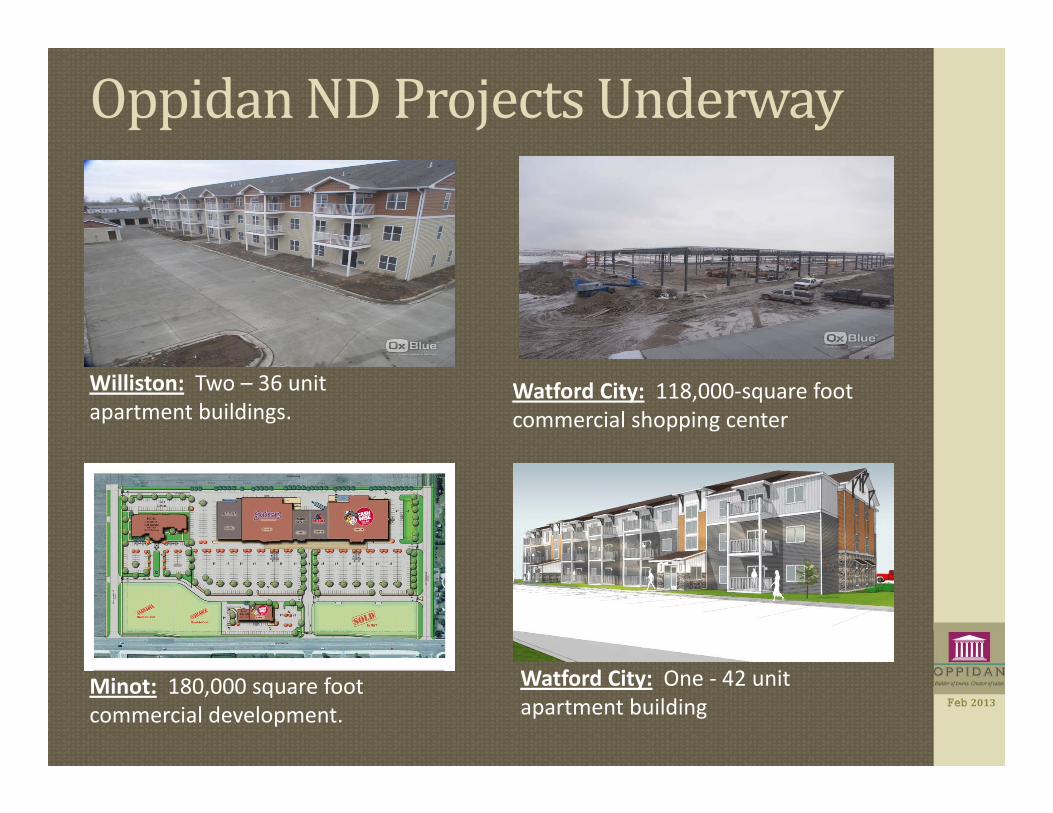
Oppidan ND Projects Underway
Feb 2013Minot: 180,000 square foot commercial development.
Williston: Two – 36 unit apartment buildings.
Watford City: One - 42 unit apartment building
Watford City: 118,000-square foot commercial shopping center

Sourceshttps://www.dmr.nd.gov/oilgas/presentations/HouseApprop01102013.pdf
2012 North Dakota Statewide Housing Needs Assessment
https://www.dmr.nd.gov/
North Dakota Association of Builders
The Dickinson Press
http://www.clr.com/
http://www.minneapolisfed.org/publications_papers/fedgazette/oil/index.cfm
North Dakota Office of the Tax Commissioner
http://www.petroleumnews.com/pntruncate/174494056.shtml
http://www.gallup.com/Feb 2013