bajaj auto investor meet - bajaj auto- latest bikes, · hero m&m maruti tvs ... our business...
TRANSCRIPT

Bajaj Auto
Investor Meet
1

Bajaj Auto
Investor Meet
2

Bajaj Auto
Investor Meet
3
Agenda
Welcome Address 11:00 – 11:20
KTM Sports Motorcycles 11:20 – 11:40
Domestic Motorcycles 11:40 – 12:00
Commercial Vehicles 12:00 – 12:20
International Business 12:20 – 12:50
Q & A 12:50 – 13:30
Bajaj Auto
Investor Meet
4
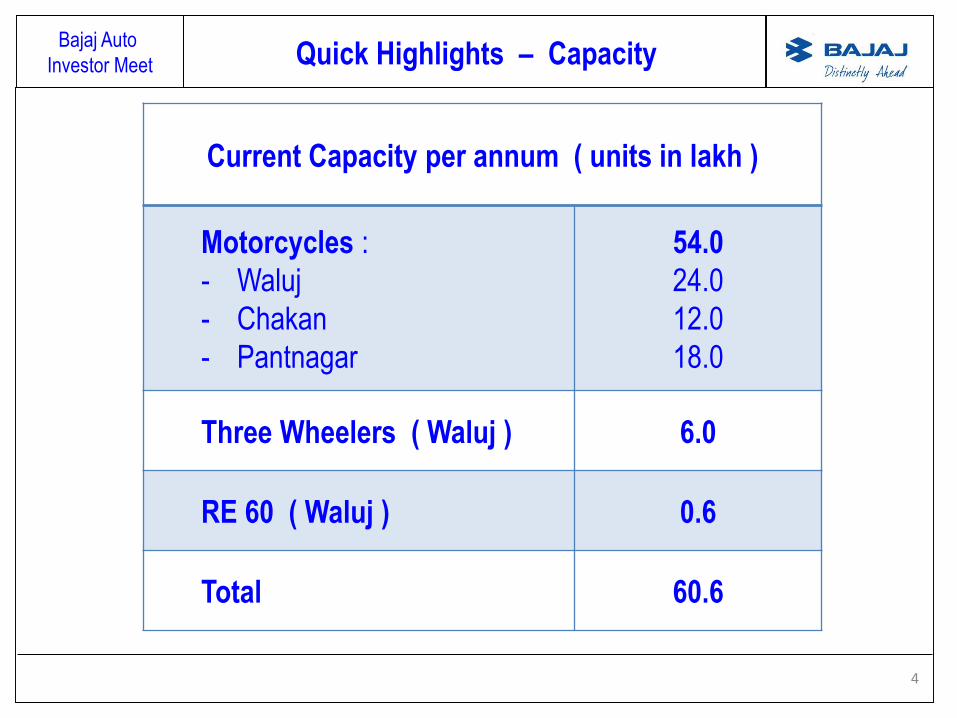
Quick Highlights – Capacity
Current Capacity per annum ( units in lakh )
Motorcycles :
- Waluj
- Chakan
- Pantnagar
54.0
24.0
12.0
18.0
Three Wheelers ( Waluj ) 6.0
RE 60 ( Waluj ) 0.6
Total 60.6

Bajaj Auto
Investor Meet
5
Quick Highlights – Volumes
Apr-Nov 14 Apr-Nov 13 Growth
Total Volumes :
Motorcycles 23,72,882 23,36,467 2%
Three Wheelers 3,66,406 3,00,052 22%
Total 27,39,288 26,36,519 4%
Of which Exports :
Motorcycles 10,88,460 8,66,726 26%
Three Wheelers 1,96,880 1,68,620 17%
Total 12,85,340 10,35,346 24%

Bajaj Auto
Investor Meet
6
Quick Highlights – Financials
( ` in crore )Q1
FY15
Q2
FY15
H1
FY15
H1
FY14
Net Sales &
Operating Income5,299 5,993 11,292 10,171
Total Expenditure 4,261 4,745 9,006 7,911
EBITDA 1,038 1,248 2,286 2,260
% 19.6 20.8 20.2 22.2
PBT * 1,075 1,172 2,247 2,250
PAT * 740 853 1,593 1,575
* before exceptional item 2nd highest in the history
of the company

Bajaj Auto
Investor Meet
7
In Q2 / FY15 we achieved our
— Highest ever Turnover – ` 6,077 crores
— Highest ever Exports – ` 2,736 crores
— Highest ever Operating EBITDA – ` 1,248 crores
— Highest ever Exports, in units – 5,19,093
— Highest ever Commercial Vehicle, in units – 1,56,429
Quick Highlights – Achievements
Ranked in “ top 100 Worlds Most Innovative Companies 2014 ” and
“ 5th in top 50 most valuable Indian brands 2014 ”

Bajaj Auto
Investor Meet
8
Quick Highlights – Operating Margin %
3.3 3.2 3.5 3.1 3.54.0 4.2
4.4
4.0
4.6
4.2
1.5
4.3
8.4
6.37.4 7.1
5.3
6.27.2
9.79.1 9.1
9.710.6
9.910.6
4.8
9.4
7.5
10.1
8.2 8.0
9.510.4
9.59.0
9.5 9.3
12.4
18.1 17.919.0
17.9
20.4
22.3
20.219.7
18.3
19.7
0.0
5.0
10.0
15.0
20.0
25.0
Q1FY13
Q2FY13
Q3FY13
Q4FY13
Q1FY14
Q2FY14
Q3FY14
Q4FY14
Q1FY15
Q2FY15
BAL *
Hero
M&M
Maruti
TVS
* excluding Mark-to-Market gain / loss and CSR spends

Bajaj Auto
Investor Meet
9
Quick Highlights – Operating ROCE
137%
160%
206%*
100%
120%
140%
160%
180%
200%
220%
FY13 FY14 H1FY15
* before exceptional item

Bajaj Auto
Investor Meet
10
Quick Highlights – ROCE
Funds Blocked with Excise & Sales tax authorities
Excise – Receivable on Exports ` 378 crore
VAT Refund Receivable ` 615 crore
Total as on 30th September 2014 ` 993 crore
Excluding these, our operating ROCE would have been ~400% !!
Bajaj Auto
Investor Meet
32
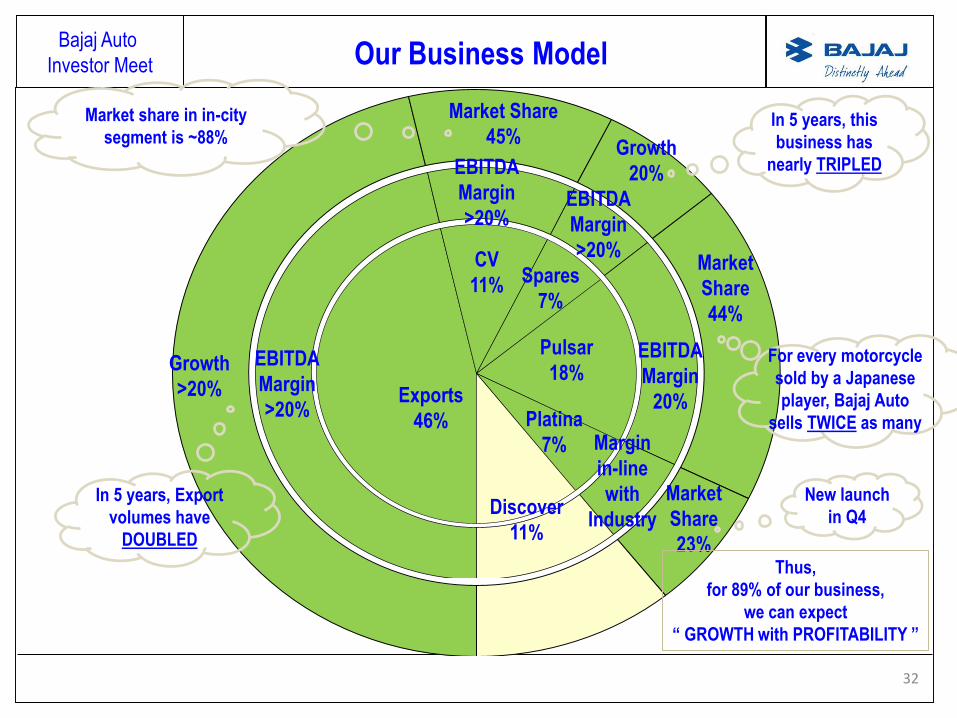
Our Business Model
Exports
46%
EBITDA
Margin
>20%
CV
11%
EBITDA
Margin
>20%
Market Share
45%
Spares
7%
EBITDA
Margin
>20%
Growth
20%
Pulsar
18%EBITDA
Margin
20%
Market
Share
44%
Platina
7% Margin
in-line
with
Industry
Market
Share
23%
Discover
11%
Market share in in-city
segment is ~88%
Growth
>20%
In 5 years, Export
volumes have
DOUBLED
In 5 years, this
business has
nearly TRIPLED
For every motorcycle
sold by a Japanese
player, Bajaj Auto
sells TWICE as many
Thus,
for 89% of our business,
we can expect
“ GROWTH with PROFITABILITY ”
New launch
in Q4
Bajaj Auto
Investor Meet
33
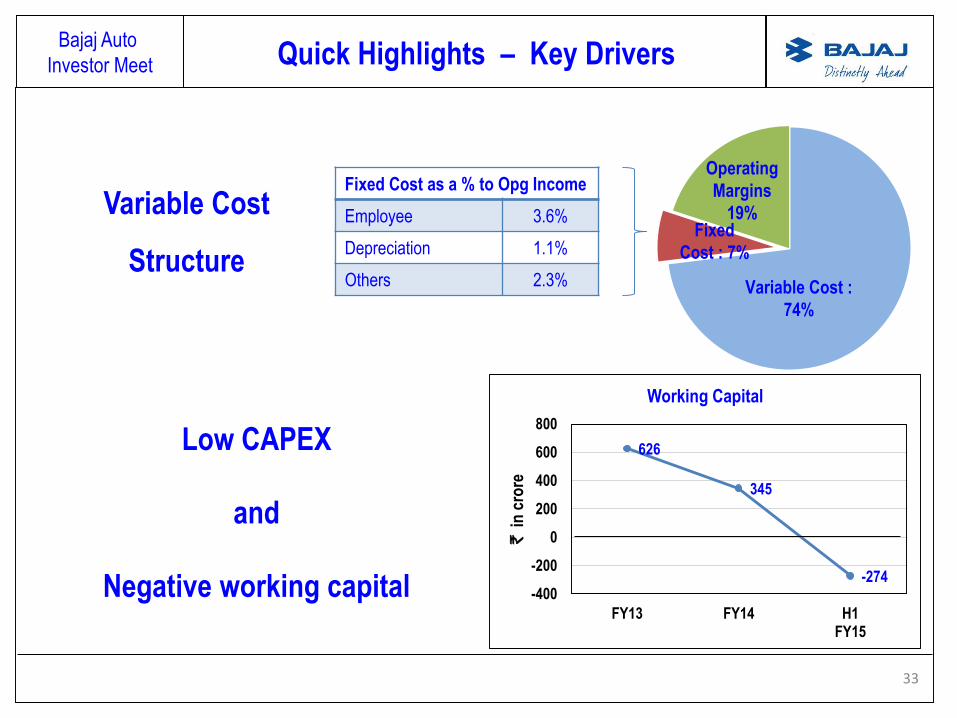
Quick Highlights – Key Drivers
Variable Cost
StructureVariable Cost :
74%
Fixed
Cost : 7%
Operating
Margins
19%
Fixed Cost as a % to Opg Income
Employee 3.6%
Depreciation 1.1%
Others 2.3%
Low CAPEX
and
Negative working capital
626
345
-274-400
-200
0
200
400
600
800
FY13 FY14 H1FY15
`in
cro
re
Working Capital
Bajaj Auto
Investor Meet
34
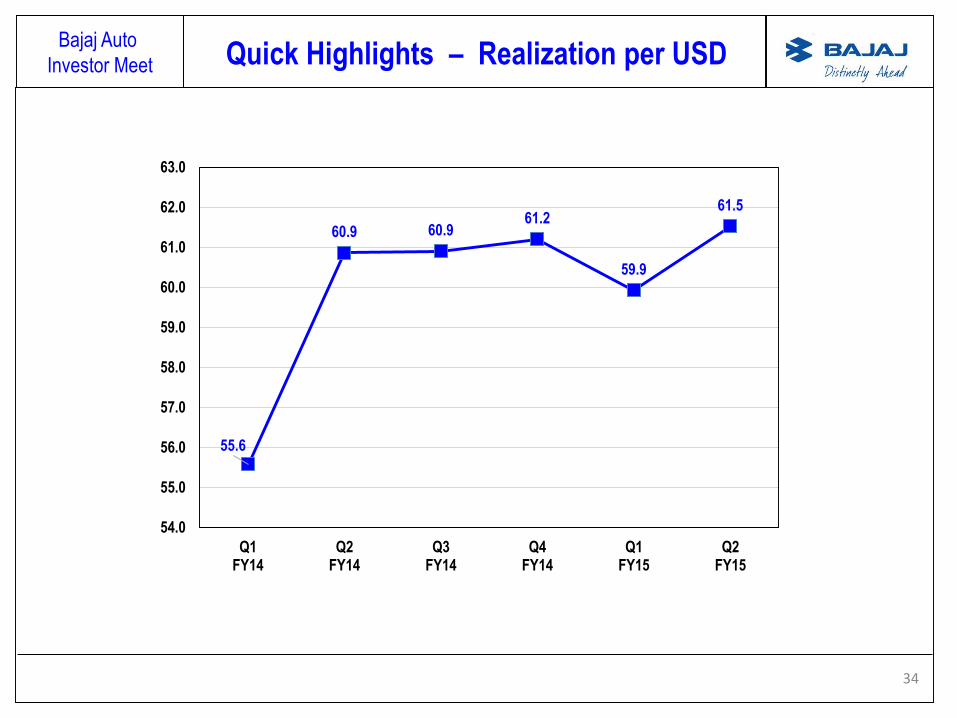
Quick Highlights – Realization per USD
55.6
60.9 60.961.2
59.9
61.5
54.0
55.0
56.0
57.0
58.0
59.0
60.0
61.0
62.0
63.0
Q1FY14
Q2FY14
Q3FY14
Q4FY14
Q1FY15
Q2FY15

Bajaj Auto
Investor Meet
35
Quick Highlights – Surplus
Surplus Cash, as on 30th September 2014 : ` 8,313 crore
Investments in FMP : ` 4,940 crore
` in croreH1
FY15
H1
FY14
Dividend received - 27
Treasury Income 136 187
Income from FMP 120 -
Total 256 214

36
KTM

37
Bajaj Auto
Investor Meet VOLUME TREND (Units Per Month)
889
698
507 468549
814
1427
947
1221
1629
2538
2176
0
500
1000
1500
2000
2500
3000
Q1/FY13 Q2/FY13 Q3/FY13 Q4/FY13 Q1/FY14 Q2/FY14 Q3/FY14 Q4/FY14 Q1/FY15 Q2/FY15 Oct 14 Nov 14
38
Bajaj Auto
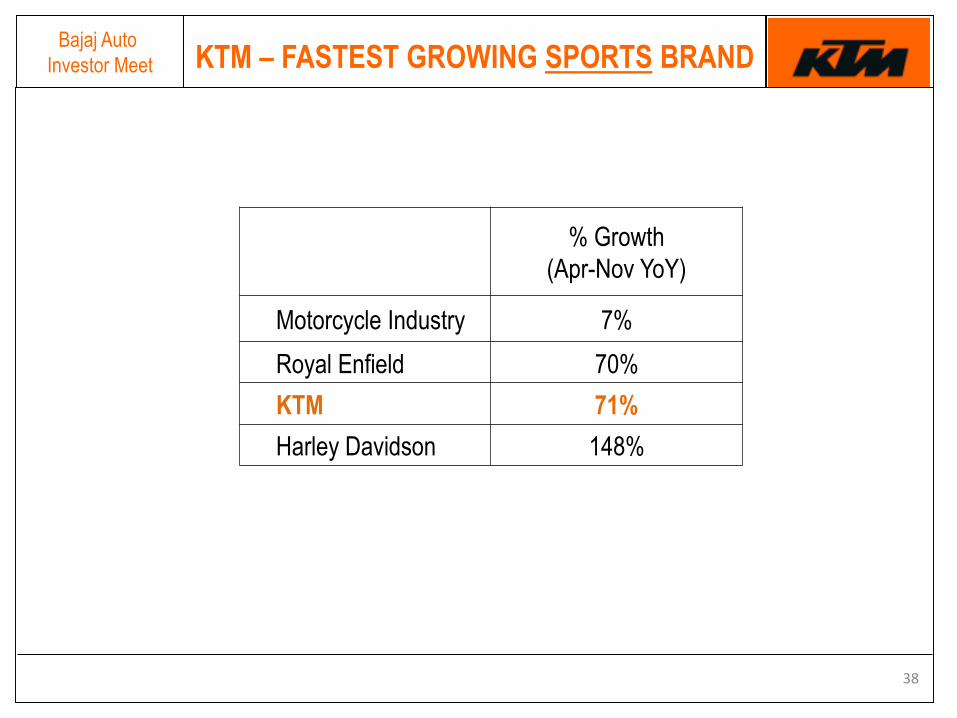
Investor Meet KTM – FASTEST GROWING SPORTS BRAND
% Growth
(Apr-Nov YoY)
Motorcycle Industry 7%
Royal Enfield 70%
KTM 71%
Harley Davidson 148%

39
Bajaj Auto
Investor Meet MARKET SHARE : BY VOLUME
54%56%
54%56%
51%48%
46%
51%
57% 57%
44%
37%
30% 31%
34% 33%
37% 38%
27% 27%
14%16%
18%
25%
16%13%
12% 11% 12%14%
27%22%
28%27%
38%
38%
0%
10%
20%
30%
40%
50%
60%
70%
Q1 (12-13)
Q2(12-13)
Q3(12-13)
Q4(12-13)
Q1 (13-14)
Q2 (13-14)
Q3 (13-14)
Q4 (13-14)
Q1 (14-15)
Q2(14-15)
Oct-14 Nov'14
Yamaha R15 MS% Honda CBR MS% KTM MS%

40
Bajaj Auto
Investor Meet KTM V/S PREMIUM MOTORCYCLE BRANDS
Premium Brands Market Share
KTM 75%
Harley Davidson 18%
Triumph 3%
Others 5%
Total 100%

41
Bajaj Auto
Investor Meet KTM NETWORK
33
51
6371
105
150
0
20
40
60
80
100
120
140
160
Jan'12 Jul'12 Jan'13 Jul'13 Jan'14 Sept'14
150 3S Facilities
128 Dealers
112 Towns
Oct’14

42
Bajaj Auto
Investor Meet REPRESENTATIVE KTM DEALERSHIPS

43
Bajaj Auto
Investor Meet PAN INDIA PRESENCE

44
Bajaj Auto
Investor Meet KTM TRACK DAYS
Authentic Race Track Experience for Core customers -
Nos. Done: 3
45
Bajaj Auto
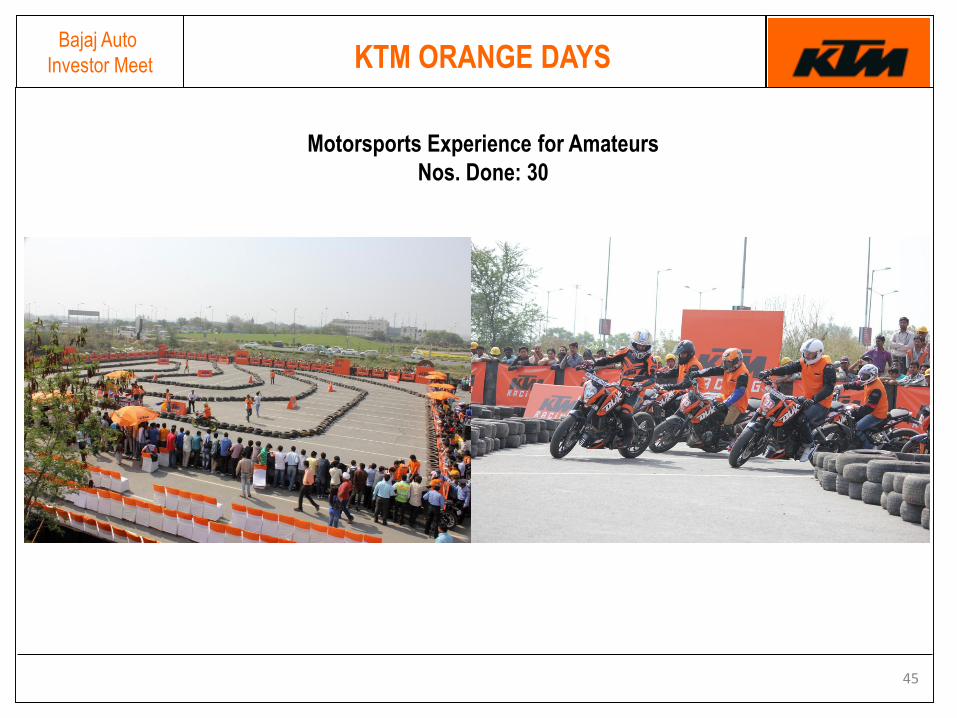
Investor Meet KTM ORANGE DAYS
Motorsports Experience for Amateurs
Nos. Done: 30

46
Bajaj Auto
Investor Meet ORANGE TOURS
Overnight Touring & Camping Experience for the ‘Non-Racer’ Customer
Nos. Done: 11

47
Bajaj Auto
Investor Meet SUMMARY
Market Share: No.1
Volume Growth: No.1 Sports Motorcycle Brand
Dealer Network: No. 1
Brand Engagement: No.1
20% Revenue Growth for top 20% of BAL Dealers

48
Bajaj Auto
Investor Meet
Premium
Sports
Mileage
Total Motorcycle Industry – 9.3 Lacs units per month
1.7 Lacs Units per month
7.6 Lacs Units per month
750 Units per month
* As of April’14-November’14
0.1%
Motorcycle Industry
18%
82%

49
Bajaj Auto
Investor Meet
Premium
Sports
Mileage
750 Units per month0.1%
Motorcycle Industry
• Rs. 2.5 Lac +
• Multi Cylinders
• Premium Features
18%
82%

50
Bajaj Auto
Investor Meet
Premium
Sports
Mileage
750 Units per month0.1%
Motorcycle Industry
• Rs. 2.5 Lac +
• Multi Cylinders
• Premium Features
Harley-Davidson
Kawasaki
Triumph
18%
82%
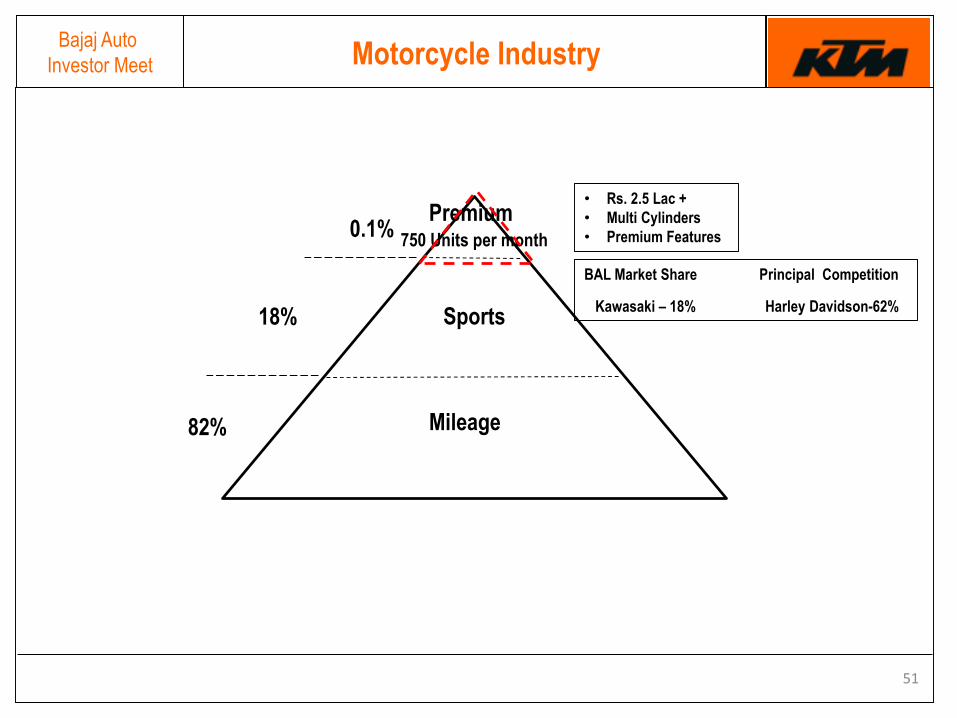
51
Bajaj Auto
Investor Meet
Premium
Sports
Mileage
750 Units per month0.1%
Motorcycle Industry
• Rs. 2.5 Lac +
• Multi Cylinders
• Premium Features
BAL Market Share Principal Competition
Kawasaki – 18% Harley Davidson-62%18%
82%
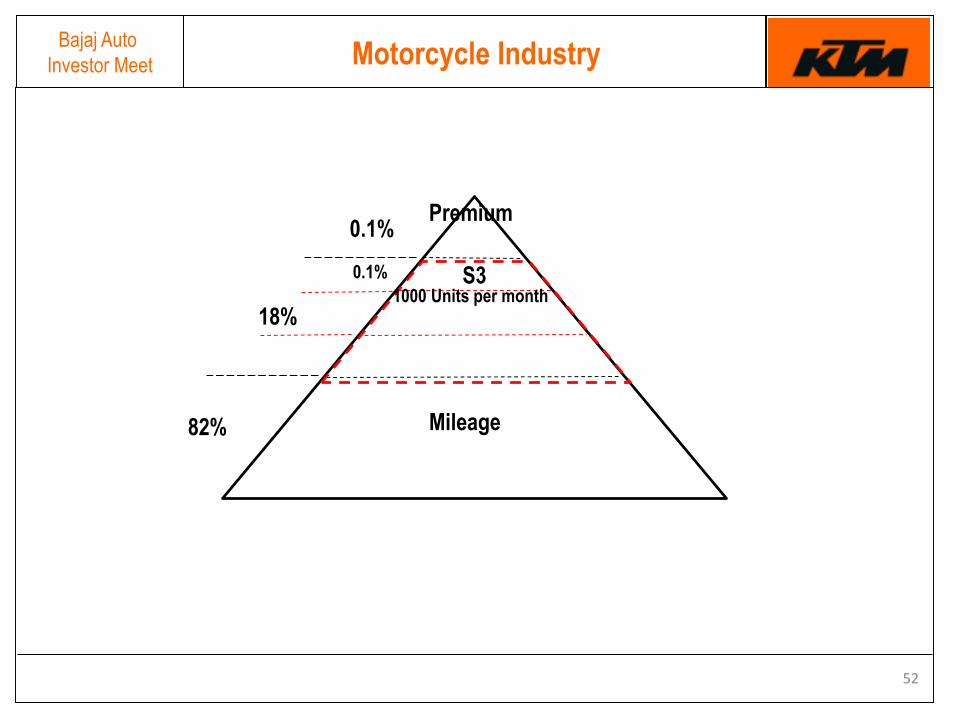
52
Bajaj Auto
Investor Meet
Premium
S3
Mileage
0.1%
Motorcycle Industry
0.1%
1000 Units per month
18%
82%

53
Bajaj Auto
Investor Meet
Premium
S3
Mileage
0.1%
Motorcycle Industry
0.1%
1000 Units per month
S3• Rs. 1.75Lac - Rs. 2.5 Lacs
• 250 cc – 500 cc
• Advanced Features
18%
82%

54
Bajaj Auto
Investor Meet
Premium
S3
Mileage
0.1%
Motorcycle Industry
0.1%
1000 Units per month
S3• Rs. 1.75Lac - Rs. 2.5 Lacs
• 250 cc – 500 cc
• Advanced Features
KTM
Royal Enfield
Honda
18%
82%

55
Bajaj Auto
Investor Meet
Premium
S3
Mileage
0.1%
Motorcycle Industry
0.1%
1000 Units per month
S3• Rs. 1.75Lac - Rs. 2.5 Lacs
• 250 cc – 500 cc
• Advanced Features
BAL Market Share Principal Competition
KTM – 53% Royal Enfield – 32%
18%
82%

56
Bajaj Auto
Investor Meet
Premium
S3
Mileage
0.1%
Motorcycle Industry
0.1%
30000 Units per month
S23.4%
S2• Rs. 1Lac - Rs. 1.75Lacs
• 150cc-500cc
• Sports/Touring Features18%
82%

57
Bajaj Auto
Investor Meet
Premium
S3
Mileage
18%
82%
0.1%
Motorcycle Industry
0.1%
30000 Units per month
S23.4%
S2• Rs. 1Lac - Rs. 1.75Lacs
• 150cc-500cc
• Sports/Touring Features
KTM
Yamaha
Royal Enfield

58
Bajaj Auto
Investor Meet
Premium
S3
Mileage
18%
82%
0.1%
Motorcycle Industry
0.1%
30000 Units per month
S23.4%
S2• Rs. 1Lac - Rs. 1.75Lacs
• 150cc-500cc
• Sports/Touring Features
BAL Market Share Principal Competition
KTM – 4% Royal Enfield – 84%
Yamaha – 10%

59
Bajaj Auto
Investor Meet
Premium
S3
Mileage
18%
82%
0.1%
Motorcycle Industry
0.1%
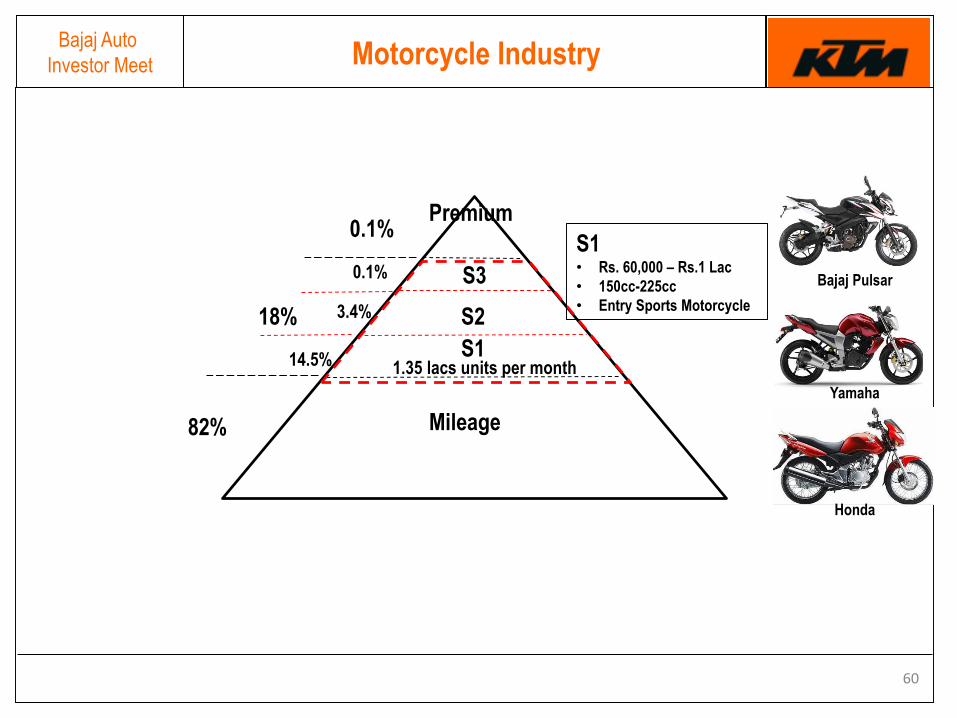
1.35 lacs units per month
S23.4%
S114.5%
S1• Rs. 60,000 – Rs.1 Lac
• 150cc-225cc
• Entry Sports Motorcycle
60
Bajaj Auto
Investor Meet
Premium
S3
Mileage
18%
82%
0.1%
Motorcycle Industry
0.1%
1.35 lacs units per month
S23.4%
S114.5%
Bajaj Pulsar
Yamaha
Honda
S1• Rs. 60,000 – Rs.1 Lac
• 150cc-225cc
• Entry Sports Motorcycle

61
Bajaj Auto
Investor Meet
Premium
S3
Mileage
18%
82%
0.1%
Motorcycle Industry
0.1%
1.35 lacs units per month
S23.4%
S114.5%
S1• Rs. 60,000 – Rs.1 Lac
• 150cc-225cc
• Entry Sports Motorcycle
BAL Market Share Principal Competition
Bajaj Pulsar – 44% Honda – 16%
Yamaha – 17%

62
Bajaj Auto
Investor Meet
Premium
S3
Mileage
18%
82%
0.1%
Motorcycle Industry
0.1%
1.35 lacs units per month
S23.4%
S114.5%
30000 units per month
1000 units per month
BAL Market Share Principal Competition
Kawasaki – 18% Harley-Davidson – 62%
KTM – 53% Royal Enfield – 32%
KTM – 4%Royal Enfield – 84%
Yamaha – 10%
Bajaj Pulsar- 44%Honda -16%
Yamaha -17%
750 units per month

Bajaj Auto
Investor Meet
63
Bajaj Auto
Investor Meet
64
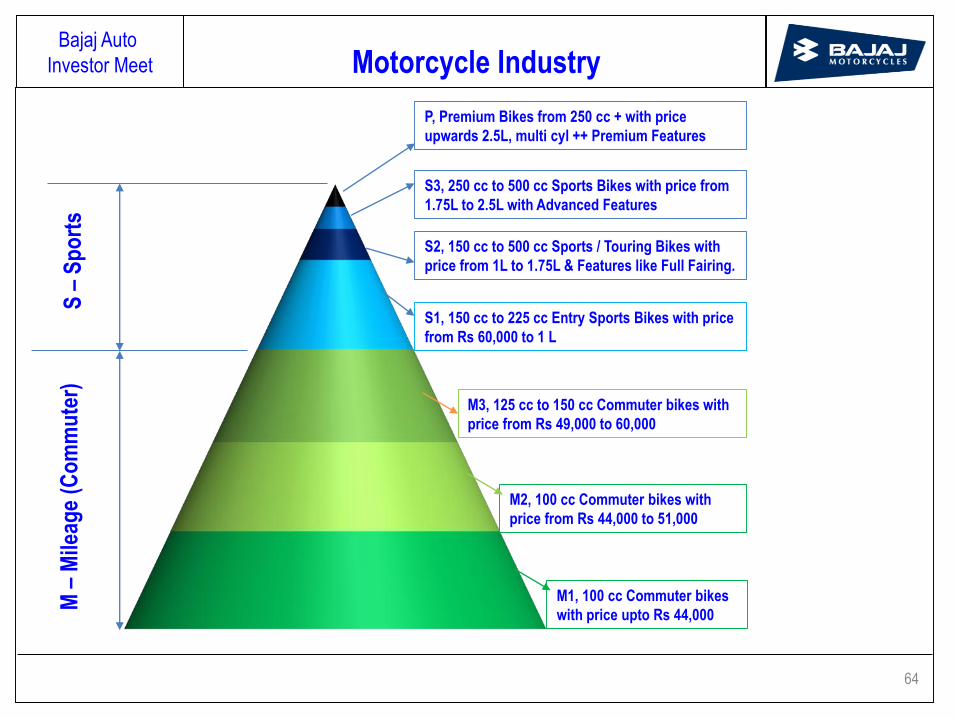
Motorcycle Industry
S2, 150 cc to 500 cc Sports / Touring Bikes with
price from 1L to 1.75L & Features like Full Fairing.
S1, 150 cc to 225 cc Entry Sports Bikes with price
from Rs 60,000 to 1 L
M3, 125 cc to 150 cc Commuter bikes with
price from Rs 49,000 to 60,000
M2, 100 cc Commuter bikes with
price from Rs 44,000 to 51,000
M1, 100 cc Commuter bikes
with price upto Rs 44,000
S3, 250 cc to 500 cc Sports Bikes with price from
1.75L to 2.5L with Advanced Features
P, Premium Bikes from 250 cc + with price
upwards 2.5L, multi cyl ++ Premium Features
M –
Mile
age
(Co
mm
ute
r)S
–S
po
rts

Bajaj Auto
Investor Meet Motorcycle Industry 8 years
S, (46,058),
9%, (68,500)
M3, (86,934),
18%, (46,000)
M2, (145,392),
30%, (44,000)
M1, (207,173),
43%, (35,000)
FY 06
S, (166,429),
18%, (97,500)
M3, (179,203),
19%, (51,000)
M2, (393,194),
42%, (48,000)
M1, (193,726),
21%, (42,000)
FY 15
Segment, (Volume AVPM),
Share of Industry, Average Price (Largest Selling Variant)
65

Bajaj Auto
Investor Meet
19% 21%
48% 42%
FY 14 FY 15
M1 M2
0%
10%
20%
30%
40%
50%
60%
70%
80%
90%
100%
FY 06 FY 07 FY 08 FY 09 FY 10 FY 11 FY 12 FY 13 FY 14 FY 15
S
M3
M2
M1
66
Industry Segment Changes - 8 years
Bajaj Auto
Investor Meet
67
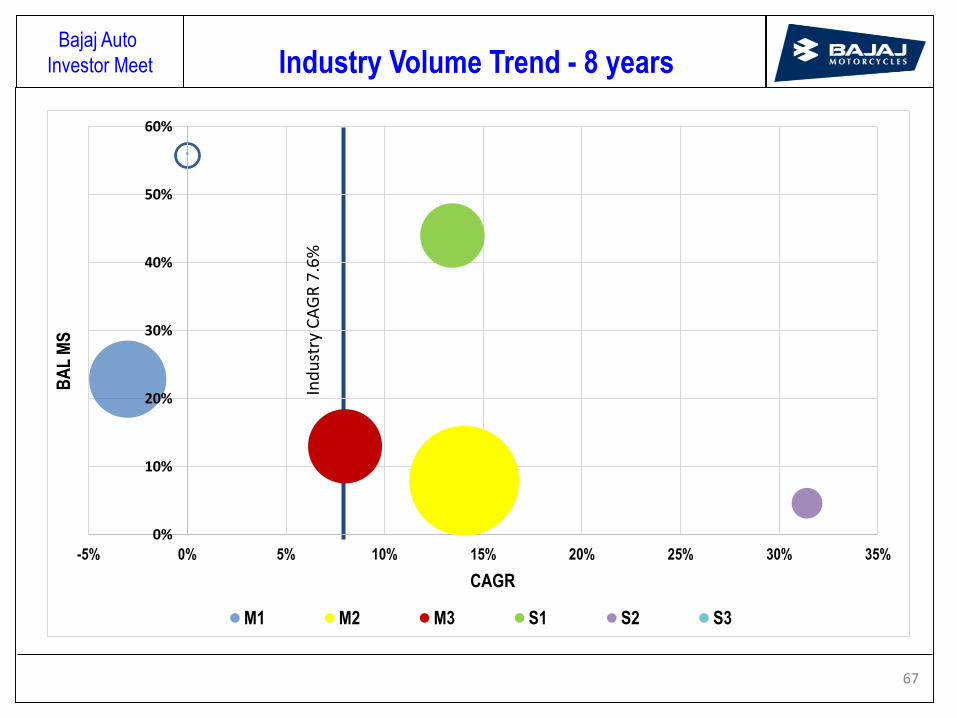
Industry Volume Trend - 8 years
0%
10%
20%
30%
40%
50%
60%
-5% 0% 5% 10% 15% 20% 25% 30% 35%
BA
L M
S
CAGR
M1 M2 M3 S1 S2 S3
Ind
ust
ry C
AG
R 7
.6%
Bajaj Auto
Investor Meet
68
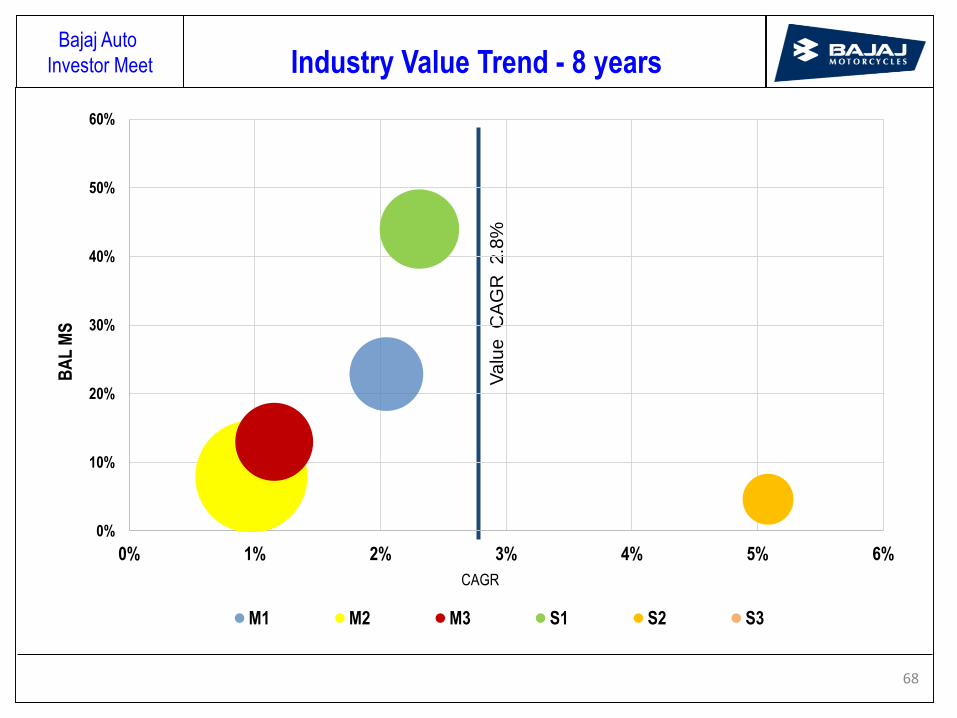
Va
lue
C
AG
R
2.8
%
Industry Value Trend - 8 years
0%
10%
20%
30%
40%
50%
60%
0% 1% 2% 3% 4% 5% 6%
BA
L M
S
CAGR
M1 M2 M3 S1 S2 S3
Bajaj Auto
Investor Meet
69
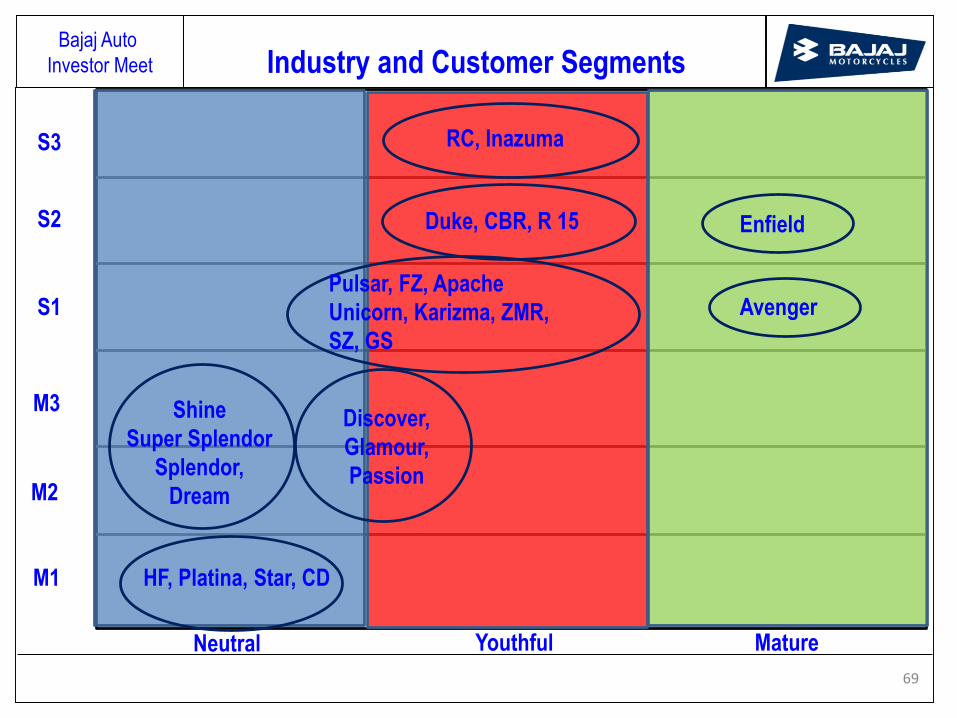
S2
S1
M3
M2
M1
S3
Neutral Youthful Mature
HF, Platina, Star, CD
Shine
Super Splendor
Splendor,
Dream
Discover,
Glamour,
Passion
Avenger
Enfield
RC, Inazuma
Pulsar, FZ, Apache
Unicorn, Karizma, ZMR,
SZ, GS
Duke, CBR, R 15
Industry and Customer Segments

Bajaj Auto
Investor Meet
70
PULSAR
MS 44%
BAL 59,759
IND 134,731
DISCOVER
MS 10%
BAL 54,791
IND 572,397
PLATINA
MS 23%
BAL 44,312
IND 193,726
PULSAR
MS 45%
BAL 53,461
IND 119,774
PLATINA
MS 24%
BAL 38,317
IND 162,100
DISCOVER
MS 14%
BAL 82,141
IND 569,283
FY14 FY15 YTD
Current Position
24%
27%30%
27%
19%17%
22%24%
17%
14%
10% 9%7% 8% 8%
11% 11%
8%
45%42% 41%
45%
39%
45% 46%
51%
46%
0%
10%
20%
30%
40%
50%
60%
FY 14 Apr May Jun Jul Aug Sep Oct Nov
Market Share - Segment wise
M1 M2+M3 S1

Bajaj Auto
Investor Meet
71
S2
S1
M3
M2
M1
S3
Neutral Youthful Mature
Platina
Discover
AvengerPulsar
X?
Y?
India : Plan

Bajaj Auto
Investor Meet
72
PULSAR
MS 52%
BAL 77,500
IND 150,000
DISCOVER
MS 12%
BAL 70,000
IND 575,000
PLATINA
MS 35%
BAL 70,000
IND 200,000
FY14 TargetFY15 YTD
MS 20%
BAL 173,919
IND 850,694
MS 18%
BAL 158,862
IND 900,853
MS 24%
BAL 217,500
IND 925,000
India : Target
M1, 23%
M1, 35%
M2+M3, 10%M2+M3, 12%
S1, 44%
S1, 52%
0%
10%
20%
30%
40%
50%
60%
Market Share - Segment wise ( Target )
PULSAR
MS 45%
BAL 53,461
IND 119,774
PLATINA
MS 24%
BAL 38,317
IND 162,100
DISCOVER
MS 14%
BAL 82,141
IND 569,283
PULSAR
MS 44%
BAL 59,759
IND 134,731
DISCOVER
MS 10%
BAL 54,791
IND 572,397
PLATINA
MS 23%
BAL 44,312
IND 193,726
Bajaj Auto
Investor Meet
73

Bajaj Auto
Investor Meet
An idea whose time has come again.
XYZ Motors
REvolution
on 4 wheels
Bajaj Auto
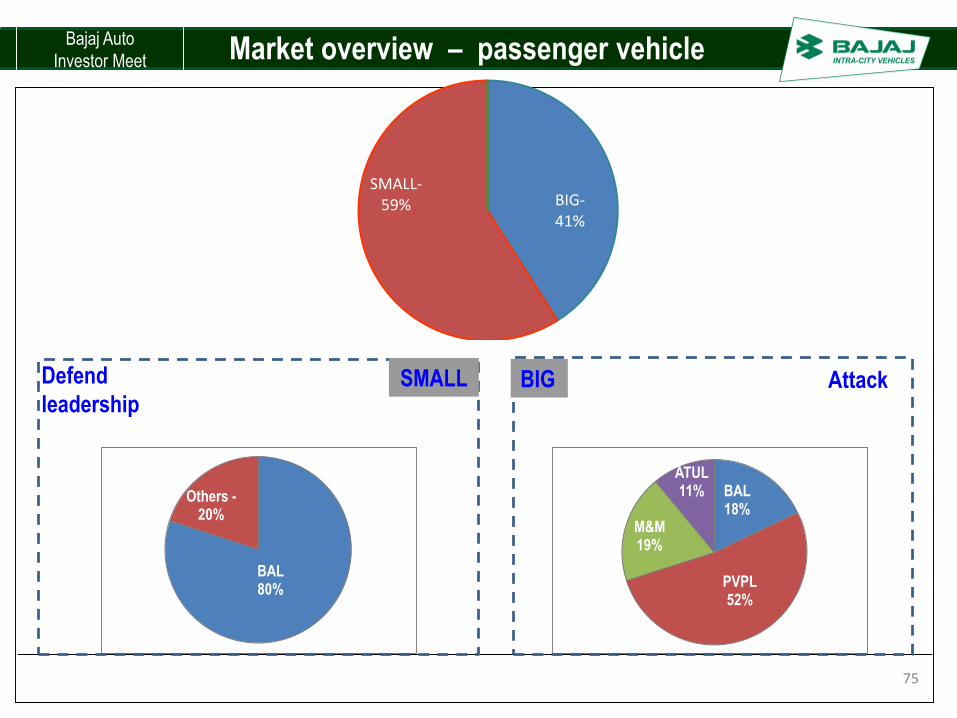
Investor Meet Market overview – passenger vehicle
BAL 80%
Others -20%
BAL 18%
PVPL52%
M&M19%
ATUL11%
AttackDefend
leadershipSMALL BIG
BIG-41%
SMALL-59%
75

Bajaj Auto
Investor Meet
Goal
Maintain absolute stability and dominance of market share of
over 80%(monopoly>73.9%) in small three wheelers.
PRODUCTS
– RE COMPACT
• Efficiency: 15% lower running & operating cost.
• Performance: dramatic reduction in NVH, superior ergonomics for driver,
comfortable ride for user.
– RE OPTIMA
• Efficiency: fuel efficient + space
• Performance: dramatic reduction in NVH, superior ergonomics for driver,
comfortable ride for user.
Small Vehicles
76
Bajaj Auto
Investor Meet
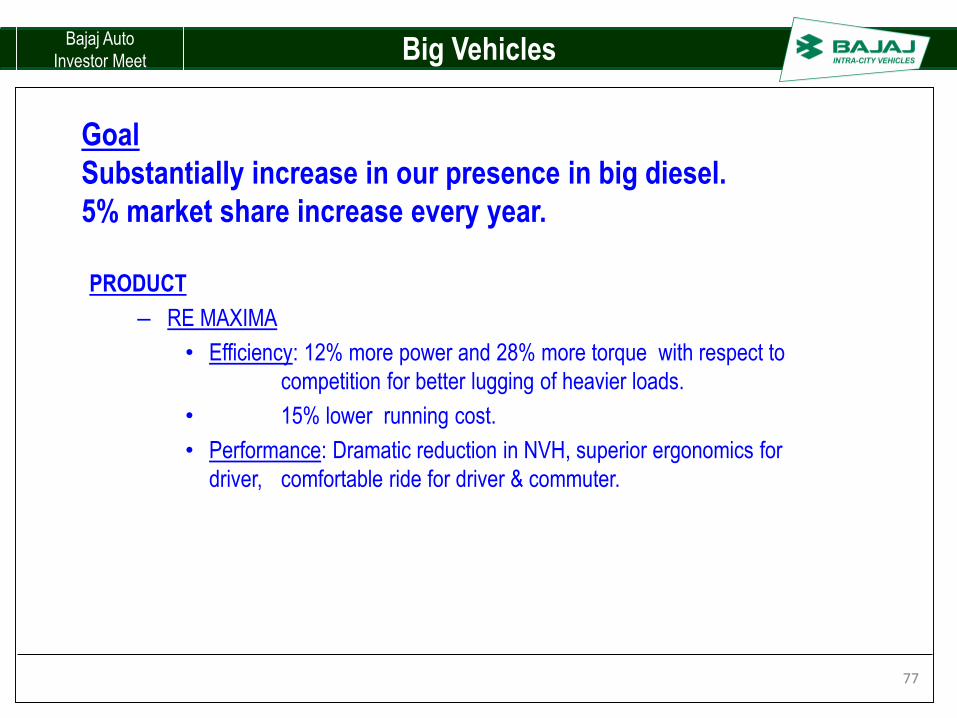
Goal
Substantially increase in our presence in big diesel.
5% market share increase every year.
PRODUCT
– RE MAXIMA
• Efficiency: 12% more power and 28% more torque with respect to
competition for better lugging of heavier loads.
• 15% lower running cost.
• Performance: Dramatic reduction in NVH, superior ergonomics for
driver, comfortable ride for driver & commuter.
Big Vehicles
77

Bajaj Auto
Investor Meet
Big vehicles growth
11%
9%
80%
2012-13
Sustanance Scale up Seeding
17%
17%
66%
2014-15 YTD
Sustanance Scale up Seeding
0%
10%
20%
30%
40%
50%
Sustanance Scale up Seeding
37%
24%
8%
43%
31%
12%
2012-13
2014-15 YTD
Industry category growth
Market share growth
Big Vehicles Growth
78
Bajaj Auto
Investor Meet
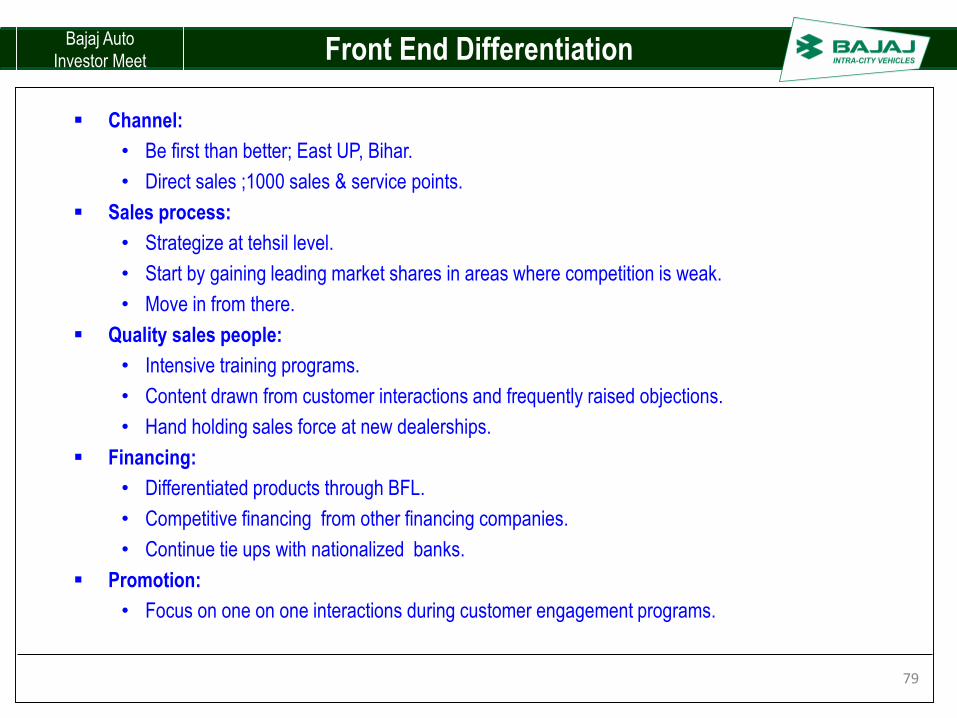
Channel:
• Be first than better; East UP, Bihar.
• Direct sales ;1000 sales & service points.
Sales process:
• Strategize at tehsil level.
• Start by gaining leading market shares in areas where competition is weak.
• Move in from there.
Quality sales people:
• Intensive training programs.
• Content drawn from customer interactions and frequently raised objections.
• Hand holding sales force at new dealerships.
Financing:
• Differentiated products through BFL.
• Competitive financing from other financing companies.
• Continue tie ups with nationalized banks.
Promotion:
• Focus on one on one interactions during customer engagement programs.
Front End Differentiation
79

Bajaj Auto
Investor Meet

Bajaj Auto
Investor Meet
1.Smarter employment.
2.Smart Taxi for smaller towns.
3.First/Last-mile connectivity for transport heads.
4.Self-drive rental.
5.Smart school cart.
6.Green transport for future cities.
7.Safe transport .
RE60 - Opportunities
81

Bajaj Auto
Investor Meet RE 60 – pitch to taxi fleet owners
There are at least 10 major radio Cab/Taxi operators in India.
• Meru, Wings, Mega Cabs, Easy Cabs, Ola, Uber, Taxi for
Sure, TAB Cabs, Fast Track, Sawaari.
Fare war has started among them with some of them offering
services at fares that are close to auto- rickshaw, clearly not
sustainable.
RE 60 offers an opportunity to offer these fares while being
economically viable.
RE 60 also offers an opportunity to expand their customer
base at the present locations and also add other tier 2 and tier
3 towns to their operations.
82
Bajaj Auto
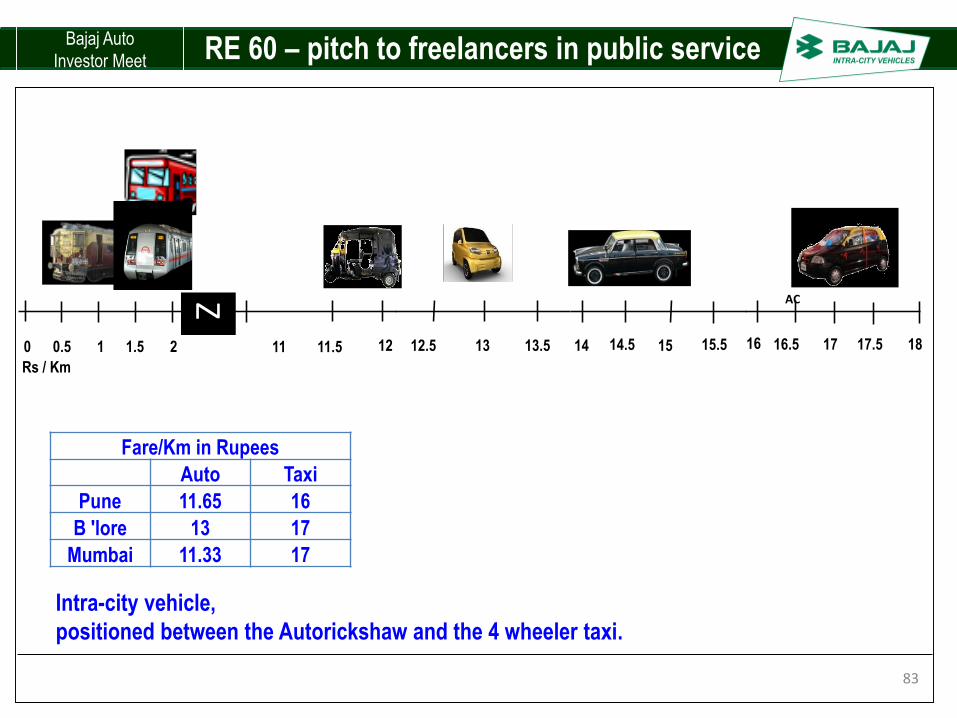
Investor Meet RE 60 – pitch to freelancers in public service
Intra-city vehicle,
positioned between the Autorickshaw and the 4 wheeler taxi.
AC
0 0.5 1 1.5 2
Rs / Km
Z
11 11.5 12 12.5 13 13.5 14 14.5 15 15.5 16 16.5 17 17.5 18
Fare/Km in Rupees
Auto Taxi
Pune 11.65 16
B 'lore 13 17
Mumbai 11.33 17
83

Bajaj Auto
Investor Meet
• ARAI Testing
ARAI has almost completed the testing of the vehicle for type approval
• Writ petitions
Writ petitions have been filed by auto rickshaw union/ Individuals in the
High courts .
The prayer in all the Writs is to stay the implementation of notification GSR
99E pertaining to Quadricycles.
The Government of India is filing a transfer petition in the supreme court
seeking to transfer all cases to the supreme court on the plea that the
matter being the same and pertaining to legislation, it should be heard at
the apex court.
RE 60 - Current Status
84

Bajaj Auto
Investor Meet
89,959 49,637
129,063
268,659 196,000
196,000 250,000
250,000
-
100,000
200,000
300,000
400,000
500,000
600,000
700,000
800,000
3W Pass. 3W Cargo 4W Pass. 4W Cargo Total SCV
BAL absent 3W Competitors BAL
62%
Bajaj Auto, currently, participates in 62% of the small commercial vehicle industry consisting of –
All 3 wheelers, Tata Ace, Magic, Venture, Zip, and Iris, M&M Maxximo, Gio
Outlook 2015
85

Bajaj Auto
Investor Meet
86
International Business

Bajaj Auto
Investor Meet
87
3,245.81
4,551.75
6,603.97 6,752.43
8,210.36
10,310.00
-
2,000
4,000
6,000
8,000
10,000
12,000
FY10 FY11 FY12 FY13 FY14 FY15 (E)
726
972
1,255 1,275 1,299
1,622
-
500
1,000
1,500
2,000
FY10 FY11 FY12 FY13 FY14 FY15(E)
Th
ou
san
ds
Annual variations but on the growth track
165
231
312
254 261 294
-
50
100
150
200
250
300
350
FY10 FY11 FY12 FY13 FY14 FY15(E)
Th
ou
san
ds
3 Wheeler Exports (Vol.)Motorcycle Exports (Vol.)
Total Exports (in INR Cr)Total Exports (in USD Mn)
CAGR: 17%
FY15 : 25%
CAGR: 12%
FY15 : 13%
681.72
974.61
1,369.02 1,309.07 1,330.04
1,620.00
-
200
400
600
800
1,000
1,200
1,400
1,600
1,800
FY10 FY11 FY12 FY13 FY14 FY15 (E)
CAGR: 19%
FY15 : 22%
CAGR: 26%
FY15 : 26%

Bajaj Auto
Investor Meet
88
165
231
312
254 261
294
-
50
100
150
200
250
300
350
FY10 FY11 FY12 FY13 FY14 FY15 (E)
Th
ou
san
ds
73
188
255236 226
256
0
50
100
150
200
250
300
FY10 FY11 FY12 FY13 FY14 FY15 (E)
Th
ou
san
ds
180
233 251 223 235
396
-
50
100
150
200
250
300
350
400
450
FY10 FY11 FY12 FY13 FY14 FY15 (E)
Th
ou
san
ds
… Across all Segments and Brands…
Utility: Boxer and CT
Commuter: Discover and PlatinaSports: Pulsar
3 Wheeler: RE
445 546
748 813 834
962
-
200
400
600
800
1,000
1,200
FY10 FY11 FY12 FY13 FY14 FY15 (E)
Th
ou
san
ds
CAGR: 28%
SOB : 13%
CAGR: 17%
SOB : 23%
CAGR: 12%
SOB : 14%
CAGR: 17%
SOB : 50%
Bajaj Auto
Investor Meet
89
119
176
248 274 272
309
-
50
100
150
200
250
300
350
FY10 FY11 FY12 FY13 FY14 FY15 (E)
Th
ou
san
ds
77
113
133
116108 103
0
20
40
60
80
100
120
140
FY10 FY11 FY12 FY13 FY14 FY15 (E)
Th
ou
san
ds
184
261286
237267
467
0
100
200
300
400
500
FY10 FY11 FY12 FY13 FY14 FY15(E)
Th
ou
san
ds
346421
588648 652
743
-
100
200
300
400
500
600
700
800
FY10 FY11 FY12 FY13 FY14 FY15(E)
Th
ou
san
ds
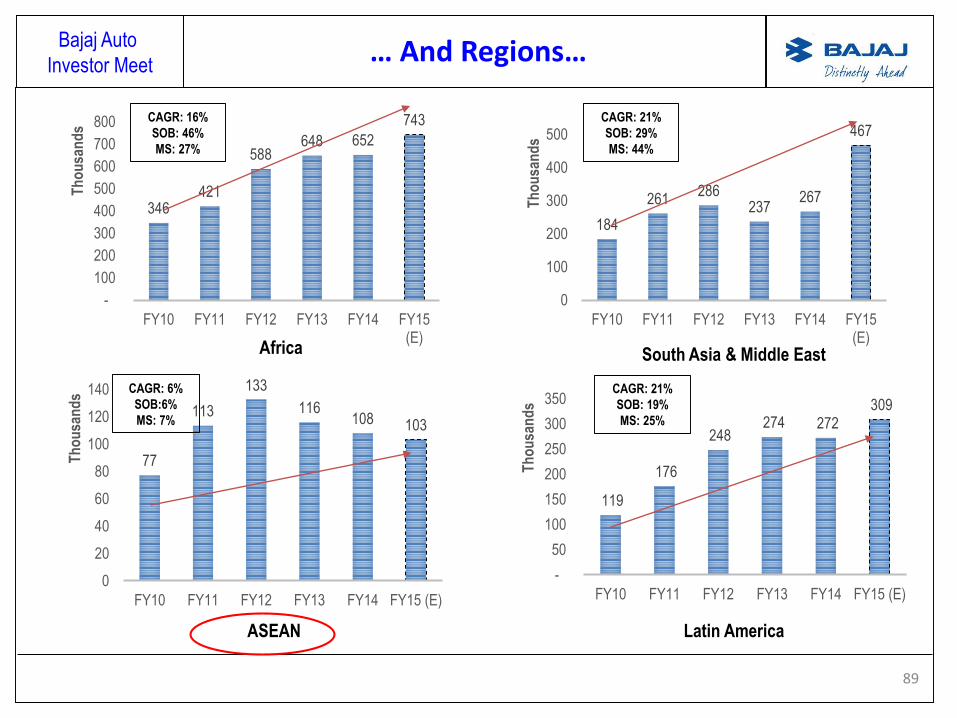
… And Regions…
ASEAN
South Asia & Middle EastAfrica
CAGR: 16%
SOB: 46%
MS: 27%
CAGR: 21%
SOB: 29%
MS: 44%
CAGR: 21%
SOB: 19%
MS: 25%
CAGR: 6%
SOB:6%
MS: 7%
Latin America

Bajaj Auto
Investor Meet
90
990 1,010
1,259 1,212
950
-
200
400
600
800
1,000
1,200
1,400
FY10 FY11 FY12 FY13 FY14 FY15 (E)
35
48
58 58
70
95
-
10
20
30
40
50
60
70
80
90
100
FY10 FY11 FY12 FY13 FY14 FY15 (E)
Th
ou
san
ds
109
156
221
160 159 167
0
50
100
150
200
250
FY10 FY11 FY12 FY13 FY14 FY15 (E)
Th
ou
san
ds
20
26
33 35
30 31
-
5
10
15
20
25
30
35
40
FY10 FY11 FY12 FY13 FY14 FY15 (E)
Th
ou
san
ds
… Including 3 Wheelers……
South Asia & Middle EastAfrica
CAGR: 22%
SOB: 32%
MS: 51%
CAGR: 9%
SOB: 57%
MS:95%
CAGR: 9%
SOB: 10%
MS: 76%
Latin AmericaASEAN

Bajaj Auto
Investor Meet
91
Ensuring 85% Sales from leadership markets
Region CountryMarket
Share *Position
South Asia
And
Middle East
Sri Lanka 80% 1
Bangladesh 54% 1
Nepal 40% 1
Egypt 28% 1
Iran 28% 1
ASEAN Philippines 30% 1
Africa
Uganda 88% 1
South Sudan 58% 1
Ethiopia 49% 1
Nigeria 42% 1
Congo 33% 1
Kenya 25% 1
Angola 29% 1
Tanzania 16% 2
Latin America
Colombia 44% 1
Guatemala 34% 1
Nicaragua 46% 1
Honduras 18% 2
Peru 19% 2
Region CountryMarket
Share *Position
South Asia
And
Middle East
Sri Lanka 91% 1
Bangladesh 98% 1
Egypt 98% 1
Africa
Sudan 97% 1
Nigeria 52% 1
Ethiopia 51% 1
Latin America
Mexico 92% 1
Central America 82% 1
Peru 83% 1
Colombia 64% 1
MCY: Market Share CV: Market Share
*Market Shares based on BAL internal estimates

Bajaj Auto
Investor Meet
92
Looking ahead
Opportunities
• Most markets are still Under-penetrated
• Market Share has room to grow, particularly opp Chinese
• Uptrading trend towards better bikes• Higher cc
• Better styling
Chinese47%
Japanese
27%
BAL23%
Indian3%
Challenges
• Volatile currency situation
• Retail pricing
• Availability of forex
• Uncertain political and economic times
• Duties
• Trade restrictions
• Interruptions
• Competitive intensity
• Emerging markets focus by Japanese
• India sourcing
• Chinese companies under pressure in domestic
17
80
42
0
20
40
60
80
100
Africa Asia and ME Latin America
Penetration M/C per 1000
persons
It’s The Best of Times and The Worst of Times !

Bajaj Auto
Investor Meet
93
Strategic Approach
II. User: A Better Experience
I. Geography: Wide & Deep
III. Distributor: Management Excellence
• Double in 4-5 years
• Equal or better than Corporate
EBITDA
• Over 90% business from no. 1 or 2
markets

Bajaj Auto
Investor Meet
94
Existing Market Type No of Countries Market Size FY14 BAL FY14 BAL M.S.
Mature ( > 5years) 25 4.2 mn 1.18 mn 28 %
Nascent ( 2-5 years) 7 0.5 mn 95,552 20 %
New ( 0-2 years) 16 0.95 mn 23,620 3 %
Total 48 5.65 mn 1.3 mn 23 %
Scope for expansion in current markets
Existing Markets : Increase share
Bajaj Auto
Investor Meet
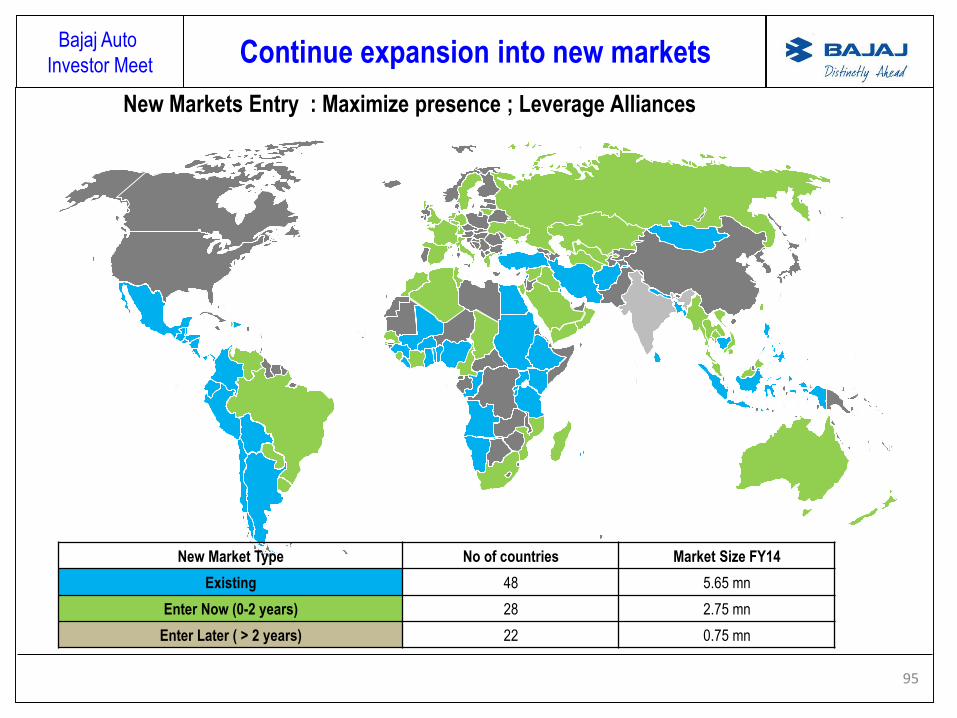
95
New Market Type No of countries Market Size FY14
Existing 48 5.65 mn
Enter Now (0-2 years) 28 2.75 mn
Enter Later ( > 2 years) 22 0.75 mn
Continue expansion into new markets
New Markets Entry : Maximize presence ; Leverage Alliances

Bajaj Auto
Investor Meet
96
Geography: New market entry is on track
Market Information
Business Case
Identify Partner
Agreement ShipmentRetail
Launch
Market Assessment Partner Identification Entry
MCY
OUTLOOK
3W
OUTLOOK
13 new markets
14 new markets2 new markets5 new markets
5 new markets25 new markets
Bajaj Auto
Investor Meet
97
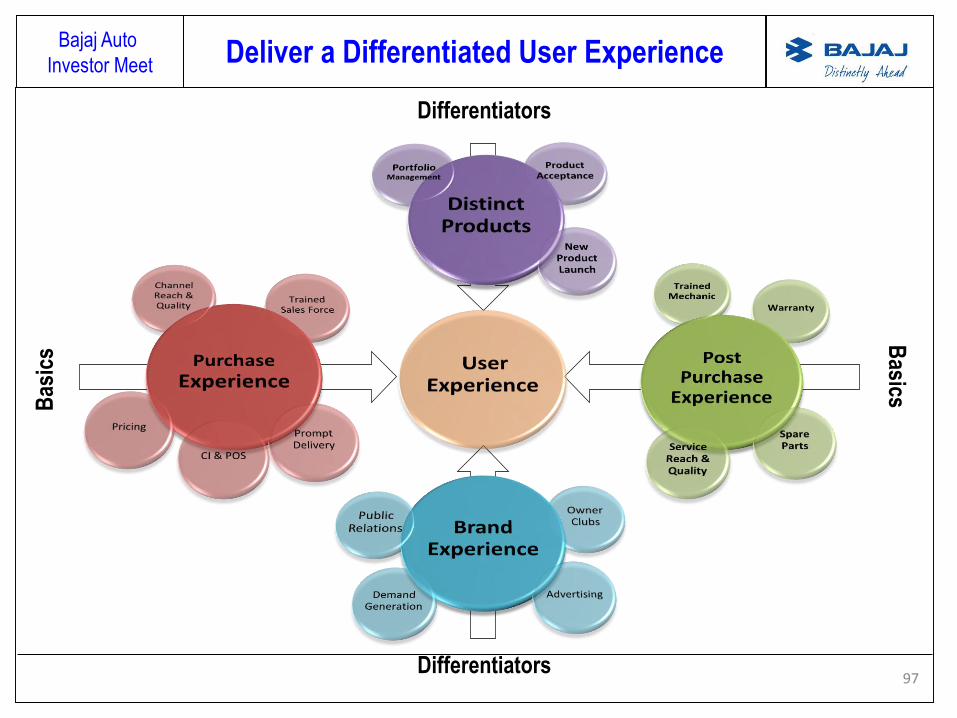
Deliver a Differentiated User Experience
Differentiators
Differentiators
Bas
ics
Basics
Bajaj Auto
Investor Meet
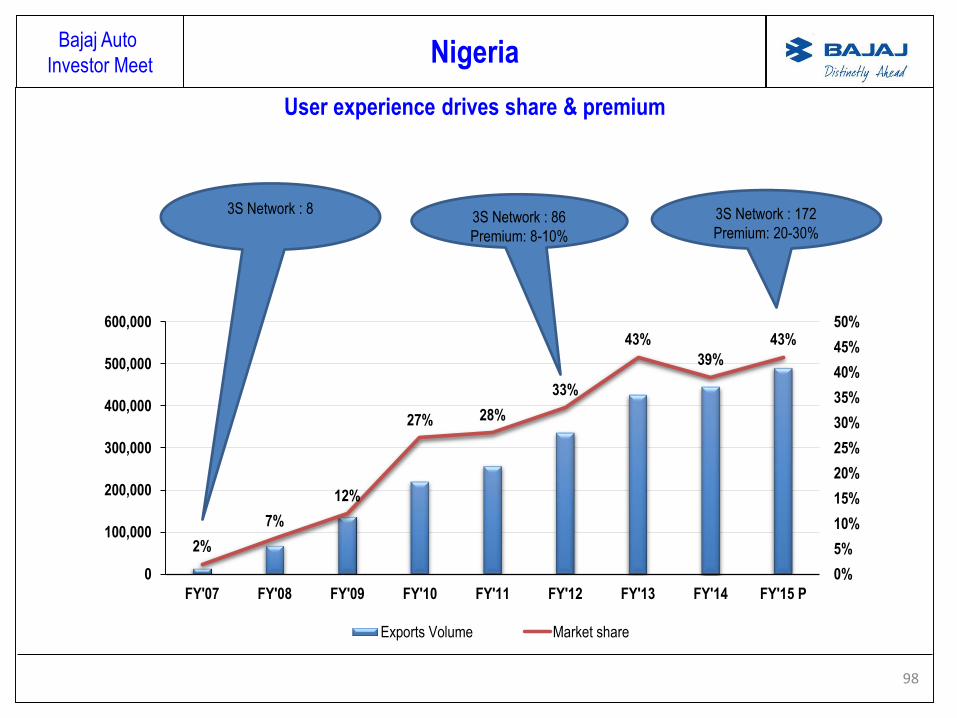
98
Nigeria
2%
7%
12%
27% 28%
33%
43%
39%
43%
0%
5%
10%
15%
20%
25%
30%
35%
40%
45%
50%
0
100,000
200,000
300,000
400,000
500,000
600,000
FY'07 FY'08 FY'09 FY'10 FY'11 FY'12 FY'13 FY'14 FY'15 P
Exports Volume Market share
3S Network : 83S Network : 86
Premium: 8-10%
3S Network : 172
Premium: 20-30%
User experience drives share & premium

Bajaj Auto
Investor Meet
99
LATAM
0%
10%
20%
30%
40%
50%
60%
Colombia CA Mexico Peru Argentina LATAM
53%
56%
35%
51%
36%
50%
28%
7%
34%
21%
30%
25%
7% 7%
16%18%
31%
10%12%
30%
15%
10%
3%
15%
Bajaj Yamaha Honda Others
User Experience builds leadership for Pulsar
Sport Segment Market Shares in key markets
Bajaj Auto
Investor Meet
100
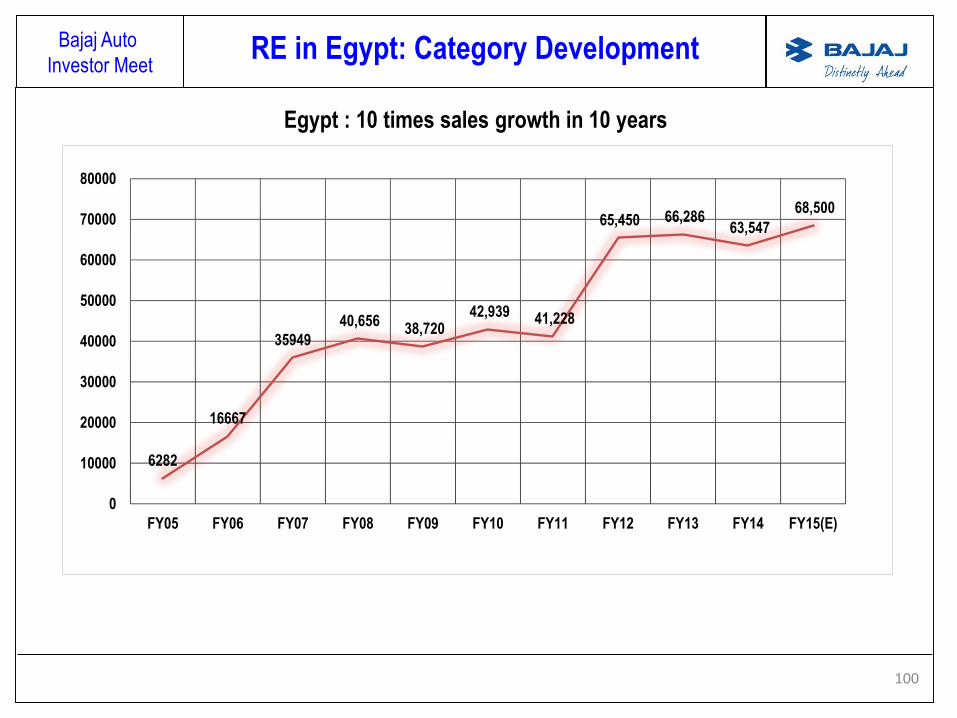
6282
16667
35949
40,656 38,720
42,939 41,228
65,450 66,286 63,547
68,500
0
10000
20000
30000
40000
50000
60000
70000
80000
FY05 FY06 FY07 FY08 FY09 FY10 FY11 FY12 FY13 FY14 FY15(E)
RE in Egypt: Category Development
Egypt : 10 times sales growth in 10 years

Bajaj Auto
Investor Meet
101
Distributor – Management Excellence
• Business model of choice:• Entrepreneurial energy and expertise
• Allows rapid entry and growth
• Needs high level of management input
• Strategy and Plans are jointly agreed.• Regular Review Process
• Distributor manages supply chain & executes• From Trading to Distribution to Customer Care
• Configure local assembly operations on cost and legislation
• Bajaj provides commercial, marketing and technical inputs• Support is based on market type : New; Nascent; Mature
85% of the Sales come from distributors who have been with BAL for > 10 years
ONE TEAM
Bajaj Auto
Investor Meet
102
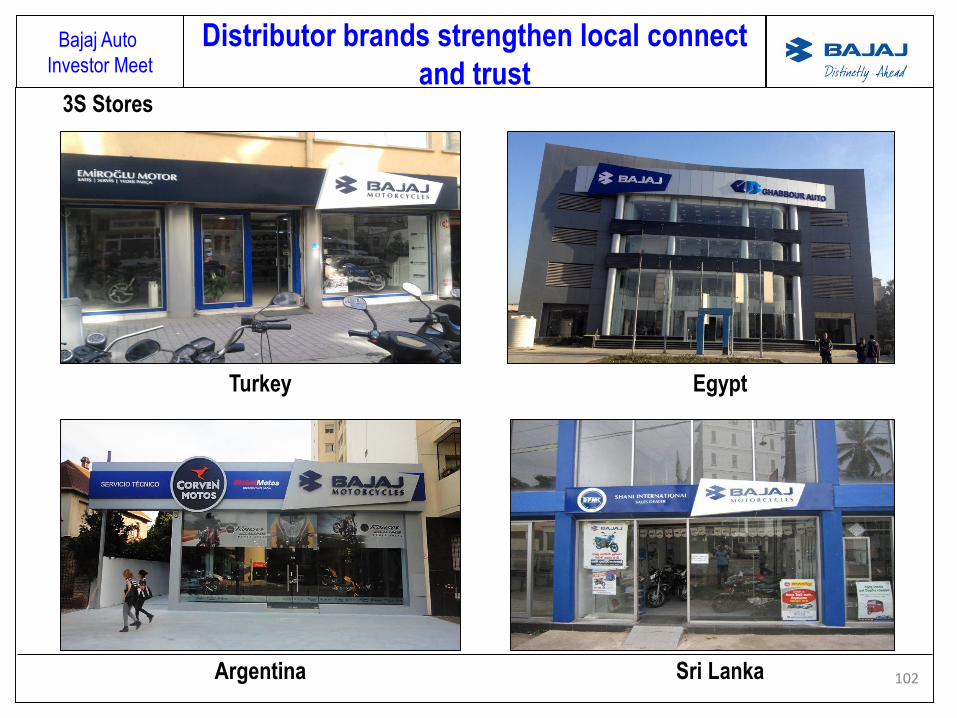
Distributor brands strengthen local connect
and trust
Turkey
Argentina
3S Stores
Egypt
Sri Lanka
Bajaj Auto
Investor Meet
103
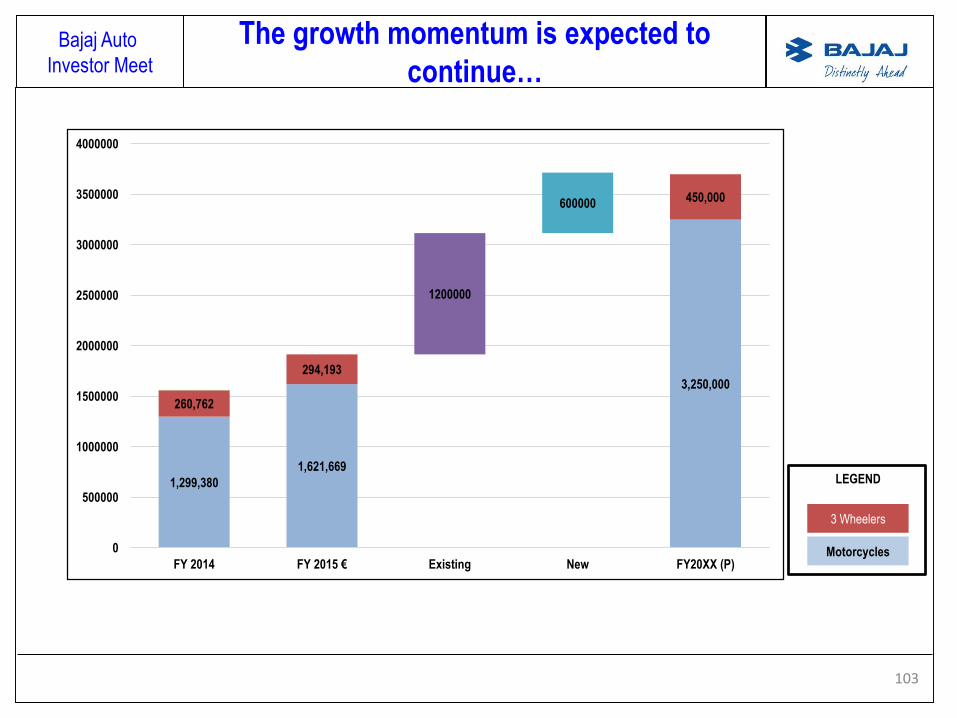
The growth momentum is expected to
continue…
3 Wheelers
Motorcycles
LEGEND1,299,380
1,621,669
3,250,000
260,762
294,193
450,000
1200000
600000
0
500000
1000000
1500000
2000000
2500000
3000000
3500000
4000000
FY 2014 FY 2015 € Existing New FY20XX (P)

Bajaj Auto
Investor Meet
104
धन्यवाद.Gracias y buena suerte
نشكركم ونتمنى لكم حظا سعيدا
Thank You!Pagpalain kayo at maraming salamat po!
terima kasih dan semoga sukses
ধন্যবাদ. আন্তরিক শুভেচ্ছা