backup and recovery for mssql server
DESCRIPTION
Guide for working with, and recovering, MSSQL. Target is SQL Server 2005. Author HP.TRANSCRIPT
Backup and recovery best practices for Microsoft SQL Server 2005
Overview . . . . . . . . . . . . . . . . . . . . . . . . . . . . . . . . 3 Solution configuration . . . . . . . . . . . . . . . . . . . . . . . . . . . 4
SQL 2005 database servers . . . . . . . . . . . . . . . . . . . . . . 4 Storage configurations . . . . . . . . . . . . . . . . . . . . . . . . . 6 Tape libraries . . . . . . . . . . . . . . . . . . . . . . . . . . . . 7 HP Data Protector cell . . . . . . . . . . . . . . . . . . . . . . . . . 7 Storage management . . . . . . . . . . . . . . . . . . . . . . . . . 8 SAN infrastructure . . . . . . . . . . . . . . . . . . . . . . . . . . 9 Domain controllers . . . . . . . . . . . . . . . . . . . . . . . . . . 9 Application load simulation . . . . . . . . . . . . . . . . . . . . . . 9 Database storage layout . . . . . . . . . . . . . . . . . . . . . . . . 9 Performance collection and monitoring . . . . . . . . . . . . . . . . . . 9
Testing . . . . . . . . . . . . . . . . . . . . . . . . . . . . . . . . . 10 Testing objectives . . . . . . . . . . . . . . . . . . . . . . . . . . . 10 Backing up SQL Server data with Data Protector . . . . . . . . . . . . . . 10
Impact of multiple backup streams . . . . . . . . . . . . . . . . . . 10 Baseline performance . . . . . . . . . . . . . . . . . . . . . . . 11 Disk-to-tape library backup performance . . . . . . . . . . . . . . . 12 Disk-to-disk backup performance . . . . . . . . . . . . . . . . . . 13 Online backup performance testing summary . . . . . . . . . . . . . 14 Effects of online backup on SQL transactions performance . . . . . . . 15Transaction log considerations . . . . . . . . . . . . . . . . . . . 18 System databases considerations . . . . . . . . . . . . . . . . . . 21
Restoring SQL Server data with Data Protector . . . . . . . . . . . . . . 21 Restore performance . . . . . . . . . . . . . . . . . . . . . . . 22
Database layout and backup performance considerations . . . . . . . . . . 24 Backup types and strategy . . . . . . . . . . . . . . . . . . . . . . . . . 29 Best practices and results . . . . . . . . . . . . . . . . . . . . . . . . . 31
Database administrators . . . . . . . . . . . . . . . . . . . . . . . . 31 Location of SQL Server binaries . . . . . . . . . . . . . . . . . . . 31 Location of system databases . . . . . . . . . . . . . . . . . . . . 31 Planning for file groups . . . . . . . . . . . . . . . . . . . . . . 31 Setup transaction log . . . . . . . . . . . . . . . . . . . . . . . 31
Server administrators . . . . . . . . . . . . . . . . . . . . . . . . . 31 Monitor server workload . . . . . . . . . . . . . . . . . . . . . . 31 Windows Instant File Initialization . . . . . . . . . . . . . . . . . . 32
Storage administrators . . . . . . . . . . . . . . . . . . . . . . . . . 32 Monitor EVA performance . . . . . . . . . . . . . . . . . . . . . 32
Backup administrators . . . . . . . . . . . . . . . . . . . . . . . . . 32 Select the right target backup device . . . . . . . . . . . . . . . . . 32 Perform incremental backups to save time and space . . . . . . . . . . 32Perform transaction log backup frequently . . . . . . . . . . . . . . 33

Additional backup considerations . . . . . . . . . . . . . . . . . . 33 Conclusion . . . . . . . . . . . . . . . . . . . . . . . . . . . . . . . 34 Appendix A. Bill of materials . . . . . . . . . . . . . . . . . . . . . . . . 35 Appendix B. SQL Server backup key performance indicators . . . . . . . . . . 37Appendix C. HP StorageWorks Storage System Scripting Utility . . . . . . . . . 39Appendix D. Test database layout . . . . . . . . . . . . . . . . . . . . . . 41 For more information . . . . . . . . . . . . . . . . . . . . . . . . . . . 43
Overview
With databases regarded as mission critical in most companies, the ability to back up Microsoft SQL Server 2005 data when required and within the specified backup window is vital. HP OpenView
Storage Data Protector 6.0 (Data Protector) is integrated with SQL Server 2005 via the Virtual Backup
Device Interface (VDI). This paper discusses the operation of Data Protector with various online
streaming backup and recovery methodologies.
Microsoft is encouraging SQL Server administrators to do backup by using backup software that integrates directly with SQL Server 2005 via VDI. The integration of Data Protector and SQL Server 2005 provides the following benefits:
• Central management of all backup operations
• Media management
• Scheduling
• Parallel backups and restores
To help you choose from among the available configuration options and backup and recovery
procedures, HP has conducted extensive laboratory tests to determine best practices. This paper discusses those test results so that users can understand the options and the limitations of implementing backup and recovery using Linear Tape-Open (LTO) tape, disk-to-disk, and virtual tape
devices. The audience for this paper is HP users in an enterprise environment currently running or planning to run SQL Server 2005.
The paper discusses:
• Best practice recommendations encompassing configuration, design, and deployment
• Backup and recovery recommendations for the integration of Data Protector Software and
Microsoft SQL Server 2005
• Backup and recovery recommendations for the LTO tape, the disk-to-disk, and the virtual tape
methodologies
• The impact on database performance and throughput for each of the methodologies: LTO tape, disk-to-disk, and virtual tape
• General recommendations for selecting which backup and recovery method to use
• Supporting configuration recommendations for HP servers and for HP StorageWorks 8100
Enterprise Virtual Array (EVA8100) disk array
• Recommendations for the use of parallel backup and restore operations, and the impact of multiple streams and device concurrency on overall backup performance
By leveraging the recommendations and best practices, administrators can shorten backup windows and efficiently load the server, thereby reducing cost and maximizing the use of hardware and
personnel resources.
3
Solution configuration
The testing environment consisted of a Microsoft SQL Server 2005 running on HP ProLiant BL480c
BladeServer systems and the HP StorageWorks EVA8100. The HP StorageWorks 6510 Virtual Library System (VLS6510) with Serial Advanced Technology Attachment (SATA) drives, and the HP
StorageWorks Enterprise Systems Library (ESL) E-Series 712e tape library were used as dedicated
backup and restore devices. Configuration of the servers and the devices attached to the storage
area network (SAN) was based on:
• HP StorageWorks 4x00/6x00/8x00 Enterprise Virtual Array configuration best practices white paper available on http://h71028.www7.hp.com/ERC/downloads/
4AA0-2787ENW.pdf?jumpid=reg_R1002_USEN
• HP StorageWorks Enterprise Backup Solution design guide available on http://
h20000.www2.hp.com/bc/docs/support/SupportManual/c00775232/c00775232.pdf
For a list of hardware and software used in this project, see “Bill of materials” on page 35.
During this test cycle, Data Protector 6.0 was used for online SQL backups with the goal of reducing
backup and recovery windows. Reducing restore times allows more time for recovery operations, including transaction log roll forward, and increases the potential to meet tighter service-level agreements and recovery time objectives (RTOs).
SQL 2005 database servers The database servers consisted of HP ProLiant BL480c G1 BladeServer systems running
Microsoft Windows Server 2003 R2 x64 Enterprise Edition. Each server was configured
with one dual-port, Fibre Channel mezzanine card. The Fibre Channel cards were based
on Emulex LP1105 Series adapters and were installed using the HP host bus adapter (HBA) Smart Component drivers. These drivers can be downloaded from the HP website on
http://welcome.hp.com/country/us/en/support.html?pageDisplay=drivers.
The HP Storport mini-port drivers and the Microsoft Windows 2003 Storport driver were used to
create a compatible configuration in which disk and tape could be accessed through the same HBA,
thus decreasing the cost of implementing SAN-based backups.
Note
For more tape compatibility information, see the Enterprise Backup Solution (EBS) compatibility matrix and the HP StorageWorks Enterprise Backup Solution design guide at http://h20000.www2.hp.com/bc/docs/support/SupportManual/ c00775232/c00775232.pdf.
Figure 1 provides a graphic of the hardware configuration.
4
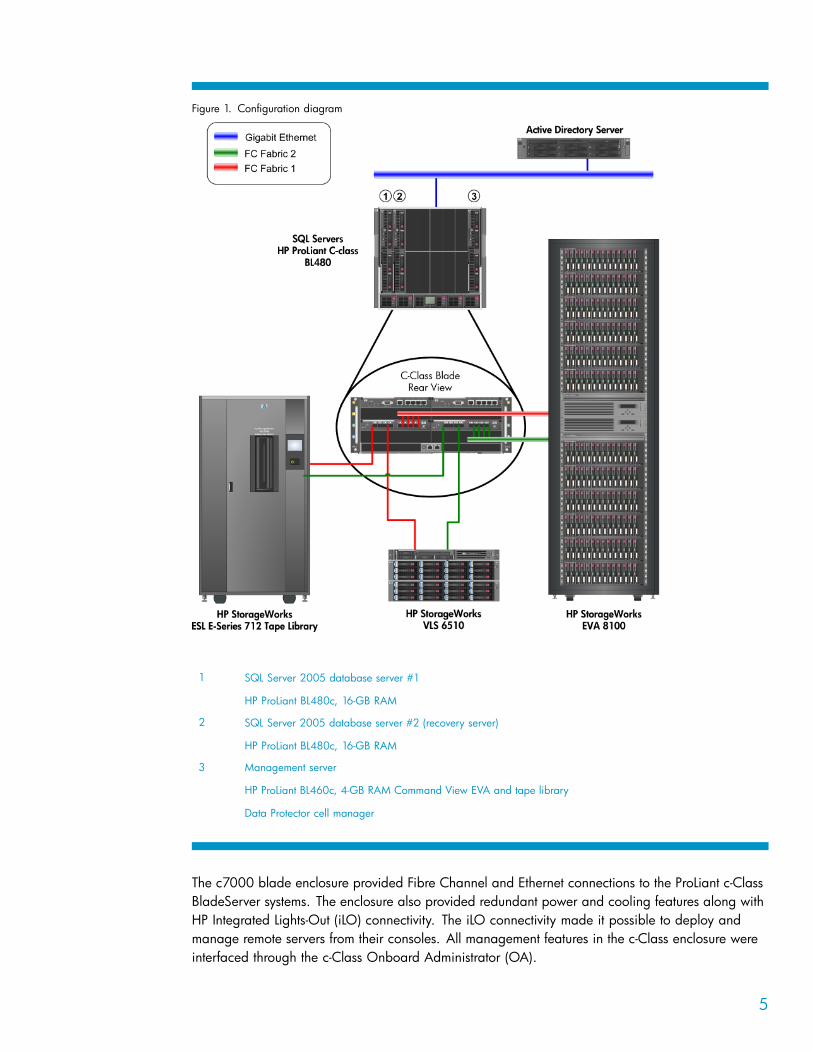
Figure 1. Configuration diagram
1 SQL Server 2005 database server #1
HP ProLiant BL480c, 16-GB RAM
2 SQL Server 2005 database server #2 (recovery server)
HP ProLiant BL480c, 16-GB RAM
3 Management server
HP ProLiant BL460c, 4-GB RAM Command View EVA and tape library
Data Protector cell manager
The c7000 blade enclosure provided Fibre Channel and Ethernet connections to the ProLiant c-Class BladeServer systems. The enclosure also provided redundant power and cooling features along with
HP Integrated Lights-Out (iLO) connectivity. The iLO connectivity made it possible to deploy and
manage remote servers from their consoles. All management features in the c-Class enclosure were
interfaced through the c-Class Onboard Administrator (OA).
5
Storage configurations The storage subsystem consisted of an EVA8100 with two HSV210-B controllers and twelve Fibre
Channel (FC) drive enclosures (2C12D configuration). The disks were arranged in an inline layout and striped vertically, in keeping with the default behavior on the EVA. The database storage was designed using two different virtual disk and disk group layouts as shown in Figure 2. This allowed
a backup and restore performance comparison between a multiple-file and a single-file database
layout. For each layout, the transaction log file is isolated in a dedicated disk group consisting of 16 x 146-GB 15K RPM FC disk drives. The disk group housing the database files consists of 64
300-GB 15K RPM FC disk drives. All virtual disks are configured with a redundancy of Vraid 1. All SQL Server data files, including the system databases and transaction log data, were stored on the
EVA. See Figure 2 for a graphic of this layout.
The Microsoft SQL Server test database is 1 TB. The user load on the database was simulated using
an online transaction processing (OLTP) workload and a no-wait or constant 3:2 read-to-write ratio of transactions. The workload parameters were modified to maintain a response time of < = 15 ms across database volumes while sustaining a request rate of at least 10,000 IOPS. This same load
scenario was used in every test case.
6
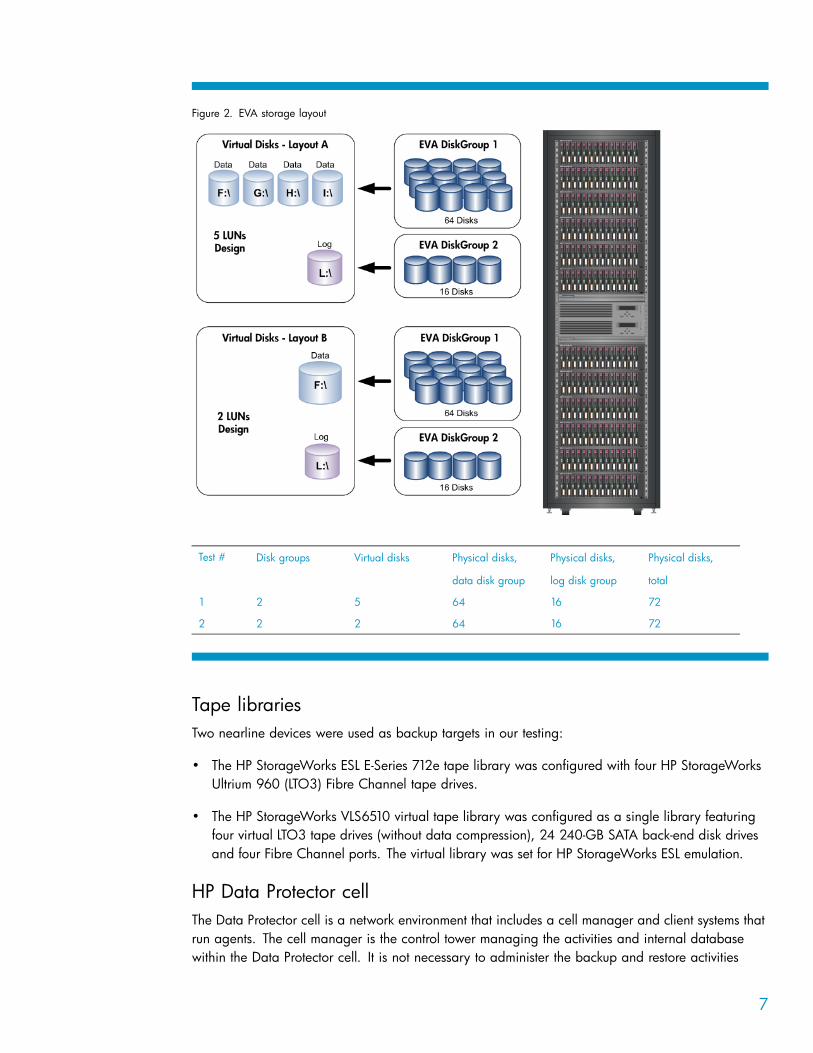
Figure 2. EVA storage layout
Test # Disk groups Virtual disks Physical disks, Physical disks, Physical disks,
data disk group log disk group total
1 2 5 64 16 72
2 2 2 64 16 72
Tape libraries Two nearline devices were used as backup targets in our testing:
• The HP StorageWorks ESL E-Series 712e tape library was configured with four HP StorageWorks Ultrium 960 (LTO3) Fibre Channel tape drives.
• The HP StorageWorks VLS6510 virtual tape library was configured as a single library featuring
four virtual LTO3 tape drives (without data compression), 24 240-GB SATA back-end disk drives and four Fibre Channel ports. The virtual library was set for HP StorageWorks ESL emulation.
HP Data Protector cell The Data Protector cell is a network environment that includes a cell manager and client systems that run agents. The cell manager is the control tower managing the activities and internal database
within the Data Protector cell. It is not necessary to administer the backup and restore activities
7
directly from the cell manager; any client within the cell can connect to the cell manager over the
network and be used to administer the activities of the cell.
Client systems run agents that are defined at installation according to the following requirements:
• The media agent is installed on a server if that server is going to have direct access to a tape
device for backup and restore.
• The tape devices either can be directly attached or can communicate over a SAN.
• The disk agent is allocated to a server if that server is going to read data from a disk device, whether local or remote.
In our test environment, SQL database servers were installed with a media agent, a disk agent, and
the SQL agent.
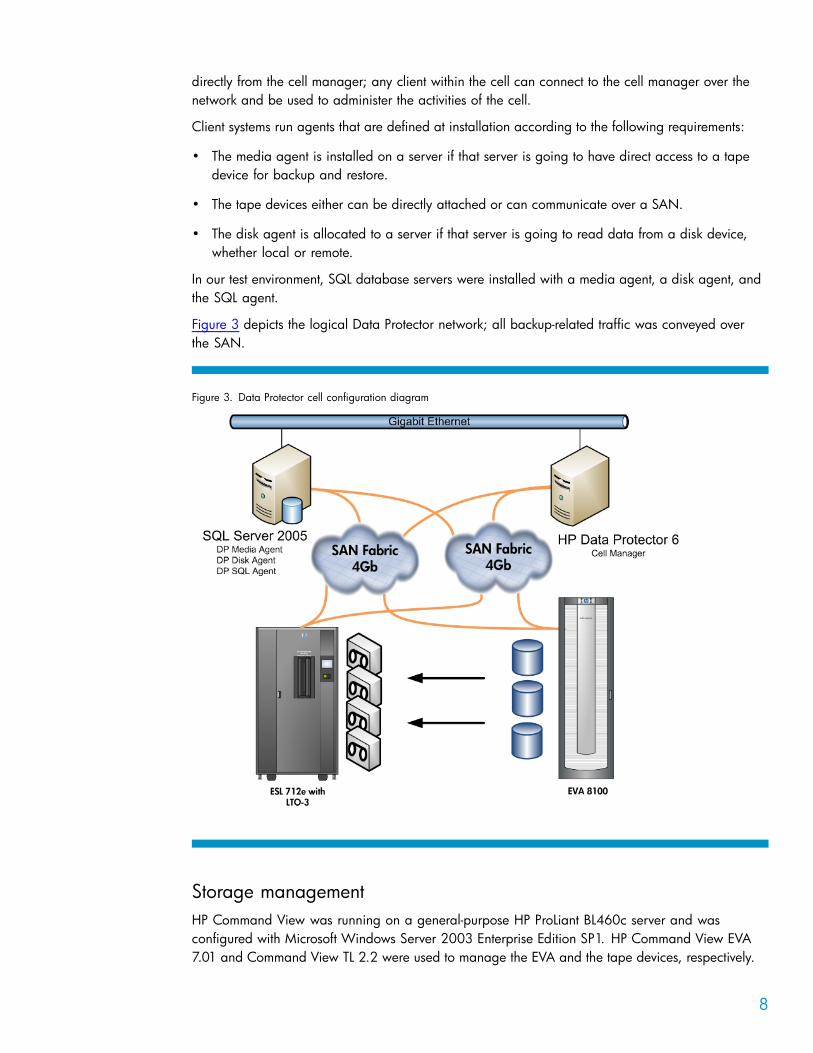
Figure 3 depicts the logical Data Protector network; all backup-related traffic was conveyed over the SAN.
Figure 3. Data Protector cell configuration diagram
Storage management HP Command View was running on a general-purpose HP ProLiant BL460c server and was configured with Microsoft Windows Server 2003 Enterprise Edition SP1. HP Command View EVA
7.01 and Command View TL 2.2 were used to manage the EVA and the tape devices, respectively.
8
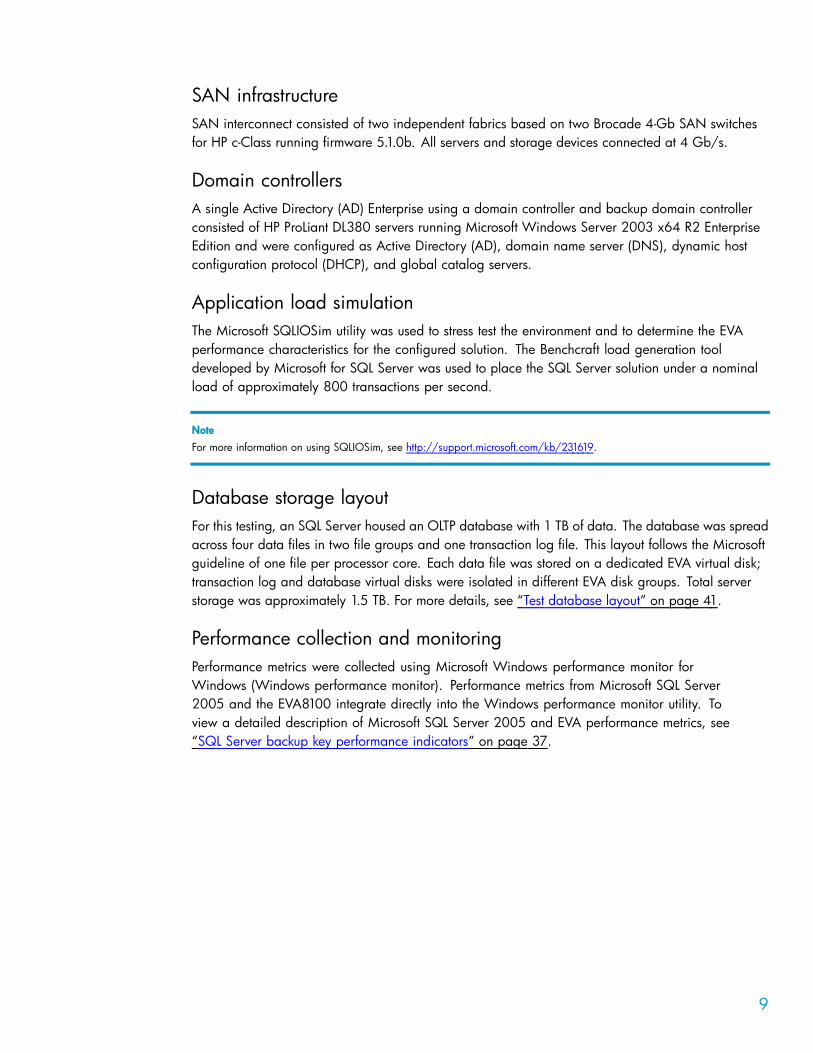
SAN infrastructure
SAN interconnect consisted of two independent fabrics based on two Brocade 4-Gb SAN switches for HP c-Class running firmware 5.1.0b. All servers and storage devices connected at 4 Gb/s.
Domain controllers A single Active Directory (AD) Enterprise using a domain controller and backup domain controller consisted of HP ProLiant DL380 servers running Microsoft Windows Server 2003 x64 R2 Enterprise
Edition and were configured as Active Directory (AD), domain name server (DNS), dynamic host configuration protocol (DHCP), and global catalog servers.
Application load simulation
The Microsoft SQLIOSim utility was used to stress test the environment and to determine the EVA
performance characteristics for the configured solution. The Benchcraft load generation tool developed by Microsoft for SQL Server was used to place the SQL Server solution under a nominal load of approximately 800 transactions per second.
Note
For more information on using SQLIOSim, see http://support.microsoft.com/kb/231619.
Database storage layout For this testing, an SQL Server housed an OLTP database with 1 TB of data. The database was spread
across four data files in two file groups and one transaction log file. This layout follows the Microsoft
guideline of one file per processor core. Each data file was stored on a dedicated EVA virtual disk; transaction log and database virtual disks were isolated in different EVA disk groups. Total server storage was approximately 1.5 TB. For more details, see “Test database layout” on page 41.
Performance collection and monitoring
Performance metrics were collected using Microsoft Windows performance monitor for Windows (Windows performance monitor). Performance metrics from Microsoft SQL Server 2005 and the EVA8100 integrate directly into the Windows performance monitor utility. To
view a detailed description of Microsoft SQL Server 2005 and EVA performance metrics, see
“SQL Server backup key performance indicators” on page 37.
9
Testing
Testing objectives OLTP applications tend to grow at an explosive pace, driving customer requirements for increasingly
larger methods of backing up and restoring data. In addition, it has become more important that the time required for data backup and restore be reduced to a minimum so as not to interrupt the
day-to-day running of company applications. It is important to consider ways to accelerate the
process and minimize the impact on the production systems. The goals of the testing were to develop
a set of backup and recovery best practices to minimize the backup windows through the use of high-performance, streaming backups.
Backing up SQL Server data with Data Protector
Microsoft SQL Server 2005 provides the Virtual Backup Device Interface (VDI) for backup. The
VDI enables third-party backup solutions such as Data Protector 6.0 to integrate directly with SQL Server, providing support for application-aware backup and restore operations. Such Application
Programming Interfaces (APIs) are engineered to provide maximum reliability and performance and
to support the full range of SQL Server backup and restore functionality. Data Protector 6.0 makes full use of this API:
• All backups are performed online; the database remains accessible to users.
• The entire database is backed up: selecting or excluding a particular table is not possible. However, only the used portion of the database, containing valid pages, is backed up. This is an
advantage compared to offline file backups.
• Different types of backups are supported by the integration: full (database), differential, transaction log or snapshot. Note that Snapshot mode is only possible when used in conjunction
with the Zero Downtime Backup (ZDB) option for Data Protector and requires HP StorageWorks Business Copy EVA software to be installed on the array.
This testing was performed on a single SQL Server 2005 server instance and aimed at characterizing
online backup with Data Protector in an SQL Server environment.
Impact of multiple backup streams
Parallel backup and restore operations can improve the capability of Microsoft SQL Server 2005 to
manage high-performance backup of very large databases. The BACKUP and RESTORE statements use parallel I/O in a number of ways:
• If a database has files on several logical unit numbers (LUNs), the BACKUP statement uses one
thread per disk device to read the extents from the database.
• If a backup set is stored on multiple backup devices, both the BACKUP and the RESTORE statement use one thread each per backup device.
However, SQL Server 2005 supports only a single data stream per targeted backup device. Therefore, the backup hardware configuration is the primary factor for determining the number of streams that can be backed up in parallel.
To understand the effect of streams and device concurrency on overall backup performance, we
performed a series of backups, increasing the number of targeted backup devices linearly for
10
each test iteration until either the point of diminishing return was met or a maximum hardware
configuration was attained.
We evaluated the following backup devices:
• LTO-3 tape drive in ESL 712e
• LTO-3 virtual tape drive in VLS6510
• Data Protector file library using 500-GB Fibre Channel Advanced Technology Attachment (FATA) disk drives
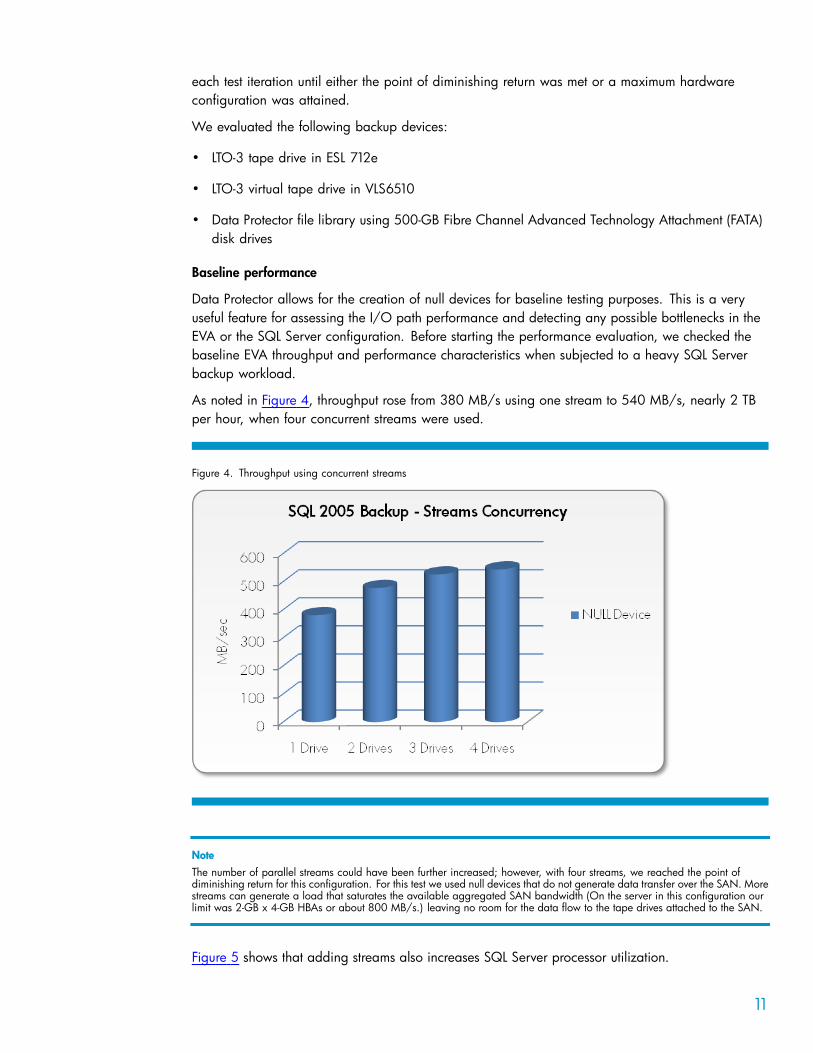
Baseline performance
Data Protector allows for the creation of null devices for baseline testing purposes. This is a very
useful feature for assessing the I/O path performance and detecting any possible bottlenecks in the
EVA or the SQL Server configuration. Before starting the performance evaluation, we checked the
baseline EVA throughput and performance characteristics when subjected to a heavy SQL Server backup workload.
As noted in Figure 4, throughput rose from 380 MB/s using one stream to 540 MB/s, nearly 2 TB
per hour, when four concurrent streams were used.
Figure 4. Throughput using concurrent streams
Note
The number of parallel streams could have been further increased; however, with four streams, we reached the point of diminishing return for this configuration. For this test we used null devices that do not generate data transfer over the SAN. More streams can generate a load that saturates the available aggregated SAN bandwidth (On the server in this configuration our limit was 2-GB x 4-GB HBAs or about 800 MB/s.) leaving no room for the data flow to the tape drives attached to the SAN.
Figure 5 shows that adding streams also increases SQL Server processor utilization.
11
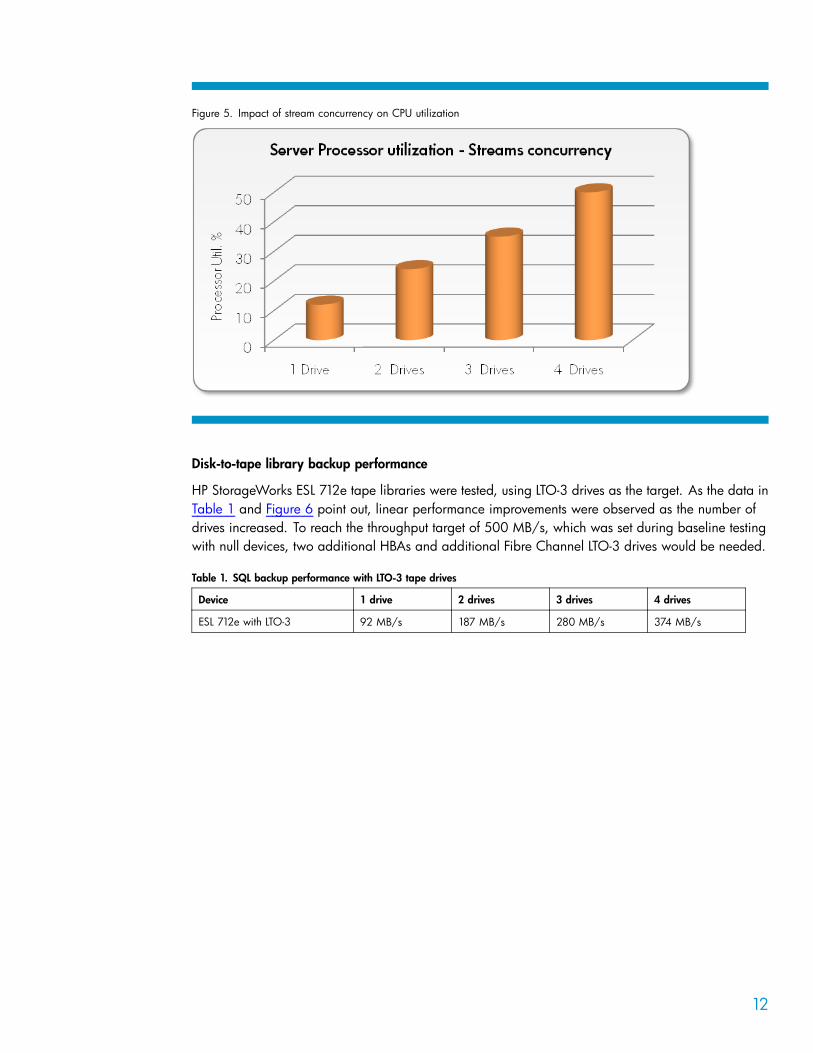
Figure 5. Impact of stream concurrency on CPU utilization
Disk-to-tape library backup performance
HP StorageWorks ESL 712e tape libraries were tested, using LTO-3 drives as the target. As the data in
Table 1 and Figure 6 point out, linear performance improvements were observed as the number of drives increased. To reach the throughput target of 500 MB/s, which was set during baseline testing
with null devices, two additional HBAs and additional Fibre Channel LTO-3 drives would be needed.
Table 1. SQL backup performance with LTO-3 tape drives
Device 1 drive 2 drives 3 drives 4 drives
ESL 712e with LTO-3 92 MB/s 187 MB/s 280 MB/s 374 MB/s
12
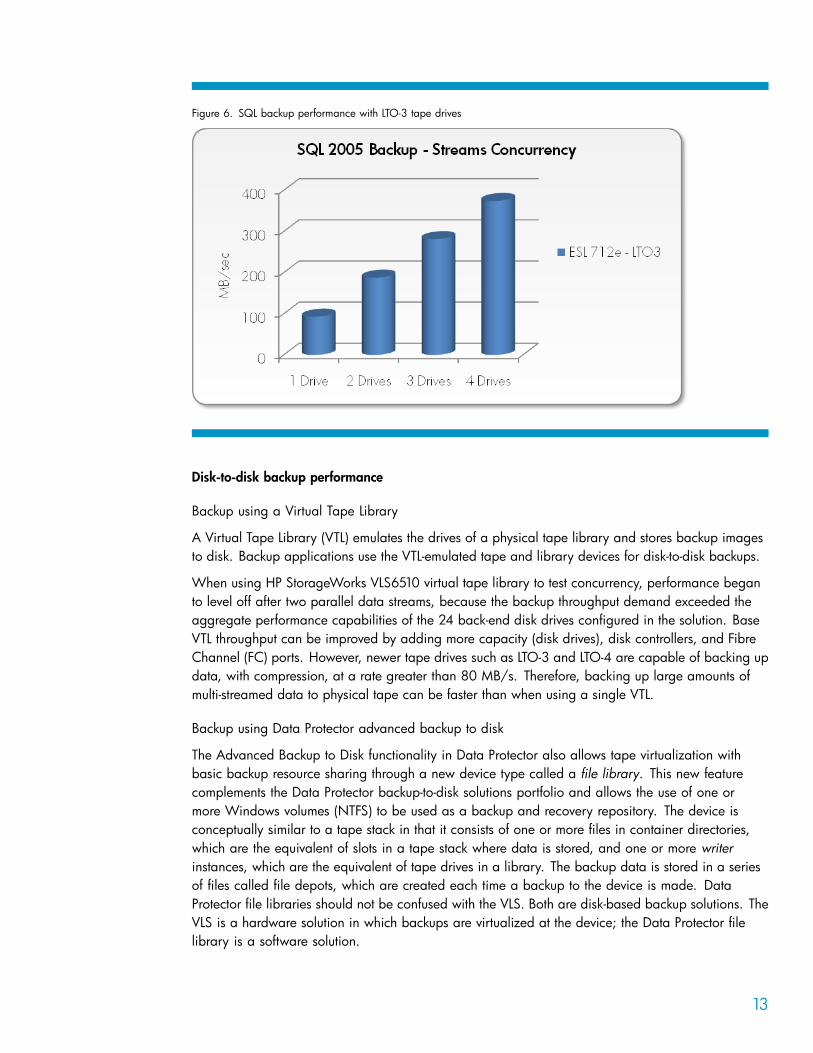
Figure 6. SQL backup performance with LTO-3 tape drives
Disk-to-disk backup performance
Backup using a Virtual Tape Library
A Virtual Tape Library (VTL) emulates the drives of a physical tape library and stores backup images to disk. Backup applications use the VTL-emulated tape and library devices for disk-to-disk backups.
When using HP StorageWorks VLS6510 virtual tape library to test concurrency, performance began
to level off after two parallel data streams, because the backup throughput demand exceeded the
aggregate performance capabilities of the 24 back-end disk drives configured in the solution. Base
VTL throughput can be improved by adding more capacity (disk drives), disk controllers, and Fibre
Channel (FC) ports. However, newer tape drives such as LTO-3 and LTO-4 are capable of backing up
data, with compression, at a rate greater than 80 MB/s. Therefore, backing up large amounts of multi-streamed data to physical tape can be faster than when using a single VTL.
Backup using Data Protector advanced backup to disk
The Advanced Backup to Disk functionality in Data Protector also allows tape virtualization with
basic backup resource sharing through a new device type called a file library. This new feature
complements the Data Protector backup-to-disk solutions portfolio and allows the use of one or more Windows volumes (NTFS) to be used as a backup and recovery repository. The device is conceptually similar to a tape stack in that it consists of one or more files in container directories, which are the equivalent of slots in a tape stack where data is stored, and one or more writer instances, which are the equivalent of tape drives in a library. The backup data is stored in a series of files called file depots, which are created each time a backup to the device is made. Data
Protector file libraries should not be confused with the VLS. Both are disk-based backup solutions. The
VLS is a hardware solution in which backups are virtualized at the device; the Data Protector file
library is a software solution.
13
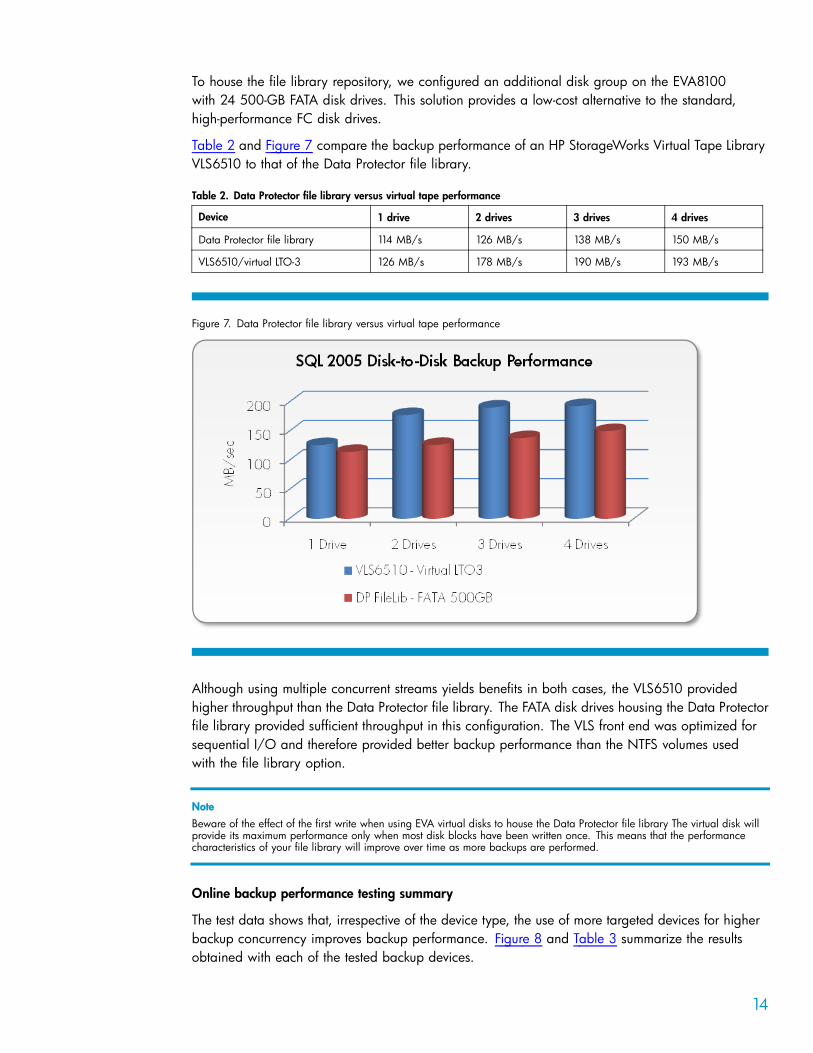
To house the file library repository, we configured an additional disk group on the EVA8100
with 24 500-GB FATA disk drives. This solution provides a low-cost alternative to the standard, high-performance FC disk drives.
Table 2 and Figure 7 compare the backup performance of an HP StorageWorks Virtual Tape Library
VLS6510 to that of the Data Protector file library.
Table 2. Data Protector file library versus virtual tape performance
Device 1 drive 2 drives 3 drives 4 drives
Data Protector file library 114 MB/s 126 MB/s 138 MB/s 150 MB/s
VLS6510/virtual LTO-3 126 MB/s 178 MB/s 190 MB/s 193 MB/s
Figure 7. Data Protector file library versus virtual tape performance
Although using multiple concurrent streams yields benefits in both cases, the VLS6510 provided
higher throughput than the Data Protector file library. The FATA disk drives housing the Data Protector file library provided sufficient throughput in this configuration. The VLS front end was optimized for sequential I/O and therefore provided better backup performance than the NTFS volumes used
with the file library option.
Note
Beware of the effect of the first write when using EVA virtual disks to house the Data Protector file library The virtual disk will provide its maximum performance only when most disk blocks have been written once. This means that the performance characteristics of your file library will improve over time as more backups are performed.
Online backup performance testing summary
The test data shows that, irrespective of the device type, the use of more targeted devices for higher backup concurrency improves backup performance. Figure 8 and Table 3 summarize the results obtained with each of the tested backup devices.
14
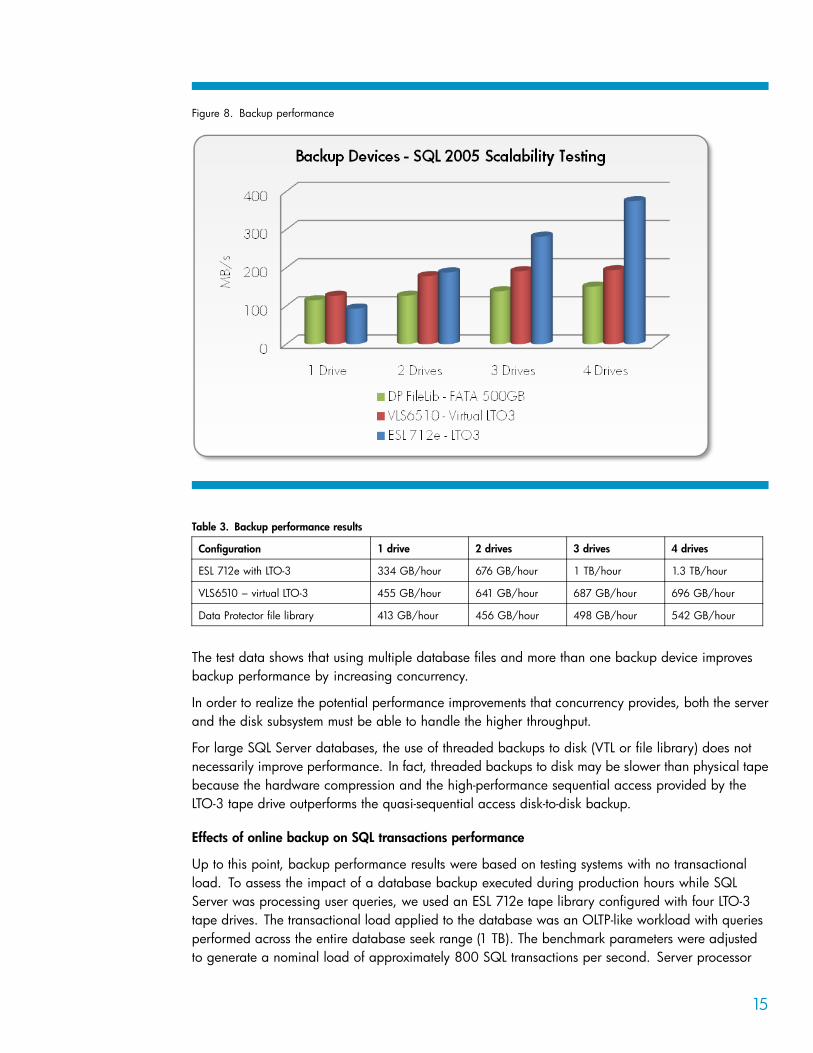
Figure 8. Backup performance
Table 3. Backup performance results
Configuration 1 drive 2 drives 3 drives 4 drives
ESL 712e with LTO-3 334 GB/hour 676 GB/hour 1 TB/hour 1.3 TB/hour
VLS6510 − virtual LTO-3 455 GB/hour 641 GB/hour 687 GB/hour 696 GB/hour
Data Protector file library 413 GB/hour 456 GB/hour 498 GB/hour 542 GB/hour
The test data shows that using multiple database files and more than one backup device improves backup performance by increasing concurrency.
In order to realize the potential performance improvements that concurrency provides, both the server and the disk subsystem must be able to handle the higher throughput.
For large SQL Server databases, the use of threaded backups to disk (VTL or file library) does not necessarily improve performance. In fact, threaded backups to disk may be slower than physical tape
because the hardware compression and the high-performance sequential access provided by the
LTO-3 tape drive outperforms the quasi-sequential access disk-to-disk backup.
Effects of online backup on SQL transactions performance
Up to this point, backup performance results were based on testing systems with no transactional load. To assess the impact of a database backup executed during production hours while SQL Server was processing user queries, we used an ESL 712e tape library configured with four LTO-3
tape drives. The transactional load applied to the database was an OLTP-like workload with queries performed across the entire database seek range (1 TB). The benchmark parameters were adjusted
to generate a nominal load of approximately 800 SQL transactions per second. Server processor
15

utilization, SQL transactions per second, disk reads and disk writes request rates and latencies, as well as the backup throughput metrics were recorded during the backup window.
Table 4 and Figure 9 highlight the key performance indicators for the disk subsystem.
Table 4. Disk performance statistics for backup under load
Counter 95 th Percentile Average Maximum
LogicalDisk\_Total\Disk Reads/sec 10,408 8,644 13,294
LogicalDisk\_Total\Disk Writes/sec 4,428 3,796 24,528
LogicalDisk\_Total\Disk Transfers/sec 14,212 12,440 27,734
LogicalDisk\_Total\Avg. Disk sec/Read 0.012 0.011 0.242
LogicalDisk\_Total\Avg. Disk sec/Write 0.002 0.002 0.424
Figure 9. Read/write disk response times and latencies for backup under load
Table 5, Table 6, and Figure 10 highlight the key performance indicators for the SQL Servers.
Table 5. SQL Server performance indicators
Counter 95 th Percentile Average Maximum
Processor\_Total\% Processor Time 72 39 96
Databases\_total\Transactions/sec 2,365 830 5,154
Buffer Manager\Page reads/sec 9,573 6,815 32,403
Buffer Manager\Page writes/sec 5,105 3,433 158,231
Buffer Manager\Buffer cache hit ratio 97 96 100
16
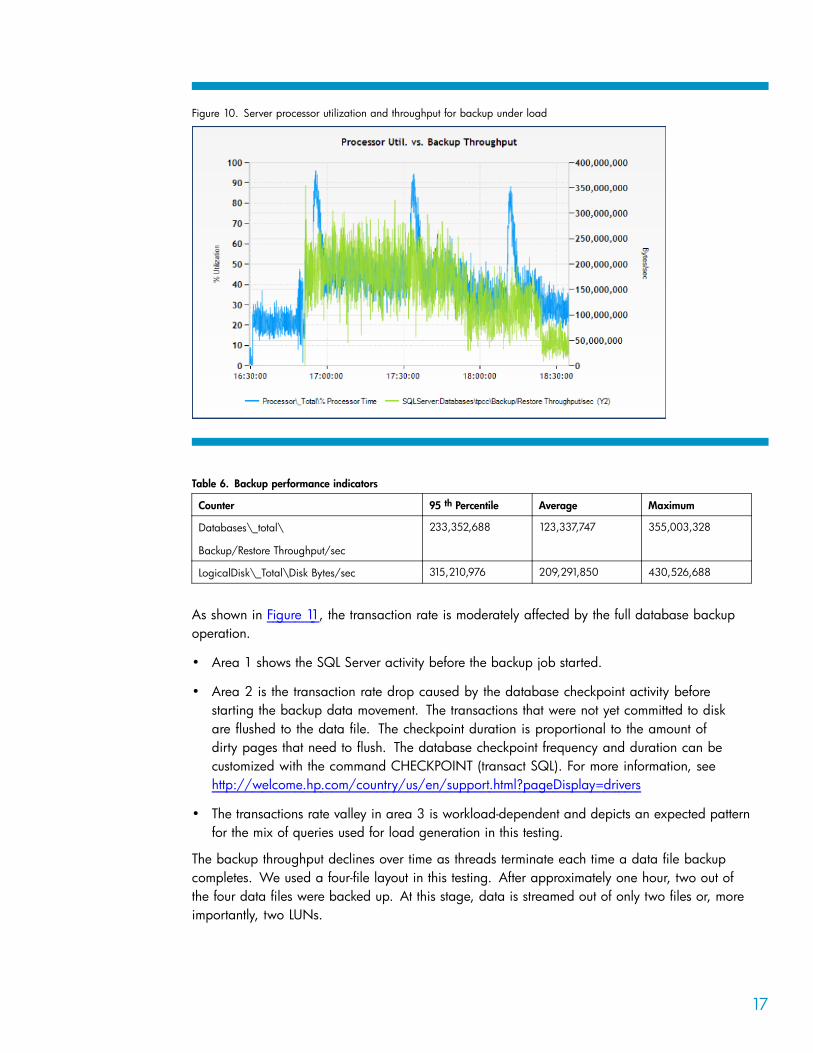
Figure 10. Server processor utilization and throughput for backup under load
Table 6. Backup performance indicators
Counter 95 th Percentile Average Maximum
Databases\_total\
Backup/Restore Throughput/sec
233,352,688 123,337,747 355,003,328
LogicalDisk\_Total\Disk Bytes/sec 315,210,976 209,291,850 430,526,688
As shown in Figure 11, the transaction rate is moderately affected by the full database backup
operation.
• Area 1 shows the SQL Server activity before the backup job started.
• Area 2 is the transaction rate drop caused by the database checkpoint activity before
starting the backup data movement. The transactions that were not yet committed to disk
are flushed to the data file. The checkpoint duration is proportional to the amount of dirty pages that need to flush. The database checkpoint frequency and duration can be
customized with the command CHECKPOINT (transact SQL). For more information, see
http://welcome.hp.com/country/us/en/support.html?pageDisplay=drivers
• The transactions rate valley in area 3 is workload-dependent and depicts an expected pattern
for the mix of queries used for load generation in this testing.
The backup throughput declines over time as threads terminate each time a data file backup
completes. We used a four-file layout in this testing. After approximately one hour, two out of the four data files were backed up. At this stage, data is streamed out of only two files or, more
importantly, two LUNs.
17
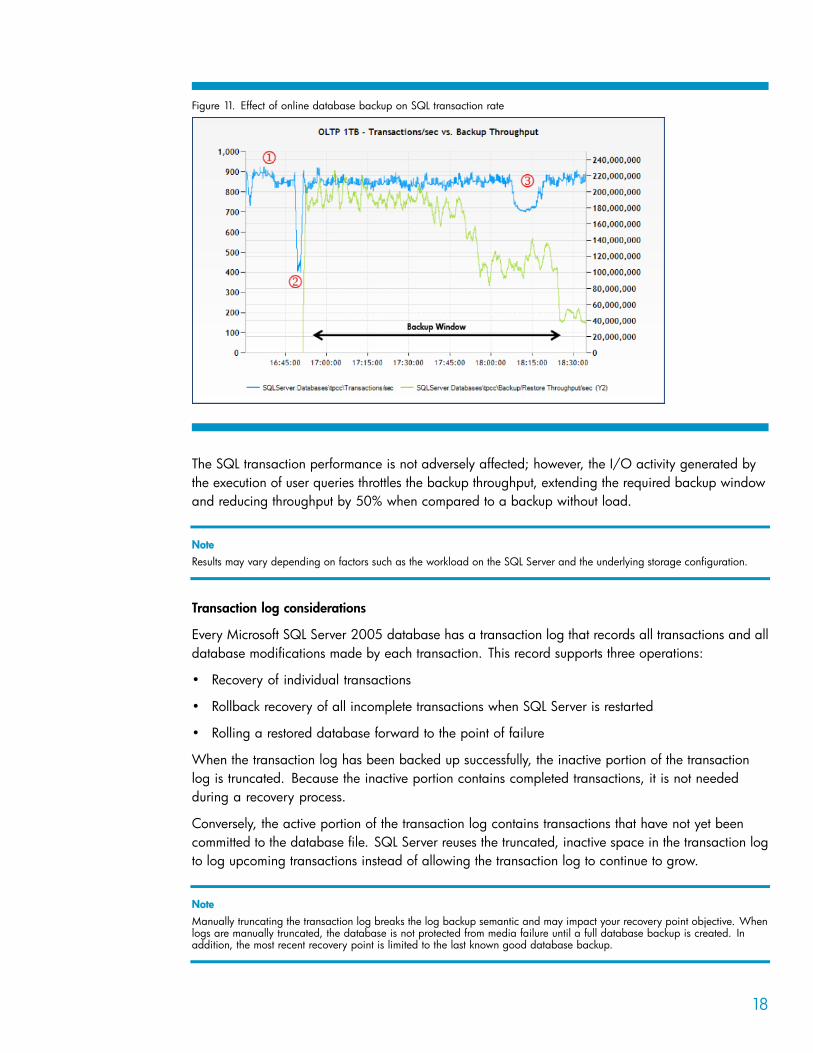
Figure 11. Effect of online database backup on SQL transaction rate
The SQL transaction performance is not adversely affected; however, the I/O activity generated by
the execution of user queries throttles the backup throughput, extending the required backup window
and reducing throughput by 50% when compared to a backup without load.
Note
Results may vary depending on factors such as the workload on the SQL Server and the underlying storage configuration.
Transaction log considerations
Every Microsoft SQL Server 2005 database has a transaction log that records all transactions and all database modifications made by each transaction. This record supports three operations:
• Recovery of individual transactions
• Rollback recovery of all incomplete transactions when SQL Server is restarted
• Rolling a restored database forward to the point of failure
When the transaction log has been backed up successfully, the inactive portion of the transaction
log is truncated. Because the inactive portion contains completed transactions, it is not needed
during a recovery process.
Conversely, the active portion of the transaction log contains transactions that have not yet been
committed to the database file. SQL Server reuses the truncated, inactive space in the transaction log
to log upcoming transactions instead of allowing the transaction log to continue to grow.
Note
Manually truncating the transaction log breaks the log backup semantic and may impact your recovery point objective. When logs are manually truncated, the database is not protected from media failure until a full database backup is created. In addition, the most recent recovery point is limited to the last known good database backup.
18
The ending point of the inactive portion of the transaction log, and hence the truncation point, is the earliest of the following events:
• The most recent database checkpoint
• The start of the oldest active transaction, that is, a transaction that has not yet been committed
or rolled back
This represents the earliest point to which SQL Server would have to roll back transactions during
recovery.
• The start of the oldest transaction that involves objects published for replication whose changes have not yet been replicated
This represents the earliest point that SQL Server still has to replicate.
The transaction log can be implemented on several files. The files can be defined to expand as
required to reduce both administrative overhead and the likelihood of running out of space for the
transaction log. Truncating the transaction log has minimal effect on transaction throughput.
Transaction log backups usually are much quicker than full and differential jobs. Performing frequent transaction log backups throughout the production day allows for more point-in-time recovery options. This lengthens and complicates the recovery process, however, because it will be necessary to restore
all transaction log data since the last full or differential backup.
Note
Full and differential backup jobs do not back up the transaction logs. If you wish to protect that critical data, it is necessary to schedule separate jobs to back up the transaction log between each full or incremental backup.
The impact of a transaction log backup on an SQL Server can be summarized as:
• Log file capacity: 50 GB
• Used transaction log space before backup: 99%
• Transaction log backup throughput with four LTO-3 drives: ~280 MB/s
• Used transaction log space after backup and log truncation: 6%
Frequent transaction log backups may be required to enhance recoverability and meet your Service
Level Agreement (SLA) requirements.
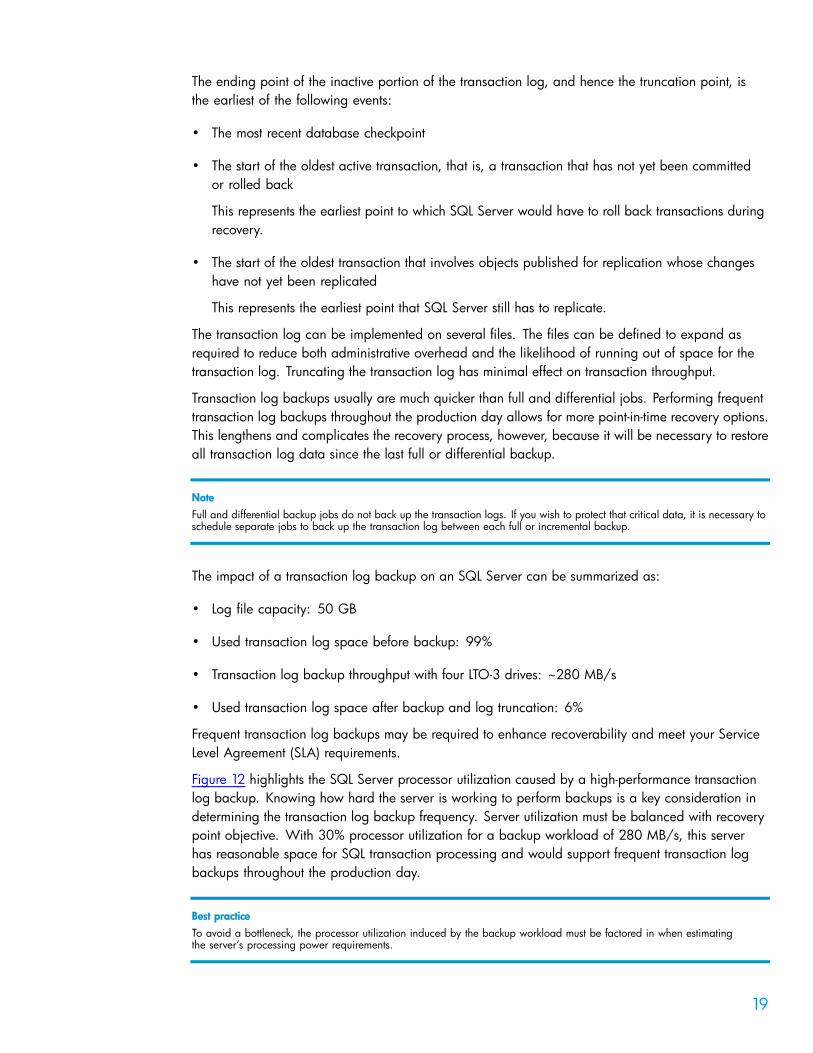
Figure 12 highlights the SQL Server processor utilization caused by a high-performance transaction
log backup. Knowing how hard the server is working to perform backups is a key consideration in
determining the transaction log backup frequency. Server utilization must be balanced with recovery
point objective. With 30% processor utilization for a backup workload of 280 MB/s, this server has reasonable space for SQL transaction processing and would support frequent transaction log
backups throughout the production day.
Best practice
To avoid a bottleneck, the processor utilization induced by the backup workload must be factored in when estimating the server‘s processing power requirements.
19
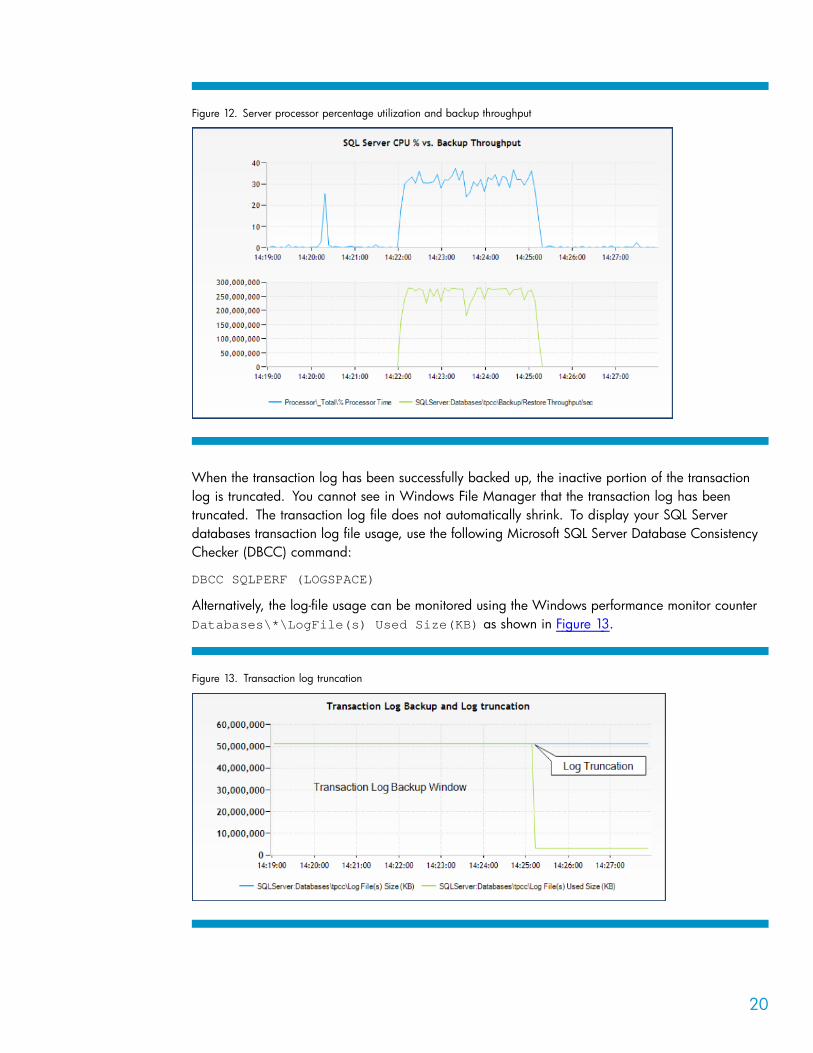
Figure 12. Server processor percentage utilization and backup throughput
When the transaction log has been successfully backed up, the inactive portion of the transaction
log is truncated. You cannot see in Windows File Manager that the transaction log has been
truncated. The transaction log file does not automatically shrink. To display your SQL Server databases transaction log file usage, use the following Microsoft SQL Server Database Consistency
Checker (DBCC) command:
DBCC SQLPERF (LOGSPACE)
Alternatively, the log-file usage can be monitored using the Windows performance monitor counter Databases\*\LogFile(s) Used Size(KB) as shown in Figure 13.
Figure 13. Transaction log truncation
20
System databases considerations
Microsoft SQL Server systems have four system databases:
• The master database records all of the system-level information for an SQL Server system. It records all login accounts and system configuration settings. Also, the master records the
existence of all other databases and the location of the primary files that contain the initialization
information for the user databases. Because the master database is a critical piece of the
system, it must be backed up as frequently as the SQL Server or the database configuration is changed. If the master database is damaged, for example, in a media failure, Microsoft SQL Server may not start. In such a case, it is necessary to rebuild the master database and then
restore the database from a recent backup.
• The tempdb database holds all temporary tables and stored procedures. It also fills any other temporary storage needs such as work tables generated by SQL Server. The tempdb database
is a global resource; the temporary tables and stored procedures for all users connected to the
system are stored there. The tempdb database is re-created every time SQL Server is started, so the
system starts with a clean copy of the database; there is never anything in the tempdb database
to be saved from one session of SQL Server to another. This database does not require backup.
• The model database is used as the template for all databases created on the system. When a
CREATE DATABASE statement is issued, the first part of the database is created by copying the
content of the model database, and then the remainder of the new database is filled with empty
pages. Because the tempdb database is created every time SQL Server is started, the model database must always exist on an SQL Server system.
• The msdb database is used by SQL Server agent for scheduling alerts and jobs.
At installation, the SQL Server 2005 executable files and binaries are copied. HP recommends that these be stored on the operating system volume (default) but that the SQL Server system databases be
stored in a different location, preferably an external storage volume attached to a SAN. In the event of a catastrophic server failure, a dedicated EVA virtual disk can reduce recovery time by providing
more flexibility as the system database could be presented and taken over by a standby server.
Restoring SQL Server data with Data Protector The restore of a Microsoft SQL database is done from the same GUI as all other generic Data
Protector restores. As is the case with any other backed-up object, different versions of the backup
can be selected for restore. During full database restore, the required database files are created
automatically. Databases can be restored with a different name using the advanced options tab; the file locations can be different, but the database logical file names must map the logical file
names of the database you backed up.
Depending on your backup strategy, you can restore the database from a full, a differential, or a
transaction log backup. Data Protector will ensure that you are restoring the complete, necessary
restore chain unless otherwise specified with the Restore only this backup option in the
Version tab of the database properties.
In the case of transaction log backups, it is possible to restore to a point in time that you specify
in the Version tab of the database properties. In that case, only transaction log records written
before the specified date and time are applied to the database. After the recovery is complete, the
database is restored to the state it was in at the time specified.
21
When restoring a database, you can select the state of the database after the recovery:
• Leave the database operational.
After the last transaction log has been restored and the recovery has completed, the database
is operational.
• Leave the database nonoperational after the last transaction log has been restored.
You may further restore additional transaction logs one by one.
• Leave the database as read-only.
– You may further restore transaction logs before the database is set to Read-Write mode. Here
the integration of Data Protector and Microsoft SQL allows you to create an undo file.
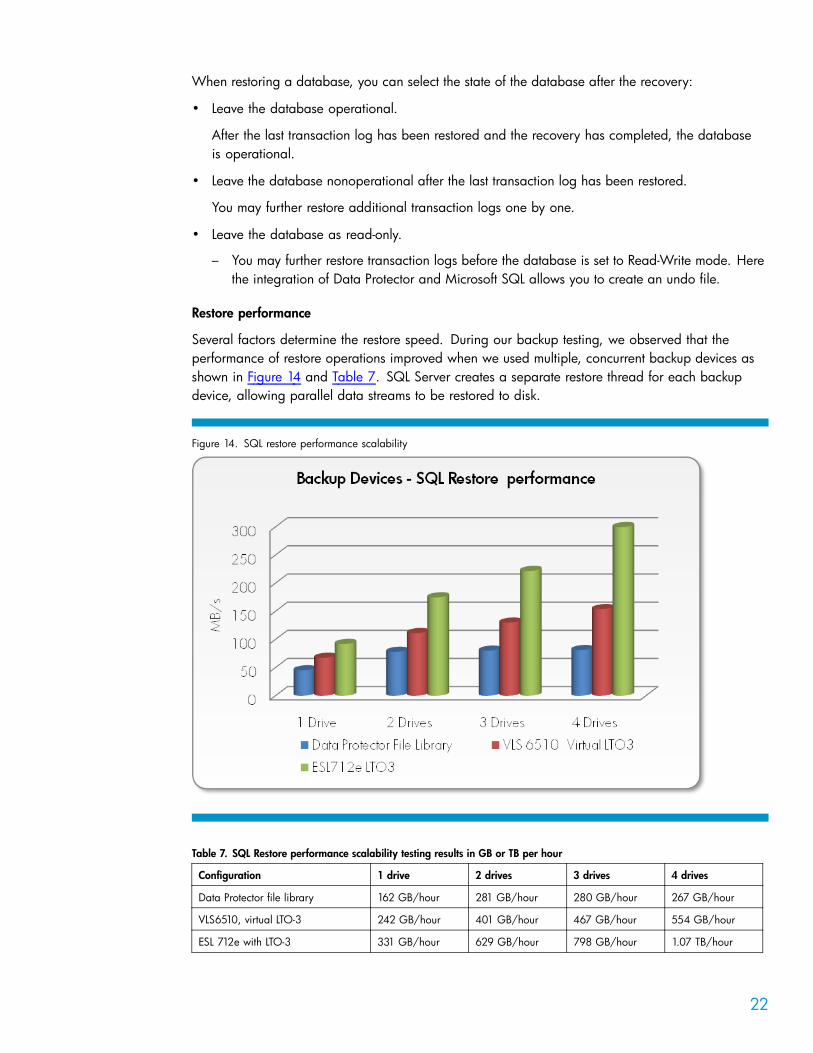
Restore performance
Several factors determine the restore speed. During our backup testing, we observed that the
performance of restore operations improved when we used multiple, concurrent backup devices as shown in Figure 14 and Table 7. SQL Server creates a separate restore thread for each backup
device, allowing parallel data streams to be restored to disk.
Figure 14. SQL restore performance scalability
Table 7. SQL Restore performance scalability testing results in GB or TB per hour
Configuration 1 drive 2 drives 3 drives 4 drives
Data Protector file library 162 GB/hour 281 GB/hour 280 GB/hour 267 GB/hour
VLS6510, virtual LTO-3 242 GB/hour 401 GB/hour 467 GB/hour 554 GB/hour
ESL 712e with LTO-3 331 GB/hour 629 GB/hour 798 GB/hour 1.07 TB/hour
22
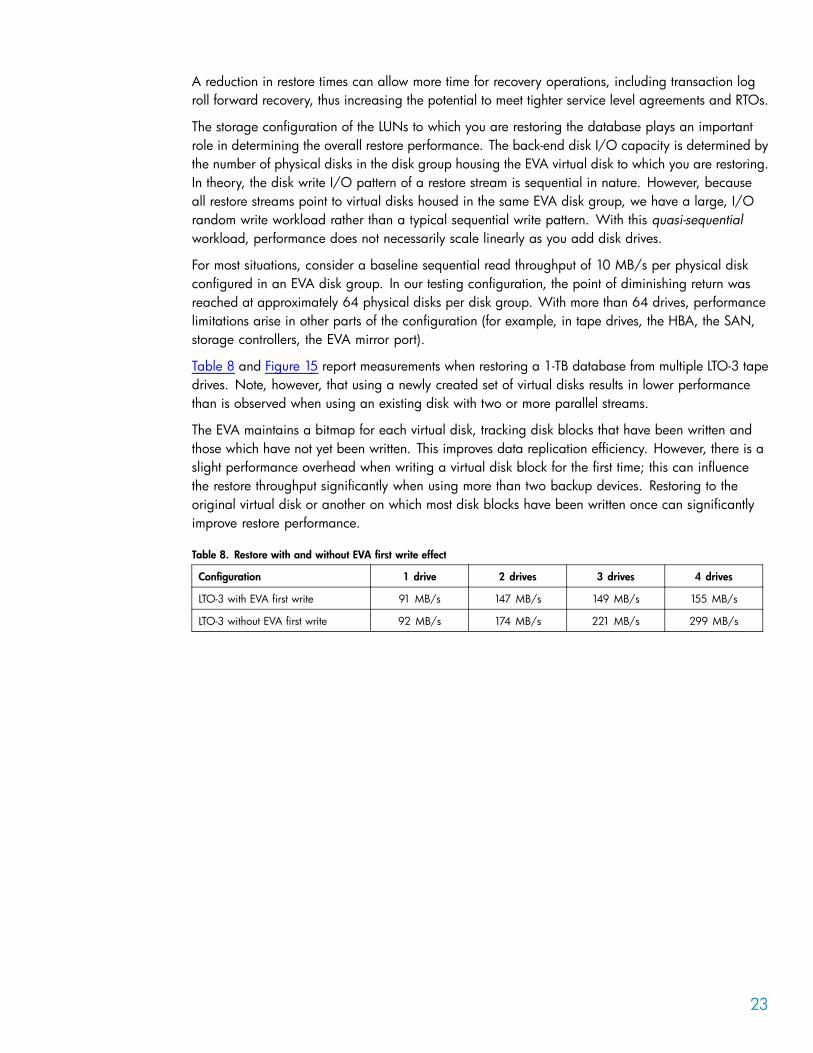
A reduction in restore times can allow more time for recovery operations, including transaction log
roll forward recovery, thus increasing the potential to meet tighter service level agreements and RTOs.
The storage configuration of the LUNs to which you are restoring the database plays an important role in determining the overall restore performance. The back-end disk I/O capacity is determined by
the number of physical disks in the disk group housing the EVA virtual disk to which you are restoring. In theory, the disk write I/O pattern of a restore stream is sequential in nature. However, because
all restore streams point to virtual disks housed in the same EVA disk group, we have a large, I/O
random write workload rather than a typical sequential write pattern. With this quasi-sequential workload, performance does not necessarily scale linearly as you add disk drives.
For most situations, consider a baseline sequential read throughput of 10 MB/s per physical disk
configured in an EVA disk group. In our testing configuration, the point of diminishing return was reached at approximately 64 physical disks per disk group. With more than 64 drives, performance
limitations arise in other parts of the configuration (for example, in tape drives, the HBA, the SAN, storage controllers, the EVA mirror port).
Table 8 and Figure 15 report measurements when restoring a 1-TB database from multiple LTO-3 tape
drives. Note, however, that using a newly created set of virtual disks results in lower performance
than is observed when using an existing disk with two or more parallel streams.
The EVA maintains a bitmap for each virtual disk, tracking disk blocks that have been written and
those which have not yet been written. This improves data replication efficiency. However, there is a
slight performance overhead when writing a virtual disk block for the first time; this can influence
the restore throughput significantly when using more than two backup devices. Restoring to the
original virtual disk or another on which most disk blocks have been written once can significantly
improve restore performance.
Table 8. Restore with and without EVA first write effect
Configuration 1 drive 2 drives 3 drives 4 drives
LTO-3 with EVA first write 91 MB/s 147 MB/s 149 MB/s 155 MB/s
LTO-3 without EVA first write 92 MB/s 174 MB/s 221 MB/s 299 MB/s
23
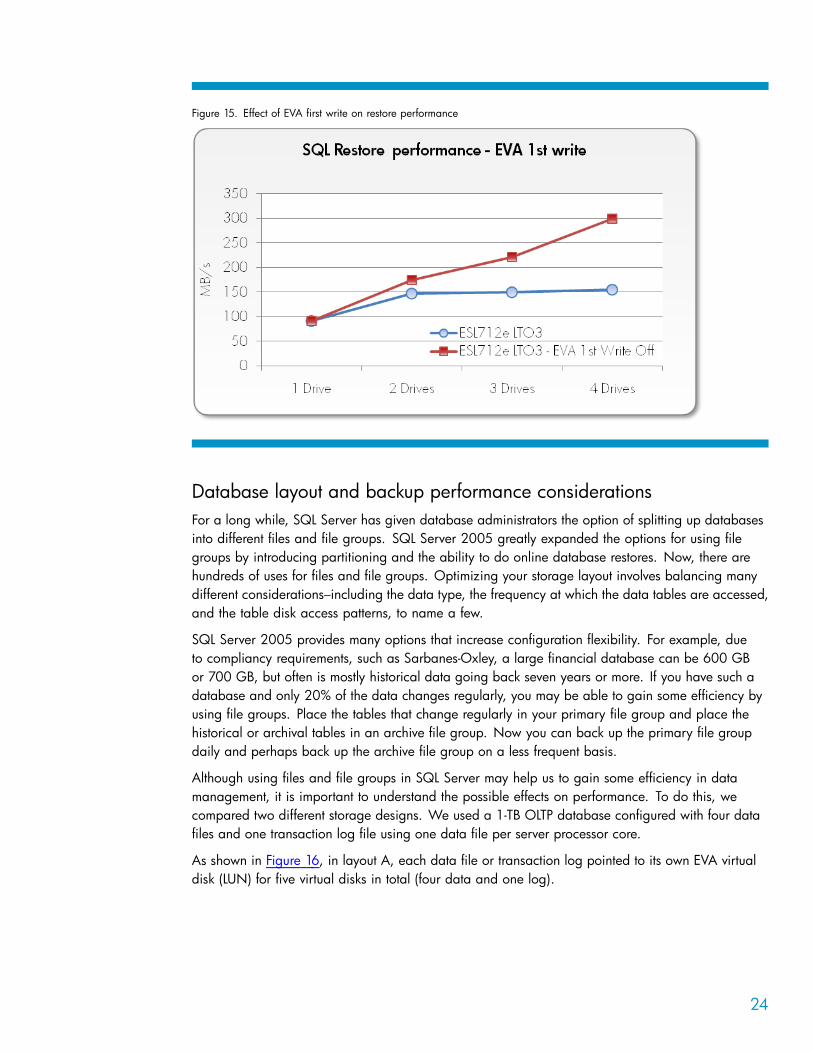
Figure 15. Effect of EVA first write on restore performance
Database layout and backup performance considerations For a long while, SQL Server has given database administrators the option of splitting up databases into different files and file groups. SQL Server 2005 greatly expanded the options for using file
groups by introducing partitioning and the ability to do online database restores. Now, there are
hundreds of uses for files and file groups. Optimizing your storage layout involves balancing many
different considerations–including the data type, the frequency at which the data tables are accessed, and the table disk access patterns, to name a few.
SQL Server 2005 provides many options that increase configuration flexibility. For example, due
to compliancy requirements, such as Sarbanes-Oxley, a large financial database can be 600 GB
or 700 GB, but often is mostly historical data going back seven years or more. If you have such a
database and only 20% of the data changes regularly, you may be able to gain some efficiency by
using file groups. Place the tables that change regularly in your primary file group and place the
historical or archival tables in an archive file group. Now you can back up the primary file group
daily and perhaps back up the archive file group on a less frequent basis.
Although using files and file groups in SQL Server may help us to gain some efficiency in data
management, it is important to understand the possible effects on performance. To do this, we
compared two different storage designs. We used a 1-TB OLTP database configured with four data
files and one transaction log file using one data file per server processor core.
As shown in Figure 16, in layout A, each data file or transaction log pointed to its own EVA virtual disk (LUN) for five virtual disks in total (four data and one log).
24
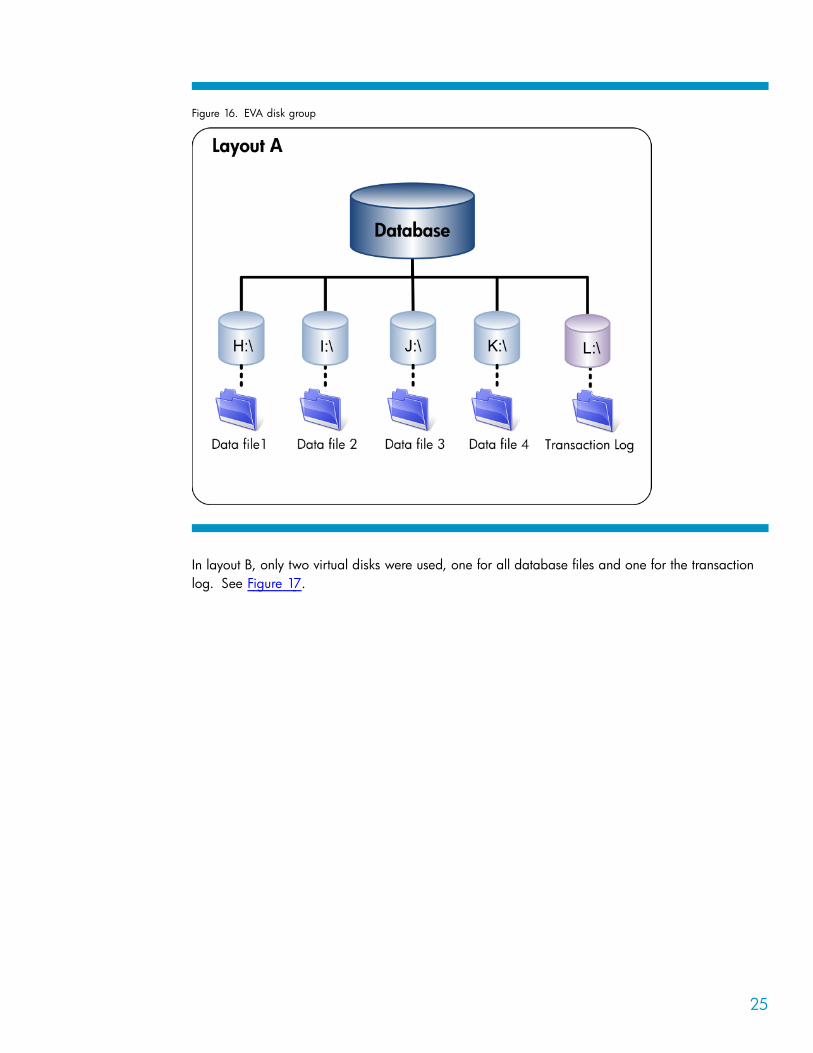
Figure 16. EVA disk group
In layout B, only two virtual disks were used, one for all database files and one for the transaction
log. See Figure 17.
25
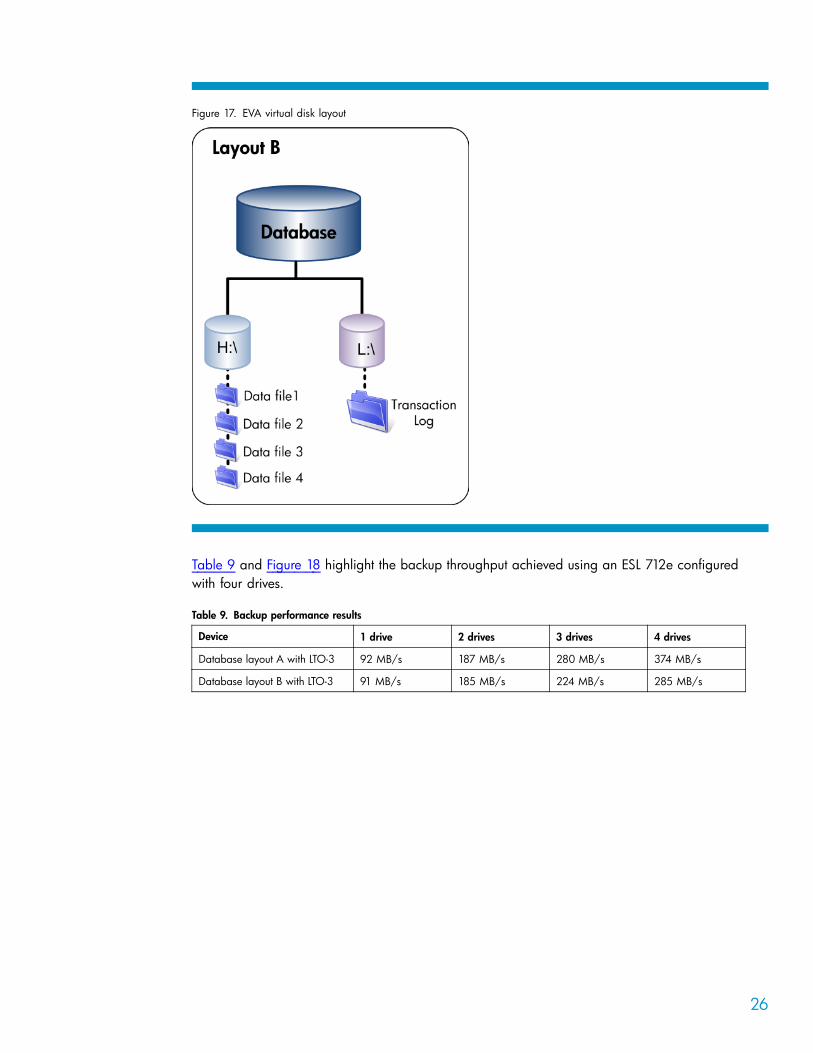
Figure 17. EVA virtual disk layout
Table 9 and Figure 18 highlight the backup throughput achieved using an ESL 712e configured
with four drives.
Table 9. Backup performance results
Device 1 drive 2 drives 3 drives 4 drives
Database layout A with LTO-3 92 MB/s 187 MB/s 280 MB/s 374 MB/s
Database layout B with LTO-3 91 MB/s 185 MB/s 224 MB/s 285 MB/s
26
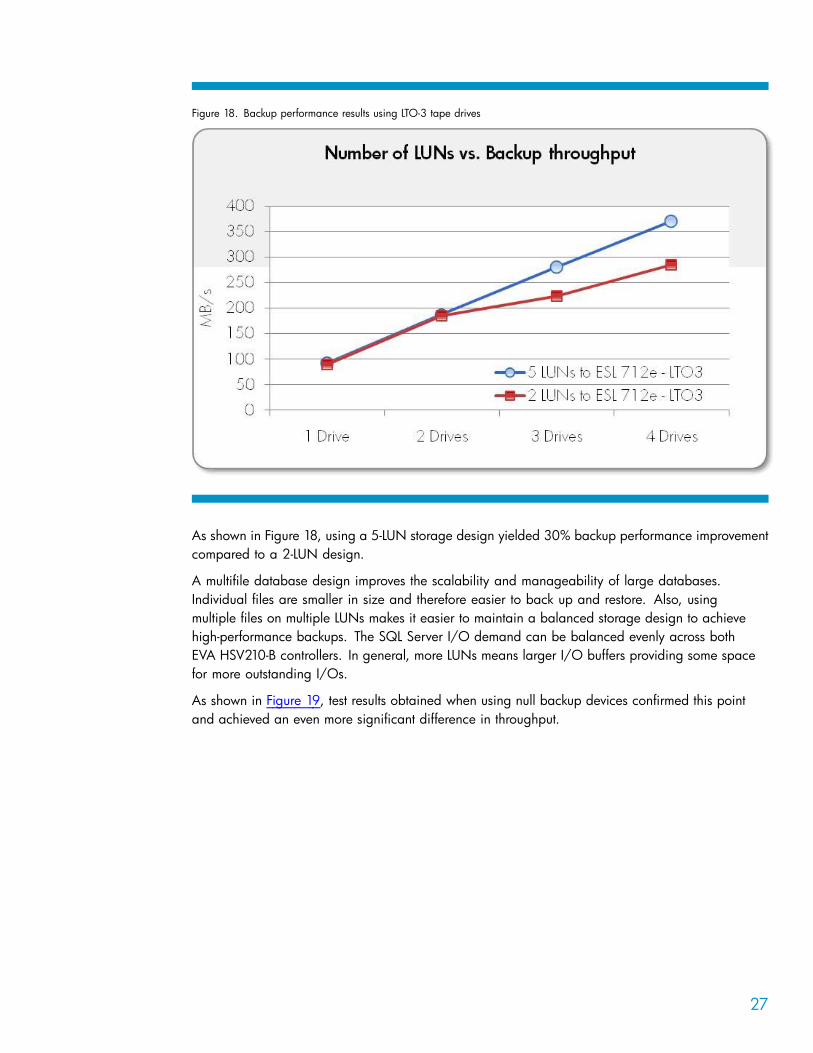
Figure 18. Backup performance results using LTO-3 tape drives
As shown in Figure 18, using a 5-LUN storage design yielded 30% backup performance improvement compared to a 2-LUN design.
A multifile database design improves the scalability and manageability of large databases. Individual files are smaller in size and therefore easier to back up and restore. Also, using
multiple files on multiple LUNs makes it easier to maintain a balanced storage design to achieve
high-performance backups. The SQL Server I/O demand can be balanced evenly across both
EVA HSV210-B controllers. In general, more LUNs means larger I/O buffers providing some space
for more outstanding I/Os.
As shown in Figure 19, test results obtained when using null backup devices confirmed this point and achieved an even more significant difference in throughput.
27
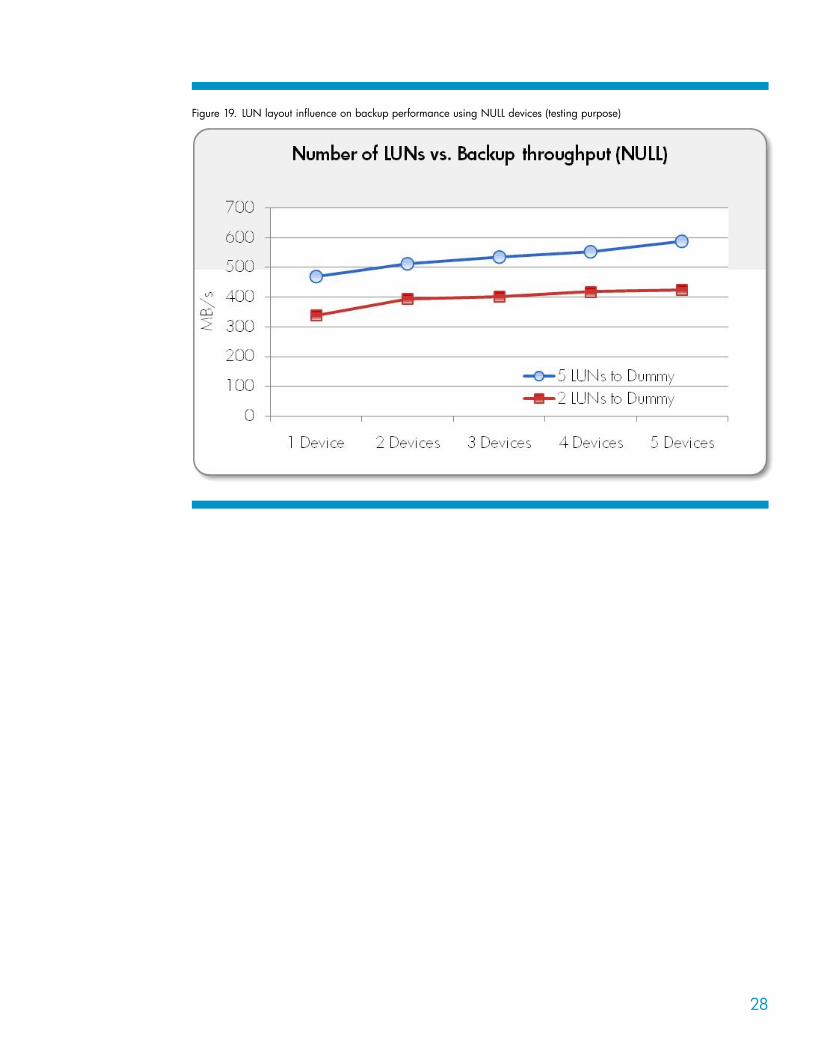
Figure 19. LUN layout influence on backup performance using NULL devices (testing purpose)
28
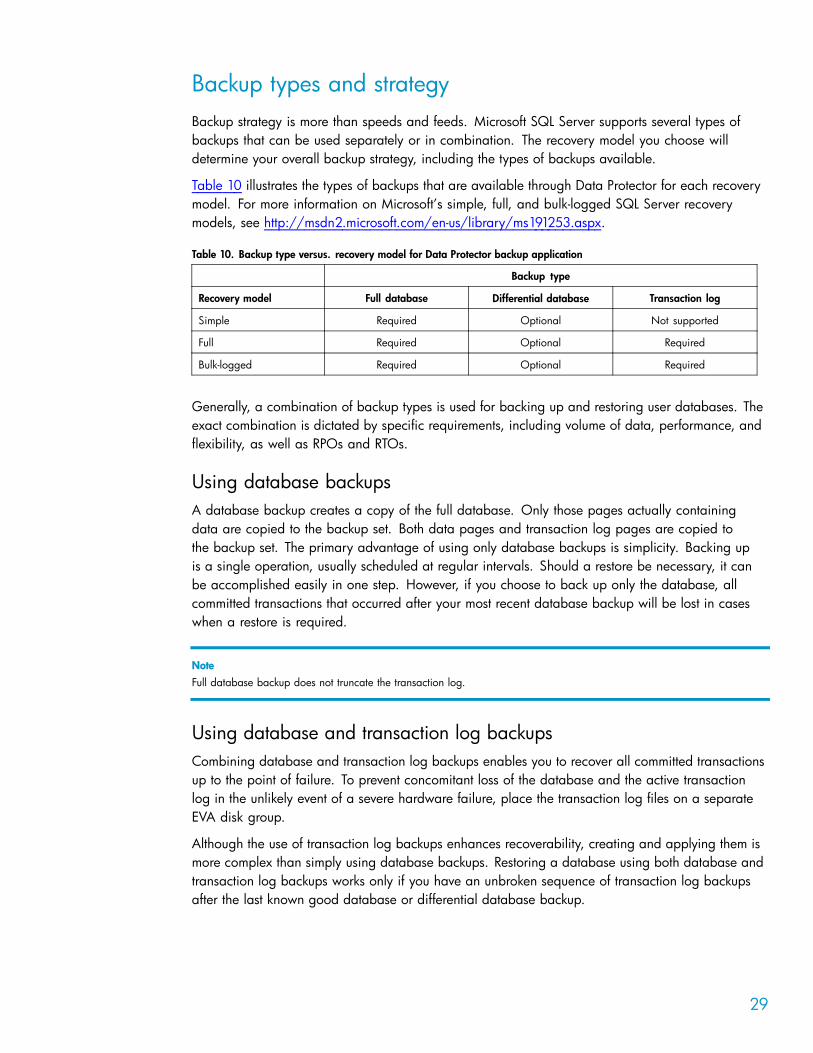
Backup types and strategy
Backup strategy is more than speeds and feeds. Microsoft SQL Server supports several types of backups that can be used separately or in combination. The recovery model you choose will determine your overall backup strategy, including the types of backups available.
Table 10 illustrates the types of backups that are available through Data Protector for each recovery
model. For more information on Microsoft’s simple, full, and bulk-logged SQL Server recovery
models, see http://msdn2.microsoft.com/en-us/library/ms191253.aspx.
Table 10. Backup type versus. recovery model for Data Protector backup application
Backup type
Recovery model Full database Differential database Transaction log
Simple Required Optional Not supported
Full Required Optional Required
Bulk-logged Required Optional Required
Generally, a combination of backup types is used for backing up and restoring user databases. The
exact combination is dictated by specific requirements, including volume of data, performance, and
flexibility, as well as RPOs and RTOs.
Using database backups A database backup creates a copy of the full database. Only those pages actually containing
data are copied to the backup set. Both data pages and transaction log pages are copied to
the backup set. The primary advantage of using only database backups is simplicity. Backing up
is a single operation, usually scheduled at regular intervals. Should a restore be necessary, it can
be accomplished easily in one step. However, if you choose to back up only the database, all committed transactions that occurred after your most recent database backup will be lost in cases when a restore is required.
Note
Full database backup does not truncate the transaction log.
Using database and transaction log backups Combining database and transaction log backups enables you to recover all committed transactions up to the point of failure. To prevent concomitant loss of the database and the active transaction
log in the unlikely event of a severe hardware failure, place the transaction log files on a separate
EVA disk group.
Although the use of transaction log backups enhances recoverability, creating and applying them is more complex than simply using database backups. Restoring a database using both database and
transaction log backups works only if you have an unbroken sequence of transaction log backups after the last known good database or differential database backup.
29
Note
Transaction log backup is only possible if the database option truncate log on checkpoint is disabled (default).
Using database and differential database backups Differential database backup records only those data changes made to the database after the last full database backup. Because a differential database backup is smaller, it takes less time to complete
than a full database backup. By creating differential database backups more frequently than full database backups, you can decrease the amount of data at risk.
Unlike transaction log backups, differential database backups do not allow a database to be restored
to the exact point of failure; only to the point in time that the differential database backup was created.
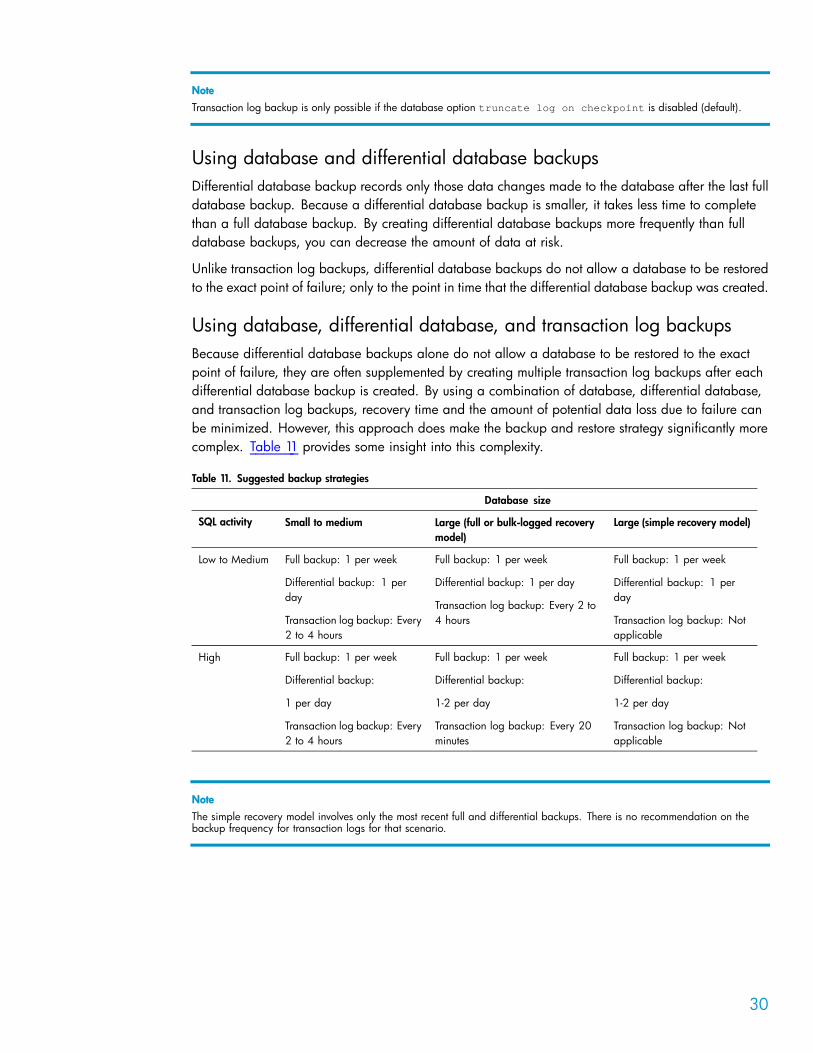
Using database, differential database, and transaction log backups Because differential database backups alone do not allow a database to be restored to the exact point of failure, they are often supplemented by creating multiple transaction log backups after each
differential database backup is created. By using a combination of database, differential database, and transaction log backups, recovery time and the amount of potential data loss due to failure can
be minimized. However, this approach does make the backup and restore strategy significantly more
complex. Table 11 provides some insight into this complexity.
Table 11. Suggested backup strategies
Database size
SQL activity Small to medium Large (full or bulk-logged recovery Large (simple recovery model) model)
Low to Medium Full backup: 1 per week Full backup: 1 per week Full backup: 1 per week
Differential backup: 1 per Differential backup: 1 per day Differential backup: 1 per day day
Transaction log backup: Every 2 to
Transaction log backup: Every 4 hours Transaction log backup: Not 2 to 4 hours applicable
High Full backup: 1 per week Full backup: 1 per week Full backup: 1 per week
Differential backup: Differential backup: Differential backup:
1 per day 1-2 per day 1-2 per day
Transaction log backup: Every Transaction log backup: Every 20 Transaction log backup: Not 2 to 4 hours minutes applicable
Note
The simple recovery model involves only the most recent full and differential backups. There is no recommendation on the backup frequency for transaction logs for that scenario.
30
Best practices and results
Database administrators
Location of SQL Server binaries
The SQL Server 2005 binaries should be placed on a drive separate from all the data drives. Reference configurations are designed with the intent that the SQL Server binaries should be placed
on the same drive as the OS. There is no performance benefit to separating the OS and SQL Server binaries on different drives.
Location of system databases
The system databases, such as the master and the msdb, should be located on one of the EVA virtual disks allocated for data use. It is beneficial to locate the databases on a SAN drive, rather than on a
disk attached directly to the server to improve high availability. In case you need to execute your disaster recovery plan and replace the entire server, it is easier to recover the system if the original system databases are located on a shared SAN drive, rather than on a local drive.
Planning for file groups
When planning for file groups, recoverability is as important as performance. Consider the need
to back up and restore your database. Using multiple files on multiple LUNs helps to maintain a
balanced storage design to achieve high-performance backups. The SQL Server I/O demand can be
evenly balanced across both EVA HSV210 controllers and, generally, the use of more LUNs means better performance. The guideline is one file per LUN per CPU core.
Using multiple data files and more than one backup device will allow for higher backup concurrency
which, in turn, provides for higher performance backups. Understanding server and storage array
utilization during backups helps to identify opportunities for increasing concurrency and backup
performance.
Setup transaction log
With an OLTP workload, good transaction log throughput is critical. However, during query
processing, the transaction log is infrequently used; therefore its location is generally not critical to
system performance. In contrast, the transaction log will be used during the data load window and
its optimal physical location will vary depending upon the recovery model used by the database
administrator (DBA) during load processing. HP recommends placing the transaction log files and
data files on separate EVA disk groups and using Vraid 1 for higher resiliency and best writing
performance.
Server administrators
Monitor server workload
Server administrators should note how SQL Server performs during backups. Servers may have room
to reconfigure backup jobs to allow for more concurrency which, in turn, should provide for better performance. Backing up a very large database with four concurrent streams using Data Protector causes a server CPU utilization of 50% on a 2 x DualCore configuration.
31
Windows Instant File Initialization
When an SQL database file is created or extended, that file is initialized by dumping zeros before the
file gets used. This can affect performance when accomplishing tasks such as database restores or creation. SQL Server 2005 now supports Windows Instant File Initialization which eliminates zeroing
out data pages that can significantly reduce the time required to restore databases.
To enable Instant File Initialization, you must run SQL Server Service account under a Windows account and assign SE_MANAGE_VOLUME_NAME special privilege to that account. This privilege is assigned to the Windows Administrators group by default. If you have system administrator rights on the server, you can assign this privilege by adding the Windows account to the Perform Volume
Maintenance Tasks security policy.
Note
Instant File Initialization does not apply to transaction log files and zeroing will happen for these files during a full database restore. HP recommends monitoring the transaction log file usage regularly to avoid large files as this may unnecessarily increase the restoration time.
Storage administrators
Monitor EVA performance
Before storage administrators set up a disk-to-disk backup scenario on the same array, they need
to characterize both the array I/O and the application workload to which the array is subjected
as follows:
• Determine the time of day or week of the lightest I/O load on the array.
• Decide whether the array configuration can handle both the production database load and the
additional load resulting from the disk-to-disk backup operation.
Backup administrators
Select the right target backup device
HP recommends disk-to-disk backup for small database size (< 100 GB). We observed limited
performance scalability when we used more than two concurrent data streams for backup and restore.
LTO-3 tape drives provide near linear scalability; the bottleneck in this testing was the SAN and
aggregated throughput (800 MB/s) of the dual-ported, 4-GB/s HBA.
Perform incremental backups to save time and space
When using very large databases with SQL Server, differential and incremental (transaction log) backups can be used instead of daily full backups. These backup types help to maintain transaction
log truncation, while reducing the amount of repeated data backed up every night. When using a
combination of differential and incremental backups, expect a longer recovery time as you need to
restore the full backup and the differential as well as every incremental in order to get the database
to a point-in-time recovery. Also, plan for enough time to perform log roll-forward recovery after the transaction log has been restored.
32

Perform transaction log backup frequently
The transaction log represents activity that is modifying data in the database. Thus its size will depend upon how many updates/inserts/deletes have been applied to the database since the
transaction log was last backed up. If you decrease the frequency of the transaction log backups, the backup file size will increase. The more frequently you back up the transaction log, the smaller each individual transaction log backup file will be and, more importantly, the more point-in-time
recovery options you will have.
Additional backup considerations
Although System State and the SQL Server 2005 database are the obvious requirements for backup policies, also consider backing up the EVA configuration data as part of the
regular backup items. EVA configuration data can be collected by running HP StorageWorks Storage System Scripting Utility (SSSU), which is included in Command View EVA or can be
downloaded as a separate update from HP. Saving this EVA configuration data will enable
a rapid reconfiguration in a disaster recovery situation if the original array is replaced. See
“HP StorageWorks Storage System Scripting Utility” on page 39 for SSSU details.
33
Conclusion
These test results demonstrate how to properly plan for, successfully deploy, and productively use
online streaming backup and recovery technologies for SQL Server 2005 with Data Protector Software and HP servers and storage. All tested configurations—LTO tape, disk-to-disk backup, and
virtual tape—have a valid place in SQL Server 2005 backup design using Data Protector.
Planning considerations
• Server workload is important to monitor. If the workload is low, consider reconfiguring your backup jobs for more concurrency, which leads to better performance.
• Leverage SQL Server files and file groups to maximize concurrency by configuring data files on dedicated LUNs.
Findings
• HP recommends disk-to-disk backup for small databases (< 100 GB). We observed limited
performance scalability when we used more than two concurrent data streams for backup and
restore.
• LTO-3 tape drives provide near linear scalability, as the bottleneck in testing is the SAN and
aggregated bandwidth (800 MB/s) of the dual−ported, 4-GB/s HBA.
• By taking advantage of the file and file group possibilities in SQL Server, database administrators can increase backup and restore throughput. Testing demonstrates that the use of four concurrent streams to four LTO-3 drives provides the fastest backups.
The test results reported in this paper and the derived best practices and recommendations, provide
users with the information necessary to plan and implement an effective and efficient SQL Server 2005 backup and recovery strategy to meet their specific requirements.
We value your feedback
In order to develop technical materials that address your information needs, we need your feedback. We appreciate your time and value your opinion. The following link will take you to a short survey
regarding the quality of this paper:http://hpwebgen.com/Questions.aspx?id=12046&pass=41514
34
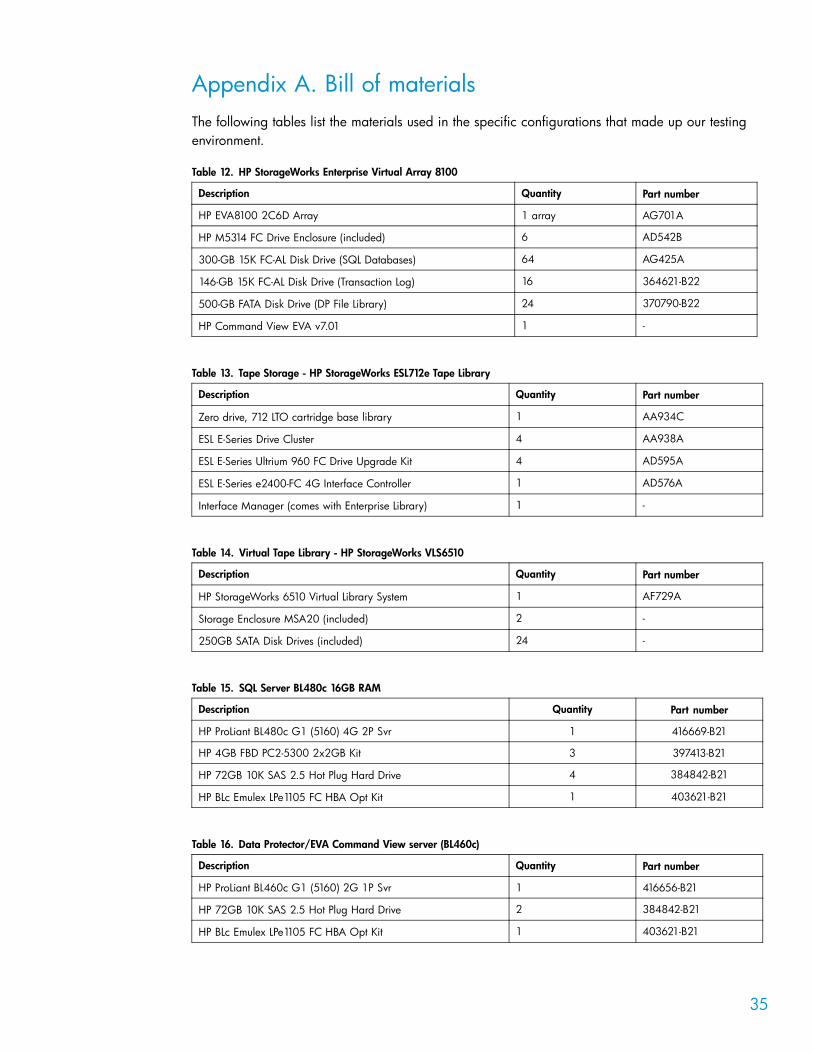
Appendix A. Bill of materials The following tables list the materials used in the specific configurations that made up our testing
environment.
Table 12. HP StorageWorks Enterprise Virtual Array 8100
Description Quantity Part number
HP EVA8100 2C6D Array 1 array AG701A
HP M5314 FC Drive Enclosure (included) 6 AD542B
300-GB 15K FC-AL Disk Drive (SQL Databases) 64 AG425A
146-GB 15K FC-AL Disk Drive (Transaction Log) 16 364621-B22
500-GB FATA Disk Drive (DP File Library) 24 370790-B22
HP Command View EVA v7.01 1 -
Table 13. Tape Storage - HP StorageWorks ESL712e Tape Library
Description Quantity Part number
Zero drive, 712 LTO cartridge base library 1 AA934C
ESL E-Series Drive Cluster 4 AA938A
ESL E-Series Ultrium 960 FC Drive Upgrade Kit 4 AD595A
ESL E-Series e2400-FC 4G Interface Controller 1 AD576A
Interface Manager (comes with Enterprise Library) 1 -
Table 14. Virtual Tape Library - HP StorageWorks VLS6510
Description Quantity Part number
HP StorageWorks 6510 Virtual Library System 1 AF729A
Storage Enclosure MSA20 (included) 2 -
250GB SATA Disk Drives (included) 24 -
Table 15. SQL Server BL480c 16GB RAM
Description Quantity Part number
HP ProLiant BL480c G1 (5160) 4G 2P Svr 1 416669-B21
HP 4GB FBD PC2-5300 2x2GB Kit 3 397413-B21
HP 72GB 10K SAS 2.5 Hot Plug Hard Drive 4 384842-B21
HP BLc Emulex LPe1105 FC HBA Opt Kit 1 403621-B21
Table 16. Data Protector/EVA Command View server (BL460c)
Description Quantity Part number
HP ProLiant BL460c G1 (5160) 2G 1P Svr 1 416656-B21
HP 72GB 10K SAS 2.5 Hot Plug Hard Drive 2 384842-B21
HP BLc Emulex LPe1105 FC HBA Opt Kit 1 403621-B21
35

Table 17. Blade Server Enclosure
Description Quantity Part number
HP BladeSystem c-Class c7000 enclosure 1 412152-B22
HP Redundant Onboard Administrator Option 1 412142-B21
GbE2c Ethernet Blade Switch for HP c7000 2 410917-B21
HP/Brocade 4/24 SAN Switch Power Pack 2 AE371A
36
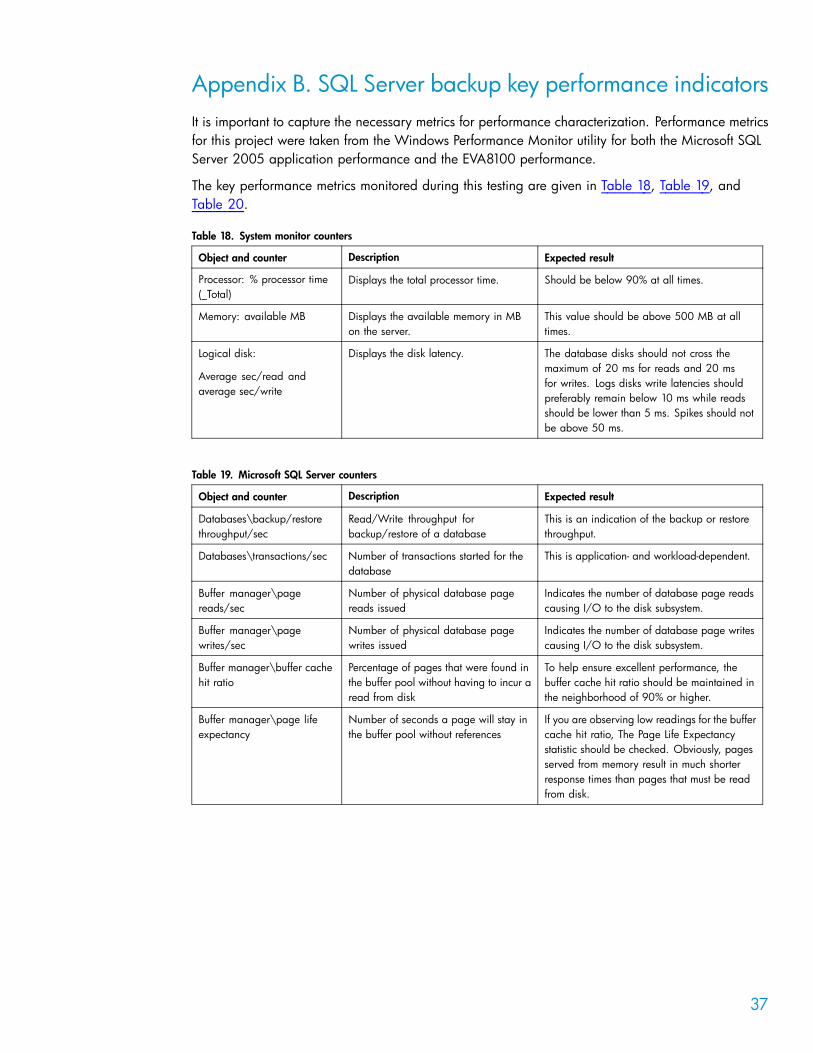
Appendix B. SQL Server backup key performance indicators It is important to capture the necessary metrics for performance characterization. Performance metrics for this project were taken from the Windows Performance Monitor utility for both the Microsoft SQL Server 2005 application performance and the EVA8100 performance.
The key performance metrics monitored during this testing are given in Table 18, Table 19, and
Table 20.
Table 18. System monitor counters
Object and counter Description Expected result
Processor: % processor time
(_Total) Displays the total processor time. Should be below 90% at all times.
Memory: available MB Displays the available memory in MB
on the server. This value should be above 500 MB at all times.
Logical disk:
Average sec/read and
average sec/write
Displays the disk latency. The database disks should not cross the
maximum of 20 ms for reads and 20 ms for writes. Logs disks write latencies should
preferably remain below 10 ms while reads should be lower than 5 ms. Spikes should not be above 50 ms.
Table 19. Microsoft SQL Server counters
Object and counter Description Expected result
Databases\backup/restore
throughput/sec
Read/Write throughput for backup/restore of a database
This is an indication of the backup or restore
throughput.
Databases\transactions/sec Number of transactions started for the
database
This is application- and workload-dependent.
Buffer manager\page
reads/sec
Number of physical database page
reads issued
Indicates the number of database page reads causing I/O to the disk subsystem.
Buffer manager\page
writes/sec
Number of physical database page
writes issued
Indicates the number of database page writes causing I/O to the disk subsystem.
Buffer manager\buffer cache
hit ratio
Percentage of pages that were found in
the buffer pool without having to incur a
read from disk
To help ensure excellent performance, the
buffer cache hit ratio should be maintained in
the neighborhood of 90% or higher.
Buffer manager\page life
expectancy
Number of seconds a page will stay in
the buffer pool without references If you are observing low readings for the buffer cache hit ratio, The Page Life Expectancy
statistic should be checked. Obviously, pages served from memory result in much shorter response times than pages that must be read
from disk.
37
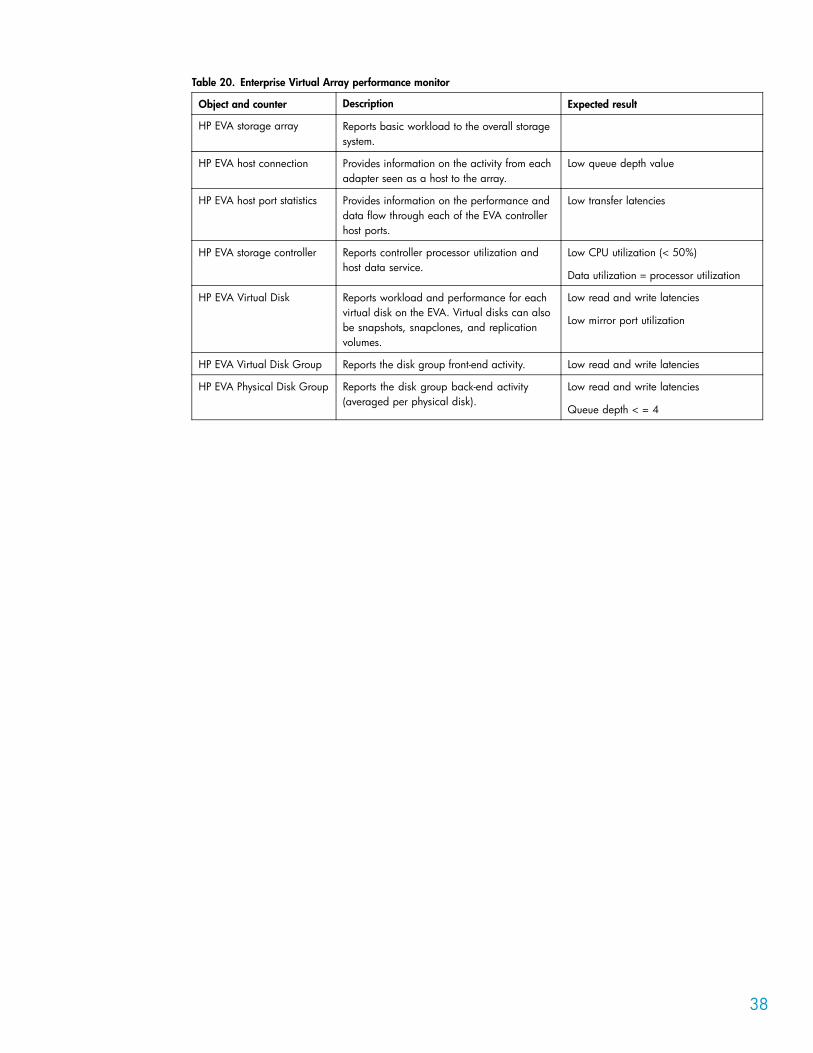
Table 20. Enterprise Virtual Array performance monitor
Object and counter Description Expected result
HP EVA storage array Reports basic workload to the overall storage
system.
HP EVA host connection Provides information on the activity from each
adapter seen as a host to the array. Low queue depth value
HP EVA host port statistics Provides information on the performance and
data flow through each of the EVA controller host ports.
Low transfer latencies
HP EVA storage controller Reports controller processor utilization and
host data service. Low CPU utilization (< 50%)
Data utilization = processor utilization
HP EVA Virtual Disk Reports workload and performance for each
virtual disk on the EVA. Virtual disks can also
be snapshots, snapclones, and replication
volumes.
Low read and write latencies
Low mirror port utilization
HP EVA Virtual Disk Group Reports the disk group front-end activity. Low read and write latencies
HP EVA Physical Disk Group Reports the disk group back-end activity
(averaged per physical disk). Low read and write latencies
Queue depth < = 4
38
Appendix C. HP StorageWorks Storage System Scripting Utility
HP StorageWorks Storage System Scripting Utility (SSSU)—is a command line interface that allows you to configure and control EVA arrays. Use the utility to script and run repetitious and complex
configuration tasks. The utility is installed on the management server when you install HP Command
View EVA. However, it can also be installed on other servers. This utility can be leveraged to
capture an exhaustive configuration report. This configuration report is stored as a script and can
be executed on a new array as a means to rebuild a similar configuration quickly. Rebuilding an
array can be time- and resource-intensive, having an up-to-date reconfiguration script can save
time in disaster recovery scenarios.
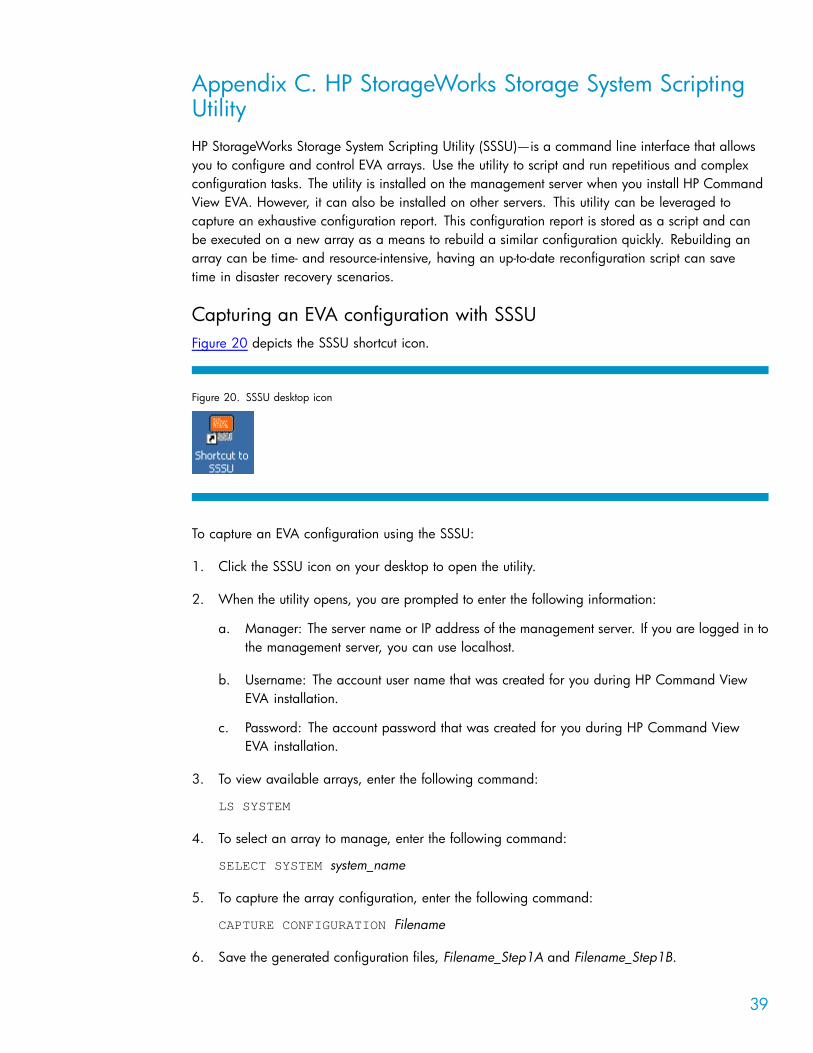
Capturing an EVA configuration with SSSU
Figure 20 depicts the SSSU shortcut icon.
Figure 20. SSSU desktop icon
To capture an EVA configuration using the SSSU:
1. Click the SSSU icon on your desktop to open the utility.
2. When the utility opens, you are prompted to enter the following information:
a. Manager: The server name or IP address of the management server. If you are logged in to
the management server, you can use localhost.
b. Username: The account user name that was created for you during HP Command View
EVA installation.
c. Password: The account password that was created for you during HP Command View
EVA installation.
3. To view available arrays, enter the following command:
LS SYSTEM
4. To select an array to manage, enter the following command:
SELECT SYSTEM system_name
5. To capture the array configuration, enter the following command:
CAPTURE CONFIGURATION Filename
6. Save the generated configuration files, Filename_Step1A and Filename_Step1B.
39

If you start the utility with arguments, the commands are executed and shown in the command
prompt. After the commands are executed, the operating system command prompt is displayed. If you start the utility without arguments, the prompt NoSystemSelected> is displayed.
40
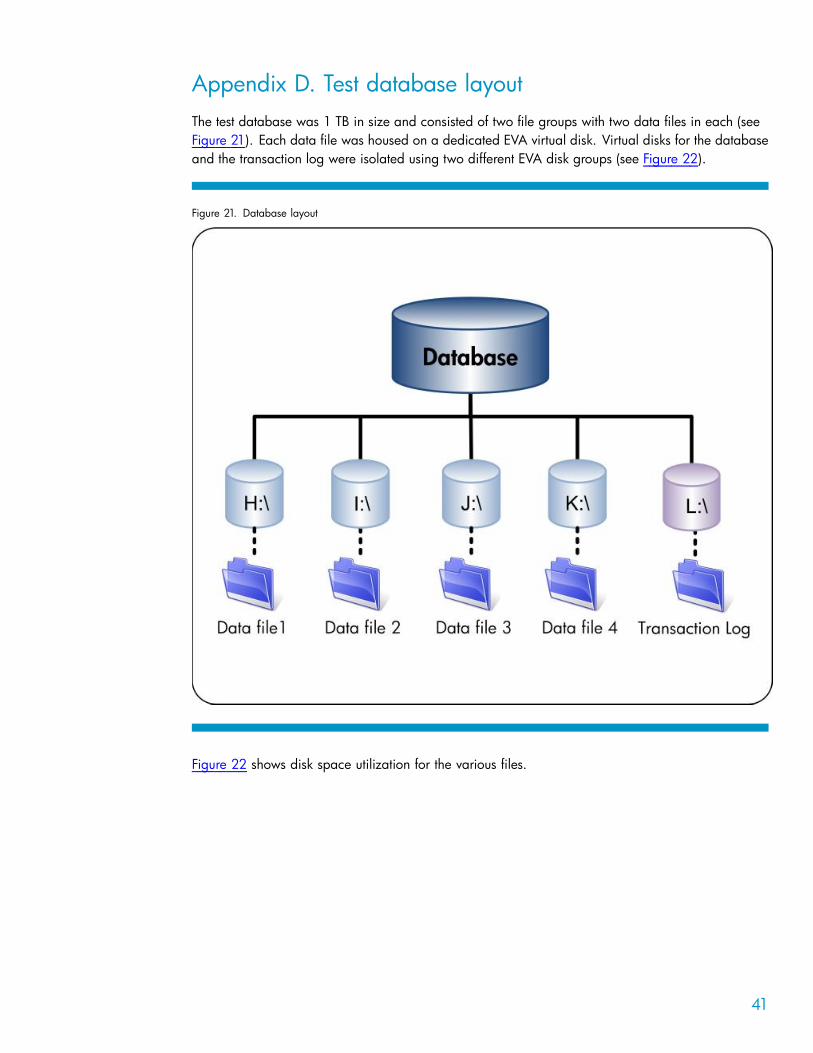
Appendix D. Test database layout The test database was 1 TB in size and consisted of two file groups with two data files in each (see
Figure 21). Each data file was housed on a dedicated EVA virtual disk. Virtual disks for the database
and the transaction log were isolated using two different EVA disk groups (see Figure 22).
Figure 21. Database layout
Figure 22 shows disk space utilization for the various files.
41
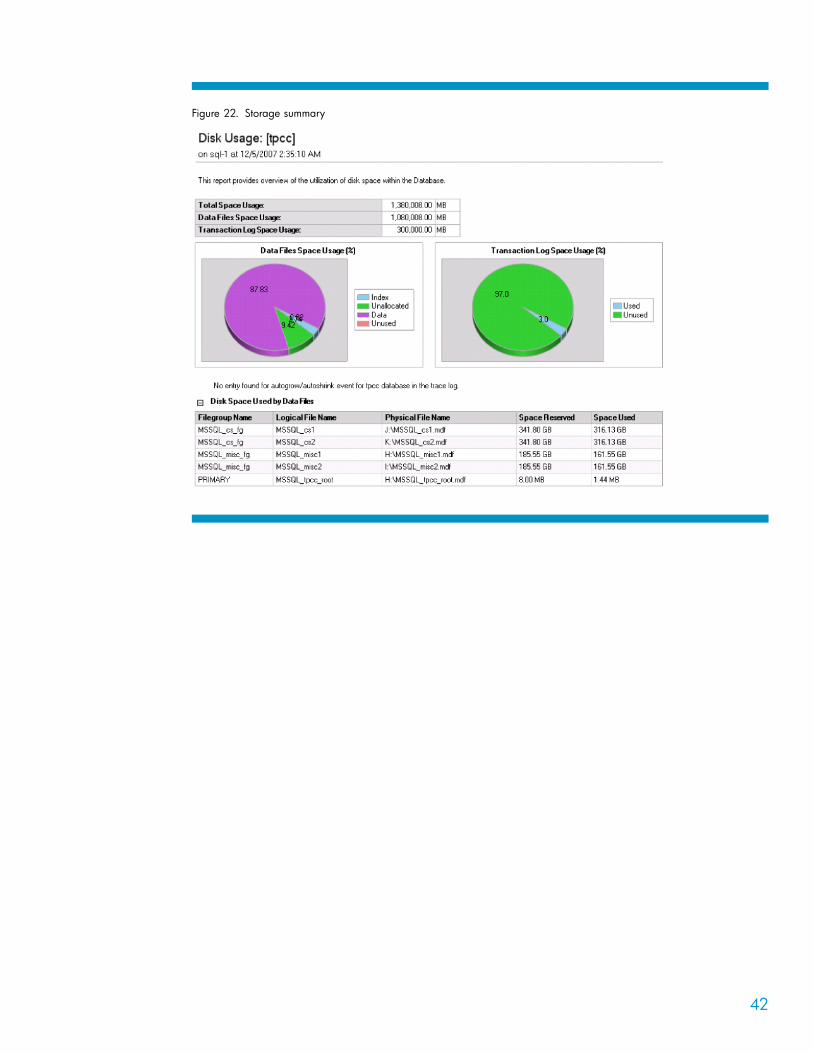
Figure 22. Storage summary
42
For more information
This section lists references and their online locations.
Some of the following links are secure websites that require an HP Passport registration. HP Passport is a single login service that lets you register with HP Passport enabled websites using a single
user identifier and password of your choice.
Data Protector Software
http://h18006.www1.hp.com/products/storage/software/dataprotector/index.html
OLTP reference configuration guidelines for Microsoft SQL Server 2005 on HP ProLiant servers
http://h71019.www7.hp.com/ERC/downloads/4AA1-5842ENW.pdf
HP ProLiant Transaction Processing Sizer for Microsoft SQL Server 2005 (x64)
http://www27.compaq.com/sb/SQLSizer/ProLiantSQL_init.asp
Active Answers – Microsoft SQL Server Solutions
http://h71019.www7.hp.com/ActiveAnswers/cache/70729-0-0-0-121.html
Customer Focused Testing solutions
http://www.hp.com/go/hpcft
Enterprise Backup Solution (EBS)
http://www.hp.com/go/ebs
HP support documentation (performance and troubleshooting)
http://www.hp.com/support/pat
HP SAN documentation
http://www.compaq.com/products/storageworks/san/documentation.html
HP IT resource center (see the forums)
http://itrc.hp.com/
© 2008 Hewlett-Packard Development Company, L.P. The information contained herein is subject to change without notice. The only warranties for HP products and services are set forth in the express warranty statements accompanying such products and services. Nothing herein should be construed as constituting an additional warranty. HP shall not be liable for technical or editorial errors or omissions contained herein. Microsoft and Windows are U.S. registered trademarks of Microsoft Corporation. 4AA1-5656ENW
43