background to the sheep sector in the european...
TRANSCRIPT

AN EVALUATION OF THE COMMONORGANISATION OF THE MARKETS INTHE SHEEP AND GOAT MEAT SECTOR
APPENDIX
Gobierno de AragónDepartamento de Agricultura y Medio Ambiente
Servicio de Investigación AgroalimentariaUnidad de Economía Agraria
FINAL REPORT
AN EVALUATION OF THE COMMON ORGANISATIONOF THE MARKETS IN THE SHEEP AND GOAT MEAT
SECTOR
APPENDIX
Prepared forThe Economic Analyses, Forward Studies and Evaluation Directorate
of the European Commission Agriculture Directorate-General
by
SACIndustry Strategy Consulting
INRADiputación General de Aragón
Contact:Stuart AshworthSAC, Auchincruive, Ayr
Tel: +44 1292 525 060Fax: +44 1292 525 052Email: [email protected]
SEPTEMBER 2000

2
CONTENTS
BACKGROUND TO THE SHEEP SECTOR IN THE EUROPEAN UNIONAND THE CURRENT COMMON MARKET ORGANISATION POLICY1 147
APPENDIX TO CHAPTER 1 170
APPENDIX TO CHAPTER 2 178
APPENDIX TO CHAPTER 3 187
STATISTICAL ANNEX 191

BACKGROUND TO THE SHEEP SECTOR IN THE EUROPEAN UNIONAND THE CURRENT COMMON MARKET ORGANISATION POLICY1
1 A earlier version of this section was first published in Ashworth et al. (1997)

148
1 SHEEP AND GOAT MEAT PRODUCTION AND TRADE IN THEEUROPEAN UNION
Production of sheep and goat meat
1.1. The EU is a major world player in the production of, and trade in, sheep and goatmeat. Statistics published by the Meat and Livestock Commission (MLC) show that formany years the EU was the largest producer of sheep and goat meat in the world.Average production in the EU - 10 increased by some 17% in the decade since theintroduction of the sheep and goat meat CMO in 1980, mainly as a result of increasedproduction in Ireland and the United Kingdom (UK). However, since 1990 sheep andgoat meat production in the EU has declined partly due to the reform of the CMO in1992. Consequently, in 1992 China became the largest sheep and goat meat producer inthe world and still retained that position in 1998 (Table 1.1). By contrast sheep and goatmeat production is the least significant of the livestock enterprises commonly found inthe EU (Figure 1.1) accounting for only 3% of meat production by volume.
Table 1.1Production of sheep and goat meat by Region
(‘000 tonnes)
1979-811 1985 1990 1995 1998
China 434 595 1068 1999 2400
European Union (15) 919 1013 1152 1175 1122
Former USSR 857 823 1010 766 n/a
Australia 635 561 743 546 615
New Zealand 568 729 584 533 542
1 Average for 1979-1981Source: FAO (1988,1993, 1996), MLC (1987, 1996a, 1999)
1.2. In terms of the total agricultural output of the EU, sheep and goat meatproduction accounted for around 4 bn ECU in 1997. However, although they onlyaccounted for 2% of the total value of agricultural production, sheepmeat and goatmeatproducers receive a disproportionately high level of support. In 1997 they received3.5% (1.4 bn ECU) of the total European Agricultural Guarantee and Guidance Fund(EAGGF) expenditure. This compares with 1.2% on pigmeat, 16.3% on beef and 7.7%on milk (Commission of the European Communities (CEC), 1999). The EU Court ofAuditors (CEC, 1995) estimated that, in 1992, each kilo of sheepmeat received 1.7 ECUof support; more than three times the support paid per kilo of beef. By 1997 this gaphad declined but it is estimated that support per kilo of meat is 50% greater in the sheepand goat sector at 1.3 ECU per kilo of meat than the beef sector.

149
Figure 1.1Meat production in the EU 1998, by volume
Sheep and goatmeat
3% Beef and veal22%
Pigmeat50%
Poultry25%
Source: MLC (1999)
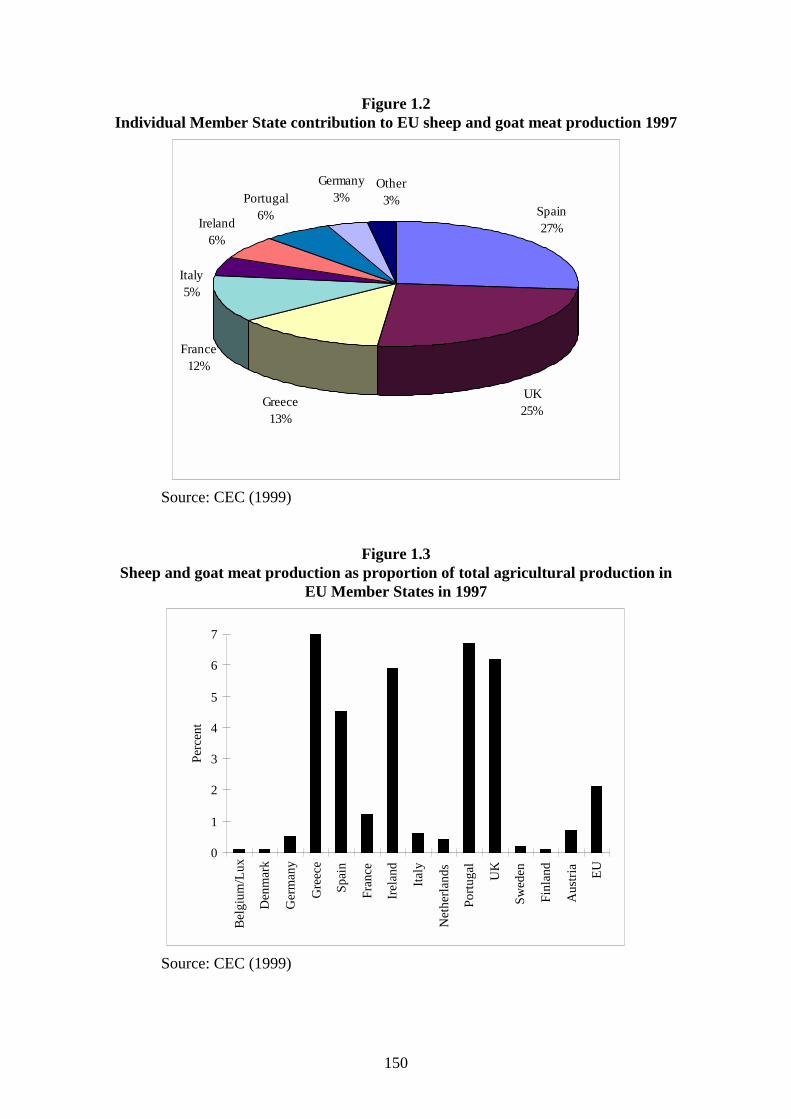
1.3. The importance of sheep and goat meat production to individual Member Statesvaries considerably. In 1997 Spain and the United Kingdom together accounted formore than 50% of the total EU production of sheep and goat meat. Greece and Francesupplied a further 25% of production (Figure 1.2). Hence, four Member States accountfor more than 75% of total sheep and goat meat production in the Community.
1.4. Equally, although sheep and goat meat only represented 2.1% of agriculturaloutput by value for the EU in 1997, it contributed more than 5% of output in Greece,Portugal, Ireland and the United Kingdom (Figure 1.3). Sheep production is also ofgreater economic significance in Spain than for the EU as a whole. In contrast, Franceis the fourth largest producer of sheep and goat meat in the EU, but sheep and goat meataccounted for only 1.2% of French final agricultural production in 1997. Sheep andgoat farming is therefore of much greater economic importance to the peripheralsouthern and north western Member States of the EU than to the central and northeastern ones.
150
Figure 1.2Individual Member State contribution to EU sheep and goat meat production 1997
Spain27%
UK25%
Greece13%
France12%
Portugal6%Ireland
6%
Italy5%
Germany3%
Other3%
Source: CEC (1999)
Figure 1.3Sheep and goat meat production as proportion of total agricultural production in
EU Member States in 1997
0
1
2
3
4
5
6
7
Bel
gium
/Lux
Den
mar
k
Ger
man
y
Gre
ece
Spai
n
Fran
ce
Irel
and
Italy
Net
herla
nds
Portu
gal
UK
Swed
en
Finl
and
Aus
tria
EU
Perc
ent
Source: CEC (1999)

151
Trade in sheep and goat meat
1.5. The gross internal sheep and goat meat production in the EU of 12 MemberStates was 1.14 million tonnes in 1994 (Table 1.2); this is a slight decline from the peaklevel of production recorded in 1991. Consumption also declined between 1991 and1994, but the level of self sufficiency remained broadly unchanged at around 83%.Gross internal production of EU - 15 in 1997 was lower than for EU - 12 in 1994 thusthe decline in production has continued beyond 1994. In line with the decline inproduction, overall self sufficiency has fallen to 81%. The deficit between internalproduction and consumption is imported from third countries. In 1997 third countryimports amounted to 287,000 tonnes (CEC, 1999), while 7,000 tonnes of sheepmeat andgoatmeat were exported.
Table 1.2Trade Balance for EU of 12 Member states
(‘000 tonnes)
1985 1988 1991 1994 19972
Production 903 1031 1221 1159 1119
Imports 254 247 258 243 287
Exports 6 7 19 7 4
Consumption1 1133 1243 1460 1395 1382
Self sufficiency (%) 79.7 82.9 83.6 83.1 81.01 Includes stock change2 EU - 15Source: CEC (1987, 1990, 1993a, 1999)
1.6. Between October 1980 and July 1995 imports of sheep and goat meat into theEU were heavily influenced by preferential trade arrangements agreed throughVoluntary Restraint Agreements (VRA). Since then preferential import terms have beenspecified by the 1994 GATT trade agreement. New Zealand was the biggest beneficiaryunder these arrangement. In 1997, New Zealand supplied approximately 83% of allsheep and goat meat imports to the EU in that year. New Zealand trades with most EUMember States, however over half its EU exports are to the United Kingdom, itstraditional trading partner. Germany, France and Greece are also significant markets forNew Zealand sheepmeat.
1.7. Significant internal trade also takes place within the EU. In 1994 some 240,000tonnes of indigenous production was traded between Member States (CEC, 1999). TheUnited Kingdom and Ireland were the major exporters of sheepmeat, while France wasthe major importer (Table 1.3 and 1.4). Internal trade in live sheep also took place,amounting to a further 31,000 tonnes of carcass weight equivalent, with France themajor importer and exporter. This level of trade makes the EU the most significantplayer in world trade of sheep and goat meat. Taking account of trade between MemberStates, 24% of world exports are sourced from the EU and almost 50% of world imports

152
are destined for the EU (FAO, 1995). Excluding internal trade between EU MemberStates, around 33% of sheepmeat entering the world market is imported into the EU.
Table 1.3Intra-EU trade in sheepmeat in 1998;
Major exporters
Exports of sheepmeat Exports of live animals
Member State '000 tonnes Member State '000 head
United Kingdom 96.7 France 887.4
Ireland 49.3 United Kingdom 304.4
Spain 15.5 Netherlands 558.7
France 8.3 Belgium 212.8
Netherlands 4.2 Ireland 180.0
Source: MLC (1999b)
Table 1.4Intra-EU trade in sheepmeat in 1998;
Major importers
Imports of sheepmeat Imports of live animals
Member State '000 tonnes Member State '000 head
France 131.2 France 688.0
Belgium 26.9 Italy1 538.7
Italy1 15.1 Spain 434.2
United Kingdom 11.3 Netherlands 346.4
Spain 4.2 Belgium 59.3
1. Figures for Italy refer to 1994Source: MLC (1999b)
SHEEP AND GOAT NUMBERS IN THE EUROPEAN UNION
1.8. In 1997, Eurostat reported a population of 96.2 million sheep and 12 milliongoats in the 15 Member States of the European Union (CEC, 1999). Spain and theUnited Kingdom have the highest population of sheep and goats of all the EU MemberStates; they account for more than 50% of the EU sheep and goat population (Figure1.4).

153
Figure 1.4Distribution of EU sheep and goat population 1997
UK26%
Spain25%Greece
14%
Italy11%
France10%
Portugal4%
Ireland5%
Germany2% Other
3%
Source: CEC (1999)
1.9. The sheep and goat industry is of particular importance to the Less FavouredAreas (LFA) of the EU where it makes a disproportionately larger contribution toagriculture in these regions compared to other agricultural commodities. In 1995 around79% of all ewes and goats on which the ewe premium was claimed were located in theLFA. However, the LFA only accounted for 55.1% of the utilised agricultural area ofthe EU in 1992. There is therefore a higher proportion of sheep in the LFA than wouldbe the case if sheep were distributed evenly across all the agricultural area (Figure 1.5).
1.10. Those Member States with the largest sheep populations namely, Spain, theUnited Kingdom, Italy and France, show the biggest difference between the percentageof sheep and land classified as in the LFA (Figure 1.5). These Member States have ahigher proportion of sheep in the LFA than would be the case if sheep were evenlydistributed across the land area. In Greece sheep are evenly distributed across LFA andnon-LFA land. It is only in the central northern Member States of the Netherlands,Belgium, Luxembourg and Germany that the percentage of sheep in the LFA is lowerthan the percentage of land classified as LFA. Thus, not only is sheep and goatproduction of greater economic importance to peripheral Member States of the EU, butit is also more likely to be located in the LFA of these Member States. As aconsequence of the distribution of sheep and goat production, it is likely that anychanges to the EU sheep and goatmeat policy will have a disproportionate economicimpact on the LFA.

154
Figure 1.5Percentage of sheep and goat premium claims and land area in LFA 1995
0102030405060708090
100
Bel
gium
/Lux
Den
mar
k
Ger
man
y
Gre
ece
Spai
n
Fran
ce
Irel
and
Italy
Net
herla
nds
Portu
gal
UK
Perc
ent
Sheep & goat premium claims Land
Source: CEC (1993b, 1995)
Change in sheep numbers in the EU since 1965
1.11. The change in sheep numbers is plotted in Figure 1.6 for the six most importantsheep producing States of the EU since 1965. Figure 1.7 presents the same data as a netpercentage change for the whole period and also as a percentage change for a fifteenyear period before and after the adoption of the sheepmeat and goatmeat regime in 1980.
1.12. The general trend over the thirty year period has been of an increase in numbersfor these countries with significant populations of sheep and goats. The largest increasehas occurred in the United Kingdom where sheep numbers in 1995 were 35% higherthan they were in 1965. The smallest changes have been in Greece where numbers areunchanged and in France where the increase since 1965 is less than 2%. Increases ofmore than 15% are recorded in Italy and Spain; however, the more accurate recording ofewe numbers required for support payments may be a contributory factor in these twocountries. In Ireland, the increase in sheep numbers over the thirty year period is 14%.

155
Figure 1.6Sheep numbers in key EU Member States 1965-1995
0
5000
10000
15000
20000
25000
30000
35000
1965 1970 1975 1980 1985 1990 1995
'000
hea
d
Greece Spain UK France Ireland Italy
Source: UN (1970), Eurostat (1994,1996a), CEC (1977, 1983)
Figure 1.7Change in sheep numbers in selected Member States 1965 to 1995
-60
-40
-20
0
20
40
60
80
100
120
140
Greece Spain UK France Ireland Italy
% c
hang
e
1965-1995 1965-1980 1980-1995
Source: UN (1970), Eurostat
156
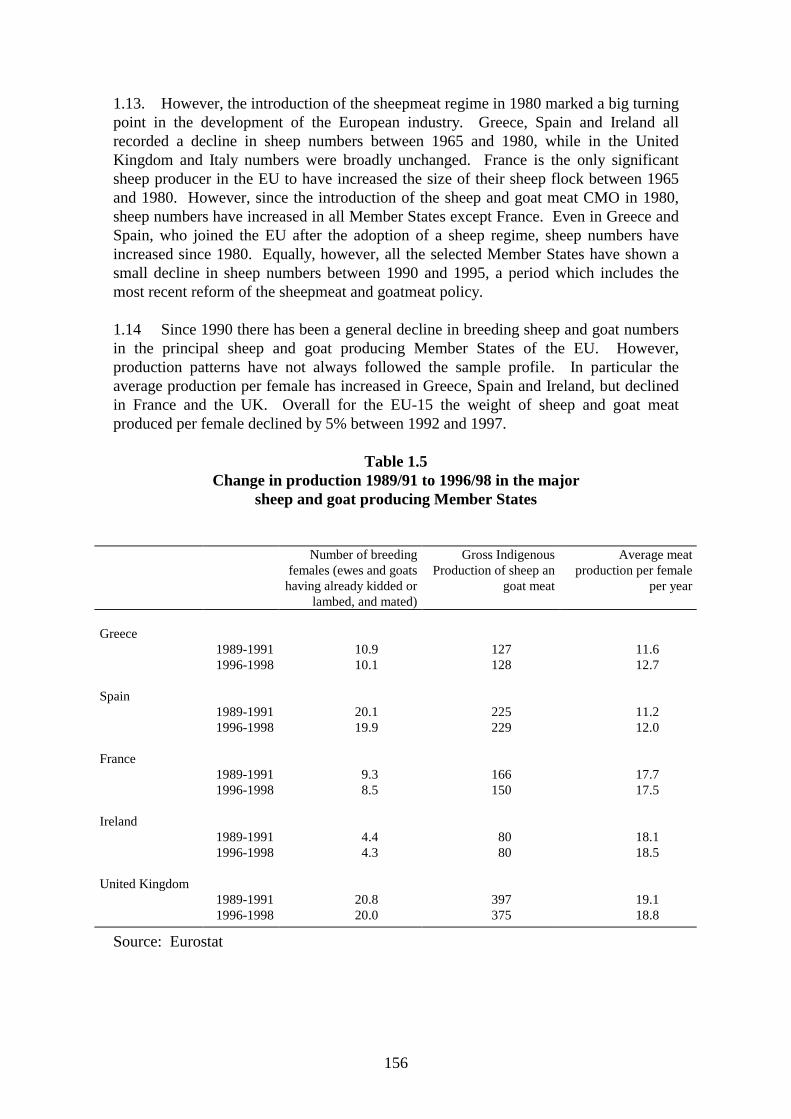
1.13. However, the introduction of the sheepmeat regime in 1980 marked a big turningpoint in the development of the European industry. Greece, Spain and Ireland allrecorded a decline in sheep numbers between 1965 and 1980, while in the UnitedKingdom and Italy numbers were broadly unchanged. France is the only significantsheep producer in the EU to have increased the size of their sheep flock between 1965and 1980. However, since the introduction of the sheep and goat meat CMO in 1980,sheep numbers have increased in all Member States except France. Even in Greece andSpain, who joined the EU after the adoption of a sheep regime, sheep numbers haveincreased since 1980. Equally, however, all the selected Member States have shown asmall decline in sheep numbers between 1990 and 1995, a period which includes themost recent reform of the sheepmeat and goatmeat policy.
1.14 Since 1990 there has been a general decline in breeding sheep and goat numbersin the principal sheep and goat producing Member States of the EU. However,production patterns have not always followed the sample profile. In particular theaverage production per female has increased in Greece, Spain and Ireland, but declinedin France and the UK. Overall for the EU-15 the weight of sheep and goat meatproduced per female declined by 5% between 1992 and 1997.
Table 1.5Change in production 1989/91 to 1996/98 in the major
sheep and goat producing Member States
Number of breedingfemales (ewes and goats
having already kidded orlambed, and mated)
Gross IndigenousProduction of sheep an
goat meat
Average meatproduction per female
per year
Greece1989-1991 10.9 127 11.61996-1998 10.1 128 12.7
Spain1989-1991 20.1 225 11.21996-1998 19.9 229 12.0
France1989-1991 9.3 166 17.71996-1998 8.5 150 17.5
Ireland1989-1991 4.4 80 18.11996-1998 4.3 80 18.5
United Kingdom1989-1991 20.8 397 19.11996-1998 20.0 375 18.8
Source: Eurostat

157
2 SHEEP AND GOAT PRODUCTION SYSTEMS WITHIN THE EU
2.1 There is considerable variation in the systems of production found within andacross the different bio-geographic regions of Europe. This section will provide anoverview of the principal production systems found in the EU.
2.2 The production systems used for sheep and goat farming can be heavilyinfluenced by land type. Sheep and goat production is more likely to be found in theLFA of the Community. In these areas, a high proportion of sheep and goats grazesemi-natural vegetation and are dominant or co-dominant with other low input extensivegrazing livestock. However, sheep production is also important within the cultivatedlands of Europe. In those areas where grassland is the major land cover, sheep and goatstend to be co-dominant with cattle or be a minority enterprise with cattle. Withincropping or mixed farming systems, sheep are typically seen as a marginal enterprise. Inmany regions where intensive arable farming has become dominant (e.g. the Parisbasin), sheep are now virtually absent.
2.3 Sheep and goat production systems, therefore, cover a wide range of farmingsituations from land with poor grazing value to intensively managed land. Furthermore,within Europe, sheep and goats are farmed across an enormous range of climaticconditions. As a consequence, sheep and goat systems continue to be enormously rich indiversity. There are a vast range of breeds used and a wide range of managementpractices adopted. The breeds used, the product and the management system are alldesigned to suit local human social needs and the farmed and natural environment. Thisdiversity of production system is in marked contrast to many other sectors, for examplethe dairy industry where the breed of cow, the management systems and the feedingsystems are becoming remarkably uniform across the world. Transhumance andstratification stand out as particular adaptations of sheep and goat farmers to the wideranges in natural environment, the seasonal variation in climate and the availability ofgrazed, browsed or conserved feed.
2.4 Transhumance typically involves seasonal grazing of high altitude pastures in thesummer and autumn and the grazing of lower altitude pastures, stubbles and woodlands,or the housing of stock, in the winter. Because of the distance between the seasonalgrazing resources, transhumance typically involves a full seasonal migration of flocksand their keepers over considerable distances, in some cases of several hundredkilometres. The seasonal flow of animals through transition pastures as snow retreatsand returns give this approach local cultural and environmental significance.Transhumance is (or has been) of considerable importance in Greece, Italy, Southernand Alpine France, Spain and Portugal.
2.5 Seasonal movement of stock also occurs in Great Britain, with the commonplacemovement of flock replacements, often over hundreds of kilometres from hill andmountain regions to lowland pastures for the winter. This is a different form ofmigration to that found in the Mediterranean regions as people do not move with thelivestock, instead the responsibilities for the stock are, usually, temporarily transferredto the farmer on whose farm the seasonal grazings are taken.2.6 Although transhumance is found in many parts of Europe, stratification iscommon only in Great Britain and Ireland. Stratification is the development of a highly
158
structured sheep industry based on the natural resources of different areas of the Countryand the sale and movement of livestock between these different areas. Typically, sheepflow from the most naturally disadvantaged areas, the hills and mountains, to the morefavoured areas, the lowlands. In the hills and mountains, sheep are bred to producelivestock which are sold to producers in the more favoured areas for use as breedingstock or for further grazing and sale as finished livestock.
2.7 Although variations in land, climate and cultures in the EU lead to manyvariations in breeds and production systems, three principal systems can be identified:
i. systems principally aimed at producing meat;ii. systems principally aimed at producing milk and dairy products; andiii.systems principally aimed at producing wool and fine fibres.
The primary output from the meat production systems is heavy lamb. These productionsystems are found throughout the EU and are the dominant small ruminant productionsystem in the Northern European States. For systems geared towards milk production,significant by-products are lambs which are sold at weaning at liveweights of less than25 kg, and are defined as light lambs. However, a common variation on the basic milkproduction system is for the lambs to be weaned and intensively reared to heavierweights which allows the producer to be classed as a heavy lamb producer. In thissituation the producer gains an added economic benefit, in that he qualifies for the fullrate of annual ewe premium. Production systems whose primary output is milk anddairy products, are predominantly found in Mediterranean Europe. Systems for whichwool and fibre production are the primary motivation are extremely rare within the EU.
2.8 Goat production systems fall into the same three principal categories as sheepproduction. However, in the countries of Northern Europe, goat production is notcommon. In Southern Europe, goat production is almost universally associated withmilk production and kids are weaned and finished at a wide range of weights in similarpatterns to lambs from dairy sheep flocks as described above.
2.9 It is most appropriate to divide sheep and goat production in Europe into twobroad categories; Northern European Systems and Southern and MediterraneanSystems. The former are categorised by significant use of grassland, by seasonalbreeding with lambing between January and May and by production of heavy lamb.These systems are found in Eire, UK, Belgium, Holland, Luxembourg, Denmark,Germany, Sweden, Finland and Central and Northern France. Milk production fromsheep and meat or milk production from goats are insignificant in Northern Europe.
2.10 Southern European Systems cover the countries of Portugal, Spain, Italy andGreece. Southern France has very similar systems to these other countries. The rangeof systems in these countries is more complex than for Northern European systems.There are both sheep and goats producing both heavy and light carcasses with a muchgreater seasonal spread of lambing and kidding than in the north. Dairy systems are alsovery important.
2.11 Northern European systems are essentially based on grass and rough grazing formeat production, while Mediterranean systems make much greater use of housing,
159
woodland, arable stubbles and arable by-products for milk and meat production. Thelevel of day-to-day shepherding is also much greater in Mediterranean Systems wherethe requirement to milk the ewe, and move sheep from over-night housing to supervisedgrazing of pastures during the day, places a high demand on labour. In NorthernEuropean systems, the sheep enterprise is often associated with other substantiallivestock or cropping enterprises. In Southern Europe the sheep or goat enterprise is amore discrete self contained enterprise.
2.12 The production systems identified all demonstrate adaptation to the environmentin which they are placed. In many situations the resource used by sheep and goats isfragile and bio-diverse and unsuitable for other agricultural activity. Nevertheless, theintegration of sheep and goats with other, larger, ruminants can be important in NorthernEurope, particularly on moorland, and in Southern Europe where integration of smallruminant systems with low density woodland is important in reducing the risk of fire.Changes to the intensity of management brought about by developments in technology,market requirements and policy influences have the potential to impact on the naturalenvironment.
3 THE CURRENT COMMON MARKET ORGANISATION POLICY
3.1 The sheep meat and goat meat regime of the European Union (EU), which wasestablished in 1980, plays a significant role in the maintenance of the income of sheepfarmers. Its rules of operation have the potential to impact on the management decisionsof sheep producers and processors and influence the shape and structure of the industry.This section establishes the background to the current regime, the framework andobjectives of the regime and identifies the key constituent parts of the regime.
Development of the regime from 1980 to 1985
3.2 The Regulation, as established by Council Regulation 1837/80, set out to createa common organisation of the market in sheepmeat and goatmeat. The regime also setout the principal objectives of the regime as:
• to establish a common organisation of the market;• to stabilise the market; and• to ensure a fair standard of living for sheep and goat farmers.
The regime comprised a common price system and a common trading system coveringboth sheep and goats. The common trading system operated through the establishmentof levies, determined monthly, on third country imports. The levy imposed variedbetween products and effectively prevented imported products reaching the market atprices below those operating in the Community. However, derogation was made forfresh, chilled and frozen sheepmeat and goatmeat imports covered under VoluntaryRestraint Agreements negotiated with traditional trading partners and already boundunder GATT agreements.
160
3.3 The price support system introduced the payment of an annual ewe premium andalso the option of using Private Storage Aid (PSA) and intervention to support themarket. PSA was designed to support the market at 90% of the Basic Price (the “priceat which intervention measures will come into operation and which will protect ....against price fluctuations on the world market”) while intervention was designed tosupport the sheepmeat market at 85% of the Basic Price. The United Kingdom was noteligible for support under the intervention system because it received derogation tocontinue operating its deficiency payment system (variable premium scheme), whichhad been applied prior to joining the EEC, up to a price level set at 85% of the BasicPrice. Development of the regime from 1985 to 1992 3.4 At the end of the transition period and ahead of the accession of Spain andPortugal to the European Community in 1986, the sheep and goatmeat regime wasreviewed. Several changes to the regime were introduced between 1986 and 1992. Thenature of these changes and the reasons for change are described below. 3.5 The review of the regime carried out in 1984 resulted in modifications to theregime being introduced in 1986. Council Regulation 3523/85 recognised that in someareas of the Community the first lambing of ewes did not take place at the normal agebecause of particularly severe natural and climatic conditions. Therefore, theyconcluded that the annual premium should be extended to specific breeds of ewes,which were not yet in lamb, in these areas. However, because production costs for eweswhich do not lamb at the normal age are lower than for breeding ewes, the rate ofpayment was set at 80% of the rate paid to ewes. An eligible female sheep other than aneligible ewe was defined by Regulation 3524/85 as a female sheep intended for flockreplacement which belonged to a specified breed and already had two replacementincisor teeth on the first day of application for a premium. 3.6 By 1988 the Agriculture Council had become concerned that the expansion insheep meat production which had occurred since 1980, combined with the EU'scommitment to VRAs (cf para. 3.29), was leading to a situation where the market couldbe become unstable through over supply. It was concluded that it was becomingimportant not to encourage the production of sheepmeat and goatmeat (CouncilRegulation 1115/88). To this end a stabiliser was introduced whereby for every onepercent increase in the number of ewes over the number of ewes in December 1987 theBasic Price would be reduced by one percent. By reducing the Basic Price, the level ofsupport would be reduced and it was hoped that this would reduce the growth in sheepnumbers. Two stabilisers were introduced, one for Great Britain, which still operatedthe variable premium scheme, and a second for the remainder of the Community. 3.7 In 1990 the regime was further consolidated and amended, and a new BasicRegulation, Council Regulation 3013/89, was adopted. Two substantial changes wereadopted. Firstly, it was recognised that account must be taken of differentspecialisations of production systems in the Community and secondly, in order to limitany increase in budget cost, provision should be made for limiting the full rate of thepremium to 1000 animals per producer in the LFA and to 500 animals per producer in

161
other areas. Payment of half rate premium was to be made beyond these limits. CouncilRegulation 3013/89 established two categories of sheep meat producer; a heavy lambproducer and a light lamb producer. 3.8 Under the terms of Council Regulation 3013/89 Great Britain agreed to phaseout the use of the variable premium scheme by the end of 1992 in line with the creationof the Single European Market and the need for the establishment of a single set ofpolicy measures. The new Basic Regulation also ended the use of intervention as amarket support option although Private Storage Aid was retained. 3.9 In the Less Favoured Areas (LFA) a further payment to sheep and goat farmerswas introduced in 1991. This payment has become known as the LFA supplement,although it is more accurately described as the Rural World Payment (RWP), and is paidonly in these areas. This payment was introduced on the basis that measures previouslyintroduced had made provision to reduce the level of support to the industry. Anyreduction in support would have unfavourable consequences for the LFA andparticularly in those areas where there was no alternative to sheep and goat farming. Itis not influenced by market prices although the number of animals for which payment ismade is constrained in the same way as the annual ewe premium payment. 3.10 Consequently, at the end of 1992 a common mechanism for supporting theprimary sheep producer applied across the EU comprising of an annual ewe premiumsupported by Private Storage Aid (PSA) in certain circumstances. Development of the regime since 1992 3.11 The sheep and goat meat regime was completely reviewed as part of theMacSharry reform of the Common Agricultural Policy completed in 1992. At theconclusion of the review the Council of the European Communities observed that theupward trend in ewe numbers was leading to a substantial drop in prices and havingserious repercussions on the market balance, and that the increase in production wasresulting in a steady increase in support expenditure. They concluded that more severemeasures were needed to create a balanced market and control expenditure. As a resultCouncil Regulation 2069/92 was adopted. This regulation imposed finite limits, orquotas, on the number of animals to be supported. This was implemented at the level ofthe producer. This quota was based on the number of ewes on which an individualproducer claimed premium in a given reference year. Each Member State could choosefrom 1989, 1990 or 1991. In recognition that sheep production is of greater importancein some areas than others, measures were adopted to prevent the movement of supportpayment rights to producers outside those regions where sheep and goat production is atraditional and important part of the rural economy. These regions have become knownas sensitive zones. However, Member States were allowed freedom in defining theseareas and making provision for transfer of quota between producers. Measures werealso taken to allow limited movement of entitlement rights between producers, andguidance was given on the handling of producer rights when land was sold or tenanciesrelinquished. Furthermore, to assist new entrants, a system of national reserves wasestablished. The national reserve was created in the first instance by reducing the
162
reference flock by between 1% and 3% and then fuelled by siphoning a proportion ofquota from individual producers who transfer quota without land. 3.12 At the same time (1992), and following from a recognition that difficultiesexisted in monitoring the definition of an eligible ewe, the definition was simplified toany animal which has lambed once or is over one year old at the end of the retentionperiod. This made it possible for full premium payments to be received on non-productive ewes and ended the reduced rate of payments that applied to a limitednumber of ewes which did not lamb at the normal age. Previous to this simplificationan eligible ewe had been defined as a female sheep which had been put to the ram forthe first time or had lambed at least once. The operation of the sheep meat and goatmeat regime was further simplified in 1995 by ending the restriction, on individualproducers, to half rate premium payments on ewe numbers above given thresholds. Thiswas done by converting the half rate rights into full rate rights by dividing by two thenumber of ewes to which half rate premium had been applied. 3.13 Increasing concerns about the impact of increasing sheep numbers on theenvironment resulted in the EU making provision, in 1994 (Council Regulation 233/94),for Member States to introduce penalties on sheep producers in certain circumstances.The penalties imposed would reflect the nature and severity of the environmentaldamage and could result in the total withdrawal of sheep annual premium payments. 3.14. Following the 1994 GATT agreement the EU sheepmeat and goatmeat tradepolicy, which had remained unchanged since the introduction of the sheepmeat andgoatmeat regime, was reformed. Voluntary Restraint Agreements were replaced bycountry-specific tariff quotas and additional non-country specific quotas wereintroduced for other countries. However, although import levies were abolished exportscontinue to require licences. 3.15. In 1998 the regulations were consolidated into a new Basic Regulation, CouncilRegulation 2467/98. The key elements of the framework created by this regulation arediscussed in the following section. THE EU SHEEP MEAT REGIME IN 2000 AND ITS MAIN FEATURES 3.16. The Basic Regulation determining the EU policy towards the commonorganisation of the market in sheepmeat and goatmeat is Council Regulation 2467/98.The regulation restates the objectives of the policy as being:
• to establish a common organisation of the market;• to stabilise the market; and• to ensure a fair standard of living for sheep and goat farmers.
The Regulation establishes that the organisation of the EU market in sheepmeat andgoatmeat should comprise both price and trading arrangements and cover both sheepand goats. The various arrangements comprise:

163
i. an annual ewe premium, often referred to as the sheep annual premium(SAP);
ii. private storage aid (PSA);iii. export refunds (currently not applied); andiv. import duties, which only apply beyond tariff free quota limits.
This evaluation study will only consider the role of the annual ewe premium.
3.17. The determination of actual Representative Market prices and the annual fixingby the European Commission of a Basic Price are critical features of both the SAP andPSA and are central to the operation of the EU sheep regime. Both these pricingfeatures are briefly described.
Basic Price
3.18. The Basic Price is set each year by the Agricultural Council in the annual farmprice negotiations. The price is fixed at the Council's discretion and the followingfactors are taken into consideration:
i. the situation on the sheep market during the current year;ii. the prospects for the production and consumption of sheep meat;iii. sheep meat production costs;iv. the market situation in the other livestock product sectors, particularly
beef and veal; andv. past experience.
The Council also fix seasonally adjusted, weekly Basic Prices to take account of thenormal seasonal variations in the Community market for sheepmeat.
3.19. Since 1988 the Basic Price has been reduced by a budget stabiliser. Thismechanism was an attempt to discourage continued expansion of the sheep flock inview of the changing market balance and the Community's international commitmentsby reducing the degree of guarantee offered by the SAP (Commission Regulation1115/88). If the size of the estimated Community flock exceeds the maximumguaranteed number (63.4 million head), then the Basic Price is, in principle, reduced bya corresponding percentage. However, since 1993 the stabiliser has been fixed at 7% ofthe Basic Price, irrespective of the size of the Community flock (Council Regulation2069/92). Consequently, the European Commission set the Basic Price each year andthen reduce it by 7%.
Representative price
3.20. The representative price is a weekly average weighted price for standard qualitysheepmeat carcasses in representative Community markets. It is the price for the mostwidespread production system, on average, found throughout the Community. Theweightings given to each Member State reflect the proportion of total Communityproduction accounted for by the particular State.

164
3.21. Only specified categories of carcass from lambs under twelve months of age areused in determining the representative price. However, because of the wide variationsin standards and interpretations of the quality of sheepmeat in the Community, thespecification used to report market prices is different for each Member State.Furthermore, individual Member States may use only a sample of markets, weighted inrelation to their importance in the national market balance, when reporting therepresentative prices. In Great Britain, for example, all auction markets are used, withthe weighting of each market varying weekly, but no deadweight centres are included.In contrast, in Spain, for example eight regional markets are used and Ireland uses amixture of markets and abattoirs. In Great Britain and Ireland prices are reported forlambs in the weight range 12-21.5 kg carcass weight, while in Spain the prices are onlyreported for lambs between 12-16 kg carcass weight.
3.22. Using both the Basic Price and the Representative Price the, EuropeanCommission can determine both:
i. the value of the aid paid to producers in the form of the ewe premium, fromthe difference between what is received from the market (the weekly EUreference price) and what is considered by the European Commission to bea reasonable return for the producer's efforts, the seasonally adjusted BasicPrice; and
ii. the point at which the European Commission should intervene, by usingPSA, in the normal activity of the market to moderate falls in price.
The calculation of the annual ewe premium is explained below.
Annual ewe premium
3.23. The annual ewe premium, commonly called the Sheep Annual Premium (SAP),is the cornerstone of the sheepmeat and goatmeat regime. The objective of the premiumwas clearly established in Article 5.1 of Council Regulation 1837/80 as “To the extentnecessary to offset the loss of income which may result from the establishment of thecommon organisation provided for by this regulation, a premium shall be granted forthe benefit of sheepmeat producers”. The current implementing regulation (CouncilRegulation 2467/98) replaces original article 5.1 with “To the extent necessary to offsetincome loss by sheepmeat producers in the Community during the marketing year, apremium shall be granted. To this end, a single income loss shall be determined whichshall be deemed to be any difference, per 100 kilograms carcass weight, between thebasic price and the arithmetic mean of the weekly market prices...”.
3.24. As noted above, the premium is calculated from the annual average differencebetween the Basic Price, adjusted for the budget stabiliser, as determined by theEuropean Commission, and the market determined representative price. This pricecomparison gives a value for the income loss per 100 kg of sheepmeat produced. As thecompensation is paid to the producer as a premium on the breeding ewe, and not thelamb meat produced, the income loss per 100 kg of sheepmeat needs to be translatedthrough a coefficient into a headage payment per ewe.

165
3.25. This translating mechanism is known as the technical coefficient. The technicalcoefficient is derived from the average weight of lamb meat produced throughout theCommunity by a ewe producing a heavy lamb. This is currently estimated at 15.68 kg(Council Regulation 377/99). Thus, because the income loss is measured per 100 kg oflamb meat, the income loss per ewe is obtained by multiplying this loss by 0.1568,which is the technical coefficient.
3.26. The ewe premium is paid to producers of heavy lambs who apply for premiumand who meet specific entitlement requirements. Producers must retain the number ofewes on which they have claimed the premium for a retention period of 100 days(Council Regulation 2700/93) and the necessary quota, or entitlement, to receivepremium on the number of ewes they claim for.
3.27. In recognition of different production systems and physical constraints onproduction, two supplements or amendments to the basic annual ewe premium apply.
i. Less Favoured Area supplement:
In recognition of the problems faced by sheep and goat producers as a consequence ofthe physical constraints of farming in the LFA and of the potential impact of previousmodifications to the Basic Regulation, an annual supplement introduced in 1991(Council Regulation 1323/90). This supplement is known as the Rural WorldSupplement and is currently worth 6.641 euro per ewe. The value of this supplement isindependent of the annual ewe premium calculation.
ii. Ewes producing light lambs
For ewes producing light lambs the premium is calculated in exactly the same way asfor heavy lamb producers, but it is reduced to 80% of the full premium rate. CouncilRegulation 3013/89 established that "a producer of light lambs is to be understood asany sheep farmer marketing sheep's milk products based on sheep's milk.". However,the Regulation also established that, as long as a producer can show that at least 40% ofhis lambs are finished as heavy lambs, then he can claim full premium on all his ewesassuming he meets the other conditions of eligibility. Lambs finished as heavycarcasses require that they are finished at least 45 days after weaning with a minimumaverage weight at sale of 25 kg liveweight. It is important to note that individual ewesare not classed as heavy or light, but producers are classified as either a keeper of ewesfor heavy or light lamb production.
Private Storage Aid
3.28. Apart from the ewe premium, price support is also provided through PrivateStorage Aid (PSA) which involves a payment to private companies to removesheepmeat from the market during periods of very low market prices. The scheme maybe triggered at a fixed price when market prices in the Member State and the EU fallbelow 90% of the seasonally adjusted Basic Price. If market prices in the Member Stateand the EU fall below 70% of the seasonally adjusted Basic Price PSA may operate

166
through a tender procedure. The meat removed is frozen and stored for an agreed periodof between three and seven months, at the end of which the owner is permitted to sellthe product on the open market. The main distinction between PSA and the interventionsystem for beef is that at no time is the lamb purchased by the EU.
Import levies and export refunds
3.29. The Basic Regulation also makes provision for import levies and export refundsto be used to stabilise the Community market by preventing fluctuations in the worldmarket prices from disturbing Community prices. This may occur when the worldmarket price is below the Basic Price. However, the size of the levies and refunds isbound under GATT and under trade agreements with traditional trading partnersestablished under Voluntary Restraint Agreements (VRAs). VRAs were agreementsbetween the EU and its traditional trading partners, whereby the trading partners agreedto restrict their exports to the EU in exchange for a reduction in the customs dutycharged.
3.30. Following the GATT agreement of 1994, the EU now operates a system ofcountry-specific tariff quotas in place of the pervious VRAs. Imports within the limitsof the country-specific tariff quota are allowed in free of customs duty. New Zealand isthe main beneficiary of this agreement, as it was under the VRA system, holding226,700 tonnes, or 78%, of the total allowance. The timing of imports can have aninfluence on the market and may in the future have a limited influence on productionsystems. Imports outside the country-specific tariff quotas are charged an import duty.
3.31. Although very little sheep and goat meat is exported out with the EU, any tradewhich does take place is controlled by the operation of export licences, except for purebred breeding sheep. Provision exists for payment of export refunds, but none arecurrently paid.
Limitations on the amount of premium received
3.32. Two limitations may apply to the level of annual ewe premium that a producermay receive. These take the form of an individual quota and an environmental crosscompliance measure.
Individual quota
3.33. With effect from the 1993 marketing year the European Commission introducedlimits on the amount of annual ewe premium which an individual can receive (CouncilRegulation 2069/92). Payments of annual ewe premium were limited to the number ofanimals for which an individual was paid premium in a reference year chosen from1989, 1990 or 1991. This limit has become known as the individual's quota. However,to provide for changes to the assets or production capacity of the recipient, allowancewas made for the transfer of quotas and for the creation of a national reserve. Thenational reserve is to be used to help producers in special circumstances, particularlynew entrants, to establish or expand their sheep enterprise. Established producers canbuy, sell or temporarily lease quota rights, if they so wish. However, the Regulation

167
requires that necessary measures to avoid quotas being moved from sensitive zones, orregions where sheep production is especially important to the local economy, beintroduced. Thus, each producer is only allowed to trade entitlement rights inspecifically defined areas; a principle which has become generally known as “ring-fencing”.
3.34. Although there is general agreement that the “ring-fence” principle is valid, thereare some concerns that they may result in some environmental damage (CEC, 1996).The concern arises from a view that accumulation of rights within the ring-fenced areasmay be leading to localised environmental damage. Equally it may be asserted that theapplication of ring-fencing can prevent the movement of rights to other zones whichmay benefit from increased sheep numbers, for example some lowland areas of Britain.
Environmental cross-compliance
3.35. Council Regulation 233/94 introduced the option for Member States to limit orabolish payments under the premium scheme for producers of sheepmeat and goatmeat,if the producer does not comply with rules fixed by the Member States with respect tothe environment. Currently the United Kingdom is the only Member State to applyenvironmental cross-compliance criteria to the application of the sheepmeat andgoatmeat regime.
REFERENCES
Ashworth, S.W., Waterhouse, A., Treacher, T. and Topp, K. (1997) The EuropeanUnion Sheepmeat and Goatmeat Regime and its Effect on the Environment. Areport for the Land Use Policy group of the British Countryside Agencies, SACAuchincruive.
CEC, (1999) The Agricultural Situation in the Community. 1998 report, Office forOfficial Publications of the European Communities, Luxembourg.
CEC, (1996) Com(96) 44 Report from the Commission to the Council on theapplication of the individual producer limits in the Annual Ewe Premium andSuckler Cow Premium Schemes. Office for the Publications of the EuropeanCommunities, Luxembourg
CEC, (1995) Special report No. 3/95 on the implementation of the interventionmeasures provided for by the organisation of the market in the sheepmeat andgoatmeat sector" Official Journal of the European Communities C285 Vol. 38,28 October 1995, p1.
CEC, (1993a) The Agricultural Situation in the Community. 1992 report, Office forOfficial Publications of the European Communities, Luxembourg.
168
CEC, (1993b) Support for farms in mountain, hill and less-favoured areas GreenEurope 2/93, Office for Official Publications of the European Communities,Luxembourg.
CEC, (1990) The Agricultural Situation in the Community. 1989 report, Office forOfficial Publications of the European Communities, Luxembourg.
CEC, (1987) The Agricultural Situation in the Community. 1986 report, Office forOfficial Publications of the European Communities, Luxembourg.
CEC, (1983) The Agricultural Situation in the Community. 1982 report, Office forOfficial Publications of the European Communities, Luxembourg.
CEC, (1977) The Agricultural Situation in the Community. 1976 report, Office forOfficial Publications of the European Communities, Luxembourg.
Commission Regulation 2700/93 OJ L 245, 1.10.93 Office for the Publications of theEuropean Communities, Luxembourg
Council Regulation 1837/80 OJ L183. 16.7.80 Office for the Publications of theEuropean Communities, Luxembourg
Council Regulation 3523/85 OJ L 336, 14.12.85 Office for the Publications of theEuropean Communities, Luxembourg
Council Regulation 3524/85 OJ L 336, 14.12.85 Office for the Publications of theEuropean Communities, Luxembourg
Council Regulation 1115/88 OJ L 110, 29.4.88 Office for the Publications of theEuropean Communities, Luxembourg
Council Regulation 3013/89 OJ L 289, 7.10.89 Office for the Publications of theEuropean Communities, Luxembourg
Council Regulation 1323/90 OJ L 132, 25.5.90 Office for the Publications of theEuropean Communities, Luxembourg
Council Regulation 2069/92 OJ L 215, 30.7.92 Office for the Publications of theEuropean Communities, Luxembourg
Council Regulation 3887/92 OJ L 391, 31.12.92 Office for the Publications of theEuropean Communities, Luxembourg
Council Regulation 233/94 OJ L 30, 3.2.94 Office for the Publications of the EuropeanCommunities, Luxembourg
Council Regulation 2467/98 OJ L 312, 20.11.98 Office for the Publications of theEuropean Communities, Luxembourg
169
Council Regulation 377/99 OJ L 46 20/2/99 Office for the Publications of the EuropeanCommunities, Luxembourg
Eurostat, (1996) Agricultural Statistical Yearbook 1996. Office for OfficialPublications of the European Communities, Luxembourg.
Eurostat, (1994) Agricultural Statistical Yearbook 1994. Office for OfficialPublications of the European Communities, Luxembourg.
FAO, (1996) Production Yearbook 1995, FAO, Rome.,
FAO, (1995) Trade Yearbook 1994, FAO, Rome.
FAO, (1993) Production Yearbook 1992, FAO, Rome.,
FAO, (1988) Production Yearbook 1987, FAO, Rome.,
MLC, (1999a) International meat market review No. 26, MLC, Milton Keynes.
MLC, (1999b) European Handbook Volume 2 section 5, MLC, Milton Keynes.
UN, (1970) Review of the Agricultural Situation in Europe at the End of 1969 - Volumeone, General survey, Grain, Livestock and meat. UN, New York.

170
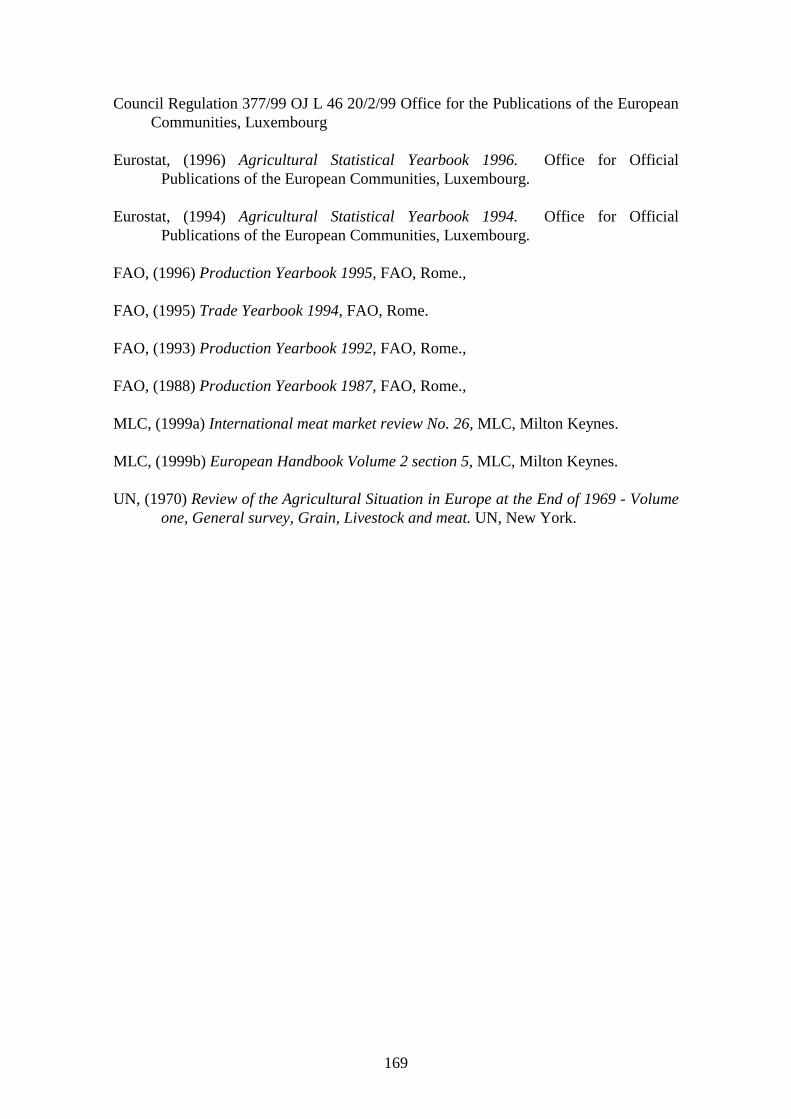
APPENDIX TO CHAPTER 1
171
Figure a1.1.1Farm Net Value Added per Agricultural Work Unit - UK
0
5000
10000
15000
20000
25000
30000
35000
1989 1990 1991 1992 1993 1994 1995 1996
Euro
per
AW
U
All farms Specialist sheep
Figure a1.1.2Farm Net Value Added per Agricultural Work Unit - Ireland
0
2000
4000
6000
8000
10000
12000
14000
16000
1989
1990
1991
1992
1993
1994
1995
1996
1997
Euro
per
AW
U
All farms Specialist sheep
172
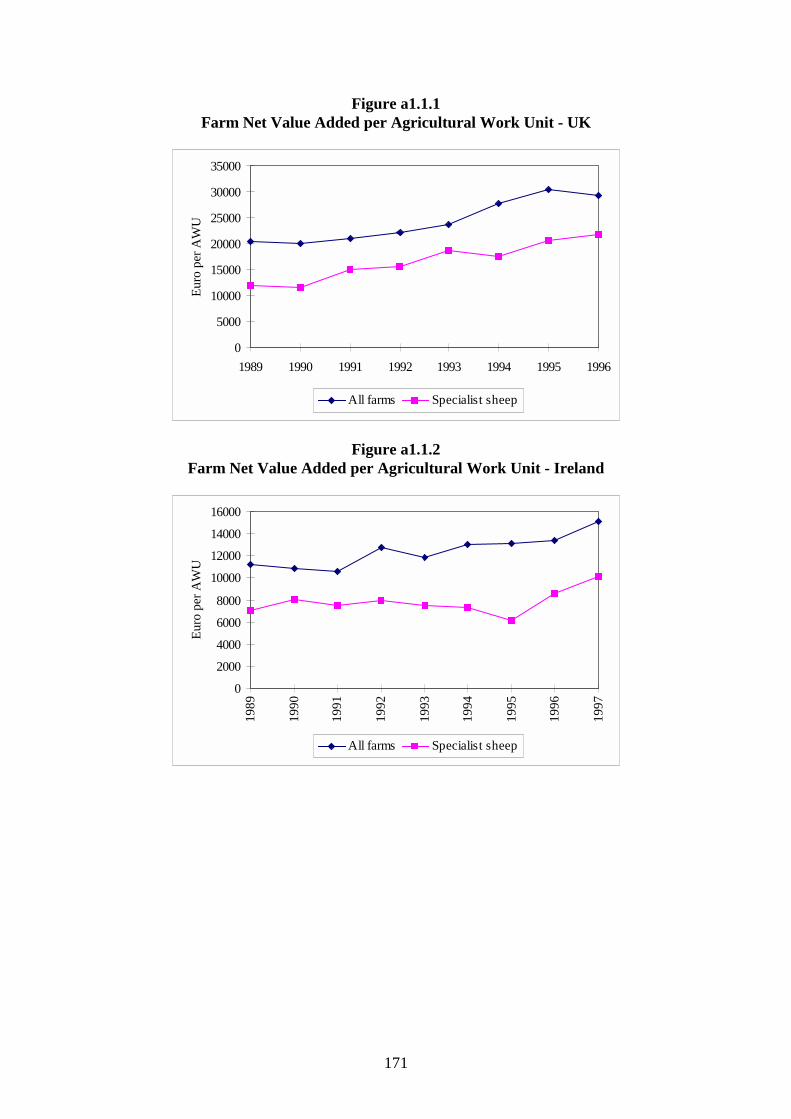
Figure a1.1.3Farm Net Value Added per Agricultural Work Unit - France
0
5000
10000
15000
20000
25000
30000
1989
1990
1991
1992
1993
1994
1995
1996
1997
Euro
per
AW
U
All farms Specialist sheep Specialist goat
Figure a1.1.4Farm Net Value Added per Agricultural Work Unit - Spain
0
5000
10000
15000
20000
25000
1989
1990
1991
1992
1993
1994
1995
1996
1997
Euro
per
AW
U
All farms Specialist sheep Specialist goat

173
Figure a1.1.5Farm Net Value Added per Agricultural Work Unit - Greece
0100020003000400050006000700080009000
10000
1989 1990 1991 1992 1993 1994 1995 1996
Euro
per
AW
U
All farms Specialist sheep Specialist goat
Figure a1.2.1Farm Net Value Added per Agricultural work unit categorised by farm location.
United Kingdom
0
5000
10000
15000
20000
25000
30000
35000
1989 1990 1991 1992 1993 1994 1995 1996
Euro
per
AW
U
All farms Specialist LFA sheep Specialist non LFA sheep
174
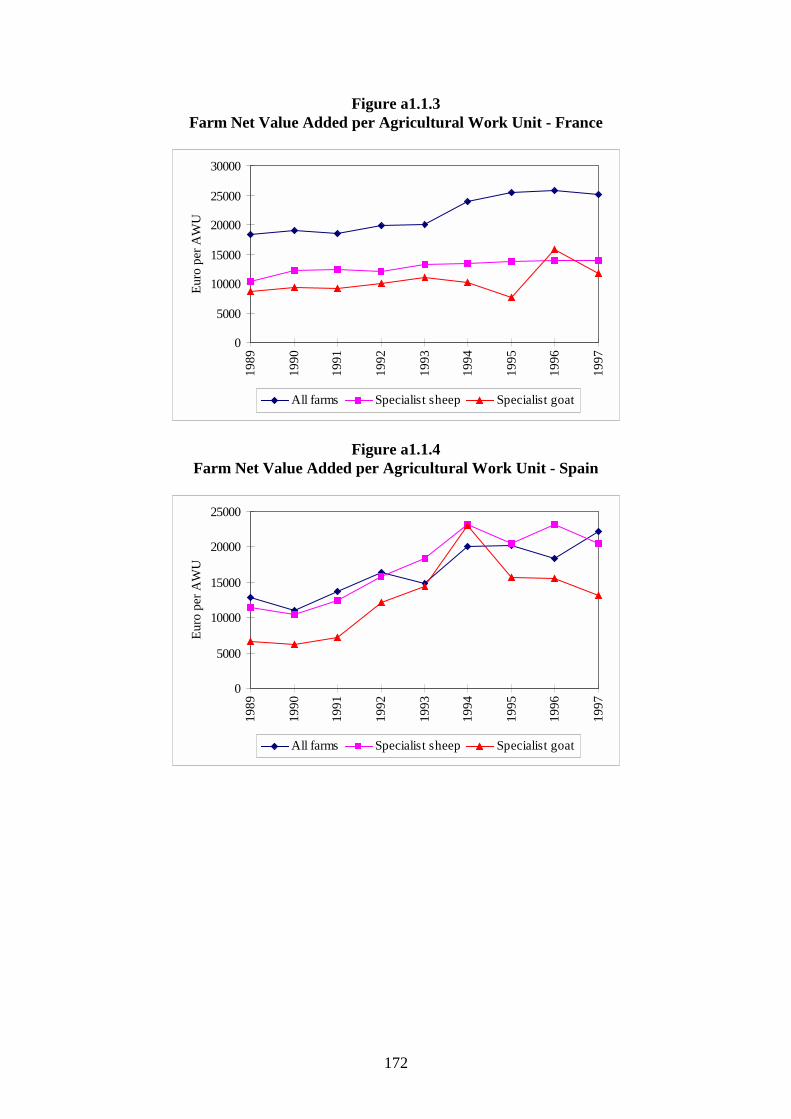
Figure a1.2.2Farm Net Value Added per Agricultural work unit categorised by farm location.
Ireland
0
2000
4000
6000
8000
10000
12000
14000
16000
1989
1990
1991
1992
1993
1994
1995
1996
1997
Euro
per
AW
U
All farms Specialist LFA sheep Specialist non LFA sheep
Figure a1.2 3Farm Net Value Added per Agricultural work unit categorised by farm location
France
0
5000
10000
15000
20000
25000
30000
1989
1990
1991
1992
1993
1994
1995
1996
1997
Euro
per
AW
U
All farms Specialist LFA sheep Specialist non LFA sheep

175
Figure a1.2.4Farm Net Value Added per Agricultural work unit categorised by farm location
Spain
0
5000
10000
15000
20000
25000
1989
1990
1991
1992
1993
1994
1995
1996
1997
Euro
per
AW
U
All farms Specialist LFA sheep Specialist non LFA sheep
Figure a1.2.5Farm Net Value Added per Agricultural work unit categorised by farm location
Greece
0
1000
2000
3000
4000
5000
6000
7000
8000
1989 1990 1991 1992 1993 1994 1995 1996
Euro
per
AW
U
All farms Specialist LFA sheep Specialist non LFA sheep

176
GLS Study
In a study published in May 1999, “Typologie des systèmes d’élevage herbivore dansl’Union Européenne” by F. Colson, V. Chatellier, M.-A. Fuentes, INRA / LERECO,Nantes, May 1999.Contrat VI / A3 / 002 Commission Européenne - Direction GénéraleVI Agriculture - Analyses économiques - Prospectives. Unité Analyse de la situation desexploitations agricoles (VI.A.3), the typology of livestock grazing systems is differentfrom the one (based on Technico - economic orientation (TEO)) generally used in thepresentation of the results of FADN. In this study all (1.6 million) the farms withgrazing animals are involved. Using the TEO classification for grazing livestock farmsonly 844,000 are identified. It can be concluded therefore, that approximately 820,000farms hold grazing livestock a s secondary activity. These farms are included in theGLS study farm types. The key for the distribution of farms in the different farm typesis presented in Table 1 below.
Table 1Indicators for Grazing Livestock Systems
Grazinganimals (CU)
Cattle (CU) Dairy cows(CU)
Sheep &Goats (CU)
Sheep &Goats CU /
Total GrazingCU
S & G milk& dairyGross
product /Total S & G
GrossProduct
Sheep dairyGross
Product / S &G dairy Gross
Product
Farm withgrazinganimals
>1
Dairy Cattle ≥ 5 ≥ 3 ≥ 3Dairy Cattlewith DairySheep &
Goats
≥ 5 ≥ 3 ≥ 3 ≥ 20% ≥ 50%
Dairy Cattlewith MeatSheep &
Goats
≥ 5 ≥ 3 ≥ 3 ≥ 20% <50%
Beef Cattle ≥ 5 ≥ 3 <3Beef Cattlewith DairySheep &
Goats
≥ 5 ≥ 3 <3 ≥ 20% ≥ 50%
Beef Cattlewith MeatSheep &
Goats
≥ 5 ≥ 3 <3 ≥ 20% <50%
Sheep &Goats
≥ 5 <3 <3 ≥ 3
Meat Sheep& Goats
≥ 5 <3 <3 ≥ 3 <50%
Dairy Sheep ≥ 5 <3 <3 ≥ 3 ≥ 50% ≥ 50%Dairy Goats ≥ 5 <3 <3 ≥ 3 ≥ 50% <50%Small sizeGrazing
Husbandry
1 - 4
CU= Cattle UnitsSource GLS Study

177
Table 2Some characteristics of EU-15 farms with sheep and goats (1995)
Economicsize
(Economicsize units)
Net valueadded per
Labour Unit(ECU)
Labour Unit /Farm
Animalhusbandrysubsidies /
Labour Unit
PermanentGrass area asa percent of
Totalpermanentgrass area
Sheep andGoats CU asa percent ofTotal Sheepand Goats
UnitsAll farms 26 15 293 1.6 1 058Farm with
grazinganimals
30 16 208 1.7 2 021 100 100
Dairy Cattle 41 20 382 1.9 1 031 46 8Dairy Cattlewith DairySheep &
Goats
21 12 600 2.0 1 022 - 1
Dairy Cattlewith MeatSheep &
Goats
46 19 328 2.1 3 994 2 4
Beef Cattle 28 13 350 1.5 4 897 42 36Beef Cattlewith DairySheep &
Goats
23 12 802 1.8 2 779 1 3
Beef Cattlewith MeatSheep &
Goats
31 16 805 1.6 9 416 18 30
Sheep &Goats
18 11915 1.6 1 931 11 54
Meat Sheep& Goats
22 14 451 1.5 3 999 8 31
Dairy Sheep 13 9 956 1.7 1 774 2 18Dairy Goats 15 10 065 1.8 1 999 1 5Small sizeGrazing
Husbandry
9 4 942 1.5 273 1 2
Source : GLS Study.

178
APPENDIX TO CHAPTER 2

179
Figure 2.2.1Seasonal pattern of goats slaughtered - EU (1992-98 av)
0
50
100
150
200
250
300
Jan Feb Mar Apr May Jun Jul Aug Sep Oct Nov Dec
per c
ent o
f ann
ual m
onth
ly a
vera
ge
Heads Kg/head Price

180
Figure 2.2.2Seasonal pattern of goat slaughtered - Greece (1992-98 av)
0
50
100
150
200
250
300
350
Jan Feb Mar Apr May Jun Jul Aug Sep Oct Nov Dec
per c
ent o
f ann
ual m
onth
ly a
vera
ge
Heads Kg/head Price
181
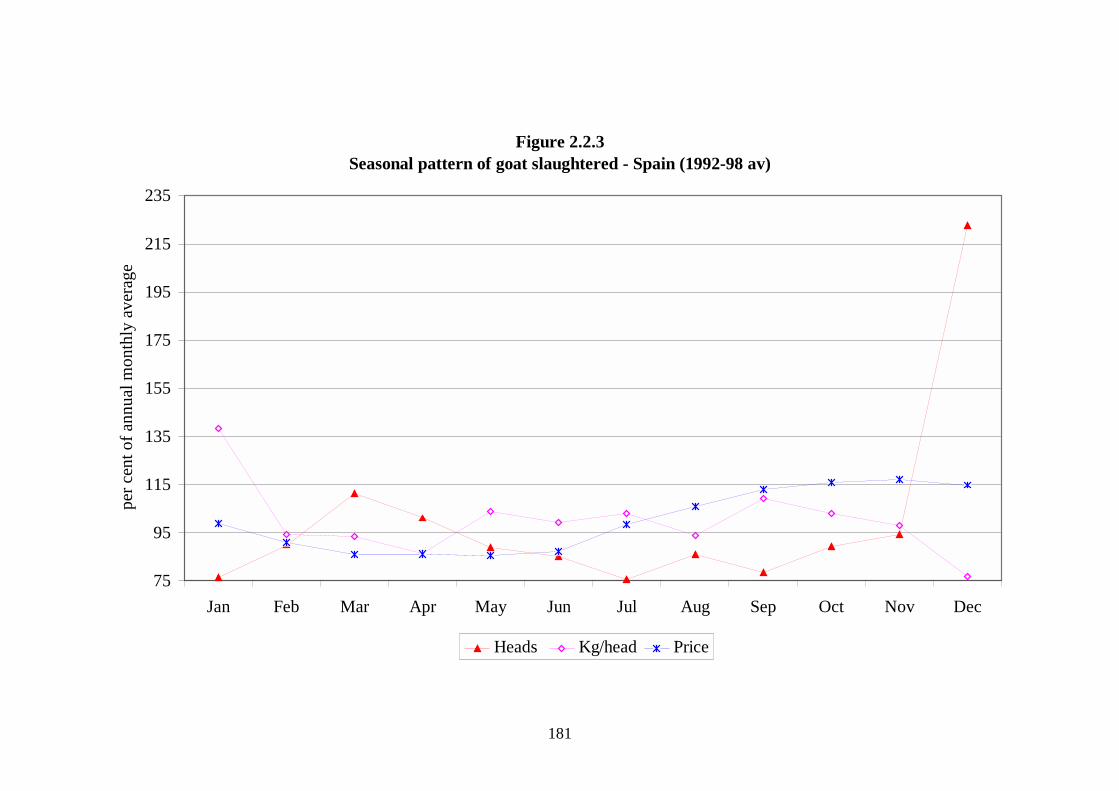
Figure 2.2.3Seasonal pattern of goat slaughtered - Spain (1992-98 av)
75
95
115
135
155
175
195
215
235
Jan Feb Mar Apr May Jun Jul Aug Sep Oct Nov Dec
per c
ent o
f ann
ual m
onth
ly a
vera
ge
Heads Kg/head Price
182
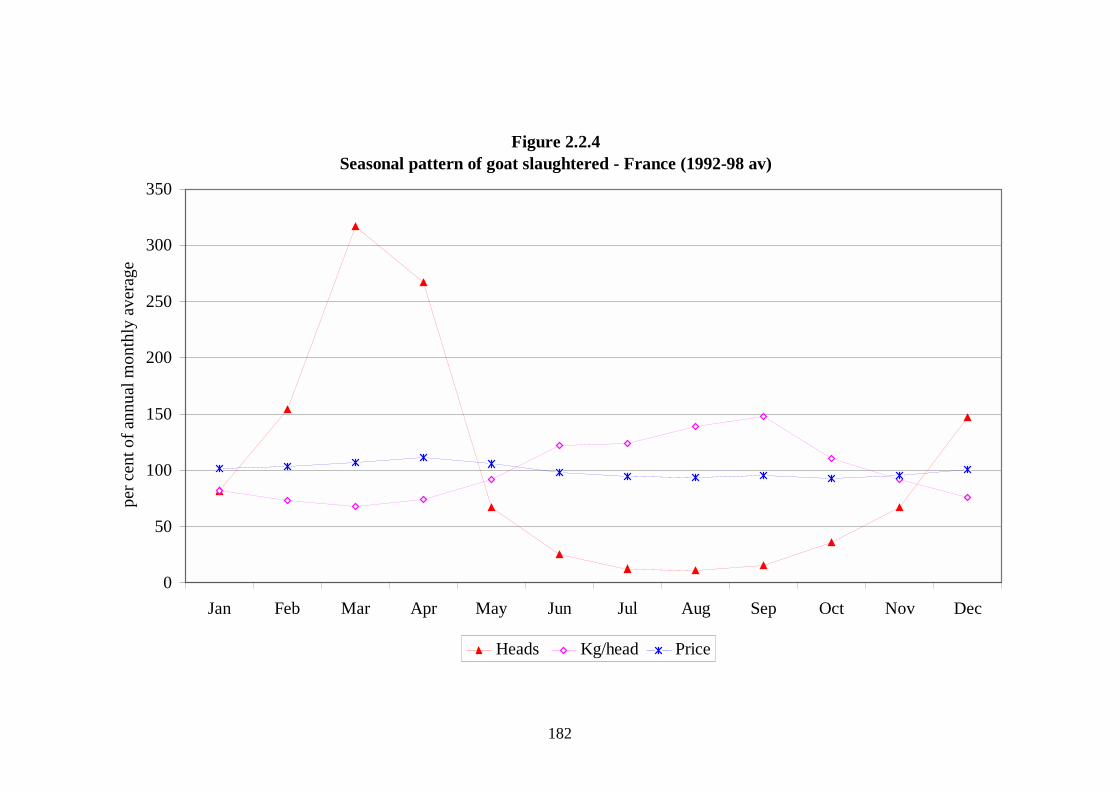
Figure 2.2.4Seasonal pattern of goat slaughtered - France (1992-98 av)
0
50
100
150
200
250
300
350
Jan Feb Mar Apr May Jun Jul Aug Sep Oct Nov Dec
per c
ent o
f ann
ual m
onth
ly a
vera
ge
Heads Kg/head Price

183
Figure 2.2.5Seasonal pattern of goat slaughtered - Italy (1992-98 av)
0
50
100
150
200
250
300
350
Jan Feb Mar Apr May Jun Jul Aug Sep Oct Nov Dec
per c
ent o
f ann
ual m
onth
ly a
vera
ge
Heads Kg/head Price

184
Figure 2.2.6Seasonal pattern of goat slaughtered - Portugal (1992-98av)
0
50
100
150
200
250
300
350
Jan Feb Mar Apr May Jun Jul Aug Sep Oct Nov Dec
per c
ent o
f ann
ual m
onth
ly a
vera
ge
Heads Kg/head Price

185
APPENDIX 2.2Estimation of short- and long-run supply elasticities
A2.2.1 To calculate supply elasticities, a simple regression approach has beenfollowed relating net lamb meat production and prices received by farmers in realterms. The analysis has been carried out at EU level and for the main producercountries: France, Greece, Ireland, Italy, Spain and UK. The sample period coversannual data from 1983 to 1998. Although it is expected that other determinants havean influence on quantities supplied, they have not been considered in this study. Theidea is only to establish a starting point in which it is possible to know farmers’reactions to price changes. On the other hand, the approach followed here is moreflexible than simply calculating correlations between prices and quantities. As it isexpected that some lags will exist in the reaction to changes in prices, up to three lagshave been considered for prices. Finally, as some persistence in production patterns isexpected, the dependent variable was introduced lagged one period as an additionalexplicative variable. Thus the specification of the regression is as follows:
=−− +++=
3
1110t
ititit uPQSQS αββ (1)
where: QSt is the net meat production; Pt is the price received by farmers; and ut is theerror term.
A2.2.2 Several specifications of model (1) have been tested in order to find theregression which best fitted the data. Two alternative ways of specification have beenfollowed. The first one has been to select the appropriate price lag. Using the AIC(Akaike, 1969) procedure, in all cases the model with the price only lagged one periodwas chosen. The second step was to select between alternative fuctional forms. Infact the linear versus the double log specification were tested. The Likelihood Ratiotest indicated that in all cases, the double log specification outperforms the linear one.Thus the final estimated model for each country was the following:
ttt uLPLQSLQS +++= −− 11110t αββ (2)
where the L indicates that the variable has been defined in log terms.
A2.2.3 The estimated parameters are shown in Table A2.2.1. First of all, it seems thatthe model is properly specified as the abscence of autocorrelation is not rejected (seethe values of BG and compare with the critical value of 3.84 at the 5% level ofsignificance). As the model is in double log form the parameters can be directlyinterpreted as elasticities.

186
Table A2.2.1Estimated parameters from the supply equation
β0 α1 β1 R2 BG(1)Greece 5.38* 0.21 0.25* 0.60 0.5France 2.02 0.02 0.59* 0.55 1.2Ireland 2.33 0.20 0.73* 0.74 2.3Italy 2.92 0.25 0.64* 0.59 1.1Spain 1.10 0.06 0.79* 0.66 0.9UK 2.74 0.11 0.64* 0.65 0.7UE 5.76 0.27 0.40* 0.67 1.2An * indicates that the coefficient is significant at the 5% levelBG (1) is the Breusch Godfrey statistic for autocorrelation of order 1. Critical value at the 5% level is3.84
A2.2.4 The long-run supply elasticity is calculated as follows:
1
11 β
α−
A2.2.5 Results are shown in Table A2.2.2
Table A2.2.2Short-run and long-run supply elasticities
Short-run elasticity Long-run elasticityGreece 0.21 0.84France 0.02 0.04Ireland 0.20 0.27Italy 0.25 0.39Spain 0.06 0.08UK 0.11 0.17UE 0.27 0.67

187
APPENDIX TO CHAPTER 3
188
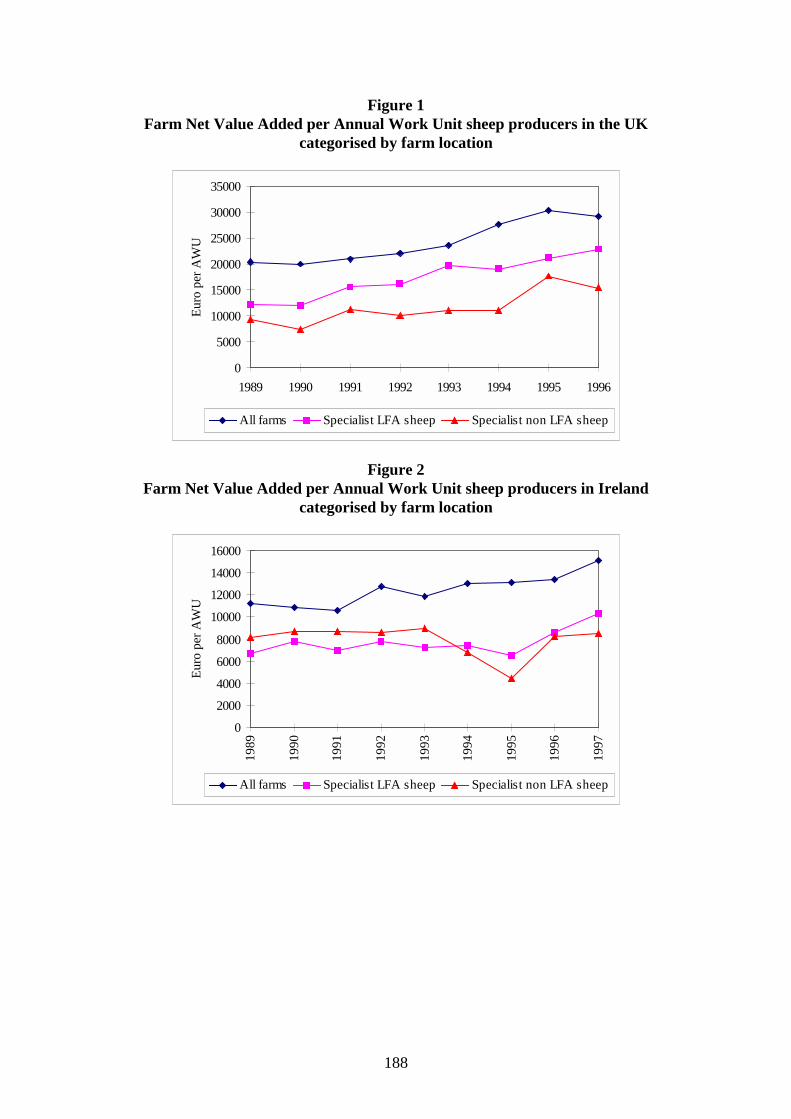
Figure 1Farm Net Value Added per Annual Work Unit sheep producers in the UK
categorised by farm location
0
5000
10000
15000
20000
25000
30000
35000
1989 1990 1991 1992 1993 1994 1995 1996
Euro
per
AW
U
All farms Specialist LFA sheep Specialist non LFA sheep
Figure 2Farm Net Value Added per Annual Work Unit sheep producers in Ireland
categorised by farm location
0
2000
4000
6000
8000
10000
12000
14000
16000
1989
1990
1991
1992
1993
1994
1995
1996
1997
Euro
per
AW
U
All farms Specialist LFA sheep Specialist non LFA sheep

189
Figure 3Farm Net Value Added per Annual Work Unit in sheep producers France
categorised by farm location
0
5000
10000
15000
20000
25000
30000
1989
1990
1991
1992
1993
1994
1995
1996
1997
Euro
per
AW
U
All farms Specialist LFA sheep Specialist non LFA sheep
Figure 4Farm Net Value Added per Annual Work Unit in for sheep producers Spain
categorised by farm location
0
5000
10000
15000
20000
25000
1989
1990
1991
1992
1993
1994
1995
1996
1997
Euro
per
AW
U
All farms Specialist LFA sheep Specialist non LFA sheep

190
Figure 5Farm Net Value Added per Annual Work Unit for sheep producers in Greece
categorised by farm location
0
1000
2000
3000
4000
5000
6000
7000
8000
1989 1990 1991 1992 1993 1994 1995 1996
Euro
per
AW
U
All farms Specialist LFA sheep Specialist non LFA sheep
Figure 6Farm Net Value Added per Annual Work Unit for goat producers in Greece
categorised by farm location
0100020003000400050006000700080009000
10000
1989 1990 1991 1992 1993 1994 1995 1996
Euro
per
AW
U
All farms Specialist LFA goat Specialist non LFA goat

191
STATISTICAL ANNEX

192
Table A4.1FNVA per Annual Work Unit - All Farms
UK Ireland France Spain Greece EU
ECU/Euro per Annual Work Unit
1989 20345 11199 18253 6741 5454 116021990 20061 10884 19025 7261 5123 113521991 20960 10617 18460 7705 6146 119021992 22048 12753 19903 11494 5179 122321993 23617 11870 20036 12226 5430 124821994 27786 13023 23899 13343 6512 145941995 30405 13068 25504 13378 6253 157281996 29291 13382 25828 16689 6025 162761997 n/a 15107 25065 16261 n/a n/a
Source: FADN
Table A4.2FNVA per Annual Work Unit - Specialist Sheep Farms
UK Ireland France Spain Greece EU
ECU/Euro per Annual Work Unit
1989 11835 7073 10321 11422 5850 93211990 11526 8063 12200 10483 6059 91111991 15042 7497 12331 12414 5947 101811992 15594 7974 12076 15872 6096 118351993 18717 7547 13209 18351 6895 125841994 17486 7287 13437 23113 7858 134331995 20640 6131 13687 20543 7251 131591996 21771 8577 13953 23215 6528 141941997 n/a 10122 13842 20547 n/a n/a
Source: FADN

193
Table A4.3FNVA per Annual Work Unit - Specialist Goat Farms
France Spain Greece EU
ECU/Euro per Annual Work Unit
1989 8608 6702 6435 65521990 9259 6248 6979 65321991 9153 7244 7350 65031992 9993 12106 7573 76181993 10941 14348 8687 90141994 10174 23031 9337 90971995 7698 15640 9103 87831996 15833 15513 8034 85371997 11681 13166 n/a n/a
Source: FADN
Table A4.4FNVA per Annual Work Unit - Specialist LFA sheep farms
UK Ireland France Spain Greece EU
ECU/Euro per Annual Work Unit
1989 12203 6714 10304 10904 5850 88771990 12014 7814 12158 10180 6059 90601991 15501 6997 12218 12038 5947 100471992 16232 7779 11888 15764 6096 117991993 19652 7258 13483 19548 6895 129771994 19077 7397 13418 24070 7858 138491995 21237 6468 13978 20837 7251 136871996 22861 8632 14167 24428 6528 146051997 n/a 10322 14115 20482 n/a n/a
Source: FADN
194
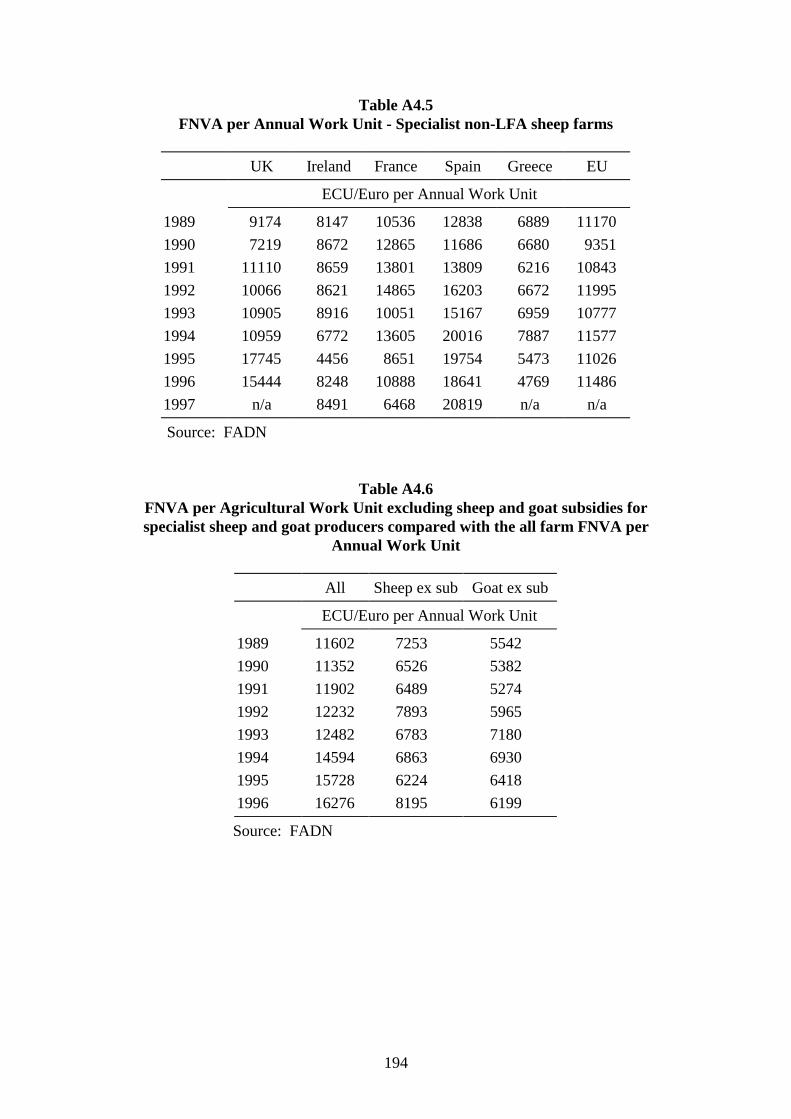
Table A4.5FNVA per Annual Work Unit - Specialist non-LFA sheep farms
UK Ireland France Spain Greece EU
ECU/Euro per Annual Work Unit
1989 9174 8147 10536 12838 6889 111701990 7219 8672 12865 11686 6680 93511991 11110 8659 13801 13809 6216 108431992 10066 8621 14865 16203 6672 119951993 10905 8916 10051 15167 6959 107771994 10959 6772 13605 20016 7887 115771995 17745 4456 8651 19754 5473 110261996 15444 8248 10888 18641 4769 114861997 n/a 8491 6468 20819 n/a n/a
Source: FADN
Table A4.6FNVA per Agricultural Work Unit excluding sheep and goat subsidies forspecialist sheep and goat producers compared with the all farm FNVA per
Annual Work Unit
All Sheep ex sub Goat ex sub
ECU/Euro per Annual Work Unit
1989 11602 7253 55421990 11352 6526 53821991 11902 6489 52741992 12232 7893 59651993 12482 6783 71801994 14594 6863 69301995 15728 6224 64181996 16276 8195 6199
Source: FADN

195
Table A4.7FNVA per Annual Work Unit at constant 1996 ECU values
Specialist SheepFarms
Specialist GoatFarms
Specialist SheepFarms ex sub
Specialist GoatFarms ex Sub
ECU/Euro per Annual Work Unit
1989 11363 7987 8842 67561990 10592 7593 7587 62571991 11267 7196 7181 58371992 12739 8199 8496 64211993 13545 9703 7301 77291994 14139 9576 7225 72951995 13684 9133 6472 66741996 14193 8536 8195 6199
Source: FADN
Table A4.8FNVA per Annual Work Unit and FNVA excluding subsidies per Annual Work
Unit - Specialist Sheep Farms
UK Ireland France Spain Greece EU
Total ex.subs
Total ex.subs
Total ex.subs
Total ex.subs
Total ex.subs
Total ex.subs
ECU/Euro per Annual Work Unit
1989 11835 4858 7073 2599 10321 n/a 11422 9335 5850 4648 9321 72531990 11526 2737 8063 796 12200 n/a 10483 7960 6059 4652 9111 65261991 15042 2334 7497 1140 12331 n/a 12414 8506 5947 4424 10181 64901992 15594 1694 7974 398 12076 n/a 15872 10950 6096 4264 11835 78931993 18717 1889 7547 1725 13209 n/a 18351 11994 6895 5016 12584 67831994 17486 1292 7287 1745 13437 n/a 23113 15399 7858 5855 13433 68641995 20640 1922 6131 933 13687 n/a 20543 12352 7251 5143 13159 62241996 21771 6098 8577 2783 13953 n/a 23215 16388 6528 4228 14194 81961997 n/a n/a 10122 4785 13842 n/a 20547 14669 n/a n/a n/a n/a
Source: FADN

196
Table A4.9Sheep enterprise gross margins in Ireland 1988 -1997
Hill blackface Mid season
Total ex. sheepsupport
Total ex. sheepsupport
IR£/ewe
1988 39 14 63 441989 31.4 8.7 54.2 36.81990 40.6 5.4 52.6 21.21991 36 3.2 47.9 24.31992 30.4 1.1 43.7 22.31993 37.8 3.6 54.5 29.51994 36.9 0.1 52.6 30.11995 36.7 2.1 45.7 23.91996 45.5 6.7 58.1 33.31997 41 12.1 56.6 40.3
Source: National Farm Survey, TEAGASC
Table A4.10Total sheep enterprise gross margins and enterprise gross margins excluding
CMO support for Upland and Lowground systems in the UK
Upland Lowland
Total Ex. CMOpayments
Total Ex. CMOpayments
£/ewe
1988 39.9 34.4 36.2 30.11989 38.2 32.9 34.6 28.91990 35.9 28.4 31.8 23.91991 37.8 26 32.8 22.91992 39.8 22.1 33.9 20.91993 51.7 27.7 44.6 26.91994 48 25.8 43.4 26.31995 51.9 28.7 45.2 27.31996 61 38.3 53.3 34.61997 50.3 30.9 43.4 31.6
Source: MLC

197
Table A4.11Propoertion of dairy ewes, meat ewes and goats in the Less Favoured Areas
% dairy sheep in LFA % meat sheep in LFA % Goats in LFA
1991 1995-97 1991 1995-97 1991 1995-97
Belgium 0.00 39.91 14.71 16.75 0.00 0.00Denmark 0.00 0.00 0.00 0.00 0.00 0.00Germany 0.00 32.23 73.47 60.07 0.00 0.00Greece 73.77 78.82 66.77 87.36 88.88 91.22Spain 76.47 88.39 78.57 87.71 75.00 83.09France 100.00 99.20 81.25 81.09 100.00 99.76Ireland 0.00 12.93 63.43 78.70 0.00 0.00Italy 74.36 76.68 72.78 77.02 91.69 89.84Luxembourg 0.00 0.00 100.00 100.00 0.00 0.00Netherlands 0.00 12.94 2.23 5.16 0.00 0.00Portugal 89.53 89.13 90.91 92.15 46.11 59.83U. Kingdom 0.00 25.57 99.96 71.83 0.00 0.00EU 76.66 81.07 82.16 77.15 81.56 89.13
Source: Dervied from EU DG Agriculture personal communication
Table A4.12Proportion of dairy ewes in total ewe population
% Dairy ewes in total ewes
1991 1995-97
Belgium 8 1Denmark 0 1Germany 0 0Greece 95 94Spain 19 19France 17 21Ireland 0 0Italy 87 89Luxembourg 0 0Netherlands 1 0Portugal 25 24U. Kingdom 0 0EU 30 30
Source: Dervied from EU DG Agriculture personal communication
198
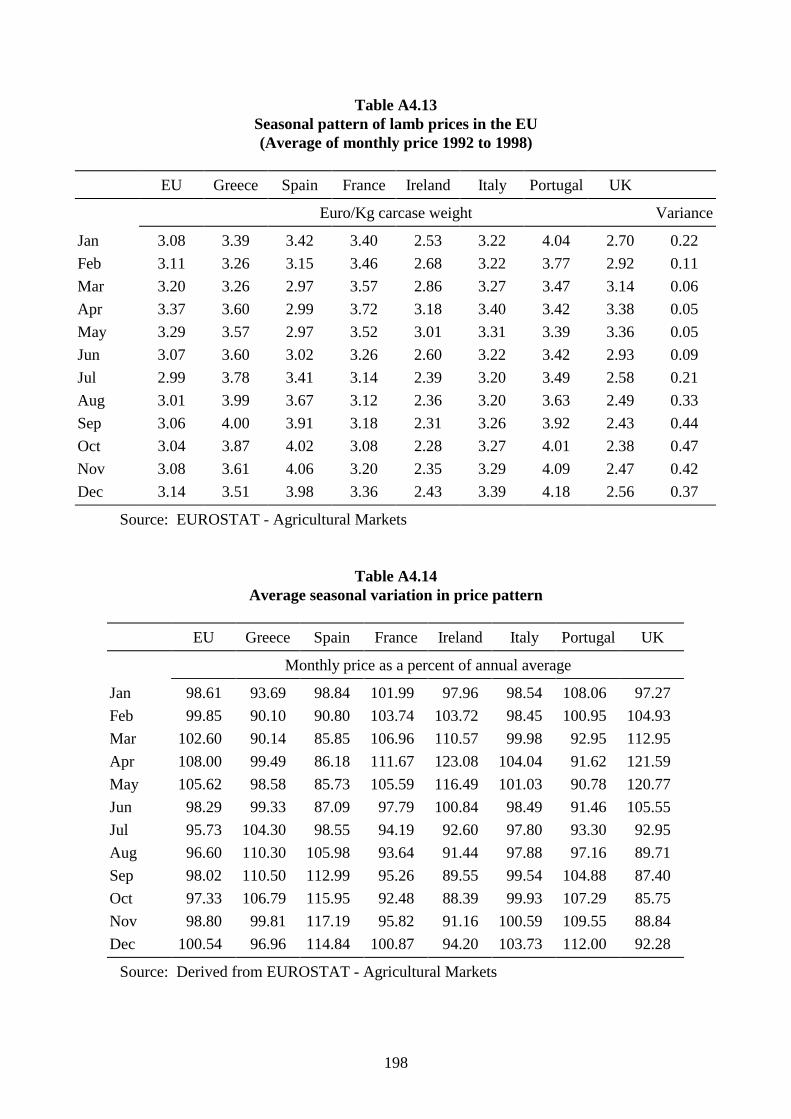
Table A4.13Seasonal pattern of lamb prices in the EU(Average of monthly price 1992 to 1998)
EU Greece Spain France Ireland Italy Portugal UK
Euro/Kg carcase weight Variance
Jan 3.08 3.39 3.42 3.40 2.53 3.22 4.04 2.70 0.22Feb 3.11 3.26 3.15 3.46 2.68 3.22 3.77 2.92 0.11Mar 3.20 3.26 2.97 3.57 2.86 3.27 3.47 3.14 0.06Apr 3.37 3.60 2.99 3.72 3.18 3.40 3.42 3.38 0.05May 3.29 3.57 2.97 3.52 3.01 3.31 3.39 3.36 0.05Jun 3.07 3.60 3.02 3.26 2.60 3.22 3.42 2.93 0.09Jul 2.99 3.78 3.41 3.14 2.39 3.20 3.49 2.58 0.21Aug 3.01 3.99 3.67 3.12 2.36 3.20 3.63 2.49 0.33Sep 3.06 4.00 3.91 3.18 2.31 3.26 3.92 2.43 0.44Oct 3.04 3.87 4.02 3.08 2.28 3.27 4.01 2.38 0.47Nov 3.08 3.61 4.06 3.20 2.35 3.29 4.09 2.47 0.42Dec 3.14 3.51 3.98 3.36 2.43 3.39 4.18 2.56 0.37
Source: EUROSTAT - Agricultural Markets
Table A4.14Average seasonal variation in price pattern
EU Greece Spain France Ireland Italy Portugal UK
Monthly price as a percent of annual average
Jan 98.61 93.69 98.84 101.99 97.96 98.54 108.06 97.27Feb 99.85 90.10 90.80 103.74 103.72 98.45 100.95 104.93Mar 102.60 90.14 85.85 106.96 110.57 99.98 92.95 112.95Apr 108.00 99.49 86.18 111.67 123.08 104.04 91.62 121.59May 105.62 98.58 85.73 105.59 116.49 101.03 90.78 120.77Jun 98.29 99.33 87.09 97.79 100.84 98.49 91.46 105.55Jul 95.73 104.30 98.55 94.19 92.60 97.80 93.30 92.95Aug 96.60 110.30 105.98 93.64 91.44 97.88 97.16 89.71Sep 98.02 110.50 112.99 95.26 89.55 99.54 104.88 87.40Oct 97.33 106.79 115.95 92.48 88.39 99.93 107.29 85.75Nov 98.80 99.81 117.19 95.82 91.16 100.59 109.55 88.84Dec 100.54 96.96 114.84 100.87 94.20 103.73 112.00 92.28
Source: Derived from EUROSTAT - Agricultural Markets
199
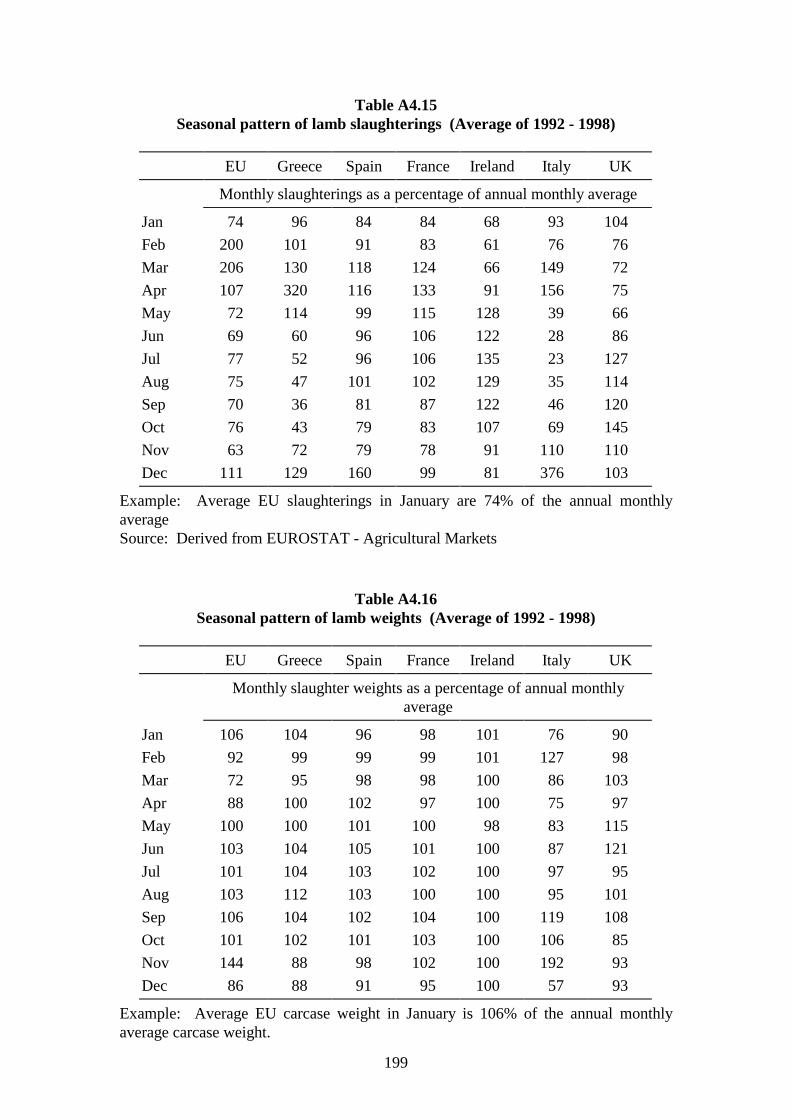
Table A4.15Seasonal pattern of lamb slaughterings (Average of 1992 - 1998)
EU Greece Spain France Ireland Italy UK
Monthly slaughterings as a percentage of annual monthly average
Jan 74 96 84 84 68 93 104Feb 200 101 91 83 61 76 76Mar 206 130 118 124 66 149 72Apr 107 320 116 133 91 156 75May 72 114 99 115 128 39 66Jun 69 60 96 106 122 28 86Jul 77 52 96 106 135 23 127Aug 75 47 101 102 129 35 114Sep 70 36 81 87 122 46 120Oct 76 43 79 83 107 69 145Nov 63 72 79 78 91 110 110Dec 111 129 160 99 81 376 103
Example: Average EU slaughterings in January are 74% of the annual monthlyaverageSource: Derived from EUROSTAT - Agricultural Markets
Table A4.16Seasonal pattern of lamb weights (Average of 1992 - 1998)
EU Greece Spain France Ireland Italy UK
Monthly slaughter weights as a percentage of annual monthlyaverage
Jan 106 104 96 98 101 76 90Feb 92 99 99 99 101 127 98Mar 72 95 98 98 100 86 103Apr 88 100 102 97 100 75 97May 100 100 101 100 98 83 115Jun 103 104 105 101 100 87 121Jul 101 104 103 102 100 97 95Aug 103 112 103 100 100 95 101Sep 106 104 102 104 100 119 108Oct 101 102 101 103 100 106 85Nov 144 88 98 102 100 192 93Dec 86 88 91 95 100 57 93
Example: Average EU carcase weight in January is 106% of the annual monthlyaverage carcase weight.

200
Source: Derived from EUROSTAT - Agricultural Markets

201
Table A4.17Seasonal pattern of lamb and goat price (Average of 1992 - 1998)
EU Greece Spain France Ireland Italy UK
Monthly prices as a percentage of annual monthly average
Jan 99 94 99 102 98 99 97Feb 100 90 91 104 104 98 105Mar 103 90 86 107 111 100 113Apr 108 99 86 112 123 104 122May 106 99 86 106 116 101 121Jun 98 99 87 98 101 98 106Jul 96 104 99 94 93 98 93Aug 97 110 106 94 91 98 90Sep 98 111 113 95 90 100 87Oct 97 107 116 92 88 100 86Nov 99 100 117 96 91 101 89Dec 101 97 115 101 94 104 92
Example: Average EU price in January is 99% of the annual monthly average priceSource: Derived from EUROSTAT - Agricultural Markets
Table A4.18Seasonal pattern of goat slaughterings (Average of 1992 - 1998)
EU Greece Spain France Italy Portugal
Monthly slaughterings as a percentage of annual monthlyaverage
Jan 68 65 77 82 38 63Feb 92 82 90 154 77 80Mar 150 122 111 317 194 135Apr 254 316 101 267 231 151May 115 146 89 67 56 75Jun 77 89 85 25 54 75Jul 66 76 76 12 47 60Aug 65 69 86 11 70 60Sep 56 58 78 15 44 40Oct 59 56 89 36 27 49Nov 66 56 94 67 48 74Dec 132 64 223 147 313 338
Example: Average EU slaughterings in January are 68% of the annual monthlyaverage.Source: Derived from EUROSTAT - Agricultural Markets

202
Table A4.19Seasonal pattern of goat weights (Average of 1992 - 1998)
EU Greece Spain France Italy Portugal
Monthly carcase weights as a percentage of annual monthlyaverage
Jan 100 88 138 82 95 98Feb 86 85 94 73 104 85Mar 80 83 93 68 61 80Apr 83 81 87 74 65 80May 96 88 104 92 93 82Jun 104 99 99 122 118 81Jul 112 105 103 124 132 102Aug 113 113 94 139 109 139Sep 120 117 109 148 144 154Oct 119 128 103 110 110 140Nov 107 117 98 92 112 85Dec 78 96 77 76 57 74
Example: Average EU carcase weight in January is 100% of the annual monthlyaverage carcase weightSource: Derived from EUROSTAT - Agricultural Markets

203
Table A4.20Number of mated ewe-lambs and ewes
Greece Spain UK France Ireland Italy EU 12
‘000 head
1986 7031 12559 18194 8958 2663 8826 621781987 7019 16250 19174 8685 3120 8802 672321988 7219 16885 20167 8662 3600 8870 698541989 6954 17255 20618 8432 4148 8836 710261990 6860 17612 20722 8476 4488 8134 713821991 6769 17994 20475 8071 4625 7698 712171992 6723 18304 20824 7734 4806 7691 714381993 6744 18119 20486 7920 4676 7765 707831994 6009 17603 20309 7755 4545 7898 692441995 6359 15741 19796 7880 4372 8518 678981996 6101 18172 19353 7651 4312 8650 676941997 6217 18118 20061 7580 4372 8740 683491998 6155 17551 20329 7533 4460 8020 67233
Source: Eurostat Agriculture yearbook 1994,1997,1998
Table A4.21Number of goats which have kids or are mated
Greece Spain France Italy Portugal EU-12
‘000 head
1988 4105 2549 870 988 604 91691989 4076 2835 1046 998 616 96291990 4106 2781 1035 992 616 95871991 4067 2109 939 984 622 87731992 4067 2005 905 1010 619 86581993 4015 2064 888 1037 605 86581994 3830 2170 900 1071 593 86101995 4000 2170 943 1071 581 88111996 3988 2042 940 1150 569 87321997 3987 2034 961 1144 572 87391998 4076 1855 941 1155 561 8630
Source: Eurostat
Table A4.22

204
Sheep and goat production
Greece Spain France Ireland Italy UK EU 12
‘000 head slaughtered1988 11794 21030 9714 2134 8433 17104 702091989 12049 19957 10490 2776 9126 19616 740141990 12213 21006 11265 3887 9602 20012 779851991 12114 22333 10913 4215 9629 20916 801201992 12491 22845 10004 4336 9755 19151 785821993 12458 22304 9796 4700 8901 18863 770221994 12476 22565 9257 4416 8552 18961 762271995 12531 21976 8753 4298 8442 19331 753311996 12419 21637 9125 4367 8359 18071 739781997 12027 21644 8843 3770 8105 16674 710631998 11992 21700 8551 4067 7805 18697 72812
Source: Eurostat
Table A4.23Sheep and goat production - kg/head carcase
Greece Spain France Ireland Italy UK EU 12
kg per carcase1986 10.74 11.43 17.27 n/a 8.29 18.91 13.871987 10.22 11.42 17.44 23.19 8.89 19.20 14.181988 10.60 10.94 16.88 22.96 8.66 18.83 13.851989 10.87 10.92 17.05 21.97 8.66 18.71 13.751990 10.60 11.00 17.20 22.00 9.90 18.50 14.401991 10.57 10.85 16.98 21.94 8.80 18.45 14.211992 10.57 10.81 17.16 21.69 8.82 18.64 14.051993 10.35 10.68 16.62 21.00 9.08 18.53 13.951994 10.36 10.79 16.66 20.96 9.13 18.56 13.971995 10.21 11.01 16.87 20.82 9.00 18.87 14.131996 10.54 10.99 16.81 20.61 9.28 19.12 14.221997 10.61 11.40 16.85 20.95 9.35 19.30 14.271998 10.54 11.29 16.74 20.55 9.39 18.78 14.27
Source: Eurostat