background report secondary copper smelting, …
TRANSCRIPT

BACKGROUND REPORT
AP-42 SECTION 12.9
SECONDARY COPPER SMELTING, REFINING, AND ALLOYING
Prepared for
U.S. Environmental Protection AgencyOAQPS/TSD/EIB
Research Triangle Park, NC 27711
II-103
Pacific Environmental Services, Inc.5001 South Miami Boulevard, Suite 300
Post Office Box 12077Research Triangle Park, NC 27709
919/941-0333

ii
This report has been reviewed by the Technical Support Division of the Office of Air QualityPlanning and Standards, EPA. Mention of trade names or commercial products is not intended toconstitute endorsement or recommendation for use. Copies of this report are available through theLibrary Services Office (MD-35), U.S. Environmental Protection Agency, Research Triangle Park,NC 27711.

iii
TABLE OF CONTENTS
1.0 INTRODUCTION . . . . . . . . . . . . . . . . . . . . . . . . . . . . . . . . . . . . . . . . . . . . . . . . . 1
2.0 INDUSTRY DESCRIPTION . . . . . . . . . . . . . . . . . . . . . . . . . . . . . . . . . . . . . . . . . 22.1 General . . . . . . . . . . . . . . . . . . . . . . . . . . . . . . . . . . . . . . . . . . . . . . . 22.2 Process Description . . . . . . . . . . . . . . . . . . . . . . . . . . . . . . . . . . . . . . 22.3 Emissions and Controls . . . . . . . . . . . . . . . . . . . . . . . . . . . . . . . . . . . 62.4 Review of References for Chapter 2.0 . . . . . . . . . . . . . . . . . . . . . . . . . 82.5 References for Chapter 2.0 . . . . . . . . . . . . . . . . . . . . . . . . . . . . . . . . 10
3.0 GENERAL EMISSION DATA REVIEW AND ANALYSIS PROCEDURES . . . . . . . . . . . . . . . . . . . . . . . . . . . . . . . . . . . . . . . . . . . . . . . . . . . . . . 11
3.1 Literature Search and Screening . . . . . . . . . . . . . . . . . . . . . . . . . . . . 113.2 Emission Data Quality Rating System . . . . . . . . . . . . . . . . . . . . . . . 123.3 Emission Factor Quality Rating System . . . . . . . . . . . . . . . . . . . . . . 143.4 References for Chapter 3.0 . . . . . . . . . . . . . . . . . . . . . . . . . . . . . . . . 15
4.0 POLLUTANT EMISSION FACTOR DEVELOPMENT . . . . . . . . . . . . . . . . . . . 164.1 Criteria Pollutant Emission Data . . . . . . . . . . . . . . . . . . . . . . . . . . . . 164.2 Noncriteria Pollutant Emission Data . . . . . . . . . . . . . . . . . . . . . . . . . 254.3 Review of Specific Data Sets . . . . . . . . . . . . . . . . . . . . . . . . . . . . . . 264.4 Data Gap Analysis . . . . . . . . . . . . . . . . . . . . . . . . . . . . . . . . . . . . . . 314.5 References for Chapter 4.0 . . . . . . . . . . . . . . . . . . . . . . . . . . . . . . . . 32

iv
LIST OF TABLES
TABLE 2.1-1: Secondary Copper Smelters and Refineries . . . . . . . . . . . . . . . . . . . . . . . . . . . . 3
TABLE 4.1-1: Filterable Particulate Matter (Metric) . . . . . . . . . . . . . . . . . . . . . . . . . . . . . . . 17TABLE 4.1-1: Filterable Particulate Matter (English) . . . . . . . . . . . . . . . . . . . . . . . . . . . . . . 18
TABLE 4.1-2: Filterable plus Inorganic Condensible Particulate Matter (Metric) . . . . . . . . . . 19TABLE 4.1-2: Filterable plus Inorganic Condensible Particulate Matter (English) . . . . . . . . . 20
TABLE 4.1-3: Lead (Metric) . . . . . . . . . . . . . . . . . . . . . . . . . . . . . . . . . . . . . . . . . . . . . . . . . 21TABLE 4.1-3: Lead (English) . . . . . . . . . . . . . . . . . . . . . . . . . . . . . . . . . . . . . . . . . . . . . . . . 21
TABLE 4.1-4: Carbon Monoxide (Metric) . . . . . . . . . . . . . . . . . . . . . . . . . . . . . . . . . . . . . . . 23TABLE 4.1-4: Carbon Monoxide (English) . . . . . . . . . . . . . . . . . . . . . . . . . . . . . . . . . . . . . . 23
TABLE 4.1-5: Total Organic Compounds, as Methane (Metric) . . . . . . . . . . . . . . . . . . . . . . . 24TABLE 4.1-5: Total Organic Compounds, as Methane (English) . . . . . . . . . . . . . . . . . . . . . . 24
TABLE 4.5-1: List of Conversion Factors . . . . . . . . . . . . . . . . . . . . . . . . . . . . . . . . . . . . . . . 33
LIST OF FIGURES
FIGURE 2.2-1: Low-Grade Copper Recovery . . . . . . . . . . . . . . . . . . . . . . . . . . . . . . . . . . . . . 4FIGURE 2.2-2: High-Grade Brass and Bronze Alloying . . . . . . . . . . . . . . . . . . . . . . . . . . . . . . 5

1
1.0 INTRODUCTION
The document "Compilation of Air Pollutant Emission Factors" (AP-42) has been published
by the U.S. Environmental Protection Agency (EPA) since 1972. Supplements to AP-42 have been
routinely published to add new emission source categories and to update existing emission factors.
AP-42 is routinely updated by the EPA to respond to new emission factor needs of the EPA, state
and local air pollution control programs, and industry.
An emission factor relates the quantity (weight) of pollutants emitted to a unit of activity of
the source. The uses for the emission factors reported in AP-42 include:
1. Estimates of area-wide emissions;
2. Emission estimates for a specific facility; and
3. Evaluation of emissions relative to ambient air quality.
The purpose of this report is to provide background information for the revision of AP-42
Section 12.9 Secondary Copper Smelting, Refining, and Alloying.
Including the introduction (Chapter 1), this report contains four chapters. Chapter 2 gives a
description of the secondary copper industry. It includes a characterization of the industry, an
overview of the different process types, a description of emissions, and a description of the
technology used to control emissions resulting from processing zinc scrap.
Chapter 3 is a review of emissions data collection and analysis procedures. It describes the
literature search, the screening of emission data reports, and the quality rating system for both
emission data and emission factors. Chapter 4 details criteria and noncriteria pollutant emission
factor development. It includes the review of specific data sets and the results of data analysis.

2
2.0 INDUSTRY DESCRIPTION
2.1 General
As of 1992, the 700,000 megagrams (800,000 tons)1 of secondary copper produced in the
U.S. accounted for more than 40 percent of supply. This production volume is remaining relatively
steady. Secondary copper includes such items as machine shop punchings, turnings, and borings;
manufacturing facility defective or surplus goods; automobile radiators, pipes, wires, bushings,
and bearings; and metallurgical process skimmings and dross. This secondary copper can be
refined into relatively pure metallic copper, alloyed with zinc or tin to form brass or bronze,
incorporated into chemical products, or used in a number of smaller applications. The operator,
location, approximate annual capacity, and processes of each of the five secondary copper
smelter/refineries and five other refineries in the U.S. are listed in Table 2.1-1. A large number of
mills and foundries reclaim relatively pure copper scrap for alloying purposes.
2.2 Process Description
Secondary copper recovery is divided into four separate operations: scrap pretreatment,
smelting, alloying, and casting. Pretreatment includes the cleaning and consolidation of scrap in
preparation for smelting. Smelting consists of heating and treating the scrap for separation and
purification of specific metals. Alloying involves the addition of one or more other metals to copper
to obtain desirable qualities characteristic of the combination of metals. The major secondary
copper smelting operations are shown in Figure 2.2-1; brass and bronze alloying operations are
shown in Figure 2.2-2.
Scrap pretreatment may be achieved through manual, mechanical, pyrometallurgical, or
hydrometallurgical methods. Manual and mechanical methods include sorting, stripping, shredding,
and magnetic separation. The scrap may then be compressed into bricquettes in a hydraulic press.
Pyrometallurgical pretreatment may include sweating (the separation of different metals by slowly
staging furnace air temperatures to liquefy each metal separately), burning insulation from copper
wire, and drying in rotary kilns to volatilize oil and other organic compounds. Hydrometallurgical
pretreatment methods include flotation and leaching to recover copper from slag. Flotation is
typically used when slag contains greater than ten percent copper. The slag is slowly cooled such
that large, relatively pure

3
Table 2.1-1: Secondary Copper Smelters and Refineries
Operator LocationAnnual
Capacity(Mg/yr)
Processes
Cerro CopperProducts
Sauget, Illinois 125,000 fire-refining, electrolytic refining
Chemetco Alton, Illinois 135,000 one-stage (top-blown rotaryconverter) smelting/refining
Gaston RecyclingIndustries
Gaston, SouthCarolina
110,000 smelting, fire-refining,electrolytic refining
Franklin Smeltingand Refining
Philadelphia,Pennsylvania
16,000 smelting
Southwire Carrollton,Georgia
100,000 smelting, fire-refining, electrolytic refining
Cyprus Warrenton,Missouri
32,000 fire-refining
Essex Fort Wayne,Indiana
44,000 fire-refining(wire manufacture)
North ChicagoSmelting andRefining
North Chicago,Illinois
500 fire-refining (anode manufacture)
Reading Metals Reading,Pennsylvania
70,000 fire-refining(tube manufacture)
Thermal ReductionCo.
Philadelphia,Pennsylvania
4,500 fire-refining
crystals are formed and recovered. The remaining slag is cooled, ground, and combined with water
and chemicals that facilitate flotation. Compressed air and the flotation chemicals separate the
ground slag into various fractions of minerals. Additives cause the copper to float in a foam of air
bubbles for subsequent removal, dewatering, and concentration.
Leaching is used to recover copper from slime, a byproduct of electrolytic refining. In this
process, sulfuric acid is circulated through the slime in a pressure filter. Copper dissolves in the
acid to form a solution of copper sulfate (CuSO4), which can then be either mixed with the

4
Figure 2.2-1 Low-grade copper recovery
electrolyte in the refinery cells or sold as a product.
Smelting of low-grade copper scrap begins with melting in either a blast or a rotary furnace,
resulting in slag and impure copper. If a blast furnace is used, this copper is charged to a
converter, where the purity is increased to about 80 to 90 percent, and then to a reverberatory
furnace, where copper of about 99 percent purity is achieved. The final step is known as fire-
refining. In these pyrometallurgical processes, flux is added to the copper and air is blown upward
through the mixture to oxidize impurities. These impurities are then removed as slag. Then, by
5
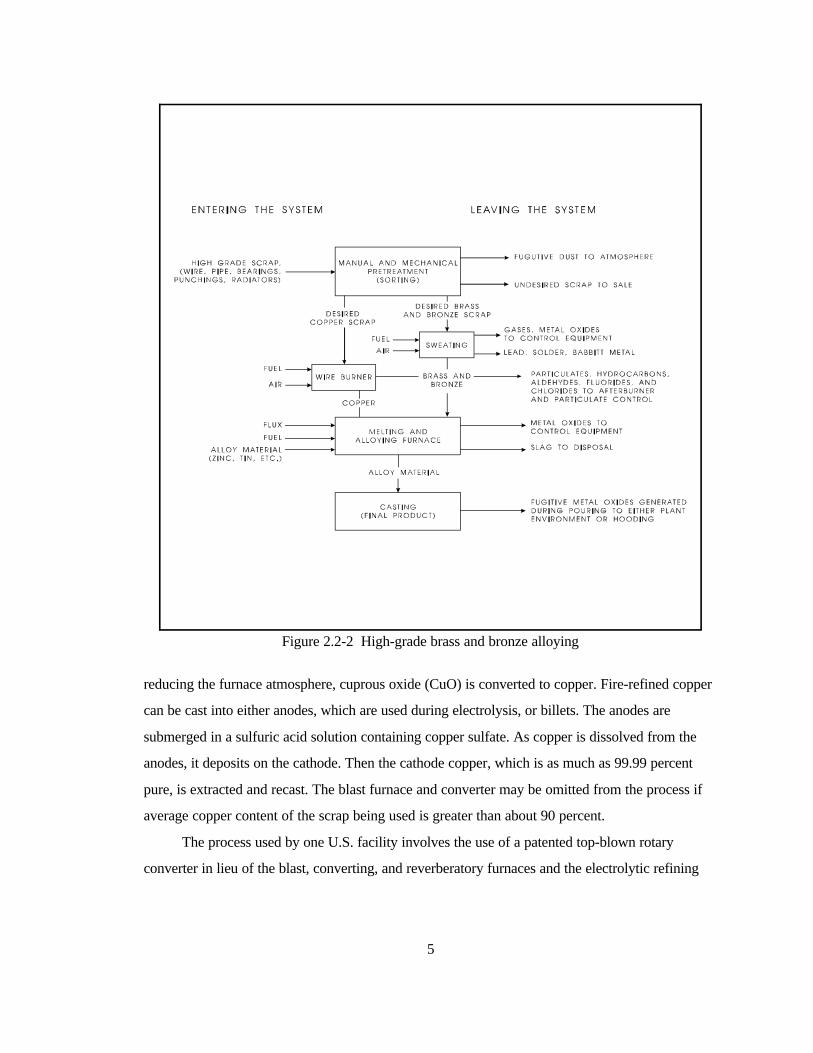
Figure 2.2-2 High-grade brass and bronze alloying
reducing the furnace atmosphere, cuprous oxide (CuO) is converted to copper. Fire-refined copper
can be cast into either anodes, which are used during electrolysis, or billets. The anodes are
submerged in a sulfuric acid solution containing copper sulfate. As copper is dissolved from the
anodes, it deposits on the cathode. Then the cathode copper, which is as much as 99.99 percent
pure, is extracted and recast. The blast furnace and converter may be omitted from the process if
average copper content of the scrap being used is greater than about 90 percent.
The process used by one U.S. facility involves the use of a patented top-blown rotary
converter in lieu of the blast, converting, and reverberatory furnaces and the electrolytic refining
6
process described above. This facility begins with low-grade copper scrap and conducts its entire
refining operation in a single vessel.
In alloying, copper-containing scrap is charged to a melting furnace along with one or more
other metals such as tin, zinc, silver, lead, aluminum, or nickel. Fluxes are added to remove
impurities and to protect the melt against oxidation by air. Air or pure oxygen may be blown
through the melt to adjust the composition by oxidizing excess zinc. The alloying process is, to
some extent, mutually exclusive of the smelting and refining processes described above that lead to
relatively pure copper.
Casting of alloyed or refined copper products is the final step used by the secondary copper
industry in the recovery of copper from scrap material. The molten metal is poured into molds from
ladles or small pots serving as surge hoppers and flow regulators. The resulting products include
shot, wirebar, anodes, cathodes, ingots, or other cast shapes.
2.3 Emissions and Controls
The principal pollutant emitted from secondary copper smelting activities is particulate
matter. As is characteristic of secondary metallurgical industries, pyrometallurgical processes used
to separate or refine the desired metal, such as the burning of insulation from copper wire, result in
emissions of metal oxides and unburned insulation. Similarly, drying of chips and borings to
remove excess oils and cutting fluids can cause discharges of volatile organic compounds (VOC)
and products of incomplete combustion.
The smelting process utilizes large volumes of air to oxidize sulfides, zinc, and other
undesirable constituents of the scrap. This oxidation procedure generates particulate matter in the
exhaust gas stream. A broad spectrum of particle sizes and grain loadings exists in the escaping
gases due to variations in furnace design and in the quality of furnace charges. Another major
factor contributing to differences in emission rates is the amount of zinc present in scrap feed
materials. The low-boiling zinc volatilizes and is oxidized to produce copious amounts of zinc
oxide as submicron particulate.
Fabric filter baghouses are the most effective control technology applied to secondary
copper smelters. The control efficiency of these baghouses may exceed 99 percent, but cooling
systems may be needed to prevent hot exhaust gases from damaging or destroying the bag filters.
Electrostatic precipitators are not as well suited to this application, because they have a low

7
collection efficiency for dense particulate such as oxides of lead and zinc. Wet scrubber
installations are ineffective as pollution control devices in the secondary copper industry because
scrubbers are useful for particles larger than one micron (µm), and the metal oxide fumes
generated are generally submicron in size.
Particulate emissions associated with drying kilns can also be controlled with baghouses.
Drying temperatures up to 150EC (300EF) produce exhaust gases that require no precooling prior
to the baghouse inlet. Wire burning generates large amounts of particulate matter, primarily
composed of partially combusted organic compounds. These emissions can be effectively
controlled by direct-flame incinerators called afterburners. An efficiency of 90 percent or more can
be achieved if the afterburner combustion temperature is maintained above 1000EC (1800EF). If
the insulation contains chlorinated organics such as polyvinyl chloride, hydrogen chloride gas will
be generated. Hydrogen chloride is not controlled by the afterburner and is emitted to the
atmosphere.
Fugitive emissions occur from each process associated with secondary copper smelter
operations. These emissions occur during the pretreating of scrap, the charging of scrap into
furnaces containing molten metals, the transfer of molten copper from one operation to another,
and from material handling. When charging scrap into furnaces, fugitive emissions often occur
when the scrap is not sufficiently compact to allow a full charge to fit into the furnace prior to
heating. The introduction of additional material onto the liquid metal surface produces significant
amounts of volatile and combustible materials and smoke. If this smoke exceeds the capacity of the
exiting capture devices and control equipment, it can escape through the charging door. Forming
scrap bricquettes offers a possible means of avoiding the necessity of fractional charges. When
fractional charging cannot be eliminated, fugitive emissions are reduced by turning off the furnace
burners during charging. This reduces the flow rate of exhaust gases and allows the exhaust
control system to better accommodate the additional temporary emissions.
Fugitive emissions of metal oxide fumes are generated not only during melting, but also
while pouring molten metal into molds. Additional dusts may be generated by the charcoal or other
lining used in the mold. The method used to make "smooth-top" ingots involves covering the metal
surface with ground charcoal. This process creates a shower of sparks, releasing emissions into the
plant environment in the vicinity of the furnace top and the molds being filled.
8
The electrolytic refining process produces emissions of sulfuric acid mist, but no data
quantifying these emissions are available.
Emission factor averages and ranges for six different types of furnaces are presented in the
revised AP-42 Section 12.9, along with PM10 emission rates and reported fugitive and lead
emissions. Several of the metals contained in much of the scrap used in secondary copper smelting
operations, particularly lead, nickel, and cadmium, are hazardous air pollutants (HAP's) as defined
in Title III of the 1990 Clean Air Act Amendments. These metals will exist in the particulate
matter emitted from these processes in proportions related to their existence in the scrap.
2.4 Review of References for Chapter 2.0
During the revision of AP-42 Section 12.9, the following sources were contacted in order to
obtain the most up-to-date information on industrial processes, emission stream characterization,
and control technology concerning the secondary copper smelting industry:
U.S. Department of the Interior, Bureau of Mines, Washington, DC.
A series of telephone conversations with the copper specialist with this government agency
provided assistance in locating secondary copper smelters and refineries, and provided estimates of
the capacities of these facilities. Much of the information presented in the revised AP-42 section
concerning the uses of copper and the secondary copper industry as a whole is based upon two
documents published by the Bureau of Mines (Reference 1: "Copper," Mineral Commodities
Summary 1992 and Reference 2: "Copper," Minerals Yearbook 1989), both of which examine this
industry from a primarily commercial standpoint. In addition, the more detailed Minerals Yearbook
provided brief descriptions of the processes utilized in secondary copper smelting and refining,
which were also used in the revision of the AP-42 section.
Association of Brass and Bronze Ingot Manufacturers, Chicago, IL.
This agency recommended several modifications to the text of AP-42 Section 12.9. These
recommendations were incorporated into the section revision.
Cerro Copper Products, Sauget, IL.

9
Environmental personnel at this facility were contacted by telephone and, at their request, by mail
in order to obtain the results of recently performed emission testing. No response was received.
Chemetco, Alton, IL.
Environmental personnel at this facility were contacted by telephone and, at their request, by mail
in order to obtain the results of recently performed emission testing. No response was received.
Franklin Smelting and Refining, Philadelphia, PA.
Environmental personnel at this facility were contacted by telephone and, at their request, by mail
in order to obtain the results of recently performed emission testing. No response was received.
Gaston Recycling Industries, Gaston, SC.
A telephone conversation with engineers at Gaston revealed that this facility is owned by a
subsidiary of Southwire (see below), and was purchased in 1990. In the short time that this
company has owned this facility, no emissions data have been compiled, and none from the
previous operator are available. Emissions testing to meet regulatory requirements is planned for
the near future.
Southwire, Carrollton, GA.
Environmental personnel at this facility were contacted by telephone and, at their request, by mail
in order to obtain the results of recently performed emission testing. No response was received
before the section revision was completed.
New Jersey Department of Environmental Protection, Trenton, NJ.
The emission test files of the Technical Services Bureau of this agency were examined for
documents that could be useful in emission factor development. An emission test report for Kearny
Smelting and Refining in Harrison, NJ, was among those found. This report is utilized in emission
factor development for rotary smelting furnaces at copper alloying facilities, and is summarized in
Section 4.3 of this background report.
10
2.5 References for Chapter 2.0
1. J.L.W. Jolly, "Copper," Mineral Commodity Summaries 1992, U.S. Department of theInterior, Bureau of Mines, Washington, DC, 1992.
2. J.L.W. Jolly, "Copper," Minerals Yearbook 1989, U.S. Department of the Interior, Bureauof Mines, Washington, DC, 1990.
11
3.0 GENERAL EMISSION DATA REVIEW AND ANALYSIS PROCEDURES
3.1 Literature Search and Screening
The first step of the investigation into emissions from the secondary copper smelting
industry involved a search of available literature. This search included the following references:
1) AP-42 background files maintained by the Emission Factor and Methodologies
Section. The references from which most of the emission factors presented in both the
previous and revised versions of AP-42 Section 12.9 are derived were obtained from
these files, and are summarized in Chapter 4.0 of this background report.
2) "Locating and Estimating" reports published by the Emission Factor and
Methodologies Section. None of the pollutants for which these reports have been
compiled is emitted from secondary copper processing facilities, and thus no useful
information was contained in these reports.
3) PM10 "gap filling" documents as listed below; none of these documents contained data
of a quality suitable for development of emission factors.
3a) "PM10 Emission Factor Listing Developed by Technology Transfer"
(EPA-450/4-89-022).
3b) "Gap Filling PM10 Emission Factors for Selected Open Area Dust
Sources" (EPA-450/88-003).
3c) "Generalized Particle Size Distributions for Use in Preparing Size
Specific Particulate Emission Inventories" (EPA-450/4-86-013).
4) Handbook of Emission Factors, Parts I and II, Ministry of Health and Environmental
Protection, The Netherlands, 1980/1983. No information concerning the secondary
copper processing industry is contained in this handbook.
7) The EPA databases, including but not limited to the VOC/Particulate Matter (PM)
Speciation Database Management System (SPECIATE), the Crosswalk/Air Toxic
Emission Factor Data Base Management System (XATEF), and the Test Methods
Storage and Retrieval System maintained by the Emission Measurement Technical
Information Center (EMTIC/TSAR). No emissions test data for the secondary copper
processing industry are contained in these databases.

12
6) The EPA Clearinghouse for Inventories and Emission Factors (CHIEF) and
National Air Toxics Information Clearinghouse (NATICH). No emissions test data
for the secondary copper processing industry are contained in these databases.
The following general criteria were used to select pertinent references:
1. Emissions data must be from a primary reference; i.e. the document must constitute
the original source of test data. For example, a technical paper was not included if the
original study was contained in the previous document.
2. The referenced study must contain test results based on more than one test run.
3. The report must contain sufficient data to evaluate the testing procedures and source
operating conditions.
For source categories for which no primary emissions data were found and emission factors
in the previous version of the corresponding AP-42 section were based entirely upon secondary
data, these secondary data were again used for emission factor development. The quality of these
factors was reevaluated based upon the criteria discussed below, and emission factor quality
ratings were assigned accordingly. The final set of reference materials utilized in this AP-42
section revision is discussed in Chapter 4.0.
3.2 Emission Data Quality Rating System
As part of the emission data analysis, the quantity and quality of the information contained
in the final set of reference documents were evaluated. The following data were always excluded
from consideration.
1. Test series averages reported in units that cannot be converted to the selected reporting
units;
2. Test series representing incompatible test methods (e.g., comparison of the EPA
Method 5 front-half with the EPA Method 5 front- and back-half);
3. Test series of controlled emissions for which the control device is not specified;
4. Test series in which the source process is not clearly identified and described; and
5. Test series in which it is not clear whether the emissions were measured before or after
the control device.

13
The rating system used by the OAQPS for the preparation of AP-42 sections is given below:
A
Multiple tests performed on the same source using sound methodology and reported in
enough detail for adequate validation. These tests do not necessarily conform to the
methodology specified in the EPA reference test methods, although these methods were
certainly used as a guide for the methodology actually used.
B
Tests that were performed by a generally sound methodology but lack enough detail for
adequate validation.
C
Tests that were based on an untested or new methodology or that lacked a significant
amount of background data.
D
Tests that were based on a generally unacceptable method but may provide an order-of-
magnitude value for the source.
The following criteria are used to evaluate source test reports for sound methodology and
adequate detail:
1. Source operation. The manner in which the source was operated is well documented in
the report. The source was operating within typical parameters during the test.
2. Sampling procedures. The sampling procedures conformed to a generally acceptable
methodology. If actual procedures deviated from accepted methods, the deviations are
well documented. When this occurrs, an evaluation is made of the extent to which
such alternative procedures could influence the test results.
3. Sampling and process data. Adequate sampling and process data are documented in
the report. Many variations can occur unnoticed and without warning during testing.
Such variations can induce wide deviations in sampling results. If a large spread
between test results cannot be explained by information contained in the test report,
the data are suspect and are assigned a lower rating.
4. Analysis and calculations. The test reports contain original raw data sheets. The
nomenclature and equations used are compared to those (if any) specified by the EPA
to establish equivalency. The depth of review of the calculations was dictated by the

14
reviewer's confidence in the ability and conscientiousness of the tester, which in turn
was based on factors such as consistency of results and completeness of other areas of
the test report.
3.3 Emission Factor Quality Rating System
The quality of the emission factors developed from analysis of the test data was rated
utilizing the following general criteria:
A (Excellent)
Developed only from A-rated test data taken from many randomly chosen facilities in the
industry population. The source category is specific enough so that variability within the
source category population may be minimized.
B (Above average)
Developed only from A-rated test data from a reasonable number of facilities. Although no
specific bias is evident, it is not clear if the facilities tested represent a random sample of the
industry. As in the A-rating, the source category is specific enough so that variability within
the source category population may be minimized.
C (Average)
Developed only from A- and B-rated test data from a reasonable number of facilities.
Although no specific bias is evident, it is not clear if the facilities tested represent a random
sample of the industry. As in the A-rating, the source category is specific enough so that
variability within the source category population may be minimized.
D (Below average)
The emission factor was developed only from A- and B-rated test data from a small number
of facilities, and there is reason to suspect that these facilities do not represent a random
sample of the industry. There also may be evidence of variability within the source category
population. Limitations on the use of the emission factor are noted in the emission factor
table.
E (Poor)
The emission factor was developed from C- and D-rated test data, and there is reason to
suspect that the facilities tested do not represent a random sample of the industry. There also

15
may be evidence of variability within the source category population. Limitations on the use
of these factors are always noted.
The use of these criteria is somewhat subjective and depends to an extent on the individual
reviewer.
3.4 References for Chapter 3.0
1. Technical Procedures for Developing AP-42 Emission Factors and Preparing AP-42Sections. U.S. Environmental Protection Agency, Office of Air Quality Planning andStandards, Technical Support Division, Research Triangle Park, NC, 27711, April 1992.[Note: this document is currently being revised at the time of this printing.]
2. Compilation of Air Pollutant Emission Factors, Volume I: Stationary Point and AreaSources, Supplement A, Appendix C.2, "Generalized Particle Size Distributions." U.S.Environmental Protection Agency, October 1986.

16
4.0 POLLUTANT EMISSION FACTOR DEVELOPMENT
4.1 Criteria Pollutant Emission Data
Particulate Matter
Due to a lack of usable data for most processes associated with the secondary copper
processing industry, revised particulate matter emission factors were developed only for rotary
smelting furnaces during this update. These revised factors for rotary smelting furnaces are based
upon a recent emission test series documented in Reference 4, which is discussed in more detail in
Section 4.3 of this background report. The resulting controlled and uncontrolled particulate matter
emission factors have been assigned quality ratings of "C" and "D," respectively.
The sources from which the emission factors presented in the previous AP-42 section are
derived were reviewed, and the factors appear to have been calculated and compiled correctly.
Fugitive particulate matter emission factors presented in the previous version of this section were
omitted, because the method by which they were estimated had no technical basis. All of these
fugitive factors were simply five percent of the corresponding uncontrolled stack emissions. The
sources of most of the remaining emission factors are not available for review. As a result, these
factors have been assigned ratings of "E" due to uncertainty as to their representativeness of
current industry operations.
Lead
Due to a lack of usable data for most processes associated with the secondary copper
processing industry, lead emission factors were developed only for rotary smelting furnaces during
this update. These factors for rotary smelting furnaces are based upon a recent emission test series
documented in Reference 4, which is discussed in more detail in Section 4.3 of this background
report. The resulting controlled lead emission factors have been assigned a quality rating of "B."
The sources from which the emission factors presented in the previous AP-42 section are
derived were not available for review. These references are not primary sources of emission test
data. As a result, these factors have been assigned ratings of "E" due to uncertainty as to their
representativeness of current industry operations.
17
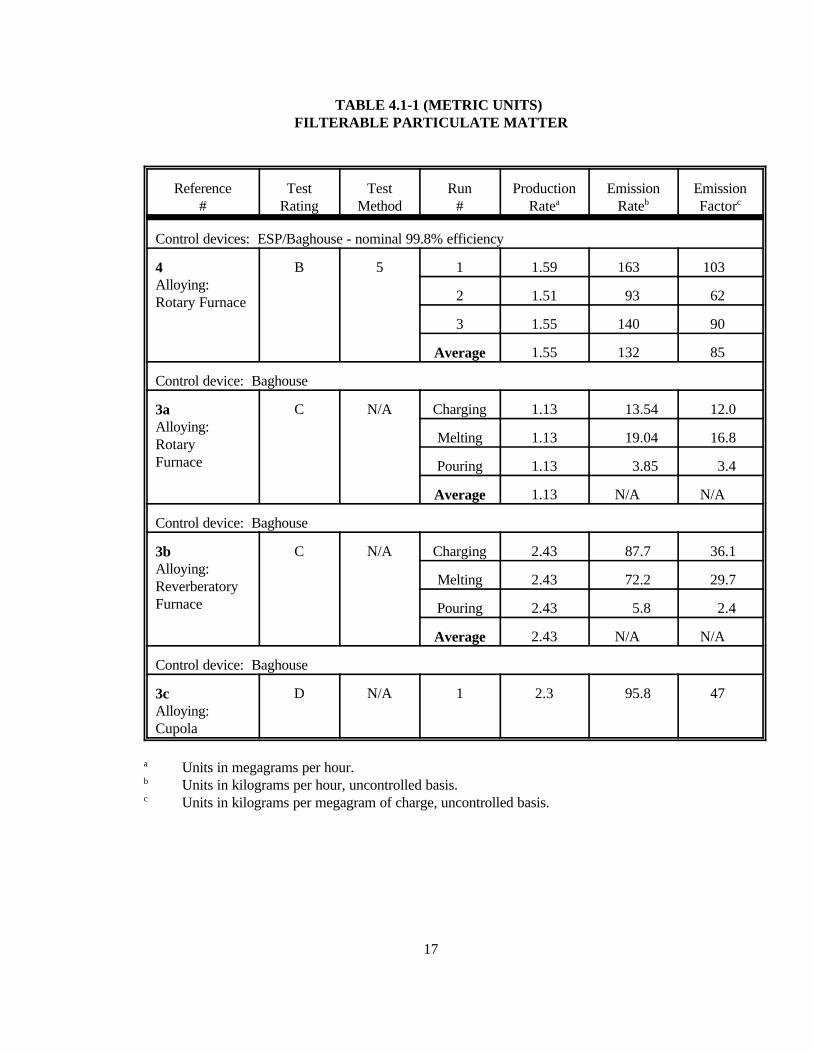
TABLE 4.1-1 (METRIC UNITS)FILTERABLE PARTICULATE MATTER
Reference#
TestRating
TestMethod
Run#
ProductionRatea
EmissionRateb
EmissionFactorc
Control devices: ESP/Baghouse - nominal 99.8% efficiency
4Alloying:Rotary Furnace
B 5 1 1.59 163 103
2 1.51 93 62
3 1.55 140 90
Average 1.55 132 85
Control device: Baghouse
3aAlloying:RotaryFurnace
C N/A Charging 1.13 13.54 12.0
Melting 1.13 19.04 16.8
Pouring 1.13 3.85 3.4
Average 1.13 N/A N/A
Control device: Baghouse
3bAlloying:ReverberatoryFurnace
C N/A Charging 2.43 87.7 36.1
Melting 2.43 72.2 29.7
Pouring 2.43 5.8 2.4
Average 2.43 N/A N/A
Control device: Baghouse
3cAlloying:Cupola
D N/A 1 2.3 95.8 47
a Units in megagrams per hour.b Units in kilograms per hour, uncontrolled basis.c Units in kilograms per megagram of charge, uncontrolled basis.

18
TABLE 4.1-1 (ENGLISH UNITS)FILTERABLE PARTICULATE MATTER
Reference#
TestRating
TestMethod
Run#
ProductionRatea
EmissionRateb
EmissionFactorc
Control devices: ESP/Baghouse - nominal 99.8% efficiency
4Alloying:Rotary Furnace
B 5 1 1.75 360 206
2 1.66 205 123
3 1.71 310 181
Average 1.71 291 170
Control device: Baghouse
3aAlloying:RotaryFurnace
C N/A Charging 1.24 29.85 24.0
Melting 1.24 41.98 33.7
Pouring 1.24 8.48 6.8
Average 1.24 N/A N/A
Control device: Baghouse
3bAlloying:ReverberatoryFurnace
C N/A Charging 2.68 193.4 72.2
Melting 2.68 159.2 59.4
Pouring 2.68 12.8 4.8
Average 2.68 N/A N/A
Control device: Baghouse
3cAlloying:Cupola
D N/A 1 2.5 211.2 93
a Units in tons per hour.b Units in pounds per hour, uncontrolled basis.c Units in pounds per ton of charge, uncontrolled basis.

19
TABLE 4.1-2 (METRIC UNITS)FILTERABLE PLUS INORGANIC CONDENSIBLE PARTICULATE MATTER
Reference#
TestRating
TestMethod
Run#
ProductionRatea
EmissionRateb
EmissionFactorc
Control device: Baghouse
3aAlloying:Rotary Furnace
C N/A Charging 1.13 13.63 12.1
Melting 1.13 19.39 17.2
Pouring 1.13 4.33 3.8
Average 1.13 N/A N/A
Control device: Baghouse
3bAlloying:ReverberatoryFurnace
C N/A Charging 2.43 88.1 36.2
Melting 2.43 72.2 29.7
Pouring 2.43 5.8 2.4
Average 2.43 N/A N/A
Control device: Baghouse
3cAlloying:Cupola
D N/A 1 2.3 97.9 43
a Units in megagrams per hour.b Units in kilograms per hour, uncontrolled basis.c Units in kilograms per megagram of charge, uncontrolled basis.

20
TABLE 4.1-2 (ENGLISH UNITS)FILTERABLE PLUS INORGANIC CONDENSIBLE PARTICULATE MATTER
Reference#
TestRating
TestMethod
Run#
ProductionRatea
EmissionRateb
EmissionFactorc
Control device: Baghouse
3aAlloying:Rotary Furnace
C N/A Charging 1.24 30.05 24.1
Melting 1.24 42.75 34.3
Pouring 1.24 9.54 7.7
Average 1.24 N/A N/A
Control device: Baghouse
3bAlloying:ReverberatoryFurnace
C N/A Charging 2.68 194.2 24.0
Melting 2.68 159.3 59.4
Pouring 2.68 12.8 4.8
Average 2.68 N/A N/A
Control device: Baghouse
3cAlloying:Cupola
D N/A 1 2.5 215.2 86
a Units in tons per hour.b Units in pounds per hour, uncontrolled basis.c Units in pounds per ton of charge, uncontrolled basis.
21
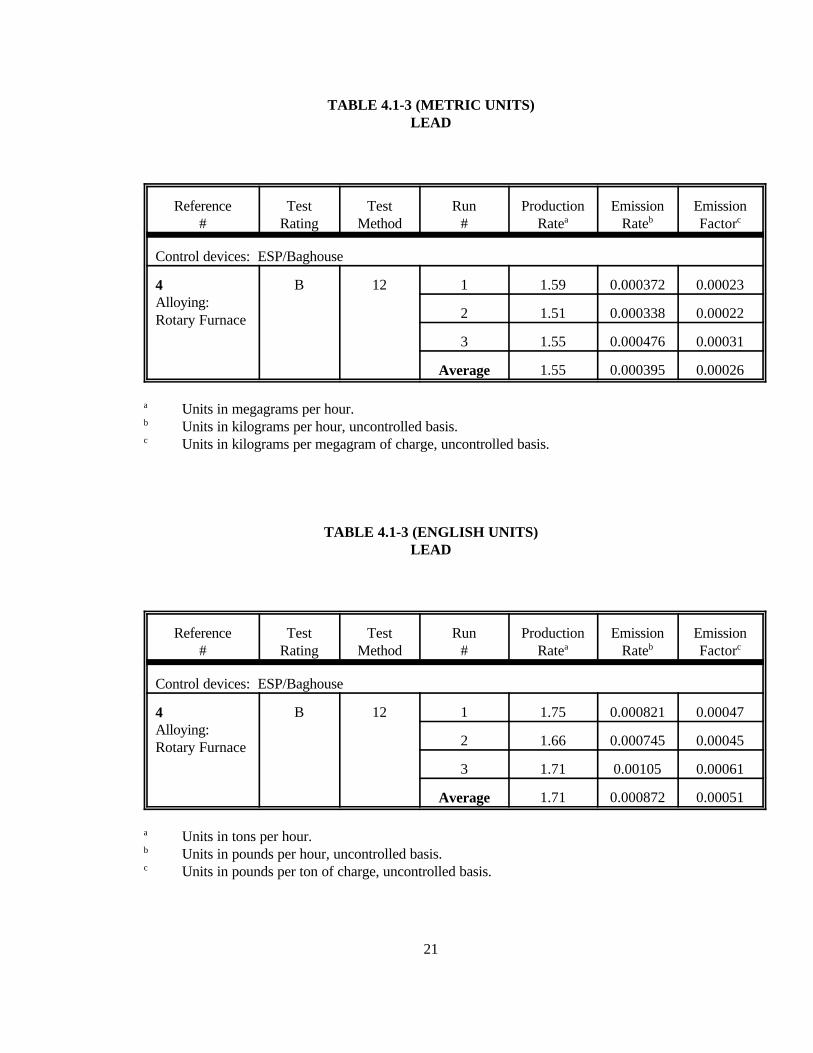
TABLE 4.1-3 (METRIC UNITS)LEAD
Reference#
TestRating
TestMethod
Run#
ProductionRatea
EmissionRateb
EmissionFactorc
Control devices: ESP/Baghouse
4Alloying:Rotary Furnace
B 12 1 1.59 0.000372 0.00023
2 1.51 0.000338 0.00022
3 1.55 0.000476 0.00031
Average 1.55 0.000395 0.00026
a Units in megagrams per hour.b Units in kilograms per hour, uncontrolled basis.c Units in kilograms per megagram of charge, uncontrolled basis.
TABLE 4.1-3 (ENGLISH UNITS)LEAD
Reference#
TestRating
TestMethod
Run#
ProductionRatea
EmissionRateb
EmissionFactorc
Control devices: ESP/Baghouse
4Alloying:Rotary Furnace
B 12 1 1.75 0.000821 0.00047
2 1.66 0.000745 0.00045
3 1.71 0.00105 0.00061
Average 1.71 0.000872 0.00051
a Units in tons per hour.b Units in pounds per hour, uncontrolled basis.c Units in pounds per ton of charge, uncontrolled basis.

22
Carbon Monoxide.
Due to a lack of usable data for most processes associated with the secondary copper
processing industry, carbon monoxide emission factors were developed only for rotary smelting
furnaces during this update. These factors for rotary smelting furnaces are based upon a recent
emission test series documented in Reference 4, which is discussed in more detail in Section 4.3 of
this background report. The resulting carbon monoxide emission factors, which are reported as
uncontrolled because the only devices serving the rotary furnace tested are a baghouse and an ESP,
have been assigned a quality rating of "B" due to inconsistency in the test results.
Nonmethane Organic Compounds.
Due to a lack of usable data for most processes associated with the secondary copper
processing industry, organic compound emission factors were developed only for rotary smelting
furnaces during this update. These factors for rotary smelting furnaces are based upon a recent
emission test series documented in Reference 4, which is discussed in more detail in Section 4.3 of
this background report. This testing utilized a gas chromatograph with a flame ionization detector
and quantified total organic compound content in the stack gas, with no adjustment made for
compounds such as methane that are considered non-photochemically reactive. The resulting total
organic compound emission factors, which are reported as uncontrolled because the only devices
serving the rotary furnace tested are a baghouse and an ESP, have been assigned a quality rating of
"B" due to inconsistency in the test results.

23
TABLE 4.1-4 (METRIC UNITS)CARBON MONOXIDE
Reference#
TestRating
TestMethod
Run#
ProductionRatea
EmissionRateb
EmissionFactorc
Control devices: ESP/Baghouse
4Alloying:Rotary Furnace
B 10 1 1.59 0.63 0.40
2 1.51 2.13 1.42
3 1.55 0.50 0.32
Average 1.55 1.09 0.72
a Units in megagrams per hour.b Units in kilograms per hour, uncontrolled basis.c Units in kilograms per megagram of charge, uncontrolled basis.
TABLE 4.1-4 (ENGLISH UNITS)CARBON MONOXIDE
Reference#
TestRating
TestMethod
Run#
ProductionRatea
EmissionRateb
EmissionFactorc
Control devices: ESP/Baghouse
4Alloying:Rotary Furnace
B 10 1 1.75 1.4 0.80
2 1.66 4.7 2.83
3 1.71 1.1 0.64
Average 1.77 2.4 1.43
a Units in tons per hour.b Units in pounds per hour, uncontrolled basis.c Units in pounds per ton of charge, uncontrolled basis.

24
TABLE 4.1-5 (METRIC UNITS)TOTAL ORGANIC COMPOUNDS
(as methane)
Reference#
TestRating
TestMethod
Run#
ProductionRatea
EmissionRateb
EmissionFactorc
Control devices: ESP/Baghouse
4Alloying:Rotary Furnace
B NJ3 1 1.59 0.221 0.14
2 1.51 3.110 2.06
3 1.55 0.530 0.34
Average 1.55 1.287 0.83
a Units in megagrams per hour.b Units in kilograms per hour, uncontrolled basis.c Units in kilograms per megagram of charge, uncontrolled basis.
TABLE 4.1-5 (ENGLISH UNITS)TOTAL ORGANIC COMPOUNDS
(as methane)
Reference#
TestRating
TestMethod
Run#
ProductionRatea
EmissionRateb
EmissionFactorc
Control devices: ESP/Baghouse
4Alloying:Rotary Furnace
B NJ3 1 1.75 0.488 0.28
2 1.66 6.857 4.13
3 1.71 1.169 0.68
Average 1.77 2.838 1.70
a Units in tons per hour.b Units in pounds per hour, uncontrolled basis.c Units in pounds per ton of charge, uncontrolled basis.

25
Sulfur Dioxide.
Due to a lack of data quantifying sulfur dioxide emissions from processes associated with
the secondary copper processing industry, no emission factors for this pollutant are presented in
either the previous or revised versions of AP-42 Section 12.9.
Nitrogen Oxides.
No data on emissions of oxides of nitrogen were found directly from processes associated
with the secondary copper processing industry. It can be assumed that these compounds are emitted
from in-process heating units, but no quantitative data are available.
4.2 Noncriteria Pollutant Emission Data
Hazardous Air Pollutants.
Hazardous Air Pollutants (HAP's) are defined in the 1990 Clean Air Act Amendments.
Included in this list are lead, nickel, and other heavy metals contained in the scrap that is the
primary raw material for the secondary copper processing industry. No quantitative emissions data
suitable for use in emission factor development are available for any HAP's other than lead, which
is discussed in Section 4.1 of this background report.
Global Warming Gases.
Pollutants such as methane (CH4), carbon dioxide (CO2), and nitrous oxide (N2O) have been
found to contribute to overall global warming. No data on emissions of any of these pollutants
were found for processes associated with the secondary copper processing industry. The prevalence
of pyrometallurgical processes makes the likelihood of carbon dioxide emissions high, but data to
quantify these emissions are not available.
Stratospheric Ozone-Depleting Gases.
Chlorofluorocarbons, hydrochlorofluorocarbons, carbon tetrachloride, methyl chloroform,
and halons have been found to contribute to stratospheric ozone depletion. Because none of these
compounds is used in any of the processes associated with secondary copper processing, no data on
emissions of these pollutants were found nor expected.

26
4.3 Review of Specific Data Sets
Reference 1: Emission Factors and Emission Source Information for Primary and SecondaryCopper Smelters
This 1977 document examines the secondary copper smelting and alloying industries for the
purpose of upgrading emission factors for these processes. This document is not referenced in the
two most recent (1977 and 1980) versions of AP-42 Section 7.9 as a source of emission factors,
but is the basis for all point source particulate matter emission factors in both. Intensive data
collection efforts were undertaken for the development of this document. Responses were received
from a large number of local, state, and regional air pollution control agencies. Unfortunately,
many of these responses contained no data pertaining to secondary copper processes; others
contained data that were not supported by emission tests; and several were no longer available in
the AP-42 background files maintained by the Emission Factors and Methodologies Section. These
responses form the basis for the list of agencies cited as the source of the emission factors in Table
12.9-1 in the 1980 revision of Section 7.9. Emission factors for six types of furnaces are presented
in this document, but no derivations of these factors are provided.
For blast furnaces, or cupolas, particulate matter emission factors for three different classes
of charge material are presented. The uncontrolled factor for scrap copper charge is derived from
testing on one furnace. Both controlled and uncontrolled emission factors for insulated copper wire
charge are also derived from one test. Both controlled and uncontrolled emission factors for scrap
copper and brass charge are derived from two tests at one facility. None of these emission tests is
available for review.
For reverberatory furnaces, an uncontrolled particulate matter emission factor for copper
charge is derived from an unspecified number of tests on 12 facilities. A controlled emission factor
for copper charge is derived from two tests on separate facilities. Both controlled and uncontrolled
emission factors for brass and bronze charge are derived from two tests on separate facilities. None
of these emission tests is available for review. One emission test report obtained by the EPA after
the publication of this document is available for review, and is summarized as Reference 2 below.
For rotary furnaces, an uncontrolled particulate matter emission factor for brass and bronze
charge is derived from two tests on separate facilities. A controlled emission factor for brass and
bronze charge is derived from three tests on separate facilities. An uncontrolled emission factor for
foundry brass charge is derived from one test, and a controlled emission factor for foundry brass

27
charge is derived from three tests on a single facility. None of these emission tests is available for
review.
For crucible and pot furnaces with brass and bronze charge, an uncontrolled particulate
matter emission factor is derived from 17 tests on 13 facilities, and a controlled emission factor is
derived from five tests on three facilities. None of these emission tests is available for review.
For electric arc furnaces, an uncontrolled particulate matter emission factor for copper
charge is derived from three tests on two facilities, and a controlled emission factor for copper
charge is derived from two tests on a single facility. An uncontrolled emission factor for brass and
bronze charge is derived from three tests on two facilities, and a controlled emission factor for
brass and bronze charge is derived from one test. None of these emission tests is available for
review.
For electric induction furnaces, an uncontrolled particulate matter emission factor for brass
and bronze charge is derived from an unspecified number of tests on 18 facilities. A controlled
emission factor for brass and bronze charge is derived from an unspecified number of tests on six
facilities. Emission factors for copper charge on both an uncontrolled basis and a controlled-by-
baghouse basis are derived from one test each. None of these emission tests is available for review.
Two emission test reports conducted on an electric induction furnace before and after installation
of a cyclone dust collector are available and are summarized as References 3a and 3b below.
Reference 2: Emission Test Report - Southwire, Carrollton, GA, May 1980
In response to an EPA request for emission data for secondary copper and aluminum
processes, the Georgia Department of Natural Resources submitted several pages summarizing the
results of a test performed on a furnace at this Georgia facility. The average charge rate during this
test was 49 tons per hour, and emission rates of 31.5 tons per hour for particulate matter and 5.5
tons per hour for lead were calculated.

28
References 3a-b: Emission Test Reports - Wolverine Tube Division, Decatur, AL, May1972 and June 1974
In response to an EPA request for emission data for secondary copper and aluminum
processes, the EPA Region IV office in Atlanta submitted two emission test reports conducted on
an electric induction furnace at this Alabama facility. The first test indicates an uncontrolled
filterable particulate matter emission factor of 7.6 lb/ton, which was not in compliance with the
facility's permitted emission limits. As a result, a mechanical cyclone-type dust collector was
installed shortly thereafter, and a performance test was conducted in 1974. This second test
revealed a controlled filterable particulate matter emission factor of 1.7 lb/ton. Both of these test
reports are fairly well documented, but the methodologies used are not described in adequate detail.
They are not deemed to be superior to the emission factors presented in the 1980 version of AP-42
Section 7.9.
Reference 4: Compliance Stack Sampling Report - Kearny Smelting and Refining, Harrison,NJ, December 1991
This report details the results of testing for particulate matter and lead (using EPA
Reference Method 12), carbon monoxide (EPA Reference Method 10), and total hydrocarbons (NJ
Air Test Method 3). The testing was performed on a rotary smelting furnace charged with alloy
scrap, including about 86 percent copper, 8 percent zinc, 4 percent tin, 2 percent lead, and less
than 1 percent iron and nickel. The smelting process takes about fifteen hours per batch, and is
followed by a three-hour "blowing" or refining process. Blowing involves the introduction of
compressed air under the surface of the molten metal, causing some of the zinc to exit the furnace
as zinc oxide.
Since this test was to demonstrate compliance with permitted emission limitations, testing
was performed only downstream of the control equipment and only during the smelting process.
Emissions of particulate from this furnace are controlled by a spray cooling tower, an electrostatic
precipitator (ESP), and a two-stage baghouse filter. The design efficiency of the ESP is 50 percent,
and that of the baghouse filter is 99.6 percent, for a combined 99.8 percent control efficiency.
Results of the three test runs for each pollutant, and corresponding test-specific emission factors,
are tabulated in Tables 4.1-1 and 4.1-3 through 4.1-5. Emission factors for gaseous pollutants
(CO, TOC) can be considered uncontrolled, because the control equipment is effective only for
particulate matter. The emission factor for filterable particulate is given on an uncontrolled basis

29
by applying a nominal efficiency of 99.8 percent to the measured controlled emission rate. The
emission factor for lead is given on a controlled basis because no differentiation was made in the
test report between front- and back-half lead catch, so a control efficiency cannot be applied in the
same manner as for filterable particulate. These emission data have been assigned quality ratings
of "B" because they are based on test data on controlled processes. Emission data for carbon
monoxide and total organic compounds are also rated "B," because the results of these tests are
somewhat inconsistent.
Reference 5: Source Test Report - North Chicago Smelters and Refiners, North Chicago, IL,July 1968
This report details the results of emission testing for particulate matter (using a method
similar to EPA Reference Method 5). Testing was performed by a crew from the Engineering
Section of the Public Health Service, in order to provide data on baghouse efficiencies for copper-
based scrap melting furnaces. No field nor laboratory data are included in this test report,
precluding the examination of documentation of sampling and analysis procedures. Otherwise, the
report is thorough, including a description of the methodology used. It appears from the report that
no velocity traverse was conducted, absence of cyclonic flow was not verified, and particulate
sampling was performed at only one point for each location (probably the centroid). The results of
this test are thus not judged to provide an accurate representation of emissions from this type of
source.
The first test period was conducted at the inlet and outlet of the baghouse serving a rotary
furnace charged with 16.4 tons of scrap, consisting of about 85 percent copper and 5 percent each
of zinc, lead, and tin. Total (filterable plus inorganic condensible) particulate matter emissions at
the inlet to the baghouse during the charging step averaged 29.85 pounds per hour (lb/hr); during
the refining step, 41.98 lb/hr; and during the pouring step, 8.48 lb/hr. Particulate matter emissions
at the outlet from the baghouse averaged 1.613 lb/hr during the entire cycle.
The second test period was conducted with two rotary furnaces and a cupola venting to the
baghouse being tested, precluding the use of the data for emission factor development.
The third test period was conducted at the inlet and outlet of the baghouse serving a
reverberatory furnace charged with 52.5 tons of scrap, again consisting of about 85 percent copper
and five percent each of zinc, lead, and tin. Total (filterable plus inorganic condensible) particulate
matter emissions at the inlet to the baghouse during the charging step averaged 194.2 pounds per

30
hour (lb/hr); during the refining step, 159.3 lb/hr; and during the pouring step, 12.81 lb/hr.
Particulate matter emissions at the outlet from the baghouse averaged 3.32 lb/hr during the entire
cycle.
The fourth test period, like the second, was conducted with multiple operating sources being
vented to the baghouse being tested, precluding the use of these data in emission factor
development.
The fifth test period was conducted at the inlet and outlet of the baghouse serving a cupola
that was being charged at a rate of 2.5 tons per hour. Total (filterable plus inorganic condensible)
particulate matter emissions for the one 45-minute test run conducted at the inlet to the baghouse
were 215.9 pounds per hour (lb/hr); those at the outlet from the baghouse averaged 8.00 lb/hr.
Results of the testing for filterable particulate matter and total (filterable plus inorganic
condensible) particulate matter at the inlets to the baghouses for the first, third, and fifth test
periods are presented in Tables 4.1-1 and 4.1-2, respectively. Because these emission test results
are not felt to be highly representative, the AP-42 emission factors for the processes tested have not
been revised.
Reference 6: EPA Test Report - West Coast Smelting and Refining, Chino, CA, November1971
This report details the results of emission testing for particulate matter (using EPA
Reference Method 5). Testing was performed by a contractor of the EPA, in order to provide a
basis for determination of federal emission standards for new sources within the brass and bronze
refining industry. No description of the furnace being tested is provided in the report, nor is the
process rate during testing documented. It is documented that testing was performed downstream of
a baghouse filter. Otherwise, the report is thorough, including a description of the methodology
used. Values for condensible particulate matter for the first two test runs are not representative,
due to the use of a soap solution in rinsing the impingers. Because a velocity traverse revealed
highly turbulent flow near the walls of the stack being tested, sampling time was increased at
points nearer the center of the stack where gas velocity could be measured reliably. The calculated
emission rate, which is based upon concentration of particulate in the gas as well as the volumetric
flow rate of the gas, is thus not judged to provide an accurate representation of emissions from this
type of source. No emission factor can be calculated based upon this emission test report due to its
lack of process data.

31
Reference 7: EPA Test Report - R.L. Lavin & Sons, Inc., Chicago, IL, November 1971
This report details the results of emission testing for particulate matter (using EPA
Reference Method 5). Testing was performed by a contractor of the EPA, in order to provide a
basis for determination of federal emission standards for new sources within the brass and bronze
refining industry. No description of the furnace being tested is provided in the report, nor is the
process rate during testing documented. It is documented that testing was performed downstream of
a baghouse filter. Otherwise, the report is thorough, including a description of the methodology
used. No emission factor can be calculated based upon this emission test report due to its lack of
process data.
Reference 8: EPA Test Report - American Smelting and Refining Co., San Francisco, CA,December 1971
This report details the results of emission testing for particulate matter (using EPA
Reference Method 5). Testing was performed by a contractor of the EPA, in order to provide a
basis for determination of federal emission standards for new sources within the brass and bronze
refining industry. No description of the furnace being tested is provided in the report, nor is the
process rate during testing documented. It is documented that testing was performed downstream of
a baghouse filter. Otherwise, the report is thorough, including a description of the methodology
used. No emission factor can be calculated based upon this emission test report due to its lack of
process data.
4.4 Data Gap Analysis
While very little emission test data were available to enable development of revised emission
factors for AP-42 Section 12.9, it is not felt that a severe shortage of test data exists for this
industry. Telephone conversations with industry personnel indicated that several facilities have
been tested in recent years, and that others plan testing in the near future. These facilities were,
unfortunately, not willing to provide the results of these emission tests. Similarly, state and local
air pollution control agencies have much data on file but are generally unable to catalog or provide
copies of the associated test reports. Collection of these additional emission data for secondary
copper smelting, refining, and alloying processes is recommended to the EPA to be a primary
option for further development of revised emission factors.

32
4.5 References for Chapter 4.0
1. Emission Factors and Emission Source Information for Primary and Secondary CopperSmelters, EPA-450/3-77-051, U.S. Environmental Protection Agency, Research TrianglePark, NC, December 1977.
2. Emission Test Report - Southwire, Carrollton, GA, CDS Labs, Carrollton, GA, May 1980.
3. Emission Test Reports - Wolverine Tube Division, Decatur, AL, United Oil Products, AirCorrection Division, Darien, CT, May 1972 and June 1974.
4. Compliance Stack Sampling Report - Kearny Smelting and Refining, Harrison, NJ, 11-13December 1991, Air Recon, Raritan, NJ, January 1992.
5. Test No. 68-12: North Chicago Refiners and Smelters, North Chicago, IL, 7-11 July 1968, Department of Health, Education, and Welfare, Public Health Service,National Air Pollution Control Administration, Abatement Program, Field OperationsActivity Engineering Section, Source Testing Unit.
6. EPA Test No. __-__-__: West Coast Smelting and Refining, Chino, CA, 10-11 November 1971, Engineering-Science, Inc., Washington, DC, December 1971.
7. EPA Test No. 71-C1-26: R.L. Lavin & Sons, Inc., Chicago, IL, 1-5 November 1971,Engineering-Science, Inc., Washington, DC, March 1972.
8. EPA Test No. 71-C1-27: American Smelting and Refining Co., San Francisco, CA, 29November - 4 December 1971, Engineering-Science, Inc., Washington, DC, February 1972.

33
TABLE 4.5-1
LIST OF CONVERSION FACTORS
Multiply: by: To obtain:
mg/dscm 4.37 x 10⁻⁴ gr/dscf
m2 10.764 ft2
m3 35.31 ft3
m 3.281 ft
kg 2.205 lb
kPa 0.145 psia
kg/Mg 2.0 lb/ton
Mg 1.1023 ton
Temperature conversion equations:
Fahrenheit to Celsius:
EC '(EF&32)
1.8
Celsius to Fahrenheit:
EF ' 1.8(EC) % 32