background paper the learning generation
TRANSCRIPT

Raising Domestic Resources for Equitable Education
Background PaperThe Learning Generation
Asma Zubairi and Pauline RoseREAL Centre, University of Cambridge

This paper was prepared for the International Commission on Financing Global Education Opportunity as a
background paper for the report, The Learning Generation: Investing in education for a changing world. The views and
opinions in this background paper are those of the author(s) and are not endorsed by the Education Commission or
its members. For more information about the Commission’s report, please visit: report.educationcommission.org.

1
Raising domestic resources for equitable education
Asma Zubairi and Pauline Rose Research for Equitable Access and Learning (REAL) Centre
University of Cambridge
Background paper for the International Commission on Financing Global Education
Acknowledgements: The research team would like to thank the Education Commission research team for their support to this work, including providing feedback on earlier drafts. We are also grateful for comments received from colleagues in the REAL Centre. Any inaccuracies are the responsibility of the authors.

2
Table of Contents Acronyms and Abbreviations .................................................................................................. 3 Introduction ............................................................................................................................ 4 1. Meeting commitments on taxes collection and education spending .............................. 5 2. Mobilizing government revenue ..................................................................................... 7
2.1 Many low-income countries mobilize their revenue through regressive taxation ............ 7 2.2 Many of the poorest countries fail to achieve their potential in tax collection due to tax exemptions or evasion by powerful interest groups ........................................................... 11 2.3 Some countries have been successful their tax reform efforts ...................................... 13 2.4 Donor investment can help improve the mobilization of additional tax revenue, but needs to do more .............................................................................................................. 14
3. Government expenditure on education ........................................................................ 17 3.1 Education budgets have great potential to redistribute wealth as they make up a large share of government budgets in developing countries ....................................................... 17 3.2 Current spending on pre-primary education makes up a very small share of total education funding in the poorest countries ........................................................................ 18 3.3 The investment case for prioritizing domestic resources for primary education remains strong for low-income countries ........................................................................................ 19 3.4 Prioritizing primary education spending at early grades .............................................. 20 3.5 Countries must heed the lessons from primary schooling when planning the roll out of fee free secondary education ............................................................................................ 21 3.6 Tertiary education subsumes a large share of public spending on education in many poor counties relative to the share of the youth who gain access....................................... 22 3.7 Public expenditure on education is more regressive in low-income countries ............... 24
4. Targeting resources to reach the most disadvantaged .................................................. 26 4.1 Education budgets are often distributed without taking into account the investment needed to mitigate disadvantage ...................................................................................... 26 4.2 Some middle and high-income countries have addressed disadvantage in their education budgets through the use of redistributive funding formulas .............................. 27 4.3 Even where a funding formula is in place, a large number of factors continue to perpetuate learning inequalities for the most disadvantaged ............................................ 31
5. Spending on social protection programmes .................................................................. 36 5.1 Social protection programmes: a global picture ........................................................... 36 5.2 Government budgets on social protection programmes though small can be effectively complemented alongside government budgets on education ............................................ 37 5.3 Social safety net programmes have been expanding in low-income countries, but do not reach all of the poorest households ................................................................................... 38 5.4 Despite being more effective at targeting, conditional cash transfers make up a low proportion of social safety net programmes ...................................................................... 39
6. The combined impact of revenue and spending policies on redistribution ................... 40 6.1 Currently government spending on public services is having a greater impact on reducing income inequalities than taxation ....................................................................... 40
7. Private expenditure on education ................................................................................. 43 7.1 Insufficient spending by governments on education hurts the poorest households in low-income countries ............................................................................................................... 43 7.2 Alternative private financing models to compensate for insufficient public funding are unlikely to be sustainable .................................................................................................. 44 7.3 Information on the financing landscape for education needs to be improved to effectively address disadvantage ....................................................................................... 46
Recommendations ................................................................................................................ 48 Conclusion ............................................................................................................................ 49 References ............................................................................................................................ 50

3
Acronyms and Abbreviations
BRAC Bangladesh Rural Advancement Committee DAC Development Assistance Committee EFA Education for All ENABLE Ensure Access to Better Learning Experiences ETF Education Tax Fund FUNDEB Fund for the Development of Basic Education and Appreciation of the
Teaching Profession GDP Gross Domestic Product GPE Global Partnership for Education IMF International Monetary Fund LEP Learning Enhancement Programme MDG Millennium Development Goal NGO Non Governmental Organization ODA Official Development Assistance OECD Organization for Economic Cooperation and Development SDG Sustainable Development Goal SSA Sarva Shiksha Abhiyan StAR Stolen Asset Recovery TETFund Tertiary Education Trust Fund UNESCO United Nations Educational, Scientific and Cultural Organization UNODC United Nations Office on Drugs and Crime

4
Introduction Inequality remains high on the global agenda and, if anything, has gained greater attention through the focus of the Sustainable Development Goals on leaving no one behind. A number of studies have recently been published to illustrate the importance of such a focus. Between 1990 and 2010 it was estimated that of 89 developing countries, 46 became more unequal (Bastagli et al., 2012). It is also reported that wealth is becoming more concentrated amongst the few with the latest estimates indicating that the wealthiest 1% of the world’s population had more wealth than the rest of the world combined in 2015 (Credit Suisse, 2015). And further analysis estimates that, in 2010, 388 people owned as much wealth as the amount owned by the poorest 50% (3.6 billion people); by 2015 the equivalent was 62 people (Hardoon et al., 2016). Moreover, there is a need to address wide inequalities within the education sector. The proposed SDG target for education, Target 4.1 pledges to, by 2030, “ensure that all girls and boys complete free, equitable and quality primary and secondary education leading to relevant and effective learning outcomes” (UN, 2015). The Incheon Declaration adopted at the 2015 World Education Forum, committed to “addressing all forms of exclusion and marginalization, disparities and inequalities in access, participation and learning outcomes” with no education target being considered met “unless met by all”(UNESCO et al., 2015). As our accompanying paper highlights, the world is currently far from achieving such commitments in equitable access and learning (REAL Centre, 2016). More and better allocated financing will be key to achieving these education commitments. As such, target 17.1 of the SDG Agenda pledges to strengthen “domestic resource mobilization, including through international support to developing countries, to improve domestic capacity for tax and other revenue collection” (UN, 2015). This is important given that tax-to-GDP collection ratios in many developing countries are low by global standards meaning that inadequate resources are collected to invest into education systems. As this paper shows, addressing inequality in education requires attention not only to the mobilization of additional domestic resources, but also to how domestic resources are mobilized (including the types of taxes that are used and ability of tax authorities to tackle tax avoidance and evasion); as well as how they are spent (including the amount of domestic resources allocated to education overall, and how these resources are distributed within the education sector).

5
1. Meeting commitments on taxes collection and education spending Over the last 15 years, domestic revenues in developing countries have increased, on average, by 14% annually (Gulasan and Hurley, 2015). Domestic revenues are the largest – and most stable – source of financing for development, underlying why it remains such a core issue as was underscored at the Third Conference on Financing for Development, held in Addis Ababa in 2015. While indicators for SDG17.1 include total government revenue as a proportion of GDP and the proportion of domestic budget funded by domestic taxes, the goal does not explicitly set targets for these. At the most recent conference on financing for development, held in Addis Ababa in July 2015, domestic resource mobilization was heralded a top priority. The draft document had proposed that “[c]ountries with government revenue below 20% of GDP agree to progressively increase tax revenues, with the aim of halving the gap towards 20% by 2025 (Schmidt-Traub and Sachs, 2015). Though the target of 20% was omitted in the final outcome document, it can be considered a starting point as a minimum target for the SDGs to be sufficiently funded from domestic resources. This is in line with amounts that are currently collected in high-income countries. According to recent World Bank calculations, revenues generated from tax account for 10-14% of GDP in low-income countries, compared with high-income countries where it makes up between 20-30% of GDP (World Bank, 2013a). With respect to education the Incheon Declaration adopted at the 2015 World Education Forum further reaffirmed a previous commitment of at least 15-20% of total government public expenditure being spent on education (UNESCO et al., 2015). Using the two indicators of tax revenue as a share of GDP and the proportion of government public spending allocated to education together, our analysis of the most recent data available finds that, for 111 low and middle-income countries with data, more than half (59 countries) fail to raise at least 20% of GDP in tax nor allocate 20% of the government budget towards education (Quadrant 2; Figure 1). Within this group are countries like Bangladesh, Pakistan, Tanzania and Uganda, which not only have some of the lowest tax-to-GDP rates in the world, but also spend a very small share of the government budget on education. In Pakistan, government expenditure in social services has traditionally been dwarfed by what the government spends on the military and debt servicing which together made up 7% of GDP in 2014. Given that only around 11% is collected in taxes overall, this leaves little in the way of spending for education, which barely reaches 2% of GDP (Malik and Rose, 2015). Nepal and Ethiopia are among 18 countries which should be commended for their high prioritization of spending on education within government budgets (Quadrant 1; Figure 1). Yet, the overall amount of resources available for education is constrained by poor tax collection rates. Currently both countries only collect around 11% of their national wealth in tax meaning that government expenditure’s potential to redistribute national wealth to the poorest is limited. Zimbabwe presents a different pattern whereby it collects more than a quarter of its national wealth through taxes – one of the highest in the sub-Saharan African region. Yet, education spending as a share of the government budget is just 9% – roughly the same as what it earmarked for military spending in 2015. Similarly Angola, which collects nearly 45% of its GDP in the form of tax, and in per capita terms is one of the wealthiest countries in sub-Saharan Africa, spends just 9% of its expenditure is on education (Quadrant 3; Figure 1).

6
Just nine low and middle-income economies collect a minimum level of their national wealth through taxation and meet, or exceed, 20% of government spending being on education. One is Swaziland which collects 36% of national wealth in taxation – largely due to international trade and transactions taxes – and spends 22% of its budget on education. Another is Malawi which, in 2013, collected 21% of its GDP in tax and spent 20% of the government budget on education (Quadrant 4; Figure 1). These statistics need unpacking further, however, to better understand their potential for redistribution. In Malawi, for instance, the largest share of tax revenue comes from taxation on goods and services and 28% of public education resources are spent on tertiary education – as this paper will seek to illustrate – both of these are regressive in nature and so the resources do not necessarily reach those who need them most. Swaziland, on the other hand, collects a larger share of its tax revenue in the form of more progressive taxes and also earmarks a large share of spending on education towards primary education which would benefit the poorest. Figure 1: Many countries need to both mobilize tax revenue and prioritize education Tax revenue as a percentage of GDP and education expenditure as a percentage of government expenditure, selected low and middle-income countries
Source: Authors’ calculations based on International Monetary Fund Revenue database and UNESCO Institute for Statistics. Note: Data for tax revenue and spending on education correlate to the same year where possible, or otherwise the nearest year of data available. Our analysis is supported by other recent work. In many low-income countries, the amount governments currently collect in tax revenue remains far below the potential. Tax effort – the ratio between the share of actual tax collection and taxable capacity1 – is greater in countries with a higher level of GDP per capita: in low-income countries tax effort is 0.65 versus 0.76 in high-income countries. Beyond a country’s wealth, high tax effort is also positively correlated with public expenditure on education. Data from a recent IMF study shows that 25 countries – which include India, Nigeria and Pakistan – were collecting less
1 A definition of tax capacity can, simply speaking, be that of the predicted tax-to-gross domestic product. This would be calculated by taking into account a country’s specific macroeconomic, demographic and institutional features (Le et al., 2012).
0
5
10
15
20
25
30
0 5 10 15 20 25 30 35 40 45
Educ
atio
n sp
endi
ng a
s a
shar
e of
tota
l gov
ernm
ent s
pend
ing
(%)
Tax revenue as a share of GDP (%)
Bangladesh
Pakistan
Ethiopia
Nepal
Uganda
Tanzania
Malawi
Swaziland
Zimbabwe Angola
Quadrant 2: 59 countries need to increase tax revenue & prioritise education spending
Quadrant 3: 25 countries prioritize tax revenue but need to prioritize education spending
Quadrant 1: 18 countries prioritize education spending but not tax revenue
Quadrant 4: 9 countries have achieved high tax revenue & prioritize education spending

7
than half of what they are able to potentially collect in taxable revenue in 2011 (Fenochietto and Pessino, 2013). Our analysis that follows highlights that, not only are reforms needed to raise additional domestic resources and to allocate a fair share to education. It is also necessary that, within the broad targets set by the international community on revenue collection and spending, the discussion goes further towards ensuring revenue is collected through progressive taxes by governments and is spent within education in ways that have the greatest impact on redistribution, and so on raising learning outcomes equitably. As such, the 20% tax-to-GDP ratio cannot be considered an achievement if this largely relies on collecting resources in a way that hurts the poorest households, or is not sufficiently spent on forms of education that benefits the poor and other disadvantaged groups.
2. Mobilizing government revenue
Key messages for Section 2 1. Progressive taxation policies can, if implemented effectively, redistribute wealth
towards the poorest households. Yet of the 50 low and middle-income countries with data, 26 countries collect at least 40% of their tax revenue through indirect taxes on goods and consumption which can be regressive and hurt the poorest households.
2. Currently 25 developing countries collect less than half of what can potentially be collected in tax revenue. This is due to both legal and illegal tax avoidance, by both domestic and international actors. Assets stolen by government officials, for instance, are the equivalent of 21% of the US$39 billion education funding gap identified for low and lower middle-income countries to meet the SDG goals for pre-primary, primary and secondary education.
3. In 2013, donors spent 0.05% of aid helping countries improve their efforts to mobilize more domestic revenues. This is despite the high returns that investment in this area can result in. However beyond resources for tax mobilization projects, its success hinges on strong political domestic support to strengthen resource mobilization.
2.1 Many low-income countries mobilize their revenue through regressive taxation In many of the poorest countries tax revenue is not only insufficient, but its collection is also often regressive. A large reason for this is that many governments rely on a very narrow tax base for their tax revenue, including the institutionally less demanding tax on goods and services. In such situations, the poor are in effect subsidizing the rich for their use of publicly-funded services, such as education.
The IMF estimates that an increase of about 2-4% of GDP in tax revenue is feasible in many low-income countries to achieve the minimum 20% tax-to-GDP benchmark (IMF, 2011). However, achieving a minimum tax-to-GDP ratio of 20% in low-income countries is currently hindered by the limited capacity of many tax authorities to collect revenue from individuals and corporations together with the high levels of resources leaving the country (World Bank, 2013a). Associated with this, a number of studies corroborate the findings that there is a positive correlation between tax revenue as a share of GDP and the level of development of countries (and allocation of public expenditure to education); equally there is a negative correlation between tax revenue as a share of GDP and income distribution (measured through the gini coefficient) and levels of corruption (Pessino and Fenochietto, 2010).

8
Strategies to increase the tax-to-GDP ratio need to consider how governments collect tax revenue to assess whether resources are being collected in a way that promotes equity. For this reason some experts have expressed skepticism about the broad 20% tax-to-GDP target, given that the manner in how it is collected may worsen existing levels of inequalities and poverty levels (Moore, 2015). One study, for instance, estimates that an increase of 1% in general sales tax as a share of GDP would result in an increase of income inequality of 0.5%; an increase of 1% in income tax as a share of GDP, on the other hand, results in a 0.1% decrease in income inequality (Martinez-Vanquez et al, 2012). In general, personal income tax is a preferable means to achieve redistribution given that it directly takes into account the ability of households or individuals to pay. By contrast, indirect taxes on goods and services tend to be regressive in nature; this is because the tax tends to be uniformly applied regardless of an individual’s income or wealth (Table 1) (IMF, 2014). Yet while personal income tax form a significant proportion of tax revenues in high-income countries (9-11% of GDP), in developing countries their share in tax revenue amounts to just 1-3% of GDP (Peter et al., 2010). Property tax – an annual tax on immoveable property such as land and buildings – is one of the mechanisms through which tax revenue can be collected in a progressive and equitable manner if administered correctly given that what is owed is directly reliant on wealth. It also has the potential to help sub-regions in federal systems which have weak capacity to collect tax do so more easily. For example, the rapid economic growth in sub-Saharan Africa since the beginning of the millennia has created super cities which have led to the proliferation of property of high value underlying the potential of revenue from property taxation (Goodfellow, 2015). The potential of collecting resources through property tax at municipal levels of government is an area which requires further exploration given the trend towards decentralizing decision-making on expenditure. Revenue from property tax can often be a significant share of total municipal tax collection. And yet in many developing countries it continues to be a hugely underutilized mechanism by which to collect revenue: while property tax accounted for 4% of GDP in developed countries, the equivalent in the developing world was 0.6% (Norregaard, 2013). Data from the IMF corroborates this finding: in low and lower middle-income countries just 1% of tax revenue is collected from property tax (IMF, 2015b). Table 1: Types of tax and their relative power at redistribution
Type of tax Description Progressive/ Regressive
Progressive tax A tax that collects a larger percentage from high-income earners than from low-income earners
Regressive tax A tax that takes a larger percentage from low-income earners than from high-income earners; this is generally where a tax is applied uniformly
Goods and services tax
A uniform tax applied on goods and services transactions. It can include value-added tax, general sales tax, excise duty, taxes on extraction, processing or production
Regressive
Income tax A tax applied on wages and salaries and on the profits of corporations. It is inclusive of both corporate and personal income tax.
Progressive
International trade and transaction tax
Taxes on imports and exports and global financial taxes
Progressive and regressive
Property tax Tax on property owned made up of taxes on immovable property
Progressive
Source: Adapted from Morrissey (2013).

9
Despite recognition that goods and services tax can be regressive, data from 50 low and lower middle-income countries shows that many of these countries collect a large share of total tax revenue through taxes on goods and services. Over half (26) collect two-fifths or more of their tax revenue through tax on goods and services. Twelve of these countries – the majority of which are situated in Central Asia or sub-Saharan Africa – collect over half of their tax revenue in this way (including Uganda, Lao PDR and the Kyrgyz Republic) (Figure 2).
In South Asia, where tax revenue as a share of GDP is low, there is a high dependence on tax collection through goods and services tax. Nepal, for instance, must be commended for the high share of the government budget which is spent on education; however, it also has one of the lowest tax-to-GDP rates in the world (11%) and around half of this is collected in the form of taxes on goods and services, while around one-fifth is collected through income tax.
Low rates of tax collection and how it is collected is similarly true of other South Asian economies. While the share of tax raised from goods and services is lower in India than many other countries (19%), high levels of tax exemption mean that just 2-3% of the population pay income tax (this compares to 1% in 1986) (Piketty and Qian, 2009). Similarly, the narrow tax base in Pakistan means that tax collection continues to remain one of the lowest in the world, at just 11% of GDP (IMF, 2015a). Fewer than 1 million of Pakistan’s 20 million eligible taxpayers pay any income tax (Bari et al., 2016).
In the short to medium term, governments are likely to continue to be reliant on sales and consumption taxes for their revenue given these are easier to collect, and tax reforms will take time. As such, it is necessary to consider how income inequality can be reduced under this approach. One approach would be to consider a differentiated commodity tax where a lower rate of tax is applied to goods that make up a relatively larger share of poorer households budgets. However, some critics argue of the danger of this approach as it increases inequalities given richer households will be likely to spend more on these goods and services in absolute terms and so accrue the benefits (Martinez-Vazquez et al., 2012). An alternative would be to implement a higher tax rate on luxury items largely consumed by richer households which would be more effective at targeting. Another option is to off-set the effect on inequality as a consequence of goods and services tax with spending that will benefit the poorest, including public expenditure on education (see Section 3). Beyond this tax diversification needs to be addressed through the issues of tax exemptions and evasion at both the domestic and international level that currently favor the rich, as the next Section discusses.

10
Figure 2: In more than half of low and lower middle-income countries, at least two-fifths of tax revenue is collected from more regressive taxation on goods and services Share of tax revenue from various tax sources, various years
Source: Authors’ calculations based on International Monetary Fund Revenue database.
188
14171717192023
25252627
303032
363839394040404142424344454546
48494949505050515252545556
5863
6666
69
0 10 20 30 40 50 60 70 80 90 100
KiribatiSyrian Arab Republic
Sao Tome and PrincipePapua New Guinea
LiberiaSierra Leone
SwazilandIndia
EthiopiaLesotho
Cote d'IvoireMadagascarAfghanistan
Central African RepublicPhilippines
NigerBhutan
D. R. CongoZimbabwe
GhanaRep. Congo
KenyaYemen
BangladeshEgypt
GambiaMalawiZambia
MaliVietnamPakistanRwanda
Cape VerdeNepal
IndonesiaBenin
SenegalMorocco
Kyrgyz RepublicTanzaniaUkraine
Burkina FasoTogo
UgandaGeorgia
ArmeniaLao PDR
MoldovaSri Lanka
Tajikistan
Tax type as a share of tax revenue (%)
Goods and services tax Income taxInternational Trade and Transactions Tax Property Tax and Other Sources of Tax Revenue
11
2.2 Many of the poorest countries fail to achieve their potential in tax collection due to tax exemptions or evasion by powerful interest groups In many countries where resource mobilization is low, regressive tax systems are associated with weak political institutions that provide opportunities for high levels of tax evasion by senior officials and powerful lobby groups and individuals in the domestic context.
Addressing domestic issues relating to low tax compliance must, therefore, firstly contend with the power of wealthy individuals and influential lobbies which avoid paying tax. While a great deal of attention in recent years has focused on the difficulties that governments face in taxing transnational corporations, more limited attention has focused on tax evasion by those who are classed as high net worth individuals. The potential resources that can be collected from the wealthiest individuals cannot be understated. In the African region, for instance, it was estimated that there were 165,000 high net worth individuals, the number of whom grew at twice the rate as the rest of the word in the past 15 years (McCluskey, 2016). And yet enforcing that these individuals pay tax has proven challenging. A recent Christian Aid study estimates that just 100 high net worth individuals out of a potential 40,000 are currently registered with the tax authority in Kenya: similarly, in South Africa it is estimated that between 28,000 and 114,000 high net worth individuals are not registered with the tax authority meaning that an estimated US$10.9 billion is foregone in tax revenue (Kumar, 2014). This is equivalent of between US$1.6 and 2.2 billion in public resources for education foregone assuming that the government spends between 15% and 20% of its budget on education.
Similarly, powerful lobby groups are able to avoid paying tax: in Pakistan, for instance, lobby groups seeking patronage amongst influential politicians are able to evade paying tax. The agricultural lobby is particularly strong. In 2014-15 agriculture made up 21% of national GDP (Government of Pakistan, 2015); yet its contribution towards total tax revenue amounted to just 1%. One study of Punjab province calculates that, had agricultural incomes been taxed at comparable rates to non-agricultural incomes, this would have raised around $500 million in 2014 (Mukhtar and Nasim, 2016). Pakistan presents a powerful – but not unusual – example of where special interest groups have eroded the potential for a more diversified tax base; in the Philippines, for instance the power of various lobbies have significantly watered down reforms intended to increase taxation on tobacco, alcohol and petroleum (DiJohn, 2010).
Beyond rich individuals and domestic lobbies, the problem of tax evasion is similarly endemic within the political class; in Pakistan, for instance, it is estimated that over 60% of the cabinet and two-thirds of federal lawmakers paid no tax in 2011 (Ali, 2015).
A separate but equally pressing issue within many countries relates to public assets collected through tax or other sources of revenue which are then stolen by public officials and transferred abroad. The sums involved often eclipse that spent by the government on education and particularly harm the poorest given they do not get back their contribution in tax collection in the form of investment in public services which would benefit them. The value of assets stolen by developing country government officials has been estimated at between US$20 and 40 billion each year (Gray et al., 2014). Had 20% of these funds been spent on education it would raise between US$4 and 8 billion of additional funds for the sector – enough to fill around 10-20% of the current US$39 billion funding gap identified to achieve the SDG education goals for pre-primary, primary and secondary education (UNESCO, 2015a).

12
The Stolen Asset Recovery (StAR) initiative – a partnership between the World Bank Group and the United Nations Office on Drugs and Crime (UNODC) – supports international efforts to prevent laundering proceeds of corruption and facilitate a timely return of stolen assets. Yet, to date the repatriation of funds as a share of what has been stolen has been minimal. In the past 15 years, it is estimated that just US$5 billion of funds have been repatriated; in addition, the accountability over these repatriated funds remains weak. Between 2004 and 2006, for instance, the Swiss Government seized US$506 million stolen by the former president of Nigeria Sani Abacha and sent this money back after a common agreement between the governments of Switzerland and Nigeria and the World Bank that these funds would be used for investment in Millennium Development Goal (MDG) projects relating to health, education, water, electricity and roads. Although positive, the funds made up a fraction of what were stolen, and there was little transparency in tracking what repatriated funds were spent on (World Bank, 2006).
Domestic issues relating to tax avoidance and evasion (whether through legal or illegal means), including related to resources leaving countries, need urgent action. Currently, they result in an over-reliance on a very narrow tax base to which the poor are contributing more than their fair share, and are also depriving the education sector of much-needed resources.
Beyond addressing domestic issues such as these, the domestic resource base can be significantly enhanced if action is taken towards multinationals operating in developing countries who are finding ways to avoid paying tax in the host country (Archer et al., 2016). This requires limiting tax exemptions granted to multinational companies. Kenya, Uganda, Tanzania and Rwanda, for instance, are estimated to be losing US$2.8 billion a year from tax incentives offered to multinational corporations to attract foreign direct investment (Tax Justice Network and ActionAid, 2012). This is in spite of tax incentives generally not being important in multinational corporations’ decision-making; of 12 criteria, tax incentives offered ranks 11th in influencing where corporations choose to invest (IMF, 2015a).
There is a further need to address illegal tax evasion of corporations. The latest Global Financial Integrity Report identified that in 2013 alone, US$1.1 trillion flowed out of developing countries due to illicit practices of multi-national corporations; the highest reported over the decade (Kar and Spanjers, 2015). The majority of this is accounted for by trade mis-invoicing which, simply put, is when a multi-national corporation deliberately misreports the value of a commercial transaction it has undertaken to custom officials to avoid paying tax. For low-income and lower middle-income countries alone illicit flows were the equivalent of US$247 billion. For these countries illicit flows as a share of national wealth can be huge and – in the case of some countries – eclipse what is currently being spent on education. In 37 low and lower middle-income countries, illicit flows as a share of GDP was in fact larger than what governments spent on education. In 17 of these countries public spending on education was below the Incheon Declaration target of 4-6% of GDP adopted at the 2015 World Education Forum. If 20% of the value of illicit flows were directed to education, then all but five (Bangladesh, Georgia, Guatemala, Sri Lanka and Zambia) of these 17 countries would be spending at least 4% of GDP on education (Figure 3).

13
Figure 3: Volume of illicit flows in 37 low and lower middle-income countries surpassed what governments spent on education Illicit financial flows and education spending as a share of GDP (%), 2013
Source: Authors’ calculations based on Kar and Spanjers (2015), UNESCO Institue for Statistics and World Economic Outlook Notes: Where spending on education was not available for the year 2013, data from the closest year was used. (a) =2008, (b) = 2009, (c) = 2010, (d) = 2011, (e) = 2012 and (f) = 2014. To ensure education and other public services receive the necessary funds, transparent and timely information on the nature and scale of tax avoidance and evasion at the domestic and global level must be strengthened over the course of the next 15 years. This must be accompanied by strategies to tackle tax avoidance and evasion. Local and international civil society organizations will continue to play a crucial role in monitoring developments in this regard. In addition, international agencies should play a greater role in supporting the capacity of tax authorities in addressing tax avoidance and evasion.
2.3 Some countries have been successful their tax reform efforts Examples of good practice can provide useful lessons for raising tax in ways that promotes redistribution. Some countries have expanded the tax base, and so reduced reliance on indirect taxation as the main source of revenue. In Chile, for instance, after a democratic government was established in 1990, Congress passed a law that required businesses and high-income earners to pay two-thirds of the new tax burden (Arnson and Bergman, 2012). Income tax as a share of total tax revenue increased from 25% in 1990 to 39% in 2013 (IMF, 2015b). In addition, Chile has not become dependent on resources raised from the revenue it earns from its earnings on copper – a prevalent challenge in many developing countries with large natural resources (Arnson and Bergman, 2012). Tax policy in Ecuador has undergone significant reform since 2007 to try and ensure a more progressive and fairer system to collect revenue. In 2008, when Ecuador adopted a new constitution, there was an emphasis on equity and redistribution; Article 300 of the constitution stated that the tax system shall be “governed by principles of….progressivity,
4 4 6 4 3 35 5
38
10
4 5 35
1
83 3
6 6 52
73 2 4 4 5 6 5 4 2 3 3 4 2
9 7 6 6
6 5 5 4
3
3 3
3 3 3
3
3
3
2 2 2 2 2
2
2
2 1
1 1 1 1 1 1 1 1 1 1
1
45
34
30 28 28
26 25
19 17
15 15 15 15 14 14 13 13 12 11 10 10 9 8 8 8 7 7 7 7 7 6 6 6 5 5 4
3
0
5
10
15
20
25
30
35
40
45
Nic
arag
ua (c
)To
goHo
ndur
asDj
ibou
ti (c
)Li
beria
(e)
Cam
bodi
a (c
)Va
nuat
u (b
)Sa
moa
(a)
Arm
enia
Mal
awi
Solo
mon
Isla
nds…
Lao
PDR
(f)Co
mor
os (e
)Ga
mbi
aRw
anda
Zam
bia
(a)
Mol
dova
(f)
Chad
Guya
na (e
)Vi
etna
m (e
)S.
T. a
nd P
rinci
peBu
rund
iSi
erra
Leon
eU
krai
neEl
Sal
vado
r (d)
Geor
gia
(e)
Guin
eaEt
hiop
iaBu
rkin
a Fa
soSe
nega
l (c)
Cote
d'Iv
oire
(f)
Mal
iBa
ngla
desh
Mau
ritan
iaGu
atem
ala
Indi
a (e
)Sr
i Lan
ka (e
)
Shar
e of
GDP
(%)
Additional resources if 20% of illicit flows redirected to educationPublic spending on educationTotal illicit flows

14
efficiency, equity, transparency and revenue collection adequacy. Priority shall be given to direct and progressive taxes” (Republic of Ecuador, 2008). As far as expenditure is concerned Article 18 of the 2008 Constitution states that the state would “progressively allocate public resources from the General Budget of the State for initial basic education and secondary education leading to a high school diploma, with annual increments of at least 0.5% of GDP until the share amounts 6% of GDP” (Republic of Ecuador, 2008). Mozambique is held up as a successful example of a country that has managed to increase its tax revenue as a share of GDP in a relatively short space of time. This is largely attributed to the introduction of a simplified tax system for small enterprises in 2006. Following this, 40,000 additional taxpayers were registered in one year (OECD, 2013). As a result, tax revenue as a share of GDP increased from 14% in 2009 to 23% in 2013 - well above the sub-Saharan regional average (IMF, 2015b). In Sierra Leone the Local Government Act of 2004 was accompanied by extensive capacity building support by donors. Following this, there has been a degree of success through which property tax has increased in some municipalities. A study of four local city councils found that this success hinged on a number of factors. Firstly where there were not close ties between economic and political elites, municipalities were found to be more effective in collecting property tax. Secondly it appeared that where local councils were aligned with the national political opposition, there was more incentive to strengthen the local tax base as the expectation was that national government would not provide financial support (Jibao and Prichard, 2013). Lastly, in Uganda there is evidence of widespread tax avoidance and evasion by high net worth individuals. Following exposure of this, in September 2015, the Uganda Revenue Authority established a special unit seeking to identify and monitor high net worth individuals. As of February 2016 the Revenue Authority had raised approximately US$3.3 million in additional revenue (ICTD, 2016).
2.4 Donor investment can help improve the mobilization of additional tax revenue, but needs to do more The role of official development assistance in helping countries with low capacity to mobilize domestic resources has been an area which has elicited renewed interest amongst some international donors. This has been driven, in part, by the convincing case of returns that such investment can bring; one estimate calculates that for every US$1 of ODA invested in resource mobilization projects, an additional US$350 is mobilized in domestic resources (UNESCO, 2014). In some cases the returns are much higher. In Kenya, for instance, a tax support programme costing US$20,000 led to an increase of US$33 million translating into a return of US$1,650 in revenue for every US$1 spent (OECD, 2014). In Colombia, a US$15,000 aid project supporting the tax authority in issues relating to transfer pricing, increased tax revenue from US$3.3 million in 2011 to US$10 million in 2013 (OECD, n.d.). In spite of the returns, however, current donor investment in helping recipient partners increase their capacity to collect tax revenue currently makes up a very small share of ODA. The latest OECD estimates indicate that of total ODA commitments, just 0.07% is for tax-related activities (OECD, 2014). A more recent study similarly estimates that in 2013 US$93 million (or 0.05%) of aid was disbursed for 232 aid projects where domestic resource

15
mobilization was the core objective. The largest donors disbursing this aid were the United Kingdom, Norway and the EU (Development Initiatives, 2016a).2 At the Third International Financing Conference held in Addis Ababa in July 2015, a key initiative was to increase cooperation in aid for domestic revenue, together with effective cooperation and monitoring systems. This supports SDG17.1 which aims to ‘strengthen domestic resource mobilization, including through international support to developing countries’ (UN, 2015). Seventeen donors pledged to double technical cooperation for domestic revenue mobilization by 2020. As technical cooperation accounted for almost half of core aid for domestic resource mobilization in 2013 (approximately US$40 million), this means that the target is US$80 million by 2020 (Development Initiatives, 2016a). However, it is worth illustrating the small amount of ODA that technical cooperation for domestic revenue mobilization makes up: in 2013 it made up just 0.04% of the total ODA levels disbursed by the 17 donors who are signatory to the agreement.3 Of the aid disbursed, a large share is well aligned to those recipient countries where current mobilization of domestic resources is low, and which collect under US$500 in government revenue per person per year.4 However, aid volumes according to size have largely been concentrated amongst three recipients (Afghanistan, Mozambique and Tanzania) and this reflects a long-term trend as far as disbursements go. Regionally of the US$93 million aid resources disbursed in 2013 for core tax-related activities, sub-Saharan Africa received around 36%; this was followed by South and Central Asia which received 22% (Development Initiatives, 2016a). However, while aid intended for revenue mobilization has been well aligned to recipient countries and regions with low capacity to mobilize domestic resources, not all countries with low capacity have been reached adequately through international support: this is something that must be more closely monitored going forward. Little reporting on the aid meant to support developing countries mobilize domestic resources indicates whether donors are supporting developing countries raise this progressively. Current descriptions of aid projects give some information on whether support is targeted to strengthen tax authority capabilities in reducing tax evasion or increase tax revenue. However, beyond this there is limited focus on whether aid projects support ways in which tax can be collected progressively: going forward donors and partner countries must better report whether aid projects are intended to improve the capacity of tax authorities to collect taxes that are deemed progressive and redistributive. The way that aid support is channeled also deserves attention: in Kenya and Uganda aid has largely been to help support systems and processes, to invest in infrastructural development required to collect tax efficiently and to strengthen the capacity of tax staff. In the case of Uganda, the majority of ODA was to provide training capacity in helping to effectively tax revenue from oil resources: in the case of Kenya, ODA was primarily disbursed to the Tax Justice Network which advocates for democratic and progressive taxation systems (Development Initiatives, 2016b). Recipients of aid which supports their tax collection efforts have seen vastly different results. Mozambique, a major recipient of core aid for tax-related activities, has frequently been held up as a success story with respect to increasing its tax-to-
2 An additional US$601 million was disbursed in 2013 on aid projects for which revenue mobilization was amongst one of many objectives (Development Initiatives, 2016a). Under the current DAC-CRS Reporting system, it is not possible to isolate resources between the various objectives contained under the same project. 3 As a share of total ODA from all donors, it made up the equivalent of 0.02% of the total. 4 The Zero draft for the Third International Financing Conference had proposed that countries needed to spend a minimum of $300 per person to ensure a minimum adequate package of public services.

16
GDP rate. In contrast in Pakistan, which up until 2012 was another major recipient for these purposes, international assistance has done little to change the situation largely attributed to poor political will (Box 1). Box 1: Successes and failures in international support to strengthen domestic resource mobilization: lessons from Mozambique and Pakistan Longstanding donor support in Mozambique has helped the Mozambique Revenue Authority – created in 2006 – to increase tax revenue as a share of GDP from 11% in 2005 to 23% in 2013 (IMF, 2015b). A big reason for Mozambique’s success has been due to the creation of a simplified tax regime which has been created for micro and small enterprises. Tax revenue has become more diversified. In 1999, corporate income tax as a share of GDP was just 0.7% versus that of taxes on goods and services for which the equivalent was 6.6% (AFRODAD, 2011). By 2012, corporate tax as a share of GDP had risen to 5.8% of GDP; the equivalent for taxes on goods and services was 7.5% (IMF, 2015b). Mozambique also offers insight into how donor support has been channeled to help different recipient governments expand their narrow tax base. Support to the Mozambique Revenue Authority, for instance, this has been through the use of a multi-donor trust fund which disburses approximately US$6 million per year in ODA resources. This model, which currently has five donors, pools funding to help strengthen the mobilization of domestic resources and so is preferential over fragmented bilateral donor efforts in supporting tax systems. The modality for how donors work means that there is a single process for dialogue, monitoring and quality control. A high degree of alignment has been achieved with Mozambique’s own in-country systems and prioritization and in addition has helped improve the capacity of the Mozambique Revenue Authority (OECD, 2013). Pakistan, up until 2012, was one of the largest recipients of core aid to help support improved domestic resource mobilization, primarily due to the World Bank-led Tax Administration Reform Project. One of the objectives of the project was to improve the integrity and fairness of tax administration through increasing the number of eligible tax-payers to pay income tax. Over the course of the project, however, Pakistan’s tax-to-GDP ratio actually stagnated and evaluation of the project by the World Bank scored it as “moderately unsatisfactory.” An evaluation found that, in an environment where there is little domestic political support for tax reforms, external support is unlikely to reach its stated objectives. It states that to “increase likelihood of tax reform success, a thorough and systematic political economy analysis should not only be seen as a desirable feature, but rather as a key component of project design and implementation” (World Bank, 2012).

17
3. Government expenditure on education
Key messages for Section 3 1. Almost 40% of 53 low and lower middle-income countries with data allocated less than
15% of government spending to education. 2. In some countries, significant resources are allocated to tertiary education, to which
very few of the poorest gain access. Of 21 low-income countries with data, two allocated more to tertiary education than primary education; and eight allocated more to tertiary than secondary education.
3. Investing early has the potential for reaping dividends throughout the education cycle. However, investment in pre-primary education is extremely low with only three of the 21 low-income countries allocating 2% or more of education budgets to pre-primary education.
4. A benefit incidence analysis of 31 low -income countries found that for one-third of the countries surveyed, spending on primary education was largely pro-poor. For secondary and tertiary education, however, public expenditure benefits the richest in all countries, often significantly so.
5. An incremental, progressive approach for achieving universal fee-free access beyond primary must be considered, taking into account countries different starting points.
3.1 Education budgets have great potential to redistribute wealth as they make up a large share of government budgets in developing countries Many countries spend a relatively large share of their government budget on education (see Figure 1). As such, in many low and lower middle-income countries, education budgets have the potential to contribute significantly to the redistribution of income to the poorest households. In many low and lower middle-income countries today, however, the low rates of completion and learning at primary level by children from poor households and other disadvantaged groups affects transition to higher levels of education (REAL Centre, 2016). The distribution of education spending therefore needs to take into account who is getting access to what level and type of education, and ability to pay of those accessing higher levels of education. As the SDGs have a broad coverage across levels of education at the same time as highlighting equity, there is a need to consider how resources should be prioritized. Given the various stages that countries have reached in access and learning at different levels of education, an incremental approach for achieving universal fee-free access beyond primary should be considered as one mechanism to take into account countries different starting points (Rose, 2015). Currently, however, one of the main obstacles to more equitable public education spending in many low and lower middle-income countries is that a significant share of education budgets is allocated to higher levels of education which are disproportionately accessed by high-income groups (Figure 4). Of 21 low-income countries, 11 spend 50% or more of their budgets on primary education. However, 2 countries – Ethiopia and Eritrea – spend more of the education budget on tertiary education compared to primary. Similarly, in eight low-income countries a greater share of the education budget was allocated to tertiary education compared to secondary education. Even of those spending a smaller share on tertiary education, this often still far outweighs the numbers reaching this level, particularly from disadvantaged households. Pre-primary education receives a very small share; just one low-income country – Niger – allocated more than 5% of its budget to this level.

18
Figure 4: The share of education spending amongst low-income countries illustrates very different prioritization of different levels Share of education spending to various levels of education, latest year
Source: Authors’ calculations based on UNESCO Institute for Statistics database.
3.2 Current spending on pre-primary education makes up a very small share of total education funding in the poorest countries SDG Target 4.2 proposes to ensure that “all girls and boys have access to quality early childhood development, care and pre-primary education so that they are ready for primary education” (UNESCO et al., 2015). In 2014, however, just under half of pre-primary aged children globally had no access to pre-primary education. This is markedly worse in some parts of the world; in sub-Saharan Africa just 18% of 3-6 year olds accessed pre-primary education in 2013, similar to the average of all low-income countries (UIS, 2016). Many governments, particularly those in poorer countries, are failing to invest adequately in pre-primary within their education budgets. Investment in many low-income countries on pre-primary education is just 0.1-0.2% of GDP (World Bank, 2015a). Large intra-country inequalities exist in terms of access to pre-primary education differing markedly depending on poverty, region and rural residence. In Nigeria many children attending primary education do not have access to pre-primary schooling, but access is markedly worse for those coming from poorer households or disadvantaged regions. In 2011 just 16% of the children coming from the poorest quintile in Grade 1 had attended pre-school in the previous year, compared to 62% from the richest quintile. Similarly just 6% of children living in the poor North-East region of the country attended Grade 1 of primary school, the equivalent for the more prosperous South-South region was 80% (UNICEF, 2011). In Malawi, in 2014 just 12% of children coming from the poorest quintile in Grade 1 had attended pre-school in the previous year versus 35% from the richest quintile (UNICEF, 2015a). Of total expenditure on education, the Government of Malawi disbursed just 0.03%
44 4135 34 31
25 22 22 22 21 20 20 18 18 18 16 16 15 12 11 10
28 2940
4240
47
62 60 5950 53
38
52
4455 47
34
53 56 51 61
0
10
20
30
40
50
60
70
80
90
100
Ethi
opia
Eritr
ea
Guin
ea
Tanz
ania
Mal
awi
Buru
ndi
D. R
. Con
go
Burk
ina
Faso
Togo
Beni
n
C. A
. R
Mal
i
Nig
er
Chad
Mad
agas
car
Cam
bodi
a
Rwan
da
Moz
ambi
que
Uga
nda
Nep
al
Com
orosSh
are
of e
duca
tion
budg
et sp
ent o
n di
ffere
nt le
vels
(5)
Tertiary Non-Tertiary Post Secondary Secondary Primary Pre-primary

19
of the total to pre-primary education in 2013, while spending on tertiary education, which is almost entirely accessed by the richest half of the population, was equivalent of 28% (Ilie and Rose, 2016a; UNESCO-UIS, 2016). While many countries have failed to roll out pre-primary education to all children, some have made remarkable progress in a short period of time by prioritizing spending on pre-primary education services. Ghana, which in 2013 spent 7% of its education budget on pre-primary education, had increased net enrolment at pre-primary level from 28% in 2000 to near universal enrolment by 2015 (UNESCO-UIS, 2016). Similarly, Peru which spends 17% of the education budget on pre-primary education, has seen net enrolment rates at pre-primary level increase from 58% in 2000 to 85% in 2014 (UNESCO-UIS, 2016). The Cuna Mas programme seeks to improve access to pre-primary education for children under the age of 3 living in the poorest areas of the country with a target of reaching 123,000 children in 2015.
3.3 The investment case for prioritizing domestic resources for primary education remains strong for low-income countries Of 173 countries surveyed world-wide, 135 have enshrined in law that public primary schooling is fee-free (although as Section 7 will illustrate this has not always been institutionalized in practice) (Transparency International, 2013). The provision of fee-free public primary schooling globally over the last two decades has meant that many countries have seen marked improvements in access to education. The primary education net enrolment ratio in sub-Saharan Africa rose from 60% to 79% between 2000 and 2014; similarly for low-income countries the proportion rose from 55% to 81% over the same period (UNESCO-UIS, 2016). Despite the chances of attending school vastly improving over the last 15 years, in many low-income countries, enrolment remains extremely low for some population groups. One study of 35 low and lower middle-income countries in South Asia and sub-Saharan Africa illustrates that for eight West African countries5 primary participation is below 80% even amongst the richest 50%. All eight of these countries are also amongst a group of 15 countries, which exhibit at least a 20% gap in participation at primary level between the richest 50% of children versus the poorest 50%. Guinea, which is one of these countries, allocates 40% of its budget to primary education versus 35% for tertiary, suggesting that the vast majority of the rich who make it to higher education benefit from a large share of public resources. Participation rates for children from the poorest households are in some cases quite shocking low; in Burkina Faso, Mali and Niger just one-fifth of the poorest 50% participate in primary education (Ilie and Rose, 2016a) (Figure 5). These countries, along with other low and lower middle-income countries, also have a long way to go for children not only to be in school but also to be learning (REAL Centre, 2016). This presents a strong case for the government to continue prioritizing primary education, while also ensure a balanced approach to supporting other levels of education.
5 Benin, Burkina Faso, Cote d’Ivoire, Gambia, Guinea, Mali, Niger and Senegal.

20
Figure 5: Primary participation is below 80% for the richest in 8 out of 15 countries where the widest disparities between the poorest and richest exists Net primary participation rate between the poorest and richest 50%
Source: Ilie and Rose (2016a). Notes: Countries have been ordered according to the largest gap in participation rates between the riches 50% and the poorest 50%. (*) denotes where primary participation rates for the richest 50% is less than 80%.
3.4 Prioritizing primary education spending at early grades Beyond just considering allocation across sub-sectors of education, more must be done to prioritize the deployment of teachers, reading materials and other resources to early grades within the primary sub-sector. The investment case for this is that early grades are where children from the disadvantaged groups are most likely to access and where learning disadvantages already emerge, and need to be tackled before they become entrenched (REAL Centre, 2016; Rose and Alcott, 2015). And yet, too often investment in upper primary grades is many times higher than that in the early grades; the consequence of which is over-crowded classrooms at lower grades with inadequate qualified teachers and teaching and learning materials. Of the 30 countries with data, a comparison of the average number of pupils per classroom/ teacher in Grade 1 and Grade 6 indicates that in just five countries (Namibia, Comoros, Seychelles, Mauritius and Sao Tome & Principe) was there at least parity of resources, or otherwise more allocated to Grade 1. However, in countries with some of the worst primary education indicators globally, resources are clearly skewed towards higher grades: in Malawi and D. R. Congo, the number of pupils per classroom/ teacher in Grade 1 is over 100 and almost double what the pupil per classroom/ teacher is in Grade 6. The unequal distribution of teachers by grade is often further compounded by the differences in experience and qualifications of teacher at the lower grades of the primary schooling system compared to the higher grades. Despite convincing arguments for deploying the best teachers to earlier grades, it is often the case that in low-income countries teachers deployed to lower grades have little or no training in teaching literacy (UNESCO, 2014). Teacher salaries, which in the case of low-income African countries make up the overwhelming majority of education budgets, would therefore be skewed in favor of higher grades where more highly-qualified, and so highly-paid teachers, are allocated. Taking the assumption that unqualified teachers are largely deployed to lower grades versus
94
76
56
75
58
89
46
81
93
62
82
95 96
69
79
51
34
18
38
22
55
18
55
68
38
58
72 75
49
59
0
10
20
30
40
50
60
70
80
90
100
Net
par
ticip
atio
n ra
te (%
)
Richest 50%Poorest 50%

21
qualified primary teachers being deployed to higher grades, together with the larger numbers of pupils per teacher at lower grades, the difference in the amount spent per child in Grade 1 versus Grade 6 can be acute. In Benin, for instance, spending on a Grade 6 student would be almost five times what is spent per student in Grade 1 (Figure 6). It remains important to have information that enables tracking spending across grades more accurately to ensure that such spending is equitable. Figure 6: Spending on pupils markedly less at lower grades than for higher grades Primary spending teacher salary per pupil, Grades 1 and 6
Source: Authors’ calculations based on UNESCO Institute for Statistics, Pole de Dakar and World Bank database.
3.5 Countries must heed the lessons from primary schooling when planning the roll out of fee free secondary education With an increase in numbers of children progressing through primary schooling over the last 15 years, questions are increasingly being raised on what this means for financing the provision of fee-free secondary education. The Incheon Declaration adopted at the 2015 World Education Forum pledged to ensure access to “quality education for all children and youth to at least 12 years of publicly-funded primary and secondary schooling, of which at least 9 years should be compulsory and free” (UNESCO et al., 2015). This extends the EFA promise at Dakar of fee-free primary schooling to at least lower secondary schooling, and the 1966 Covenant on Economic, Social and Cultural Rights which committed to progressive implementation of fee-free secondary schooling. A question arises about the timescale in which the extended commitment of fee-free education can be achieved in the light of continued low access and learning in primary school, and so a bias in who gets access to secondary school in some countries. An increasing number of low and middle-income countries have already made lower secondary free and compulsory over the last decade; as of 2015, 94 out of 107 low and middle-income countries had legislation in place making lower secondary free (UNESCO, 2015b). Yet, in many of these countries, the majority of children from poor households are not completing primary school so have no chance from benefiting from this public subsidy to secondary school.
51 56 38
24
51 57 68
35 53
28 24 39
8 24 12
243 243 220
181
131 131 131
90 98
62 57 59
26 41
29
0
50
100
150
200
250
US
$ (p
er c
hild
)
Spending per pupil, Grade 1 (average teacher salary)Spending per pupil, Grade 6 (average teacher salary)Spending per pupil, Grade 1 (unqualified teacher salary)Spending per pupil, Grade 1 (qualified teacher salary)

22
Additionally, the sustainability of financing fee-free secondary education must also be considered in low-income country contexts. Excluding tertiary education, rolling out fee-free funding for pre-school, primary and secondary education is estimated to be 6.6% of GDP in low-income countries; this moreover masks differences between countries – for those with low levels of access and rapid population growth the needs are as high as 15-20% of GDP (UNESCO, 2015a). Given this is more than the total amount collected in taxes in some of these countries, it would clearly not be feasible. The experience of countries rolling out fee free secondary education in contexts where large parts of the population are not getting access to a complete cycle of good quality primary schooling should also be considered. In Kenya, for instance the government introduced “fee-free” secondary education for all in 2008; however, the government has not been able to implement this effectively in practice due to insufficient public resources being mobilized. Schools continue to levy charges for many inputs including school uniforms, books and teaching and learning materials. One study found that day secondary school costs in the first year were eight times the monthly income of employed parents – far beyond what families can afford (Ohba, 2009). Lessons from the roll out of fee-free primary education are useful when considering the financial ramifications of introducing fee-free secondary education. In Malawi, where fee-free primary education for all was introduced in 1994, the surge in enrolment overnight meant a severe deterioration in learning environments, leaving a lasting legacy of high repetition and drop-out rates, accompanied by continued poor quality (Kadzamira and Rose, 2003). Other countries took a gradual approach in rolling out fee-free primary education. For example, Ghana initially targeted the poorest 40 districts before rolling out fee-free primary education nation-wide (World Bank, 2009). Experience suggests that for low-income countries which continue to have low enrolment primary level and poor learning outcomes for the poor, a progressive approach needs to be adopted whereby fee-free access to secondary is initially extended to the most marginalized groups, before being rolled out gradually to the broader population until it is finally sustainable to roll out fee-free secondary education for all (R4D, 2015).
3.6 Tertiary education subsumes a large share of public spending on education in many poor counties relative to the share of the youth who gain access The SDG agenda for education pledges that by 2030 equal access is to be assured “for all women and men to affordable quality technical, vocational education, including university” (UN, 2015). A strong case has been made for a greater focus on higher education given its role in helping to achieve other post-2015 global goals, most notably economic development and poverty eradication (Ilie and Rose, 2016a). Moreover, the “critical mass” of tertiary educated citizens necessary to effectively deliver quality basic and secondary education and other public services cannot be understated. However, many education systems in low and lower middle-income countries currently experience extremely low access to higher education for young people, especially from disadvantaged backgrounds. One study finds that for 35 countries in South Asia and sub-Saharan Africa, access to higher education is below 10% for 31 countries and below 5% in 20 of these 31 countries (Ilie and Rose, 2016a). The picture is even starker for the poor; in only
23
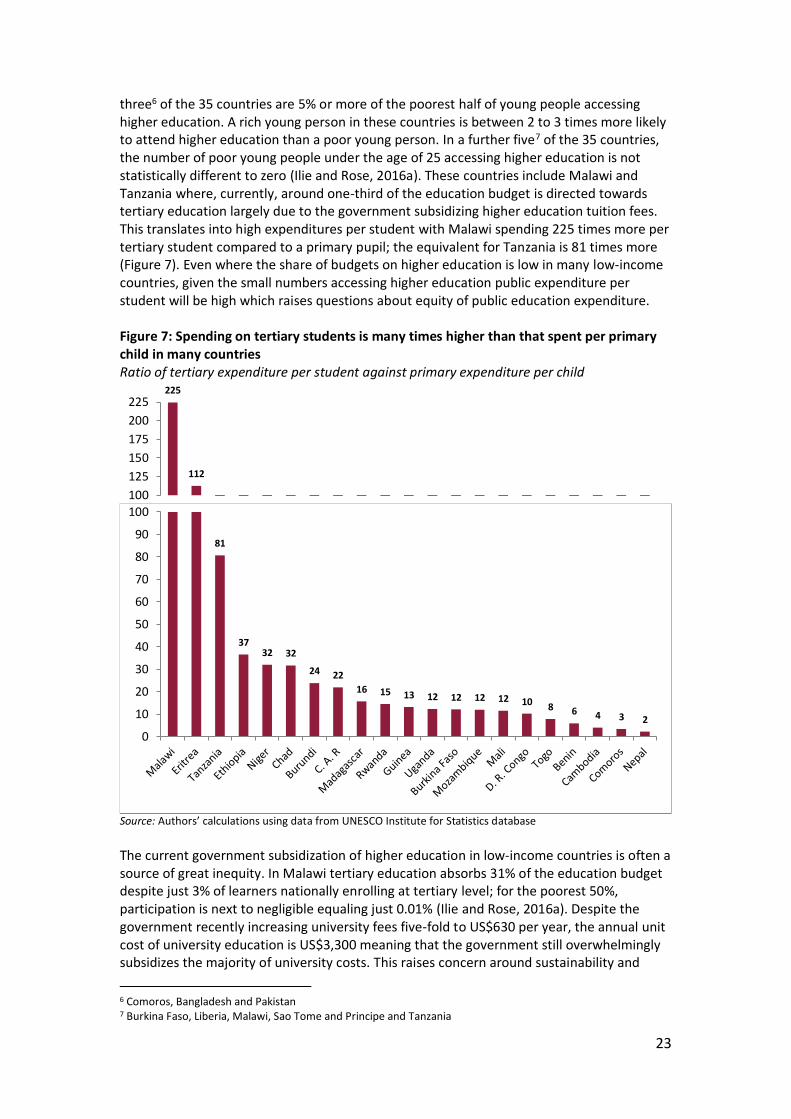
three6 of the 35 countries are 5% or more of the poorest half of young people accessing higher education. A rich young person in these countries is between 2 to 3 times more likely to attend higher education than a poor young person. In a further five7 of the 35 countries, the number of poor young people under the age of 25 accessing higher education is not statistically different to zero (Ilie and Rose, 2016a). These countries include Malawi and Tanzania where, currently, around one-third of the education budget is directed towards tertiary education largely due to the government subsidizing higher education tuition fees. This translates into high expenditures per student with Malawi spending 225 times more per tertiary student compared to a primary pupil; the equivalent for Tanzania is 81 times more (Figure 7). Even where the share of budgets on higher education is low in many low-income countries, given the small numbers accessing higher education public expenditure per student will be high which raises questions about equity of public education expenditure. Figure 7: Spending on tertiary students is many times higher than that spent per primary child in many countries Ratio of tertiary expenditure per student against primary expenditure per child
Source: Authors’ calculations using data from UNESCO Institute for Statistics database The current government subsidization of higher education in low-income countries is often a source of great inequity. In Malawi tertiary education absorbs 31% of the education budget despite just 3% of learners nationally enrolling at tertiary level; for the poorest 50%, participation is next to negligible equaling just 0.01% (Ilie and Rose, 2016a). Despite the government recently increasing university fees five-fold to US$630 per year, the annual unit cost of university education is US$3,300 meaning that the government still overwhelmingly subsidizes the majority of university costs. This raises concern around sustainability and 6 Comoros, Bangladesh and Pakistan 7 Burkina Faso, Liberia, Malawi, Sao Tome and Principe and Tanzania
225
112
100125150175200225
81
3732 32
24 2216 15 13 12 12 12 12 10 8 6 4 3 2
0
10
20
30
40
50
60
70
80
90
100

24
equity, particularly because beyond government subsidization the student loan system in many sub-Saharan Africa countries does not predicate loan allocation on the financial background of student raising concern about the sustainability of such systems. The government of Malawi, like many low-income countries, has been ineffective in recovering money lent to students for fees through its loan recovery system (Hall and Mambo, 2015). One recent estimate is that ex-students owed the government US$2.5 million in unpaid loans taken out between 1985 and 2012 (Muheya, 2016). Given the skewed distribution of access to higher education, approaches to cost-sharing at this level need to be considered to ensure equity is achieved. To ensure more effective support through a loan delivery and recovery system, there are a number of areas which need addressing. The first is to ensure that targeted and differentiated support by government is given to those students from low socioeconomic backgrounds. In Tanzania, a start has been made to improve data collection methods to ensure that there is more transparency of the applicant’s socioeconomic status (World Bank, 2010). Secondly, the provision and administration of loans should be overseen through an autonomous or specialized body so as to ensure more effective recovery. In Rwanda, Tanzania and Ghana, a specialized government agency has been formed to administer student loans and build formal relationships with other stakeholders. Thirdly is improving the legal systems in place for loan recovery which are currently costly and, in terms of enforcement, have no legal authority to do recover loans (World Bank, 2010). The benefits that graduates accrue in terms of higher wages and other benefits upon completion of study can be tapped into. In the health sector, for instance, one of the recommendations relating to raising resources was a tax on tobacco and other substances harmful to a nation’s population health (Lancet, 2014). For education the equivalent could be the application of the graduate tax where students pay nothing upfront to attend a tertiary institute but upon graduation pay the costs out of their salary for the course of their life-time.8 Currently no low-income country has a graduate tax in place: in Ethiopia a graduate-like tax was introduced in 2003/04 with payment being collected as a percentage of salary over a period of 15 years (Wanna and Chalchisa, 2012). Given its time-bound nature, it is not a graduate tax in the true sense. The advantage of a graduate tax is the potential it has to be more equitable in allowing students from poor backgrounds to reach higher education without placing financial barriers to their access. It could also mean greater revenue diversification if implemented together with policies encouraging a more effective approach to cost-sharing for higher education (Woodhall, 2007).
3.7 Public expenditure on education is more regressive in low-income countries The above discussion highlights potential inequities that can arise from the distribution of public spending, depending on the share of enrolment across levels of education. One of the most striking findings pertaining to public expenditure on education is the strong inverse correlation between the income of a country and the regressive nature of education spending. In low-income countries the 10% most educated students’ access 46% of public education resources. The equivalent for lower middle-income countries is 26% and in upper middle-income and high-income countries it is 13% (UNICEF, 2015b).
8 The difference between a graduate tax and an income contingent system is that in the case of the latter, loan repayments will only be collected from the graduate until the total amount borrowed has been paid back, A graduate tax, on the other hand, is a life-long obligation (Woodhall, 2007).

25
Benefit incidence analysis allows us to assess further which income groups benefit the most from public spending on education. Whilst largely focusing on income groups, benefit incidence analysis can also be used to assess by location of user (rural versus urban or by sub-region), by gender or by different ethnic background, for example; in this way it proves useful in measuring whether different sources of deprivation receive their fair share of government resources. The analysis should be more systematically institutionalized at a country level, with international agencies supporting data collection in ways that can inform the distribution of education spending. Despite the power of expenditure on education being a potential source of redistribution, if it is not allocated appropriately then it can have adverse effects on equity. A recent benefit incidence analysis of public expenditure in education for 31 low and lower middle-income countries in sub-Saharan Africa and South Asia illustrates not only the variation in the level of inequality of public spending between many developing countries, but also the breadth of inequity. While public education expenditure disproportionately benefits the richest groups in all 31 countries, the levels of inequity vary substantially. In the case of Nepal, Comoros, Bangladesh and Namibia, for instance, for every $100 spent on the richest 10%, at least $50 is spent on the poorest decile. At the other extreme are Malawi, Guinea, Republic of Congo and Liberia, where the poorest decile benefit from less than $10 of every $100 spent on the richest decile (Ilie and Rose, 2016b). Disaggregating the benefits of public spending according to different levels of education (primary, secondary, tertiary), the study finds that for one-third9 of the 31 countries, primary education expenditure is largely pro-poor with the poorest decile benefitting from larger shares of public resources than the richest deciles. For secondary education, expenditure is pro-rich for all countries although there is great variation between countries; in Nepal public secondary spending for the richest decile is just 1.3 times more than the poorest decile while in Ethiopia it is 72 times more. Higher education is the most skewed in favor of the rich for all countries; in 12 countries10 public expenditure on higher education is 1,000 times more for the richest decile than for the poorest. The analysis further shows that the countries with the largest inequities in public education expenditure overall demonstrate more pro-rich expenditure patterns at each of the three levels of education analyzed, including primary education (Ilie and Rose, 2016b).
9 Swaziland, Bangladesh, Mozambique, Comoros, Nepal, Namibia, Madagascar, Rwanda, Zimbabwe and Cameroon. 10 Mozambique, Madagascar, Zimbabwe, Cameroon, Niger, Tanzania, Zambia, Cote d’Ivoire, Malawi, Burkina Faso, Guinea and Liberia.

26
4. Targeting resources to reach the most disadvantaged
Key messages for Section 4 1. Education budgets are often formulated on the basis of the numbers of children
enrolled per school. This fails to take account of the higher investment needed to reach those children who are disadvantaged due to income, gender, geographic location, ethnic origin and disability – many of whom remain out of school.
2. Many low-income countries follow the principle of equality of funding i.e. disbursing the same amount per child, rather than equity of funding which rather looks at differentiated funding depending on disadvantage.
3. In a number of middle-income countries, including Brazil, India and South Africa, governments have tried to address the large disparities in school access and learning outcomes for children from the most advantaged and disadvantaged backgrounds. They have done this through funding formulas intended to mitigate disadvantage and ensure these gaps narrow over time.
4. Large disparities in learning outcomes, however, continue even in those countries where resources have tried to better target the most disadvantaged pupils and schools. Some reasons are that teacher salaries (representing the largest share of the education budget) are often not included in funding formula redistribution, there is poor autonomy over the use of funds by schools, and parents and funds are delayed by late disbursements meaning schools do not receive money until late in the school year.
4.1 Education budgets are often distributed without taking into account the investment needed to mitigate disadvantage In many countries, both developed and developing, children and young people who are the hardest to reach are often the last to benefit from government investment in education. Reaching children who are disadvantaged by income, gender, geographic location, ethnic origin and disability are likely to entail much higher investment needs than reaching those children from groups not affected by disadvantage (UNESCO, 2009). The cost of reaching these children is likely to be far much higher than the average cost per pupil because costs include interventions intended to mitigate the historical and present disadvantage that these children/ adolescents face (UNESCO, 2014). While equality of funding would be defined as disbursing the same amount of money to per pupil or per school, equity of funding would rather be about “providing the right amount of resources that a certain group needs to live a full life, given the historical, material and social marginalization they have experienced” (Zine, 2001). Since the 1980s governments have progressively moved towards a system of allocating funding for education through a per-pupil formula (Levacic, 2014). And yet these are often based on the principle of equality of funding where funding is allocated to schools on the basis of the numbers of children without factoring in for the differing needs of providing education. Failing to differentiate between the different backgrounds of students in different locations, equality of funding approaches can be highly regressive. Equity of funding approaches is based on the principle of different amounts of money per child based on need, but even where funding is allocated in this way, it often makes up only a small proportion of total public education funding, particularly where teacher salaries are excluded from the formula (Save the Children, 2014). In addition to formula funding, demand side financing, usually associated with social protection programmes, redistribute public resources by giving cash payments to low-income families, with payments sometimes being dependent upon regular attendance of children in school (see Section 5).

27
Given the current high repetition and early drop-out rates at primary level for many disadvantaged in poor countries, a high percentage of public expenditure on education is being spent on children who leave school without having learnt basic literacy and numeracy skills. Analysis in Ghana illustrates the strong cost-effectiveness argument to be made for targeting resources towards marginalized children. Simulations found that were 500 pre-primary schools to be built and spread evenly throughout the country, the number of primary completers would total 6,202. However, if these schools were situated in the North of the country and in those districts where 90% or more of the children come from poor households, then the number of additional primary completers would equal 27,327. In other words, for the same investment there would be an almost four-fold improvement in the numbers of primary completers, provided that resources are targeted towards disadvantage focusing on both region and poverty in Ghana (UNICEF, 2015c). Another incentive of investing in equity is the foregone national income in not doing so. Children with disabilities are one of the most marginalized groups and make up one-third of the global numbers of children who are out of school (Sæbønes at al., 2015). Being disabled is associated with a 10% increased probability of falling in the bottom two wealth quintiles (Filmer, 2008). It is estimated that the cost of excluding people with disabilities is equivalent to 7% of GDP in low and lower middle-income countries (Buckup, 2009); however, were access to schooling for children with disabilities made a priority by governments it would allow caregivers the chance to engage in employment and increase children’s potential wealth creation (Sæbønes at al., 2015).
4.2 Some middle and high-income countries have addressed disadvantage in their education budgets through the use of redistributive funding formulas A number of middle and high-income countries have embarked upon differentiated funding according to need, with varying degrees of success and different approaches to addressing this disadvantage. In the case of the Netherlands, for instance, a school funding formula has been in place since 1985 and is weighted in favor of the number of disadvantaged children in a primary school. The main categories of disadvantaged children are defined as native Dutch children, whose parents themselves have little education and disadvantaged immigrant children. Schools with a large number of disadvantaged children, on average, have 58% more teachers per student, together with more support staff (Ladd and Fiske, 2010). However it is not always the case that funding is equitable even in countries where income levels are high; in the case of England, for instance a child attending school in the relatively wealthier Inner London region receives approximately 1.5 times more in government funding than does a child attending school in the South West of the country. A proposed reform for the 2017-18 school year is to make school funding more equitable. While the proposed revision of the funding formula is currently still under discussion, it is intended that the grant will go directly from the government to schools, as opposed to passing through local authorities as is the case currently (Johnes, 2016). Some of the highest inequalities in the world continue to persist in fast-growing middle-income countries with large populations, where the benefits of impressive growth rates over the last two decades have been very unequal. Governments in many of these countries have increasingly recognized that the equality of funding approach towards funding education is perpetuating disadvantage for the poorest, and are shifting towards a system of ensuring a more equitable distribution of resources. In many of the middle-income countries surveyed, the majority illustrate extreme geographical inequities. In India, for instance, the population

28
classed as multi-dimensionally poor constitute 79% and 68% in Bihar and Uttar Pradesh respectively; this is compared to 12% and 13% in Delhi and Kerala respectively (Alkire and Robles, 2015). Similarly in South Africa the poorer provinces of Limpopo and Eastern Cape had 64% and 61%, respectively, of the population living below the poverty line; this compared to 23% and 25% in the Gauteng and the Western Cape provinces respectively (Statistics of South Africa, 2014). The marginalized in Brazil and Kenya, amongst the most unequal countries in the world, similarly are concentrated in particular geographical hotspots. These countries should be commended for their efforts to start reversing the trends in unequal distribution of government resources for education, which, for too long, have been at the expense of the most marginalized groups. Table 2 illustrates some of the ways in which these middle-income countries have embarked on distributing education resources through a funding formula which favors disadvantaged whether this is by poverty, by geographic region or by school.

29
Table 2: Summary of middle-income country interventions in increasing equity of education expenditure Name of scheme Description How does scheme direct resources to
most disadvantaged What does the scheme cover?
Shortcomings of current funding formula approach
Brazil Fund for the Development of Basic Education and Appreciation of the Teaching Profession (FUNDEB)
Brazil introduced FUNDEF in 1996 with the aim of committing to invest a minimum amount per child with state spending complemented by federal allocations. In 2006, FUNDEF became FUNDEB. It further differentiated between categories of students to account for certain marginalized groups. Furthermore, it was extended beyond primary education to include primary, secondary and youth adult education
Federal funding ‘tops’ up State funding to minimize historical disparities in funding between poorer and richer states to counter the highly unequal tax mobilization capacity amongst states. Funding formula favor rural and marginalized indigenous groups. The majority is earmarked for teacher salaries to reconcile the fact that historically poorer states in the North and North-East had a larger share of unqualified teachers.
FUNDEF resources earmark 60% for teacher salaries and 40% for school operations
India Special Focus District (SFD) under Sarva Shiksha Abiyan (SSA)
SSA has been operational since 2000 and is intended to reduce the gaps in educational outcomes between regions, income groups, genders and minority communities. In 2006 SSA identified districts to receive additional funding based on variables including out-of-school population, gender disparities and large populations of minority groups. These were Special Focus Districts (SFDs)
Government disburses additional resources to states/ districts with high out-of-school populations, gender disparities, large disadvantaged minority groups and with special needs
SSA disburses grants to schools around three broad areas: (1) Maintenance, (2) Development and (3) Teaching and learning
- Grants to schools are earmarked around three areas and so may not align with school needs
- There is no mechanism to compensate schools for increased enrollments as grants are not based on per child norms
- Large schools, with higher operating costs, are penalized meaning total grant per child is inequitable when comparing between type of school
Mexico Consejo Nacional De Fomento Educativo (CONAFE)
In 1992 the government, through the CONAFE Program – part of a “Compensatory Programmes” – tried to ensure an equitable distribution of resources and education standards across all schools.
Funds skewed in favor of the poorest districts within the 23 poorest states. Spending is on infrastructure improvement, school equipment, textbooks and teaching and learning materials, pedagogical training and monetary incentives for teachers. In addition small volumes of funds are disbursed to parents who have the discretion to invest in what they deem appropriate for the needs of the school.
Non salary expenditure including monetary incentives for teachers and support for SMCs
- Excludes teacher salaries and capital spending
Pakistan National Finance Commission Award (NFCA)
Federal transfers account for 90% of provincial spending on education. Up until 2009, funding to provinces was disbursed on the share of their
Federal transfers to provinces make up 90% of total resources for provinces. The criterion relates to the distribution of
All education expenditure
- Weighting given to poverty is just 10% - Formula based budgeting within the four
provinces is currently not operational

30
population. As this failed to take into account the deprivation of provinces and their ability to raise their own resources it was considered a regressive funding formula. The 7th Award in 2009 added three additional criterion to determine provincial allocations. This took into account disadvantage of certain provinces in mobilizing resources and poverty levels
federal resources. Distribution to provinces is weighted on four criterion: 82% is on population size, 10% on ‘poverty backwardness’, 5% on provincial revenue collection and 3% with inverse population density. The change in formula is intended to favor smaller, less sparsely populated and less developed provinces.
despite intra-province inequalities
South Africa
National Norms and Standards for School Funding (NNSSF)
The programme was introduced in 2006 to reverse the legacy of Apartheid. It was intended to reduce the wide gaps by race in education spending.
Fee free schooling for schools in the poorest three income quintiles geographical areas. Each Provincial Education Department directs 60% of non-personnel and non-capital recurrent expenditure towards the bottom two quintiles of schools.
Non salary expenditure
- Excludes teacher salaries and capital spending
- Funding is earmarked and so may not align with school needs
- A school might be situated in a wealthy catchment area and yet the learner might come from low-income households. Similarly learners from wealthy households may be attending no-fee schools without having to make any contribution
Sri Lanka Education Quality Inputs (EQI)
The programme was introduced in 2000 to address disadvantage faced by smaller schools in rural and poorer areas which have higher operating costs.
Funds are skewed towards smaller schools which are largely situated in rural and poorer areas. Resources are earmarked for purchase of consumables and repair and maintenance of schools.
60% for consumables 40% for repair/ maintenance
- Excludes teacher salaries - Funding is earmarked and so may not
align with school needs
Vietnam Primary Education for Disadvantaged Children Project (PEDC)
The Project was implemented from 2003 to 2010, focusing on achieving fundamental school quality levels with particular attention to initiatives for highly vulnerable children. Geographically project targeted 227 of the poorest districts out of a total of 615 districts. This targeted approximately 70% of disadvantaged children
The Project targeted disadvantaged children defined as those not enrolled in school, attending sub-standard school or being disabled or part of other vulnerable groups. Targeting was at the district level
- Targeting based on district and not school. Within district all schools eligible to receive project support, meaning some better-off schools could be included
Source: Da Cruz et al. (2015); Bruns et al. (2012); Jhingran and Sankar (2009); World Bank (2008); Motala and Sayed (2012); Giese et al. (2009); Arunatilake and Jayawardena (2013); Getler et al. (2012); Poisson (2014); Mestry and Ndhlovu (2014); Malik and Rose (2015).

31
Some low and lower middle-income countries have also begun to consider ways in which education resources can be redistributive, although the developments are not as advanced as the case studies presented in Table 2. Part of the reason for this is due to the capacity constraints that these governments face in being able to target and implement programmes effectively. In Kenya, for instance, the government adopted a new constitution in 2010 which set out how government allocations would meet the requirements relating to equity. This specifically related to reducing the disparities between regions and closing the gap in relation to access and quality of basic services, including education. Article 202 of the 2010 Constitution set out that revenue raised nationally should be shared equitably among national and country governments. The equitable share provision set out under Article 203 stated that counties would receive a minimum of 15% of national revenue. A further 0.5% of revenue would be channeled by the Equalization Fund, created in 2010 by the constitution to improve services in the most marginalized parts of the country to “bring the quality of those services….to the level generally enjoyed by the rest of the nation, so far as possible” (Watkins and Alamayehu, 2012). However, capitation grants to primary schools have been dependent on the numbers of children enrolled which firstly fails to take into account where disadvantaged groups may be in need of more resources, and secondly penalizes the poorer Arid and Semi-Arid regions of the country which are home to 46% of the out-of-school population (Watkins and Alamayehu, 2012). In Malawi, schools currently receive two grants directly; the ‘Direct Support to Schools’ grant initiated in 2006 and the ‘School Improvement Grant’ introduced as a pilot in 2010. In the case of the latter there is a specific focus on orphans and vulnerable children and HIV-positive children; this grant is disbursed on the basis of both the total numbers of children and the number of vulnerable children enrolled at school level. At the national level US$12.9 per child had been determined for orphans and vulnerable children, while US$20 was the flat rate for HIV positive learners (Nampota and Chiwaula, 2014). In the context of what schools get in grants for Direct Support to Schools, however, the School Improvement Grants are a small share of the total.
4.3 Even where a funding formula is in place, a large number of factors continue to perpetuate learning inequalities for the most disadvantaged Despite some countries with the largest inequalities (Brazil, India, South Africa) institutionalizing a redistribution of public education resources towards the most marginalized parts of the country, and in some cases closing the gap in learning disparities, there remains a large divide in both the funding and learning outcomes in those schools and regions deemed as poor compared to their richer counterparts. Moreover, even where funding formula grants direct a larger share of resources to the poorest schools and regions, disparities have not completely closed. This can be for a variety of reasons. In large decentralized systems, for instance, where contributions are contingent on local governments, as well as central government, inequalities may be perpetuated given that poorer states’ will only be able to contribute much less than wealthier states. In India, for instance, public elementary expenditure per child in 2011-12 was approximately US$126 and US$256 for the wealthier states of Kerala and Himachal Pradesh, whereas in West Bengal and Bihar these amounted to US$79 and US$54 respectively (Dongre et al., 2014).

32
Similarly, in Pakistan, a wide variation exists in the capacity of different provinces to raise revenue through local taxes. In the wealthier province of Punjab, 11% of its total revenue is through its own taxes; the equivalent for the poorer province of Baluchistan was just 3%. In spite of the changes brought in to elicit more equitable resource distribution amongst the provinces in Pakistan in 2009, what provinces disburse to the districts is still beset by large inequities. In the wealthier province of Punjab, the districts of Lahore and Faisalabad receive 9% of the total budget while the 8% of the total budget is disbursed to the eight worst performing districts. In all four provinces, it is in those districts where the proportions of out of school children are the highest that district budgets are the lowest (Malik and Rose, 2015). A remaining challenge is that, even where government resources have been skewed in favor of poorer schools, wealthier schools continue to be able to supplement government resources with other sources of income. In Sri Lanka, for instance, despite non-salary recurrent expenditure being skewed in favor of schools from the bottom three income quintiles, those schools in the top two quintiles – where state funding has been reduced – continue to be able to acquire physical and human resources paid for through school fees which continues to keep in place the inequities in funding (Mestry and Ndhlovu, 2014). While increasing attention has been given to distribution according to enrolment, less focus has been given to how the distribution of resources affects the quality of education in schools where the majority of poor children attend. In South Africa, for instance, the poorest 60% of learners are three grade levels behind that of the richest quintile by Grade 3; this increases to four grade levels by Grade 9 (Spaull and Kotze, 2015). Schools with an overwhelmingly large population of learners of African descent in South Africa still underperform those learners in predominantly Afrikaans or Asian schools. In spite of additional resources being channeled more equitably according to the National Norms and Standards for School Funding policy, the increase in the aggregate number of candidates passing examinations successfully has been minimal (Mestry, 2014). An important point is not that adopting formulae for the distribution of public resources is misplaced, but rather that there are lessons to be learnt for ensuring they achieve their desired objectives. The experience from countries which have specifically targeted disadvantage through institutionalized redistribution policies offer important practical lessons on how their design can be strengthened to improve the learning outcomes of the most disadvantaged children. School grants must be invested in areas that can raise quality : In India SSA funding largely appeared to prioritise investment for infrastructure over improvement in outcomes; in 2013-14 76% of the budget was for interventions relating to teacher salaries and infrastructure. Interventions earmarked for “quality” interventions within the SSA grant are made up of two components; an innovation grant and the Learning Enhancement Programme (LEP). However, as a share of elementary spending this has been negligible amounting to less than 1% in financial year 2014-15; prior to this the share going to quality made up 1-2% of allocations (Accountability Initiative, 2014). In the case of Bangladesh while spending on primary education is pro-poor, one recent study finds that as well as schooling inputs being inadequate, they are also not pro-poor. While the shortage of adequate inputs was perceived to be a nation-wide issue, it was more acute in poorer areas with a shortage of infrastructure and gender equity inputs being particularly
33
weak. These were found to account for some of the stark differences in learning outcomes between schools in poorer and richer catchment areas (Steer et al., 2014). Funding formula must take into account teacher salaries: In many of the countries reviewed where a proxy funding formula is in place, salaries – which make up the overwhelming majority of education expenditure – sit outside funding formulas limiting the effectiveness of redistribution. In Sri Lanka, for instance, the Education Quality Inputs programme makes up 2% of the total education recurrent budget as it discounts for teachers’ salaries. Similarly, in South Africa grants meant to disburse more funds to disadvantaged areas are limited to non-salary recurrent expenditure. Non-salary expenditures make up only 8-10% of school budgets. There continues to be a skewed distribution of qualified teachers to wealthier schools and a higher teacher-learner ratio in township and rural schools (Mestry and Ndhlovu, 2014). Brazil provides a counter example to this with 60% of FUNDEF funds being earmarked for teacher salaries. FUNDEF made it mandatory that all teachers acquire minimum qualifications meaning that by 2002 almost all teachers in the Northern disadvantaged areas of the country had acquired the minimum teaching qualifications required. Outside of countries with a funding formula in place, the unequal distribution of teachers by sub-region remains a challenge. In 25 sub-Saharan African countries, just six countries deployed 80% or more of the teacher workforce in relation to the number of pupils (UNICEF, 2015b). The Rainbow Spectrum in Philippines, which was initiated in 2006, executed a fairer distribution of qualified teachers to more marginalized districts. In color coding districts according to need and making this information publicly available, those areas with high pupil: teacher ratios were prioritized for teacher deployment (UNESCO, 2010). Togo is another example which has improved the high inequity in teacher allocation over a relatively short space of time; the proportion of teacher allocation not dependent on the pupil population per school went down from 68% in 2010-11 to 50% in 2012-13. Government officials responded to the inequitable teacher allocation by posting approximately 6,000 newly appointed teachers to regions with high pupil-teacher ratios (UNICEF, 2015c). Increasing school autonomy over how resources are spent : One of the arguments made in support of greater decentralization over the last decade was to allow greater autonomy over spending decisions at the school level in order to better link this with the needs of the school. However, in some countries with funding formulas in place, and indeed decentralized structures, rigid earmarking of how funds are spent is limiting the potential effectiveness of decentralized decision-making. In India, despite various commitments made to increase the autonomy of schools and school management committees over spending decisions, this has not been executed in practice (Accountability Initiative, 2012). In 2013-14, for instance, one state expressed an interest in restructuring its in-service teacher-training model, whilst another state asked for a top-grant to improve the quality of textbooks; in neither case were the proposals accepted. Of total SSA resources in 2013-14, schools and school management committees have no power over how the bulk of resources are spent (Aiyar et al., 2013). Similarly in the case of Sri Lanka, education quality inputs are chosen according to guidelines administered by the Ministry of Education; these may not always correspond to what the schools themselves would spend on and the rigid use of funds to budget lines makes it difficult to change this according to what best suits the school’s needs (UNESCO, 2011). The degree of autonomy over spending also creates inequities between the disadvantaged and advantaged. In Sri Lanka and South Africa, schools that receive the bulk of their funding

34
from Education Quality Inputs and National Norms and Standards for School Funding – and which are where the most disadvantaged students are likely to attend – have less autonomy over spending than schools which mobilize additional income from school fees and other sources of income. In South Africa richer schools are able to hire teachers, in addition to funds it receives from government sources. Given that South Africa’s National Norms and Standards for School Funding is meant only for non-recurrent expenditure, it means that poorer schools whose income is solely dependent on these funds are unable to spend on teachers even where this is the greatest need. The inequities over school autonomy is similarly reflected in Honduras in relation to how school grants are spent between less and more developed regions; in the former case it was found that parents had no power over recruitment of teachers, whereas in more developed areas parents had more autonomy over teacher recruitment. Greater school autonomy can pay dividends as the example of Mexico illustrates; in doubling the grants made to parent associations test scores in Spanish and Mathematics significantly improved (Getler et al, 2012). A recommendation going forward would firstly be to ensure that grants to schools are not rigidly earmarked, as this often fails to reflect the needs of schools receiving funds. This must be accompanied with providing increased support to improve capacity for schools and school management committees so they are able to use funds on areas which will improve learning outcomes. Increasing timeliness and information on funding to schools: In almost all cases where a funding formula has been institutionalized, favoring poorer schools and districts has generally meant an increase in resource allocation for the poorest schools. However, a mixture of poor timeliness of disbursements and information as to what schools expect to receive has impeded progress in equity given the poor utilization of funds. Poorer states and schools remain the most affected by the discrepancies in amounts and timeliness of disbursed funds, given their more limited capacity to spend. Beyond countries with funding formula, lack of information and delays in the disbursements of school grants are also prevalent in Kenya, Uganda, Lesotho, Malawi and Ethiopia to name a few countries. In South Africa, schools in the poor region of the Eastern Cape were receiving lower allocations due to them as compared to other regions (Sayed and Motala, 2012). In Sri Lanka, school census data from 2011 indicated that less than one-third of schools had received Education Quality Inputs funds half-way through the school year; in the poorer North Western province just 6% of schools received funds half-way through the school year. In both South Africa and Sri Lanka this has proved most detrimental for the poorest, given the greater reliance of schools in poorer districts on the funding (Aruntilake and Jayawardena, 2013). Delays have often meant that when money finally does arrive, resources are not fully utilized or when they are, the pressure of spending within the financial year is often done without necessarily aligning it with school needs. In India, utilization of funds was just 62% in 2011-12 (Accountability Initiative, 2012); this disguises the much lower utilization rates amongst poorer districts and schools. Moreover, it is reported that the funds were used in more than 60% of schools to white wash their walls annually. This has reported to have largely been as a consequence of schools experiencing delays in what they receive in funding leading to an inability to effectively spend around activities that reflect school needs: school expenditures, instead, are spent on activities like white washing to allow schools to use resources before the financial year ends after which resources cannot be spent (Aiyar at al., 2013). Evidence from Sri Lanka illustrates how schools with qualified teachers and head-teachers are often

35
more adept at utilizing and aligning funds with school needs, even when there is a delay in receiving them (Arunatilake and Jayawardena, 2013). Ensuring greater utilization of funds is crucial if the equalization of opportunity is to be achieved. While Sri Lanka has introduced a policy of allowing schools to carry over unspent funds into the next financial year, this fails to adequately address the issue in the long-term which is the poor capacity of teachers in poorer schools to spend. In Mexico, to counter-balance the problem of delayed disbursements, parents received skills training in the management and spending of funds (Getler et al., 2012). One recommendation would be to train personnel, including teachers, in effective financial management. Similarly, increasing information around the predictability of when funds should arrive is necessary. In Kenya, the Ministry has established a disbursement schedule to try and make funding more predictable; 50% of resources are meant to be disbursed in the first school term, 30% in the second term and 20% in the third term (Njihia and Nderitu, 2014). Reducing the complexity of financial disbursemen ts to schools: Funding in decentralized settings often comes from multiple sources; additional pressure is placed on poor schools with limited capacity to spend effectively. Schools in Indonesia currently receive funds from 8 different sources and 4 different budgets making the education funding system incredibly complex (World Bank, 2013b). This makes equalization of resources more difficult; in the case of India, for instance, the system with multiple agencies disbursing funds to districts and schools has meant that equalization between districts has been extremely limited in nature (Accountability Initiative, 2013). In Uganda, the number of conditional grants has meant a highly fragmented system which makes it difficult to assess whether funding to schools is equitable; in 1997-8 the number of sector conditional grants numbered 10 before increasing to 46 in 2014-15. As such a current proposal is to reduce the number of conditional grants to 13 in 2015-16 (Government of Uganda, 2015). Ensuring minimum levels of investment correlate to funding needs : Despite a weak correlation between direct spending on education and quality outcomes, a minimum level of spending on areas of investment including teachers, textbooks and school infrastructure is necessary to affect learning outcomes positively. Evidence suggests that pupil scores can increase, on average, by 10% if they are taught by teachers with better qualifications. Similarly, providing an additional 10% of textbooks can impact text scores by 0.44% and are amongst some of the most cost-effective interventions (UNESCO-UIS, 2011). The poorest households are adversely affected if these areas remain underfunded given the ability of wealthier households to send their children to private schools, pay for additional tutoring or purchase teaching and learning materials. One of the biggest criticisms of how governments allocate funding is the extent to which funding allocation per child is actually reflective of what it costs to deliver quality education. Increased funding has not necessarily meant sufficient funding to deliver quality education to the poorest schools. In Brazil, it has been calculated that an investment of at least US$550 per pupil is required to attain a minimum level of quality for grades 1-4; this figure exceeds Brazil’s current minimum investment of US$346 per pupil annually in the North-East province (PREAL and Lemann Foundation, 2009). Redistributive measures to equalize education opportunity for the most disadvantaged need to be bolstered by a range of other measures to ensure that funds are not just equitable, but their effectiveness and efficiency are increased. Firstly, on the expenditure side investments must be better linked to those interventions which would improve learning outcomes; this

36
would mean less rigid earmarking of education expenditure so it better reflects school needs. Secondly, given the largest expenditure item of many country budgets is teacher salaries, it is vital that any funding formula is accompanied by effective deployment of qualified teachers to those schools and regions with the largest disadvantage. Thirdly, it is necessary to improve the disbursement of funds so that schools receive them in a timely and predictable manner. Governments should avoid complex mechanisms through which to disburse funds to schools and make efforts to ensure transparency of what schools should expect to receive.
5. Spending on social protection programmes
Key messages for Section 5 1. Globally cash transfers exist in 130 countries, with most rapid growth occurring in sub-
Saharan Africa. Between 2010 and 2014, total spending on social safety nets was US$329 billion.
2. Though a small share compared to what many countries currently spend on their education budgets, cash transfers have great potential – especially if targeted well – to increase access to school for children from disadvantaged backgrounds.
3. While targeted cash transfers are more costly and difficult to administer in low-income countries, they can generate cost savings as well as increase the share of the poorest targeted from 38% to 82%. Different approaches to targeting have been utilized from means tested/ proxy testing, to geographic to group-based.
4. Conditional cash transfers are found to be more effective in influencing if a child is enrolled in school compared to unconditional cash transfers. Conditional cash transfers improved the chances of a child being enrolled in school by 60%; the equivalent for unconditional cash transfers was 18-25%.
5.1 Social protection programmes: a global picture In an era of an increased focus on intra-national inequalities, the role of social protection programmes in targeting the poor has been elevated on the policy agenda of many governments and donors. Government spending on education can address supply side issues adequately; however, spending through education budgets alone is not enough to address the historic disadvantage that children may face be it by income, gender, geographic location, ethnic origin or disability. Demand side interventions through social safety nets are complementary interventions to public spending on education to reach groups most in need, preferably through targeting transfers as oppose to a universal approach of giving transfers to everyone. In some countries where poverty is correlated with specific sub-national geographic regions, governments have complemented direct spending on education and other social service with more targeted social protection programs and other safety-net measures. Valid questions have arisen over the capacity of poor countries to roll out social safety nets which attach conditions to transfers or use some sort of eligibility criteria to target resources to the most marginalized. However, there exists a robust evidence base of the impact that these transfers have had for the poorest households in accessing schooling and other social indicators. As of 2015, cash transfers existed in 130 countries with the most rapid growth taking place in the sub-Saharan African region. Of the 120 developing countries with social safety nets in place, total spending amounted to US$329 billion between 2010 and 2014 (World Bank,

37
2015b). As a share of the GDP of low and middle-income countries in 2015, this was the equivalent of 1.4%. The top 5 conditional cash transfers in 2015 in terms of the numbers of beneficiaries were Bolsa Familia (Brazil), Prospera (Mexico), Pantawid (Philippines), Familias en Accion (Colombia) and the stipend programme for primary students (Bangladesh). All these programmes have, amongst their overall aims, an education specific target of reducing non-attendance and drop-out rates amongst the poorest children and students (World Bank, 2015b). Currently there are over 100 programmes worldwide which aim to improve education enrolment (Garcia-Jarmillo and Miranti, 2015).
5.2 Government budgets on social protection programmes though small can be effectively complemented alongside government budgets on education While there has been a rapid growth in the numbers of countries institutionalizing social safety nets globally, spending on these programmes as a share of government expenditure is generally low. Resources directed towards social safety nets and, more specifically, targeted conditional cash transfers, which are better at targeting the poorest households, are currently much smaller than direct spending on education services and other social sectors. This remains true regardless of region or income group; in the Latin American region for instance, where cash transfers are most established, volumes of resources going to education budgets were up to 24 times that earmarked for conditional cash transfers in Mexico, 14 times in Colombia and 13 times in Brazil (Figure 10). Virtual income can, in simple terms, be defined as what households receive through the provision of government services such as education, health and cash transfers which are then converted into a cash value. From an equity perspective, the virtual income redistributed to children from the poorest households through conditional cash transfers is currently eclipsed by the potential for redistribution through education budgets, themselves, in many countries. However, if administered and targeted effectively, cash transfers have great potential to maximise both income redistribution and poverty alleviation (Garcia-Jarmillo and Miranti, 2015). This is especially so if complemented with spending on education budgets. One review of 42 conditional cash transfers found that these were most effective in influencing educational outcomes in contexts where school enrolment levels were low and where supply side interventions – such as in school infrastructure, additional teachers and textbooks – complemented conditional cash transfer interventions (Saavedra and Garcia, 2013). Social protection programmes have been positively associated with improving the outcomes for many disadvantaged groups. In Bangladesh the monetary incentives provided to female students under the Female Secondary School Stipend Programme has led to an increase in female secondary school enrolment (UNDP, 2010). During its pilot phase, girls’ enrolment over the first five years meant the enrolment rose from 27% to 44% – roughly double the national average (World Bank, 2001). In addition the Primary Education Stipend Program was expanded in 2010 to reach larger numbers of students attending schools in poorer sub-districts of the country; the average allocation to the poorest quintile of sub-districts amount to US$12 per student compared to US$6 for students in the wealthiest quintile sub-districts (Steer et al., 2014). The Japan Fund for Poverty Reduction Scholarship Programme in Cambodia – specifically targeting girls from the poorest households and girls who came from households with lower parental education levels – increased girls’ secondary school enrolment by 30% (Filmer and Schady, 2008).

38
Figure 10: Expenditures on cash transfers are dwarfed by education budgets in most developing countries that have CCT programmes Ratio of government education budgets to social safety nets and CCTs, various years
A. Social safety nets B. Conditional Cash Transfers
Source: Authors’ calculations using data from UNESCO Institute for Statistics database and World Bank Atlas of Social Protection: Indicators of Resilience and Equity (ASPIRE)
5.3 Social safety net programmes have been expanding in low-income countries, but do not reach all of the poorest households In order for direct cash transfers to make an impact, programmes must not only cover a high proportion of the extreme poor, but the benefits must be large enough so that the transfers per beneficiary cover the poverty gap (Lustig, 2012). Social safety nets targeting the poorest households, however, have the lowest coverage in low and lower middle-income countries with just one-quarter of the poorest quintile reached in these countries; this rises to 64% for upper-middle-income countries. The gap is particularly acute for the sub-Saharan African and South Asia regions; here just 10% and 20%, respectively, of the poorest quintile have access to social safety nets (World Bank, 2015b). Currently, at the global level cash transfers amount to roughly 20% of what is needed to close the poverty gap in low-income countries and half of what is needed to close the poverty gap in lower middle-income countries (World Bank, 2015b). Where social protection programmes have used targeted approaches, several approaches have been used; these include means tested/ proxy testing (where resources prioritise those below a certain income threshold), geographic (where resources are targeted to regions characterised by certain characteristics including poverty or marginalization) or categorical/ group-based (where particular demographic groups e.g. children, orphans, elderly are targeted) (Garcia-Jarmillo and Miranti, 2015). Means tested or proxy testing approaches are
2 2 2 2 2 2 3 3
4 4 4 4 5 5 5 5 5 5 6 6 7
8 12
14 14
24
BangladeshUganda
MoroccoEcuador
BrazilTimor-Leste
NamibiaArgentina
PeruEl Salvador
UruguayPanama
PhilippinesGuatemala
FijiBolivia
IndonesiaColombiaHondurasTajikistan
MexicoParaguayVietnam
GhanaTanzaniaDjibouti
4 7 7 9 10 12 13 14 15 16 20 22 24 24 32
62 68 75 82 84
126 134
158 198 202
269
EcuadorPhilippinesGuatemala
HondurasUruguay
ArgentinaBrazil
ColombiaUganda
NamibiaPeru
BangladeshMexicoBolivia
VietnamFiji
El SalvadorDjiboutiPanama
IndonesiaParaguayTajikistan
Timor-LesteGhana
TanzaniaMorocco

39
found to be relatively more costly to administer than other targeted approaches (Grosh et al, 2008). Targeted programmes currently make up a fraction of the total social safety net spending budgets given that they are more costly to administer in low-income countries. However, if administered correctly targeted approaches can potentially generate savings in the long-term. One estimate is that were social assistance benefits restricted to the poorest two quintiles, then savings would amount to 0.4% of GDP; in addition the average share of the poorest targeted could increase from the current 38% to 82% (Granado, 2010). Another study of 122 targeted anti-poverty programs in 48 countries found that, on average, 25% more is directed to poor individuals through targeted programmes (Coady et al., 2004). South Africa – the most unequal country in the world – provides a good example of targeted social safety nets. The Child Support Grant, which is currently the largest social safety net in sub-Saharan Africa, reaches 11 million beneficiaries. South Africa’s spending on social safety net programmes, which as a share of GDP equalled 3.5% in 2013, is comparatively much higher than the global average of 1.6% of GDP or that spent in developing and transition economies (World Bank, 2015b). One estimate calculates that two-thirds of the income of the poorest quintile comes from social assistance grants, with most of this being attributed to the Child Support Grant programme. Targeting according to poverty appears well coordinated; in 2008 close to 56% of the poorest 20% of households reported receiving income from Child Support Grants. The equivalent for the richest 20% of households was 9% (Statistics South Africa, 2014). While low-income countries may not have the resources to implement means tested targeted social safety net programmes in the short-term, one recommendation is to begin by rolling out programmes which are a less costly method of targeting e.g. targeting by geographic region. Once this sort of targeting reaches minimum coverage rates, countries should move onto combining this with means tested mechanisms as a country’s capacity to target more efficiently and equitably grows (Garcia-Jarmillo and Miranti, 2015). Low-income countries would need to be supported in achieving more accurate targeting in a cost-efficient way. A medium term goal would be to strive in setting up information systems which would allow for simple collection and access of data on eligible beneficiaries.
5.4 Despite being more effective at targeting, conditional cash transfers make up a low proportion of social safety net programmes Of all social safety net programmes, conditional cash transfers have been found to be the best at targeting the poorest households. Countries need to have the capacity to design, implement and deliver cash transfers effectively, together with monitoring whether compliance has been met. As of 2010, conditional cash transfers were institutionalized in all but two countries in Latin America and 15 countries in Asia and Africa (Saavedra and Garcia, 2013). Conditional cash transfers are challenging to implement requiring strong in-country institutional structures and capacity which is needed to disburse resources to the poorest and most disadvantaged households. Many countries in sub-Saharan Africa, for instance – while having seen a rise in the number and volumes of resources disbursed for social safety nets generally – have not seen the same growth in conditional cash transfers which are more institutionally demanding to carry out in contexts where the capacity of government systems is low (World Bank, 2015b). As far as the effect on education is concerned, a large body of literature supports the effectiveness of both conditional and unconditional cash transfer programmes in improving school enrolment. There is also evidence that the effects on enrolment and attendance are

40
always greater for conditional cash transfers compared to unconditional cash transfers. One review of 35 studies concluded that conditional cash transfers had a larger effect on attendance and enrolment; interventions with no conditions improved the odds of being in school by 18-25%, while conditional cash transfers improved the chances of being enrolled in school by 60% (Baird et al., 2013). Very few studies have analysed the impact of cash transfers on outcomes; based on 5 studies, conditional cash transfers significantly increased test scores while there was no impact of unconditional cash transfers on test scores (Baird et al., 2013).
6. The combined impact of revenue and spending policies on redistribution
Key messages for Section 6 1. The combined effect of fiscal policy on reducing inequality indicates that the
contribution of taxes in redistributing income to the poorest households has been much more limited than the impact of expenditure, including that on education.
2. Redistribution of resources from the rich to poor is greatest in countries where inequality before fiscal interventions is higher and so there is more scope for change.
3. Of 17 developing countries with data, the marginal contribution of public spending and health on the total reduction in inequality averaged 68%.
4. The mix of fiscal policy interventions affects income inequality in different ways across developing countries. In Latin American countries, government spending on education and health have the most impact on reducing income inequality; in Tanzania on the other hand direct and indirect taxation do the most to reduce income inequality.
6.1 Currently government spending on public services is having a greater impact on reducing income inequalities than taxation Our analysis so far has looked at reforms needed to mobilize domestic resources as well as ones to spend these resources in ways that will achieve greater equity in education. Looking at the effects of these reforms combined, analysis suggests that the contribution of taxes in redistributing income to the poorest households have been much more limited than the impact of government expenditure on redistribution in poorer countries. Findings from a recent IMF study conclude that government’s efforts to redistribute wealth has largely been centred around expenditure policies, as opposed to taxation (Clements et al., 2015c). By comparison, advanced economies taxation and spending policies have had a combined effect of reducing income inequality by one-third. Approximately two-thirds of this reduction in income inequality has been due to spending on social spending, including education and transfers to the poorest families; the remaining one-third has been due to progressive taxation (Clements et al., 2015). More recently, the impact of tax policies and expenditure policies (including spending on public services such as health and education as well as on cash transfers) in developing regions have begun to be evaluated together to better understand what their combined impact has been on the redistribution of wealth. Most of the focus has been on Latin American countries. The marginal contribution of public spending on education and health as a share of the total reduction in inequality has been large: averaging 68% for the 17 developing countries for which there is data. This, however, disguises the range between countries: the contribution was as low as 13% in Ethiopia to as high as 100% in Bolivia and Guatemala. Moreover, spending on health and education had the largest marginal

41
contribution in redistributing income in 14 of the 17 countries with data compared to the contribution of direct and indirect taxation, and cash transfers. The findings also broadly show that redistribution of resources from rich to poor is, not surprisingly, greater in countries where inequality before fiscal interventions is higher and so there is more scope for change (Figure 11). Countries in the Latin American region remain amongst some of the most unequal in the world in spite of high rates of taxation and high government spending directed to social sectors. Many governments in the region invest in cash transfer programmes which target the poor, such as Brazil’s Bolsa Familia cash transfer programme and Mexico’s Prospera (previously Oportunidades) programme; however, the regressive taxation systems in place in many of these Latin American countries is undermining efforts for there to be a real transfer of resources to the poorest households through such spending. This – together with the low share of cash transfers as a percentage of GDP – means that the redistribution of resources is limited through cash transfers alone. Direct expenditures on education and health have contributed to the largest decreases in income inequality in the Latin American countries reviewed. In Brazil, for instance, the gini coefficient before redistribution efforts through government fiscal policy was 0.58; after taxation efforts and cash transfers this fell slightly to 0.54. The gini coefficient only improved substantially after direct government investments in health and education to 0.44 (Figure 3) (Lustig et al., 2013). If the improvement in the gini coefficient were to be attributed to the source of government fiscal policy in Brazil, just 10% of this could be attributed to direct taxation and 15% to direct cash transfer programs like Bolsa Familia. Despite considerable attention given to Brazil’s successful social protection programmes, currently it is government spending on education and health which does most to reduce inequality; the marginal contribution of public spending on education and health as a share of the total reduction in inequality in Brazil averaged 76%. Outside of the Central and Latin American region the impact of various policies relating to revenue collection and government expenditure policies have different impacts on redistribution of income. Tanzania, in comparison to many Latin American countries, is more equal, with the gini coefficient standing at 0.38 before government efforts to redistribute income through revenue collection or spending. Unlike in the Latin American region, direct and indirect taxation have the most significant impact on redistributing income to poorer households in Tanzania. As of 2011, 47% of Tanzania’s population lived under the US$1.90 a day poverty line (World Bank, 2016). However, the currently low coverage of Tanzania’s conditional cash transfer program in this context helps explains why cash transfers marginal impact on reducing inequality is so small (2%). Similarly, the marginal contribution of government spending on education and health services on income inequality is not as large as what the impact of direct taxation has been (Younger et al., 2016). This is partly explained by the high levels of spending on tertiary education which are not accessed by the poorest households; the poorest decile received just 17% of what the richest decile receives in public education resources (Ilie and Rose, 2016b). The marginal contribution of direct and indirect taxes on reducing inequality was 47% and 31%, respectively; the equivalent contribution of public spending on education and health was 20%. South Africa presents a counter-example to Tanzania within the sub-Saharan African context. Firstly, it is the most unequal country in the world. Even after tax and spending policies, income inequality remains higher than before most other middle-income countries have even started executing fiscal policies. As an example, for instance, South Africa’s gini

42
coefficient after direct and indirect taxation and spending on cash transfers and public spending on health and education equalled 0.60; this was higher than the gini coefficient for Brazil (0.58) before it had started to execute these redistribution policies (Figure 11). Since the end of Apartheid, progressive governments in power have aimed to address and reverse the legacy of one of the most unequal countries in the world. South Africa performs well in terms of its resource mobilisation efforts, with 24% of its national income collected in the form of tax revenue in 2013. Moreover, its direct taxation system is deemed to be largely progressive with the richest households contributing to a larger share of revenue to direct tax resources. However, the government’s expenditure policies have had a much greater impact in reducing income inequality. Close to 90% of the reduction in inequality has in fact been due to cash transfers and public spending on education and health (Figure 11). In some countries, fiscal policy may be at the expense of the poor. In Armenia, Bolivia, Brazil, El Salvador, Ethiopia and Guatemala the number of the poorest households made worse off as a result of the government expenditure and revenue collection policies actually exceeds the number who benefit from these policies (Lustig, 2015). In Ethiopia, for instance, one in 10 households are either made poor or poor households made poorer when taking into account what they pay in tax and receive in benefits (World Bank, 2015c). Building on the work by the Commitment to Equity Institute, more systematic and comprehensive analysis of the combined impact of tax collection and expenditure policies on inequality and poverty across countries and across time is vital to ensure there is a firm understanding of the impact of different policies, and areas of domestic resource mobilization and/or spending that need to be strengthened. It would also be valuable to undertake analysis of this kind with more specific attention to the implications to the education sector. Figure 11: Spending on education and health appears to have the greatest impact in reducing income inequality Impact of tax, cash transfers and spending on education and health in reducing income inequality
Source: Amended from Commitment to Equity Reports, various years Notes: The overall reduction in inequality used has taken the Commitment to Equity Centre definition, namely the difference between the market-income gini and the gini arrived at after direct and indirect taxes, cash transfers and public spending on education and health. The gini coefficient at 0 denotes a situation of perfect equality, and at 1 it denotes a situation of perfect inequality.
0.77
0.58
0.75
0.57
0.69
0.54
0.70
0.55
0.60
0.44
0.300.350.400.450.500.550.600.650.700.750.80
Sout
h…
Braz
il
Guat
emal
a
Mex
ico
Cost
a Ri
ca
Peru
Boliv
ia
Para
guay
Uru
guay
Arge
ntin
a
Ecua
dor
El S
alva
dor
Ghan
a
Arm
enia
Indo
nesia
Tanz
ania
Ethi
opia
Gini
coe
ffici
ent
Initial gini coefficient…...minus direct taxes……plus cash transfers...…minus indirect taxes……public spending on education and health

43
7. Private expenditure on education
Key messages for Section 7 1. In spite of fee free primary education being enshrined in the constitution of 135
countries worldwide, 110 still continue to charge households a monetary contribution of some sort. In African countries for which data exist, household expenditure as a share of total spending on education is higher at primary levels compared to tertiary.
2. Alternative mechanisms to government spending on education through voucher schemes or funding from philanthropy are unlikely to be financially sustainable for low-income countries with poor revenue mobilization capacities. In Pakistan, philanthropic contributions amount to just 0.1% of the amount the government disbursed for the education sector.
3. Lessons can be drawn from National Health Accounts which have in some cases led to successful cases of redistribution of public health spending towards the most disadvantaged groups. In Burkina Faso following the results from National Health Accounts, more resources were redirected to the poorer regions of the country; in India the revelation of high out-of-pocket expenditure by the poor prompted an increase in government spending on health.
7.1 Insufficient spending by governments on education hurts the poorest households in low-income countries The poor state of current tax collection efforts in many of the poorest countries has translated into inadequate resources for public services including for education. This in turn has led to poor learning outcomes for many of the most disadvantage groups. Even when governments remain committed to education within their national budgets, where government revenue collected from tax is inadequate, public expenditure on education falls short of needed resources (see Section 3). As a result, even where free and compulsory education has been institutionalized as part of the constitution, households have often had to provide monetary contributions. As such, education is rarely free for households. In 135 countries where fee-free public primary schooling has been guaranteed, 110 continue to charge households a fee of some sort (Transparency International, 2013). In many low-income countries, household contributions to send their children to school continue to be significant given the insufficient volumes governments are contributing to the education sector. Within the sub-Saharan African region, data from Pôle de Dakar reveal the extent to which insufficient public funding means households are contributing a large share of their resources to supplement public spending on education. The data also shows that households are contributing a larger share of total spending on primary education, compared to household spending on tertiary education. In Chad, household contributions to tertiary education make up just 14% of total expenditure but for primary education household contributions make up 56% (Figure 12). The 2015 Education for All Global Monitoring Report corroborate findings that household spending makes up a larger share of education spending the poorer the country. Of 50 low, middle and high-income countries with data, household spending averaged 31% of the total and in a quarter of countries – largely low-income – household expenditure exceeded the amount governments were spending (UNESCO, 2015b). As a share of total expenditure (governments, donors and households), household expenditure as a share of the total ranged from 14% in Indonesia to 37% in Bangladesh (UNESCO, 2014).
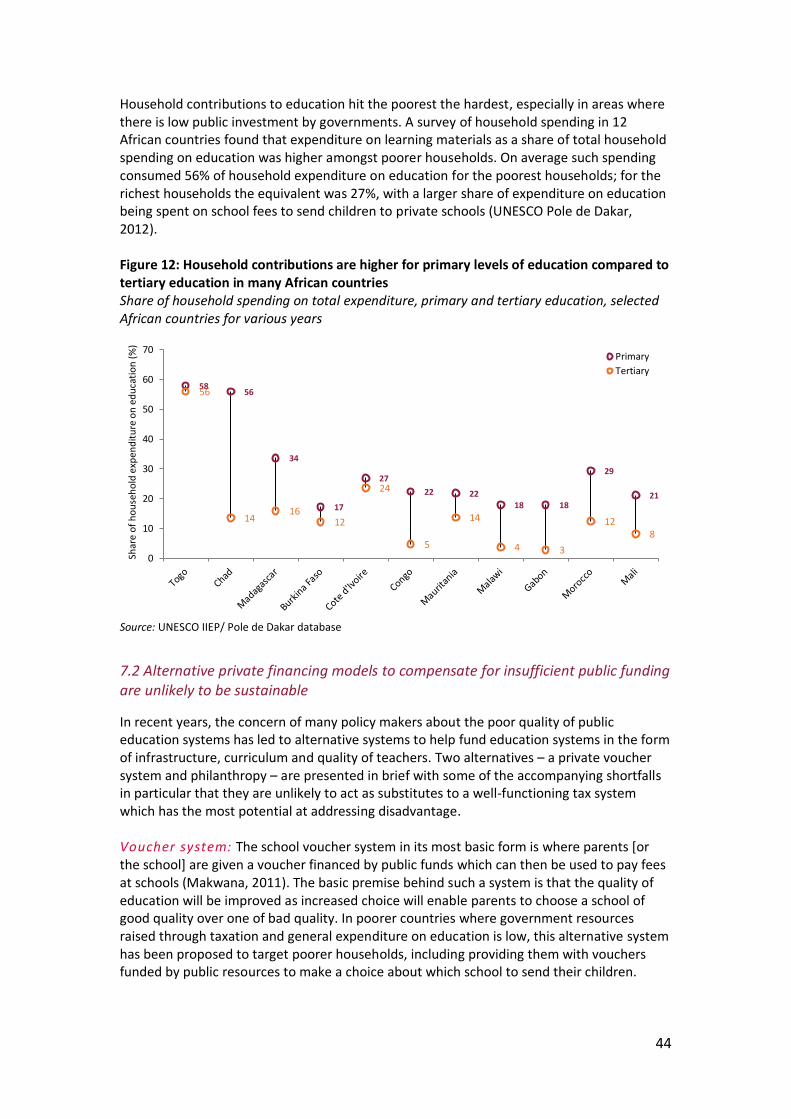
44
Household contributions to education hit the poorest the hardest, especially in areas where there is low public investment by governments. A survey of household spending in 12 African countries found that expenditure on learning materials as a share of total household spending on education was higher amongst poorer households. On average such spending consumed 56% of household expenditure on education for the poorest households; for the richest households the equivalent was 27%, with a larger share of expenditure on education being spent on school fees to send children to private schools (UNESCO Pole de Dakar, 2012). Figure 12: Household contributions are higher for primary levels of education compared to tertiary education in many African countries Share of household spending on total expenditure, primary and tertiary education, selected African countries for various years
Source: UNESCO IIEP/ Pole de Dakar database
7.2 Alternative private financing models to compensate for insufficient public funding are unlikely to be sustainable In recent years, the concern of many policy makers about the poor quality of public education systems has led to alternative systems to help fund education systems in the form of infrastructure, curriculum and quality of teachers. Two alternatives – a private voucher system and philanthropy – are presented in brief with some of the accompanying shortfalls in particular that they are unlikely to act as substitutes to a well-functioning tax system which has the most potential at addressing disadvantage. Voucher system: The school voucher system in its most basic form is where parents [or the school] are given a voucher financed by public funds which can then be used to pay fees at schools (Makwana, 2011). The basic premise behind such a system is that the quality of education will be improved as increased choice will enable parents to choose a school of good quality over one of bad quality. In poorer countries where government resources raised through taxation and general expenditure on education is low, this alternative system has been proposed to target poorer households, including providing them with vouchers funded by public resources to make a choice about which school to send their children.
58 56
34
17
27 22 22
18 18
29
21
56
14 16
12
24
5
14
4 3
12 8
0
10
20
30
40
50
60
70
Shar
e of
hou
seho
ld e
xpen
ditu
re o
n ed
ucat
ion
(%)
PrimaryTertiary

45
Chile introduced a universal non-targeted voucher system in 1980, applying it to both primary and secondary education. The value of the vouchers differs between rural and urban areas and a school can charge additional fees up to almost two times the value of the voucher (Makwana, 2011). The system has been found to result in increased social stratification as the majority of the poor remain in public schools, while children from middle and rich backgrounds have moved to study in schools unaided by public funds but funded completely by private tuition (Makwana, 2011). A voucher system’s success for reversing disadvantage hinges on ensuring that its value is enough for poor households to send their children to better quality schools. In the case of Chile, however, students with vouchers spent an average of US$52 more on school fees per annum as the vouchers only partly covered the total cost of private schools. Other questions remain on the feasibility of scaling up such schemes in poorer countries where the absolute numbers of the poorest children are large. In India, for instance, the Ensure Access to Better Learning Experiences (ENABLE) funded through an NGO has provided choice for the poorest households. The voucher covers payment for fees, books, uniforms and meals. However, currently the programme reaches just 8,000 disadvantaged children (Dixon, 2015); equivalent to 0.1% of India’s primary aged out of school population. A voucher system which prioritizes the poorest and most disadvantaged groups would also require a robust system to identify and target priority households. As Section 5 discussed accurate targeting involves timely and regular identification of beneficiaries. In many low-income countries capacity constraints in accessing and verifying such timely, accurate and up-to-date information would likely act as a barrier in the short-term to a voucher system given the costly nature of collecting such information (Bastagli, 2010). Philanthropy: Philanthropy has been put forward as another way of increasing resources and more efficiently targeting spending towards achieving better quality education for the disadvantaged. The increase in the numbers of high-net worth individuals worldwide, the increase in the numbers of philanthropic foundations and the pivotal role that some of these have had in influencing the development agenda has led to questions around whether philanthropic donors can serve as an alternative model in countries where tax systems are failing to mobilize resources, and invest in provision of good quality public education systems for the most disadvantaged. How feasible a model is this? Firstly, it is worth putting in context what the global volumes spent by private foundations and corporations on education in developing countries are. It has been estimated that just US$683 million per year by foundations and corporations was disbursed to developing country education systems; this worked out to the equivalent of 5% of what was given in education aid by DAC donors (Van Fleet, 2012; UNESCO, 2012). One estimate from Pakistan calculates that philanthropic contributions amount to just 0.1% of what the government disbursed for the education sector (Bari and Malik, 2016). Clearly, therefore, the current volumes remain vastly insufficient to act as a substitutionary mechanism. Moreover, tax incentives are unlikely to increase giving for philanthropic causes. A 2007 study found that just 7% of high-net worth individuals (earning between US$5 to US$50 million) would “dramatically decrease” their giving should they receive zero income tax deductions; just over half (52%) indicated that their giving would in fact remain the same (Centre on Philanthropy, 2007).

46
Secondly, the latest statistics of the regional distribution of high net worth individuals illustrate that they continue to be concentrated in North America and Europe. In many countries where tax mobilization is failing, the number of high net worth individuals with substantial resources to invest in education systems remains small. India remains an exception to the rule with 0.5% of the globe’s population whose assets are worth US$1 billion or more. The African region, on the other hand, had just 29 individuals with assets worth over US$1 billion (Credit Suisse, 2015). Lastly, the question of accountability of such a proposed model deserves attention. Philanthropists do not, unlike democratically elected governments, represent the electorate. In the United States, where data on philanthropic and NGO giving is much better documented, it was found that spending decisions were not found to closely match the spending choices of the government. Half of charitable donations were made to religious organizations, and only a small part of American giving redistributed from rich to poor (Reich, 2011). The above has cautioned against a model whereby philanthropy is a substitute for state service delivery in countries where tax systems are failing. However, this is not to say that philanthropy should not be encouraged to complement state service delivery. Rather, it has a key role to play, and should be supported in making sure resources are in line with national commitments to reach the most disadvantaged.
7.3 Information on the financing landscape for education needs to be improved to effectively address disadvantage The accountability, efficiency and equity of public and out-of-pocket financing in education remain increasingly critical in order to achieve maximum impact for education expenditure (Chawla, 2010). One of the routine challenges faced when tracking resources for education in their totality is the lack of holistic, reliable and timely financing data. Many countries do not know how much is being spent on education, on what and by whom. And yet effective policy making requires that decision makers have complete access to information on education financing including the share of national wealth spent on education, the financial burden of education spending falling on households, the extent to which the education system is supported by external financing or other non-governmental providers and the overall share of education spending on those sub-sectors of education which are accessed by the most disadvantaged. National Education Accounts are one such tool which can help address this and can potentially influence finance related decisions, particularly for vulnerable and marginalized groups. National Education Accounts can provide policy-makers with the holistic information necessary that can allow policy change in relation to inequities existing within the system (Chawla, 2010). Typically a National Education Account would have information broken down by: (1) Financing source: government (central, state, district), private sector (household, NGO, corporation), international (donor government, philanthropic organization), (2) Level of education: pre-primary, primary, lower secondary, upper secondary, TVET, tertiary and (3) Spending activity: teachers’ salaries, school books and teaching and learning materials. Few examples exist of National Education Accounts institutionalized at country level; one that does was a pilot USAID-funded State Education Account in Nigeria for the states of

47
Kano, Zamfara, Bauchi and Sokoto. The findings for Kano and Zamfara indicated a strong bias, by both public and private providers, to fund schools in urban areas; consequently, state planners reassigned teachers from urban to rural areas. In Zamfara state more funds were channelled towards girls’ schools. Additionally more funding was allocated towards textbooks and maintenance where a shortage of funds was identified (Chawla, 2010). National Health Accounts provide a better insight into where publically made information has led to widespread support for better health financing decisions. This has been specifically in relation to out-of-pocket expenditures in health which have adversely affected the most disadvantaged. In Burkina Faso, National Health Accounts data revealed huge geographic inequities in health spending with poorer regions receiving less than more affluent areas. Boucle du Mouhoun and Nord – two of the poorest regions in Burkina Faso – received a combined 11% total of all health care spending; this is in spite of poverty incidences being 60% and 69%, respectively, in each these regions. This was contrasted to the wealthier Centre region which received 29% of total health care spending in spite of having 22% incidence of poverty. As a result of the findings, the government and development agencies allocated more resources to poorer regions (Zida et al., 2010). Similarly in India, National Health Accounts data revealed that household spending on health accounted for 78% of total health expenditure, therefore making the case for increased public health spending. The high burden borne by households, as revealed in the first round of the National Health Accounts, prompted the government to establish the National Rural Health Mission (2005-2012); objectives included increasing public expenditure on health and reducing the regional imbalances existing in relation to health infrastructure. It also led to the creation of the Rashtriya Swasthya Bima Yojna (RSBY) – a government-funded health insurance scheme targeting the poor (Maeda et al., 2012). While National Education Accounts are not as well established as National Health Accounts, in 2013 in partnership between the UNESCO Institute for Statistics (UIS), the UNESCO Institute for Education Planning (IIEP) and the Global Partnership for Education, technical support was provided to eight GPE member countries to initiate pilot National Education Accounts.11 This was intended to collect good quality education finance data from the government and external funders to glean whether resources are equitably and efficiently allocated. Going forward, the education sector can learn much from the experiences of health as far as rolling out National Education Accounts are concerned; work on institutionalizing and better linking these to high-level policy decisions on education expenditure needs to be accelerated if the 2030 education goals are to be achieved.
11 Cote d’Ivoire, Guinea, Lao PDR, Nepal, Senegal, Uganda, Vietnam and Zimbabwe

48
Recommendations 1. Governments must make a strong commitment in both increasing resources collected
in taxable revenue, and spending a minimum share of the government budget on education according to the benchmarks agreed upon by the international community.
2. Governments must collect resources equitably, ensuring that the indicative 20% tax-to-GDP ratio is met through progressive tax revenues that do not harm the poorest and most disadvantaged. Efforts to broaden the tax base must minimize harmful tax practices which exempt or allow for tax evasion practices by powerful interest groups.
3. Donors must increase the levels of aid currently invested in strengthening domestic
resource mobilization, ensuring that this is achieved through progressive tax systems. Support must be provided beyond just the technical, and complemented by evaluating the political will for such reforms at country level.
4. Domestic spending must commit to prioritizing those levels most likely to be accessed
by the poor. Despite the ambitious nature of the global SDG agenda for education, an incremental approach in rolling out fee-free access beyond the primary level is recommended to guarantee the principle that no one is left behind.
5. Governments should re-balance domestic expenditure towards pre-primary and earlier
grades of primary, where learning disparities between disadvantaged and advantaged children can most effectively be addressed.
6. Cost-sharing and recovery of higher education need to be considered in order to
reverse the current regressive spending in education within many poor countries. 7. Education spending must adopt equity of funding approaches to address the historical
disadvantage faced by the poorest groups. The design of funding formulas and how they are executed must take into account how they can most effectively improve the learning outcomes of the most disadvantaged children.
8. Government spending on education must be complemented with cash transfers for the
most disadvantaged. Cash transfers should be targeted to the most vulnerable groups. 9. Regular, comprehensive and systematic analysis to better understand the combined
impact of tax collection and government expenditure on income inequality and poverty across countries must be invested in with a specific focus on the implications to the education sector, and the most disadvantaged children.
10. Scaling up investment to institutionalize country level data tools needed to track who
the disadvantaged are and where funding for education comes from in a timely and systematic manner. Rolling out National Education Accounts and linking this to high-level policy decisions for the education sector must be prioritized.

49
Conclusion At the turn of the millennia when the Millennium Development Goals were set, much of the discussion centered on education inequalities between countries. While this remains important, the high rates of growth that many countries once classed as “low-income” have witnessed over the last 15 years – accompanied with widening inequalities in-country – mean that equal, if not greater, attention must be given towards reducing and, indeed, reversing in-country inequalities in education. If the universality of the SDG goals on education are to be realistically achieved between now and 2030, action is needed now on government policies regarding equitable resource mobilization and government expenditure. This paper has pointed to three very distinct but complementary ways which tax systems and government spending must do more to ensure no one is left behind. Firstly, governments must commit to ensuring that beyond collecting a minimum of 20% of GDP in tax revenue, tax bases are diversified towards progressive taxes which redistribute wealth and do not in the process hurt the poor and disadvantaged. Secondly, governments must ensure that they keep to the Incheon Declaration adopted at the 2015 World Education Forum that a minimum level of the government budget is spent on education (15-20%), but go beyond this to ensure the resources target those areas of education most likely to accessed by the disadvantaged. Thirdly, education expenditure and other expenditure on public services must be complemented with targeted cash transfers to the most vulnerable households to help mitigate long-standing historical disadvantage. These recommendations cannot be institutionalized and enforced without investment in the data needs to implement and track progress. Accurate and publically available information remains vital to pinpoint where the poorest and disadvantaged are situated at the sub-national level, where current expenditure on education is coming from and what it is currently being spent on. As it stands governments, donors and other policy-makers in the education community are hindered in their full understanding of these issues due to the lack of timely, accurate and transparent data. Investment in institutionalizing National Education Accounts needs to be a priority in order to ensure the effective execution of the recommendations on progressive taxation, education expenditure and targeting of resources to those who need them most.

50
References Accountability Initiative (2012), Do Schools Get Their Money? PAISA 2012, Accountability Initiative, New Delhi. http://papers.ssrn.com/sol3/papers.cfm?abstract_id=2399751 Accountability Initiative (2014), Do Schools Get Their Money? PAISA 2014, Accountability Initiative, New Delhi. http://accountabilityindia.in/paisa/study/download/170 AFRODAD (2011), What has tax got to do with development: A critical look at Mozambique’s Tax System, African Forum and Network on Debt and Development, Harare. https://afrodad.files.wordpress.com/2013/10/what-has-tax-got-to-do-with-development-mozambique1.pdf Aiyar, Y., Dongre, A., Kapur, A. Mukherjee, A. and Raghunandan, T. (2013), Rules vs Responsiveness: Towards Building an Outcome Focussed Approach to Governing Elementary Education Finances in India, Accountability Initiative, New Delhi. http://accountabilityindia.in/sites/default/files/rules_vs_responsiveness_7.5.15_revised2_0.pdf Ali, S. (2015). Development, Poverty, and Power in Pakistan: The impact of state and donor interventions on farmers. Routledge Press. http://www.kspjournals.org/index.php/JEB/article/view/210 Alkire, S. and G. Robles (2015), Multidimensional Poverty Index 2015: Brief Methodological Note and Results, Oxford Poverty and Human Development Initiative, University of Oxford. http://www.ophi.org.uk/wp-content/uploads/MPI-2015-Brief-Methodological-Note_June.pdf Archer, D, Curtis, M. and Pereira, J. (2016), Domestic Tax and Education, Background paper prepared for The International Commission on Financing Global Education, ActionAid Arnson, C. and Bergman, M. (2012), Taxation and Equality in Latin America, Woodrow Wilson International Center for Scholars, Washington D.C. https://www.wilsoncenter.org/sites/default/files/Taxation_0.pdf Arunatilake, N. and Jayawardena, P. (2013), School Funding Formulas in Sri Lanka. Background paper prepared for the Education for All Global Monitoring Report 2013/14, United Nations Educational, Scientific and Cultural Organization, Paris. http://unesdoc.unesco.org/images/0022/002259/225944E.pdf Asad, M. and Chaudhury, N. (2009), Holy alliances: Public subsidies, Islamic high schools, and female schooling in Bangladesh, Education Economics, Volume 17, Number 3, Pages 377-394. http://www.tandfonline.com/doi/pdf/10.1080/09645290903142593 Baird, S., Ferreira, F., Ozler, B. and Woolcock, M. (2013), Relative effectiveness and cost-effectiveness of conditional and unconditional cash transfers for schooling outcomes in developing countries: a systematic review, Systematic Reviews, Pages 1-124. http://www.3ieimpact.org/en/evidence/systematic-reviews/details/158/ Bari, F. and Malik, R. (2016), Raising domestic resources for equitable education in Pakistan, Background paper prepared for The International Commission on Financing Global Education, IDEAS Pakistan. Bastagli, F. (2010), Poverty, inequality and public cash transfers: lessons from Latin America, Background Paper for the European Report on Development (ERD) 2010 on Social Protection for Inclusive Development, European University Institute, Florence. http://eprints.lse.ac.uk/36840/1/Poverty%20inequality%20and%20public%20cash%20transfers%20(lsero).pdf Bastagli, F., Coady, D. and Gupta, S. (2012), Income Inequality and Fiscal Policy, International Monetary Fund, Washington D.C. https://www.imf.org/external/pubs/ft/sdn/2012/sdn1208.pdf Bruns, B., Evans, D. and Luque, J. (2012), Achieving World-Class Education in Brazil, World Bank, Washington D.C. https://openknowledge.worldbank.org/bitstream/handle/10986/2383/656590REPLACEM0hieving0World0Class0.pdf?sequence=1 Buckup, S. (2009), The price of exclusion: The economic consequences of excluding people with disabilities from the world of work, Employment Working Paper No. 43, International Labour Organization, Geneva. http://www.ilo.org/wcmsp5/groups/public/---ed_emp/---ifp_skills/documents/publication/wcms_119305.pdf
51
Center on Philanthropy (2007), Bank of America Study of High Net-Worth Philanthropy: Portraits of Donors, Indiana University, Indianapolis. http://newsroom.bankofamerica.com/files/press_kit/additional/BAC_Portraits_of_Donors_Report_12-07-07.pdf Chawla, D. and Forbes, P. (2010), Promoting Accountability and Enhancing Efficiency: Using National Education Accounts to Track Expenditure Flows, Creative Associates International, Washington D.C. http://files.eric.ed.gov/fulltext/ED514809.pdf Clements, B., Mooji, R., Gupta, S. and Keen, M. (2015), Inequality and Fiscal Policy, International Monetary Fund, Washington D.C. Coady, D., Grosh, M. and Hoddinott, J. (2004), Targeting of transfers in developing countries: Review of lessons and experiences, World Bank, Washington D.C. http://siteresources.worldbank.org/SAFETYNETSANDTRANSFERS/Resources/281945-1138140795625/Targeting_En.pdf Credit Suisse (2015), Global Wealth Databook, Credit Suisse Research Institute, Zurich. https://publications.credit-suisse.com/tasks/render/file/?fileID=F2425415-DCA7-80B8-EAD989AF9341D47E Da Cruz, H., Luque, A. and Teixeira, A. (2015), Challenges in the Funding Model of State Universities of Sao Paulo, International Journal of Economics, Finance and Management Sciences, Volume 3, Issue 3, Pages 148-155. http://article.sciencepublishinggroup.com/pdf/10.11648.j.ijefm.20150303.11.pdf Development Initiatives (2016a), Aiding domestic revenue mobilization, Development Initiatives, Bristol. http://devinit.org/wp-content/uploads/2016/04/Aiding-domestic-revenue-mobilisation_report.pdf Development Initiatives (2016b), Foreign aid and stimulating domestic revenue mobilization in Uganda and Kenya, Development Initiatives, Bristol. http://devinit.org/wp-content/uploads/2016/05/Foreign-aid-and-stimulating-domestic-revenue-mobilisation-in-Uganda-and-Kenya-Discussion-Paper-May-2016.pdf DiJohn, J. (2010), Taxation, Resource Mobilisation and State Performance, Working Paper no,84, Crisis States Research Centre. http://www2.lse.ac.uk/internationalDevelopment/research/crisisStates/download/wp/wpSeries2/WP842.pdf Dixon, P. (2015), Extending Choices and Access for the Poorest to Low Cost Private Schools in India and Africa, School of Education, Communication and Language Sciences, University of Newcastle. https://blogs.ncl.ac.uk/nisr/2015/03/17/extending-choices-and-access-for-the-poorest-to-low-cost-private-schools-in-india-and-africa/ Dongre, A., Kapur, A. and Tewary, V. (2014), How much does India spend per student on elementary education? Accountability Initiative, New Delhi. http://accountabilityindia.in/sites/default/files/working_paper_series1.pdf Fenochietto, R. and Pessino, C. (2013), Understanding Countries’ Tax Effort, International Monetary Fund, Washington D.C. https://www.imf.org/external/pubs/ft/wp/2013/wp13244.pdf Fjeldstad, O., and Heggstad, K. (2012). Building taxpayer culture in Mozambique, Tanzania and Zambia: Achievements, challenges and policy recommendations, CHR. Michelsen Institute. http://www.cmi.no/publications/file/4499-building-taxpayer-culture-in-mozambique.pdf Filmer, D. (2008), Disability, Poverty and Schooling in Developing Countries: Results from 14 Household Surveys, Volume 22, Number 1, PP. 141-163, World Bank Economic Review. http://www-wds.worldbank.org/external/default/WDSContentServer/WDSP/IB/2013/05/27/000445729_20130527161051/Rendered/PDF/775610JRN02008000PUBLIC00Disability.pdf Filmer, D. and Schady, N. (2008), Getting Girls into School: Evidence from a Scholarship Program in Cambodia, Economic Development and Cultural Change, Volume 56, Number 3, Pages 581-617. http://siteresources.worldbank.org/INTPUBSERV/Resources/477250-1186007634742/Filmer&SchadyGettingGirlsSchool.pdf Garcia-Jarmillo, S. and Miranti, R. (2015), Effectiveness of targeting in social protection programs aimed to children: lessons for a post-2015 agenda, Background paper prepared for the Education for All Global Monitoring Report 2015, United Nations Educational, Scientific and Cultural Organization, Paris. http://unesdoc.unesco.org/images/0023/002324/232421e.pdf

52
Getler, P., Patrinos, H. and Rubio-Codina, M. (2012), Empowering parents to improve education: Evidence from rural Mexico, Journal of Development Economics, Volume 99, Issue 1, Pages 68-79. http://siteresources.worldbank.org/EXTHDOFFICE/Resources/5485726-1334870720628/8597105-1334870802493/Mexico_Evaluation_Report.pdf Giese, S., Zide, H., Koch, R. and Hall, K. (2009), A study on the implementation and impact of the No-Fee and Exemption policies, Alliance for Children’s Entitlement to Social Security, Cape Town. Goodfellow, T. (2015), Taxing the Urban Boom: Property Taxation and Land Leasing in Kigali and Addis Ababa, Working Paper 38, International Centre for Tax and Development, Institute of Development Studies, University of Sussex, Brighton. http://www.ictd.ac/publication/2-working-papers/31-taxing-the-urban-boom-property-taxation-and-land-leasing-in-kigali-and-addis-ababa Government of Uganda (2015), Overview of Reforms: Consolidating intergovernmental transfers to local government, Unpublished document, Ministry of Finance, Planning and Economic Development, Kampala. Government of Pakistan (2015), Pakistan Economic Survey 2014-15, Government of Pakistan, Islamabad. http://www.finance.gov.pk/survey/chapters_15/Highlights.pdf Government of Tanzania (2015), Big Results Now: 2013/14 Annual Report, Government of Tanzania, Dar Es Salaam. GPE (2014), Domestic Resource Mobilization: Call for Action, Global Partnership for Education, Brussels. http://www.globalpartnership.org/content/call-action-domestic-resource-mobilisation Granado, J., Coady, D. and Gillingham, R. (2010), The Unequal Benefits of Fuel Subsidies: A Review of Evidence for Developing Countries, International Monetary Fund, Washington D.C. https://www.imf.org/external/pubs/ft/wp/2010/wp10202.pdf Gray, L., Hansen, K., Recica-Kirkbride, P., and Mills, L. (2014), Few and Far: The Hard Facts on Stolen Asset Recovery. World Bank/ Organization for Economic Cooperation and Development, Washington D.C./ Paris. http://star.worldbank.org/star/sites/star/files/few_and_far_the_hard_facts_on_stolen_asset_recovery.pdf Grosh, M., Ninno, E., Tesliuc, E. and Ouerghi, A. (2008), For protection and promotion: the design and implementation of effective safety nets. World Bank, Washington D.C. http://siteresources.worldbank.org/SPLP/Resources/461653-1207162275268/For_Protection_and_Promotion908.pdf Gulasan, N. and Hurley, G. (2015), Financing development through better domestic resource mobilization, United Nations Development Programme, New York. http://www.undp.org/content/undp/en/home/blog/2015/12/22/Financing-development-through-better-domestic-resource-mobilization.html Hall, N. and Mambo, M. (2015), Financing Education in Malawi: Opportunities for Action, Country Case Study for the Oslo Summit on Education. http://reliefweb.int/sites/reliefweb.int/files/resources/malawi.pdf Hardoon, D., Fuentes-Nieva, R. and Ayele, S. (2016), An Economy for the 1%; How privilege and power in the economy drive extreme inequality and how this can be stopped, Oxfam Briefing Paper 210, Oxford. http://policy-practice.oxfam.org.uk/publications/an-economy-for-the-1-how-privilege-and-power-in-the-economy-drive-extreme-inequ-592643 ICTD (2016), ICTD Impact Stories: Bringing Uganda’s Rich into the Tax Net, International Centre for Tax and Development, Institute of Development Studies, University of Sussex, Brighton. http://www.ictd.ac/bringing-uganda-s-rich-into-the-tax-net Ille, S. and Rose, P. (2016a), Is equal access to higher education in South Asia and sub-Saharan Africa achieveable by 2030? Higher Education Volume 72, Issue 4, pp 435–455 Ilie, S. and Rose, P. (2016b), Funding widening participation in higher education: implications for the distribution of public financing in South Asia and sub-Saharan African counties. IMF (2011), Revenue Mobilization in Developing Countries, International Monetary Fund, Washington D.C.

53
https://www.imf.org/external/np/pp/eng/2011/030811.pdf IMF (2014), Fiscal Policy and Income Inequality, International Monetary Fund, Washington D.C. https://www.imf.org/external/np/pp/eng/2014/012314.pdf IMF (2015a), Options for low-income countries’ effective and efficient use of tax incentives for investment, International Monetary Fund, Washington D.C. http://www.imf.org/external/np/g20/pdf/101515.pdf IMF (2015b), Worldwide Government Revenue Database, International Monetary Fund, Washington D.C. http://data.imf.org/?sk=77413F1D-1525-450A-A23A-47AEED40FE78 Jhingran, D. and Sankar, D. (2009), Addressing educational disparity: using district level education development indices for equitable resource allocations in India, World Bank, Washington D.C. http://datatopics.worldbank.org/hnp/files/edstats/INDprwp09.pdf Jibao, S. and Prichard, W. (2013), Rebuilding Local Government Finance After Conflict: The Political Economy of Property Tax Reform in Post-Conflict Sierra Leone, Working Paper 12, International Centre for Tax and Development, Institute of Development Studies, University of Sussex, Brighton. http://www.ictd.ac/publication/2-working-papers/80-rebuilding-local-government-finance-after-conflict-the-political-economy-of-property-tax-reform-in-sierra-leone Johnes, G. (2016), The way schools are funded in England is ripe for reform – here’s why, Lancaster University. http://www.lancaster.ac.uk/lums/news/comment/the-way-schools-are-funded-in-england-is-ripe-for-reform--heres-why/ Kadzamira, E. and Rose, P. (2003), Can free primary education meet the needs of the poor?: evidence from Malawi. International Journal of Educational Development Volume 23, Issue 5, September 2003, Pages 501–516. Kangave, J., Nakato, S., Waiswa, R. and Zzimbe, P. (2016), Boosting Revenue Collection through Taxing High Net Worth Individuals: The Case of Uganda, Working Paper 45, International Centre for Tax and Development, Institute of Development Studies, University of Sussex, Brighton. http://www.ictd.ac/publication/2-working-papers/98-boosting-revenue-collection-through-taxing-high-net-worth-individuals-the-case-of-uganda Kar, D. and Spanjers, J. (2015), Illicit Financial Flows from Developing Countries: 2004-2013, Global Financial Integrity. http://www.gfintegrity.org/wp-content/uploads/2015/12/IFF-Update_2015-Final.pdf Kumar, C. (2014), Africa rising: Inequalities and the essential role of fair taxation, Tax Justice Network Africa and Christian Aid, London. http://www.christianaid.org.uk/images/Africa-tax-and-inequality-report-Feb2014.pdf Ladd, H. and Fiske, E. (2010), Weighted Student Funding in the Netherlands: A Model for the U.S.? Sanford School of Public Policy, Duke University. http://www.iga.ucdavis.edu/Research/EJS/seminars/Ladd%20paper.pdf Lancet (2014), Global health 2035: a world converging within a generation, The Lancet Commissions. http://www.thelancet.com/pdfs/journals/lancet/PIIS0140-6736(13)62105-4.pdf Le, T., Moreno-Dodson, B. and Bayraktar, N. (2012), Tax Capacity and Tax Effort: Extended Cross-Country Analysis from 1994 to 2009, World Bank, Washington D.C. http://documents.worldbank.org/curated/en/534031468332056098/pdf/wps6252.pdf Le Blanc, D. (2014), Towards integration at last? The sustainable development goals as a network of targets, Working Paper No. 141, United Nations Department of Economic & Social Affairs, New York. http://www.un.org/esa/desa/papers/2015/wp141_2015.pdf Levacic, R. (2014), Using quantitative data in World Bank per-student funding reform projects: data, designs and dilemmas in transition countries, Comparative Education, Volume 50, Issue 3, Pages 340-356. http://www.tandfonline.com/doi/abs/10.1080/03050068.2014.921373#.V3JdJtL5OUk Lustig, N. (2012), Taxes, Transfers, and Income Redistribution in Latin America, Inequality in Focus Volume 1, Issue 2, World Bank, Washington D.C. http://siteresources.worldbank.org/EXTPOVERTY/Resources/InequalityInFocusJuly2012FINAL.pdf Lustig, N. (2015), The Redistributive Impact of Government Spending on Education and Health: Evidence from Thirteen Developing Countries in the Commitment to Equity Project, Commitment to Equity Institute, Working Paper 30, Tulane University.

54
http://www.commitmentoequity.org/publications_files/Comparative/CEQWPNo30%20RedisImpactGovntSpendEducHealth%20March%202015.pdf Lustig, N., Pessino, C. and Scott, J. (2013), The impact of taxes and social spending on inequality and poverty in Argentina, Bolivia, Brazil, Mexico, Peru and Uruguay: An overview, Commitment to Equity Institute, Working Paper 13, Tulane University. http://www.commitmentoequity.org/publications_files/CEQWPNo13%20Lustig%20et%20al.%20Overview%20Arg,Bol,Bra,Mex,Per,Ury%20April%202013.pdf Maeda, A., Harrit, M., Mabuchi, S., Siadat, B. and Nagpal, S. (2012), Creating Evidence for Better Health Financing Decisions: A Strategic Guide for the Institutionalization of National Health Accounts, World Bank, Washington D.C. https://openknowledge.worldbank.org/handle/10986/13141 Makwana, R. (2011), Poor Education for Poor: Can Vouchers Be the Answer in Gujarat, India, Journal of Alternative Perspectives in the Social Sciences, Volume 11, Number 3, Pages 721-742. http://www.japss.org/upload/12.Makwana.pdf Malik, R. and Rose, P. (2015), Financing Education in Pakistan: Opportunities for Action, Country Case Study for the Oslo Summit on Education, IDEAS Pakistan and University of Cambridge. http://reliefweb.int/sites/reliefweb.int/files/resources/pakista.pdf Martinez-Vazquez, J., Moreno-Dodson, B. and Vulovic, V. (2012), The Impact of Tax and Expenditure Policies on Income Distribution: Evidence from a Large Panel of Countries, Andrew Young School of Policy Studies Research Paper Series. http://scholarworks.gsu.edu/cgi/viewcontent.cgi?article=1036&context=econ_facpub McCluskey, R. (2016), African governments aren’t taxing the rich. Why they should. The Conversation. https://theconversation.com/african-governments-arent-taxing-the-rich-why-they-should-57162 Mestry, R. (2014), A critical analysis of the National Norms and Standards for Social Funding policy: Implications for social justice and equality in South Africa, Educational Management Administration & Leadership, Volume 42, Pages 851-867. http://www.ajol.info/index.php/saje/article/view/107404/97285 Mestry, R. and Ndhlovu, R. (2014), The implications of the National Norms and Standards for School Funding policy on equity in South African public schools, South African Journal of Education, Volume 34, Number 3. http://www.scielo.org.za/pdf/saje/v34n3/02.pdf Motala, S. and Sayed, Y. (2012), Finding Place and Keeping Pace: Exploring Meaningful and Equitable Learning in Southern African Schools Moore, M. (2015), The Sustainable Development Goals – Reject Tax Targeting, Institute of Development Studies, University of Sussex, Brighton. http://www.ids.ac.uk/opinion/the-sustainable-development-goals-reject-tax-targeting Morrissey, O. (2013), Tax incidence in low-income countries, Overseas Development Institute, London. https://www.odi.org/sites/odi.org.uk/files/odi-assets/events-documents/5045.pdf Muheya, G. (2016), Ex-university students owe Malawi govt K.17bn in unpaid loans, Nyasa Times. Mukherjee, A. (2016), Financing Access and Outcomes in Education: Lessons from India’s Experience in the Post-MDG period, Background paper prepared for The International Commission on Financing Global Education, Center for Global Development, Washington D.C. Mukhtar, H. and Nasim, A. (2016), Agricultural Taxation in Punjab: The Missing Billions, Working Paper Number 01-16, Institute of Development and Economic Alternatives. http://ideaspak.org/wp-content/uploads/2016/03/AIT_Paper_Final_2016.pdf Nampota, D. and Chiwaula, L. (2014), The Use and Usefulness of School Grants: Lessons from Malawi, United Nations Educational, Scientific and Cultural Organization-International Institute for Educational Planning, Paris. http://unesdoc.unesco.org/images/0022/002282/228286E.pdf Njihia, M. and Nderitu, J. (2014), The Use and Usefulness of School Grants: Lessons from Kenya, United Nations Educational, Scientific and Cultural Organization-International Institute for Educational Planning, Paris. http://unesdoc.unesco.org/images/0022/002282/228289E.pdf

55
Norregaard, J. (2013), Taxing Immoveable Property: Revenue Potential and Implementation Challenges, International Monetary Fund, Washington D.C. https://www.imf.org/external/pubs/ft/wp/2013/wp13129.pdf OECD (n.d.), Strengthening Tax Systems to Mobilise Domestic Resources in the Post-2015 Development Agenda, Organization for Economic Cooperation and Development, Paris. https://www.oecd.org/dac/Post%202015%20Domestic%20Resource%20Mobilisation.pdf OECD (2013), Tax and Development: Aid Modalities for Strengthening Tax Systems, Organization for Economic Cooperation and Development, Paris. http://www.oecd.org/officialdocuments/publicdisplaydocumentpdf/?cote=DCD/DAC(2012)34&docLanguage=En OECD (2014), Development Cooperation Report 2014: Mobilising Resources for Sustainable Development, Organization for Economic Cooperation and Development, Paris. http://www.oecd-ilibrary.org/docserver/download/4314031e.pdf?expires=1466182735&id=id&accname=guest&checksum=7E9E28779608AF67959FB64A0AED183A Ohba, A (2009), Does free secondary education enable the poor to gain access? A study from rural Kenya, Centre for International Education, Sussex School of Education, University of Sussex, Brighton. http://www.create-rpc.org/pdf_documents/PTA21.pdf Pessino, C., and Fenochietto, R. (2010), Determining Countries’ Tax Effort, Econometrica, Volume 64, Pages 69-85. http://papers.ssrn.com/sol3/papers.cfm?abstract_id=2140805 Peter, K., Buttrick, S. and Duncan, D. (2010), Global Reform of personal income taxation, 1981-2005: evidence from 189 countries. National Tax Journal, Volume 63, Pages 447-478. http://ftp.iza.org/dp4228.pdf Piketty, T. and Qian, N. (2009), Income Inequality and Progressive Income Taxation in China and India 1986-2015, American Economic Journal, Volume 1, Issue 2, Pages 53-63. http://piketty.pse.ens.fr/fichiers/public/PikettyQian2009_AEJPP.pdf Poisson, M. (2014), Achieving transparency in pro-poor education incentives, United Nations Educational, Scientific and Cultural Organization-International Institute for Educational Planning, Paris. http://unesdoc.unesco.org/images/0022/002269/226982e.pdf PREAL and Lemann Foundation (2009), Overcoming Inertia? A Report Card on Education in Brazil, Partnership for Educational Revitalization in the Americas. Lemann Foundation, Washington D.C./ Sao Paulo. http://pdf.usaid.gov/pdf_docs/PBAAC246.pdf Prichard, W. (2010), Taxation and State Building: Towards a Governance Focused Tax Reform Agenda, Working Paper, Volume 2010, No. 341, Institute of Development Studies, University of Sussex, Brighton. http://www.ids.ac.uk/files/dmfile/Wp341.pdf R4D (2015), Financing Upper Secondary Education: Unlocking 12 Years of Education for All, Results for Development Institute and Malala Fund. http://www.resultsfordevelopment.org/sites/resultsfordevelopment.org/files/resources/Financing%20Upper%20Secondary%20Education_0.pdf REAL Centre (2016), Overcoming inequalities within countries to achieve global convergence in learning, Background paper for the International Commission on Financing Global Education Opportunity. Reich, R. (2011), Towards a Political Theory of Philanthropy, Department of Political Science, Stanford University. http://pacscenter.stanford.edu/sites/all/files/images/reich-toward-a-political-theory-of-philanthropy.pdf Republic of Ecuador (2008), Constitution of the Republic of Ecuador, Political Database of the Americas. http://pdba.georgetown.edu/Constitutions/Ecuador/english08.html Rose, P. (2015), Three lessons for educational quality in post-2015 goals and targets: Clarity, measurability and equity, International Journal of Educational Development, Volume 40, Pages 289-296. http://ac.els-cdn.com/S073805931400114X/1-s2.0-S073805931400114X-main.pdf?_tid=5c6ebd64-34b0-11e6-bae8-00000aacb35f&acdnat=1466184455_b7ed3354684ff44b0bc99c7abe826cc3

56
Rose, P., & Alcott, B. (2015). How can education systems become equitable by 2030? DFID think pieces – Learning and equity. Report prepared for UK Department for International Development. Oxford, UK: Health & Education Advice and Resource Team. Runde, D., Savoy, C. and Perkins, C. (2014), Taxes and Development: The Promise of Domestic Resource Mobilization, Center for Strategic and International Studies, New York. https://csis-prod.s3.amazonaws.com/s3fs-public/legacy_files/files/publication/141203_Savoy_TaxesDevelopment_Web.pdf Saavedra, J. and Garcia, S. (2013), Educational Impacts and Cost-Effectiveness of Conditional Cash Transfer Programs in Developing Countries: A Meta-Analysis, CSER Working Paper No. 2013-007. http://papers.ssrn.com/sol3/papers.cfm?abstract_id=2333946 Sæbønes, A., Bieler, R., Baboo, N., Banham, L., Singal, N., Howgego, C., McClain-Nhlapo, C., Riis-Hansen, T., and Dansie, G.(2015), Towards a Disability Inclusive Education, Background paper for the Oslo Summit on Education. http://www.osloeducationsummit.no/pop.cfm?FuseAction=Doc&pAction=View&pDocumentId=63386 Save the Children (2014), More is Not Enough: Achieving Equity in Domestic Education Financing, Save the Children, Norway, https://www.savethechildren.nl/Uploaded_files/Publicaties/more-is-not-enough.pdf Sayed, Y. and Motala, S. (2012). Equity and 'No Fee' Schools in South Africa: Challenges and Prospects, Social Policy and Administration Volume 46, Number 6, Pages 672-87. http://onlinelibrary.wiley.com/doi/10.1111/j.1467-9515.2012.00862.x/pdf Schmidt-Traub, G. and Sachs, J. (2015), Financing Sustainable Development: Implementing the SDGs through Effective Investment Strategies and Partnerships, Sustainable Development Solutions Network, New York. http://unsdsn.org/wp-content/uploads/2015/04/150619-SDSN-Financing-Sustainable-Development-Paper-FINAL-02.pdf Spaul, N. and Kotze, J. (2015) Stating behind and staying behind in South Africa: The insurmountable learning deficits in mathematics, International Journal of Educational Development, Volume 41, Pages 13-24. http://ac.els-cdn.com/S0738059315000036/1-s2.0-S0738059315000036-main.pdf?_tid=593a2ae6-3d31-11e6-9729-00000aacb35d&acdnat=1467119464_ce0db94b2bc90608ed6b4506e3dec05b Statistics South Africa (2014), Poverty Trends in South Africa: An examination of absolute poverty between 2006 and 2011, Pretoria. http://www.statssa.gov.za/publications/Report-03-10-06/Report-03-10-06March2014.pdf Steer, L., Rabbani, F. and Parker, A. (2014), Primary Education Finance for Equity and Quality: An analysis of past success and future options in Bangladesh, Global Economy and Development, Brookings, Washington D.C. http://www.brookings.edu/~/media/research/files/papers/2014/09/primary-education-finance-equity-quality/equity-financing-in-bangladesh-final-v2.pdf Tax Justice Network and ActionAid (2012), Tax competition in East Africa: A race to the bottom? Tax Justice Network Africa and ActionAid International, Nairobi/ Johannesburg. http://www.actionaid.org/sites/files/actionaid/eac_report.pdf Transparency International (2013), Global Corruption Report: Education, Transparency International, Berlin. http://www.transparency.org/gcr_education Ugwuanyi, G. (2014), Taxation and Tertiary Education Enhancement in Nigeria: An Evaluation of the Education Tax Fund (ETF) between 1999-2010, Journal of Economics and Sustainable Development, Volume 5, Number 6. http://www.iiste.org/Journals/index.php/JEDS/article/view/11945 UN (2015), Transforming our world: the 2030 Agenda for Sustainable Development, United Nations, New York. https://sustainabledevelopment.un.org/post2015/transformingourworld/publication UNDP (2010), What Will It Take to Achieve the Millennium Development Goals? An International Assessment, United Nations Development Programme, New York. http://www.unisdr.org/files/14365_UNDPmdgs.pdf UNESCO (2009), Education for All Global Monitoring Report 2009: Overcoming inequality – Why governance matters, Paris, United Nations Educational, Scientific and Cultural Organization, Paris. http://unesdoc.unesco.org/images/0017/001776/177683e.pdf

57
UNESCO (2011), Can school grants lead to school improvement? An overview of experiences of five countries, United Nations Educational, Scientific and Cultural Organization-International Institute for Educational Planning, Paris. http://www.iiep.unesco.org/sites/default/files/school_grants_synthesis_working-paper.pdf UNESCO (2012), Education for All Global Monitoring Report 2012: Youth and skills – Putting education to work, United Nations Educational, Scientific and Cultural Organization, Paris. http://unesdoc.unesco.org/images/0021/002180/218003e.pdf UNESCO (2014), Education for All Global Monitoring Report 2013/14: Teaching and Learning – Achieving Quality for All, United Nations Educational, Scientific and Cultural Organization, Paris. http://unesdoc.unesco.org/images/0022/002256/225660e.pdf UNESCO (2015a), Pricing the right to education: The cost of reaching new targets by 2030, United Nations Educational, Scientific and Cultural Organization, Paris. http://unesdoc.unesco.org/images/0023/002321/232197E.pdf UNESCO (2015b), Education for All Global Monitoring Report 2015: Education for All 2000-2015: Achievements and Challenges, United Nations Educational, Scientific and Cultural Organization, Paris. http://unesdoc.unesco.org/images/0023/002322/232205e.pdf UNESCO et al. (2015). Education 2030 Incheon Declaration and Framework for Action: Towards inclusive and equitable quality education and lifelong learning for all. United Nations Education Science and Cultural Organisation, Paris. http://www.uis.unesco.org/Education/Documents/education_2030_incheon_declaration_en.pdf UNESCO-UIS (2011), Financing Education in sub-Saharan Africa: Meeting the Challenges of Expansion, Equity and Quality, United Nations Educational, Scientific and Cultural Organization, Montreal. http://unesdoc.unesco.org/images/0019/001921/192186e.pdf UNESCO-UIS (2016), Data Centre, United Nations Educational, Scientific and Cultural Organization, Montreal. http://www.uis.unesco.org/datacentre/pages/default.aspx UNESCO Pole de Dakar (2012), Household Education Spending: An Analytical and Comparative Perspective for 15 African Countries, UNESCO-BREDA, Dakar. http://www.uis.unesco.org/Library/Documents/household-education-spending-analytical-comparitive-perspective-15-african-countries-2012-en.pdf UNICEF (2011), Multiple Indicator Cluster Survey: Nigeria, United Nations Children’s Fund, New York. http://www.unicef.org/nigeria/Multiple_Indicators_Cluster_Survey_4_Report.pdf UNICEF (2014), Multiple Indicator Cluster Survey: Nepal, United Nations Children’s Fund, New York. http://unicef.org.np/uploads/files/597341286609672028-final-report-nmics-2014-english.pdf UNICEF (2015a), Multiple Indicator Cluster Survey: Malawi MDG Endline Survey, United Nations Children’s Fund, New York. https://mics-surveys-prod.s3.amazonaws.com/MICS5/Eastern%20and%20Southern%20Africa/Malawi/2013-2014/Final/Malawi%202013-14%20MICS%20%28MDG%20Endline%20Survey%29_English.pdf UNICEF (2015b), The Investment Case for Education and Equity, United Nations Children’s Fund, New York. http://www.unicef.org/publications/files/Investment_Case_for_Education_and_Equity_FINAL.pdf UNICEF (2015c),Simulations for Equity in Education (SEE), United Nations Children’s Fund, New York. http://www.unicef.org/education/bege_SEE.html Van Fleet, J. (2012), Private Philanthropy & Social Investments in Support of Education for All, Background paper prepared for the Education for All Global Monitoring Report 2012, United Nations Educational, Scientific and Cultural Organization, Paris. http://unesdoc.unesco.org/images/0021/002179/217920E.pdf Wanna, L. and Chalchisa, D. (2012), Cost Sharing in Public Higher Education Institutions in Ethiopia with Special Emphasis on Addis Ababa and Adama Universities, Forum for Social Studies, Addis Ababa. Watkins, K. and Alemayehu, W. (2012), Financing for a fairer, more prosperous Kenya: A review of the public spending challenges and options for selected arid and semi-arid counties, Center for Universal Education, Brookings, Washington D.C.

58
http://www.brookings.edu/~/media/research/files/reports/2012/8/08-financing-kenya-watkins.pdf Woodhall, M. (2007), Funding Higher Education: The Contribution of Economic Thinking to Debate and Policy Development, World Bank, Washington D.C. http://siteresources.worldbank.org/EDUCATION/Resources/278200-1099079877269/547664-1099079956815/Funding_HigherEd_wps8.pdf World Bank (2001), Engendering Development: Through Gender Equality in Rights, Resources, and Voice, World Bank, Washington D.C. http://siteresources.worldbank.org/PGLP/Resources/Engendering_Development.pdf World Bank (2006). Utilization of Repatriated Abacha Loot: Results of the Field Monitoring Exercise, World Bank, Washington D.C. http://siteresources.worldbank.org/INTNIGERIA/Resources/Abacha_Funds_Monitoring_1221.pdf World Bank (2009), Abolishing School Fees in Africa: Lessons from Ethiopia, Ghana, Kenya, Malawi and Mozambique, World Bank, Washington D.C. http://www.unicef.org/publications/files/Aboloshing_School_Fees_in_Africa.pdf World Bank (2010), Financing Higher Education in Africa, World Bank, Washington D.C. http://www-wds.worldbank.org/external/default/WDSContentServer/WDSP/IB/2010/05/11/000333037_20100511005406/Rendered/PDF/544410PUB0EPI01BOX0349416B01PUBLIC1.pdf World Bank (2012), Pakistan – Tax Administration Reform Project, World Bank, Washington D.C. http://www-wds.worldbank.org/external/default/WDSContentServer/WDSP/IB/2012/07/11/000356161_20120711004432/Rendered/PDF/ICR21470P077300LIC0dislosed07090120.pdf World Bank (2013a), Financing for Development Post-2015, World Bank, Washington D.C. https://www.worldbank.org/content/dam/Worldbank/document/Poverty%20documents/WB-PREM%20financing-for-development-pub-10-11-13web.pdf World Bank (2013b), Spending more or spending better: Improving education financing in Indonesia, World Bank, Washington D.C. https://openknowledge.worldbank.org/handle/10986/13207 World Bank (2015a), Improving Learning Outcomes through Early Childhood Development, World Bank, Washington D.C. http://www-wds.worldbank.org/external/default/WDSContentServer/WDSP/IB/2015/09/30/090224b083111ac3/3_0/Rendered/PDF/Improving0lear0hildhood0development.pdf World Bank (2015b), The State of Social Safety Nets 2015, World Bank, Washington D.C. http://www-wds.worldbank.org/external/default/WDSContentServer/WDSP/IB/2015/10/29/090224b083179357/3_0/Rendered/PDF/The0state0of0social0safety0nets02015.pdf World Bank (2015c), Ethiopia Poverty Assessment 2014, World Bank, Washington D.C. https://openknowledge.worldbank.org/handle/10986/21323 World Bank (2016), World Development Indicators, World Bank, Washington D.C. http://databank.worldbank.org/data/reports.aspx?source=world-development-indicators Younger, S, Myamba, F. and Mdadila, K. (2016), Fiscal Incidence in Tanzania, Commitment to Equity Institute, Working Paper 16, Tulane University. http://www.commitmentoequity.org/publications_files/Tanzania/CEQ_WP36_Fiscal_Incidence_Tanzania_Jan_16_2016.pdf Zida, A., Berone, P and Lorenzetti, L. (2010), Using National Health Accounts to Inform Policy Change in Burkina Faso, Health Systems 20/20, Abt Associates. http://pdf.usaid.gov/pdf_docs/pnaeb930.pdf Zine, J. (2001), Negotiating equity: The dynamics of minority community engagement in constructing inclusive education policy. Cambridge Journal of Education, Volume 31, Number 2, Pages 239-269. http://www.tandfonline.com/doi/pdf/10.1080/0305764012006164
The InternationalCommissionon Financing GlobalEducation Opportunity
educationcommission.org