background paper on occurrence of melamine in foods and feed
TRANSCRIPT
Background Paper on Occurrence of Melamine in Foods and Feed
Prepared for the WHO Expert Meeting on
Toxicological and Health Aspects of Melamine and Cyanuric Acid
In collaboration with FAO Supported by Health Canada
Health Canada, Ottawa, Canada
1–4 December 2008
Prepared by Carla Hilts and Luc Pelletier
Bureau of Chemical Safety, Food Directorate, Health Products and Food Branch, Health Canada, Ottawa, Ontario, Canada
World Health Organization
Geneva, 2009

iii
CONTENTS
1. DEFINITIONS OF BASELINE, ADULTERATION AND MISUSE.............................1
2. POSSIBLE SOURCES OF BASELINE MELAMINE AND CYANURIC ACID IN FOOD........................................................................................................................................1
2.1 MELAMINE-CONTAINING PLASTIC MATERIALS FOR TABLEWARE.....................................1 2.2 MELAMINE OCCURRENCE FROM HERBICIDE/PESTICIDE USE ............................................3 2.3 MELAMINE IN FERTILIZERS .............................................................................................5 2.4 OTHER SOURCES OF MELAMINE.......................................................................................5 2.5 SOURCES OF CYANURIC ACID, AMMELINE AND AMMELIDE..............................................6
3. MELAMINE CONTAMINATION (ADULTERATION)................................................6 3.1 PET FOOD INCIDENT: 2007 ..............................................................................................7 3.2 THE ADDITION OF MELAMINE AND RELATED ANALOGUES TO FEED .................................7
3.2.1 Feed incident: 2007 ...............................................................................................7 3.2.2 Other occurrences of melamine in feed ...............................................................10
3.3 MELAMINE-CONTAMINATED MILK INCIDENT IN CHINA: 2008.......................................11 3.4 NATIONAL MONITORING AND SURVEILLANCE DATA .....................................................12
3.4.1 Australia...............................................................................................................13 3.4.2 New Zealand ........................................................................................................14 3.4.3 Japan....................................................................................................................14 3.4.4 Republic of Korea ................................................................................................14 3.4.5 Taiwan, China......................................................................................................15 3.4.6 Canada.................................................................................................................15 3.4.7 United States of America .....................................................................................16 3.4.8 European Union...................................................................................................16 3.4.9 International Food Safety Authorities Network (INFOSAN)...............................17
4. RECOMMENDATIONS AND FUTURE WORK .........................................................18 4.1 RECOMMENDATIONS FOR DATA COLLECTION AND REPORTING .....................................18 4.2 RECOMMENDATIONS FOR FUTURE WORK ......................................................................18
5. REFERENCES...................................................................................................................18
APPENDIX 1. SUMMARY OF OCCURRENCE DATA ON MELAMINE AND RELATED ANALOGUES BY COUNTRY AND FOOD CATEGORY FOR COMPLETE DATA SETS IN WHICH BOTH POSITIVE AND NEGATIVE DETERMINATIONS WERE INCLUDED.........................................................................25
APPENDIX 2. SUMMARY OF POSITIVE OCCURRENCES OF MELAMINE REPORTED TO INFOSAN AND THROUGH THE EUROPEAN RAPID ALERT SYSTEM FOR FOOD AND FEED......................................................................................36
APPENDIX 3. SUMMARY OF OCCURRENCE DATA ON MELAMINE FOR DAIRY PRODUCTS AND OTHER FOODS CONTAINING MILK INGREDIENTS REPORTED TO THE CONFEDERATION OF FOOD AND DRINK INDUSTRIES OF THE EU (CIAA).....................................................................................................................40

1
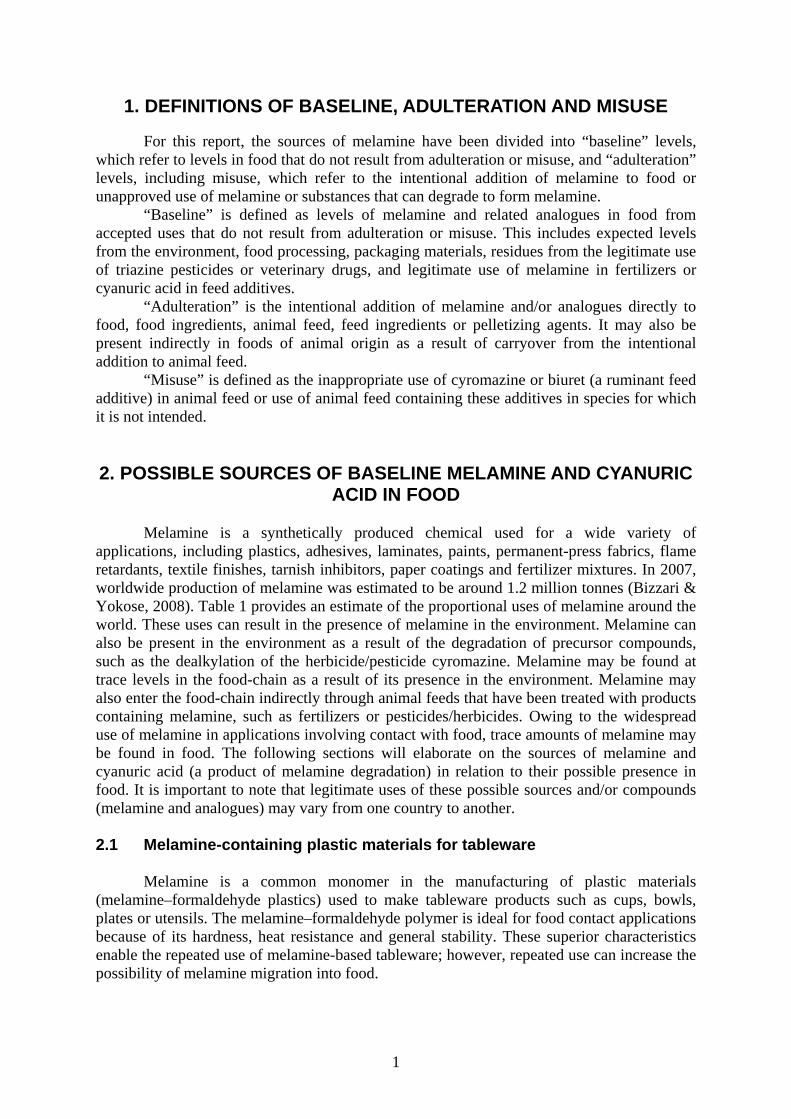
1. DEFINITIONS OF BASELINE, ADULTERATION AND MISUSE
For this report, the sources of melamine have been divided into “baseline” levels, which refer to levels in food that do not result from adulteration or misuse, and “adulteration” levels, including misuse, which refer to the intentional addition of melamine to food or unapproved use of melamine or substances that can degrade to form melamine.
“Baseline” is defined as levels of melamine and related analogues in food from accepted uses that do not result from adulteration or misuse. This includes expected levels from the environment, food processing, packaging materials, residues from the legitimate use of triazine pesticides or veterinary drugs, and legitimate use of melamine in fertilizers or cyanuric acid in feed additives.
“Adulteration” is the intentional addition of melamine and/or analogues directly to food, food ingredients, animal feed, feed ingredients or pelletizing agents. It may also be present indirectly in foods of animal origin as a result of carryover from the intentional addition to animal feed.
“Misuse” is defined as the inappropriate use of cyromazine or biuret (a ruminant feed additive) in animal feed or use of animal feed containing these additives in species for which it is not intended. 2. POSSIBLE SOURCES OF BASELINE MELAMINE AND CYANURIC
ACID IN FOOD
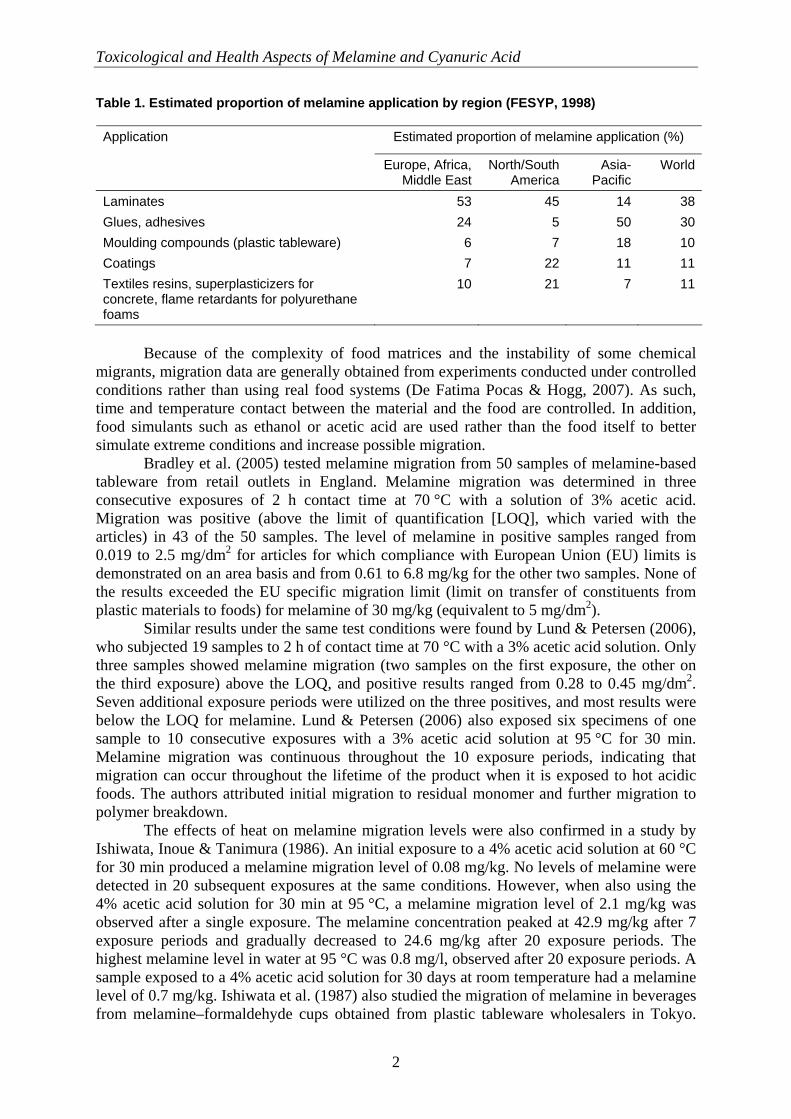
Melamine is a synthetically produced chemical used for a wide variety of applications, including plastics, adhesives, laminates, paints, permanent-press fabrics, flame retardants, textile finishes, tarnish inhibitors, paper coatings and fertilizer mixtures. In 2007, worldwide production of melamine was estimated to be around 1.2 million tonnes (Bizzari & Yokose, 2008). Table 1 provides an estimate of the proportional uses of melamine around the world. These uses can result in the presence of melamine in the environment. Melamine can also be present in the environment as a result of the degradation of precursor compounds, such as the dealkylation of the herbicide/pesticide cyromazine. Melamine may be found at trace levels in the food-chain as a result of its presence in the environment. Melamine may also enter the food-chain indirectly through animal feeds that have been treated with products containing melamine, such as fertilizers or pesticides/herbicides. Owing to the widespread use of melamine in applications involving contact with food, trace amounts of melamine may be found in food. The following sections will elaborate on the sources of melamine and cyanuric acid (a product of melamine degradation) in relation to their possible presence in food. It is important to note that legitimate uses of these possible sources and/or compounds (melamine and analogues) may vary from one country to another. 2.1 Melamine-containing plastic materials for tableware
Melamine is a common monomer in the manufacturing of plastic materials (melamine–formaldehyde plastics) used to make tableware products such as cups, bowls, plates or utensils. The melamine–formaldehyde polymer is ideal for food contact applications because of its hardness, heat resistance and general stability. These superior characteristics enable the repeated use of melamine-based tableware; however, repeated use can increase the possibility of melamine migration into food.
Toxicological and Health Aspects of Melamine and Cyanuric Acid
2
Table 1. Estimated proportion of melamine application by region (FESYP, 1998)
Estimated proportion of melamine application (%) Application
Europe, Africa, Middle East
North/South America
Asia-Pacific
World
Laminates 53 45 14 38Glues, adhesives 24 5 50 30Moulding compounds (plastic tableware) 6 7 18 10Coatings 7 22 11 11Textiles resins, superplasticizers for concrete, flame retardants for polyurethane foams
10 21 7 11
Because of the complexity of food matrices and the instability of some chemical
migrants, migration data are generally obtained from experiments conducted under controlled conditions rather than using real food systems (De Fatima Pocas & Hogg, 2007). As such, time and temperature contact between the material and the food are controlled. In addition, food simulants such as ethanol or acetic acid are used rather than the food itself to better simulate extreme conditions and increase possible migration.
Bradley et al. (2005) tested melamine migration from 50 samples of melamine-based tableware from retail outlets in England. Melamine migration was determined in three consecutive exposures of 2 h contact time at 70 °C with a solution of 3% acetic acid. Migration was positive (above the limit of quantification [LOQ], which varied with the articles) in 43 of the 50 samples. The level of melamine in positive samples ranged from 0.019 to 2.5 mg/dm2 for articles for which compliance with European Union (EU) limits is demonstrated on an area basis and from 0.61 to 6.8 mg/kg for the other two samples. None of the results exceeded the EU specific migration limit (limit on transfer of constituents from plastic materials to foods) for melamine of 30 mg/kg (equivalent to 5 mg/dm2).
Similar results under the same test conditions were found by Lund & Petersen (2006), who subjected 19 samples to 2 h of contact time at 70 °C with a 3% acetic acid solution. Only three samples showed melamine migration (two samples on the first exposure, the other on the third exposure) above the LOQ, and positive results ranged from 0.28 to 0.45 mg/dm2. Seven additional exposure periods were utilized on the three positives, and most results were below the LOQ for melamine. Lund & Petersen (2006) also exposed six specimens of one sample to 10 consecutive exposures with a 3% acetic acid solution at 95 °C for 30 min. Melamine migration was continuous throughout the 10 exposure periods, indicating that migration can occur throughout the lifetime of the product when it is exposed to hot acidic foods. The authors attributed initial migration to residual monomer and further migration to polymer breakdown.
The effects of heat on melamine migration levels were also confirmed in a study by Ishiwata, Inoue & Tanimura (1986). An initial exposure to a 4% acetic acid solution at 60 °C for 30 min produced a melamine migration level of 0.08 mg/kg. No levels of melamine were detected in 20 subsequent exposures at the same conditions. However, when also using the 4% acetic acid solution for 30 min at 95 °C, a melamine migration level of 2.1 mg/kg was observed after a single exposure. The melamine concentration peaked at 42.9 mg/kg after 7 exposure periods and gradually decreased to 24.6 mg/kg after 20 exposure periods. The highest melamine level in water at 95 °C was 0.8 mg/l, observed after 20 exposure periods. A sample exposed to a 4% acetic acid solution for 30 days at room temperature had a melamine level of 0.7 mg/kg. Ishiwata et al. (1987) also studied the migration of melamine in beverages from melamine–formaldehyde cups obtained from plastic tableware wholesalers in Tokyo.
Background Paper: Occurrence of Melamine
3
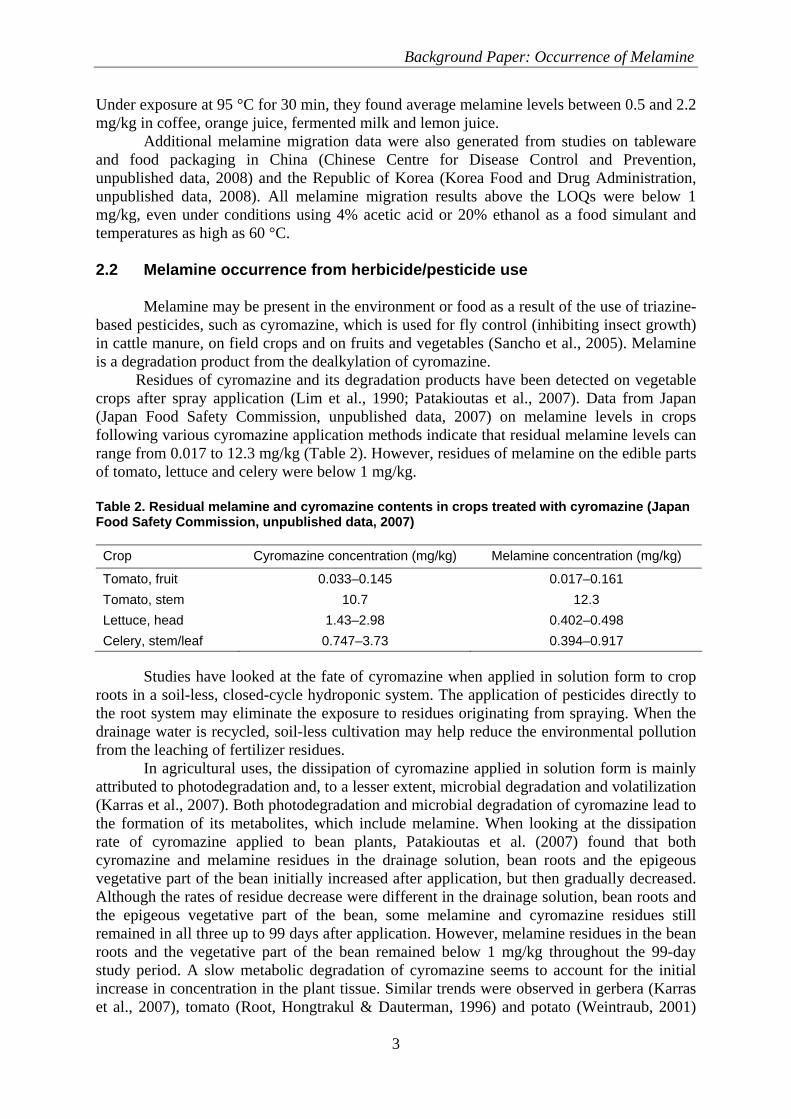
Under exposure at 95 °C for 30 min, they found average melamine levels between 0.5 and 2.2 mg/kg in coffee, orange juice, fermented milk and lemon juice.
Additional melamine migration data were also generated from studies on tableware and food packaging in China (Chinese Centre for Disease Control and Prevention, unpublished data, 2008) and the Republic of Korea (Korea Food and Drug Administration, unpublished data, 2008). All melamine migration results above the LOQs were below 1 mg/kg, even under conditions using 4% acetic acid or 20% ethanol as a food simulant and temperatures as high as 60 °C. 2.2 Melamine occurrence from herbicide/pesticide use
Melamine may be present in the environment or food as a result of the use of triazine-based pesticides, such as cyromazine, which is used for fly control (inhibiting insect growth) in cattle manure, on field crops and on fruits and vegetables (Sancho et al., 2005). Melamine is a degradation product from the dealkylation of cyromazine.
Residues of cyromazine and its degradation products have been detected on vegetable crops after spray application (Lim et al., 1990; Patakioutas et al., 2007). Data from Japan (Japan Food Safety Commission, unpublished data, 2007) on melamine levels in crops following various cyromazine application methods indicate that residual melamine levels can range from 0.017 to 12.3 mg/kg (Table 2). However, residues of melamine on the edible parts of tomato, lettuce and celery were below 1 mg/kg. Table 2. Residual melamine and cyromazine contents in crops treated with cyromazine (Japan Food Safety Commission, unpublished data, 2007) Crop Cyromazine concentration (mg/kg) Melamine concentration (mg/kg)
Tomato, fruit 0.033–0.145 0.017–0.161 Tomato, stem 10.7 12.3 Lettuce, head 1.43–2.98 0.402–0.498 Celery, stem/leaf 0.747–3.73 0.394–0.917
Studies have looked at the fate of cyromazine when applied in solution form to crop
roots in a soil-less, closed-cycle hydroponic system. The application of pesticides directly to the root system may eliminate the exposure to residues originating from spraying. When the drainage water is recycled, soil-less cultivation may help reduce the environmental pollution from the leaching of fertilizer residues.
In agricultural uses, the dissipation of cyromazine applied in solution form is mainly attributed to photodegradation and, to a lesser extent, microbial degradation and volatilization (Karras et al., 2007). Both photodegradation and microbial degradation of cyromazine lead to the formation of its metabolites, which include melamine. When looking at the dissipation rate of cyromazine applied to bean plants, Patakioutas et al. (2007) found that both cyromazine and melamine residues in the drainage solution, bean roots and the epigeous vegetative part of the bean initially increased after application, but then gradually decreased. Although the rates of residue decrease were different in the drainage solution, bean roots and the epigeous vegetative part of the bean, some melamine and cyromazine residues still remained in all three up to 99 days after application. However, melamine residues in the bean roots and the vegetative part of the bean remained below 1 mg/kg throughout the 99-day study period. A slow metabolic degradation of cyromazine seems to account for the initial increase in concentration in the plant tissue. Similar trends were observed in gerbera (Karras et al., 2007), tomato (Root, Hongtrakul & Dauterman, 1996) and potato (Weintraub, 2001)
Toxicological and Health Aspects of Melamine and Cyanuric Acid
4
after a foliar spray application. Slow dissipation in the plant tissue may be advantageous with respect to plant protection, but the lengthy persistence could be a concern for consumer health.
Cyromazine use as a pesticide was also evaluated by the Joint FAO/WHO Meeting on Pesticide Residues (JMPR) in 2007, where maximum residue limits (MRLs) were set for cyromazine in a number of crops and animal products (FAO, 2007). The JMPR has reported that melamine residues are generally ~10% of cyromazine residues, except in edible offal and mushrooms, where residues of melamine were of a similar magnitude to those of cyromazine (USEPA, 1999; FAO, 2007). The United States Environmental Protection Agency (USEPA) has reported that 10% of cyromazine is converted metabolically to melamine in vivo (USEPA, 1999).
Cyromazine is also effective as a feed-through larvicide in poultry (Karras et al., 2007). It is incorporated into feed for laying hens to prevent flies from hatching in the manure. In a study by Chou et al. (2003), a total of 46 samples, consisting of chicken, egg, beef, mutton and pork, were analysed for cyromazine and melamine residue by liquid chromatography. Only one beef sample contained a detectable level of cyromazine (0.04 mg/kg), and no sample contained a detectable level of melamine (>0.02 mg/kg). Combined melamine and cyromazine levels up to 0.25 mg/kg have also been estimated in chicken meat and eggs from hens fed up to 5 mg cyromazine/kg (Meek et al., 2003; EFSA, 2007).
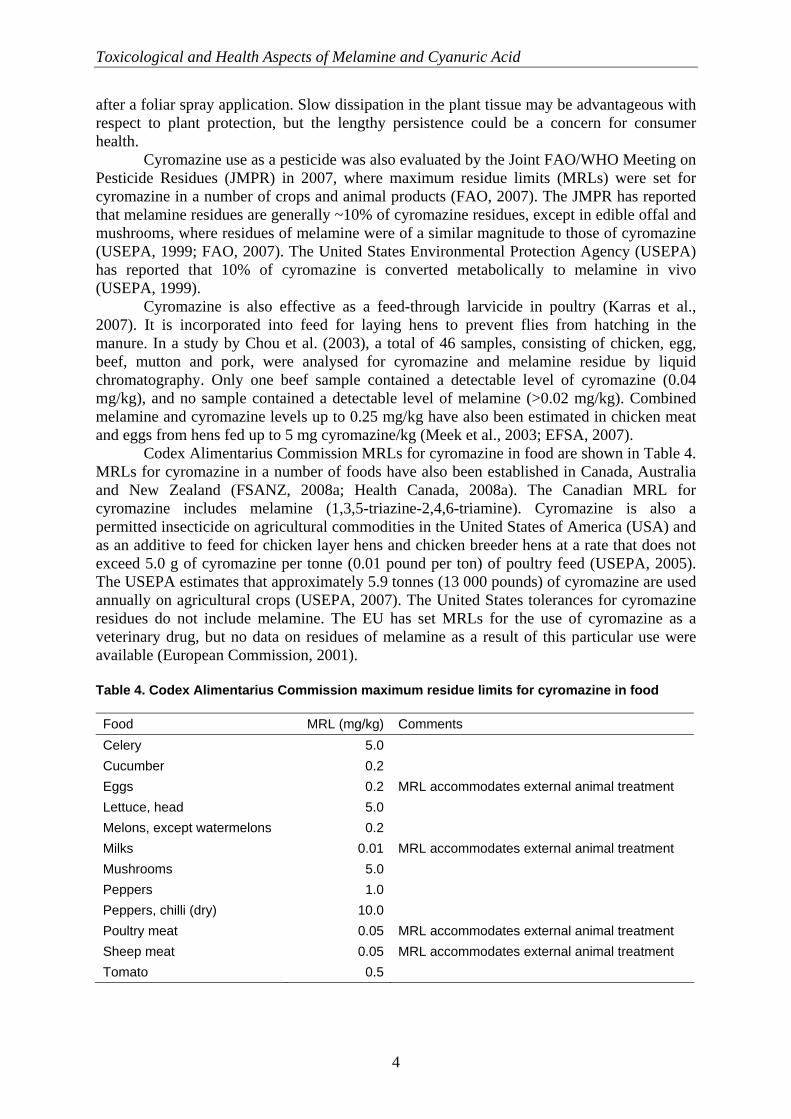
Codex Alimentarius Commission MRLs for cyromazine in food are shown in Table 4. MRLs for cyromazine in a number of foods have also been established in Canada, Australia and New Zealand (FSANZ, 2008a; Health Canada, 2008a). The Canadian MRL for cyromazine includes melamine (1,3,5-triazine-2,4,6-triamine). Cyromazine is also a permitted insecticide on agricultural commodities in the United States of America (USA) and as an additive to feed for chicken layer hens and chicken breeder hens at a rate that does not exceed 5.0 g of cyromazine per tonne (0.01 pound per ton) of poultry feed (USEPA, 2005). The USEPA estimates that approximately 5.9 tonnes (13 000 pounds) of cyromazine are used annually on agricultural crops (USEPA, 2007). The United States tolerances for cyromazine residues do not include melamine. The EU has set MRLs for the use of cyromazine as a veterinary drug, but no data on residues of melamine as a result of this particular use were available (European Commission, 2001). Table 4. Codex Alimentarius Commission maximum residue limits for cyromazine in food Food MRL (mg/kg) Comments Celery 5.0 Cucumber 0.2 Eggs 0.2 MRL accommodates external animal treatment Lettuce, head 5.0 Melons, except watermelons 0.2 Milks 0.01 MRL accommodates external animal treatment Mushrooms 5.0 Peppers 1.0 Peppers, chilli (dry) 10.0 Poultry meat 0.05 MRL accommodates external animal treatment Sheep meat 0.05 MRL accommodates external animal treatment Tomato 0.5
Background Paper: Occurrence of Melamine
5
There have been recent reports of melamine findings in milk, egg and soya products, which may have originated from the animal feed and carried over into the food. However, these occurrences of melamine have not yet been characterized as either adulterations (intentional additions to feed) or baseline levels (residues from the legitimate use of cyromazine as a pesticide or veterinary drug). 2.3 Melamine in fertilizers
Trace amounts of melamine may also occur in food from its addition to various fertilizers. Melamine and other triazine compounds are used as a nitrogen source in slow-release urea-based fertilizer mixtures. Their accumulation and persistence in the environment are well known (El-Sayed, El-Baz & Othman, 2006). Although the levels of melamine occurrence in food as a result of its use in fertilizers are unknown, the increased use of slow-release fertilizers may become a significant source of melamine in food and water. In a study testing melamine for nitrogen release characteristics and response to application on grass, the melamine–urea combination showed significant nitrogen plant uptake (Mosdell, Daniel & Freeborg, 1987). 2.4 Other sources of melamine
Melamine-containing resins are commonly used in the manufacturing of particleboard (Antikainen et al., 2004). In a review of the wood product industry in Finland, Antikainen et al. (2004) estimated that almost 30 000 tonnes of urea–melamine resins are used annually for the production of particleboard and veneer products alone. Industrial production of melamine resins may be an ongoing source of melamine in water and the environment in general. Factories involved in its production estimated that 80–90% of melamine in wastewater effluents is eliminated at the wastewater treatment plant (OECD, 1998). The EU System for the Evaluation of Substances (EUSES) model estimates that the predicted environmental concentration of melamine is 0.003 mg/l in site-specific water (based on estimates of a plant producing 300 tonnes per year) and 0.0042 mg/l in regional water (OECD, 1998). Melamine monitoring data in river water in Japan indicate levels ranging from 0.0001 to 0.0076 mg/l in water, from 0.01 to 0.40 mg/kg in sediment and from 0.02 to 0.55 mg/kg in fish (OECD, 1998). However, these data were considered to be insufficient to estimate possible levels in drinking-water or fish in general.
Efforts to further reduce melamine–formaldehyde residues in wastewater effluents from aminoplastic plants are being investigated (El-Sayed, El-Baz & Othman, 2006). Using bacterial strains that feed off the carbon and nitrogen in the resin, the biodegradation of melamine occurs via stepwise deamination reactions producing intermediates such as ammeline, ammelide and cyanuric acid (El-Sayed, El-Baz & Othman, 2006). Other studies have also identified bacteria and fungi capable of dealkylating s-triazine herbicides such as atrazine, simazine, cyanazine, ametryn and prometryn (Nishimura et al., 2002). Sequestering triazine compounds, using aqueous melamine-based organoclay materials, has emerged as another possible means to reduce residues of melamine from water effluents (Neitsch et al., 2006). However, if the organoclays were unconfined in the natural environment and the clays were to degrade, the nature of the resulting products would need to be characterized.
Trichloromelamine, which readily decomposes to melamine, is permitted for use in the USA and other countries in sanitizing solutions for food-processing equipment, utensils and other food contact articles (with the exception of milk containers or equipment). The United States Food and Drug Administration (USFDA) indicates that melamine residues would be roughly half the trichloromelamine residues. They estimate a dietary concentration
Toxicological and Health Aspects of Melamine and Cyanuric Acid
6
of melamine to be approximately 0.14 mg/kg, assuming that all sanitizers contain trichloromelamine. 2.5 Sources of cyanuric acid, ammeline and ammelide
Melamine can be degraded via deamination reactions to analogues such as ammeline, ammelide and cyanuric acid. Similar to melamine, cyanuric acid can occur as a degradation product of s-triazine pesticides. However, possible occurrence levels of cyanuric acid in food originating from sources similar to melamine are currently unknown.
Trace levels of cyanuric acid can be present in food and water from the potential use of dichloroisocyanurate in drinking-water and water used in food manufacturing, as well as in swimming pools. Sodium dichloroisocyanurate (NaDCC) is an active ingredient in water treatment disinfectants. When dissolved, it can release a number of chlorinated and non-chlorinated isocyanurate compounds, including isocyanuric acid. In a WHO review on NaDCC as a disinfectant in drinking-water, it was estimated that drinking-water treated with the typical concentration of free available chlorine (1 mg/l) would contain the equivalent of 1.6 mg NaDCC/l (63% free available chlorine) and ultimately 1.6 mg cyanuric acid/l (1 mol NaDCC gives 1 mol of cyanuric acid) (WHO, 2004). The maximum potential concentration of cyanuric acid would be approximately 3.2 mg/l, when higher initial doses of free chlorine are required (up to 2 mg/l). However, the review indicated that the use of NaDCC as a water disinfectant would be primarily for emergency situations.
Cyanuric acid is not approved by the USFDA as a non-protein source of nitrogen in hog, chicken, fish or aquaculture feeds (Karbiwnyk et al., 2009). However, it is permitted for use in ruminant feed (e.g. cattle, sheep, goat and bison), provided the label indicates the percentage of equivalent non-crude protein from non-protein nitrogen. No data on possible baseline levels of cyanuric acid from its legitimate use in ruminant feed were available.
Ammeline is used in the USA as a lubricating grease (US FDA, 2007). However, no specific information on residues of ammeline and/or ammelide resulting from approved sources was provided.
3. MELAMINE CONTAMINATION (ADULTERATION)
In 2007, wheat gluten and other protein sources, pet food and animal feed in North America were found to be contaminated with melamine and related compounds, such as cyanuric acid, ammelide and ammeline. Widespread pet illness and deaths in North America were subsequently attributed to the formation of melamine–cyanurate crystals in the kidneys of these animals (Puschner et al., 2007; USFDA, 2007). This prompted the EU, the USA, Canada and many additional countries to initiate border lookouts and restrictions on vegetable and cereal proteins (including wheat, corn, rice and soya glutens and/or protein concentrates) originating from China and other countries. More recently, in 2008, high levels of melamine were detected in infant formula and other liquid and powdered milk products originating from China. These high levels of melamine in infant milk and other milk products have led to severe health effects and illness in Chinese infants and young children (EFSA, 2008; WHO, 2008a, 2008b, 2008c).
Since the initial report of findings of melamine in infant formula products in China, it has been confirmed by international food regulatory authorities that other foods containing milk-derived ingredients (whole milk powder, non-fat milk powder, whey powder, lactose powder and casein) originating from China and other countries could be contaminated with melamine. Certain processed food products containing milk and milk-derived ingredients,
Background Paper: Occurrence of Melamine
7
such as milk-based candies, instant powdered coffee products, biscuits, chocolates, milk-based drinks and cakes, have been found to be contaminated with melamine. More recently, international media reports have raised concerns about melamine contamination of fruit and vegetables grown in China, fresh eggs, powdered and liquid egg products, non-dairy creamers, ammonium bicarbonate and animal feed originating from China, which may have been exported to other countries (FSANZ, 2008b; HKCFS, 2008; INFOSAN, 2008; Kuo & Kang, 2008; Korea Food and Drug Administration, United Kingdom Food Standards Agency and F. Reyers, personal communications, 2008). The source of the contamination of the non-dairy creamer and ammonium bicarbonate is not known at this time. 3.1 Pet food incident: 2007
On 15 March 2007, a pet food manufacturer (Menu Foods) alerted the USFDA to the deaths of animals that were associated with the consumption of their pet food. Further reports of renal failure in cats and dogs fed commercial pet foods in North America led to concerns about the possible contamination of pet food and to a widespread recall of these products prior to the identification of the contaminant (Cianciolo et al., 2008). An investigation found that melamine and related triazine compounds were present in the pet food (Nestle & Nesheim, 2007; Kim, Perkins & Bushway, 2008). Further investigation by the USFDA determined that wheat flour presented as wheat gluten and rice protein imported from China as pet food ingredients and subsequently incorporated into pet food manufactured in North America were contaminated with melamine and its analogues, cyanuric acid, ammeline and ammelide (Brown et al., 2007; Burns, 2007c; Ehling, Tefera & Ho, 2007; JAVMA, 2007). It is believed that melamine was added to the wheat flour to increase the flour’s apparent protein content, allowing the flour to pass for a higher-protein-containing ingredient, such as wheat gluten (Brown et al., 2007). Cyanuric acid, ammeline and ammelide are considered co-contaminants of melamine and may be generated during the production of melamine or as degradation products (AJVR, 2007; Burns, 2007c; Puschner et al., 2007; Cianciolo et al., 2008). It is interesting to note that the contaminated wheat gluten was a human food-grade product (Brown et al., 2007). Brown et al. (2007) suggested that a 2004 pet food incident in Asia initially attributed to mycotoxicosis, where the consumption of pet food was associated with renal failure in pets, may have been due to circumstances similar to those in the 2007 pet food incident.
Preliminary analysis of over 200 pet food samples after the 2007 incident found melamine concentrations ranging from 0 to 2263 mg/kg (Ehling, Tefera & Ho, 2007; Cianciolo et al., 2008). Melamine levels in pet food samples submitted to and analysed by the California Animal Health and Food Safety Laboratory were reported to range from 10 to 3200 mg/kg (Puschner et al., 2007). Cyanuric acid was detected at levels greater than 10 mg/kg in many of the pet food samples. The USFDA estimated that the wheat gluten present in pet food could contain melamine concentrations ranging from 0.2% to 9% (2–90 g/kg). In the manufacturing of pet food, wheat gluten usually accounts for less than 5–10% of the final pet food product (Burns, 2007b; Nestle & Nesheim, 2007). 3.2 The addition of melamine and related analogues to feed 3.2.1 Feed incident: 2007
In 2007, subsequent to the pet food incident, it was discovered that the waste material from the manufacture of pet food contaminated with melamine alone or in combination with cyanuric acid had been added to animal feed (hog and chicken feed) in the USA (USFDA,
Toxicological and Health Aspects of Melamine and Cyanuric Acid
8
2007; Buur, Baynes & Riviere, 2008). During this time, investigators also learned that adulterated wheat gluten had been used in the manufacture of aquaculture feeds (Karbiwnyk et al., 2009). Melamine is not allowed as a source of non-protein nitrogen in food or animal feed in the USA; likewise, cyanuric acid is not approved for use by the USFDA as a source of non-protein nitrogen in hog, chicken, fish or aquaculture feeds. However, cyanuric acid is allowed in ruminant feed in the USA, as a component of feed-grade biuret (a ruminant feed additive), as long as it is listed on the label of the feed with the percentage of equivalent non-crude protein from non-protein nitrogen (Karbiwnyk et al., 2009). Burns (2007a) reported that modern swine and poultry operations in the USA that do include some pet food scraps in their feed tend to include salvage or by-products as a small percentage of the rations. Pet food scraps are typically mixed with grain to make hog feed, where pet food comprises 5–10% of the feed. However, in this incident, some hogs where fed feed containing 50–100% pet food scraps. In the case of chicken feed, pet food scraps are first mixed with bakery scraps to make bakery meal, and the bakery meal is then mixed with other feed components to make poultry feed. Bakery meal typically accounts for 3–15% of the chicken feed.
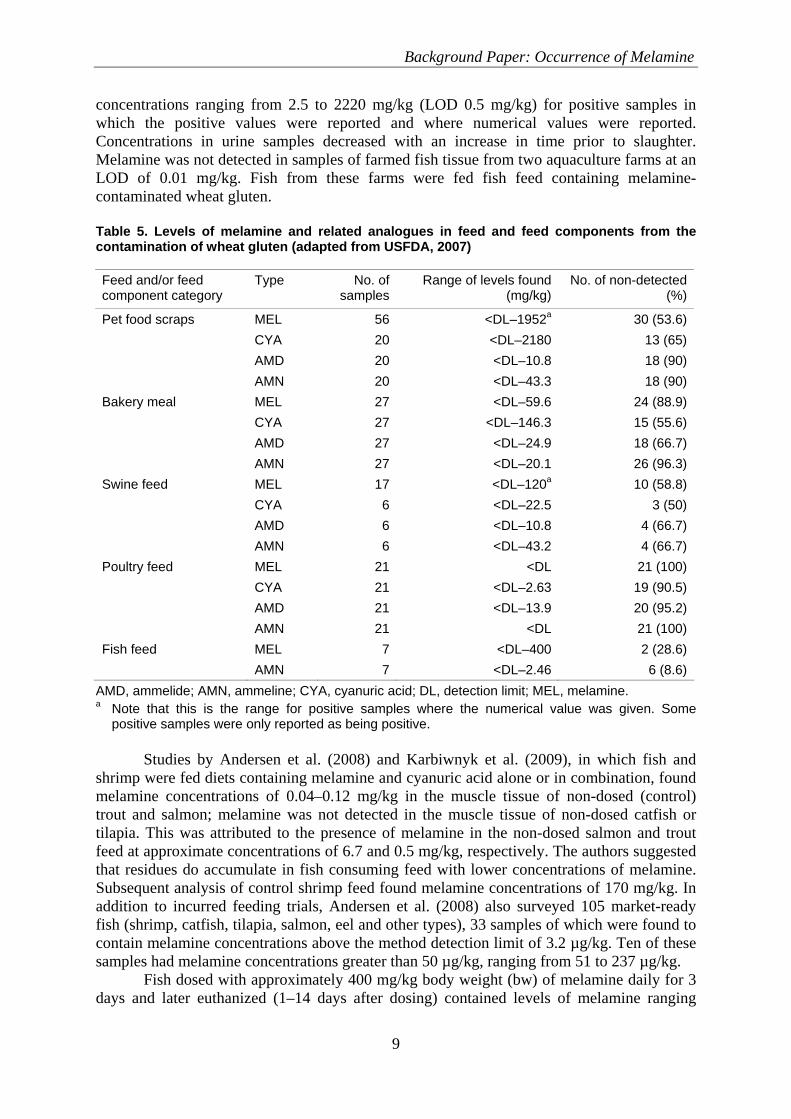
As a result of the addition of melamine-contaminated pet food scraps and wheat gluten to animal feed, the United States Food Safety and Inspection Service and the USFDA collected samples of animal feed components, animal feed, tissue samples of swine and poultry and urine samples of swine (USDA, 2007; USFDA, 2007). Specifically, melamine and, in some instances, cyanuric acid, ammelide and ammeline were determined in 56 samples of pet food scraps destined for animal feed production, 27 samples of bakery meal, 17 samples of swine feed, 21 samples of poultry feed and 7 samples of fish feed. As well, 21 samples of animal tissue and 131 urine samples were also analysed. The limit of detection (LOD) was estimated conservatively at 50 µg/kg (ppb). The analysis of the samples was conducted by the USFDA, private laboratories or the University of California – Davis. Levels in positive pet food scrap samples ranged from 9.4 to 1952 mg/kg for melamine, from 6.6 to 2180 mg/kg for cyanuric acid, from 6.0 to 10.8 mg/kg for ammelide and from 3.0 to 43.4 mg/kg for ammeline. Concentrations were much lower in bakery meal samples, consisting of a combination of pet food and bakery scraps, ranging from 10.6 to 59.6 mg/kg for melamine, from 1.8 to 146.3 mg/kg for cyanuric acid and from 1.2 to 24.9 mg/kg for ammeline; the concentration of ammelide was 20.1 mg/kg. In swine feed samples, positive concentrations ranged from 30 to 120 mg/kg for melamine, from 6.6 to 22.5 mg/kg for cyanuric acid, from 5.6 to 10.8 mg/kg for ammeline and from 33.6 to 43.2 mg/kg for ammelide. Poultry feed samples were negative for melamine and ammeline, two samples were positive for cyanuric acid (2.11 and 2.63 mg/kg) and one sample was positive for ammelide (13.9 mg/kg). Concentrations of melamine in the five positive fish feed samples ranged from 53 to 400 mg/kg; in addition, one sample was reported as containing ammeline, at 2.46 mg/kg. Further details on the concentrations of these compounds found in feed and feed scraps can be found in Table 5. 3.2.1.1 Melamine and related analogue levels in animal tissues and urine samples of
animals fed feed containing contaminated pet food and/or wheat gluten
Limited data were available from the 2007 pet food incident on the “carryover” of melamine from feed into foods of animal origin. Concentrations of melamine in swine and poultry tissues were below the LOD of 0.05 mg/kg utilized by the United States Food Safety and Inspection Service laboratory, even for those hogs believed to be fed the highest percentage of pet food scraps (50–100%) (USFDA, 2007). Three of these samples, also analysed by the University of California – Davis, contained levels of 0.009–0.012 mg/kg, owing to the lower LOD of 0.01 mg/kg. Melamine was found in the urine of swine at
Background Paper: Occurrence of Melamine
9
concentrations ranging from 2.5 to 2220 mg/kg (LOD 0.5 mg/kg) for positive samples in which the positive values were reported and where numerical values were reported. Concentrations in urine samples decreased with an increase in time prior to slaughter. Melamine was not detected in samples of farmed fish tissue from two aquaculture farms at an LOD of 0.01 mg/kg. Fish from these farms were fed fish feed containing melamine-contaminated wheat gluten. Table 5. Levels of melamine and related analogues in feed and feed components from the contamination of wheat gluten (adapted from USFDA, 2007) Feed and/or feed component category
Type No. of samples
Range of levels found (mg/kg)
No. of non-detected (%)
Pet food scraps MEL 56 <DL–1952a 30 (53.6) CYA 20 <DL–2180 13 (65) AMD 20 <DL–10.8 18 (90) AMN 20 <DL–43.3 18 (90)Bakery meal MEL 27 <DL–59.6 24 (88.9) CYA 27 <DL–146.3 15 (55.6) AMD 27 <DL–24.9 18 (66.7) AMN 27 <DL–20.1 26 (96.3)Swine feed MEL 17 <DL–120a 10 (58.8) CYA 6 <DL–22.5 3 (50) AMD 6 <DL–10.8 4 (66.7) AMN 6 <DL–43.2 4 (66.7)Poultry feed MEL 21 <DL 21 (100) CYA 21 <DL–2.63 19 (90.5) AMD 21 <DL–13.9 20 (95.2) AMN 21 <DL 21 (100)Fish feed MEL 7 <DL–400 2 (28.6) AMN 7 <DL–2.46 6 (8.6)
AMD, ammelide; AMN, ammeline; CYA, cyanuric acid; DL, detection limit; MEL, melamine. a Note that this is the range for positive samples where the numerical value was given. Some
positive samples were only reported as being positive.
Studies by Andersen et al. (2008) and Karbiwnyk et al. (2009), in which fish and shrimp were fed diets containing melamine and cyanuric acid alone or in combination, found melamine concentrations of 0.04–0.12 mg/kg in the muscle tissue of non-dosed (control) trout and salmon; melamine was not detected in the muscle tissue of non-dosed catfish or tilapia. This was attributed to the presence of melamine in the non-dosed salmon and trout feed at approximate concentrations of 6.7 and 0.5 mg/kg, respectively. The authors suggested that residues do accumulate in fish consuming feed with lower concentrations of melamine. Subsequent analysis of control shrimp feed found melamine concentrations of 170 mg/kg. In addition to incurred feeding trials, Andersen et al. (2008) also surveyed 105 market-ready fish (shrimp, catfish, tilapia, salmon, eel and other types), 33 samples of which were found to contain melamine concentrations above the method detection limit of 3.2 µg/kg. Ten of these samples had melamine concentrations greater than 50 µg/kg, ranging from 51 to 237 µg/kg.
Fish dosed with approximately 400 mg/kg body weight (bw) of melamine daily for 3 days and later euthanized (1–14 days after dosing) contained levels of melamine ranging
Toxicological and Health Aspects of Melamine and Cyanuric Acid
10
from 81 to 210 mg/kg in catfish, from 34 to 80 mg/kg in trout, from 0.02 to 177 mg/kg in tilapia and from 58 to 94 mg/kg in salmon (Andersen et al., 2008). Cyanuric acid levels in the muscle tissues of fish dosed with cyanuric acid alone ranged from 0.43 to 1210 mg/kg in salmon, from <9.3 to 11.2 mg/kg in catfish, from 0.05 to 5.8 mg/kg in trout and from 5.83 to 27.7 mg/kg in tilapia (Karbiwnyk et al., 2009). Interestingly, although no melamine was detected in catfish feed, measurable quantities (0.006–0.012 mg/kg bw in three samples) were found in the muscle of catfish dosed with cyanuric acid alone at approximately 400 mg/kg bw per day for 3 days. Melamine levels (0.08, 6.2 and 0.02 mg/kg) were also found in the muscle tissue of salmon dosed with cyanuric acid only. It was determined that the salmon in this study were exposed to low levels of melamine through the commercial salmon feed. However, the levels of melamine in cyanuric acid–dosed salmon were higher than those found in the muscle tissue of non-dosed salmon. Melamine and cyanuric acid were also confirmed in the muscle tissue samples of fish dosed with both melamine and cyanuric acid; however, these levels were generally lower than levels that were found in muscle tissue samples of fish dosed with melamine or cyanuric acid alone. This has been attributed to the formation of melamine–cyanurate crystals in the kidney, possibly reducing the availability of these components for accumulation in the muscle tissue itself (crystal formation was not observed in the edible tissue).
A study by Bermudez et al. (2008) in which broiler chickens were fed feed containing 0, 0.5, 1.0, 1.5, 2.0, 2.5 and 3.0% melamine from 1 to 21 days of age found melamine concentrations of 600, 700 and ~1000 mg/kg in pectoral muscle, liver and kidney, respectively, for surviving (at day 21) broilers fed at the 3.0% dose rate. Concentrations in the tissues of broilers fed diets containing 0.5% and 1.0% melamine were 100, ~150 and ~250 mg/kg (0.5%) and ~210, ~345 and ~490 mg/kg (1.0%) for pectoral muscle, liver and kidney tissues, respectively.
More recent reports (F. Reyers, personal communication, 2008) from South Africa suggest that the presence of melamine in raw milk may be a result of carryover of melamine from melamine-contaminated raw materials used in animal feed. 3.2.2 Other occurrences of melamine in feed
Limited occurrence data were available for other possible incidents that related to the adulteration of feed or feed ingredients with melamine. However, Nestle & Nesheim (2007) reported, based on their literature search, that the adulteration of animal feed with melamine is common. The use of melamine in animal feed to boost the apparent protein content was reported in the 1980s by Italian investigators surveying the fraudulent use of melamine. These scientists reported the presence of melamine in many (56%) fish meal samples (Cattaneo & Ceriani, 1988). A New York Times article published in 2007 suggested that the addition of melamine to animal feed was common practice in China (Barboza & Barrionuevo, 2007). Recently, a “water sac syndrome” or “big head syndrome” was observed in shrimp in Thailand. This syndrome has been attributed to the presence of melamine in feed ingredients sourced from China, although this has not been confirmed by scientific evidence (Karunasagar, 2008; Shrimp News International, 2008). The International Food Safety Authorities Network (INFOSAN, 2008) reported that the presence of melamine in animal feed originating from China might be widespread. Recently, the European Rapid Alert System for Food and Feed has reported the adulteration of animal feed originating from China in France, Germany and the United Kingdom (organic soya expeller). Concentrations were in the range of 1.6–410 mg/kg (INFOSAN, 2008; RASFF, 2008; FAO, personal communication, 2008). This is important not only for the feed animal, but because the carryover of melamine from animal feed to foods (tissues) of animal origin is a possibility.
Background Paper: Occurrence of Melamine
11
Melamine has been reported to have been added to binding agents for pellet feeds (shrimp and fish feed) in the USA to improve the binding properties of the pellets (JAVMA, 2007). The USFDA was reported to have estimated that concentrations of melamine in three binding agents would lead to concentrations less than 465, 233 and 50 mg/kg in shrimp feed, fish feed and livestock feed, respectively. These products were recalled, and the use of melamine as a binding agent was reported to have been discontinued (JAVMA, 2007).
Recent work by Muñiz-Valencia et al. (2008) did not detect melamine or its analogues in commercial rice concentrates (n = 5), farm animal feeds (n = 10), cat feeds (n = 6) or dog feeds (n = 3) in Spain, with the exception of one rice concentrate from a local wholesaler, where a melamine concentration of 1.2 ± 0.1% was found. Food and/or feed ingredients analysed for melamine by the National Measurement Institute, Australia, were generally below the analytical LOD. Melamine levels ranged from <0.12 to 12 mg/kg (only 3/73 positive) in these ingredients. Melamine was not detected (<1 mg/kg) in two samples of fish meal. 3.3 Melamine-contaminated milk incident in China: 2008
On 22 September 2008, Chinese authorities reported that 52 857 children had been treated for renal complications and that at least 4 children had died as a direct result of the contamination of infant formula and related dairy products with melamine (Chan, Griffiths & Chan, 2008; WHO, 2008b). Updated figures (Chinese Ministry of Health, personal communication, 2008) indicate that 290 000 children had been treated for renal complications and that 6 children have died as a direct result of the contamination. China’s General Administration of Quality Supervision, Inspection and Quarantine (AQSIQ) announced, in mid-September, the results of an investigation into the extent of melamine contamination of dairy products (Chan, Griffiths & Chan, 2008; EFSA, 2008; WHO, 2008a, 2008b). Of the 175 manufacturers of domestic powdered infant formula, 66 halted production, whereas 109 had their products tested by AQSIQ. Of 491 batches of products that were sampled, 69 batches produced by 22 companies contained detectable levels of melamine. Levels in these products ranged from 0.09 to 2563 mg/kg. The median level for the reported maximum values from these 22 companies was 29 mg/kg (EFSA, 2008). In addition, tests conducted on liquid milk showed that 24 of 1202 batches from three of five companies contained melamine; the highest concentration reported was 8.6 mg/kg (Chan, Griffiths & Chan, 2008). Updated figures (Chinese Centre for Disease Control and Prevention, unpublished data, 2008) indicate that 31 of 265 lots from 20 of 154 companies were positive for the presence of melamine at a maximum level of 6196 mg/kg in products tested that were manufactured prior to 14 September 2008.
Recent data generated by the Institute of Nutrition and Food Safety, Chinese Centre for Disease Control and Prevention, which tested 111 (87 positive) Sanlu infant formula (implicated in the current contamination event) samples from Beijing and Gansu province for the presence of melamine, indicated a mean melamine level of 1212 mg/kg; melamine concentrations in individual samples ranged from <0.05 to 4700 mg/kg (Chinese Centre for Disease Control and Prevention, unpublished data, 2008). Fifty-one of the 87 positive samples had a concentration higher than 1000 mg/kg. The mean melamine concentration in 38 samples of non-Sanlu brand infant formula analysed from Gansu province was 4.06 mg/kg. Data generated on 52 samples of Sanlu product from Gansu province indicated that the contamination profile was different from that associated with the pet food incident in 2007, in that concentrations of cyanuric acid, ammeline and ammelide were low relative to concentrations of melamine. Mean concentrations of melamine, cyanuric acid, ammeline and ammelide were 1673.6, 1.6, 1.7 and 2.9 mg/kg, respectively. The 90th percentile
Toxicological and Health Aspects of Melamine and Cyanuric Acid
12
concentrations were 2880, 3.4, 4.3 and 8.1 mg/kg for melamine, cyanuric acid, ammeline and ammelide, respectively. A similar contamination profile was seen in samples of the raw material analysed from Gansu province and used for the adulteration of milk. It is believed that melamine was added to raw ingredients at the milk collection centres to increase the milk’s apparent protein content, after these products had been diluted with water.
On 13 October 2008, a joint emergency notice was issued by Chinese government departments (AQSIQ, the Ministry of Industry and Information Technology, the Ministry of Commerce, the Ministry of Health, the State Administration for Industry and Commerce and the State Food and Drug Administration) requiring companies in the dairy industry in China to check and test all dairy products made before 14 September 2008 for the presence of melamine (AQSIQ, 2008b).
This incident prompted many countries and regions worldwide, including China, Hong Kong Special Administrative Region, Australia, New Zealand, the USA, Canada and the European Union, to establish action limits for the presence of melamine and/or melamine and its analogues in dairy-based foods and/or foods containing milk ingredients (AQSIQ, 2008a; CFIA, 2008; European Commission, 2008; FSANZ, 2008b; Health Canada, 2008b, 2008c; HKCFS, 2008; NZFSA, 2008; USFDA, 2008). In general, a maximum melamine limit of 1 mg/kg was established for infant formula and/or sole-source nutrition products,1 and a maximum melamine level of 2.5 mg/kg was established for milk products and products containing milk or milk-derived ingredients. The reader is referred to each regulatory agency’s web site in order to obtain specific information on variations of these maximum limits, the food commodities to which they refer and how they are applied. As well, many nations have initiated nationwide inspection and surveillance programmes directed at products containing milk and milk-derived ingredients from China and to determine baseline levels of melamine in foods.
According to the most recent information available on its web site, AQSIQ has tested 1507 batches (1645 batches2) of powdered infant formula produced after 14 September 2008 from 78 brands produced in 17 provinces (municipalities and autonomous regions). All of these batches were below the temporary administrative limits for melamine (AQSIQ, 2008d). Similarly, tests on 2175 batches (2310 batches) of milk powder, other than infant formula, produced after 14 September 2008 from 182 brands (184 companies) and in 25 provinces indicated that all of the products comply with the temporary melamine administrative limits. AQSIQ has tested 11 231 batches (12 209 batches) of liquid milk from 190 brands (197 brands) produced after 14 September 2008 from the markets of 52 cities in 28 major liquid milk–producing provinces. All of these products have been found to comply with the temporary administrative limits for melamine (AQSIQ, 2008c). 3.4 National monitoring and surveillance data
The adulteration of milk and milk products with melamine in China has prompted investigations worldwide into the concentrations of melamine and, in some cases, related analogues in milk, milk ingredients and composited products containing milk-derived ingredients. In many cases, the primary focus has been on Chinese dairy products and other mixed foods containing dairy ingredients manufactured or sourced from China. Some surveys have also focused on determining baseline levels of melamine in these types of products for 1 The USFDA indicated that it could not establish a maximum limit for the presence of melamine and related analogues in combination in infant formula, but that available analytical methods could reliably detect melamine at a level of 1 mg/kg. During the WHO Expert Meeting, this limit (1 mg/kg) was established by the USFDA for melamine or one of its analogues when present alone in infant formula. 2 Updated figures provided at the WHO Expert Meeting provided in parentheses.
Background Paper: Occurrence of Melamine
13
imported and domestically produced items. All of the available survey results are summarized in Appendix 1. The results from many countries were provided according to a limit of reporting (LOR) for regulatory purposes, due to the setting of maximum limits, rather than as an analytical level of determination. Also, the results from surveys of adulterated products and surveys of baseline levels are not differentiated, as the form in which they were supplied did not always permit the separation of targeted samples from those analysed for the purposes of determining baseline levels. However, in general, available information indicates that the majority of samples analysed are below the LOR and that baseline levels of melamine and related analogues in food appear to be below 1 mg/kg. Many of the surveys are ongoing, and the information provided below is a compilation of data that were submitted to WHO for the Expert Meeting as well as information available on the web pages of international scientific bodies and in the literature.
Appendix 1 includes only those results for which both non-detects and positive results were provided. Appendix 2 lists those results where only the positive values were provided to INFOSAN and through the EU Rapid Alert System for Food and Feed—that is, where non-detects, if any, were not provided. 3.4.1 Australia
The Food Standards Agency Australia New Zealand (FSANZ) submitted aggregate data of 85 results from Australian state and territory jurisdictions on the presence of melamine and cyanuric acid in a variety of composited foods containing milk ingredients. Melamine concentrations ranged from below the LOR to 163 mg/kg, and cyanuric acid was not present in any of the samples above the LOR. A further breakdown of the data by food category is presented in Appendix 1. Most analyses were carried out using liquid chromatography–tandem mass spectrometry (LC-MS/MS). Other samples were analysed by gas chromatography–mass spectrometry (GC-MS). The LOR for melamine was 1 mg/kg, and the LOR for cyanuric acid was either 1 or 10 mg/kg. These results are part of an ongoing surveillance programme, in which future surveillance will include a broader scope of foods, including composited foods, vegetable proteins, and animal and pet food, targeting products manufactured in China or products manufactured elsewhere with source ingredients originating from China.
International media reports have raised concerns about the possibility of melamine contamination of fruit and vegetables grown in China that have been exported to the world (FSANZ, 2008b). As such, some mushroom and mushroom products were analysed for melamine, cyanuric acid and cyromazine. None of the 15 samples contained residues above the 1 mg/kg LOR.
The regulatory authority for milk and dairy products in Victoria, Australia, Dairy Food Safety Victoria, indicated that 360 samples of dairy foods had been tested for the presence of melamine by the industry. No melamine was detected in any of these samples, where the LOR varied from <0.1 to <1.0 mg/kg, depending on the food matrix and the analytical method employed. A government-supervised testing programme did not determine melamine (<1.0 mg/kg) in 30 raw milk samples from around Australia.
Data were also provided by the National Measurement Institute of Australia on 242 samples of products containing milk-derived ingredients, pet food, fish meal, food and/or feed ingredients, and packaging materials. A summary of the data is presented in Appendix 1. The LOR for the majority (226) of samples was 1 mg/kg using an LC-MS/MS method. Melamine was found above the LOR in only three samples: two egg albumin samples at 11 and 12 mg/kg and a sample of continental garlic at 0.7 mg/kg (this sample was below its respective LOR of 1 mg/kg). Fourteen samples were analysed using a GC-MS method, but
Toxicological and Health Aspects of Melamine and Cyanuric Acid
14
melamine was not determined above the LOR of 2.5 mg/kg. The remaining two samples were reported to be below the LOR and/or LOD (LC-MS/MS) of 0.1 mg/kg. 3.4.2 New Zealand
New Zealand submitted individual melamine and cyanuric acid results for 180 samples of 111 products from 42 importers and/or manufacturers; the products included infant formula, biscuits, milk-based drinks and candy. Melamine and cyanuric acid were not reported in the majority of samples at an LOR of 1 mg/kg. An LC-MS/MS method was employed for the analysis. Of those samples that were positive (including some samples additional to those in the data set containing 180 samples referred to above), two biscuit samples contained melamine at concentrations of 3.7 and 20 mg/kg, a milk-based candy contained melamine at 180 mg/kg and cyanuric acid at 1.4 mg/kg, and three samples of milk drinks contained melamine concentrations of 0.7, 3.3 and 9.0 mg/l. One follow-on formula was found to contain cyanuric acid alone at 0.49 mg/kg. A melamine residue level of 17 mg/kg was found in canned mushrooms. It was suggested that this level is in excess of what would be expected from the use of fertilizer and/or cyromazine. 3.4.3 Japan
Japan submitted positive melamine results for various bakery and confection, snack food, processed foodstuff and dried whole egg products. Melamine concentrations ranged from 0.5 to 41 mg/kg. This information was also submitted to INFOSAN and is reported in Appendix 2. Higher levels of melamine were found in frozen dairy-based desserts and croissants, as well as a pumpkin bun. Melamine was found in dried whole eggs at concentrations ranging from 2.8 to 4.6 mg/kg. Melamine was also found in fried chicken at 1.6 mg/kg and in frozen takoyaki (octopus) at concentrations ranging from 0.6 to 1.6 mg/kg. 3.4.4 Republic of Korea
The National Veterinary Research and Quarantine Service of the Republic of Korea submitted aggregate surveillance data, covering the period 1 September 2008 to 31 October 2008, for a variety of domestic and imported livestock products, including dairy and milk products (e.g. milk, milk powder, cheeses, fermented milk, ice cream), meat and egg products. Melamine was not detected at an LOQ of 0.1 mg/kg in the majority (99.6%) of the samples analysed. The USFDA’s Laboratory Information Bulletin (LIB) No. 4396 (Andersen et al., 2007) or LIB No. 4422 (Smoker & Krynytsky, 2008) analytical methods were used for analysis. Positive results for the presence of melamine were found only in egg powder (whole egg powder: 0.84–4.00 mg/kg; egg white powder: 1.30–2.50 mg/kg; egg yolk powder: 0.11 mg/kg) and liquid egg yolk (0.48 mg/kg) products.
The Korean Food and Drug Administration (unpublished data, 2008) reported that melamine was found in 2 of 10 samples of lactoferrin (1.9 and 3.3 mg/kg) above the LOQ of 1 mg/kg using a high-performance liquid chromatography–diode array detection (HPLC-DAD) method. Melamine was also found in a sample of ammonium bicarbonate at a concentration of 603 mg/kg. A snack sample containing ammonium bicarbonate had a melamine concentration of 18.1 mg/kg.
Background Paper: Occurrence of Melamine
15
3.4.5 Taiwan, China
Melamine determinations conducted in Taiwan, China, were reported by Chen & Kang (2008). All products were analysed by the Bureau of Food and Drug Analysis, Department of Health, using LC-MS/MS. In total, 415 milk powder products, including 74 samples from China and 341 from other countries, were tested for melamine (Chen & Kang, 2008). Samples that were either collected or received as a result of consumer complaints were provided by local health authorities. Two milk products originally implicated in the milk contamination event contained relatively high levels of melamine, at an average concentration of 312 ± 33 mg/kg, and trace amounts of cyanuric acid, accounting for less than 0.1% of melamine. An analysis of 67 samples of milk powder from another company, referred to as “X-company” (under two brand names), found concentrations of melamine in 63 (94%) of the samples at low levels. The average melamine concentration in these 63 samples was 0.28 ± 0.17 mg/kg. Two of five samples from different brands contained melamine at concentrations averaging 0.57 ± 0.57 mg/kg. In addition to the milk powder manufactured in and/or originating from China, 341 samples of milk powder manufactured in other countries were analysed. Only one of these samples contained detectable levels of melamine, at 0.09 mg/kg. Twenty-three samples of milk powder products (9 infant formulas and follow-on formula samples and 14 other milk powders) from “X-company” and manufactured in other countries did not contain detectable levels of melamine. Milk powder products originating from China accounted for 98.5% of the positive samples.
The government of Taiwan, China, subsequently found melamine in a non-dairy creamer used as an ingredient in some dry mixes and in ammonium bicarbonate (a leavening agent used in the making of fritters, biscuits and cookies) originating from China (Kuo & Kang, 2008). One lot of the non-dairy creamer contained melamine concentrations ranging from 3726.8 to 20 700 mg/kg, whereas another lot contained melamine at levels ranging from 745.2 to 5500 mg/kg. Subsequent analysis of ammonium bicarbonate samples by the Bureau of Food and Drug Analysis, as a result of positive findings by the Malaysian government, found melamine concentrations ranging from 70 to 80 mg/kg in products imported into Taiwan, China, from Mainland China. A Malaysian newspaper had reported melamine concentrations of 33.4–508 mg/kg in 18 of 47 ammonium bicarbonate samples used in the manufacture of two brands of biscuits (BERNAMA, 2008). A local health bureau in Taiwan, China, submitted additional samples of ammonium bicarbonate for analysis, in which melamine concentrations were found to range from 1590 to 2470 mg/kg. 3.4.6 Canada
Health Canada (2008d) analysed 80 infant formula products available on the retail market in order to determine background (referred to as “baseline” in this report) concentrations of melamine. Melamine was detected in 60 of 80 infant formula products, representing a 75% incidence of positive detections of low baseline levels of melamine. Concentrations ranged from 0.0043 to 0.346 mg/kg “as purchased”. Concentrations in products “as consumed”, after accounting for reconstitution factors in concentrated and powdered products, ranged from 0.000 53 to 0.0689 mg/kg. Samples were analysed using a liquid/liquid extraction and cation-exchange solid-phase extraction to prepare samples and electrospray positive ionization LC-MS/MS to quantify melamine at an LOD of 0.004 mg/kg. A further survey of 242 samples of domestic milk and domestic or imported finished foods containing milk or milk-derived ingredients, as well as composited foods containing milk ingredients available in Asian markets, was conducted. Positive results for melamine in products containing milk or milk ingredients, other than infant formula, were generally low
Toxicological and Health Aspects of Melamine and Cyanuric Acid
16
and ranged from 0.004 35 to 0.282 mg/kg, with the exception of one milk-based candy (7.29 mg/kg), which was subject to a recall by the importer and a Health Hazard Alert by the Canadian Food Inspection Agency. The highest concentrations of melamine found in this survey, other than the milk-based candy mentioned above, were found in liquid coffee and milk teas available in Asian markets (0.039–0.282 mg/kg) and in evaporated and condensed milk samples (0.0176–0.0325 mg/kg).
The Canadian Food Inspection Agency, as of 20 November 2008, had analysed 465 products for the presence of melamine and, in some samples, for the presence of cyanuric acid. A high proportion (92%) of the samples were below the LOR of 1 mg/kg using an LC-MS/MS method (CFIA, 2008). All products testing above the interim standards were subject to a recall by the Canadian Food Inspection Agency. Further details of these results can be found in Appendix 1. 3.4.7 United States of America
The USFDA submitted melamine and cyanuric acid results on 44 domestically manufactured infant formulas consisting of powdered, liquid concentrated and liquid ready-to-use formulas. The samples were analysed with GC-MS (LOQ 2.5 mg/kg), LC-MS LIB No. 4421 (Turnipseed et al., 2008) (LOQ 0.25 mg/kg) or LC-MS LIB No. 4422, version 1 (Smoker & Krynytsky, 2008) (LOQ 0.2 mg/kg). Although some positive detections of melamine were noted (0.137–0.206 mg/kg), all positive values were below the 0.25 mg/kg LOQ. Cyanuric acid was detected in one infant formula product, without detectable levels of melamine, at concentrations ranging from 0.245 to 0.249 mg/kg.
During the WHO Expert Meeting, the USFDA released results on their web site for the presence of melamine and related analogues in 74 infant formula samples; analysis of a further 13 samples was under way. At that time, melamine and related analogues were not detected in any of the additional samples. A further 1428 sample results (using the same analytical methodologies reported above) were submitted; melamine levels were found to range from <LOQ to 1817 mg/kg, and cyanuric acid levels ranged from <LOQ to 3.62 mg/kg. A more detailed breakdown of the types of products analysed and their associated melamine and cyanuric acid determinations is provided in Appendix 1. 3.4.8 European Union
The import of milk and milk products from China into the EU is prohibited; however, composite food products, such as biscuits and chocolate, which could be made from contaminated milk powder, may have reached the EU. As a result, targeted sampling has been conducted by many member states.
The European Commission submitted data (555 samples) on the occurrence of melamine in various products from official controls in member states, including Austria, Cyprus, the Czech Republic, Estonia, Finland, Germany, Hungary, Italy, Latvia, Slovakia, Sweden and the United Kingdom; data from Norway were also included. The majority of sample results were from Germany, Hungary, Italy and the United Kingdom. A breakdown of the types of products tested and a summary of their melamine determinations are provided in Appendix 1.
Data were also submitted by the European Commission on the occurrence of melamine in food and feed in the EU, as reported through the Rapid Alert System for Food and Feed. A summary of these data, as well as those reported to INFOSAN, is presented in Appendix 2.
Background Paper: Occurrence of Melamine
17
The European Commission also submitted aggregate data compiled by the Confederation of Food and Drink Industries of the EU (CIAA) on the occurrence of melamine in 1258 dairy products and foods containing milk or milk-derived ingredients. Products were tested for the presence of melamine by CIAA members, if they were producing products in China or for other Asian markets, irrespective of the source of the milk ingredients. In addition, products on the European market not imported from China were also tested for the presence of melamine. Details of this testing can be found in Appendix 3. 3.4.8.1 United Kingdom
According to the United Kingdom Food Standards Agency web site, it has found elevated melamine levels in 21 products and/or samples of composited foods containing milk or milk-derived ingredients. Melamine levels ranged from 3.3 to 259 mg/kg. Elevated melamine levels in confection items, such as chocolate and milk candies (n = 17), ranged from 3.3 to 259 mg/kg, whereas levels in biscuits and cookies (n = 4) ranged from 4.2 to 11 mg/kg (UKFSA, 2008). 3.4.8.2 France
The Agence Française de Sécurité Sanitaire des Aliments (AFSSA) submitted data on the presence of melamine in 56 samples of Asian milk-based products. Five of these samples were above the LOQs of 0.17, 0.2 or 2.5 mg/kg. In particular, three White Rabbit candy samples (2, 52 and 290 mg/kg) and two crisp samples were found to be contaminated with melamine (5.30 mg/kg). Data were obtained from the Directorate General for Competition, Consumer Affairs and Fraud Control and the Directorate General for Food. 3.4.9 International Food Safety Authorities Network (INFOSAN)
INFOSAN has compiled two lists of food products, a “confirmed list” and a “reported list”. Each list consists for the most part of products containing milk or milk-derived ingredients, either confirmed or reported to be positive for the presence of melamine. INFOSAN has noted that this list may not be exhaustive, as member countries are not obligated to report their results to WHO. It should be noted that some countries appear to have submitted only positive concentrations that were above the maximum levels established (by many countries) for melamine and related analogues in food, whereas other countries submitted data on any positive determinations they may have encountered, regardless of whether they were above maximum limits. Samples testing positive for melamine included samples of biscuits, cakes and confectionery (0.6–945.86 mg/kg); liquid milk and yoghurt products (0.5–648 mg/kg); frozen desserts (39–60.8 mg/kg); powdered milk and cereal products (0.38–1143 mg/kg); processed foodstuff (0.6–41 mg/kg); food-processing ingredients (1.5–6694 mg/kg); and animal feed (116.2–410 mg/kg). Further details on the ranges of melamine found in various food commodities, by country, are presented in Appendix 2.
Toxicological and Health Aspects of Melamine and Cyanuric Acid
18
4. RECOMMENDATIONS AND FUTURE WORK 4.1 Recommendations for data collection and reporting • Ensure that FAO/WHO and their member states have effective systems to collect, collate
and report data for FAO/WHO data calls and the INFOSAN network. • FAO/WHO should consider setting up a structured collaboration with relevant food and
other industries involved in the food-chain that can be used to generate and/or request data quickly.
• Governments should be encouraged to publish and disseminate data on all testing results (positives and non-detects) in a timely manner where possible.
• Results should be reported for melamine and its three analogues (cyanuric acid, ammelide, ammeline) in food, feed and feed ingredients, rather than melamine only
4.2 Recommendations for future work • More data to estimate the concentration of melamine and cyanuric acid in edible parts of
crops and feed as a result of using cyromazine and other triazine pesticides or veterinary drugs and fertilizer mixtures containing melamine.
• Determine the extent to which melamine and its analogues may be present in feed, in order to identify adulterated feed from baseline levels that may occur through approved uses of melamine and related analogues, such as fertilizer or pesticide applications for different countries.
• Further investigate the carryover ratio of melamine and related analogues present in animal feed containing these compounds into food of animal origin (including fish).
• Further investigate the baseline levels of melamine present in food products as a result of migration from food contact materials, cross-contamination during processing, processing facilities, packaging material and/or residues of sanitizers.
• More data to determine baseline levels of melamine and cyanuric acid in drinking-water. • Investigate the presence of high levels of melamine in suspect foods other than milk-
based products and products containing milk-derived ingredients, such as ammonium bicarbonate and non-dairy creamers.
• Investigate the extent to which cyanuric acid and related analogues are present in combination with melamine; determine patterns of co-occurrence and whether this information may provide insight into the origin of melamine and related compounds in foods.
• National and international food and feed regulatory bodies should continue to work closely with food and feed manufacturers and importers concerning information on the origin of food and feed products and ingredients.
5. REFERENCES AJVR (2007). Research examines contaminants in food, deaths of pets. American Journal of Veterinary Research, 68(12): 1279. Andersen WC et al. (2007). Determination of melamine residues in catfish tissue by triple quadrupole LC-MS-MS with HILIC chromatography. Denver, CO, United States Food and Drug Administration, Animal Drugs Research Center (Laboratory Information Bulletin No. 4396; http://www.cfsan.fda.gov/~frf/lib4396.html).
Background Paper: Occurrence of Melamine
19
Andersen WC et al. (2008). Determination and confirmation of melamine residues in catfish, trout, tilapia, salmon, and shrimp by liquid chromatography with tandem mass spectrometry. Journal of Agricultural and Food Chemistry, 56: 4340–4347. Antikainen R, Haapanen R, Rekolainen S (2004). Flows of nitrogen and phosphorus in Finland—the forest industry and use of wood fuels. Journal of Cleaner Production, 12: 919–934. AQSIQ (2008a). Five departments regulated melamine limits in milk products for the first time. General Administration of Quality Supervision, Inspection and Quarantine of the People’s Republic of China, 14 October 2008 (http://english.aqsiq.gov.cn/NewsRelease/NewsUpdates/200810/t20081014_93410.htm). AQSIQ (2008b). Notice issued to recall and test dairy products produced before Sept. 14. General Administration of Quality Supervision, Inspection and Quarantine of the People’s Republic of China, 17 October 2008 (http://english.aqsiq.gov.cn/NewsRelease/NewsUpdates/200810/t20081017_93991.htm). AQSIQ (2008c). The 22th [sic] round of melamine tests shows liquid milk meeting regulation. General Administration of Quality Supervision, Inspection and Quarantine of the People’s Republic of China, 18 November 2008 (http://english.aqsiq.gov.cn/NewsRelease/NewsUpdates/200811/t20081118_97522.htm). AQSIQ (2008d). The 15th round of melamine tests shows milk powder meeting regulation. General Administration of Quality Supervision, Inspection and Quarantine of the People’s Republic of China (http://english.aqsiq.gov.cn/NewsRelease/NewsUpdates/200811/t20081118_97523.htm). Barboza D, Barrionuevo A (2007). Filler in animal feed is open secret in China. New York Times, 30 April 2007 (http://www.nytimes.com/2007/04/30/business/worldbusiness/30food.html). Bermudez A et al. (2008). Pathology and mortality associated with graded levels of melamine fed to young broiler chickens. In: Proceedings of the American Association of Veterinary Laboratory Diagnosticians; October, Greensboro, NC. Davis, CA, American Association of Veterinary Laboratory Diagnosticians, p. 112. BERNAMA (2008). Malaysia bans import of raising agent from China, orders recall of two biscuit brands. Malaysian National News Agency, 16 October 2008 (http://www.bernama.com/bernama/v3/news_lite.php?id=364989). Bizzari S, Yokose K (2008). Melamine. In: Chemical economics handbook. Menlo Park, CA, SRI Consulting Inc. (http://www.sriconsulting.com/CEH/Public/Reports/673.3000/). Bradley EL et al. (2005). Survey of the migration of melamine and formaldehyde from melamine food contact articles available on the UK market. Food Additives and Contaminants, 22(6): 597–606. Brown CA et al. (2007). Outbreaks of renal failure associated with melamine and cyanuric acid in dogs and cats in 2004 and 2007. Journal of Veterinary Diagnostic Investigation, 19(5): 525–531. Burns K (2007a). Hogs, chickens, ate pet food containing adulterants. Journal of the American Veterinary Medical Association, 230(11): 1603. Burns K (2007b). Recall shines spotlight on pet foods. Journal of the American Veterinary Medical Association, 230(9): 1285–1286. Burns K (2007c). Researchers examine contaminants in food, deaths of pets. Journal of the American Veterinary Medical Association, 231(11): 1636–1638. Buur JL, Baynes RE, Riviere JE (2008). Estimating meat withdrawal times in pigs exposed to melamine contaminated feed using a physiologically based pharmacokinetic model. Regulatory Toxicology and Pharmacology, 51: 324–331. Cattaneo P, Ceriani L (1988). Situazione attuale della mellamina nelle farine di carne. Tecnica Moliatoria, 39: 28–32 (in Italian).
Toxicological and Health Aspects of Melamine and Cyanuric Acid
20
CFIA (2008). Report on testing results for melamine in foods containing milk and milk-derived ingredients from China. Melamine – certain products from China – 2008. Ottawa, Ontario, Canadian Food Inspection Agency (http://www.inspection.gc.ca/english/fssa/concen/2008melinfoe.shtml). Chan EYY, Griffiths SM, Chan CW (2008). Public-health risks of melamine in milk products. The Lancet, 372: 1444–1445. Chen S-K, Kang J-J (2008). Analysis of melamine contamination in milk powder. Surveillance report on melamine contamination in Taiwan. Taiwan, China, Institute of Toxicology, College of Medicine, National Taiwan University; Bureau of Food and Drug Analysis, Department of Health; Centers of Disease Control, Department of Health; Taipei Hospital, Department of Health. Chou S-S, Hwang D-F, Lee H-F (2003). High performance liquid chromatographic determination of cyromazine and its derivative melamine in poultry meats and eggs. Journal of Food and Drug Analysis, 11(4): 290–295. Cianciolo RE et al. (2008). Clinicopathological, histological, and toxicological findings in 70 cats inadvertently exposed to pet food contaminated with melamine and cyanuric acid. Journal of the American Veterinary Medical Association, 233(5): 729–737. De Fatima Pocas M, Hogg T (2007). Exposure assessment of chemicals from packaging materials in foods: a review. Trends in Food Science & Technology, 18: 219–230. EFSA (2007). EFSA’s provisional statement on a request from the European Commission related to melamine and structurally related compounds such as cyanuric acid in protein-rich ingredients used for feed and food. European Food Safety Authority, 4 July 2007 (Question No. EFSA-Q-2007-093). EFSA (2008). Statement of the EFSA on risks for public health due to the presence of melamine in infant milk and other milk products in China. European Food Safety Authority, 24 September 2008 (Question No.EFSA-Q-2008-695. The EFSA Journal, 807: 1–10 (http://www.efsa.europa.eu/EFSA/efsa_locale-1178620753812_1211902098495.htm). Ehling S, Tefera S, Ho IP (2007). High-performance liquid chromatographic method for simultaneous detection of the adulteration of cereal flours with melamine and related triazine by-products ammeline, ammelide, and cyanuric acid. Food Additives and Contaminants, 24(12): 1319–1325. El-Sayed WS, El-Baz AF, Othman AM (2006). Biodegradation of melamine formaldehyde by Micrococcus sp. strain MF-1 isolated from aminoplastic wastewater effluent. International Biodeterioration & Biodegradation, 57: 75–81. European Commission (2001). Commission Regulation (EC) No. 1478/2001 of 18 July 2001 amending Annexes I, II and III of Council Regulation (EEC) No. 2377/90 laying down a Community procedure for the establishment of maximum residue limits of veterinary medicinal products in foodstuffs of animal origin. Official Journal of the European Union, L 195/32, 19.7.2001 (http://eur-lex.europa.eu/LexUriServ/LexUriServ.do?uri=OJ:L:2001:195:0032:0035:EN:PDF). European Commission (2008). Commission Decision 2008/798/EC, 14 October 2008, Imposing special conditions governing the import of products containing milk or milk products originating in or consigned from China, and repealing Commission Decision 2008/757/EC. Official Journal of the European Union L 273/18, 15.10.2008 (http://eur-lex.europa.eu/LexUriServ/LexUriServ.do?uri=OJ:L:2008:273:0018:0020:EN:PDF). FAO (2007). Evaluations—Cyromazine (169). Rome, Food and Agriculture Organization of the United Nations, Joint FAO/WHO Meeting on Pesticide Residues (http://www.fao.org/ag/AGP/AGPP/Pesticid/JMPR/Download/2007_eva/Cyromazine.pdf). FESYP (1998). Annual report 1997/98. Brussels, European Federation of Associations of Particleboard Manufacturers, pp. 146–152. FSANZ (2008a). Food Standards Code, Chapter 1, Part 1.4, Standard 1.4.2, Schedule 1. Food Standards Australia and New Zealand (http://www.foodstandards.gov.au/thecode/; accessed November 2008).
Background Paper: Occurrence of Melamine
21
FSANZ (2008b). Melamine in foods from China. Food Standards Agency Australia New Zealand (http://www.foodstandards.gov.au/newsroom/factsheets/factsheets2008/melamineinfoodsfromchina/index.cfm; updated 29 October 2008). Health Canada (2008a). Maximum residue limits for pesticides. Ottawa, Ontario, Health Canada, Pest Management Regulatory Agency (http://www.hc-sc.gc.ca/cps-spc/pest/protect-proteger/food-nourriture/mrl-lmr-eng.php). Health Canada (2008b). Health Canada’s human health risk assessment supporting standard development for melamine in foods. Ottawa, Ontario, Health Canada, November 2008 (http://www.hc-sc.gc.ca/fn-an/pubs/melamine_hra-ers-eng.php). Health Canada (2008c). The Government of Canada responds to reports of melamine in food products. Ottawa, Ontario, Health Canada, 3 October 2008 (http://www.hc-sc.gc.ca/fn-an/securit/chem-chim/melamine-eng.php). Health Canada (2008d). Survey and health risk assessment of background levels of melamine in infant formula allowed for sale in Canada. Ottawa, Ontario, Health Canada, Health Products and Food Branch, Food Directorate, Bureau of Chemical Safety, November 2008 (http://www.hc-sc.gc.ca/fn-an/pubs/melamine_survey-enquete_hra-ers-eng.php). HKCFS (2008). Melamine in Mainland’s milk powder incident. Government of the Hong Kong Special Administrative Region, Center for Food Safety (http://www.cfs.gov.hk/english/whatsnew/whatsnew_fstr/whatsnew_fstr_Melamine_in_Mainland_Milk_Powder_Incident.html). INFOSAN (2008). Melamine-contaminated products, China. International Food Safety Authorities Network, 10 November 2008 (Emergency Alert Update No. 11). Ishiwata H, Inoue T, Tanimura A (1986). Migration of melamine and formaldehyde from tableware made of melamine resin. Food Additives and Contaminants, 3(1): 63–70. Ishiwata H et al. (1987). Liquid chromatographic determination of melamine in beverages. Journal of the Association of Official Analytical Chemists, 70(3): 457–460. JAVMA (2007). Melamine adulterates component of pellet feeds. Journal of the American Veterinary Medical Association, 231(1): 17. Karbiwnyk CM et al. (2009). Determination of cyanuric acid residues in catfish, trout, tilapia, salmon and shrimp by liquid chromatography–tandem mass spectrometry. Analytica Chimica Acta, 637(1–2): 101–111. Karras G et al. (2007). Fate of cyromazine applied in nutrient solution to a gerbera (Gerbera jamesonii) crop grown in a closed hydroponic system. Crop Protection, 26: 721–728. Karunasagar I (2008). Melamine in water and fish feed. Unpublished report. Rome, Food and Agriculture Organization of the United Nations, Fish Utilization and Marketing Service, Fish Products and Industry Division. Kim B, Perkins LB, Bushway RJ (2008). Determination of melamine in pet food by enzyme immunoassay, high-performance liquid chromatography with diode array detection, and ultra-performance liquid chromatography with tandem mass spectrometry. Journal of AOAC International, 91(2): 408–413. Kuo H-S, Kang J-J (2008). Melamine-tainted non-dairy product investigation report. Surveillance report on melamine contamination in Taiwan. Taiwan, China, Institute of Toxicology, College of Medicine, National Taiwan University; Bureau of Food and Drug Analysis, Department of Health; Centers of Disease Control, Department of Health; Taipei Hospital, Department of Health. Lim LO et al. (1990). Disposition of cyromazine in plants under environmental conditions. Journal of Agricultural and Food Chemistry, 38: 860–864.
Toxicological and Health Aspects of Melamine and Cyanuric Acid
22
Lund KH, Petersen JH (2006). Migration of formaldehyde and melamine monomers from kitchen- and tableware made of melamine plastic. Food Additives and Contaminants, 23(9): 948–955. Meek ME et al. (2003). A framework for human relevance analysis of information on carcinogenic modes of action. Critical Reviews in Toxicology, 33: 591–653. Mosdell DK, Daniel WH, Freeborg RP (1987). Melamine and ammeline as nitrogen sources for turfgrasses. Fertilizer Research, 11(1): 79–86. Muñiz-Valencia R et al. 2008. Method development and validation for melamine and its derivatives in rice concentrates by liquid chromatography. Application to animal feed samples. Analytical and Bioanalytical Chemistry, 392: 523–531. Neitsch S et al. (2006). Melamine-based organoclay to sequester atrazine. Chemosphere, 64: 704–710. Nestle M, Nesheim MC (2007). Additional information on melamine in pet food. Journal of the American Veterinary Medical Association, 231(11): 1647. Nishimura K et al. (2002). Biodegradation of triazine herbicides on polyvinylalcohol gel plates by the soil yeast Lipomyces starkeyi. Applied Microbiology and Biotechnology, 58: 848–852. NZFSA (2008). NZFSA refines melamine response approach. Wellington, New Zealand Food Safety Authority, 29 September (http://www.nzfsa.govt.nz/publications/media-releases/2008/29-sep-melamine-statement.htm). OECD (1998). Screening information dataset for melamine. CAS No. #108-78-1. Paris, Organisation for Economic Co-operation and Development (http://www.chem.unep.ch/irptc/sids/OECDSIDS/108781.pdf). Patakioutas D et al. (2007). Application and fate of cyromazine in a closed-cycle hydroponic cultivation of bean (Phaseolus vulgaris L.). Journal of Agricultural and Food Chemistry, 55: 9928–9935. Puschner B et al. (2007). Assessment of melamine and cyanuric acid toxicity in cats. Journal of Veterinary Diagnostic Investigation, 19(6): 616–624. RASFF (2008). The Rapid Alert System for Food and Feed (RASFF): Annual report 2007. European Commission, Directorate-General for Health and Consumers (http://ec.europa.eu/food/food/rapidalert/report2007_en.pdf). Root DS, Hongtrakul T, Dauterman WC (1996). Studies on the absorption, residues and metabolism of cyromazine in tomatoes. Pesticide Science, 48: 25–30. Sancho JV et al. (2005). Residue determination of cyromazine and its metabolite melamine in chard samples by ion-pair liquid chromatography coupled to electrospray tandem mass spectrometry. Analytica Chimica Acta, 530: 237–243. Shrimp News International (2008). Thailand, Big head syndrome. Shrimp News International, 18 January 2008 (http://www.shrimpnews.com/FreeNewsBackIssues/FreeNewsJanuary200818.html). Smoker MS, Krynitsky AJ (2008). Interim method for determination of melamine and cyanuric acid residues in foods using LC-MS/MS: version 1.0. Silver Spring, MD, United States Department of Health and Human Services, Center for Food Safety and Nutrition, pp. 1–27 (Laboratory Information Bulletin No. 4422; http://www.cfsan.fda.gov/~frf/lib4422.html). Turnipseed S et al. (2008). Determination of melamine and cyanuric acid residues in infant formula using LC-MS/MS. Silver Spring, MD, United States Department of Health and Human Services, Center for Food Safety and Nutrition, pp. 1–13. (Laboratory Information Bulletin No. 4421; http://www.cfsan.fda.gov/~frf/lib4421.html). UKFSA (2008). Melamine update: 21 November 2008. United Kingdom Food Standards Agency (http://www.food.gov.uk/news/newsarchive/2008/nov/latestonmelamine).
Background Paper: Occurrence of Melamine
23
USDA (2007). Disposition of hogs and chickens from farms identified as having received pet food scraps contaminated with melamine and melamine-related compounds and offered for slaughter. [United States Department of Agriculture, Food Safety and Inspection Service, Docket No. FSIS 2007-0018.] Federal Register, 72(103): 29945–29948. USEPA (1999). Cyromazine; Pesticide tolerance. [United States Environmental Protection Agency.] Federal Register, 64(178): 50043–50050. USEPA (2005). Cyromazine: tolerances for residues. United States Environmental Protection Agency, Code of Federal Regulations Title 40, Part 180.414 (http://cfr.vlex.com/vid/180-414-cyromazine-tolerances-residues-19815002). USEPA (2007). Cyromazine: Registration review summary document. Washington, DC, United States Environmental Protection Agency (http://www.regulations.gov/fdmspublic/component/main?main=DocumentDetail&d=EPA-HQ-OPP-2006-0108-0003). USFDA (2007). Interim melamine and its analogues safety/risk assessment. Washington, DC, United States Food and Drug Administration, Center for Food Safety and Applied Nutrition, 25 May 2007 (http://www.cfsan.fda.gov/~dms/melamra.html). USFDA (2008). Interim safety and risk assessment of melamine and its analogues in food for humans. Silver Spring, MD, United States Department of Health and Human Services, Food and Drug Administration, Center for Food Safety and Nutrition (http://www.cfsan.fda.gov/~dms/melamra3.html; accessed 12 November 2008). Weintraub PG (2001). Effects of cyromazine and abamectin on the pea leafminer Liriomyza huidobrensis (Diptera: Agromyzidae) and its parasitoid Diglyphus isaea (Hymenoptera: Eulophidae) in potatoes. Crop Protection, 20: 207–213. WHO (2004). Sodium dichloroisocyanurate. In: Safety evaluation of certain food additives and contaminants. Prepared by the sixty-first meeting of the Joint FAO/WHO Expert Committee on Food Additives. Geneva, World Health Organization (WHO Food Additives Series, No. 52; http://whqlibdoc.who.int/publications/2004/924166052X.pdf).
WHO (2008a). Melamine-contaminated powdered infant formula, China. Weekly Epidemiological Record, No. 39. Geneva, World Health Organization, p. 350 (http://www.who.int/wer/2008/wer8339.pdf). WHO (2008b). Melamine-contamination event, China, September–October 2008. Geneva, World Health Organization (http://www.who.int/foodsafety/fs_management/infosan_events/en/print.html; accessed 12 November 2008). WHO (2008c). Melamine and cyanuric acid: Toxicity, preliminary risk assessment and guidance on levels in food. Geneva, World Health Organization, 25 September 2008 (http://www.who.int/foodsafety/fs_management/Melamine.pdf).

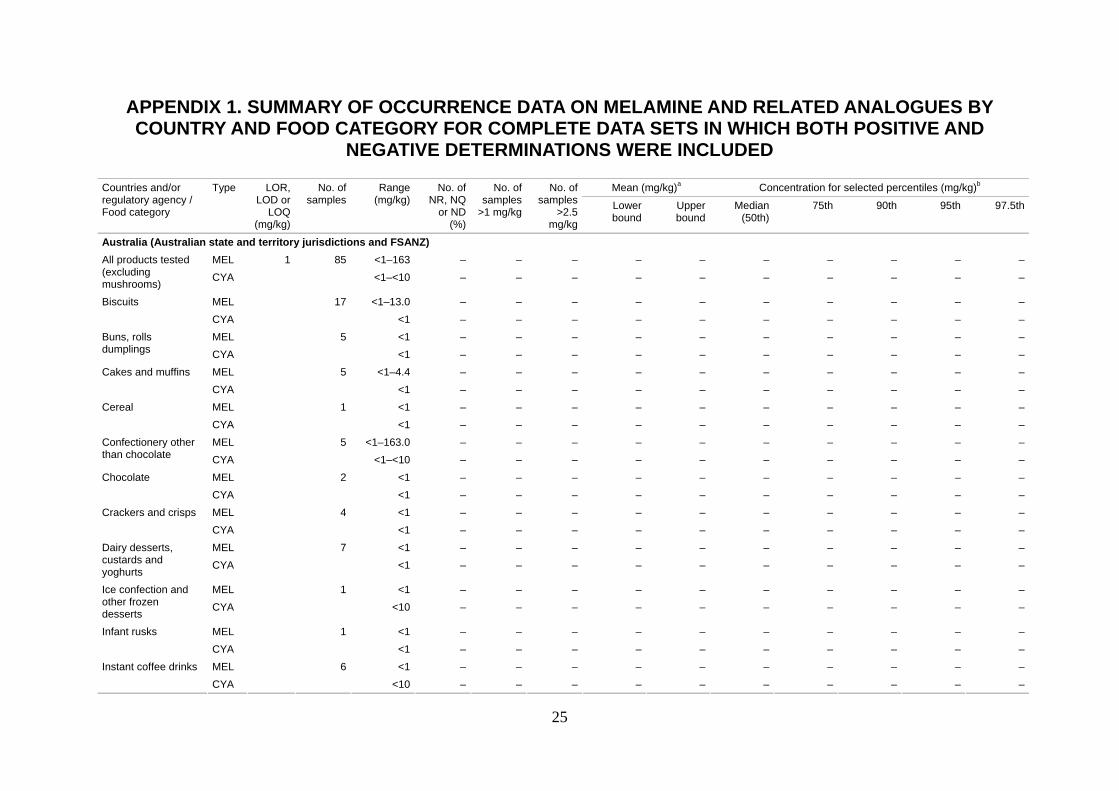
25
APPENDIX 1. SUMMARY OF OCCURRENCE DATA ON MELAMINE AND RELATED ANALOGUES BY COUNTRY AND FOOD CATEGORY FOR COMPLETE DATA SETS IN WHICH BOTH POSITIVE AND
NEGATIVE DETERMINATIONS WERE INCLUDED
Mean (mg/kg)a Concentration for selected percentiles (mg/kg)b Countries and/or regulatory agency / Food category
Type LOR, LOD or
LOQ (mg/kg)
No. of samples
Range (mg/kg)
No. of NR, NQ
or ND (%)
No. of samples
>1 mg/kg
No. of samples
>2.5 mg/kg
Lower bound
Upper bound
Median (50th)
75th 90th 95th 97.5th
Australia (Australian state and territory jurisdictions and FSANZ) MEL <1–163 – – – – – – – – – – All products tested
(excluding mushrooms) CYA
85<1–<10 – – – – – – – – – –
MEL <1–13.0 – – – – – – – – – – Biscuits CYA
17<1 – – – – – – – – – –
MEL <1 – – – – – – – – – – Buns, rolls dumplings CYA
5<1 – – – – – – – – – –
MEL <1–4.4 – – – – – – – – – – Cakes and muffins CYA
5<1 – – – – – – – – – –
MEL <1 – – – – – – – – – – Cereal CYA
1<1 – – – – – – – – – –
MEL <1–163.0 – – – – – – – – – – Confectionery other than chocolate CYA
5<1–<10 – – – – – – – – – –
MEL <1 – – – – – – – – – – Chocolate CYA
2<1 – – – – – – – – – –
MEL <1 – – – – – – – – – – Crackers and crisps CYA
4<1 – – – – – – – – – –
MEL <1 – – – – – – – – – – Dairy desserts, custards and yoghurts CYA
7<1 – – – – – – – – – –
MEL <1 – – – – – – – – – – Ice confection and other frozen desserts CYA
1<10 – – – – – – – – – –
MEL <1 – – – – – – – – – – Infant rusks CYA
1<1 – – – – – – – – – –
MEL <1 – – – – – – – – – – Instant coffee drinks CYA
1
6<10 – – – – – – – – – –
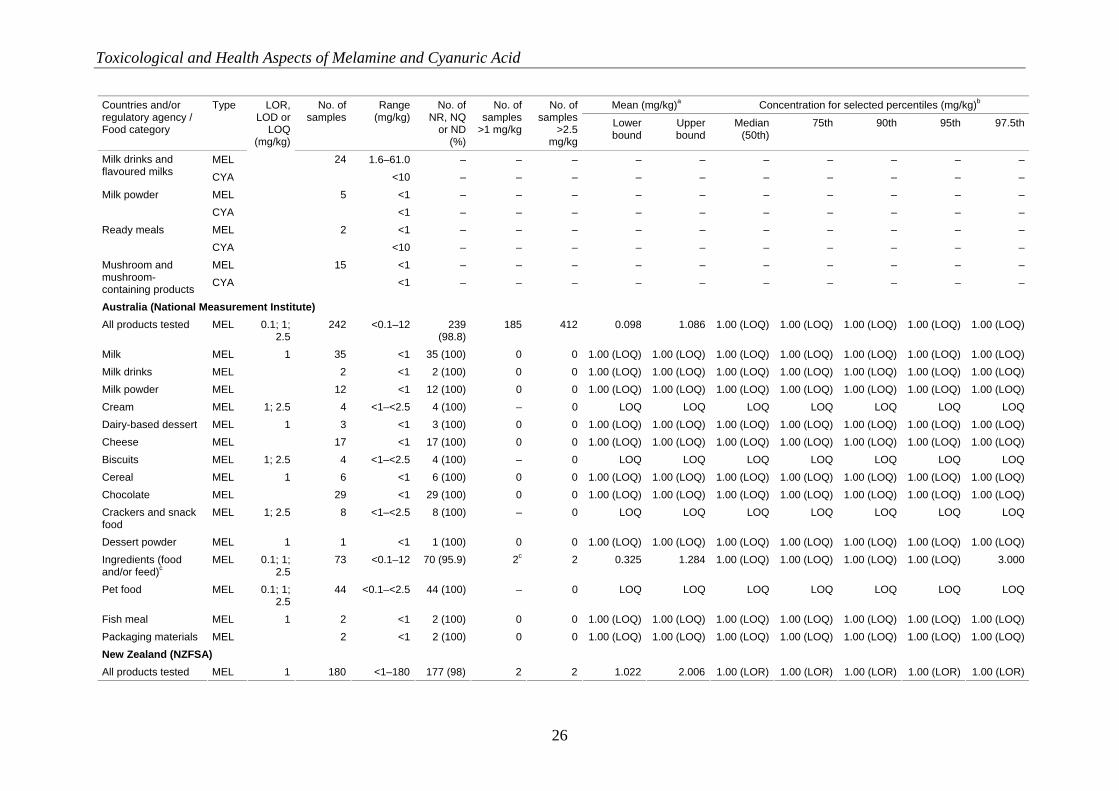
Toxicological and Health Aspects of Melamine and Cyanuric Acid
26
Mean (mg/kg)a Concentration for selected percentiles (mg/kg)b Countries and/or regulatory agency / Food category
Type LOR, LOD or
LOQ (mg/kg)
No. of samples
Range (mg/kg)
No. of NR, NQ
or ND (%)
No. of samples
>1 mg/kg
No. of samples
>2.5 mg/kg
Lower bound
Upper bound
Median (50th)
75th 90th 95th 97.5th
MEL 1.6–61.0 – – – – – – – – – – Milk drinks and flavoured milks CYA
24
<10 – – – – – – – – – – MEL <1 – – – – – – – – – – Milk powder CYA
5<1 – – – – – – – – – –
MEL <1 – – – – – – – – – – Ready meals CYA
2<10 – – – – – – – – – –
MEL <1 – – – – – – – – – – Mushroom and mushroom-containing products CYA
15<1 – – – – – – – – – –
Australia (National Measurement Institute) All products tested MEL 0.1; 1;
2.5 242 <0.1–12 239
(98.8)185 412 0.098 1.086 1.00 (LOQ) 1.00 (LOQ) 1.00 (LOQ) 1.00 (LOQ) 1.00 (LOQ)
Milk MEL 35 <1 35 (100) 0 0 1.00 (LOQ) 1.00 (LOQ) 1.00 (LOQ) 1.00 (LOQ) 1.00 (LOQ) 1.00 (LOQ) 1.00 (LOQ) Milk drinks MEL 2 <1 2 (100) 0 0 1.00 (LOQ) 1.00 (LOQ) 1.00 (LOQ) 1.00 (LOQ) 1.00 (LOQ) 1.00 (LOQ) 1.00 (LOQ) Milk powder MEL
1
12 <1 12 (100) 0 0 1.00 (LOQ) 1.00 (LOQ) 1.00 (LOQ) 1.00 (LOQ) 1.00 (LOQ) 1.00 (LOQ) 1.00 (LOQ) Cream MEL 1; 2.5 4 <1–<2.5 4 (100) – 0 LOQ LOQ LOQ LOQ LOQ LOQ LOQ Dairy-based dessert MEL 3 <1 3 (100) 0 0 1.00 (LOQ) 1.00 (LOQ) 1.00 (LOQ) 1.00 (LOQ) 1.00 (LOQ) 1.00 (LOQ) 1.00 (LOQ) Cheese MEL
1 17 <1 17 (100) 0 0 1.00 (LOQ) 1.00 (LOQ) 1.00 (LOQ) 1.00 (LOQ) 1.00 (LOQ) 1.00 (LOQ) 1.00 (LOQ)
Biscuits MEL 1; 2.5 4 <1–<2.5 4 (100) – 0 LOQ LOQ LOQ LOQ LOQ LOQ LOQ Cereal MEL 6 <1 6 (100) 0 0 1.00 (LOQ) 1.00 (LOQ) 1.00 (LOQ) 1.00 (LOQ) 1.00 (LOQ) 1.00 (LOQ) 1.00 (LOQ) Chocolate MEL
1 29 <1 29 (100) 0 0 1.00 (LOQ) 1.00 (LOQ) 1.00 (LOQ) 1.00 (LOQ) 1.00 (LOQ) 1.00 (LOQ) 1.00 (LOQ)
Crackers and snack food
MEL 1; 2.5 8 <1–<2.5 8 (100) – 0 LOQ LOQ LOQ LOQ LOQ LOQ LOQ
Dessert powder MEL 1 1 <1 1 (100) 0 0 1.00 (LOQ) 1.00 (LOQ) 1.00 (LOQ) 1.00 (LOQ) 1.00 (LOQ) 1.00 (LOQ) 1.00 (LOQ) Ingredients (food and/or feed)c
MEL 0.1; 1; 2.5
73 <0.1–12 70 (95.9) 2c 2 0.325 1.284 1.00 (LOQ) 1.00 (LOQ) 1.00 (LOQ) 1.00 (LOQ) 3.000
Pet food MEL 0.1; 1; 2.5
44 <0.1–<2.5 44 (100) – 0 LOQ LOQ LOQ LOQ LOQ LOQ LOQ
Fish meal MEL 2 <1 2 (100) 0 0 1.00 (LOQ) 1.00 (LOQ) 1.00 (LOQ) 1.00 (LOQ) 1.00 (LOQ) 1.00 (LOQ) 1.00 (LOQ) Packaging materials MEL
1 2 <1 2 (100) 0 0 1.00 (LOQ) 1.00 (LOQ) 1.00 (LOQ) 1.00 (LOQ) 1.00 (LOQ) 1.00 (LOQ) 1.00 (LOQ)
New Zealand (NZFSA) All products tested MEL 1 180 <1–180 177 (98) 2 2 1.022 2.006 1.00 (LOR) 1.00 (LOR) 1.00 (LOR) 1.00 (LOR) 1.00 (LOR)
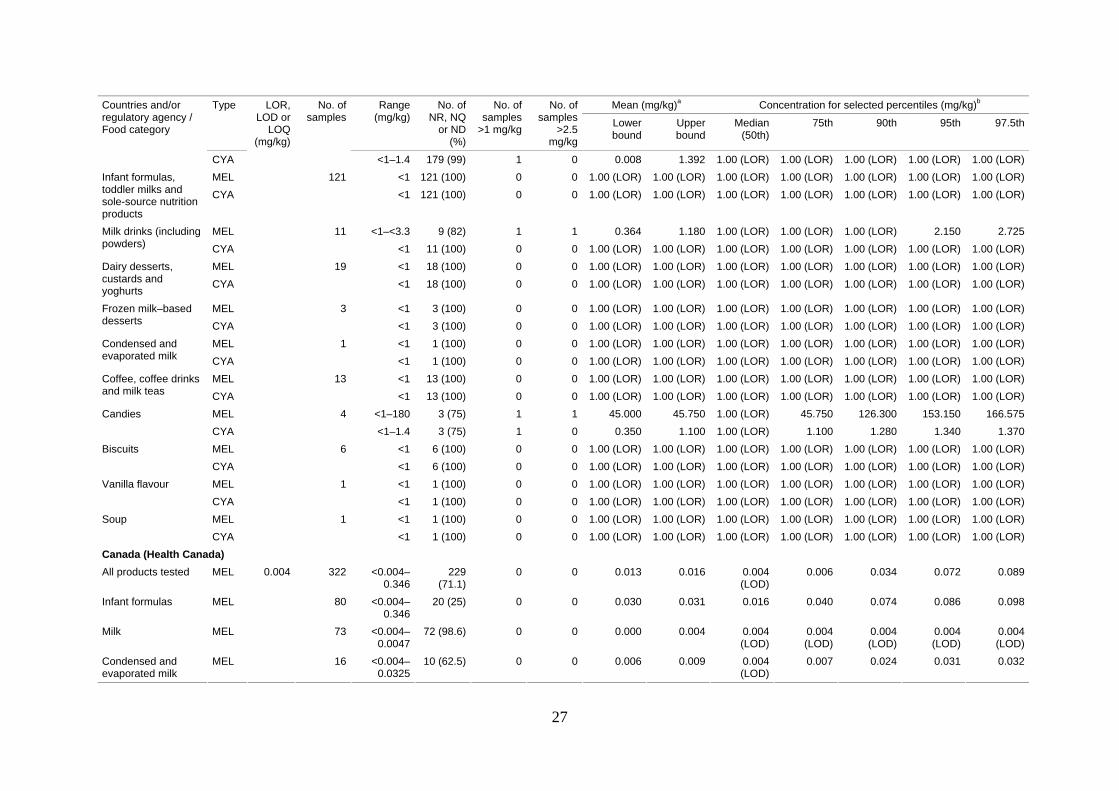
27
Mean (mg/kg)a Concentration for selected percentiles (mg/kg)b Countries and/or regulatory agency / Food category
Type LOR, LOD or
LOQ (mg/kg)
No. of samples
Range (mg/kg)
No. of NR, NQ
or ND (%)
No. of samples
>1 mg/kg
No. of samples
>2.5 mg/kg
Lower bound
Upper bound
Median (50th)
75th 90th 95th 97.5th
CYA <1–1.4 179 (99) 1 0 0.008 1.392 1.00 (LOR) 1.00 (LOR) 1.00 (LOR) 1.00 (LOR) 1.00 (LOR) MEL <1 121 (100) 0 0 1.00 (LOR) 1.00 (LOR) 1.00 (LOR) 1.00 (LOR) 1.00 (LOR) 1.00 (LOR) 1.00 (LOR) Infant formulas,
toddler milks and sole-source nutrition products
CYA 121
<1 121 (100) 0 0 1.00 (LOR) 1.00 (LOR) 1.00 (LOR) 1.00 (LOR) 1.00 (LOR) 1.00 (LOR) 1.00 (LOR)
MEL <1–<3.3 9 (82) 1 1 0.364 1.180 1.00 (LOR) 1.00 (LOR) 1.00 (LOR) 2.150 2.725 Milk drinks (including powders) CYA
11<1 11 (100) 0 0 1.00 (LOR) 1.00 (LOR) 1.00 (LOR) 1.00 (LOR) 1.00 (LOR) 1.00 (LOR) 1.00 (LOR)
MEL <1 18 (100) 0 0 1.00 (LOR) 1.00 (LOR) 1.00 (LOR) 1.00 (LOR) 1.00 (LOR) 1.00 (LOR) 1.00 (LOR) Dairy desserts, custards and yoghurts CYA
19<1 18 (100) 0 0 1.00 (LOR) 1.00 (LOR) 1.00 (LOR) 1.00 (LOR) 1.00 (LOR) 1.00 (LOR) 1.00 (LOR)
MEL <1 3 (100) 0 0 1.00 (LOR) 1.00 (LOR) 1.00 (LOR) 1.00 (LOR) 1.00 (LOR) 1.00 (LOR) 1.00 (LOR) Frozen milk–based desserts CYA
3<1 3 (100) 0 0 1.00 (LOR) 1.00 (LOR) 1.00 (LOR) 1.00 (LOR) 1.00 (LOR) 1.00 (LOR) 1.00 (LOR)
MEL <1 1 (100) 0 0 1.00 (LOR) 1.00 (LOR) 1.00 (LOR) 1.00 (LOR) 1.00 (LOR) 1.00 (LOR) 1.00 (LOR) Condensed and evaporated milk CYA
1<1 1 (100) 0 0 1.00 (LOR) 1.00 (LOR) 1.00 (LOR) 1.00 (LOR) 1.00 (LOR) 1.00 (LOR) 1.00 (LOR)
MEL <1 13 (100) 0 0 1.00 (LOR) 1.00 (LOR) 1.00 (LOR) 1.00 (LOR) 1.00 (LOR) 1.00 (LOR) 1.00 (LOR) Coffee, coffee drinks and milk teas CYA
13<1 13 (100) 0 0 1.00 (LOR) 1.00 (LOR) 1.00 (LOR) 1.00 (LOR) 1.00 (LOR) 1.00 (LOR) 1.00 (LOR)
MEL <1–180 3 (75) 1 1 45.000 45.750 1.00 (LOR) 45.750 126.300 153.150 166.575 Candies CYA
4<1–1.4 3 (75) 1 0 0.350 1.100 1.00 (LOR) 1.100 1.280 1.340 1.370
MEL <1 6 (100) 0 0 1.00 (LOR) 1.00 (LOR) 1.00 (LOR) 1.00 (LOR) 1.00 (LOR) 1.00 (LOR) 1.00 (LOR) Biscuits CYA
6<1 6 (100) 0 0 1.00 (LOR) 1.00 (LOR) 1.00 (LOR) 1.00 (LOR) 1.00 (LOR) 1.00 (LOR) 1.00 (LOR)
MEL <1 1 (100) 0 0 1.00 (LOR) 1.00 (LOR) 1.00 (LOR) 1.00 (LOR) 1.00 (LOR) 1.00 (LOR) 1.00 (LOR) Vanilla flavour CYA
1<1 1 (100) 0 0 1.00 (LOR) 1.00 (LOR) 1.00 (LOR) 1.00 (LOR) 1.00 (LOR) 1.00 (LOR) 1.00 (LOR)
MEL <1 1 (100) 0 0 1.00 (LOR) 1.00 (LOR) 1.00 (LOR) 1.00 (LOR) 1.00 (LOR) 1.00 (LOR) 1.00 (LOR) Soup CYA
1<1 1 (100) 0 0 1.00 (LOR) 1.00 (LOR) 1.00 (LOR) 1.00 (LOR) 1.00 (LOR) 1.00 (LOR) 1.00 (LOR)
Canada (Health Canada) All products tested MEL 322 <0.004–
0.346229
(71.1)0 0 0.013 0.016 0.004
(LOD)0.006 0.034 0.072 0.089
Infant formulas MEL 80 <0.004–0.346
20 (25) 0 0 0.030 0.031 0.016 0.040 0.074 0.086 0.098
Milk MEL 73 <0.004–0.0047
72 (98.6) 0 0 0.000 0.004 0.004 (LOD)
0.004 (LOD)
0.004 (LOD)
0.004 (LOD)
0.004 (LOD)
Condensed and evaporated milk
MEL
0.004
16 <0.004–0.0325
10 (62.5) 0 0 0.006 0.009 0.004 (LOD)
0.007 0.024 0.031 0.032
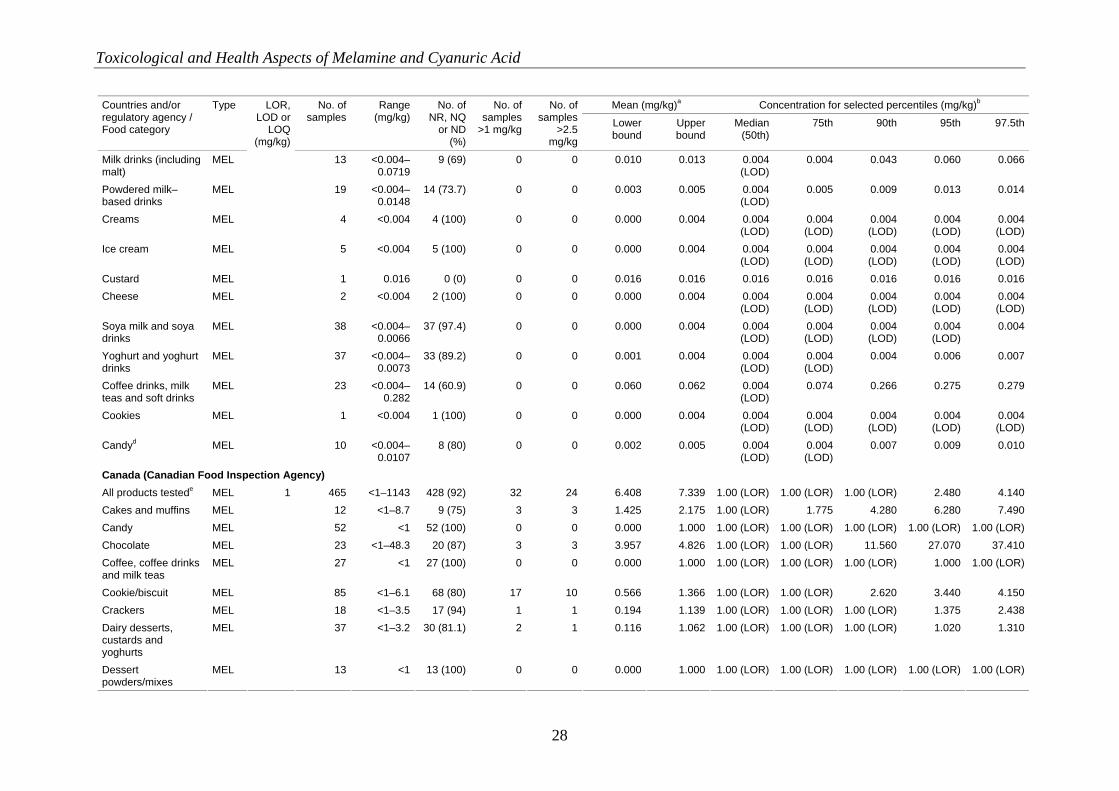
Toxicological and Health Aspects of Melamine and Cyanuric Acid
28
Mean (mg/kg)a Concentration for selected percentiles (mg/kg)b Countries and/or regulatory agency / Food category
Type LOR, LOD or
LOQ (mg/kg)
No. of samples
Range (mg/kg)
No. of NR, NQ
or ND (%)
No. of samples
>1 mg/kg
No. of samples
>2.5 mg/kg
Lower bound
Upper bound
Median (50th)
75th 90th 95th 97.5th
Milk drinks (including malt)
MEL 13 <0.004–0.0719
9 (69) 0 0 0.010 0.013 0.004 (LOD)
0.004 0.043 0.060 0.066
Powdered milk–based drinks
MEL 19 <0.004–0.0148
14 (73.7) 0 0 0.003 0.005 0.004 (LOD)
0.005 0.009 0.013 0.014
Creams MEL 4 <0.004 4 (100) 0 0 0.000 0.004 0.004 (LOD)
0.004 (LOD)
0.004 (LOD)
0.004 (LOD)
0.004 (LOD)
Ice cream MEL 5 <0.004 5 (100) 0 0 0.000 0.004 0.004 (LOD)
0.004 (LOD)
0.004 (LOD)
0.004 (LOD)
0.004 (LOD)
Custard MEL 1 0.016 0 (0) 0 0 0.016 0.016 0.016 0.016 0.016 0.016 0.016 Cheese MEL 2 <0.004 2 (100) 0 0 0.000 0.004 0.004
(LOD)0.004 (LOD)
0.004 (LOD)
0.004 (LOD)
0.004 (LOD)
Soya milk and soya drinks
MEL 38 <0.004–0.0066
37 (97.4) 0 0 0.000 0.004 0.004 (LOD)
0.004 (LOD)
0.004 (LOD)
0.004 (LOD)
0.004
Yoghurt and yoghurt drinks
MEL 37 <0.004–0.0073
33 (89.2) 0 0 0.001 0.004 0.004 (LOD)
0.004 (LOD)
0.004 0.006 0.007
Coffee drinks, milk teas and soft drinks
MEL 23 <0.004–0.282
14 (60.9) 0 0 0.060 0.062 0.004 (LOD)
0.074 0.266 0.275 0.279
Cookies MEL 1 <0.004 1 (100) 0 0 0.000 0.004 0.004 (LOD)
0.004 (LOD)
0.004 (LOD)
0.004 (LOD)
0.004 (LOD)
Candyd MEL 10 <0.004–0.0107
8 (80) 0 0 0.002 0.005 0.004 (LOD)
0.004 (LOD)
0.007 0.009 0.010
Canada (Canadian Food Inspection Agency) All products testede MEL 465 <1–1143 428 (92) 32 24 6.408 7.339 1.00 (LOR) 1.00 (LOR) 1.00 (LOR) 2.480 4.140 Cakes and muffins MEL 12 <1–8.7 9 (75) 3 3 1.425 2.175 1.00 (LOR) 1.775 4.280 6.280 7.490 Candy MEL 52 <1 52 (100) 0 0 0.000 1.000 1.00 (LOR) 1.00 (LOR) 1.00 (LOR) 1.00 (LOR) 1.00 (LOR) Chocolate MEL 23 <1–48.3 20 (87) 3 3 3.957 4.826 1.00 (LOR) 1.00 (LOR) 11.560 27.070 37.410 Coffee, coffee drinks and milk teas
MEL 27 <1 27 (100) 0 0 0.000 1.000 1.00 (LOR) 1.00 (LOR) 1.00 (LOR) 1.000 1.00 (LOR)
Cookie/biscuit MEL 85 <1–6.1 68 (80) 17 10 0.566 1.366 1.00 (LOR) 1.00 (LOR) 2.620 3.440 4.150 Crackers MEL 18 <1–3.5 17 (94) 1 1 0.194 1.139 1.00 (LOR) 1.00 (LOR) 1.00 (LOR) 1.375 2.438 Dairy desserts, custards and yoghurts
MEL 37 <1–3.2 30 (81.1) 2 1 0.116 1.062 1.00 (LOR) 1.00 (LOR) 1.00 (LOR) 1.020 1.310
Dessert powders/mixes
MEL
1
13 <1 13 (100) 0 0 0.000 1.000 1.00 (LOR) 1.00 (LOR) 1.00 (LOR) 1.00 (LOR) 1.00 (LOR)
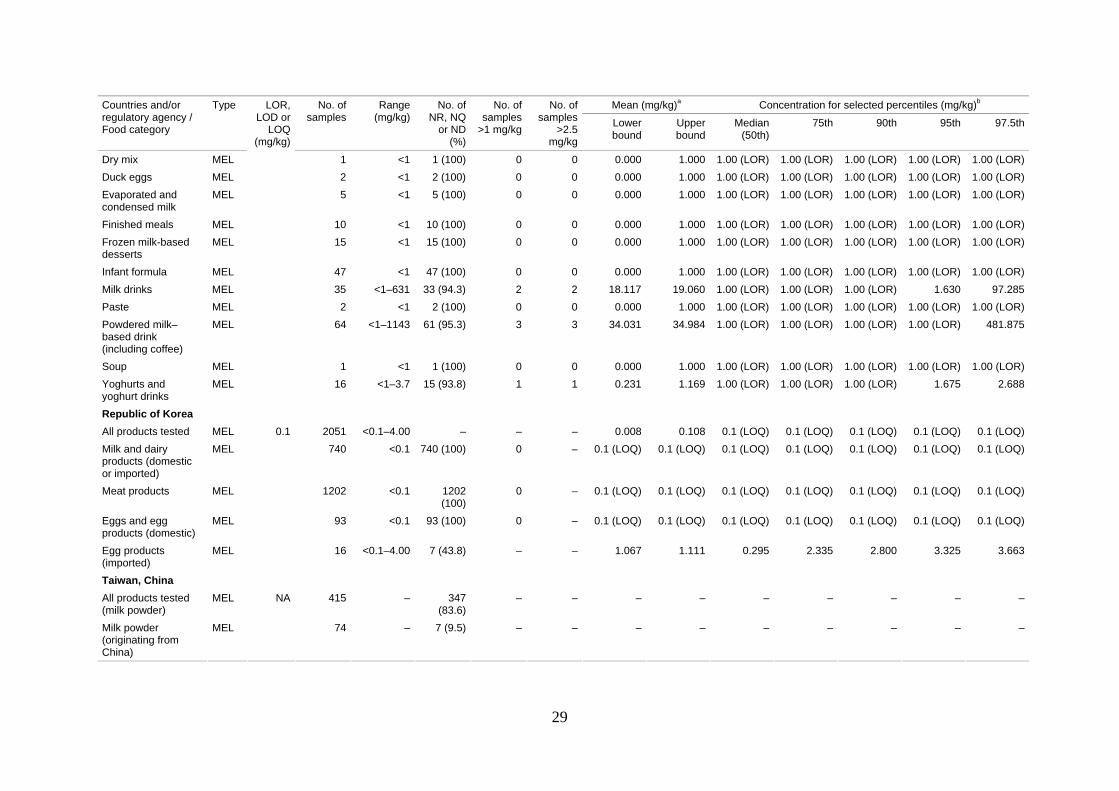
29
Mean (mg/kg)a Concentration for selected percentiles (mg/kg)b Countries and/or regulatory agency / Food category
Type LOR, LOD or
LOQ (mg/kg)
No. of samples
Range (mg/kg)
No. of NR, NQ
or ND (%)
No. of samples
>1 mg/kg
No. of samples
>2.5 mg/kg
Lower bound
Upper bound
Median (50th)
75th 90th 95th 97.5th
Dry mix MEL 1 <1 1 (100) 0 0 0.000 1.000 1.00 (LOR) 1.00 (LOR) 1.00 (LOR) 1.00 (LOR) 1.00 (LOR) Duck eggs MEL 2 <1 2 (100) 0 0 0.000 1.000 1.00 (LOR) 1.00 (LOR) 1.00 (LOR) 1.00 (LOR) 1.00 (LOR) Evaporated and condensed milk
MEL 5 <1 5 (100) 0 0 0.000 1.000 1.00 (LOR) 1.00 (LOR) 1.00 (LOR) 1.00 (LOR) 1.00 (LOR)
Finished meals MEL 10 <1 10 (100) 0 0 0.000 1.000 1.00 (LOR) 1.00 (LOR) 1.00 (LOR) 1.00 (LOR) 1.00 (LOR) Frozen milk-based desserts
MEL 15 <1 15 (100) 0 0 0.000 1.000 1.00 (LOR) 1.00 (LOR) 1.00 (LOR) 1.00 (LOR) 1.00 (LOR)
Infant formula MEL 47 <1 47 (100) 0 0 0.000 1.000 1.00 (LOR) 1.00 (LOR) 1.00 (LOR) 1.00 (LOR) 1.00 (LOR) Milk drinks MEL 35 <1–631 33 (94.3) 2 2 18.117 19.060 1.00 (LOR) 1.00 (LOR) 1.00 (LOR) 1.630 97.285 Paste MEL 2 <1 2 (100) 0 0 0.000 1.000 1.00 (LOR) 1.00 (LOR) 1.00 (LOR) 1.00 (LOR) 1.00 (LOR) Powdered milk–based drink (including coffee)
MEL 64 <1–1143 61 (95.3) 3 3 34.031 34.984 1.00 (LOR) 1.00 (LOR) 1.00 (LOR) 1.00 (LOR) 481.875
Soup MEL 1 <1 1 (100) 0 0 0.000 1.000 1.00 (LOR) 1.00 (LOR) 1.00 (LOR) 1.00 (LOR) 1.00 (LOR) Yoghurts and yoghurt drinks
MEL 16 <1–3.7 15 (93.8) 1 1 0.231 1.169 1.00 (LOR) 1.00 (LOR) 1.00 (LOR) 1.675 2.688
Republic of Korea All products tested MEL 2051 <0.1–4.00 – – – 0.008 0.108 0.1 (LOQ) 0.1 (LOQ) 0.1 (LOQ) 0.1 (LOQ) 0.1 (LOQ) Milk and dairy products (domestic or imported)
MEL 740 <0.1 740 (100) 0 – 0.1 (LOQ) 0.1 (LOQ) 0.1 (LOQ) 0.1 (LOQ) 0.1 (LOQ) 0.1 (LOQ) 0.1 (LOQ)
Meat products MEL 1202 <0.1 1202 (100)
0 – 0.1 (LOQ) 0.1 (LOQ) 0.1 (LOQ) 0.1 (LOQ) 0.1 (LOQ) 0.1 (LOQ) 0.1 (LOQ)
Eggs and egg products (domestic)
MEL 93 <0.1 93 (100) 0 – 0.1 (LOQ) 0.1 (LOQ) 0.1 (LOQ) 0.1 (LOQ) 0.1 (LOQ) 0.1 (LOQ) 0.1 (LOQ)
Egg products (imported)
MEL
0.1
16 <0.1–4.00 7 (43.8) – – 1.067 1.111 0.295 2.335 2.800 3.325 3.663
Taiwan, China All products tested (milk powder)
MEL 415 – 347 (83.6)
– – – – – – – – –
Milk powder (originating from China)
MEL
NA
74 – 7 (9.5) – – – – – – – – –
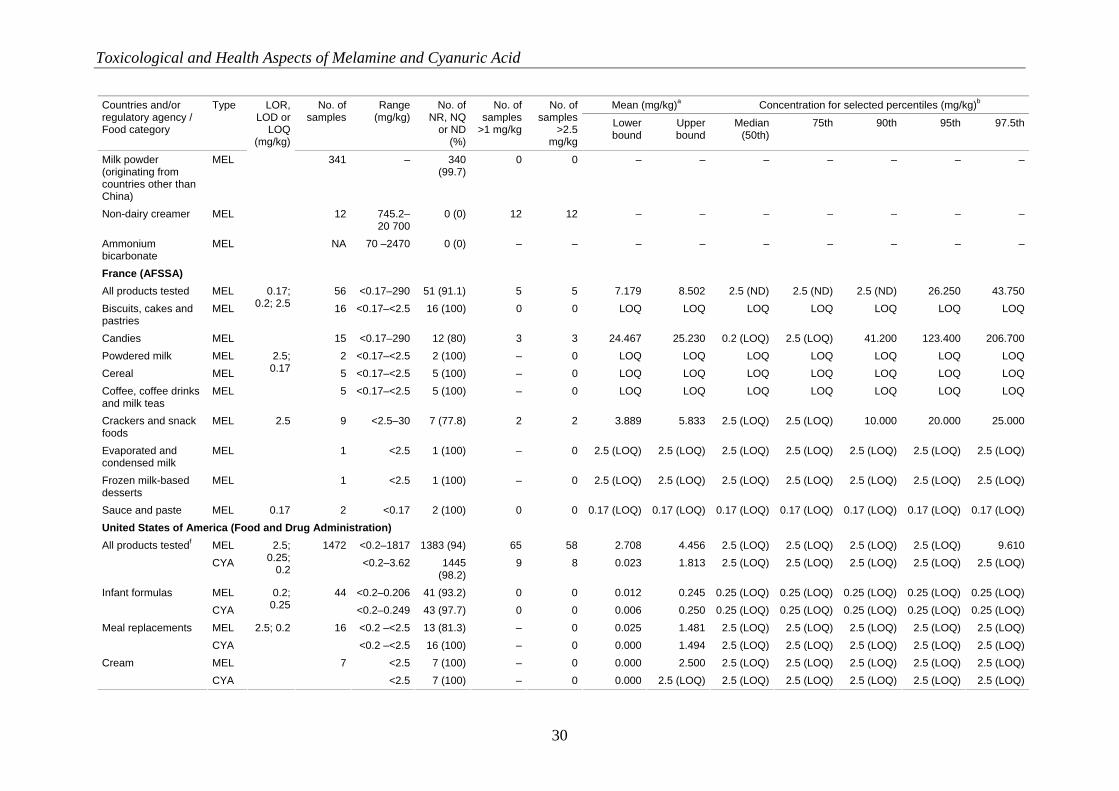
Toxicological and Health Aspects of Melamine and Cyanuric Acid
30
Mean (mg/kg)a Concentration for selected percentiles (mg/kg)b Countries and/or regulatory agency / Food category
Type LOR, LOD or
LOQ (mg/kg)
No. of samples
Range (mg/kg)
No. of NR, NQ
or ND (%)
No. of samples
>1 mg/kg
No. of samples
>2.5 mg/kg
Lower bound
Upper bound
Median (50th)
75th 90th 95th 97.5th
Milk powder (originating from countries other than China)
MEL 341 – 340 (99.7)
0 0 – – – – – – –
Non-dairy creamer MEL 12 745.2–20 700
0 (0) 12 12 – – – – – – –
Ammonium bicarbonate
MEL NA 70 –2470 0 (0) – – – – – – – – –
France (AFSSA) All products tested MEL 56 <0.17–290 51 (91.1) 5 5 7.179 8.502 2.5 (ND) 2.5 (ND) 2.5 (ND) 26.250 43.750 Biscuits, cakes and pastries
MEL 16 <0.17–<2.5 16 (100) 0 0 LOQ LOQ LOQ LOQ LOQ LOQ LOQ
Candies MEL
0.17; 0.2; 2.5
15 <0.17–290 12 (80) 3 3 24.467 25.230 0.2 (LOQ) 2.5 (LOQ) 41.200 123.400 206.700 Powdered milk MEL 2 <0.17–<2.5 2 (100) – 0 LOQ LOQ LOQ LOQ LOQ LOQ LOQ Cereal MEL 5 <0.17–<2.5 5 (100) – 0 LOQ LOQ LOQ LOQ LOQ LOQ LOQ Coffee, coffee drinks and milk teas
MEL
2.5; 0.17
5 <0.17–<2.5 5 (100) – 0 LOQ LOQ LOQ LOQ LOQ LOQ LOQ
Crackers and snack foods
MEL 9 <2.5–30 7 (77.8) 2 2 3.889 5.833 2.5 (LOQ) 2.5 (LOQ) 10.000 20.000 25.000
Evaporated and condensed milk
MEL 1 <2.5 1 (100) – 0 2.5 (LOQ) 2.5 (LOQ) 2.5 (LOQ) 2.5 (LOQ) 2.5 (LOQ) 2.5 (LOQ) 2.5 (LOQ)
Frozen milk-based desserts
MEL
2.5
1 <2.5 1 (100) – 0 2.5 (LOQ) 2.5 (LOQ) 2.5 (LOQ) 2.5 (LOQ) 2.5 (LOQ) 2.5 (LOQ) 2.5 (LOQ)
Sauce and paste MEL 0.17 2 <0.17 2 (100) 0 0 0.17 (LOQ) 0.17 (LOQ) 0.17 (LOQ) 0.17 (LOQ) 0.17 (LOQ) 0.17 (LOQ) 0.17 (LOQ) United States of America (Food and Drug Administration)
MEL <0.2–1817 1383 (94) 65 58 2.708 4.456 2.5 (LOQ) 2.5 (LOQ) 2.5 (LOQ) 2.5 (LOQ) 9.610 All products testedf CYA
2.5; 0.25;
0.2
1472<0.2–3.62 1445
(98.2)9 8 0.023 1.813 2.5 (LOQ) 2.5 (LOQ) 2.5 (LOQ) 2.5 (LOQ) 2.5 (LOQ)
MEL <0.2–0.206 41 (93.2) 0 0 0.012 0.245 0.25 (LOQ) 0.25 (LOQ) 0.25 (LOQ) 0.25 (LOQ) 0.25 (LOQ) Infant formulas CYA
0.2; 0.25
44<0.2–0.249 43 (97.7) 0 0 0.006 0.250 0.25 (LOQ) 0.25 (LOQ) 0.25 (LOQ) 0.25 (LOQ) 0.25 (LOQ)
MEL <0.2 –<2.5 13 (81.3) – 0 0.025 1.481 2.5 (LOQ) 2.5 (LOQ) 2.5 (LOQ) 2.5 (LOQ) 2.5 (LOQ) Meal replacements CYA
16<0.2 –<2.5 16 (100) – 0 0.000 1.494 2.5 (LOQ) 2.5 (LOQ) 2.5 (LOQ) 2.5 (LOQ) 2.5 (LOQ)
MEL <2.5 7 (100) – 0 0.000 2.500 2.5 (LOQ) 2.5 (LOQ) 2.5 (LOQ) 2.5 (LOQ) 2.5 (LOQ) Cream CYA
2.5; 0.2
7<2.5 7 (100) – 0 0.000 2.5 (LOQ) 2.5 (LOQ) 2.5 (LOQ) 2.5 (LOQ) 2.5 (LOQ) 2.5 (LOQ)
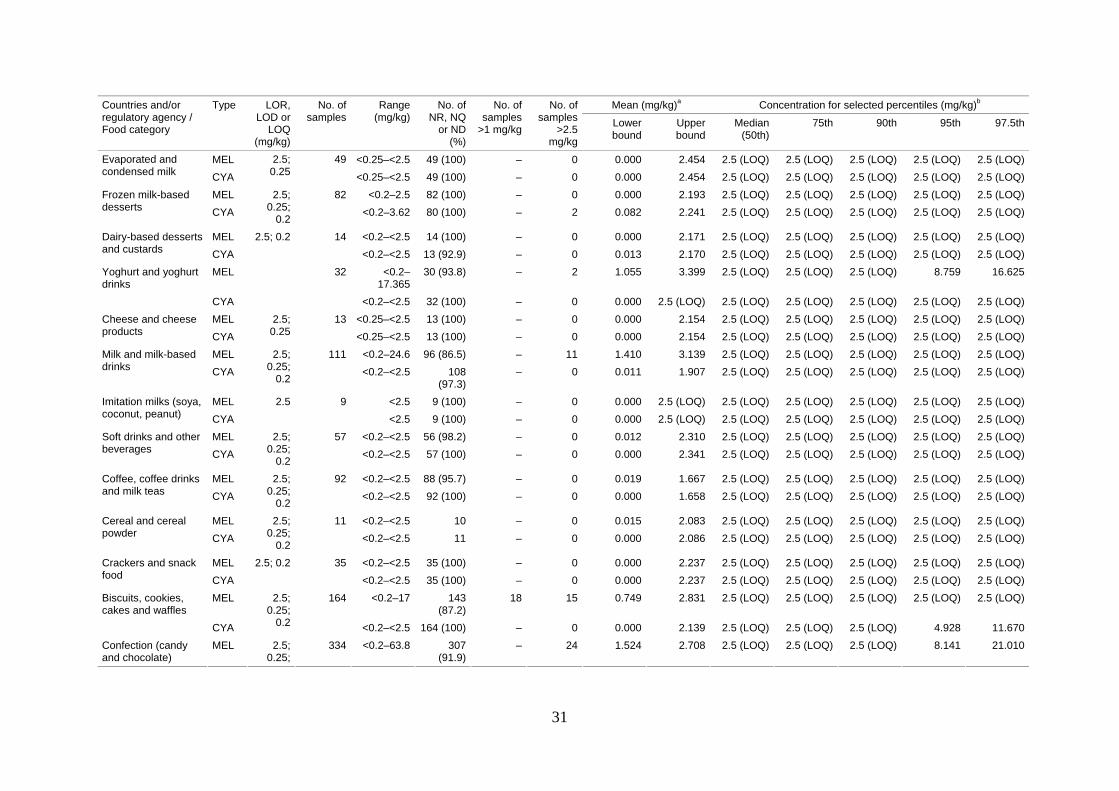
31
Mean (mg/kg)a Concentration for selected percentiles (mg/kg)b Countries and/or regulatory agency / Food category
Type LOR, LOD or
LOQ (mg/kg)
No. of samples
Range (mg/kg)
No. of NR, NQ
or ND (%)
No. of samples
>1 mg/kg
No. of samples
>2.5 mg/kg
Lower bound
Upper bound
Median (50th)
75th 90th 95th 97.5th
MEL <0.25–<2.5 49 (100) – 0 0.000 2.454 2.5 (LOQ) 2.5 (LOQ) 2.5 (LOQ) 2.5 (LOQ) 2.5 (LOQ) Evaporated and condensed milk CYA
2.5; 0.25
49
<0.25–<2.5 49 (100) – 0 0.000 2.454 2.5 (LOQ) 2.5 (LOQ) 2.5 (LOQ) 2.5 (LOQ) 2.5 (LOQ) MEL <0.2–2.5 82 (100) – 0 0.000 2.193 2.5 (LOQ) 2.5 (LOQ) 2.5 (LOQ) 2.5 (LOQ) 2.5 (LOQ) Frozen milk-based
desserts CYA 2.5;
0.25; 0.2
82<0.2–3.62 80 (100) – 2 0.082 2.241 2.5 (LOQ) 2.5 (LOQ) 2.5 (LOQ) 2.5 (LOQ) 2.5 (LOQ)
MEL <0.2–<2.5 14 (100) – 0 0.000 2.171 2.5 (LOQ) 2.5 (LOQ) 2.5 (LOQ) 2.5 (LOQ) 2.5 (LOQ) Dairy-based desserts and custards CYA
14<0.2–<2.5 13 (92.9) – 0 0.013 2.170 2.5 (LOQ) 2.5 (LOQ) 2.5 (LOQ) 2.5 (LOQ) 2.5 (LOQ)
MEL <0.2–17.365
30 (93.8) – 2 1.055 3.399 2.5 (LOQ) 2.5 (LOQ) 2.5 (LOQ) 8.759 16.625 Yoghurt and yoghurt drinks
CYA
2.5; 0.2
32
<0.2–<2.5 32 (100) – 0 0.000 2.5 (LOQ) 2.5 (LOQ) 2.5 (LOQ) 2.5 (LOQ) 2.5 (LOQ) 2.5 (LOQ) MEL <0.25–<2.5 13 (100) – 0 0.000 2.154 2.5 (LOQ) 2.5 (LOQ) 2.5 (LOQ) 2.5 (LOQ) 2.5 (LOQ) Cheese and cheese
products CYA 2.5;
0.25 13
<0.25–<2.5 13 (100) – 0 0.000 2.154 2.5 (LOQ) 2.5 (LOQ) 2.5 (LOQ) 2.5 (LOQ) 2.5 (LOQ) MEL <0.2–24.6 96 (86.5) – 11 1.410 3.139 2.5 (LOQ) 2.5 (LOQ) 2.5 (LOQ) 2.5 (LOQ) 2.5 (LOQ) Milk and milk-based
drinks CYA 2.5;
0.25; 0.2
111<0.2–<2.5 108
(97.3)– 0 0.011 1.907 2.5 (LOQ) 2.5 (LOQ) 2.5 (LOQ) 2.5 (LOQ) 2.5 (LOQ)
MEL <2.5 9 (100) – 0 0.000 2.5 (LOQ) 2.5 (LOQ) 2.5 (LOQ) 2.5 (LOQ) 2.5 (LOQ) 2.5 (LOQ) Imitation milks (soya, coconut, peanut) CYA
2.5 9<2.5 9 (100) – 0 0.000 2.5 (LOQ) 2.5 (LOQ) 2.5 (LOQ) 2.5 (LOQ) 2.5 (LOQ) 2.5 (LOQ)
MEL <0.2–<2.5 56 (98.2) – 0 0.012 2.310 2.5 (LOQ) 2.5 (LOQ) 2.5 (LOQ) 2.5 (LOQ) 2.5 (LOQ) Soft drinks and other beverages CYA
2.5; 0.25;
0.2
57<0.2–<2.5 57 (100) – 0 0.000 2.341 2.5 (LOQ) 2.5 (LOQ) 2.5 (LOQ) 2.5 (LOQ) 2.5 (LOQ)
MEL <0.2–<2.5 88 (95.7) – 0 0.019 1.667 2.5 (LOQ) 2.5 (LOQ) 2.5 (LOQ) 2.5 (LOQ) 2.5 (LOQ) Coffee, coffee drinks and milk teas CYA
2.5; 0.25;
0.2
92<0.2–<2.5 92 (100) – 0 0.000 1.658 2.5 (LOQ) 2.5 (LOQ) 2.5 (LOQ) 2.5 (LOQ) 2.5 (LOQ)
MEL <0.2–<2.5 10 – 0 0.015 2.083 2.5 (LOQ) 2.5 (LOQ) 2.5 (LOQ) 2.5 (LOQ) 2.5 (LOQ) Cereal and cereal powder CYA
2.5; 0.25;
0.2
11<0.2–<2.5 11 – 0 0.000 2.086 2.5 (LOQ) 2.5 (LOQ) 2.5 (LOQ) 2.5 (LOQ) 2.5 (LOQ)
MEL <0.2–<2.5 35 (100) – 0 0.000 2.237 2.5 (LOQ) 2.5 (LOQ) 2.5 (LOQ) 2.5 (LOQ) 2.5 (LOQ) Crackers and snack food CYA
2.5; 0.2 35<0.2–<2.5 35 (100) – 0 0.000 2.237 2.5 (LOQ) 2.5 (LOQ) 2.5 (LOQ) 2.5 (LOQ) 2.5 (LOQ)
MEL <0.2–17 143 (87.2)
18 15 0.749 2.831 2.5 (LOQ) 2.5 (LOQ) 2.5 (LOQ) 2.5 (LOQ) 2.5 (LOQ) Biscuits, cookies, cakes and waffles
CYA
2.5; 0.25;
0.2
164
<0.2–<2.5 164 (100) – 0 0.000 2.139 2.5 (LOQ) 2.5 (LOQ) 2.5 (LOQ) 4.928 11.670 Confection (candy and chocolate)
MEL 2.5; 0.25;
334 <0.2–63.8 307 (91.9)
– 24 1.524 2.708 2.5 (LOQ) 2.5 (LOQ) 2.5 (LOQ) 8.141 21.010
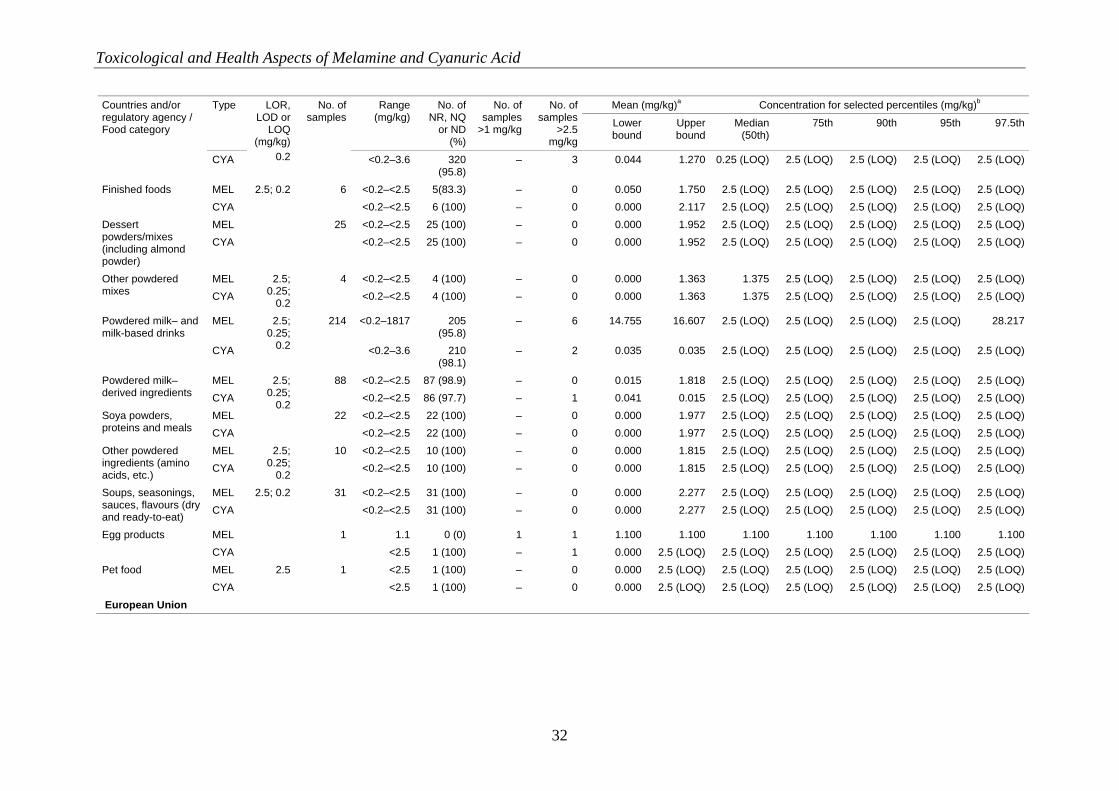
Toxicological and Health Aspects of Melamine and Cyanuric Acid
32
Mean (mg/kg)a Concentration for selected percentiles (mg/kg)b Countries and/or regulatory agency / Food category
Type LOR, LOD or
LOQ (mg/kg)
No. of samples
Range (mg/kg)
No. of NR, NQ
or ND (%)
No. of samples
>1 mg/kg
No. of samples
>2.5 mg/kg
Lower bound
Upper bound
Median (50th)
75th 90th 95th 97.5th
CYA 0.2 <0.2–3.6 320 (95.8)
– 3 0.044 1.270 0.25 (LOQ) 2.5 (LOQ) 2.5 (LOQ) 2.5 (LOQ) 2.5 (LOQ)
MEL <0.2–<2.5 5(83.3) – 0 0.050 1.750 2.5 (LOQ) 2.5 (LOQ) 2.5 (LOQ) 2.5 (LOQ) 2.5 (LOQ) Finished foods CYA
6<0.2–<2.5 6 (100) – 0 0.000 2.117 2.5 (LOQ) 2.5 (LOQ) 2.5 (LOQ) 2.5 (LOQ) 2.5 (LOQ)
MEL <0.2–<2.5 25 (100) – 0 0.000 1.952 2.5 (LOQ) 2.5 (LOQ) 2.5 (LOQ) 2.5 (LOQ) 2.5 (LOQ) Dessert powders/mixes (including almond powder)
CYA
2.5; 0.2
25<0.2–<2.5 25 (100) – 0 0.000 1.952 2.5 (LOQ) 2.5 (LOQ) 2.5 (LOQ) 2.5 (LOQ) 2.5 (LOQ)
MEL <0.2–<2.5 4 (100) – 0 0.000 1.363 1.375 2.5 (LOQ) 2.5 (LOQ) 2.5 (LOQ) 2.5 (LOQ) Other powdered mixes CYA
2.5; 0.25;
0.2
4<0.2–<2.5 4 (100) – 0 0.000 1.363 1.375 2.5 (LOQ) 2.5 (LOQ) 2.5 (LOQ) 2.5 (LOQ)
MEL <0.2–1817 205 (95.8)
– 6 14.755 16.607 2.5 (LOQ) 2.5 (LOQ) 2.5 (LOQ) 2.5 (LOQ) 28.217 Powdered milk– and milk-based drinks
CYA
2.5; 0.25;
0.2
214
<0.2–3.6 210 (98.1)
– 2 0.035 0.035 2.5 (LOQ) 2.5 (LOQ) 2.5 (LOQ) 2.5 (LOQ) 2.5 (LOQ)
MEL <0.2–<2.5 87 (98.9) – 0 0.015 1.818 2.5 (LOQ) 2.5 (LOQ) 2.5 (LOQ) 2.5 (LOQ) 2.5 (LOQ) Powdered milk–derived ingredients CYA
88<0.2–<2.5 86 (97.7) – 1 0.041 0.015 2.5 (LOQ) 2.5 (LOQ) 2.5 (LOQ) 2.5 (LOQ) 2.5 (LOQ)
MEL <0.2–<2.5 22 (100) – 0 0.000 1.977 2.5 (LOQ) 2.5 (LOQ) 2.5 (LOQ) 2.5 (LOQ) 2.5 (LOQ) Soya powders, proteins and meals CYA
2.5; 0.25;
0.2 22
<0.2–<2.5 22 (100) – 0 0.000 1.977 2.5 (LOQ) 2.5 (LOQ) 2.5 (LOQ) 2.5 (LOQ) 2.5 (LOQ) MEL <0.2–<2.5 10 (100) – 0 0.000 1.815 2.5 (LOQ) 2.5 (LOQ) 2.5 (LOQ) 2.5 (LOQ) 2.5 (LOQ) Other powdered
ingredients (amino acids, etc.) CYA
2.5; 0.25;
0.2
10<0.2–<2.5 10 (100) – 0 0.000 1.815 2.5 (LOQ) 2.5 (LOQ) 2.5 (LOQ) 2.5 (LOQ) 2.5 (LOQ)
MEL <0.2–<2.5 31 (100) – 0 0.000 2.277 2.5 (LOQ) 2.5 (LOQ) 2.5 (LOQ) 2.5 (LOQ) 2.5 (LOQ) Soups, seasonings, sauces, flavours (dry and ready-to-eat) CYA
31<0.2–<2.5 31 (100) – 0 0.000 2.277 2.5 (LOQ) 2.5 (LOQ) 2.5 (LOQ) 2.5 (LOQ) 2.5 (LOQ)
MEL 1.1 0 (0) 1 1 1.100 1.100 1.100 1.100 1.100 1.100 1.100 Egg products CYA
2.5; 0.2
1<2.5 1 (100) – 1 0.000 2.5 (LOQ) 2.5 (LOQ) 2.5 (LOQ) 2.5 (LOQ) 2.5 (LOQ) 2.5 (LOQ)
MEL <2.5 1 (100) – 0 0.000 2.5 (LOQ) 2.5 (LOQ) 2.5 (LOQ) 2.5 (LOQ) 2.5 (LOQ) 2.5 (LOQ) Pet food CYA
2.5 1<2.5 1 (100) – 0 0.000 2.5 (LOQ) 2.5 (LOQ) 2.5 (LOQ) 2.5 (LOQ) 2.5 (LOQ) 2.5 (LOQ)
European Union
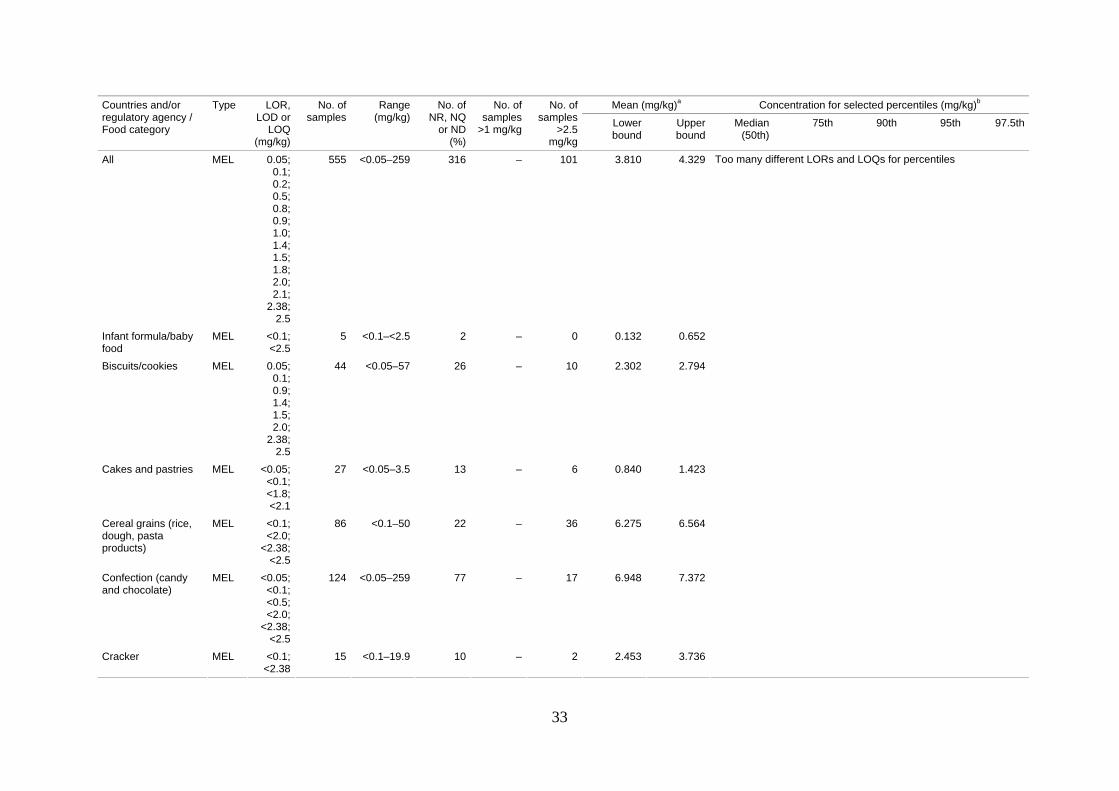
33
Mean (mg/kg)a Concentration for selected percentiles (mg/kg)b Countries and/or regulatory agency / Food category
Type LOR, LOD or
LOQ (mg/kg)
No. of samples
Range (mg/kg)
No. of NR, NQ
or ND (%)
No. of samples
>1 mg/kg
No. of samples
>2.5 mg/kg
Lower bound
Upper bound
Median (50th)
75th 90th 95th 97.5th
All MEL 0.05; 0.1; 0.2; 0.5; 0.8; 0.9; 1.0; 1.4; 1.5; 1.8; 2.0; 2.1;
2.38; 2.5
555 <0.05–259 316 – 101 3.810 4.329
Infant formula/baby food
MEL <0.1; <2.5
5 <0.1–<2.5 2 – 0 0.132 0.652
Biscuits/cookies MEL 0.05; 0.1; 0.9; 1.4; 1.5; 2.0;
2.38; 2.5
44 <0.05–57 26 – 10 2.302 2.794
Cakes and pastries MEL <0.05; <0.1; <1.8; <2.1
27 <0.05–3.5 13 – 6 0.840 1.423
Cereal grains (rice, dough, pasta products)
MEL <0.1; <2.0;
<2.38; <2.5
86 <0.1–50 22 – 36 6.275 6.564
Confection (candy and chocolate)
MEL <0.05; <0.1; <0.5; <2.0;
<2.38; <2.5
124 <0.05–259 77 – 17 6.948 7.372
Cracker MEL <0.1; <2.38
15 <0.1–19.9 10 – 2 2.453 3.736
Too many different LORs and LOQs for percentiles
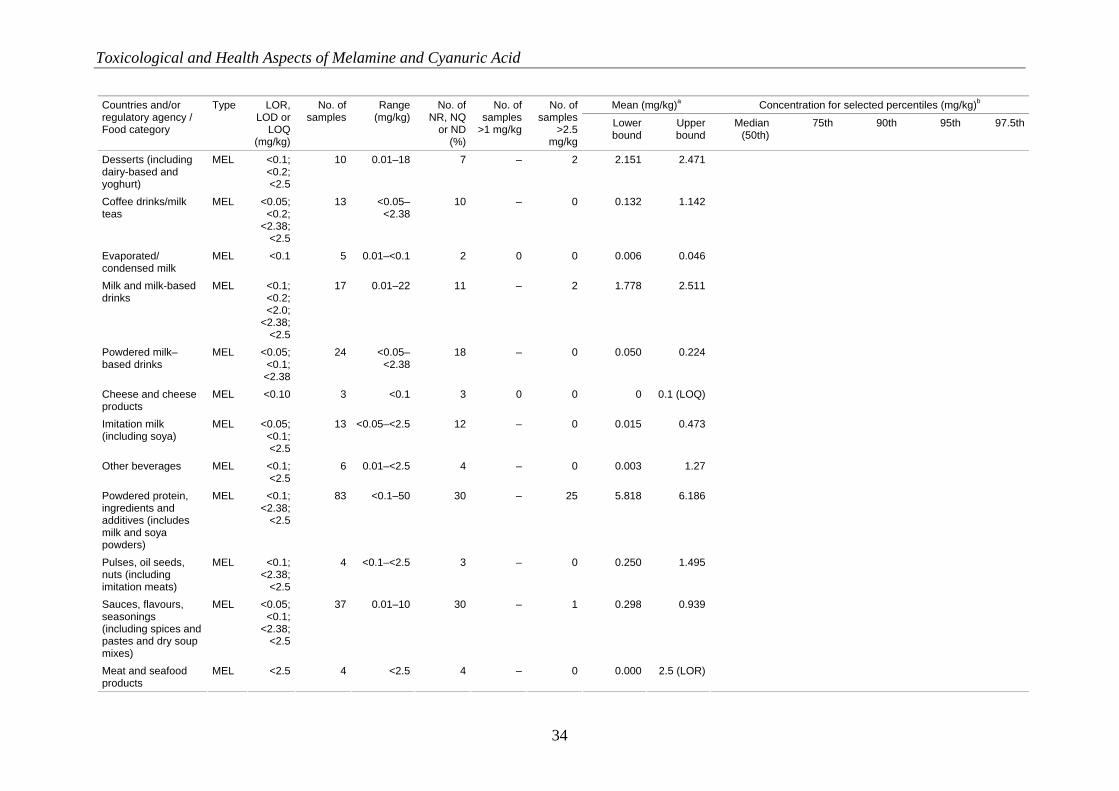
Toxicological and Health Aspects of Melamine and Cyanuric Acid
34
Mean (mg/kg)a Concentration for selected percentiles (mg/kg)b Countries and/or regulatory agency / Food category
Type LOR, LOD or
LOQ (mg/kg)
No. of samples
Range (mg/kg)
No. of NR, NQ
or ND (%)
No. of samples
>1 mg/kg
No. of samples
>2.5 mg/kg
Lower bound
Upper bound
Median (50th)
75th 90th 95th 97.5th
Desserts (including dairy-based and yoghurt)
MEL <0.1; <0.2; <2.5
10 0.01–18 7 – 2 2.151 2.471
Coffee drinks/milk teas
MEL <0.05; <0.2;
<2.38; <2.5
13 <0.05–<2.38
10 – 0 0.132 1.142
Evaporated/ condensed milk
MEL <0.1 5 0.01–<0.1 2 0 0 0.006 0.046
Milk and milk-based drinks
MEL <0.1; <0.2; <2.0;
<2.38; <2.5
17 0.01–22 11 – 2 1.778 2.511
Powdered milk–based drinks
MEL <0.05; <0.1;
<2.38
24 <0.05–<2.38
18 – 0 0.050 0.224
Cheese and cheese products
MEL <0.10 3 <0.1 3 0 0 0 0.1 (LOQ)
Imitation milk (including soya)
MEL <0.05; <0.1; <2.5
13 <0.05–<2.5 12 – 0 0.015 0.473
Other beverages MEL <0.1; <2.5
6 0.01–<2.5 4 – 0 0.003 1.27
Powdered protein, ingredients and additives (includes milk and soya powders)
MEL <0.1; <2.38;
<2.5
83 <0.1–50 30 – 25 5.818 6.186
Pulses, oil seeds, nuts (including imitation meats)
MEL <0.1; <2.38;
<2.5
4 <0.1–<2.5 3 – 0 0.250 1.495
Sauces, flavours, seasonings (including spices and pastes and dry soup mixes)
MEL <0.05; <0.1;
<2.38; <2.5
37 0.01–10 30 – 1 0.298 0.939
Meat and seafood products
MEL <2.5 4 <2.5 4 – 0 0.000 2.5 (LOR)
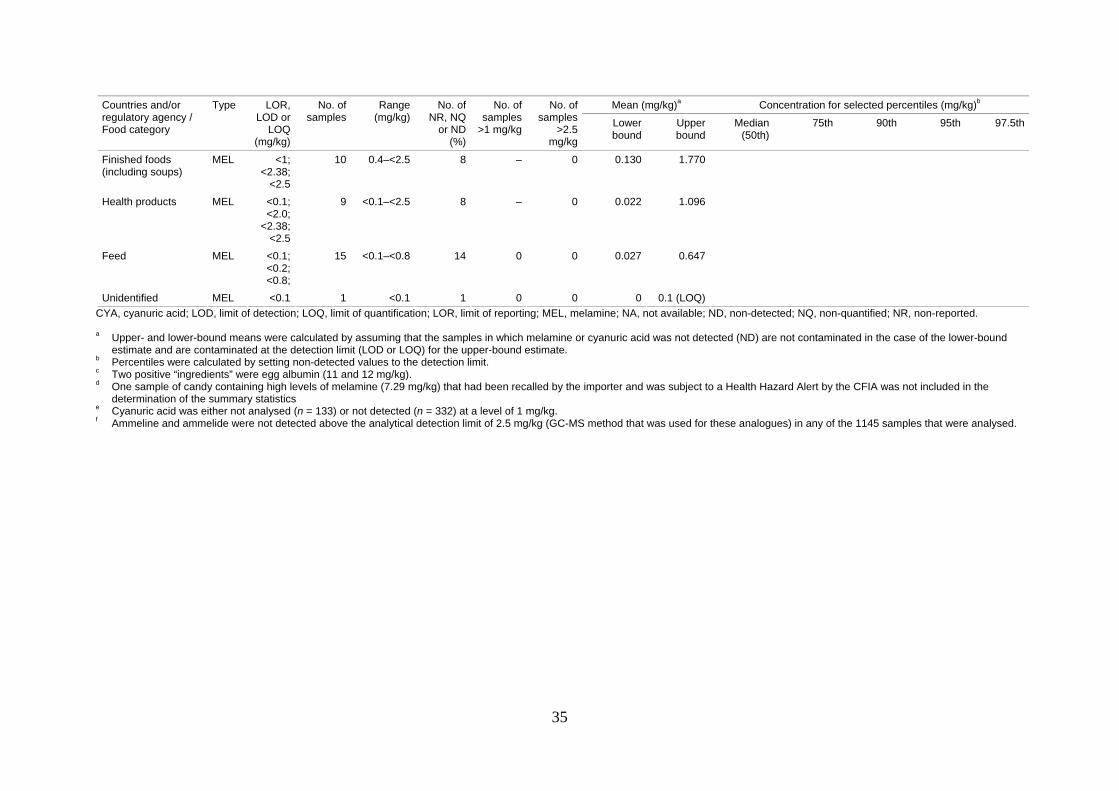
35
Mean (mg/kg)a Concentration for selected percentiles (mg/kg)b Countries and/or regulatory agency / Food category
Type LOR, LOD or
LOQ (mg/kg)
No. of samples
Range (mg/kg)
No. of NR, NQ
or ND (%)
No. of samples
>1 mg/kg
No. of samples
>2.5 mg/kg
Lower bound
Upper bound
Median (50th)
75th 90th 95th 97.5th
Finished foods (including soups)
MEL <1; <2.38;
<2.5
10 0.4–<2.5 8 – 0 0.130 1.770
Health products MEL <0.1; <2.0;
<2.38; <2.5
9 <0.1–<2.5 8 – 0 0.022 1.096
Feed MEL <0.1; <0.2; <0.8;
15 <0.1–<0.8 14 0 0 0.027 0.647
Unidentified MEL <0.1 1 <0.1 1 0 0 0 0.1 (LOQ)CYA, cyanuric acid; LOD, limit of detection; LOQ, limit of quantification; LOR, limit of reporting; MEL, melamine; NA, not available; ND, non-detected; NQ, non-quantified; NR, non-reported. a Upper- and lower-bound means were calculated by assuming that the samples in which melamine or cyanuric acid was not detected (ND) are not contaminated in the case of the lower-bound
estimate and are contaminated at the detection limit (LOD or LOQ) for the upper-bound estimate. b Percentiles were calculated by setting non-detected values to the detection limit. c Two positive “ingredients” were egg albumin (11 and 12 mg/kg). d One sample of candy containing high levels of melamine (7.29 mg/kg) that had been recalled by the importer and was subject to a Health Hazard Alert by the CFIA was not included in the
determination of the summary statistics e Cyanuric acid was either not analysed (n = 133) or not detected (n = 332) at a level of 1 mg/kg. f Ammeline and ammelide were not detected above the analytical detection limit of 2.5 mg/kg (GC-MS method that was used for these analogues) in any of the 1145 samples that were analysed.
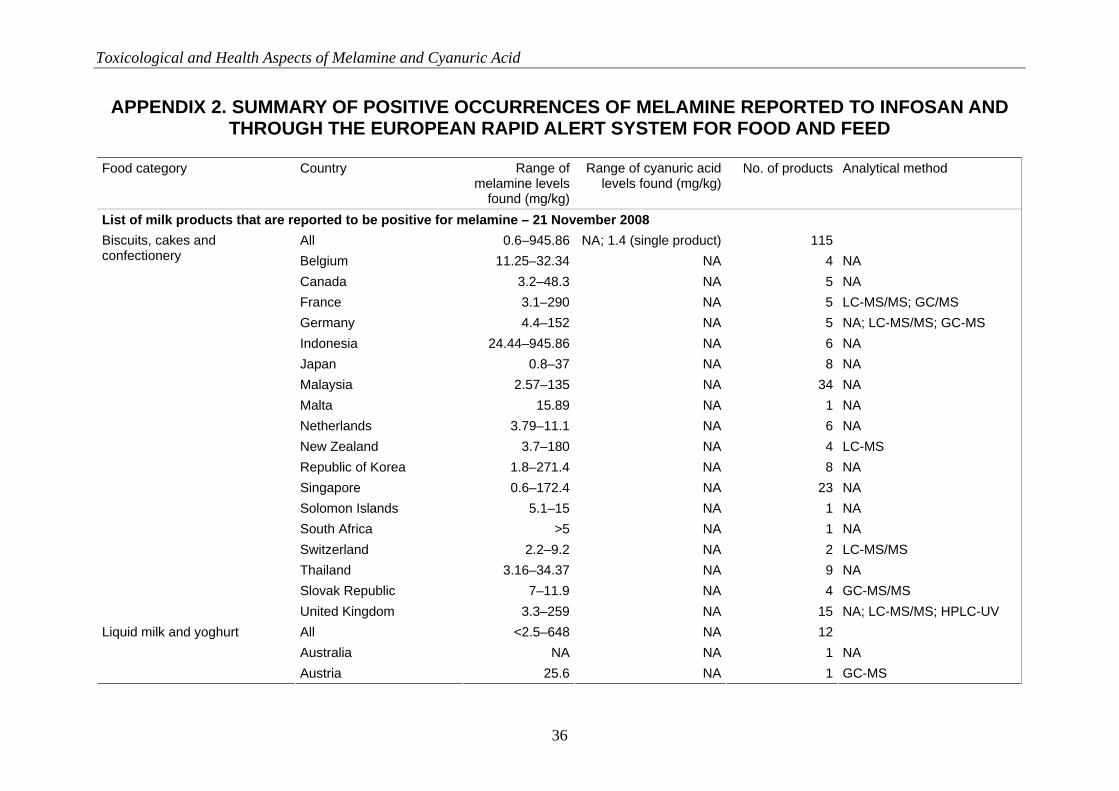
Toxicological and Health Aspects of Melamine and Cyanuric Acid
36
APPENDIX 2. SUMMARY OF POSITIVE OCCURRENCES OF MELAMINE REPORTED TO INFOSAN AND THROUGH THE EUROPEAN RAPID ALERT SYSTEM FOR FOOD AND FEED
Food category Country Range of
melamine levels found (mg/kg)
Range of cyanuric acid levels found (mg/kg)
No. of products Analytical method
List of milk products that are reported to be positive for melamine – 21 November 2008 All 0.6–945.86 NA; 1.4 (single product) 115 Belgium 11.25–32.34 NA 4 NA Canada 3.2–48.3 NA 5 NA France 3.1–290 NA 5 LC-MS/MS; GC/MS Germany 4.4–152 NA 5 NA; LC-MS/MS; GC-MS Indonesia 24.44–945.86 NA 6 NA Japan 0.8–37 NA 8 NA Malaysia 2.57–135 NA 34 NA Malta 15.89 NA 1 NA Netherlands 3.79–11.1 NA 6 NA New Zealand 3.7–180 NA 4 LC-MS Republic of Korea 1.8–271.4 NA 8 NA Singapore 0.6–172.4 NA 23 NA Solomon Islands 5.1–15 NA 1 NA South Africa >5 NA 1 NA Switzerland 2.2–9.2 NA 2 LC-MS/MS Thailand 3.16–34.37 NA 9 NA Slovak Republic 7–11.9 NA 4 GC-MS/MS
Biscuits, cakes and confectionery United Kingdom 3.3–259 NA 15 NA; LC-MS/MS; HPLC-UV
All <2.5–648 NA 12 Australia NA NA 1 NA
Liquid milk and yoghurt Austria 25.6 NA 1 GC-MS
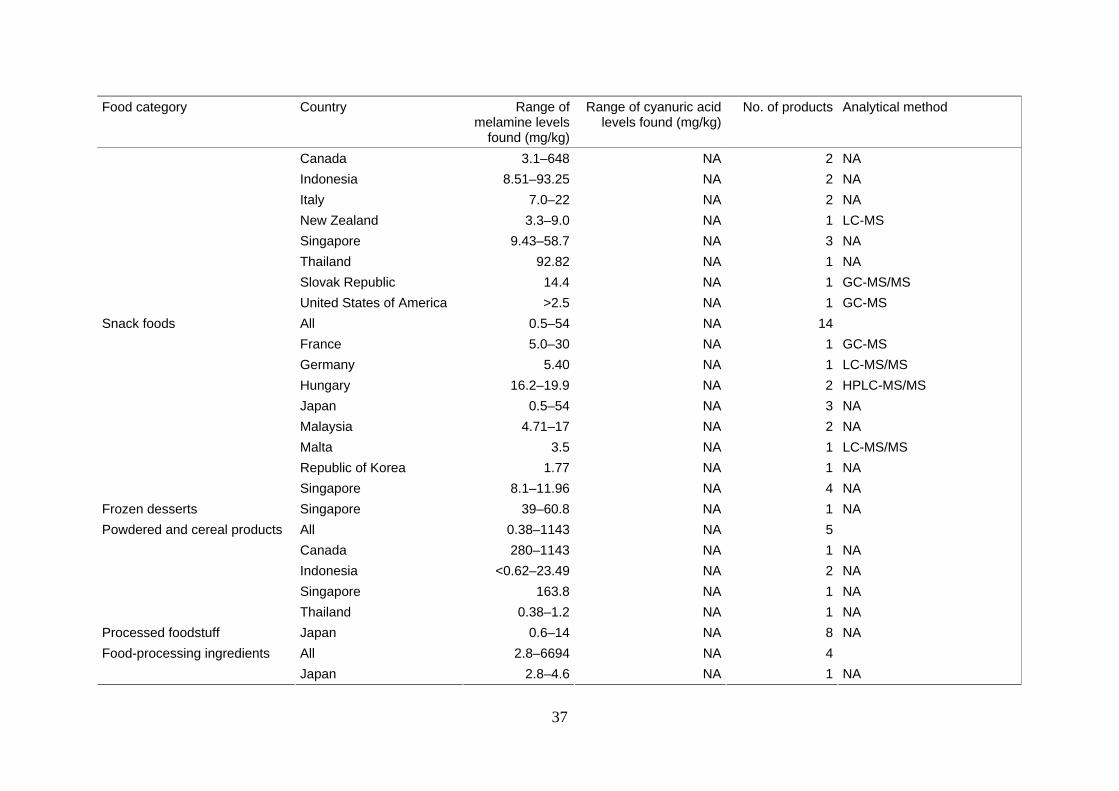
37
Food category Country Range of melamine levels
found (mg/kg)
Range of cyanuric acid levels found (mg/kg)
No. of products Analytical method
Canada 3.1–648 NA 2 NA Indonesia 8.51–93.25 NA 2 NA Italy 7.0–22 NA 2 NA New Zealand 3.3–9.0 NA 1 LC-MS Singapore 9.43–58.7 NA 3 NA Thailand 92.82 NA 1 NA Slovak Republic 14.4 NA 1 GC-MS/MS
United States of America >2.5 NA 1 GC-MS All 0.5–54 NA 14 France 5.0–30 NA 1 GC-MS Germany 5.40 NA 1 LC-MS/MS Hungary 16.2–19.9 NA 2 HPLC-MS/MS Japan 0.5–54 NA 3 NA Malaysia 4.71–17 NA 2 NA Malta 3.5 NA 1 LC-MS/MS Republic of Korea 1.77 NA 1 NA
Snack foods
Singapore 8.1–11.96 NA 4 NA Frozen desserts Singapore 39–60.8 NA 1 NA
All 0.38–1143 NA 5 Canada 280–1143 NA 1 NA Indonesia <0.62–23.49 NA 2 NA Singapore 163.8 NA 1 NA
Powdered and cereal products
Thailand 0.38–1.2 NA 1 NA Processed foodstuff Japan 0.6–14 NA 8 NA
All 2.8–6694 NA 4 Food-processing ingredients Japan 2.8–4.6 NA 1 NA
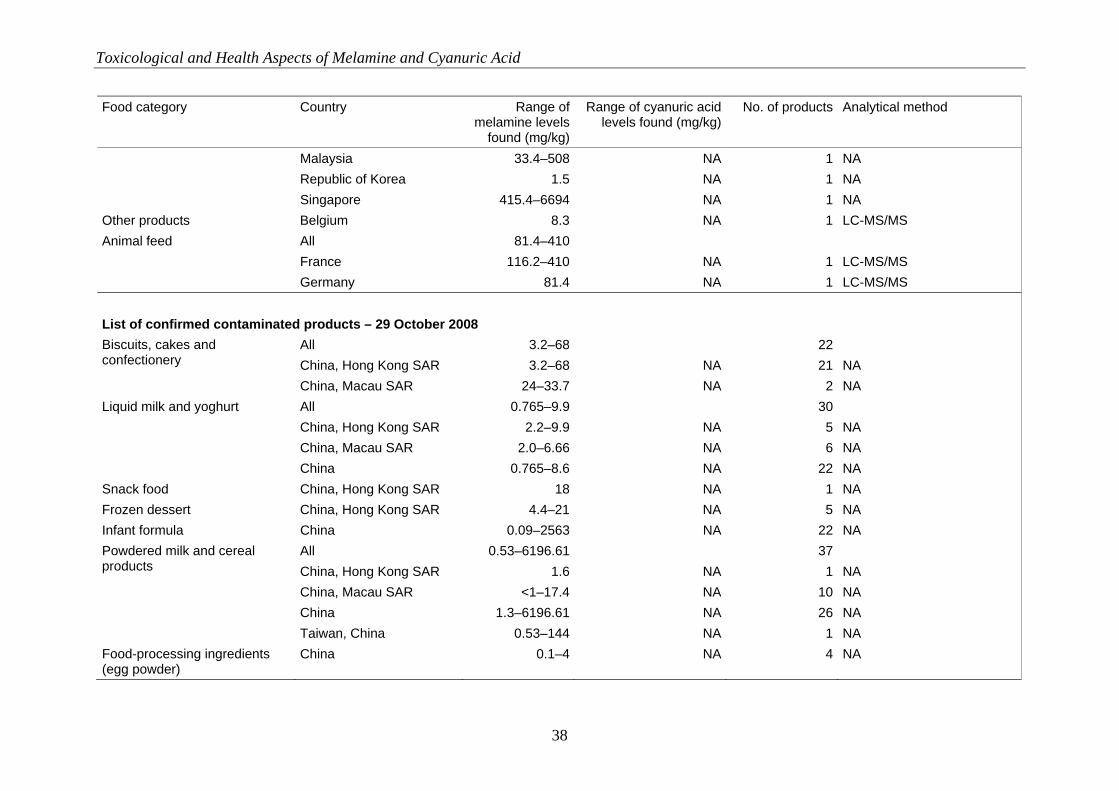
Toxicological and Health Aspects of Melamine and Cyanuric Acid
38
Food category Country Range of melamine levels
found (mg/kg)
Range of cyanuric acid levels found (mg/kg)
No. of products Analytical method
Malaysia 33.4–508 NA 1 NA Republic of Korea 1.5 NA 1 NA
Singapore 415.4–6694 NA 1 NA Other products Belgium 8.3 NA 1 LC-MS/MS
All 81.4–410 France 116.2–410 NA 1 LC-MS/MS
Animal feed
Germany 81.4 NA 1 LC-MS/MS List of confirmed contaminated products – 29 October 2008
All 3.2–68 22 China, Hong Kong SAR 3.2–68 NA 21 NA
Biscuits, cakes and confectionery
China, Macau SAR 24–33.7 NA 2 NA All 0.765–9.9 30 China, Hong Kong SAR 2.2–9.9 NA 5 NA China, Macau SAR 2.0–6.66 NA 6 NA
Liquid milk and yoghurt
China 0.765–8.6 NA 22 NA Snack food China, Hong Kong SAR 18 NA 1 NA Frozen dessert China, Hong Kong SAR 4.4–21 NA 5 NA Infant formula China 0.09–2563 NA 22 NA
All 0.53–6196.61 37 China, Hong Kong SAR 1.6 NA 1 NA China, Macau SAR <1–17.4 NA 10 NA China 1.3–6196.61 NA 26 NA
Powdered milk and cereal products Taiwan, China 0.53–144 NA 1 NA Food-processing ingredients (egg powder)
China 0.1–4 NA 4 NA
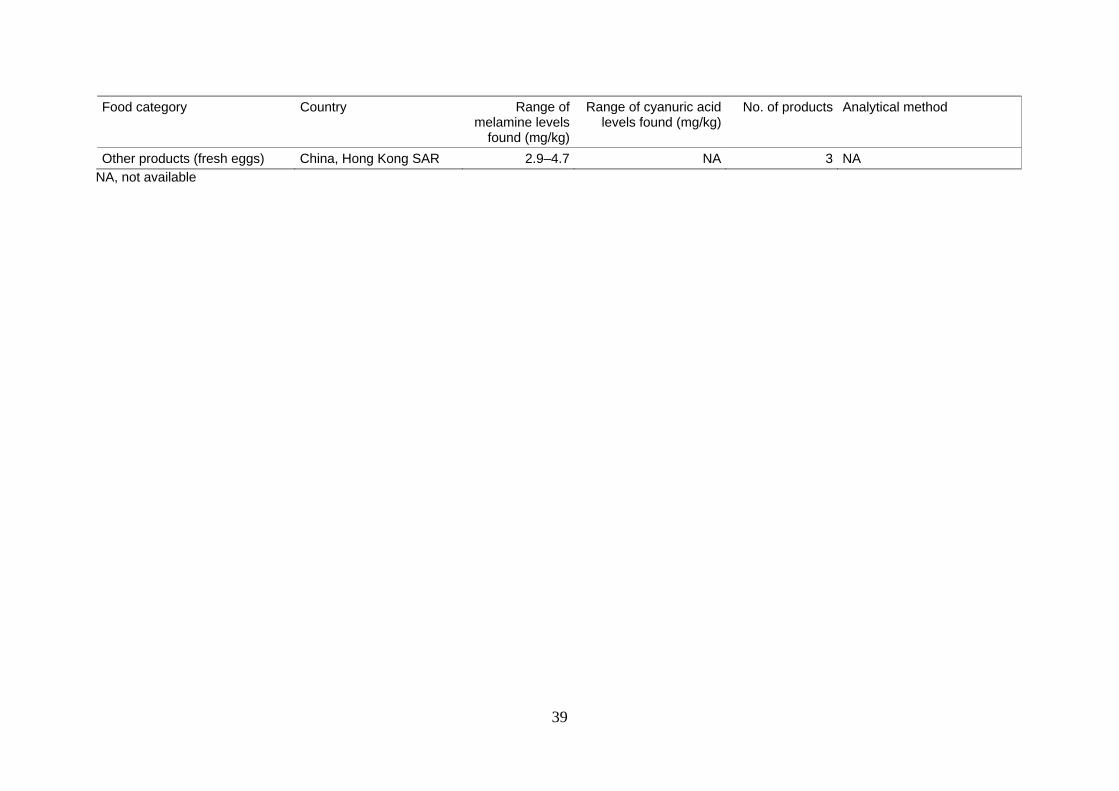
39
Food category Country Range of melamine levels
found (mg/kg)
Range of cyanuric acid levels found (mg/kg)
No. of products Analytical method
Other products (fresh eggs) China, Hong Kong SAR 2.9–4.7 NA 3 NA NA, not available
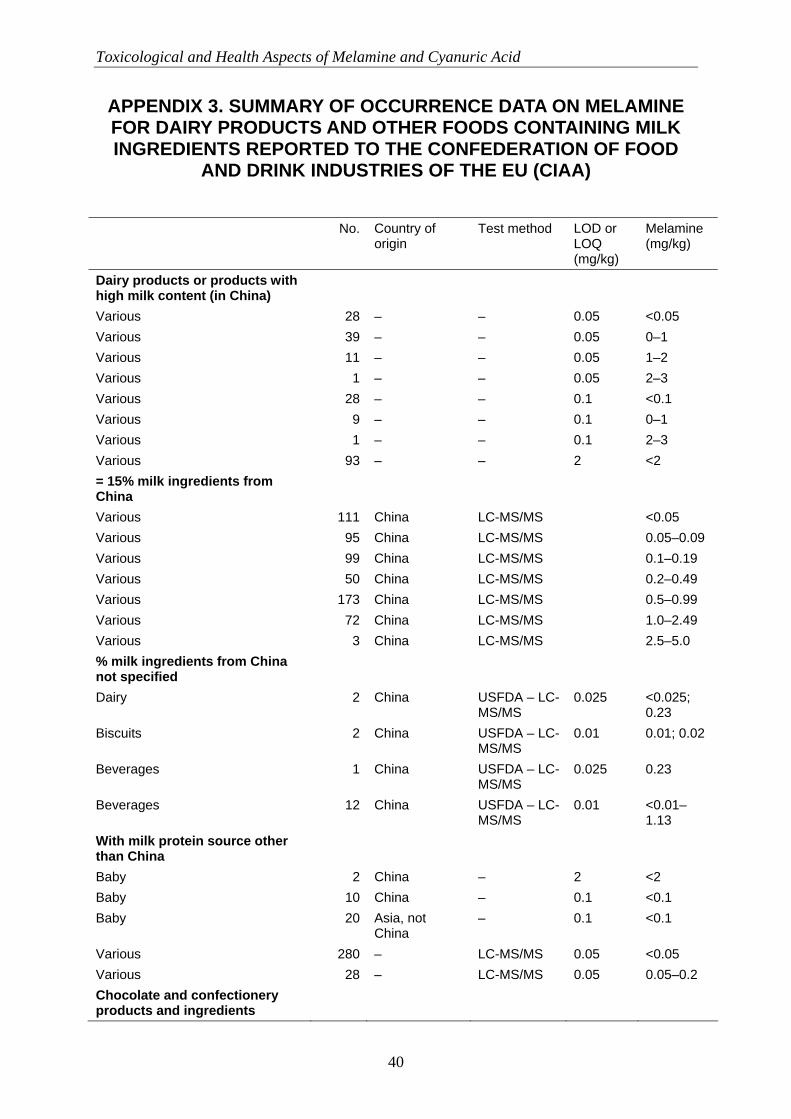
Toxicological and Health Aspects of Melamine and Cyanuric Acid
40
APPENDIX 3. SUMMARY OF OCCURRENCE DATA ON MELAMINE FOR DAIRY PRODUCTS AND OTHER FOODS CONTAINING MILK INGREDIENTS REPORTED TO THE CONFEDERATION OF FOOD
AND DRINK INDUSTRIES OF THE EU (CIAA) No. Country of
origin Test method LOD or
LOQ (mg/kg)
Melamine (mg/kg)
Dairy products or products with high milk content (in China)
Various 28 – – 0.05 <0.05 Various 39 – – 0.05 0–1 Various 11 – – 0.05 1–2 Various 1 – – 0.05 2–3 Various 28 – – 0.1 <0.1 Various 9 – – 0.1 0–1 Various 1 – – 0.1 2–3 Various 93 – – 2 <2 = 15% milk ingredients from China
Various 111 China LC-MS/MS <0.05 Various 95 China LC-MS/MS 0.05–0.09 Various 99 China LC-MS/MS 0.1–0.19 Various 50 China LC-MS/MS 0.2–0.49 Various 173 China LC-MS/MS 0.5–0.99 Various 72 China LC-MS/MS 1.0–2.49 Various 3 China LC-MS/MS 2.5–5.0 % milk ingredients from China not specified
Dairy 2 China USFDA – LC-MS/MS
0.025 <0.025; 0.23
Biscuits 2 China USFDA – LC-MS/MS
0.01 0.01; 0.02
Beverages 1 China USFDA – LC-MS/MS
0.025 0.23
Beverages 12 China USFDA – LC-MS/MS
0.01 <0.01–1.13
With milk protein source other than China
Baby 2 China – 2 <2 Baby 10 China – 0.1 <0.1 Baby 20 Asia, not
China – 0.1 <0.1
Various 280 – LC-MS/MS 0.05 <0.05 Various 28 – LC-MS/MS 0.05 0.05–0.2 Chocolate and confectionery products and ingredients
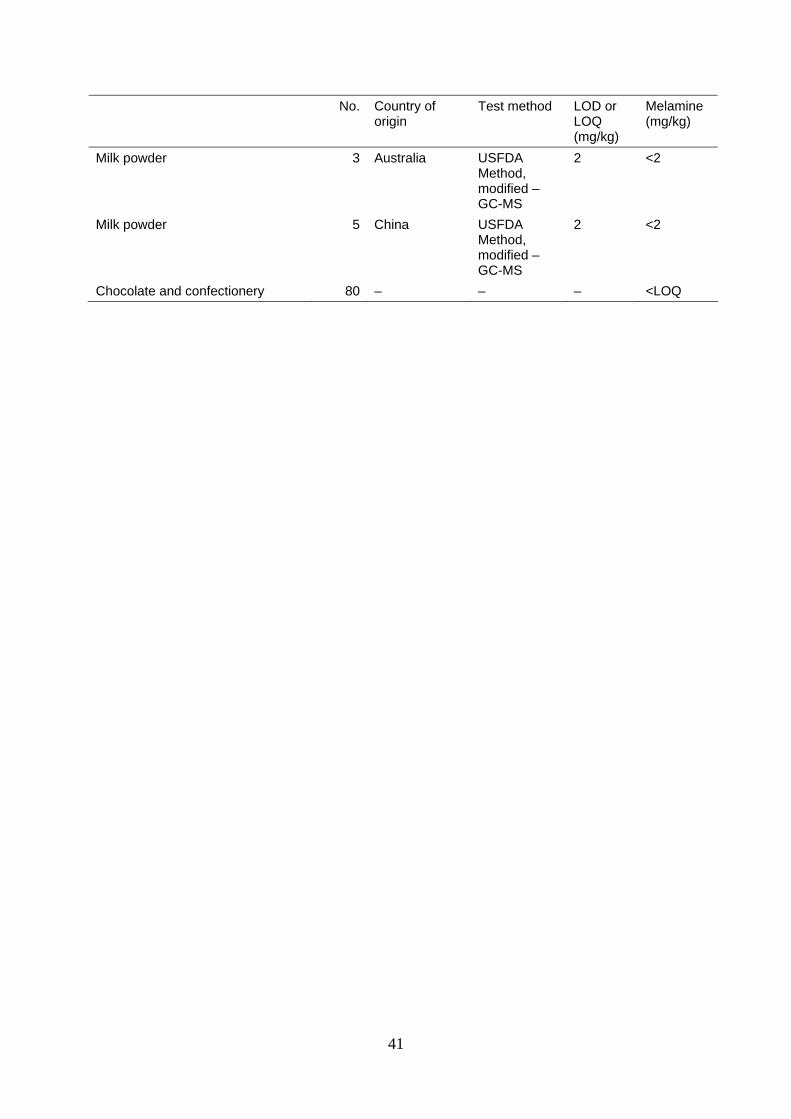
41
No. Country of origin
Test method LOD or LOQ (mg/kg)
Melamine (mg/kg)
Milk powder 3 Australia USFDA Method, modified – GC-MS
2 <2
Milk powder 5 China USFDA Method, modified – GC-MS
2 <2
Chocolate and confectionery 80 – – – <LOQ