back to the basics? research-based strategies for college student success
DESCRIPTION
Back to the Basics? Research-based strategies for college student success. Everything I know about college student retention, I learned in 1980. Dr. Wes Habley [email protected]. Back to the Basics. Lumina Foundation Goal. - PowerPoint PPT PresentationTRANSCRIPT

Back to the Basics?Research-based strategies for college student success
Dr. Wes Habley
Everything I know about college student retention, I learned in 1980

Back to the Basics
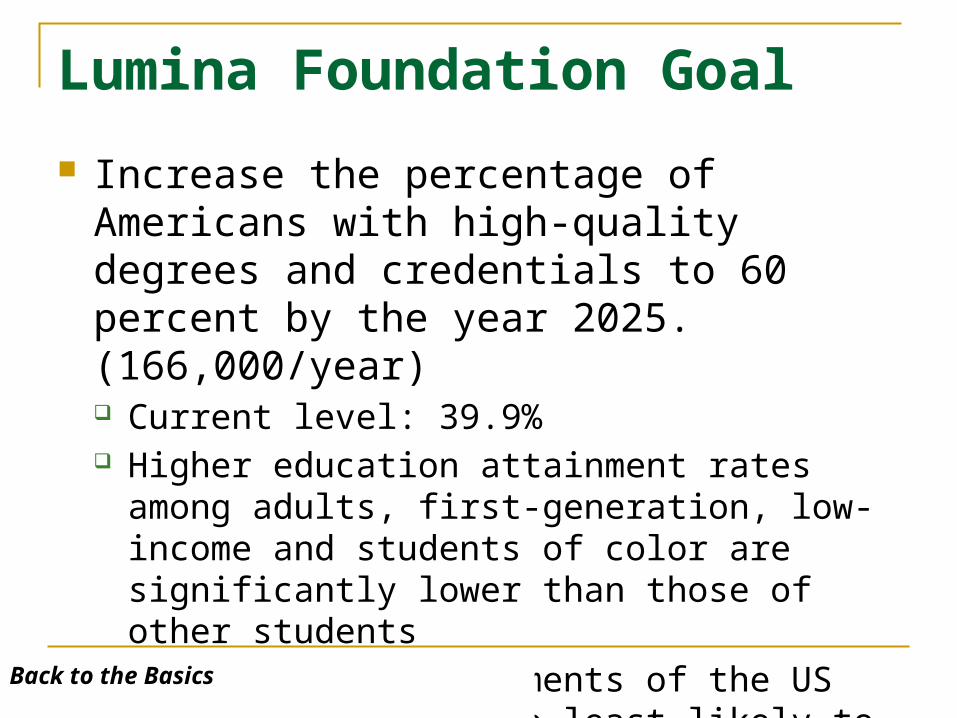
Lumina Foundation Goal
Increase the percentage of Americans with high-quality degrees and credentials to 60 percent by the year 2025. (166,000/year) Current level: 39.9% Higher education attainment rates among adults,
first-generation, low-income and students of color are significantly lower than those of other students
Fastest growing segments of the US population are those least likely to complete high school, enroll in college and earn certificates or degrees.
Back to the Basics

President Obama 2020 Goal U.S. will return to first in the world in the
proportion of 25-34 year-olds with some form of postsecondary education
Requires H.S. graduation rate of 90% (current rate is 74.9%)
We must double current undergraduate enrollment
8 million more individuals must complete postsecondary education
Back to the Basics

Global Competitiveness?
23rd of 35 countries on high school enrollment of 15-19 year-olds
20th of 28 countries on high school completion rate
10th of 32 countries on B.A. enrollment rate 12th of 36 countries in degree attainment of
25-34 year-olds
Back to the Basics

Topics
Overview of WWISR surveys Attrition Factors Retention Interventions Retention and Degree Completion Rates Educational Attainment Rates Expanding the Retention Paradigm
Back to the Basics

Back to the Basics

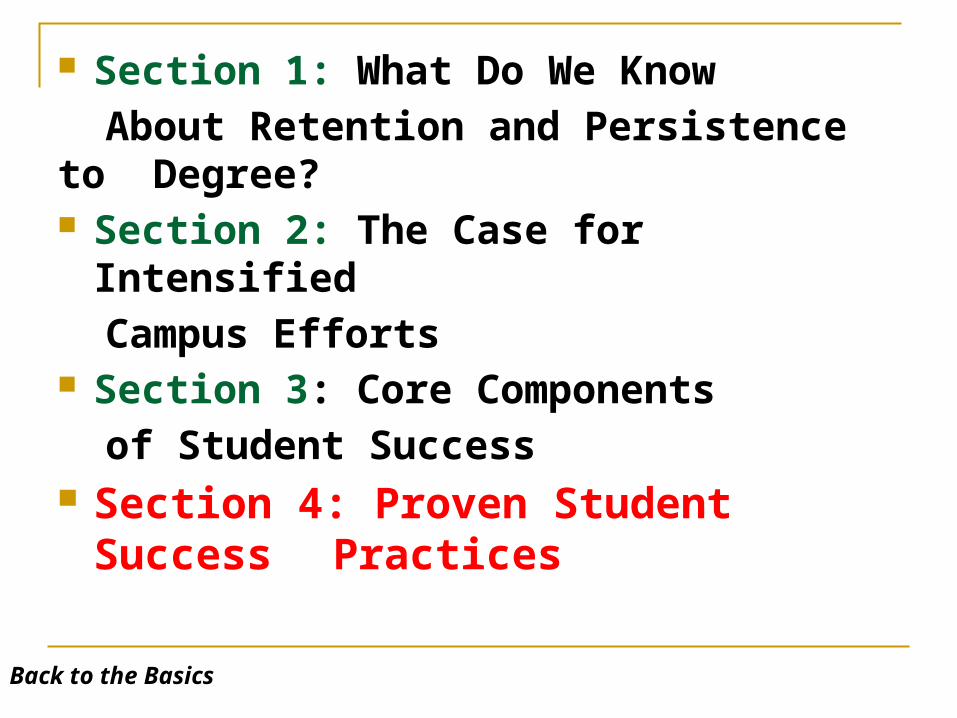
Section 1: What Do We Know
About Retention and Persistence to Degree?
Section 2: The Case for Intensified
Campus Efforts Section 3: Core Components
of Student Success
Back to the Basics

ACHIEVEMENT
BEHAVIOR GOALSSUCCESS
Back to the Basics
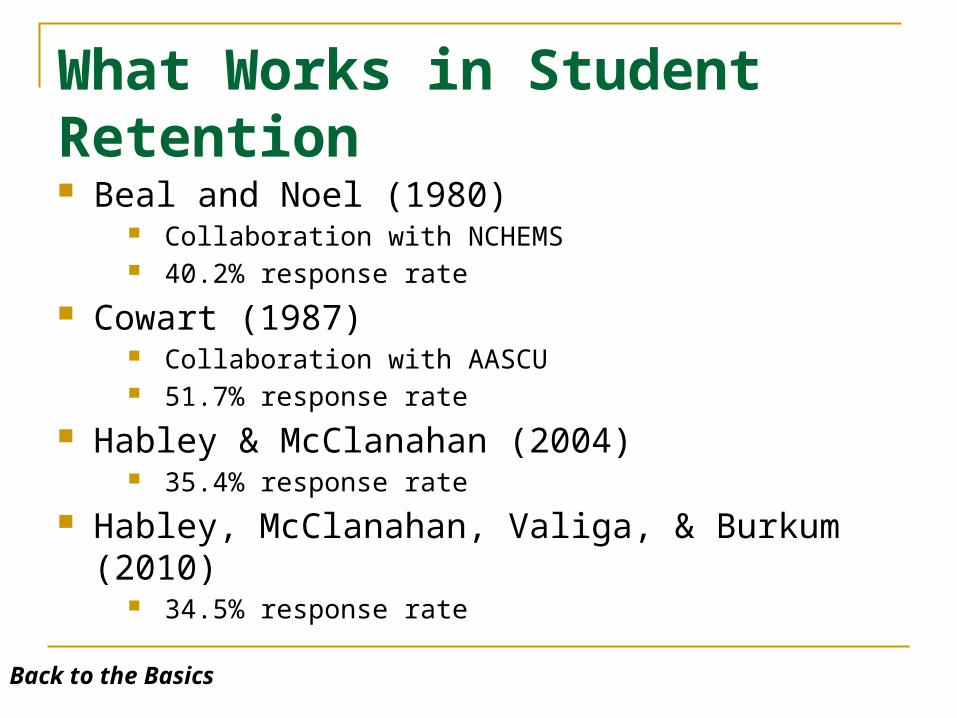
What Works in Student Retention Beal and Noel (1980)
Collaboration with NCHEMS 40.2% response rate
Cowart (1987) Collaboration with AASCU 51.7% response rate
Habley & McClanahan (2004) 35.4% response rate
Habley, McClanahan, Valiga, & Burkum (2010) 34.5% response rate
Back to the Basics

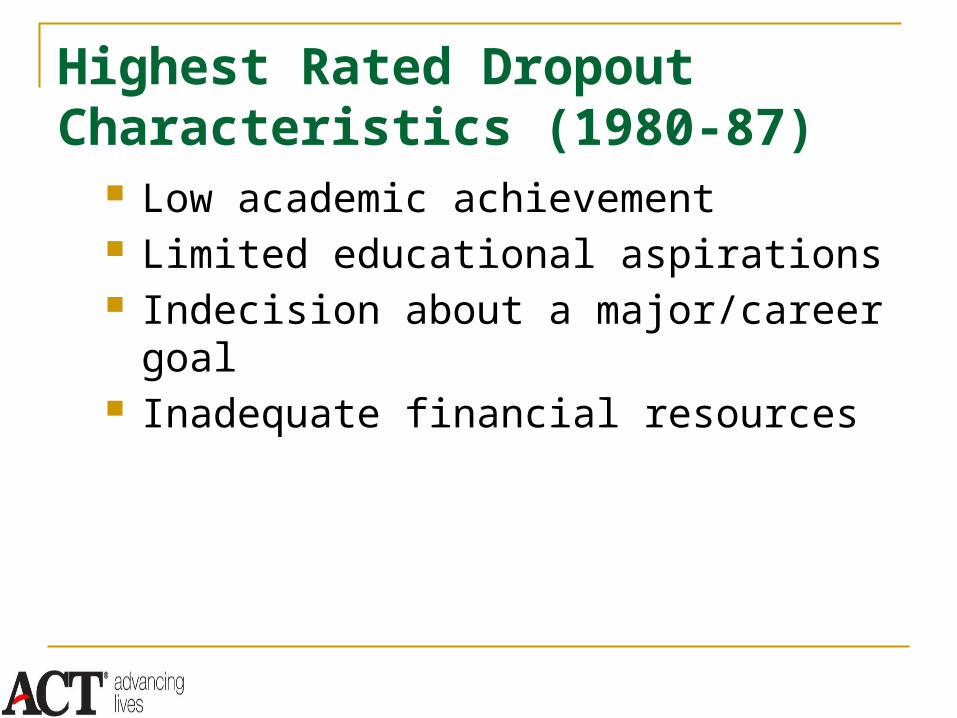
Highest Rated Dropout Characteristics (1980-87)
Low academic achievement Limited educational aspirations Indecision about a major/career goal Inadequate financial resources
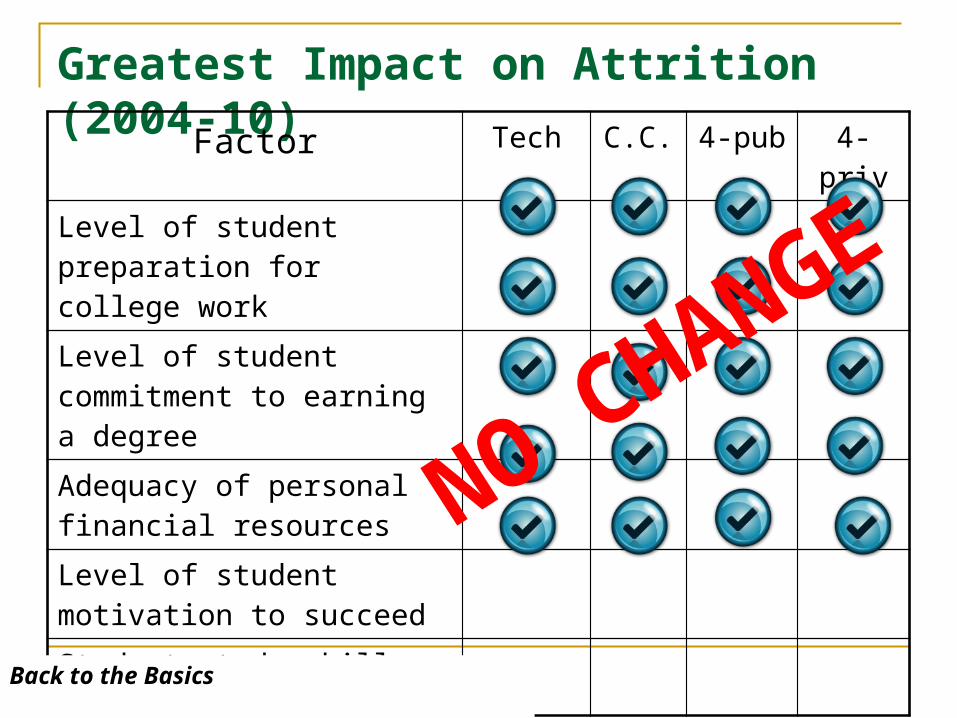
Greatest Impact on Attrition (2004-10)Factor Tech C.C. 4-pub 4-priv
Level of student preparation for college work
Level of student commitment to earning a degree
Adequacy of personal financial resources
Level of student motivation to succeed
Student study skills
Back to the Basics
NO CHANGE
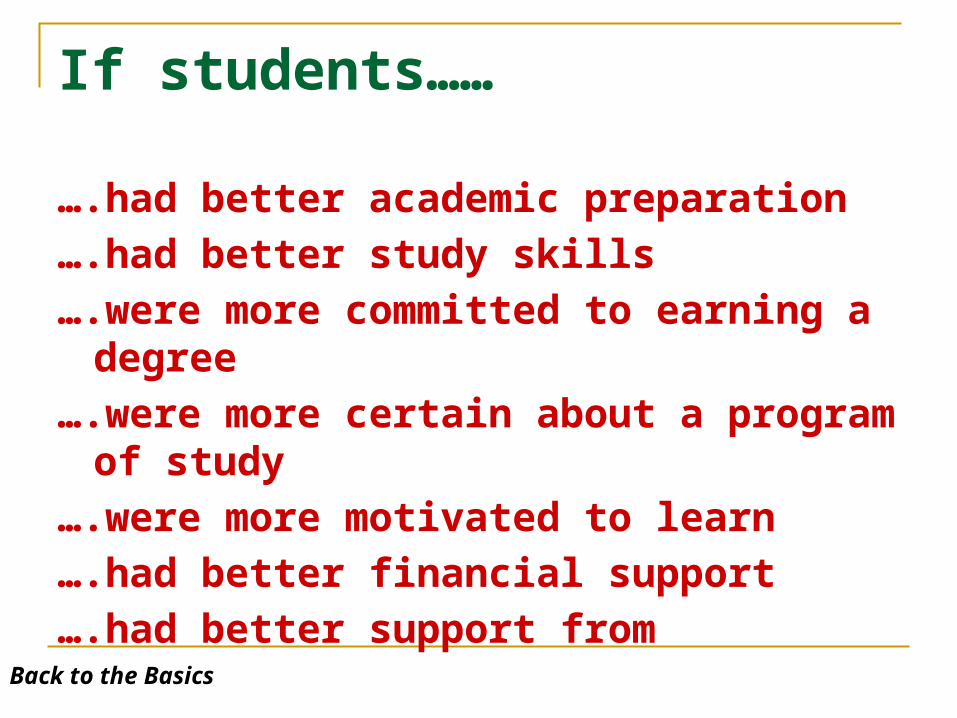
If students……
….had better academic preparation
….had better study skills
….were more committed to earning a degree
….were more certain about a program of study
….were more motivated to learn
….had better financial support
….had better support from significant others
Back to the Basics

There would be no attrition problem

Least Impact on Attrition (2004-10)
Factor Tech C.C. 4-pub 4-priv
Campus safety and security
Cultural activities
Residence hall facilities
Student physical health issues
Commuting/living off campus
Back to the Basics
NO CHANGE

Why do we have a problem? We have…..
a beautiful campus great facilities a rich set of co-curricular
experiences excellent academic programs an outstanding faculty
Back to the Basics

The problem must be that we have the….
WRONG STUDENTS
Back to the Basics
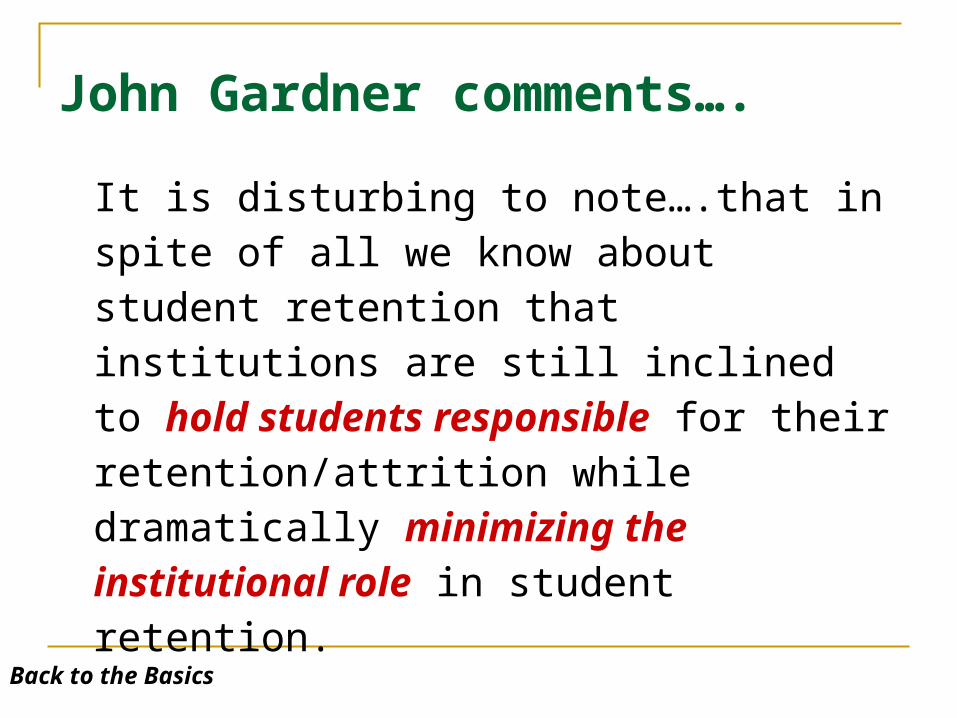
John Gardner comments….
It is disturbing to note….that in spite of all we know about student retention that institutions are still inclined to hold students responsible for their retention/attrition while dramatically minimizing the institutional role in student retention.
Back to the Basics

What do we know about academic performance?
Back to the Basics

Academic Performance
Global competitiveness is on the decline High school grades are on the rise Dual enrollment is on the rise Advanced placement is on the rise Assessment results are stagnant
NAEP Pipeline scores ACT college readiness pipeline scores
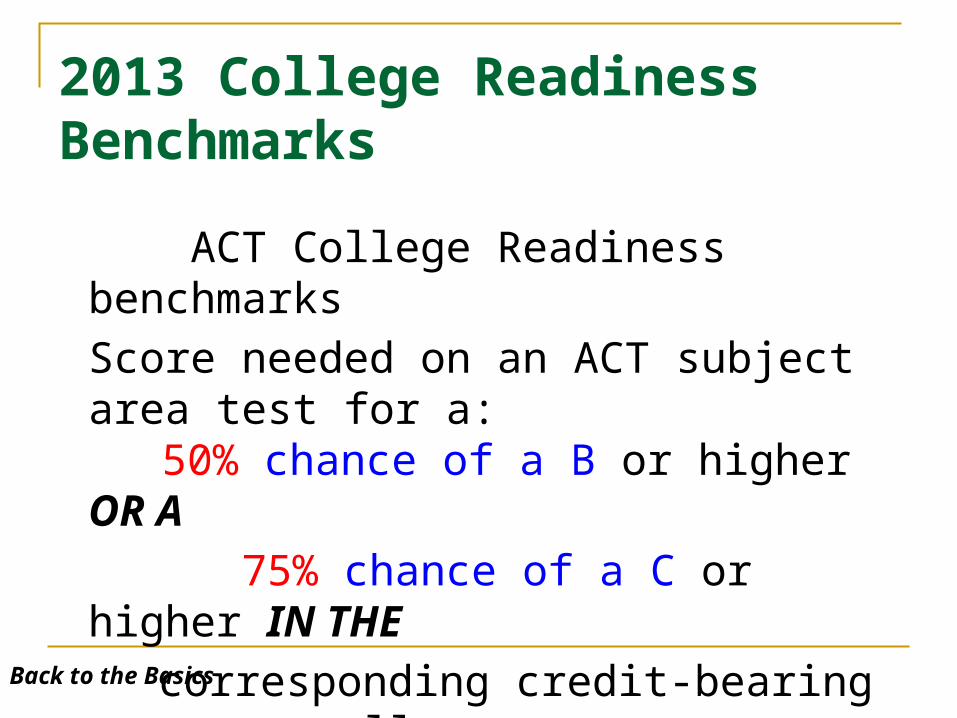
2013 College Readiness Benchmarks
Back to the Basics
ACT College Readiness benchmarks
Score needed on an ACT subject area test for a:
50% chance of a B or higher OR A
75% chance of a C or higher IN THE
corresponding credit-bearing college course

2013 College Readiness Benchmarks
Back to the Basics
Test College Course ACT Score/% earning
English English Comp. 18/64%Math College
Algebra22/44%
Reading Social Science 21/44%
Science Biology 24/36%
26% of ACT-tested 2013 high school graduates met all four benchmarks
What do we know about retention and persistence to degree rates?
Back to the Basics

Retention Trends 1983-2013 Freshman-Sophomore YearHighest % Lowest % Current %
Two-Year Public 55.7 (’10) 51.3(’04) 55.0
BA/BS Public 70.0(’04) 66.4(’96,’05) 64.4
MA/MS Public 73.6 (‘13) 68.1(’89) 73.6
PhD Public 78.6(’10) 72.9(’08) 77.4
Two-year Private 72.6(‘92) 55.5(’08,’12) 56.4
BA/BS Private 74.0(’89) 67.3(’10,’12) 67.4
MA/MS Private 78.0(’85) 69.9 (‘13) 69.9
PhD Private 85.0(’85) 80.2(’12,‘13) 80.2
ALL 66.8
Back to the Basics
NO CHANGE

Completion Trends1983-2013
Two-year Colleges – Graduation in 3 years or lessHighest % Lowest % Current %Public 38.8(’89) 22.7 (‘13) 22.7
Private 66.4(’90) 50.2(’08) 51.3
ALL 44.0(’89) 24.8(’13) 24.8
Back to the Basics
NO CHANGE
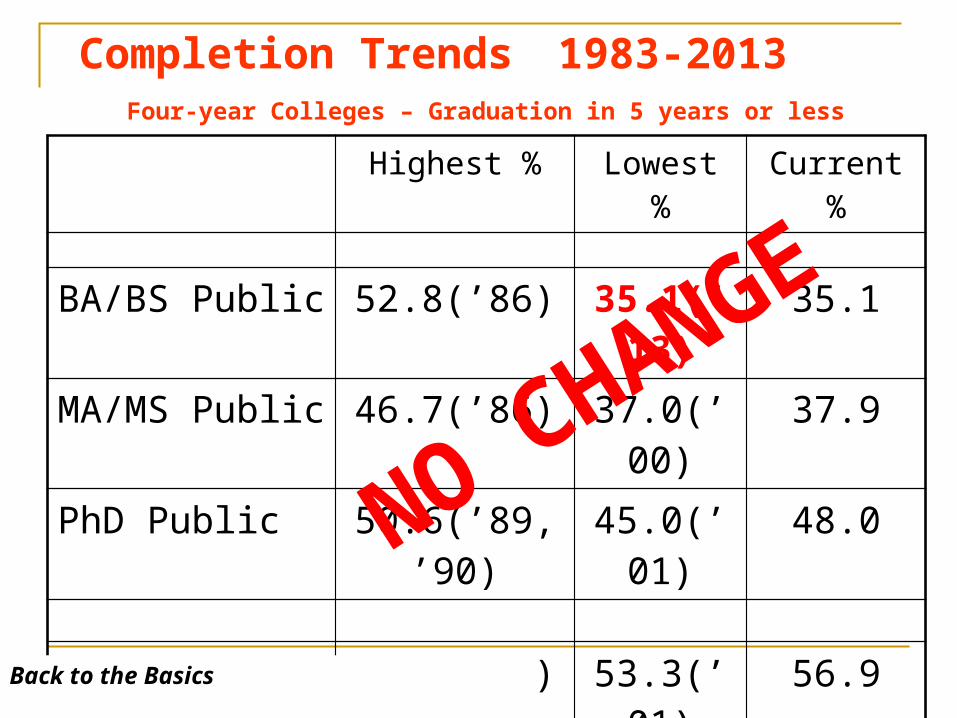
Highest % Lowest % Current %
BA/BS Public 52.8(’86) 35.1(’13) 35.1
MA/MS Public 46.7(’86) 37.0(’00) 37.9
PhD Public 50.6(’89,’90) 45.0(’01) 48.0
BA/BS Private 57.5(’06) 53.3(’01) 56.9
MA/MS Private 58.4(’88) 53.5(’01) 54.4
PhD Private 68.8(’86) 62.3(‘13) 62.3
Completion Trends 1983-2013Four-year Colleges – Graduation in 5 years or less
Back to the Basics
NO CHANGE

College Participation/AttainmentSome
CollegeAA/ASDegree
BA/BSDegree
Above a BA/BS
All races 19.5%
White (non-Hispanic) 20.0%
White in combination. 19.4%
Black alone 22.2%
Black in combination 22.5%
Hispanic (any race) 15.6%
Asian alone 13.9%
Asian in combination 14.6%
U.S. Census, 2010: population 18 years or olderBack to the Basics

College Participation/AttainmentSome
CollegeAA/ASDegree
BA/BSDegree
Above a BA/BS
All races 19.5% 8.5%
White (non-Hispanic) 20.0% 9.2%
White in combination. 19.4% 8.6%
Black alone 22.2% 8.1%
Black in combination 22.5% 8.2%
Hispanic (any race) 15.6% 5.8%
Asian alone 13.9% 6.6%
Asian in combination 14.6% 6.7%
U.S. Census, 2010: population 18 years or olderBack to the Basics

College Participation/AttainmentSome
CollegeAA/ASDegree
BA/BSDegree
Above a BA/BS
All races 19.5% 8.5% 17.7%
White (non-Hispanic) 20.0% 9.2% 19.9%
White in combination. 19.4% 8.6% 18.1%
Black alone 22.2% 8.1% 11.6%
Black in combination 22.5% 8.2% 11.7%
Hispanic (any race) 15.6% 5.8% 8.8%
Asian alone 13.9% 6.6% 29.8%
Asian in combination 14.6% 6.7% 29.5%
U.S. Census, 2010: population 18 years or olderBack to the Basics

College Participation/Attainment
Some College
AA/ASDegree
BA/BSDegree
Above a BA/BS
All races 19.5% 8.5% 17.7% 9.3%
White (non-Hispanic) 20.0% 9.2% 19.9% 10.6%
White in combination 19.4% 8.6% 18.1% 9.4%
Black alone 22.2% 8.1% 11.6% 5.6%
Black in combination 22.5% 8.2% 11.7% 1.1%
Hispanic (any race) 15.6% 5.8% 8.8% 3.1%
Asian alone 13.9% 6.6% 29.8% 18.7%
Asian in combination 14.6% 6.7% 29.5% 18.2%
U.S. Census, 2010: population 18 years or olderBack to the Basics
NO CHANGE

After 40 Years…..
Attrition Factors – No Change Retention Interventions – No Change Retention and Persistence to Degree Rates –
No Change U.S. Educational Attainment – No Change The fastest growing demographic groups
include those least likely to succeed in the educational system
Back to the Basics

Asian/American Caucasian
3
Asian/American Caucasian
1
Hispanic/American
3
Caucasian Hispanic/American
2
Caucasian
1
Asian American African/American
1
African/Hispanic/ Caucasian
1
American
African/Caucasian/ Asian American
2
American
This is about all of America’s children

These are America’s kids

Lumina Foundation Goal?
Obama Goal?
Back to the Basics
Section 1: What Do We Know
About Retention and Persistence to Degree?
Section 2: The Case for Intensified
Campus Efforts Section 3: Core Components
of Student Success Section 4: Proven Student Success
Practices
Back to the Basics

Retention Interventions
All four surveys…… Entry level course placement Appropriate learning support/developmental
education Academic Advising First year transition programs
Back to the Basics

ACHIEVEMENT
BEHAVIOR GOALSSUCCESS
Back to the Basics
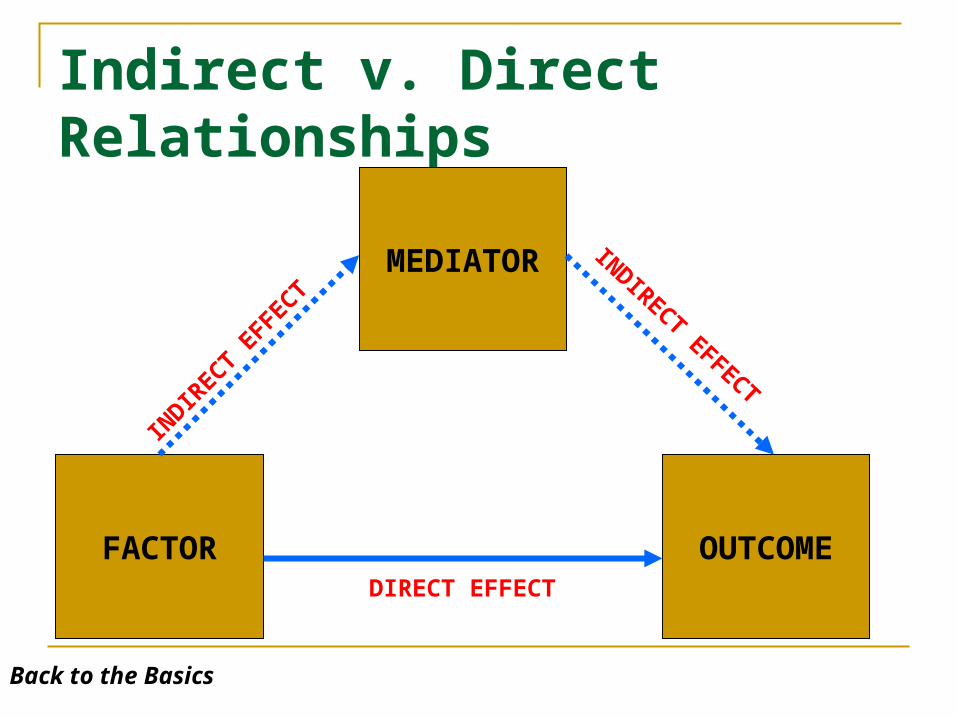
Indirect v. Direct Relationships
FACTOR OUTCOME
MEDIATOR
DIRECT EFFECT
INDIR
ECT
EFFE
CT
INDIRECT EFFECT
Back to the Basics

Indirect v. Direct Relationships
FACTOR OUTCOME
MEDIATOR
DIRECT EFFECT
INDIR
ECT
EFFE
CT
INDIRECT EFFECT
RELATIONSHIP SATISFACTION PERSISTENCE
Course Placement
Learning Support
Academic Advising
Transition Programs
High Quality
Back to the Basics

High Quality Course Placement“Optimal placement results when students begin with the course for which all important learning outcomes have been satisfied and few important course outcomes have been mastered.”
D.R. Whitney (1989)
Back to the Basics

Course Placement in WWISR Academic preparation was consistently rated
as a major cause of student attrition Mandatory placement testing rated in the top
five retention strategies across all institutional types
The use of placement diagnostics was a differentiator between high retention campuses and low retention campuses
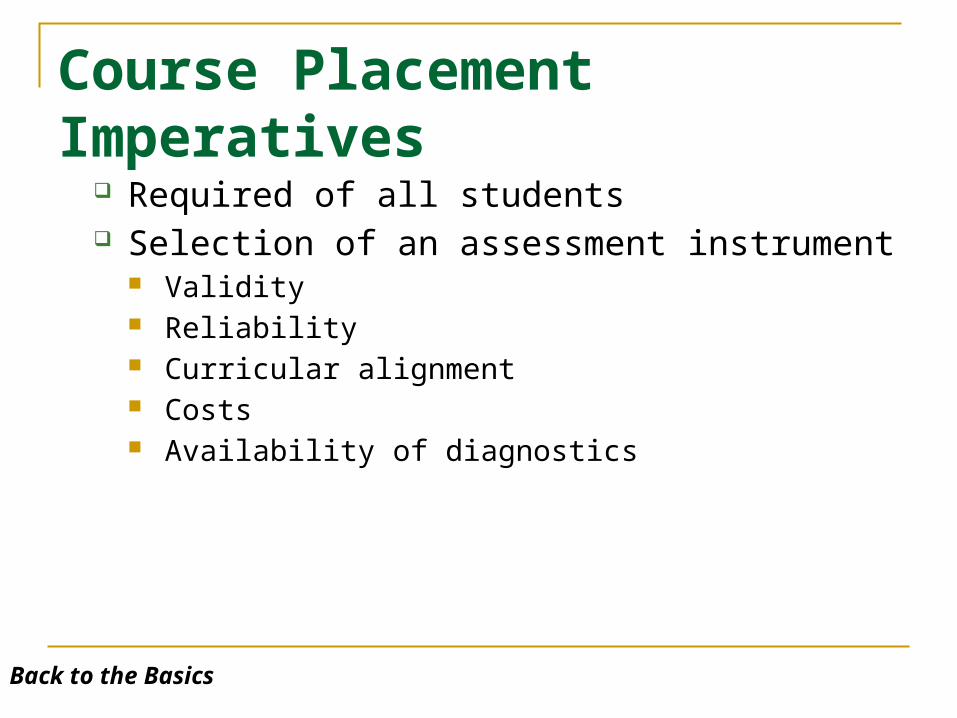
Course Placement Imperatives
Required of all students Selection of an assessment instrument
Validity Reliability Curricular alignment Costs Availability of diagnostics
Back to the Basics
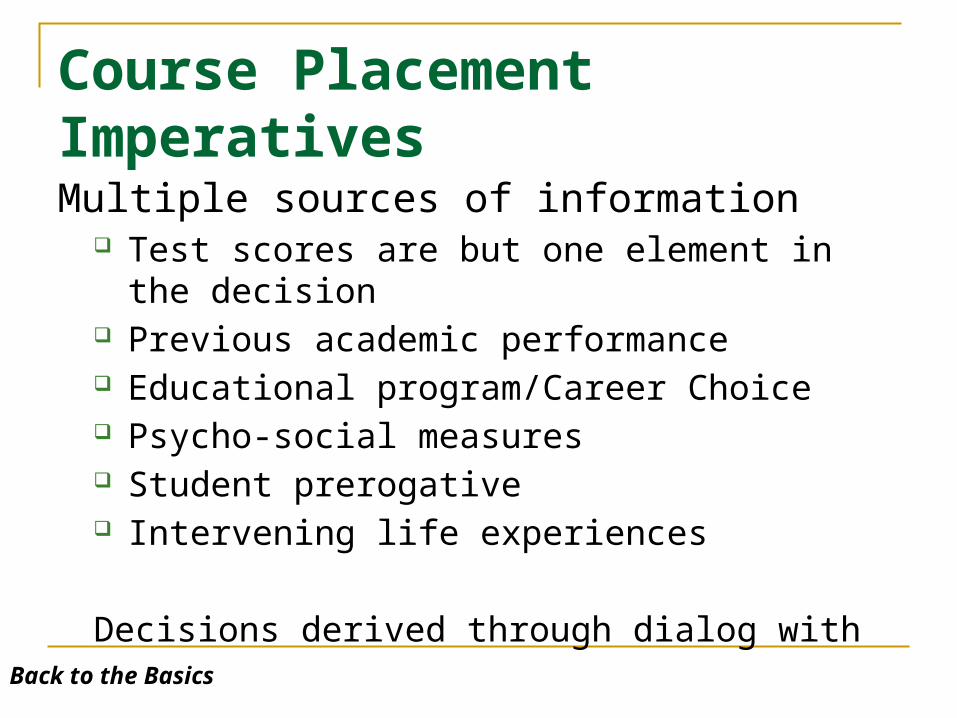
Course Placement ImperativesMultiple sources of information
Test scores are but one element in the decision Previous academic performance Educational program/Career Choice Psycho-social measures Student prerogative Intervening life experiences
Decisions derived through dialog with an advisor
Back to the Basics
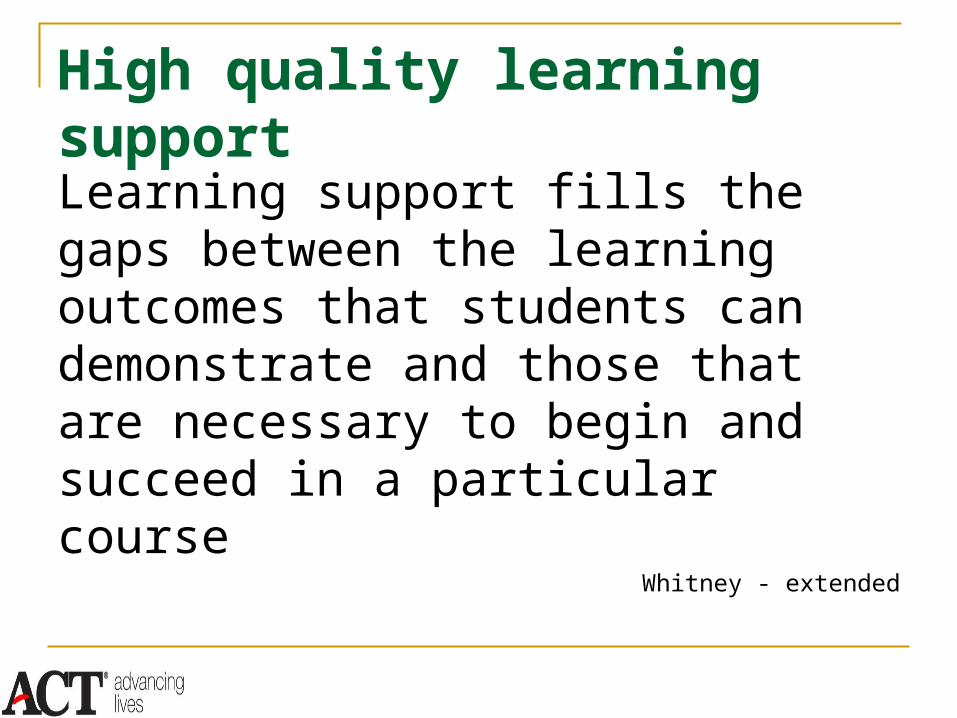
High quality learning supportLearning support fills the gaps between the learning outcomes that students can demonstrate and those that are necessary to begin and succeed in a particular course
Whitney - extended

Learning Support in WWISR Remedial/Developmental Coursework
(required)
Back to the Basics

Developmental Education Courses Percentage of colleges offering
developmental education Two-year Colleges 99% Four-year Public Colleges 88% Four-year Private Colleges 68%
Back to the Basics

Remediation
Percentage of community college students taking at least one remedial course
45%
27%Source: National Center for Education Statistics
Percentage of four-year college students taking at least one remedial course
WHAT HAPPENS WHEN THEY ENROLL?

Remediation
Annual estimated cost of college remediation in the United States
$5,600,000,000,000
$5.6 Billion
Source: Alliance for Excellent Education

Developmental Education Courses Percentage of colleges offering
developmental education Two-year Colleges 99% Four-year Public Colleges 88% Four-year Private Colleges 68%
We are teaching college courses to
high school students
We are teaching high school
courses to college students
Back to the Basics

Learning Support in WWISR Remedial/Developmental Coursework
(required) Supplemental Instruction Comprehensive Learning Assistance Center Tutoring Early Warning system
Back to the Basics
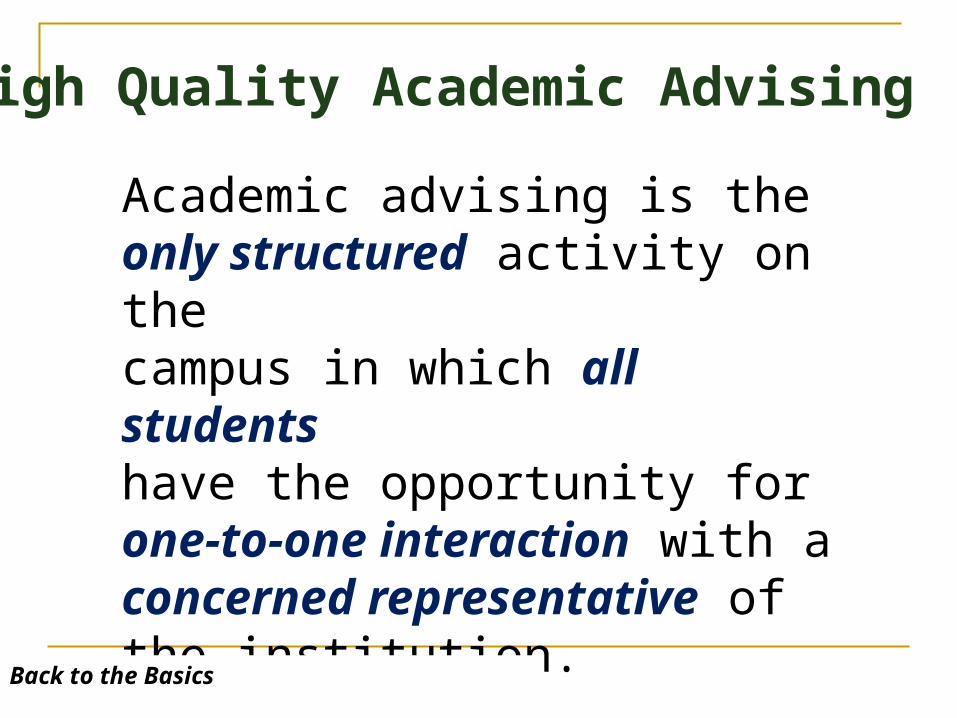
Academic advising is theonly structured activity on thecampus in which all studentshave the opportunity forone-to-one interaction with aconcerned representative ofthe institution.
The potential impact
Back to the Basics
High Quality Academic Advising
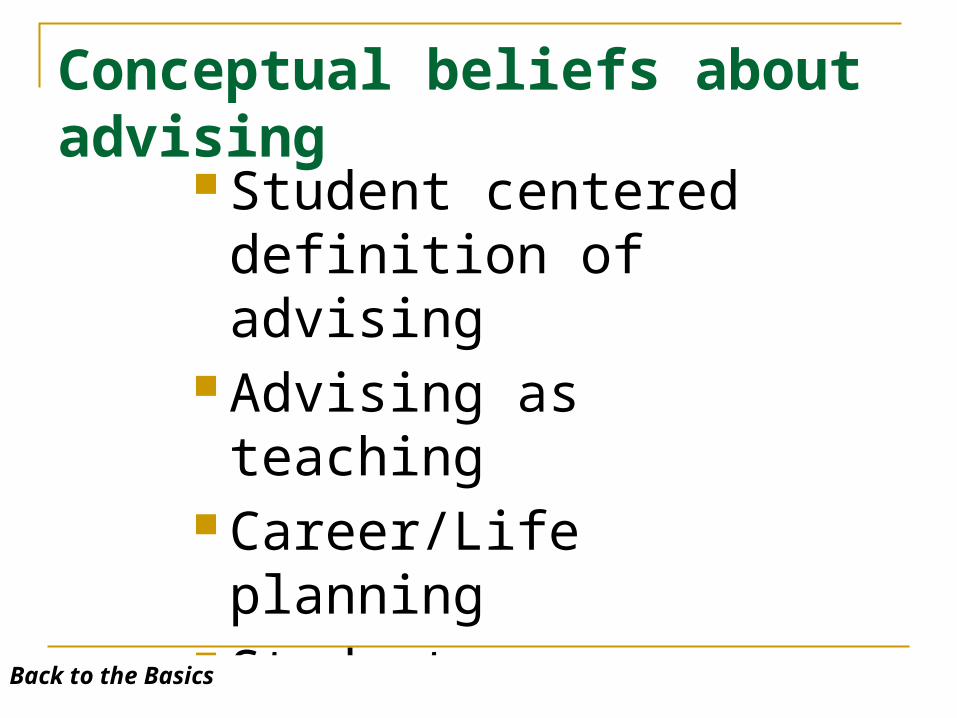
Conceptual beliefs about advising
Student centered definition of advising
Advising as teaching Career/Life planning Student persistence
Back to the Basics
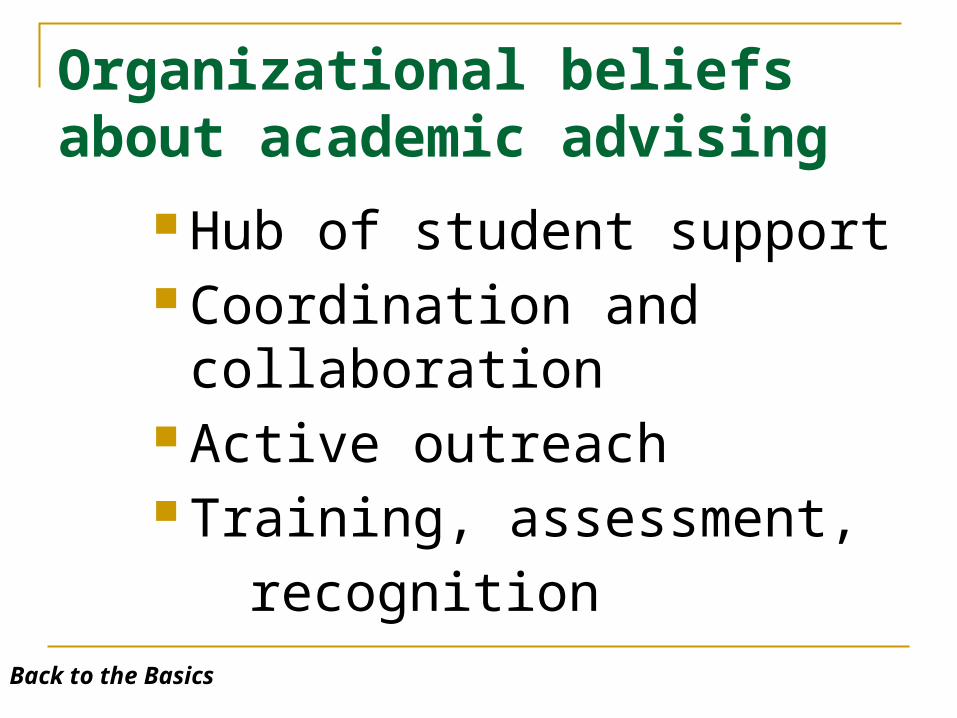
Organizational beliefs about academic advising
Hub of student support Coordination and collaboration Active outreach Training, assessment,
recognition
Back to the Basics

Academic Advising in WWISR Programs for special populations Increased staffing Advising center/office Integration with first year experience Integration with career/life planning
Back to the Basics

High Quality Transition Programs Transition is a three-stage process
Separation from some, if not many, of the values, norms and behaviors that characterized past social/educational environments
A period of passage between old and new Acceptance of many of the new norms, values
and behaviors
Back to the Basics

High Quality Transition Programs Three basic types
Orientation Generally time-constrained and generally occurring
before classes begin Learning Community
Small group of students enrolled together in two or more courses.
Four basic models First-year seminar
A course offered to or required of new students

High Quality Transition Programs Scope, content and format guided by
Identification of student needs Institutional characteristics Institutional culture

Current Retention Paradigm
The percentage of students who enroll at an institution, are retained at that institution, persist at that institution and graduate from that institution in a reasonable period of time.
Back to the Basics

Higher Education Production Model
61
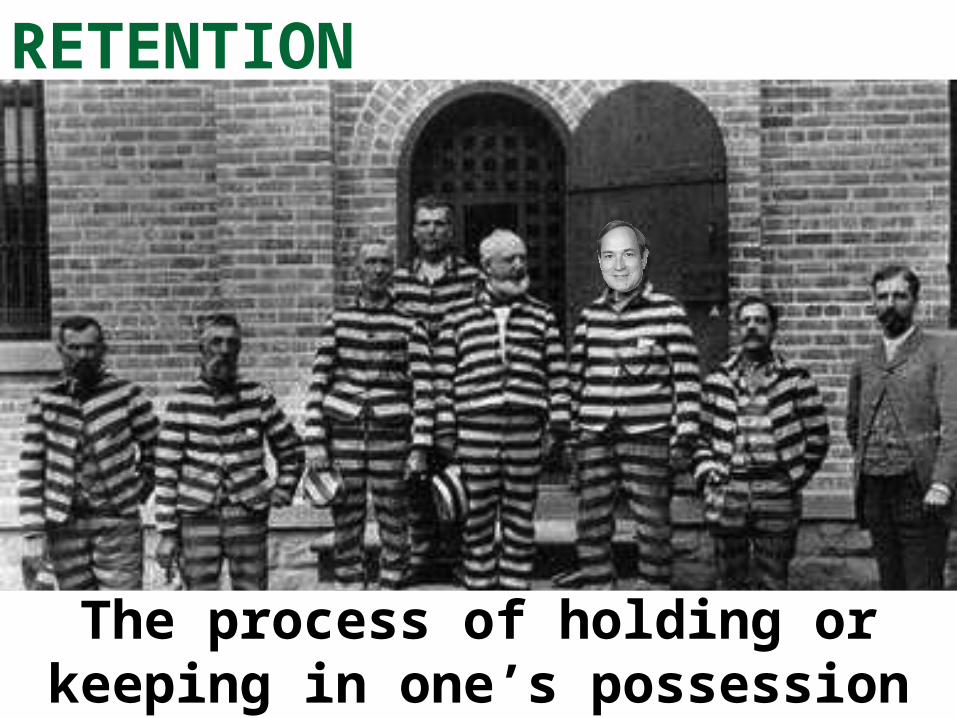
RETENTION
The process of holding or keeping in one’s possession

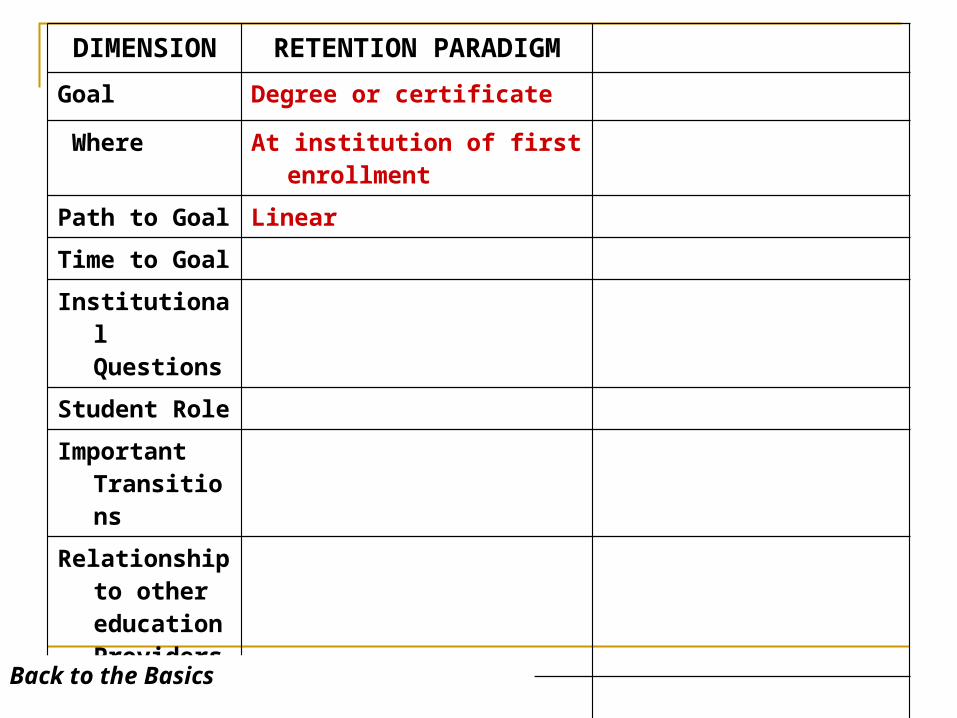
DIMENSION RETENTION PARADIGM
Goal Degree or certificate
Where
Path to Goal
Time to Goal
Institutional Questions
Student Role
Important Transitions
Relationship to other education Providers
Measure of Effectiveness
Back to the Basics

DIMENSION RETENTION PARADIGM
Goal Degree or certificate
Where At institution of first enrollment
Path to Goal
Time to Goal
Institutional Questions
Student Role
Important Transitions
Relationship to other education Providers
Measure of Effectiveness
Back to the Basics
DIMENSION RETENTION PARADIGM
Goal Degree or certificate
Where At institution of first enrollment
Path to Goal Linear
Time to Goal
Institutional Questions
Student Role
Important Transitions
Relationship to other education Providers
Measure of Effectiveness
Back to the Basics

DIMENSION RETENTION PARADIGM
Goal Degree or certificate
Where At institution of first enrollment
Path to Goal Linear
Time to Goal With all due speed
Institutional Questions
Student Role
Important Transitions
Relationship to other education Providers
Measure of Effectiveness
Back to the Basics

DIMENSION RETENTION PARADIGM
Goal Degree or certificate
Where At institution of first enrollment
Path to Goal Linear
Time to Goal With all due speed
Institutional Questions
How can we best serve?Why did she leave?
Student Role
Important Transitions
Relationship to other education Providers
Measure of Effectiveness
Back to the Basics
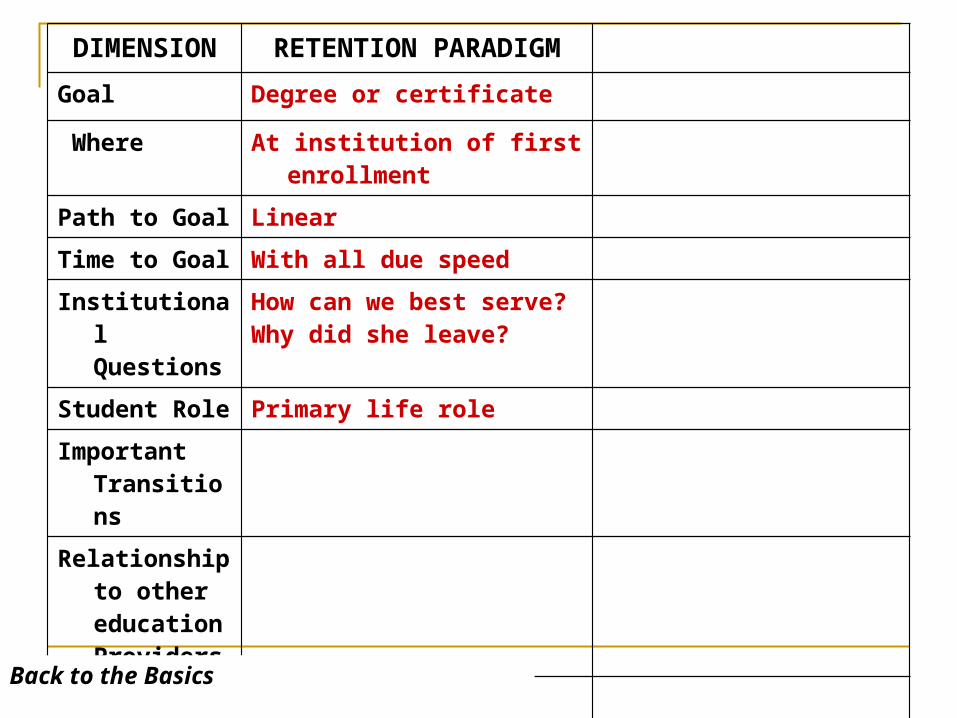
DIMENSION RETENTION PARADIGM
Goal Degree or certificate
Where At institution of first enrollment
Path to Goal Linear
Time to Goal With all due speed
Institutional Questions
How can we best serve?Why did she leave?
Student Role Primary life role
Important Transitions
Into this institutionThrough this institutionGraduation from this institution
Relationship to other education Providers
Competitive OpaqueDiscreetUnsystematic
Measure of Effectiveness
Institutional retention rateInstitutional degree completion
rate
Back to the Basics

http://www.act.org/readinessreality/13/pdf/Reality-of-College-Readiness-2013.pdf

The Reality of College Readiness – 2013
72
Reports on the 2012 college enrollmentstatus of ACT-tested students in the highschool graduating class of 2011
National Student Clearinghouse Match
Back to the Basics
Key Finding - Institutional measures of retention fail to tell the whole story about student success
Trends in students migration and movement Multiple institutions as they progress Geography matters So do their goals (intentions)
Institutional measures are limiting & linear
Back to the Basics

Group Exercise
Stopped out of college for one term or longer Entered college with dual enrollment, AP, CLEP or
other college level credit Took courses part-time Took longer than four years to earn your
undergraduate degree Transferred (2-yr to 4-year OR 4-yr to 2-yr) Enrolled in two or more institutions simultaneously Began college after age 25 Did not enroll in college right out of high school Took an online course as an undergraduate
Back to the Basics
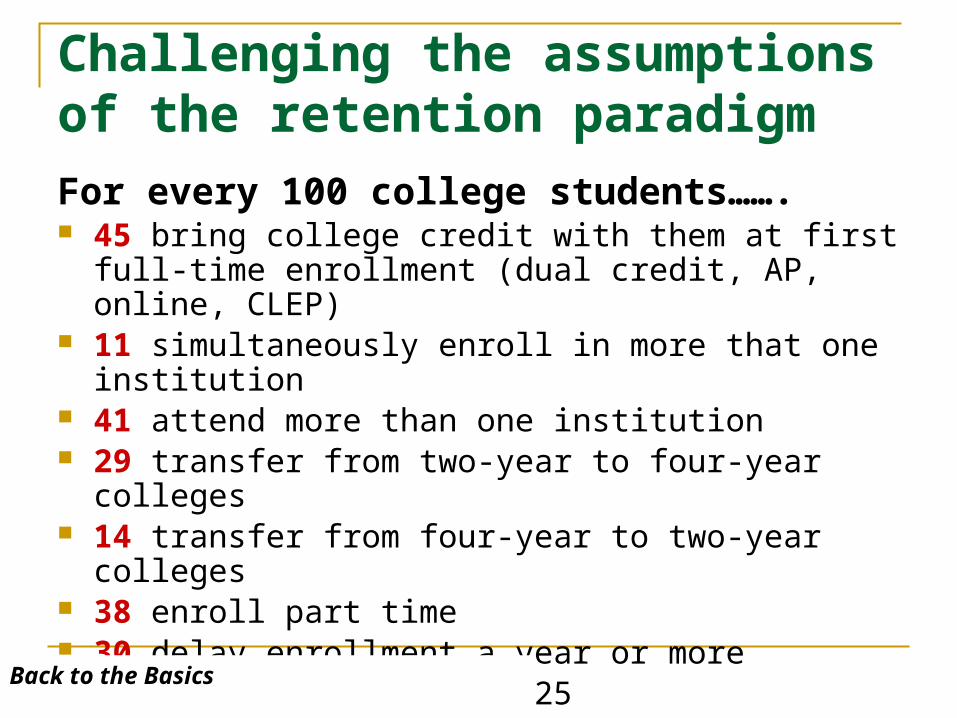
Challenging the assumptions of the retention paradigmFor every 100 college students……. 45 bring college credit with them at first full-time
enrollment (dual credit, AP, online, CLEP) 11 simultaneously enroll in more that one institution 41 attend more than one institution 29 transfer from two-year to four-year colleges 14 transfer from four-year to two-year colleges 38 enroll part time 30 delay enrollment a year or more 25 are over the age of 25 30 enroll in an online course
Back to the Basics
Student Success in College Is not constrained by time
Back to the Basics

Student Success in College Is not constrained by place
Back to the Basics
Key Finding - Too many students who intend to go to college are not enrolled anywhere one year later Self select by taking a college entrance test
Attend nowhere Intend to delay enrollment but are not enrolled one year later Attend one year (or less) but are not enrolled in a
second year
Back to the Basics

Fall 2011 Status
Fall 2012 Status Group 1 Group 2 Group 3
Group 4
All Grads Re-Enrolled in State
44 55 54 46
Re-Enrolled Out of State
35 19 12 11
Not Enrolled- unknown
22 26 34 43
2013 Reality of College Readiness - National
Group 1: <20%DE, MD, ME, NC, NH, NJ, PA, RI, & WA
Group 2: 20-59%AK, AZ, CA. CT, GA, HI, IN, MA, NV, NY, OR, SC, TX, VA, & VT
Group 3: 60-79%FL, IA, ID, KS, MN, MO, MT, NE, NM, OH, OK, UT, WI, & WV
Group 4: 80-100%AL, AR, CO, IL, KY, LA, MI, MS, ND, SD, TN, & WY
Back to the Basics

Fall 2011 Status
Fall 2012 Status
Group 1 Group 2 Group 3
Group 4
Two-year college
Not Enrolled- unknown
22 26 34 43
Four-year public
Not Enrolled –unknown
24 25 30 32
Four-year private
Not Enrolled - unknown
7 9 14 13
2013 Reality of College Readiness Not enrolled – one year later
Group 1: <20%DE, MD, ME, NC, NH, NJ, PA, RI, & WA
Group 2: 20-59%AK, AZ, CA. CT, GA, HI, IN, MA, NV, NY, OR, SC, TX, VA, & VT
Group 3: 60-79%FL, IA, ID, KS, MN, MO, MT, NE, NM, OH, OK, UT, WI, & WV
Group 4: 80-100%AL, AR, CO, IL, KY, LA, MI, MS, ND, SD, TN, & WY
Back to the Basics
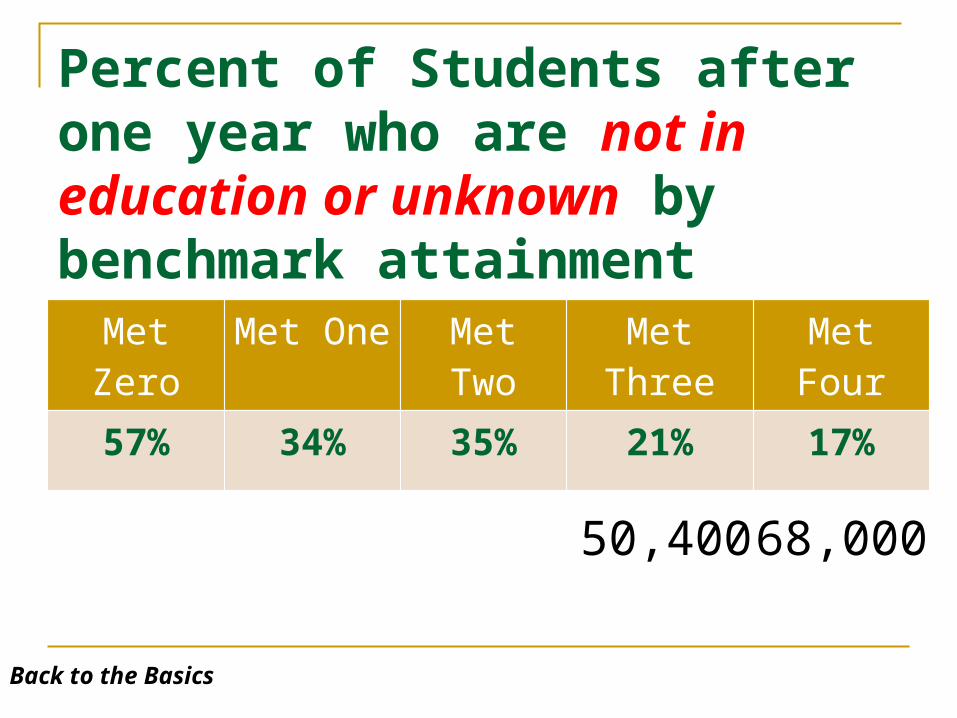
Percent of Students after one year who are not in education or unknown by benchmark attainmentMet Zero Met One Met Two Met
ThreeMet Four
57% 34% 35% 21% 17%
Back to the Basics
68,00050,400

Key Finding - There is a relationship between retention and the fit between a student’s interests and chosen major.
Understand the importance of fit Capture and use the data
Utilize non-cognitive measures in your intervention and counseling strategies
Back to the Basics
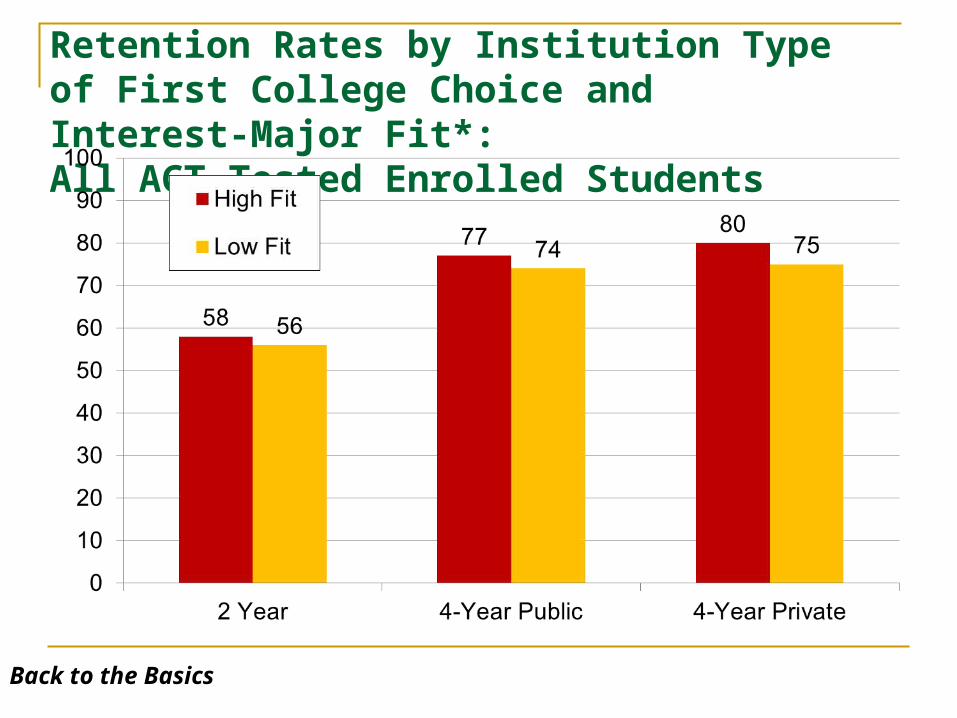
Retention Rates by Institution Type of First College Choice and Interest-Major Fit*: All ACT-Tested Enrolled Students
Back to the Basics
Section 1: What Do We Know
About Retention and Persistence to Degree?
Section 2: The Case for Intensified
Campus Efforts Section 3: Core Components
of Student Success Section 4: Proven Student Success
Practices Section 5: Making Student Success
a Priority Back to the Basics
Rethinking the Retention Paradigm How would things be different if individual
student success became the goal rather than institutional retention and persistence to degree rates?
How would we expand the paradigm?
Back to the Basics

DIMENSION RETENTION PARADIGM EXPANDED PARADIGM
Goal Degree or certificate Student defined
Where At institution of first enrollment
Path to Goal Linear
Time to Goal With all due speed
Institutional Questions
How can we best serve?Why did she leave?
Student Role Primary life role
Important Transitions
Into this institutionThrough this institutionGraduation from this institution
Relationship to other education Providers
Competitive OpaqueDiscreetUnsystematic
Measure of Effectiveness
Institutional retention rateInstitutional degree completion rate
Back to the Basics

DIMENSION RETENTION PARADIGM EXPANDED PARADIGM
Goal Degree or certificate Student defined
Where At institution of first enrollment Any college
Path to Goal Linear Non-linear, discontinuous
Time to Goal With all due speed Student pace, discontinuous
Institutional Questions
How can we best serve?Why did she leave?
How can we best serve? Where is she going?How can we help her get
there?
Student Role Primary life role May be one of several important life roles
Important Transitions
Into this institutionThrough this institutionGraduation from this institution
Into this institutionTransition to another
institution
Relationship to other education Providers
Competitive OpaqueDiscreetUnsystematic
TransparentCollaborativeSystematic
Measure of Effectiveness
Institutional retention rateInstitutional degree completion rate
Back to the Basics

DIMENSION RETENTION PARADIGM EXPANDED PARADIGM
Goal Degree or certificate Student defined
Where At institution of first enrollment Any college
Path to Goal Linear Non-linear, discontinuous
Time to Goal With all due speed Student pace, discontinuous
Institutional Questions
How can we best serve?Why did she leave?
How can we best serve? Where is she going?How can we help her get there?
Student Role Primary life role May be one of several important life roles
Important Transitions
Into this institutionThrough this institutionGraduation from this institution
Into this institutionTransition to another institution
Relationship to other education Providers
Competitive OpaqueDiscreetUnsystematic
TransparentCollaborativeSystematic
Measure of Effectiveness
Institutional retention rateInstitutional degree completion rate
Student success – goal achievement rate
Back to the Basics

Implementing the expanded paradigmRecommendations for Policy Makers Pursue P-20 collaborations to develop integrated
education systems
Expand the current retention definition to focus on individual student success - the achievement of student educational goals rather than the completion of a degree at a specific institution within a specific timeframe
Measure and reward individual student success across the postsecondary system. Success should not be measured solely by retention and graduation rates within an institution.
Back to the Basics

Implementing the expanded paradigmRecommendations for Policy Makers Review and revise policies and agreements which
increase the transparent movement of students from one educational experience to another
Develop a common course numbering system Develop a course applicability system Expand articulation agreements Establish a clearinghouse which serves as a
repository for a student-owned educational portfolio used to facilitate institution to institution transitions
Participate in the Voluntary System of Accountability (VSA) or the Voluntary Framework for Accountability (VFA)
Back to the Basics
Topics
Overview of WWISR surveys Attrition Factors Retention Interventions Retention and Degree Completion Rates Educational Attainment Rates Expanding the Retention Paradigm
Back to the Basics
