back to the basics: building essential skills for quality ... · back to the basics: building...
TRANSCRIPT
Back to the Basics: Building Essential Skills for Quality and Patient Safety Azhar Ali, MD
Executive Director, Middle East Asia Regions
Frank Federico RPh
Vice President Intensive Monday, September 26 9:30 AM – 4:30 PM

Faculty
Frank Federico
Vice President
Sr. Safety Expert
Dr. Azhar Ali
Executive Director
Head of IHI Asia Pacific Region

Participants
Singapore
Australia
Thailand
Hong Kong
Japan
Malaysia
India
England
United States
New Zealand

Agenda
Period 1 9:30 – 10:30
Mid morning refreshments 10:30 – 11:00
Period 2 11:00 – 12:00
Lunch 12:00 – 13:00
Period 3 13:00 – 14:30
Mid afternoon refreshments 14:30 – 15:00
Period 3 15:00 – 16:30

IHI Background
Founded by Don Berwick and colleagues
Grew out of National Demonstration Project on Quality Improvement in Health Care (NDP)
First National Forum was the NDP Summit
Incorporated in 1991
From 4 employees to now 120
Office in Cambridge, Massachusetts
Remote employees in many other locations
Work in North America, Europe, and Africa

Gail, insert updated IHI
Strategy on a page

How We Work
Improvement requires change and not all change
is improvement.

www.ihi.org

The problems that exist in the world today
cannot be solved by the levels of thinking
that created them.
Albert Einstein

Balancing Improvement, Planning and
Control

Quality Trilogy
Joseph Juran
11
Quality Design (Planning)
Quality Assurance
(Control) Quality Improvement

Quality Trilogy Quality Design – purpose is to leverage all we know about providing good quality service or product to our clients – system creation
Quality Assurance – purpose is to assess when we have achieved the intended quality of service or product – yes/no identification- ACCREDITATION, NATIONAL INDICATOR PROGRAM
Quality Improvement – purpose is to move the system from current state of performance to a new state of performance defined by our definition of Quality

What does this mean?
Quality Planning: You develop a new process
using the principles of reliability from the
beginning.
Quality Control: You monitor the process to be
certain that it is working as designed. Does it
deliver the outcome you want?
Quality Improvement: The process is not
delivering the outcomes as designed so it must
be improved.

Juran Trilogy
QUALITY PLANNING
QUALITY
IMPROVEMENT
QUALITY
CONTROL
Plan to control – is there
proof of concept i.e.
prototype and
implementation plan?
Can not control a process
that is not capable
Need a new process
Process is stable
and capable

The Sequence
PLAN- the process using a quality process to deliver the
outcome you want.
QUALITY IMPROVEMENT- use an improvement
process to create proof of concept (‘I know that the
process as planned actually creates the results we want’)
and we scale up that process so that we get the same
superior results everywhere
QUALITY CONTROL- monitor the process to be sure
it is reliability delivering the outcome. Example: you put the
process in place and you monitor the results

A Quick Exercise
Think of your work: list 3 processes you work with
everyday.
Where would you say you spend your time with
those processes: planning, controlling or
improving?

What is Quality Improvement?

Quality Improvement &
The Know-Do Gap
What we
know
What we
do
18

Two Fundamental System Principles
Every system is perfectly designed to achieve the
results it gets. - Batalden
If each part of a system, considered separately, is
made to operate as efficiently as possible, then the
system as a whole will not operate as effectively as
possible.
- Ackoff (1981)
4-13 1-20

Quality Improvement
The techniques and methods used to take us
from where we are, to where we want to be
20

Three Necessary Ingredients for
Improvement
Building Will
– Motivating health care provider organizations to think beyond the status quo and imagine a better system
Harvesting Ideas
– Finding, cultivating, or inventing new approaches for better patient care
Getting Results (Execution of the ideas)
– Providing the support, methods and tools for teams to take action
Understanding Psychology can help us
with the Will

Model for Improvement

Stuck…..

The Science of
Quality Improvement

© 2010 Institute for Healthcare Improvement/R. Lloyd
The Foundation for All Quality
Models
Deming’s Profound
Knowledge
Juran’s Quality
Trilogy
Quality Planning
Quality
Improvement Quality
Control
Juran’s
Quality
Trilogy
CQI
Understanding
Variation
Understanding
Systems
Thinking
Understanding
Human Behavior
(Psychology)
Understanding
Theory

The Science of Improvement
Dr. W. Edwards Deming stressed the importance
of studying four areas to become more effective
in leading improvement:
• Appreciation of a system
• Understanding variation
• Theory of knowledge
• Psychology
Source : Improvement Guide, Introduction, p xxiv-xxvi

Two Types of Knowledge
Subject Matter
Knowledge
Subject Matter Knowledge: Knowledge basic to the things we do in life.
Professional knowledge.
Profound Knowledge: The interaction of the theories of
systems, variation, knowledge, and psychology.
Profound
Knowledge

Knowledge for Improvement
Profound Knowledge
Subject Matter
Knowledge
Improvement: Learn to
combine subject matter
knowledge and profound
knowledge in creative
ways to develop
effective changes for
improvement.

The Lens of Profound Knowledge
29
Appreciation
of a system
Understanding Variation
Theory of Knowledge
Psychology QI
The system of profound knowledge provides a lens. It provides a new map of theory by which to understand and optimize our organizations. It provides an opportunity for dialogue and learning!

© 2010 Institute for Healthcare Improvement/R. Lloyd
30
Appreciation for a System • Interdependence, dynamism
• World is not deterministic
• Optimization, interactions
• System must have an aim
• Whole is greater than sum of the parts
Understanding Variation • Variation is to be expected
• Common or special causes
• Ranking, tampering
• Potential mistakes
Theory of Knowledge
• Prediction
• Learning from theory, experience
• Operational definitions
• PDSA for learning and
improvement
Psychology • Interaction between people
• Intrinsic motivation,
movement
• Beliefs, assumptions
• Will to change
What insights might be obtained by looking
through the Lens of Profound Knowledge?

On using the System of Profound Knowledge
Common Trap – a technique does not work, and so the
method is discounted/blamed
SOPK Improvement
Technique
SOPK Improvement Improvement
Technique

Organizational Transformation
Requires….
A Vision and Bold Aims
Coupled with
Relentless Execution of
Small, Repeated Tests of Large
Changes
Engaging Others
Teamwork and Clinician Involvement
– People understand the need to change
– People are equipped with the right tools
– People are empowered to take action
– People change their behaviors

Why Improvement Projects Fail
Lack of senior leader engagement
– Know improvement, align strategy, mentor teams
Loss of improvement expert
Lack of capability at the front line
Lack of useful data or analysis of data
No formal system to hardwire new process
– Fall back to what they know
http://au621leadershipvsmanagement.weebly.com/uploads/5/4/6/9/54693805/why_hospital_improvement_efforts_fail.pdf

Why Improvement Projects Fail
We do not get to the root of the problem
We do not understand human factors and
engineer systems to deal with the human
condition
We do not simplify
We add steps to the processes that result in
increased complexity
Frank Federico’s Observations

Key Concepts in Theory of Knowledge
There is no substitute for knowledge
Management is prediction, any plan is a prediction.
Prediction is based on theory
Operational definitions - put communicable meaning to a concept.
Analytic vs. Enumerative Studies

All Roads Lead To…
A set of processes that need
designing, redesigning, and
improving.

Exercise
What improvement methods have you used?
What has been the success rate of your efforts?
Why do you think you succeeded or failed?

The Sequence
Set as an aim
Plan measures you will use – process, outcome,
balancing?
Plan tests of change (as many as needed)
Design a PDSA
39
Making Sense of the
Tools in the Toolkit
Which Method to Use?

Spread and Diffusion
AIM
Tool Box
Rapid Improvement
Model
IDEO
Lean Methods
Reliability
41
KP Patient Safety U

Ranking Continuous Improvement
Methods
http://www.industryweek.com/PrintArticle.aspx?ArticleID=13941
Continuous Improvement
Method Implemented Percentage Of Respondents
Lean manufacturing 40.5%
Lean and Six Sigma 12.4%
Total quality management 9.9%
Agile manufacturing 3.8%
Toyota Production System 3.1%
Six Sigma 3.1%
Theory of Constraints 3.0%
Other 5.2%
No Methodology 19.1%

The Aim Should Drive
the Method Used
Are the Approaches Really Different?
Appear to be different because of their historical
development and labeling
The differentiating factors are a matter of
emphasis on the core concepts of
– Variation
– Flow
– Customer focus

Can We All Agree That No Matter the Methodology
These Questions Must Be Answered?
What are we trying to improve?
How will we know the change is an
improvement?
What changes will we make to improve?

Model for Improvement

Developing the
improvement team’s Aim Statement
47
Question #1:
What are We Trying to Accomplish?

Today’s Problems are Yesterday’s
Solutions
Complex areas such as variance reduction,
patient readmissions, or flow forecast accuracy
are not a quick fix
One question to reflect upon is "How long did it
take us to get into this situation?"

Constructing an Aim Statement
Boundaries: the system to be improved (scope, patient population, processes to address, providers, beginning & end, etc.)
Specific numerical goals for outcomes – Ambitious but achievable
Includes timeframe (How good by when?)
Provides guidance on sponsor, resources, strategies, barriers, interim & process goals
49

Constructing an Aim Statement
Involve senior leaders • Obtain sponsorship (geared to the project’s
complexity)
• Provide frequent and brief updates (practice the 2 minute elevator speech)
Focus on issues that are important to your organization • Connect the team Aim Statement to the Strategic
Plan
• Build on the work of others (steal shamelessly!)
50

Aims
Improvement relies on intention to improve
−Senior leaders set & align aim with strategic
goals.
−Middle management understand – and can
translate the project work to the strategic goals.
−Agreement on aim is critical
Aim should be unambiguous...clear, specific, numerical, measurable
−Strong message in stretch goal
Avoid aim “drift”

Guidance to Develop an Aim Statement
What is your measurable goal? • What is the improvement area (and why is it important)?
• What is the numerical goal? (e.g. baseline and improvement position)
What is the scope of your project? • Target population or patient group?
• Geographical or provider based scope?
• Specific process start and end points?
When do you want to achieve this? (i.e. by when) • Time frame?
NHS Improvement and Innovation

Aim Statement for the IHI Hospital Acquired Infections Community: Overall, to reduce infections from MRSA, VRE and C. diff by 30% within 12 months.
Example #1 of an Aim Statement
How good? By When?
Hope is not a plan!

In a pilot population, our hospital will decrease peri-operative
harm by 25% within 1 year by focusing on prevention of surgical
site infection (SSI) and implementation of pre-procedural
briefings in orthopedic and vascular surgery.
Team: Leadership: VPMM
Technical: Orthopedic surgeon
Day-to-day: OR manager, surgical technician
Additional members: Safety specialist, nursing
54
• System: perioperative harm in pilot population
• Goal: 25% reduction
• Timeframe: 1 year
• Guidance: Team membership
Example #2 of an Aim Statement
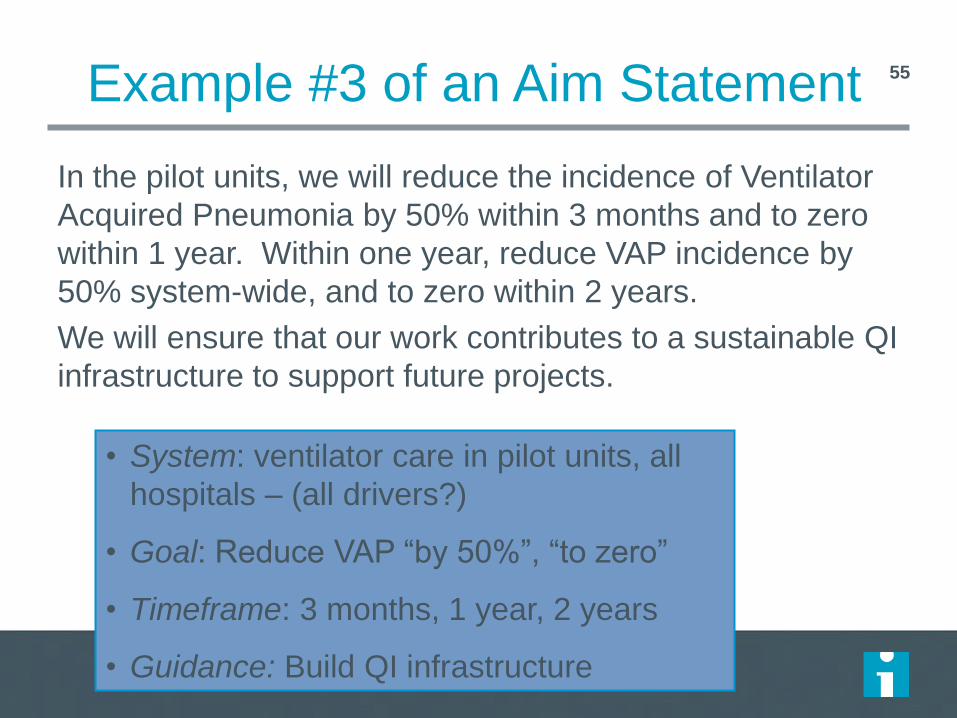
In the pilot units, we will reduce the incidence of Ventilator
Acquired Pneumonia by 50% within 3 months and to zero
within 1 year. Within one year, reduce VAP incidence by
50% system-wide, and to zero within 2 years.
We will ensure that our work contributes to a sustainable QI
infrastructure to support future projects.
55
• System: ventilator care in pilot units, all
hospitals – (all drivers?)
• Goal: Reduce VAP “by 50%”, “to zero”
• Timeframe: 3 months, 1 year, 2 years
• Guidance: Build QI infrastructure
Example #3 of an Aim Statement

Examine These Aims
Surgical
Achieve 100% compliance with appropriate selection
and timing of prophylactic antibiotic administration
Diabetes- Chronic Disease
Reduce diabetic patient admissions by 75 percent within 11 months
Heart Failure- Outpatient
Patients with HF recognize deterioration and call the
office within 10 months.

Checking on Our Aim
•How do we know we have the right aim?
•Relative versus absolute
•How much by when
•What will be people’s concerns about the aim?
• Is it strategic?
•Does it align with priorities?
•Been there, done that.

Scenario 1
You have been late for work three times in the
last two weeks.
Set an aim to improve your on-time arrival at
work.

Scenario 2
You are the manager of a delivery company.
Customers are complaining that the packages
are not arriving on time. You want to work with
your team of employees to improve on-time
delivery.
Develop an aim statement
Scenario 3
Your team wants to ensure that patients receive
medications on time.
Develop an aim statement

Do Not Negotiate the Ambition of the
Aim
Negotiate time to get to the aim
Think about using half-lives
Remind folks that we will get there through a
program of testing and spread
Keep the ‘hard red goal line’ on every graph
Consider relative (50% improvement) versus
absolute goal (2% infection rate)

Exercise
Work alone or together in a small group
Choose an improvement effort / topic of common
interest & relevance to the group
Develop a strong, clear aim statement to guide
improvement work on this topic
Discuss how you would set the goal in this aim
statement

Measurement for Improvement
Dr. Azhar Ali
This presenter has
nothing to disclose
September 2016

Model for Improvement

65 The Three Faces of Performance
Measurement
Lief Solberg, Gordon Mosser and Sharon McDonald. The Three Faces of Performance Measurement: Improvement,
Accountability and Research. Journal on Quality Improvement vol. 23, no. 3, (March 1997), 135-147.

Ideas for System Improvement: The Crucial Role of Data
You can’t fatten a cow by measuring
it…..but you can’t reach your goal
without measurement
Commitment to data that is
• Simple (set of core measures) that
everyone uses, has high value
• Easy to collect and report
• Tracks intermediate and outcome
metrics
• “real time”, accurate, complete
• Transparent/observable
• accountable


Data Grief

System of Feedback
70
Source: Brandon Bennett, Improvement Science Consulting

PDSA Measures Guide Learning about our testing.
Process Measures Guide Learning about how our testing is improving reliability of the process.
Outcome Measures Guide Learning about how the reliability of the process is achieving our aim.

Types of
Measures
Description The Surgical Sight Infection FOM
Outcome The voice of the customer or patient. How is
the system performing? What is the result?
Is our improvement work making a
meaningful impact?
Surgical Sight Infection Rate
Process The voice of the workings of the process.
Are the parts or steps in the system
performing as planned.
Are we on track to improve?
Percentage of appropriate prophylactic
antibiotic selection.
Percentage of on time administration of
prophylactic antibiotics.
Percentage of a safety climate score great than
4.
Balancing Looking at a system from different directions
or dimensions. What happened to the
system as we improved the outcome and
improvement measures?
Are we producing perverse unintended
consequences in our efforts to improve?
What other factors may be affecting results?
Patient satisfaction
Cost per case
Provost, L.P. & Murray, S.K. (2011). The health care data guide: Learning from data for improvement. San Francisco: Jossey-Bass. P. 63.
72

An Operational Definition...
… is a description, in quantifiable terms, of what to measure and the steps to follow to measure it consistently.
It gives communicable
meaning to a concept
Is clear and
unambiguous
Specifies
measurement
methods and
equipment
Identifies criteria
73 Source: R. Lloyd. Quality Health Care: A Guide to Developing and Using Indicators. Jones and Bartlett Publishers, 2004.

Operational Definition
a) Decrease
stillbirths by 40%
(b) decrease birth
asphyxia by 30 %
(c) decrease
newborn mortality
due to birth
asphyxia by 30 %
over 18 months in
all participating
hospitals
Fresh Stillbirth rate
Caesarean section as a
proportion of total deliveries
Proportion of newborn deaths
due to birth asphyxia
AIM OUTCOME MEASURES
Incidence of birth asphyxia
OPERATIONAL DEFINITION
No. of fresh still birth in facility
during month/ Total No. of births
(live birth + still birth) in facility
No. of babies born with birth
asphyxia in facility during month/
Total No. of live births in facility
DETAILS
Need to identify fresh
still birth
Need to define birth
asphyxia
No. of newborn deaths due to birth
asphyxia in babies born in the
facility during month/ Total No. of
newborn deaths in facility
Need to define birth
asphyxia
No. of caesarean section in the
facility during month/ Total No. of
deliveries (vaginal + caesarean) in
facility

a) Decrease
stillbirths by 40%
(b) decrease birth
asphyxia by 30 %
(c) decrease
newborn mortality
due to birth
asphyxia by 30 %
(d) Establish C-
section rate of
minimum 5 % over
18 months in all
participating
hospitals
All women in labor will be assessed
for risk identification
All high risk deliveries attended by a
personnel receiving regular drills on
newborn resuscitation
If oxytocin is used for augmentation
of labor, the SOP on Oxytocin
administration will be followed
AIM PROCESS MEASURES
All women in labor will have a
partogram completed correctly
OPERATIONAL DEFINITION TOOL TO MEASURE
Pre-delivery checklist used before all
high risk deliveries to prepare for
newborn resuscitation
Babies with birth asphyxia given
AMBU bag and mask within first
golden minute (1 minute) of life
Process Measures

Variation
What is variation? – The act, process or
result of varying
– The extent or degree to which something varies
Synonyms: – difference
– disparity
– dissimilarity

Understanding Variation
Deny the data (It doesn’t fit my view of reality!)
See trends where there are no trends
Try to explain natural variation as special events
Blame and give credit to people for things over which
they have no control
Distort the process that produced the data
Kill the messenger!
Miss opportunities for improvement
If we don’t understand the variation in
our data, we may...

Sources of Variation
Common Causes—those causes inherent in the process over time, affect everyone working in the process, and affect all outcomes of the process. Can be seen as random variation with multiple causes or due to multiple variables
Special Causes—those causes not part of the process all the time or do not affect everyone, but arise because of specific circumstances. Assignable.

Types of Variation
Common Cause Variation
• Is not ‘good variation’
• Is stable and predictable
• Due to the design of the
process
• Does not mean that the
variation is acceptable
Special Cause Variation
• Is not ‘bad variation’
• Unstable and
unpredictable
• Due to irregular or
unnatural causes-
intentional or
unintentional
• Does not mean that the
variation is acceptable

Your Drive to Work….
80
• How much time does it usually take at
7:30 on a Monday morning?
• On Tuesday night at 10 PM?
• Is this special or common cause variation?

Variation: Improvement Strategies
SPECIAL CAUSE
Investigate the special
cause, find out what’s
different and then seek to
manage the special cause
COMMON CAUSE
Take action on the system
as a whole by reducing the
variation in the variables
within the process

Variation Quiz: 2x2 table
YES or NO ? Common
Cause
Special
Cause
Change the
Process
or System
Investigate the
Cause

Variation Quiz
YES or NO ? Common
Cause
Special
Cause
Change the
Process
or System
YES NO
Investigate the
Cause NO YES

Data display and Run Charts
Dr. Azhar Ali
This presenter has
nothing to disclose
September 2016

Azhar’s Correct Spelling on
Slides
93%

Azhar’s Correct Spelling on
Slides
Last week
94% Yesterday
93%
86

Azhar’s Correct Spelling on
Slides

Azhar’s Correct Spelling on
Slides

Run Charts
Power of data graphed over time
– Allows you to “see” variation
– Useful tool for identifying whether special causes are
present
– Is the process “in control” i.e. predictable
Easy to interpret
40
50
60
70
80
90
100
Nov-13 Feb-14 May-14 Aug-14 Nov-14 Feb-15 May-15 Aug-15 Month
% S
TR
ON
GL
Y A
GR
EE

90

Special
Cause
In the Improvement
world we are trying
to introduce special
cause (change) and
then make it
common cause
(sustainable) over
time – a new
process.
Elective Delivery prior to 39 week gestation

Variation Speaks
Run Charts
A run chart, also known as a run-sequence plot is a
graph that displays observed data in a time sequence.
No calculations required
Median
Run Chart Rules
– Shift
– Trend
– Astronomical point

1 2 3 4 5 6 7 8 9 10 11 12 13 14 15 16 17 18 19 20 21 22 23 24 25 26 27 28 29
Point Number
Poun
ds
of R
ed
Bag
Wast
e
3.25
3.50
3.75
4.00
4.25
4.50
4.75
5.00
5.25
5.50
5.75
6.00
Median=4.610
Meas
ure
Time
X (CL) ~
Elements of a Run Chart
The centerline (CL) on a
Run Chart is the Median

Median
Shift: the purpose of this test is to identify a shift
in the process. A run containing 6 or more
consecutive data points all above or all below
the median indicates a non-random pattern in
your data which should be investigated. This
non-random pattern may be a signal of
improvement or of process degradation.
(The IHI extranet)
Astronomical Point(s)
An astronomical point is one that is obviously and blatantly much higher or lower than all the other points on the chart. On a
run chart this rule is not determined statistically but rather by judgment or consensus. (The IHI extranet definition)
Median
Trend: The purpose of this test is to identify a
low-probability trend in the data set. A trend is
defined as 5 or more consecutive points
constantly increasing or 5 or more consecutive
points decreasing. If a trend is detected it
indicates a non-random pattern in your data
which should be investigated.
(The IHI extranet definition)
Rule 1 Rule 2
Rule 3
Three (3) simple rules that indicate if something is not typical random
variation. Only one rule needs to be present.
Median

Analysis of Run Charts Special Cause Rule Number 1: Shifts Six or more consecutive points either above of below the center line (mean or median).
Values on the center line are ignored, they do not break a run, nor are they counted as
points in the run.
0.2
0.7
1.2
1.7
2.2
1 2 3 4 5 6 7 8 9 10 11 12 13 14 15 16 17 18 19 20 21 22 23 24 25
Blood Samples
Mic
ro
gra
ms
/ML
Mean = 2.0
SERUM GENTAMICIN LEVELS - TROUGH

Analysis of Run Charts
75
80
85
90
95
100
105
110
115
120
1 2 3 4 5 6 7 8 9 10 11 12 13 14 15 16 17 18 19 20 21 22 23 24 25
INDIVIDUAL PATIENT READINGS
ME
AS
UR
EM
EN
T
Mean = 94.32
DIALOSTIC BLOOD PRESSURE
Special Cause Rule Number 2: Patterns Any non-random pattern may be an indication of a special cause variation. A general rule
is to investigate any non-random pattern that recurs five or more consecutive times.
Analysis of Run Charts
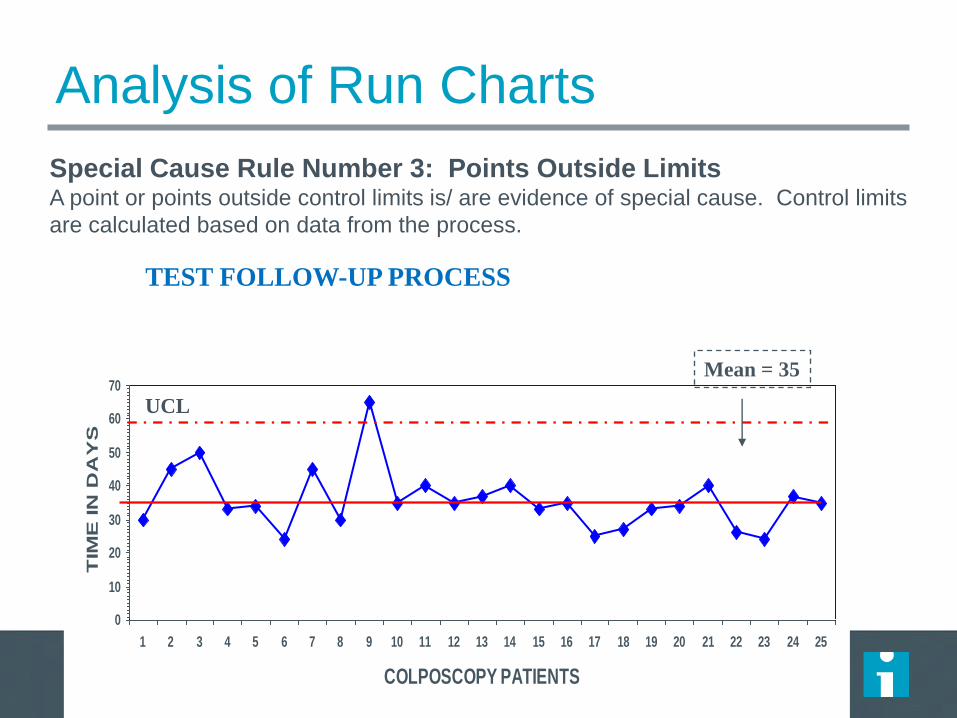
Special Cause Rule Number 3: Points Outside Limits A point or points outside control limits is/ are evidence of special cause. Control limits
are calculated based on data from the process.
0
10
20
30
40
50
60
70
1 2 3 4 5 6 7 8 9 10 11 12 13 14 15 16 17 18 19 20 21 22 23 24 25
COLPOSCOPY PATIENTS
TIM
E IN
DA
YS
Mean = 35
TEST FOLLOW-UP PROCESS
UCL

Medication Administration Process
0
5
10
15
20
25
30
35
40
45
1 2 3 4 5 6 7 8 9 10 11 12 13 14 15 16 17 18 19 20 21 22 23 24 25
Medication Sequence
Ela
ps
ed
Tim
e t
o A
dm
inis
ter
Me
dic
ati
on
in
Min
ute
s
Mean = 22.5
SHIFT DOWN

Process for Obtaining a Stat Consult
0
1
2
3
4
5
6
1 2 3 4 5 6 7 8 9 10 11 12 13 14 15 16 17 18 19 20 21 22 23 24 25
Consult Patients
Tim
e in
Ho
urs
Median = 3.75
SHIFT UP

Process for Admitting from Outpatient
Clinic
0
1
2
3
4
5
6
1 2 3 4 5 6 7 8 9 10 11 12 13 14 15 16 17 18 19 20 21 22 23 24 25
Patient: Admissions
Tim
e in
Ho
urs
Median = 3.0
PATTERN

Test Follow-up Process
0
10
20
30
40
50
60
1 2 3 4 5 6 7 8 9 10 11 12 13 14 15 16 17 18 19 20 21 22 23 24
Tim
e in
Da
ys
Colposcopy Patients
Median = 35
RANDOM VARIATION

Coronary Artery Bypass Graft
Mortality Rate (%)
Jan 13 Jan 14
5.9%
1.1%

Coronary Artery Bypass Graft
0
1
2
3
4
5
6
7
Jan
-13
Feb
Mar
Ap
r
May Ju
n
Jul
Au
g
Sep Oct
Nov
Dec
Jan
-14
CABG Mortality Rate: Clinic I

Coronary Artery Bypass Graft
0
1
2
3
4
5
6
7J
an
-13
Feb
Ma
r
Ap
r
Ma
y
Ju
n
Ju
l
Au
g
Sep
Oct
No
v
Dec
Ja
n-1
4
CABG Mortality Rate: Clinic II
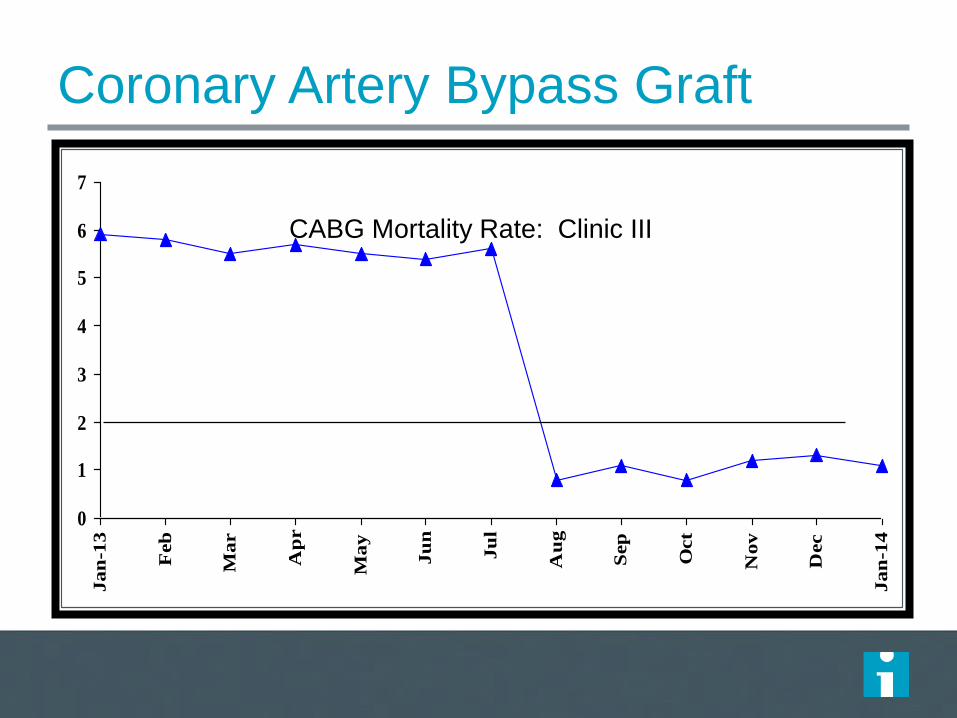
Coronary Artery Bypass Graft
0
1
2
3
4
5
6
7
Ja
n-1
3
Feb
Ma
r
Ap
r
Ma
y
Ju
n
Ju
l
Au
g
Sep
Oct
No
v
Dec
Ja
n-1
4
CABG Mortality Rate: Clinic III

There are two ways to view data
106
STATIC VIEW Descriptive Statistics
Mean, Median & Mode
Minimum/Maximum/Range
Standard Deviation
Bar graphs/Pie charts
DYNAMIC VIEW Line Chart
Run Chart
Control Chart
Statistical Process Control (SPC)
Ra
te p
er
10
0 E
D P
atie
nts
Unplanned Returns to Ed w/in 72 Hours
M
41.78
17
A
43.89
26
M
39.86
13
J
40.03
16
J
38.01
24
A
43.43
27
S
39.21
19
O
41.90
14
N
41.78
33
D
43.00
20
J
39.66
17
F
40.03
22
M
48.21
29
A
43.89
17
M
39.86
36
J
36.21
19
J
41.78
22
A
43.89
24
S
31.45
22
Month
ED/100
Returns
u chart
1 2 3 4 5 6 7 8 9 10 11 12 13 14 15 16 17 18 19
0.0
0.2
0.4
0.6
0.8
1.0
1.2
UCL = 0.88
Mean = 0.54
LCL = 0.19
Understanding Data Variation
© 2014 Kaiser Foundation Health Plan, Inc. For internal use only. Kaiser Permanente Improvement Institute

Improvement uses static and dynamic data
Static views are suited to assess variation at a point in time
107
Trends
Sudden Shifts 0
200
400
600
800
1000
Dell
Compaq
IBM
Toshiba HP
System
Pro
cess
ing
Tim
e
0%
10%
20%
30%
40%
50%
60%
70%
80%
90%
100%
Significance of Factors
Unusual Observations
Dynamic views are best for measuring changes in data variation
© 2014 Kaiser Foundation Health Plan, Inc. For internal use only.
Kaiser Permanente Improvement Institute

0
1
2
3
4
5
6
7
8
Before Change (Week 4) After Change (Week 11)
8
3
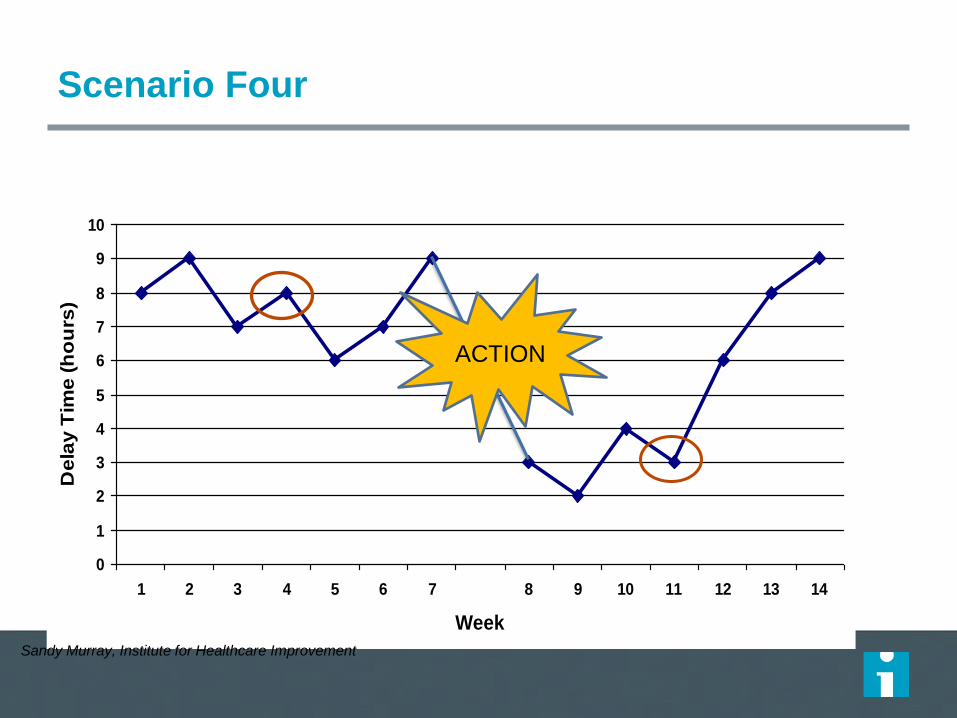
Is this change an improvement?
How confident are you that the change, implemented
in week 7, has led to an improvement?
Sandy Murray, Institute for Healthcare Improvement
Decrease in Delay Time (Hours)

0
1
2
3
4
5
6
7
8
9
10
1 2 3 4 5 6 7 8 9 10 11 12 13 14
Week
De
lay
Tim
e (
ho
urs
)
Scenario One
Sandy Murray, Institute for Healthcare Improvement
ACTION

0
1
2
3
4
5
6
7
8
9
10
1 2 3 4 5 6 7 8 9 10 11 12 13 14
Week
De
lay
Tim
e (
ho
urs
)
Scenario Two
Sandy Murray, Institute for Healthcare Improvement
ACTION

0
1
2
3
4
5
6
7
8
9
10
1 2 3 4 5 6 7 8 9 10 11 12 13 14
Week
De
lay
Tim
e (
ho
urs
)Scenario Three
Sandy Murray, Institute for Healthcare Improvement
ACTION
0
1
2
3
4
5
6
7
8
9
10
1 2 3 4 5 6 7 8 9 10 11 12 13 14
Week
De
lay
Tim
e (
ho
urs
)
Scenario Four
Sandy Murray, Institute for Healthcare Improvement
ACTION

Example: Results of New CHF Protocol
(static)
113 Readmission Reduced from 30% to 24%!
New CHF
Protocol
Introduced
Best Practice
Spread to entire Region!
Understanding Data Variation
© 2014 Kaiser Foundation Health Plan, Inc. For internal use only.
Kaiser Permanente Improvement Institute

Same data … dynamic view
114
New CHF
Protocol
Introduced
Understanding Data Variation
© 2014 Kaiser Foundation Health Plan, Inc. For internal use only.
Working Example from Kaiser Permanente Improvement Institute

How will we know that a change is an
improvement?
1. By understanding the variation that lives
within your data
2. By making good management decisions on
this variation (i.e. don’t overreact to a
special cause and don’t think that random
movement of your data up and down is a
signal of improvement)

– We must become masters of improvement
– We must learn how to improve rapidly
– We must learn to discern the difference between improvement and illusions of progress
Change vs. Improvement
Of all changes I’ve observed, about 5%
were improvements, the rest, at best,
were illusions of progress.
W. Edwards Deming

LUNCH

Driver Diagrams Frank Federico, RPh
These presenters have
nothing to disclose
31 August 2016

Theory of Change
What do you have to do to achieve the aim?
Example: Improve flow through the hospital by
freeing up X number of beds by DATE.

Driver Diagrams
A driver diagram depicts the relationship between
the aim, the primary drivers that contribute directly
to achieving the aim, and the secondary drivers
that are necessary to achieve the primary drivers.
A driver diagram represents the team members’
current theories of “cause and effect” in the system
– what changes will likely cause the desired
effects.

Components of Driver Diagrams
121
The Driver Diagram: tells us everything in the
system that we need to work on to reach our aim
Primary Drivers: tells us the BIG categories of
work needed to reach our aim
Secondary Drivers: the changes we need to
make to complete the Primary Driver
Change Package: what we actually have to do to
make the changes work

What Changes Can We Make? Understanding the System for Weight Loss
Primary
DriversOutcome
Secondary
Drivers
Process
Changes
AIM:
A New
ME!
Calories In
Limit daily
intake
Track
Calories
Calories
Out
Substitute
low calorie
foods
Avoid
alcohol
Work out 5
days
Walk to
errands
Plan
Meals
Drink H2O
Not Soda
drives
drives
drives
drives
drives
drives
drives
drives
“Every system is perfectly
designed to achieve the results
that it gets”
See
change
package
Source: Richard Scoville, Improvement Advisor

Reduce infant
mortality
Social Issues
Post-birth actions
Pre-birth maternal
health
Maternal smoking
Improved sharing of
information
Improved management
of care
Increase referrals
Improved identification
Aim 1⁰ 2⁰
Theory of what actions will
reduce infant mortality
Detailed Aim:
To reduce by 15%
the rates of
stillbirth & infant
mortality by 2015
Maternal drinking
Maternal misuse of
drugs
Health
Increase rate of
breastfed babies
Quicker diagnoses of
Neonatal Abstinence
Syndrome
Poverty
Housing
Domestic Abuse &
Violence
Maternal Obesity
Maternal mental
health
Attachment
Improved stability /
permanence for LAC
Improved uptake of
benefits
Improved planning
Improved family
centred response
Improved leadership &
culture
Improved teamwork,
communication and
collaboration
Parenting skills
Identification &
reasons for current
resilience
WORKSTREAM 1 (conception to 1 year)
Theory of what drivers infant mortality

VTE Prevention
Risk assessment
Appropriate
prophylaxis
Patient and Family
Engagement
Aim 1⁰ 2⁰
Theory of what actions will
prevent VTE
Detailed Aim: how
much by when
Theory of what drivers prevent VTE
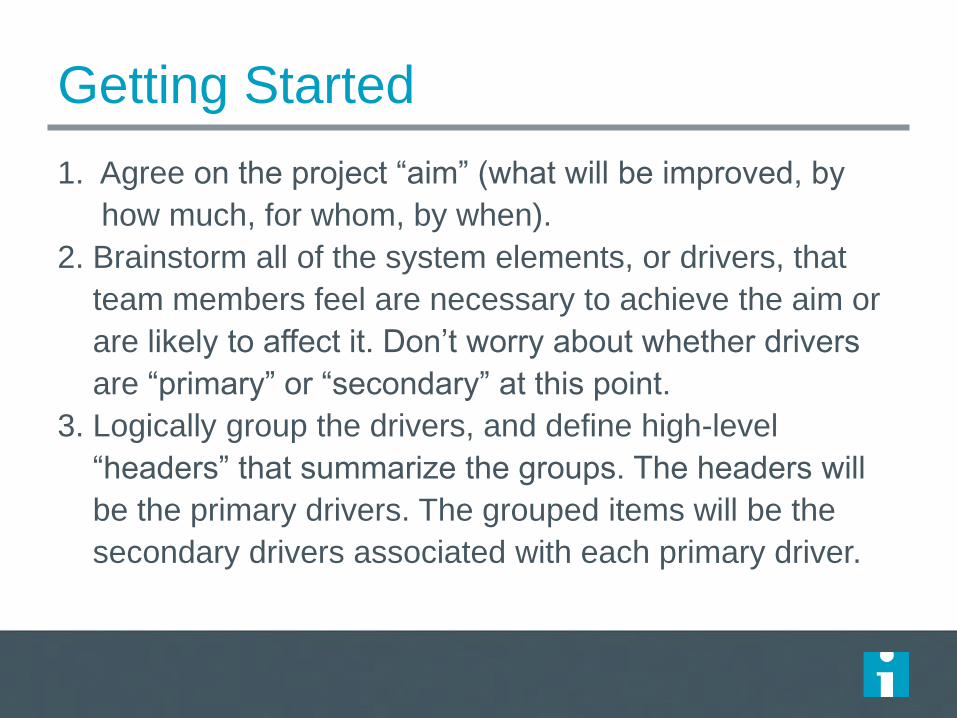
Getting Started
1. Agree on the project “aim” (what will be improved, by
how much, for whom, by when).
2. Brainstorm all of the system elements, or drivers, that
team members feel are necessary to achieve the aim or
are likely to affect it. Don’t worry about whether drivers
are “primary” or “secondary” at this point.
3. Logically group the drivers, and define high-level
“headers” that summarize the groups. The headers will
be the primary drivers. The grouped items will be the
secondary drivers associated with each primary driver.

Getting Started
4. Check the drivers for duplicates, clarity, missing
elements, and team consensus.
5. You can now draw connecting arrows showing the
cause-and-effect relationships (if secondary drivers
have multiple arrows to more than one primary
driver, then the grouping may need to be
adjusted; most secondary drivers should align
under one primary driver each).

Getting Started
6. You are now ready to define the interventions or
strategies (the “hows”) that you will use to have
an impact on the various drivers.
7. You can also define project measures for
tracking progress, to test and modify your
theories for improvement, and to monitor for
overall project effectiveness.

Can you develop Driver Diagrams for Everything Improvement
Effort?


PDSA – Testing Changes
Dr. Azhar Ali
This presenter has
nothing to disclose
September 2016

Model for Improvement

The PDSA Cycle
What’s next?
Did it work?
What will happen if we
try something different?
Let’s try it!
Plan• Objective
• Questions &
predictions
• Plan to carry out:
Who?When?
How? Where?
Do• Carry out plan
• Document
problems
• Begin data
analysis
Act• Ready to
implement?
• Try something
else?
• Next cycle
Study• Complete data
analysis
• Compare to
predictions
• Summarize

Act
Plan Objective
Questions and
predictions (why)
Plan to carry out the cycle
(who, what, where, when)
Study Do
Plan, Do, Study, Act Cycle

Act Plan
Study
Do Carry out the plan
Document problems
and unexpected
observations
Begin analysis of
the data
Plan, Do, Study, Act Cycle

Act Plan
Study Complete the
analysis of the data
Compare data to
predictions
Summarise what
was learned
Do
Plan, Do, Study, Act Cycle

Act
What changes
are to be made?
Next cycle?
Plan
Study Do
Plan, Do, Study, Act Cycle

137

The PDSA Cycle
What’s next?
Did it work?
What will happen if we
try something different?
Let’s try it!
Plan• Objective
• Questions &
predictions
• Plan to carry out:
Who?When?
How? Where?
Do• Carry out plan
• Document
problems
• Begin data
analysis
Act• Ready to
implement?
• Try something
else?
• Next cycle
Study• Complete data
analysis
• Compare to
predictions
• Summarize

139
Spread
throughout the
system
Develop a
change
Implement a
change
Test a
change
Test under a variety of conditions
Embed in daily operations
`
AP
DS
APD
S
A
P
D
S
A P
DS
Prerequisites for change
Confidence that
change is e
ffective
The Sequence of Improvement

Current Situation Resistant Indifferent Ready
Low
Confidence that
current change
idea will lead to
Improvement
Cost of
failure
large
Very Small
Scale Test
Very Small
Scale Test
Very Small
Scale Test
Cost of
failure
small
Very Small
Scale Test
Very Small
Scale Test
Small Scale
Test
High
Confidence that
current change
idea will lead to
Improvement
Cost of
failure
large
Very Small
Scale Test
Small Scale
Test
Large Scale
Test
Cost of
failure
small
Small Scale
Test
Large Scale
Test
Implement
Think About the Size and Scope of a Test

Why Test?
Increase belief that the change will result in
improvement in your environment.
Predict how much improvement can be expected
from the change.
Learn how to adapt the change to conditions in the
local environment.
Minimize resistance upon implementation.

To be Considered a Real Test
Test was planned, including a plan for collecting
data.
Plan was carried out and data was collected.
Time was set aside to analyze data and study the
results.
Action was based on what was learned.

Objective
Test to spin a coin
for the longest
amount of time in
15 minutes
Materials
Any Singaporean Coin
PDSA Tracker Form
Run Chart
Smartphone timer

# Plan Do Study Act
# What questions? Theories? Prediction What do you see? How Long? How did what you see match prediction?
What now? Adopt, adapt, abandon?
1 Large coins last longer 2p = 10 seconds Started to wobble. Time = 7 No, Three seconds short. Large Size/weight Adapt - Test 10p
2 10p will spin longer 10p = 10 seconds Started to lose spin fast. Time = 8 Two seconds short. Size may be more important Adapt?
3
4
5
6
7
8
9
10
10
7
5
3
1
1 2 3 4 5 6 7 8 9 10
PDSA Test Cycle
Se
co
nd
s
Data
Collection
on a Run
Chart
PDSA Tracker

# Plan Do Study Act
# What questions? Theories? Prediction What do you see? How Long?
How did what you see match prediction?
What now? Adopt, adapt, abandon?
1
2
3
4
5
6
7
8
9
10
10
7
5
3
1
1 2 3 4 5 6 7 8 9 10
PDSA Test Cycle
Se
co
nd
s
Data
Collection
on a Run
Chart
PDSA Tracker

Repeated Use of the PDSA Cycle
Hunches
Theories
Ideas
Changes That
Result in
Improvement
A P
S D
A P
S D
Very Small
Scale Test
Follow-up
Tests
Wide-Scale Tests
of Change
Implementation of
Change
What are we trying to accomplish?
How will we know that a change is an improvement?
What change can we make that will result in improvement?
Model for Improvement
Sequential building of
knowledge under a wide range
of conditions
Sprea
d

About Predictions…
Most often unstated but powerful influence.
It is your theory behind the changes you choose
and tests that you run.
Without a theory, change are just independent
elements that don’t add up.
Allows you learn and delve deeper: bundle
example.

PDSA Cycle for Learning & Improvement
Act
• What modifications
are to be made?
• Next cycle?
Plan • Objective
• Questions & predictions (What will happen and why?)
• Plan to carry out the cycle
(Who, what, where, when?)
Study • Complete analysis of
the data
•Compare data to
predictions
•Summarize what
was learned
Do • Carry out the plan
• Document problems
and unexpected
observations
• Begin analysis
of the data
Test or Task
In-service education
Make a form
Determining whether email or phone call works
best with physician notification of problem
Posting data
Newsletter to physicians about project
Team meeting


Decrease the Time Frame
for a PDSA Test Cycle
– Years
– Quarters
– Months
– Weeks
– Days
– Hours
– Minutes
151
Drop down next
“two levels” to
plan Test Cycle!


Change Concepts

A general idea or theory - grounded in science,
experience, or logic - that can stimulate specific
ideas for changes that will lead to improvement.
Change concepts can be derived from:
A Change Concept Is...
• Evidence; scientific results
• Critical thinking or observation of current system
• Creative thinking
• Hunches
• Mental leaps...extrapolating from other situations

Complete List of Change Concepts
Eliminate Waste 1. Eliminate things that are not used
2. Eliminate multiple entry
3. Reduce or eliminate overkill
4. Reduce controls on the system
5. Recycle or reuse
6. Use substitution
7. Reduce classifications
8. Remove intermediaries
9. Match the amount to the need
10. Use Sampling
11. Change targets or set points
Improve Work Flow 12. Synchronize
13. Schedule into multiple processes
14. Minimize handoffs
15. Move steps in the process close together
16. Find and remove bottlenecks
17. Us automation
18. Smooth workflow
19. Do tasks in parallel
20. Consider people as in the same system
21. Use multiple processing units
22. Adjust to peak demand
Optimize Inventory 23 Match inventory to predicted demand
24 Use pull systems
25 Reduce choice of features
26 Reduce multiple brands of same item
Change the Work Environment
27. Give people access to information
28. Use Proper Measurements
29. Take Care of basics
30. Reduce de-motivating aspects of pay system
31. Conduct training
32. Implement cross-training
33. Invest more resources in improvement
34. Focus on core process and purpose
35. Share risks
36. Emphasize natural and logical consequences
37. Develop alliances/cooperative relationships
Enhance the Producer/customer relationship
38. Listen to customers
39. Coach customer to use product/service
40. Focus on the outcome to a customer
41. Use a coordinator
42. Reach agreement on expectations
43. Outsource for “Free”
44. Optimize level of inspection
45. Work with suppliers
Manage Time
46. Reduce setup or startup time
47. Set up timing to use discounts
48. Optimize maintenance
49. Extend specialist’s time
50. Reduce wait time
Manage Variation 51. Standardization (Create a Formal Process)
52. Stop tampering
53. Develop operation definitions
54. Improve predictions
55. Develop contingency plans
56. Sort product into grades
57. Desensitize
58. Exploit variation
Design Systems to avoid mistakes 59. Use reminders
60. Use differentiation
61. Use constraints
62. Use affordances
Focus on the product or service
63. Mass customize
64. Offer product/service anytime
65. Offer product/service anyplace
66. Emphasize intangibles
67. Influence or take advantage of fashion trends
68. Reduce the number of components
69. Disguise defects or problems
70. Differentiate product using quality dimensions
Langley, G.J., Nolan, K.M., Nolan, T.W, Norman, C.L., & Provost, L.P. (2009). The improvement guide: A
practical approach to enhancing organizational performance (2nd Ed.). San Francisco: Jossey-Bass.

Selecting Changes
Copy: use the literature, experience of others,
hunches and theories: “This is what they did
at Dr. Grays. I don’t know if it will work here
but let’s see what we can learn from it.”
Avoid low impact changes:
– “Let’s put up a poster.”;
– “Let’s have an education session.”;
– “Let’s send out reminders.”

Selecting Concepts
Avoid technical slow-downs: “We will build a
computer programme to do this…”
Be strategic: set priorities based on the aim,
known problems, and feasibility, “Let’s see if we
can get the multi-disciplinary team together for
one round.”

Change Concepts for System
Redesign
Do tasks in parallel (rescuing deteriorating patients:
call system, availability of juniors…)
Minimize handoffs (Hospital At Night)
Synchronize to a common point in time (knife to
skin)
Use pull systems (discharge appointments)
Move steps closer together (central line insertion
cart)

Now You Practice... Selecting Change
Concepts and Planning a Test
Continue, in small groups, with the same aim and
measures.
Select one of the generic change concepts that is
relevant to your improvement effort or identify an
“original” concept or theory for change that you want
to test.

Engaging teams in improvement
Dr. Azhar Ali
This presenter has
nothing to disclose
September 2016
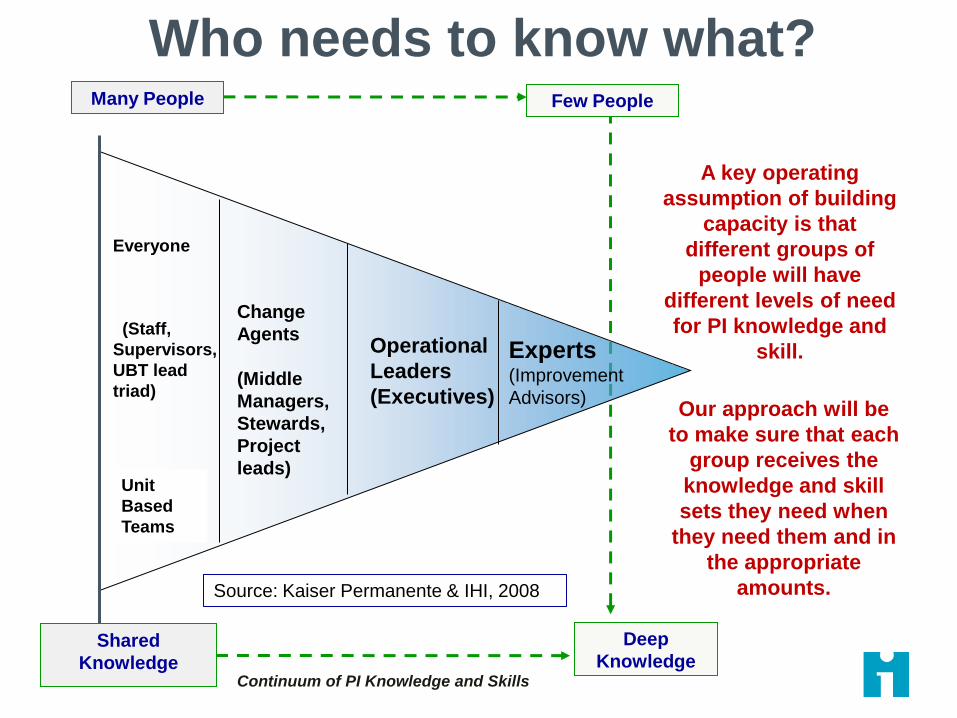
Experts (Improvement
Advisors)
Operational
Leaders
(Executives)
Change
Agents
(Middle
Managers,
Stewards,
Project
leads)
Everyone
(Staff,
Supervisors,
UBT lead
triad)
Unit
Based
Teams
Continuum of PI Knowledge and Skills
Deep
Knowledge
Many People Few People
Our approach will be
to make sure that each
group receives the
knowledge and skill
sets they need when
they need them and in
the appropriate
amounts.
A key operating
assumption of building
capacity is that
different groups of
people will have
different levels of need
for PI knowledge and
skill.
Who needs to know what?
Source: Kaiser Permanente & IHI, 2008
Shared
Knowledge
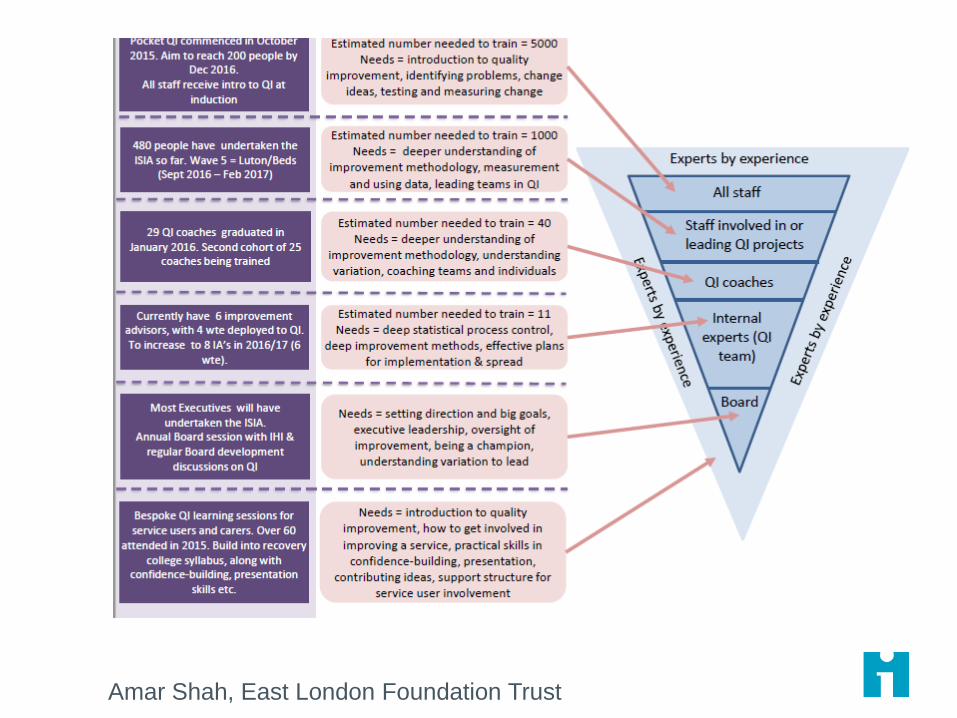
Amar Shah, East London Foundation Trust

Improvement Teams
Who make good team members
– Project leader with authority to execute the project
– Day-to-day operational and clinical leaders
– Subject matter experts
Committed to aim of the project work
Must have senior leaders sponsor
Must have the time allotted to do improvement
work
163

Project Selection
• The project you propose should be important for your organization. For example: – Problems with patient safety, service or outcomes
– A need to reduce costs
– Responding to quality issues
• 3-9 months
• Baseline data exists and potential measures have been identified
• You have control over the drivers of improvement
• The project has a sponsor
164
165
What We Have Here
Is a Failure to…Engage?
How Often Have You Felt / Heard?
– My Board is not engaged…
– If only my manager was more engaged…
– My team members aren’t interested in trying new things…
– Our patients are not engaged in their own care…
What do you mean?

Getting Results Framework
Will - to improve,
Ideas - about alternatives to the
status quo, and
Execution / Getting Results - you
have to make it real

Discussion
What have been your biggest challenges
in engaging leaders/middle
managers/physicians/nurses and others in
QI and Safety?
– Is it lack of WILL?
– Is it lack of IDEAS?
– Is it GETTING RESULTS/EXECUTION?

168
Questions
To Guide Your Discussion
1. Are the three factors that are contributing to this problem at the ____ level, mostly related to ideas, will, or execution?
2. What hasn’t worked with respect to our current engagement strategy with this group?
3. How might we more effectively engage this group?

Engaging Patients
Engaged in their own care
Engaged in an improvement team
Engaged in governance/committees

Engaging Physicians

How is a paradigm formed?

Every time a monkey went up the ladder, the scientists soaked the rest of the monkeys with cold water.
NHS III

After a while, every time a monkey went up the ladder, the others beat up the one on the ladder.
NHS III
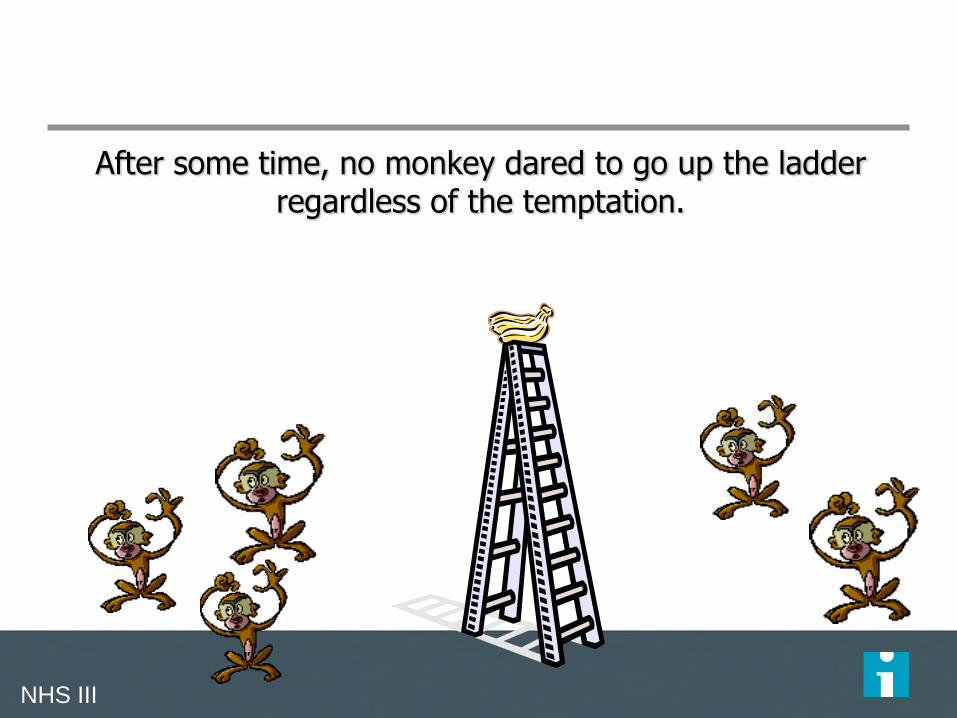
After some time, no monkey dared to go up the ladder regardless of the temptation.
NHS III
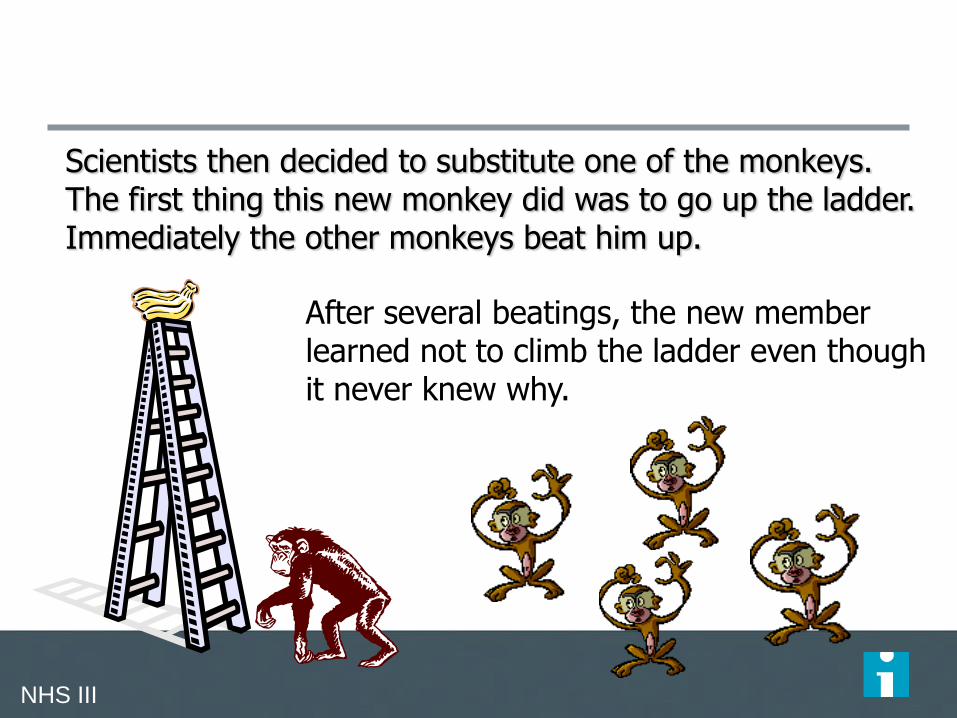
Scientists then decided to substitute one of the monkeys. The first thing this new monkey did was to go up the ladder. Immediately the other monkeys beat him up.
After several beatings, the new member learned not to climb the ladder even though it never knew why.
NHS III

A second monkey was substituted and the same occurred. The first monkey participated on the beating for the second monkey. A third
monkey was changed and the same was repeated (beating). The fourth was substituted and the beating was repeated and finally the fifth monkey
was replaced.
NHS III

What was left was a group of five monkeys that even though never received a cold shower, continued to beat up any monkey who attempted
to climb the ladder.
NHS III
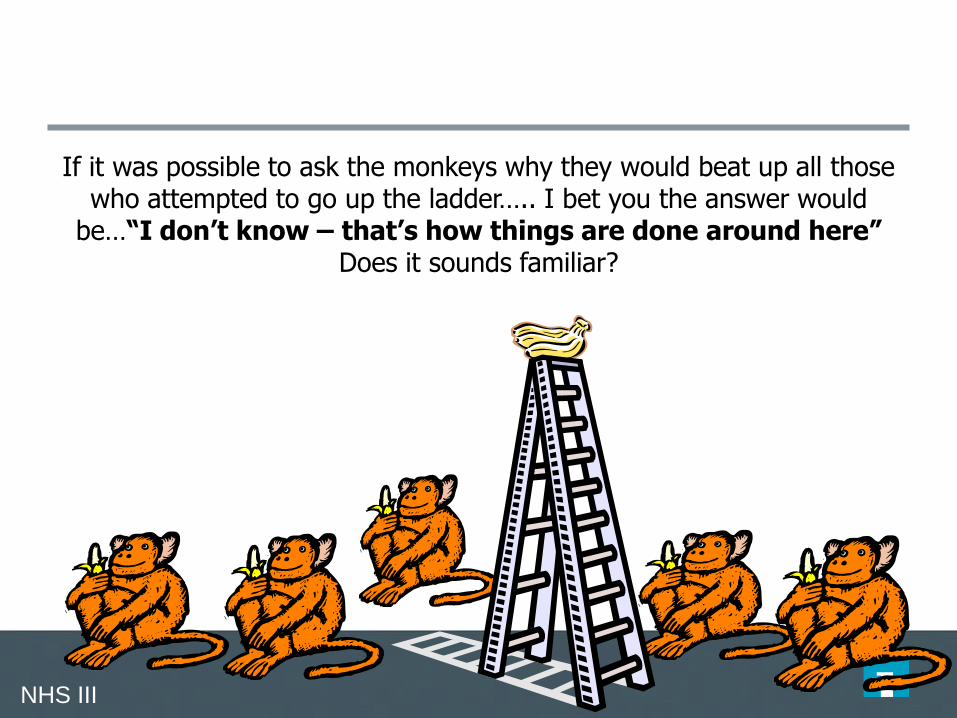
If it was possible to ask the monkeys why they would beat up all those who attempted to go up the ladder….. I bet you the answer would
be…“I don’t know – that’s how things are done around here” Does it sounds familiar?
NHS III

179
Spreadland Next Exit

Methods for Spread and Scale Up
• Natural diffusion
• Executive mandates (and training).
• Extension agents - spread ideas and best
practices.
• Emergency mobilization – rapid efficient
assembly of plans, materials, supplies.
• Affinity group - develop superior model, then
dissemination to other sites in the system.
Massoud MR, Donohue KL, and McCannon CJ. 2010. Options for Large-scale Spread of Simple, High impact Interventions.
Technical Report. Published by the USAID Health Care Improvement Project. Bethesda, MD: University Research Co. LLC
(URC).

Methods for Spread and Scale Up
• Collaborative (physical or virtual) – networked
structured learning and exchange around shared
aims, measures, and goals.
• Wave sequence - systematic spread within
integrated multi-level systems
• Campaigns - shared, quantitative aim connected
to a targeted social system (evidence-based
intervention, measurement, communications,
and distributed field operations).
• Hybrid approaches, where combined elements
from different approaches form a new approach.
Massoud MR, Donohue KL, and McCannon CJ. 2010. Options for Large-scale Spread of Simple, High impact Interventions.
Technical Report. Published by the USAID Health Care Improvement Project. Bethesda, MD: University Research Co. LLC
(URC).

http://www.businessballs.com/treeswing.htm

How Can We Foster the Adoption of
Successful Change Ideas?
The Traditional Approaches

An Early Adopter

Will this be one of your team members?

Clarify “Where” We Spread
What is your level of our ambition?
– Every unit or ward in a hospital?
– Every service line (clinical & operations)?
– Every hospital in a system or region?
– All primary care clinics?
– All inpatient and outpatient mental health?
– All levels of care across a population?

Roger’s Adopter Categories
Rogers, E. M. (2003). Diffusion of innovations. New York, Free Press.
‘Traditionalists’
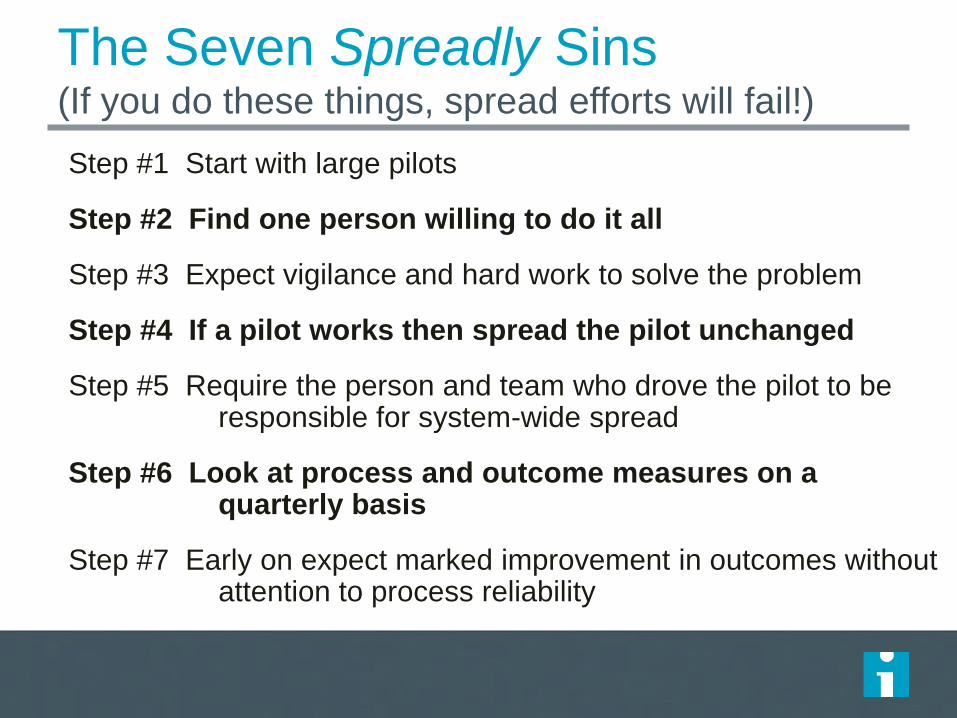
The Seven Spreadly Sins (If you do these things, spread efforts will fail!)
Step #1 Start with large pilots
Step #2 Find one person willing to do it all
Step #3 Expect vigilance and hard work to solve the problem
Step #4 If a pilot works then spread the pilot unchanged
Step #5 Require the person and team who drove the pilot to be responsible for system-wide spread
Step #6 Look at process and outcome measures on a quarterly basis
Step #7 Early on expect marked improvement in outcomes without attention to process reliability

Key Contacts Bill NichollLiz Armour
SG&R - Fiona Gibson
Activity Hand Hygiene Safety Briefings SBARMedicines
Reconciliation
Anti Coag
ManagementTrigger Tool Daily Goals SEWS PVC Bundle
Month November November November November November November November November
Clinical/Practice Area
Tay Ward PRI
Earn Ward PRI
Rehab Stroke Unit
Simpson Day Hospital
Legend ( more than one legend can be entered to display progress eg. Testing & implementing within one month)
Testing T
Fully Implemented F
Spreading S
Not yet Measuring NM
Not Yet in Place NP
Not Applicable NA
Tests Carried Out
Challenges
Successes
Plans for Spread
Perth & Kinross CHP- Spread Plan
Date: November 07
Completed by:

Tracking the Spread of Specific Ideas Across Multiple Sites
Pilot 1
Pilot 2
Spread 1
Spread 2
Spread 3
Progress Score 3.5 3.0 2.0 3.0 1.5
A B C D A B C D A B C D A B C D A B C D
VTE Prophylaxis x x x x x
Sepsis x x x x x
Unit Briefings x x x x x
VAP x x x x 0
Hazard Drug/Area #
1 x x x x x
Early Warning
System x x 0 0 0
Reconciliation x x x x x
Pressure ulcers x x x x x
Central lines x x x x x
Patient Involvement x x x x x
Simulation x
N
A
N
A
N
A
N
A
Legend: A= Planning B= Start C= In Progress D= Fully Implemented

Don’t be a slave to the plan!
You will learn a lot that may require a change to
your plan
Don’t be frustrated by having to back up and
reevaluate - just don’t take forever!
– Change takes longer than you thought!
– Some units want the change NOW!
– Some never want it!

“Quality improvement begins with love and vision. Love of your patients. Love of your
work. If you begin with technique, improvement won’t
be achieved.”
A. Donabedian, M.D
References
IHI.org
Langley, G. J., Moen, R. D., Nolan, K. M., Nolan,
T. W., Norman, C. L., & Provost L. P. (2009). The
improvement guide: A practical approach to
enhancing organizational performance. San
Francisco, CA: Jossey-Bass.

Questions and
Discussion