back to basics: guidelines for profitable dairy farming michael verner 25 january 2011
TRANSCRIPT

Back to Basics: Guidelines for
Profitable Dairy Farming
Michael Verner25 January 2011

Outline
Where we are today
Does milk from forage matter?
How important is feed efficiency?
Are there economies of scale?
The prospects for 2011 and beyond
OUTLINE

Feed and fertiliser prices: 2000 - 2010
050
100150200250300350
2000 2002 2004 2006 2008 2010 2012
Year
£/to
nn
e
Milk Fertiliser Concentrates
Feed and Fertiliser Prices - 2000-2010
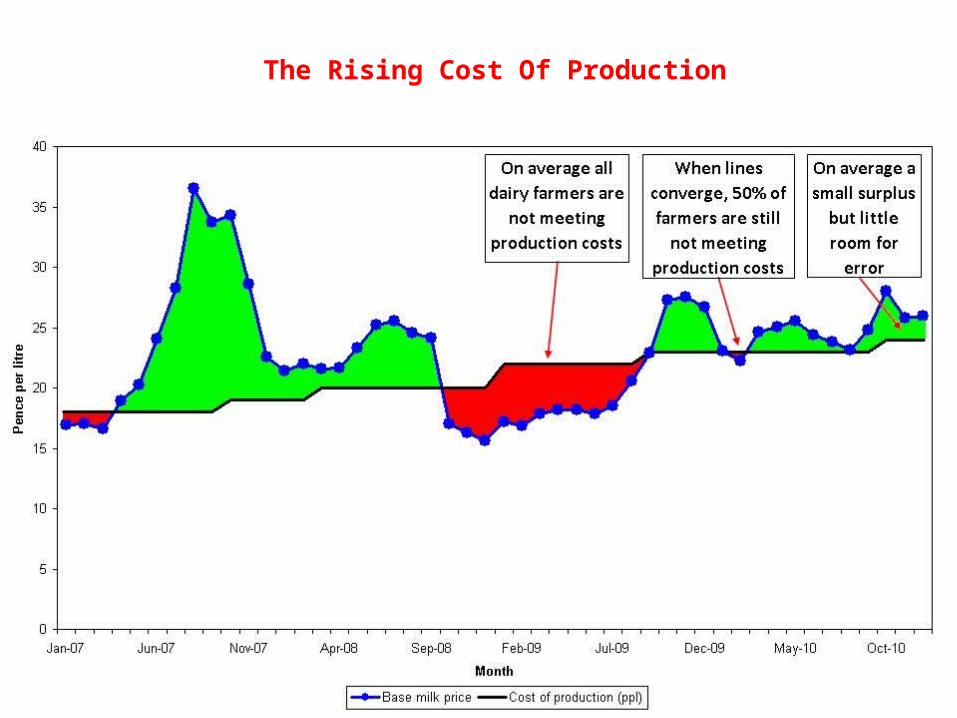
The rising cost of productionThe Rising Cost Of Production

Does milk from forage matter?
Does Milk From Forage matter

How we’ve changed
2000 2010 Change
Herd size 83 129 +46
Milk yield(litres/cow)
6000 6710 +710
MFF(litres/cow)
3222 1887 -1335
How we’ve changed

Feed Cash cost (£/t utilisable DM)
Full economic cost (£/t utilisable DM)
Grazed grass 44 (35 – 56) 80
3 cut silage 76 (69 – 109) 122
Wholecrop wheat 74 123
Forage maize 77 (72 – 162) 121
Concentrates 250 254
The ‘real’ cost of forageThe ‘real’ cost of forage

Definition: Net Profit (£/cow)
Net profit = Output – (Variable costs + Overhead Costs)
Variable costs Overhead costs
Forage ConcentratesVet and MedAIMiscellaneous
Machinery running costsContractor costsDepreciationProperty repairsBusiness costsMiscellaneousLabourConacreFinance / Interest
Definition: Net Profit (£/cow)

Milk from forage and net profit
0
50
100
150
200
250
300
350
400
450
500
>4000 3500 to 4000 3000 to 3499 2500 to 2999 2000 to 2499 1500 to 1999 <1500
MFF litres/cow
Ne
t P
rofi
t £
/co
w
2% 2% 4% 11% 22% 21% 38%
Milk from forage and net profit

“The man with money and
grass will not waste the
grass”
Does milk from forage matter?Does milk from forage matter?

How important is feed efficiency?
How important is feed efficiency?

How we’ve changed
2000 2010 Change
Herd size 83 129 +46
Milk yield(litres/cow)
6000 6710 +710
Meal fed(kg/cow)
1250 2170 +920
0.21 kg/litre 0.32 kg/litre
How we’ve changed

MILK YIELD : MEAL FED
3,500.00
4,500.00
5,500.00
6,500.00
7,500.00
8,500.00
9,500.00
0.00 500.00 1,000.00 1,500.00 2,000.00 2,500.00 3,000.00 3,500.00 4,000.00 4,500.00
MEAL FED/COW (KG)
MIL
K Y
IEL
D/C
OW
(L
ITR
ES
)
Milk yield versus meal fed fed
2.5 tonnes8000 litres
2.5 tonnes6200 litres

Measures that matter – Feed rate
Example100 cow herd selling 7,500 litres/cow from 2 tonnes of concentrates
Buys 200 tonnes of dairy concentrateSells 750000 litres of milk
Farm has a feeding rate of:
(200 x 1000kg) = 200000 = 0.26kg/litre 750000 750000
Measures that matter – Feed rate
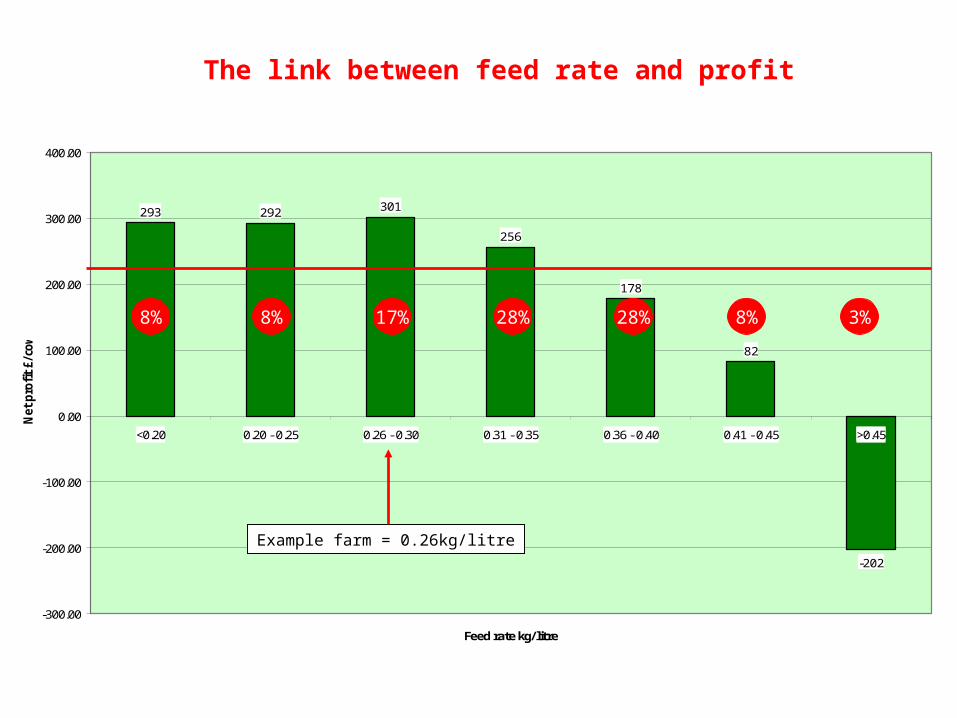
293 292 301
256
178
82
-202
-300.00
-200.00
-100.00
0.00
100.00
200.00
300.00
400.00
<0.20 0.20 - 0.25 0.26 - 0.30 0.31 - 0.35 0.36 - 0.40 0.41 - 0.45 >0.45
Feed rate kg/litre
Net
pro
fit £
/cow
The link between feed rate and profit
Example farm = 0.26kg/litre
8% 8% 17% 28% 28% 8% 3%
The link between feed rate and profit
Feeding Method
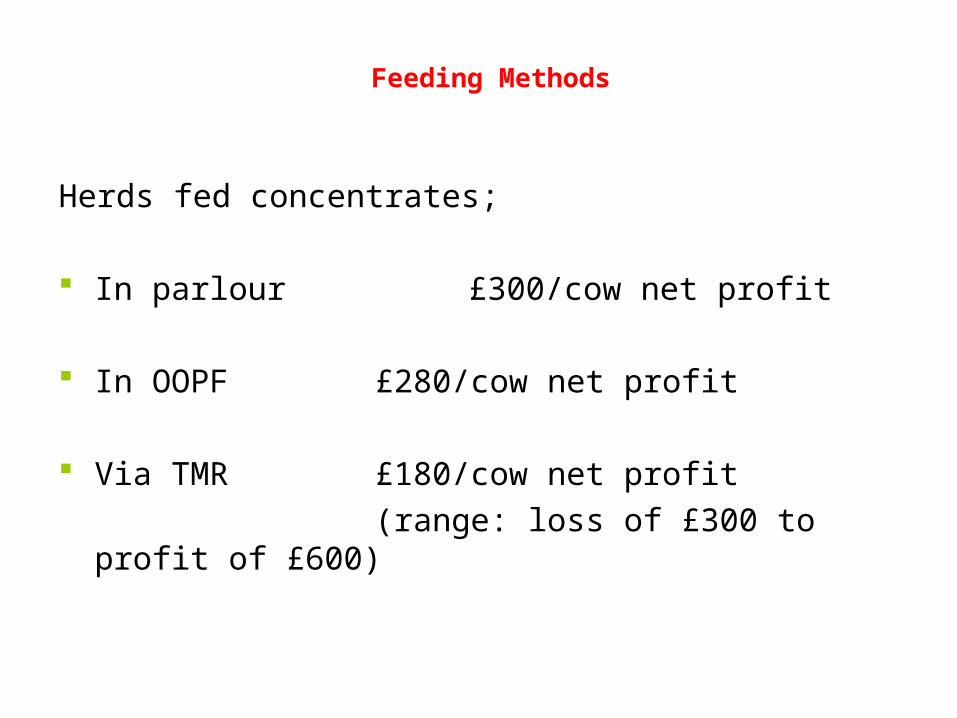
Herds fed concentrates;
In parlour £300/cow net profit
In OOPF £280/cow net profit
Via TMR £180/cow net profit (range: loss of £300 to profit of £600)
Feeding Methods

Successful TMR feeding
Feeding quality forage(s)
Batching cows
Feeding to the lowest yielding cow in group and ‘topping up’
Moving cows as yield declines and adjusting parlour feeding
Calibrating parlour feeders
Checking crude protein of ration esp. with inclusion of maize
Staff understanding
Successful TMR feeding

“Margin is sanity,
volume is vanity”
How important is feed efficiency?How important is feed efficiency?

Are there economies of scale?
Are there economies of scale?

0
5000
10000
15000
20000
25000
30000
35000
40000
<50 50-74 75-99 100-149 150-200 >200
Herd size
Pro
fit f
rom
da
iryin
g
Total profit from dairying
100 cows 170 cows
8% 15% 19% 25% 20% 13%
Total profit from dairying

0
5000
10000
15000
20000
25000
30000
35000
40000
<50 50-74 75-99 100-149 150-200 >200
Herd size
Pro
fit f
rom
da
iryin
g
Total profit from dairying
Controlled expansion maintain performance Little expansion regain performance
Total profit from dairying

“Get better before you get bigger”
Are there economies of scale?

The prospects for 2011 and beyondThe prospects for 2011 and beyond

The answers!
Does milk from forage matter?
Yes - High quality grazed grass and grass silage are vital to
ensure future profitability
How important is feed efficiency?
Very – Concentrates are the single biggest cost on most dairy
farms
Are there economies of scale?
Probably – but make sure performance is good and then
expand gradually, remember profit equals margin x volume!
The answers
What are the prospects?
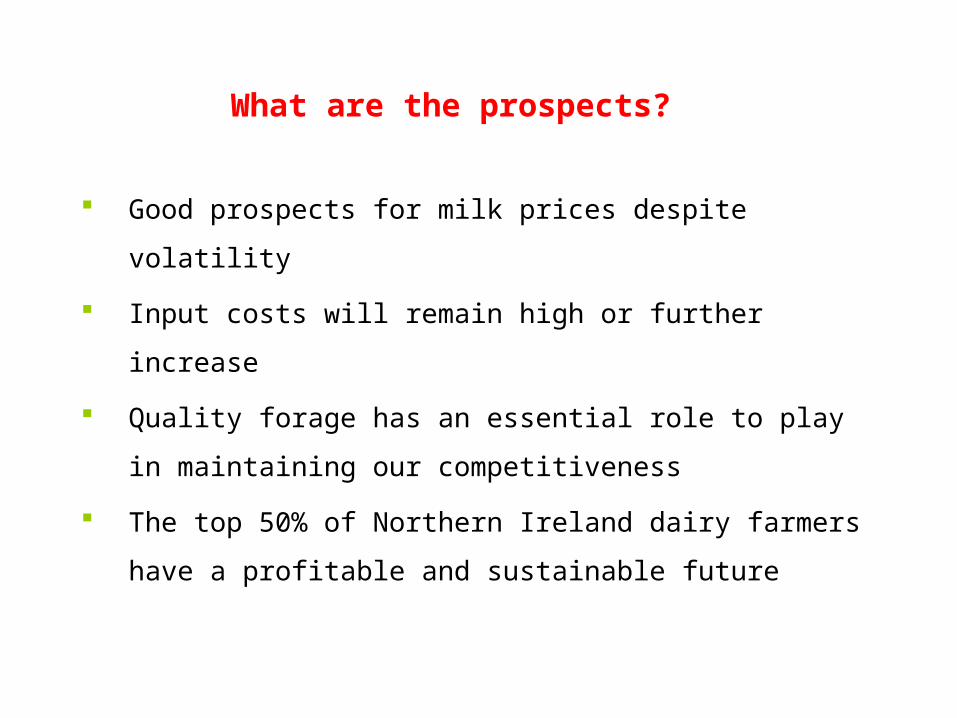
Good prospects for milk prices despite volatility
Input costs will remain high or further increase
Quality forage has an essential role to play in maintaining
our competitiveness
The top 50% of Northern Ireland dairy farmers have a
profitable and sustainable future
What are the prospects?
Benchmarking – what’s it all about?
Do you know what level of profit your business is making?
Do you know how each category of your costs compares to
other farmers in Northern Ireland?
Do you know what are realistic physical and financial
performance targets for your dairy system?
Benchmarking – “Measure to Manage”
Benchmarking- what’s it all about?