back to basics - · pdf fileback to basics: simplifying ... back in 1987, prime minister bob...
TRANSCRIPT
Back to Basics
Back toBasics
Simplifying Australia’s family payments system to tackle
child poverty
Australian Council of Social Service

First published in 2013 by the Australian Council of Social Service
Locked Bag 4777Strawberry Hills, NSW, 2012 Australia
Email: [email protected]: www.acoss.org.au
ISSN: 1326 7124ISBN: 978 0 85871 045 0
© Australian Council of Social Service
This publication is copyright. Apart from fair dealing for the purpose of private study, research, criticism, or review, as permitted under the Copyright Act, no part may be reproduced by any process without written permission. Enquiries should be addressed to the Publications Officer, Australian Council of Social Service. Copies are available from the address above.
Who we are
ACOSS is the peak body of the community services and welfare sector and the national voice for the needs of people affected by poverty and inequality.
Our vision is for a fair, inclusive and sustainable Australia where all individuals and communities can participate in and benefit from social and economic life.
What we do
ACOSS leads and supports initiatives within the community services and welfare sector and acts as an independent non-party political voice.
By drawing on the direct experiences of people affected by poverty and inequality and the expertise of its diverse member base, ACOSS develops and promotes socially and economically responsible public policy and action by government, community and business.
Acknowledgement
This report draws on modelling undertaken for ACOSS by the National Centre for Social and Economic Modelling (NATSEM). All care has been taken by ACOSS to accurately reflect the results of the modelling in this report. A detailed report of the modelling has been prepared by NATSEM : Phillips, B (2013) Modelling of ACOSS FTB options: Summary of methods and results. NATSEM, March 2013.
The Report was prepared by Adam Farrar, former ACOSS Senior Policy Officer and Peter Davidson, ACOSS Senior Adviser with assistance from ACOSS policy advisers. Editing and layout by Penny Dorsch, Publications and Information Officer.

Back to Basics: Simplifying Australia’s family payments system to reduce child poverty
Back to Basics
Contents
Foreword 1
Executive summary 3
1. Introduction 8
Child poverty is increasing in Australia 8
2. Our family payment system needs reform 9
2.1 The once good family payments system is failing to meet its objectives 11
2.2 What has gone wrong? 11
3. The ACOSS proposals 15
3.1 Restructure family payments to target families at risk of poverty and simplify the family payments system 15
3.2 Changes to rates of payment and income tests 17
3.3 The cost of the proposed restructure 17
3.4 Benchmarking FTB rates to the Couple Pension Rate 18
4. What difference will the reforms make to families? 20
4.1 Redirecting payments to those who need them most 21
4.2 What will it mean for illustrative low income families? 26
Tables
Table 1: Structure of the family payments system (June 2013) 10
Table 2: Payment rates and income tests (in 2014 - 15) 17
Table 3: Anti-poverty benchmarks for fortnightly Family Tax Benefits (Part A) 19
Table 4: Payment increases and reductions by family type and income quintile 25
Table 5: Results of cameo modelling: disposable incomes compared to poverty lines before and after proposed reforms 27

4
Charts
Chart 1: The growing gap between family payments and adequacy benchmarks for the costs of children 12
Chart 2: % of family type per household income quintile 21
Chart 3: Overall redistribution of payments by household income quintile 22
Chart 4: Redistribution of payments by % of all families per income quintile 22
Chart 5: Redistribution of payments to single parents by income quintiles 23
Chart 6: Single parent payments redistribution by % of income quintile 23
Chart 7: Redistribution of payments to couple families by income quintile 24
Chart 8: Redistribution to couple families by % if quintile 25
Abbreviations
ACOSS Australian Council of Social Service
CPI Consumer Price Index
FTB Family Tax Benefit
HILDA Household, Income and Labour Dynamics in Australia Survey
MTAWE Male Total Average Weekly Earnings
NATSEM National Centre for Social and Economic Modelling
STINMOD Static Incomes Module

Back to Basics: Simplifying Australia’s family payments system to reduce child poverty
Back to Basics
ForewordFor many of us, living in Australia is a great privilege. Twenty years of strong economic growth has seen the majority of us enjoying living standards better than ever before. On some measures, we are the wealthiest country in the world. For most of us, we do not have a ‘cost of living’ problem.
It is extraordinary therefore that the rate of poverty in Australia is growing, and this is particularly the case among our children. One in six children are living below the poverty line. That is 575,000 children.
How can it be that anyone in Australia should be living without being able to afford food, or housing, or going to a dentist, or even small treats like a meal out, or learning to play sport? And how can we not care about this?
Every child deserves the best.
The impacts of growing up without enough can be life lasting. As one teenage girl said:
I think that it’s pretty easy [for my family to meet school costs], ‘cos I don’t pick very expensive subjects, plus I don’t go on camps1
It is easy for us to just blame the families affected, and to think that there is nothing we can do. As we show in this paper, there is much we can do. We need to start by valuing the great spirit of human resilience demonstrated by the many families and children affected. The mums who take their children to the pool every morning to give them a hot shower before school. The dads who do the rounds picking up second hand goods. The children who learn to cope, to not ask for more, because they know there is not more.
Importantly, we need to also recognise that policy changes over the last decade in particular are a major reason for the growth in poverty among our children and urgent action is required.
Our family payments system has been recognised globally as an important means for protecting our children from poverty, and treating low and middle income families with children fairly by taking account of the costs of raising children.
Our family payments system is not ‘middle class welfare’. However, it is now in urgent need of repair.
Back in 1987, Prime Minister Bob Hawke famously declared ‘We set ourselves this first goal - by 1990 no Australian child will be living in poverty’.’. His hope and vision was much maligned and misunderstood. Yet, his efforts made a big difference at the time.
Mr Hawke’s anti-child poverty reforms set benchmarks for the costs of children and raised family payments for low income families to those levels, reducing child poverty by over30%. Importantly, family payments for low income families were indexed to wage movements.
In the 1990s the system was simplified so that families both in and out of paid work received a single fortnightly payment to the main carer (usually the mother).
1 Jennifer Skattebol, Peter Saunders, Gerry Redmond, Megan Bedford and Bettina Cass (2012) Making a Difference: Building on Young People’s Experiences of Economic Adversity. Social Policy Research Centre, University of New South Wales

2
However, in recent years, the family payment system has been allowed to decline and to moved away from these goals.
In 2009, indexation of family payments for low income families to wage movements was removed. This was done to save money. The change almost guarantees that child poverty will increase over time.
The system has also become more complex, with the introduction of ‘bonus’ payments and add-ons that are poorly conceived and targeted, such as the Baby Bonus, the Schoolkids Bonus, and the ‘Part B’ payment for single income couples.
ACOSS proposes a restructure of family payments to bring the system ‘back to basics’. This would involve:
• restoring proper indexation
• increasing the payment to assist sole parents (who are particularly vulnerable to poverty) with the extra costs of raising a child alone
• redirecting the funding of the two ‘bonuses’ (The Baby Bonus and the Schoolkids Bonus) to increase the main family payment for low and middle income families, and
• better targeting the ‘Part B’ payment for couples caring for a child ‘at home’ to families with younger children.
Savings from removing the two bonuses should not be used to restore the budget bottom line: they should be used to restore the budget bottom line of low and middle income families.
The last 20 years show that we cannot rely solely on economic growth to ensure that no child will live in poverty. We need concrete policies, monitoring and reporting on our progress to deliver greater equality and fairness for all.
That is why ACOSS is calling for the next Federal Government to adopt a National Development Goal: The Reduction of Poverty in Australia, and to set concrete targets for progress, reporting against those targets annually to the Australian Parliament.
We are also calling for a concrete Anti-Poverty Strategy which includes reform of our family payments system.
The modelling of our proposals by NATSEM show that child poverty would be reduced.
Overall, the incomes of 1,175,000 families (25% of all families) would rise by an average of $1,203 a year while the incomes of 606,000 families (13%), mostly on higher incomes, would fall by an average of $2,316.
In these times of significant economic challenge, and falling revenues, we need to go ‘Back to Basics’, with government assistance targeted to those who need it. Our proposals do not complete reform, but they take us in the right direction.
Remember, no child should live in poverty. Every child deserves the best.
Cassandra Goldie
Chief Executive Officer, ACOSS

Back to Basics: Simplifying Australia’s family payments system to reduce child poverty
Back to Basics
Executive summary
Child poverty is increasing in Australia
Child poverty is a measure of a country’s fairness and an indication of how well the next generation will fare. But today one in six children (575,000) are living in poverty, in one of the wealthiest countries in the world. The recent annual report of the longitudinal study of households (HILDA) showed that child poverty in lone parent families has increased by 15% since 2001.
Our once good family payments system is failing to meet its objectives
Our family payments system performs two vital social and economic roles – helping prevent child poverty (vertical equity) and treating low and middle income families with children fairly by taking account of the costs of raising children in the tax-transfer system (horizontal equity). Viewed from this perspective, family payments are not ‘middle class welfare’. It is fairer and more convenient to parents to provide tax relief for families through a direct fortnightly payment that goes to the primary carer (usually the mother).
In the 1980s Australia led the world in implementing measures to guard against child poverty, reducing it by over 30% thanks to the family payments system put in place at that time. In the 1990s the system was simplified to concentrate support for the direct costs of children in a single fortnightly payment to the primary carer rather than dividing it between income support for families out of paid work and tax rebates for those with jobs, as in many other countries.
But in recent years, the family payment system has strayed from its primary goals and has increasingly been used for purposes that are not well conceived, such as the Baby Bonus, the Schoolkids Bonus, and the ‘Part B’ payment for single income couples. It is time to simplify what has become a ramshackle and complex system and bring it ‘back to basics’. Even more important, since 2009 its value is being eroded by a lack of proper indexation so that, over time, child poverty will increase.
What has gone wrong?
The role of family payments in reducing poverty was embedded in the decision by the Hawke Government in the late 1980s to benchmark family payments for those on low incomes to the married rate of pension, and therefore to movements in wage rates. This was the centrepiece of that Government’s child poverty strategy. But in 2009 that link was removed, so that payments will steadily fall behind community living standards. The inevitable result is that child poverty will increase.
In 2000, the ‘Part B’ payment was introduced, purportedly to enable one parent (usually the mother) within a married couple family to care for a young child fulltime ‘at home’. But it extends to the primary carers of children up to 18 years old even though there is no need for such full time care at that age. The Part B payment for couples has a similar effect to ‘income splitting’ within the tax system. Since it is strictly income tested on the personal income of the ‘second income earner’ (usually the mother) it discourages workforce participation among women.

4
Sole parent families also receive the Part B payment but for them its purpose is completely different. It replaced a previous payment that compensated sole parent families for the higher costs of raising a child alone. That purpose has now been confused with assisting parents to care for young children at home. So the payment drops by $22 per week once the youngest child reaches 5 years, yet the extra costs of raising a child alone actually rise as the child grows older.
In 2006 a Baby Bonus was added to Family Tax Benefits. Its purpose was never clear. The then Government argued it was to help families with the costs of equipment for a new baby and to replace some of the income foregone by the mother. Yet those costs are not identical, and since paid parental leave was introduced the Baby Bonus has lacked a clear purpose. Help with equipment costs is best absorbed into the general Family Tax Benefit. In 2012 the Government decided to abolish the Baby Bonus and replace it with a smaller family payment (down from $5,000 to $2,000 for the first child) to save $300 million in 2014-15.
In 2011 an annual Education Tax Refund established to assist parents with school costs was replaced by the Schoolkids Bonus attached to the Family Tax Benefits system. It was never clear why a separate payment was needed to assist with those costs, which should be taken into account in the general Family Tax Benefit payment. In its previous Budget the Government had already increased Family Tax Benefit for teenage children (aged 16 years and over) to take better account of the higher costs of children as they grow older. The Schoolkids Bonus is poorly targeted. Unlike the Family Tax Benefit (Part A) payment, which is income tested to take account of different family needs, the Schoolkids Bonus is paid at the same rate to families with incomes up to around $120,000.
Some commentators argue that family payments are ‘wasteful middle class welfare’. They suggest that payments such as the Baby Bonus, Schoolkids Bonus, and Part B payment should be abolished in order to save Governments money. We agree that those parts of the family payment system are poorly designed and targeted, but believe that any savings from reforming them should be devoted to improving the family payment system for poor and low income families as well as middle income families. The Baby Bonus should have been fully replaced by an increase in Family Tax Benefits for low income families with younger children, and the Schoolkids Bonus should now be replaced by higher payments for older children. The Part B payment should also be reformed to target it better to those who need it most.
Our proposals are based on the current situation before the Baby Bonus changes come into effect.
The ACOSS proposals
ACOSS is proposing a package of reforms to:
• reduce child poverty;
• keep pace with overall living standards through adequate indexation;
• improve support with the extra costs of raising a child alone – particularly for sole parent families with school age children, many of who have been affected by recent cuts to their income support payments;
• replace outdated supports for one parent in a married couple to care for high school age children at home with increases in other family payments;

Back to Basics: Simplifying Australia’s family payments system to reduce child poverty
Back to Basics
• simplify the system by replacing poorly conceived ‘bonus’ payments (Baby Bonus and Schoolkids Bonus) with increases in family payments generally.
Given the budget environment, we propose that, apart from the improved indexation, this rationalisation of family payments would be revenue neutral. On the other hand, since family payments are still inadequate for many low income families, ACOSS opposes reductions to family payments that are used to achieve budget savings instead of improving the system.
The proposed package has four elements:
1. Replace the Baby Bonus and the Schoolkids Bonus with increases in the maximum rate of Family Tax Benefit A for preschool and school age children respectively. Current expenditure on the Baby Bonus would go to increase the maximum rate of FTB A for parents of children aged between 0 – 4; and spending on the Schoolkids Bonus would go to increase the maximum rate of FTB A for school age children.
2. Replace FTB Part B for sole parents with a Sole Parent Supplement (at a higher rate for parents of older children than the current FTB B) to reflect the higher costs and demands of caring for children as a sole parent.
3. Limit FTB Part B for couples with one parent at home caring for children until the youngest child turns 13, and tighten the income test on the primary earner (usually the father) to target this payment to families in greatest need.
4. Index family payments to movements in average earnings as well as the Consumer Price Index (CPI)2.
The first three elements of the package are designed to be revenue neutral in 2014-15 relative to the policy environment in 2012-13. However, the changed indexation means that the overall cost of the package over the forward estimates to 2017-18 is $1.3 billion3. Note that this is modelled on the existing payment structure, without the $300 million cut to the Baby Bonus announced in last year’s Budget. This restores a system of indexation to payments for families in poverty that should not have been removed in the first place.
What this means for families
NATSEM has modelled for us the effects of the first three changes on the Budget and on different families in 2014-15, using its STINMOD program.
Overall, 1,175,000 families (25% of all families with children) would see their incomes increase by an average of $1,2034 a year. However, since these changes are revenue neutral, to pay for any improvements some families must receive lower payments. They are intended to produce a better targeted family payments system.
The proposed reforms are more progressive.
2 The exception to this is Family Tax Benefit Part A payments for preschool age children, which would be indexed to the CPI only until they are equal to the same payment for primary school age children. Otherwise the proposed reforms would permanently raise payments for pre-schoolers to more than those for primary school age children, even though the direct costs of a child generally increase with age.
3 In 2014-15 dollars.
4 All payments are in 2014-15 dollars.

6
Almost twice as many families would be better off than those whose payments would be reduced. 606,000 families (13% of all families) would lose an average of $2,316 a year. The disposable incomes of 2,858,000 families (62%) would be unchanged5.
This is despite the fact that for 3% of families with newborn children the redistribution of the Baby Bonus effectively means an immediate loss of $5,000 which is redistributed over the next four years of the child’s life6.
595,000 families with incomes in the bottom two quintiles (the bottom 40% of families) would be better off, while only 162,000 families in these quintiles will be worse off (see chart below). More than half the families in those quintiles would receive increased payments, while only 14% would see their payments decrease.
Sole parent families would particularly benefit.
Recent Budget cuts are reducing the weekly incomes of almost 100,000 sole parent families by around $3,000 per year (if they have no private income) and up to twice that amount if they have part time earnings7. Our proposed package would increase the incomes of almost 80% of sole parent families (470,000 families) by an average of $1,472 a year. Together with our proposed $50 a week increase in the single rate of Newstart Allowance this would more than offset the Government’s payment cuts in most cases.
Only 12% of sole parents would have reduced payments. Again, sole parent families in the bottom household income quintile overwhelmingly benefit. Payments increase for 93% of such families and decrease for only 3%.
5 Most often because they are not eligible for Family Tax Benefit.
6 The Government has already cut this payment in last year’s Budget though this has not yet been implemented so it was not modelled for us by NATSEM. Therefore, many families would be better off than indicated in this report if our package was implemented, though its cost to Government would be greater.
7 ACOSS 2012, ‘Sole parents won’t be helped to find employment by cutting their payments’, ACOSS Paper 190.

Back to Basics: Simplifying Australia’s family payments system to reduce child poverty
Back to Basics
More couples with children also benefit from the proposed reform than would receive reduced payments – although not to the same extent as single parents, who are at greater risk of poverty. 27% of couple families would be better off, 21% would have payments reduced, and 52% would be unchanged8. But the proposed changes are better targeted. For example, payments for one parent in a couple to care for a child fulltime ‘at home’ would no longer extend to children of high school age.
76% of couples with children whose incomes are in the bottom quintile of household income would receive increased payments and 71% of those with incomes in the second lowest quintile would receive an increase. Only 16% and 25% of couple families respectively in these two quintiles would have their payments reduced.
What will it mean for particular low income households and poverty?
As well as looking at the average effect on families, NATSEM modelled the impact on 32 illustrative low income families, or cameos. Of these cameo families, one-quarter were in poverty under the current arrangements. None of the cameo families with modest employment income had disposable incomes below the poverty line for that household type; but half the cameo families depending solely on income support were in poverty. This includes all of those receiving the lower Newstart Allowance rather than a pension payment. This illustrates the inadequacy of social security payments, including payments for adults as well as family payments, and underscores the need for increases in the lowest Allowance payments as advocated by ACOSS9.
The proposed changes would lift two of the 16 cameo sole parent families out of poverty, leaving none in poverty. For the 16 couple family cameos, the effects are mixed. One of the six cameo couple families that were in poverty under the current arrangements would be lifted out of poverty, while the other five would remain under the poverty line. Broadly speaking, the incomes of low income couple families with children under 5 would rise significantly. For those with children between 5 and 12, the changes largely balance out, but the rises are not enough to lift them out of poverty. For couples with children 13 or over, the loss of FTB Part B outweighs the other gains, though the numbers involved are small10.
8 A substantial proportion of those that are unchanged are not eligible for FTB
9 ACOSS 2012, Submission to Senate Inquiry into the adequacy of Newstart and other Allowance payments.
10 Modelling suggests that these cameos represent approximately 1,500 families or 0.07% of all couple families with children and 2.3% of couple families in the lowest income quintile..

8
1. Introduction
Child poverty is increasing in Australia
Child poverty is a measure of a country’s fairness and an indication of how well the next generation will fare. But today child poverty is once again the face of poverty in Australia.
Recent research commissioned by ACOSS11 estimates that in 2010 one in six children (17.3%) was living below the austere poverty line used by the OECD (50% of median household disposable income). 575,000 children are living in poverty in one of the wealthiest countries in the world. If we take the somewhat more generous measure sometimes used of 60% of median household income, the number of children in poverty rises to 869,000 which is more than a quarter of all children.
Today we have a child poverty rate above the OECD average12. This year the Melbourne Institute of Applied Economic and Social Research longitudinal study of households (HILDA) showed that child poverty in sole parent families increased by 15% since 200113.
Sole parent families face a much higher risk of poverty than partnered families. Of the 575,000 children below the poverty line, half (286,000 children) were in sole parent families. Among other factors, this reflects the weaker economies of scale for the household budgets of sole parent families, and their greater difficulty combining care for children with paid employment. It highlights the need to ensure that the higher costs of caring for a child alone and the challenges of gaining employment are properly reflected in policy.
11 ACOSS (2012) ‘Poverty in Australia’
12 OECD (2012) ‘Child poverty’ Organisation for Economic Cooperation and Development, France
13 Melbourne Institute of Applied Economic and Social Research (2013) Families, Incomes and Jobs, Volume 8: A Statistical Report on Waves 1 to 10 of the Household, Income and Labour Dynamics in Australia (HILDA) Survey

Back to Basics: Simplifying Australia’s family payments system to reduce child poverty
Back to Basics
2. Our family payment system needs reform
Our family payment system performs two vital social and economic roles – helping prevent child poverty (vertical equity) and treating low and middle income families with children fairly by taking account of the costs of raising children in the tax-transfer system (horizontal equity)14. It is fairer and more convenient to parents to provide tax relief for families through a direct fortnightly payment that goes to the primary carer (usually the mother).
14 It is fairer and simpler to compensate low and middle income families for the direct costs of children through the social security system than through tax rebates and deductions, which are complex, and which exclude those who are too poor to pay income tax. This also reflects the preferences of the vast majority of primary cares, who are predominantly mothers. Therefore, we do not regard Family Tax Benefit payments for middle income families as an undesirable form of ‘middle class welfare’.. Viewed from this perspective, family payments are not ‘middle class welfare’.
“My food budget has disappearedMy son’s health is affectedCheap food, Carbohydrates,You get fat.No vegetables in nearly 3 weeks”
Louise, “What body Part do I need to sell?, Jobs Australia, pg15
10
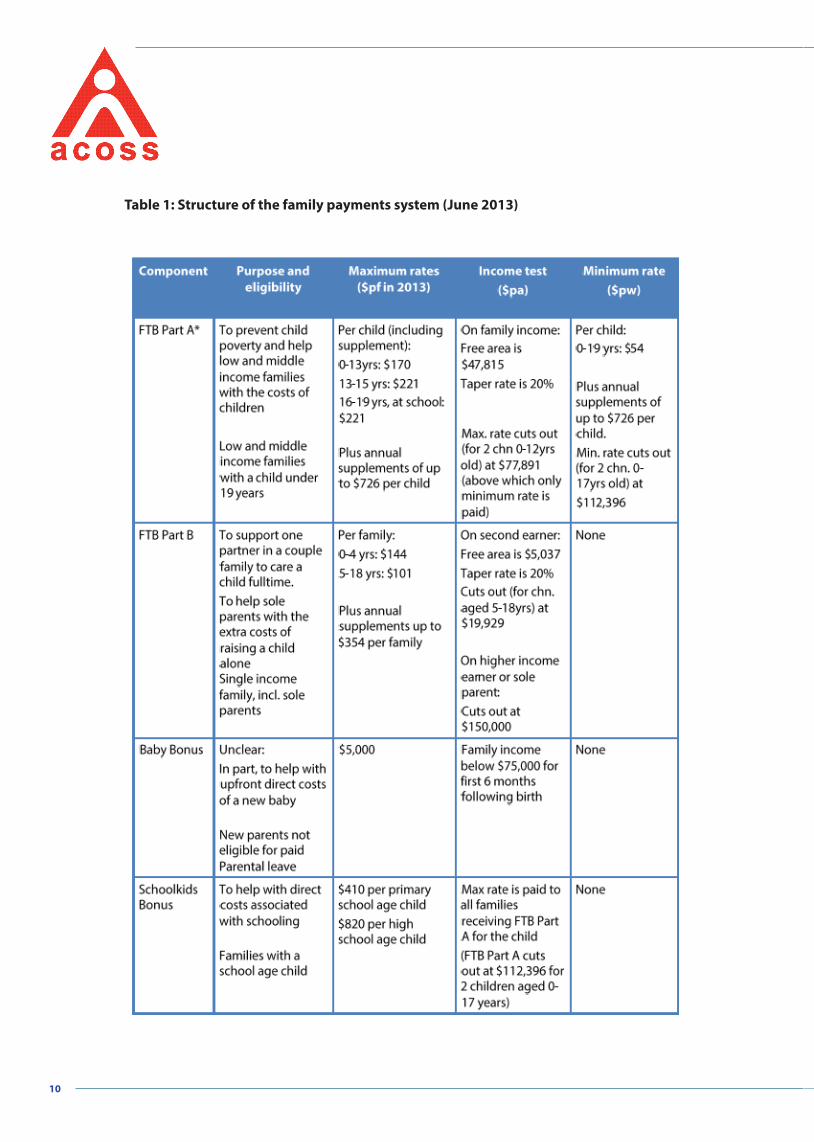
Table 1: Structure of the family payments system (June 2013)

Back to Basics: Simplifying Australia’s family payments system to reduce child poverty
Back to Basics
2.1 Our once strong family payments system is failing to meet its objectives
Our family payment system is in urgent need of reform, to ensure that it can continue to discharge the important functions described above.
In the 1980s Australia led the world in implementing measures to reduce child poverty. The centrepiece of those efforts was the introduction of a new income tested Family Allowance Supplement. At that time family payments were low by OECD standards – too low to protect low income families from poverty. Those reforms were particularly successful – they reduced child poverty by over 30%15. Thanks to the family payments system put in place at that time, Australia was one of the most successful countries in the world in reducing child poverty.
In the 1990s the family payments system was simplified to concentrate support for the direct costs of children in a single fortnightly payment to the primary carer (usually the mother), rather than dividing it between income support for families out of paid work and tax rebates for those with jobs, as in many other countries. The maximum rate of payment was still targeted to low income families to prevent child poverty. There was also a lower ‘minimum’ rate of payment to acknowledge the costs of children in middle income families. Income tests were progressively eased so as to improve work incentives, especially for mothers.
Since then the family payment system has strayed from its primary purpose of preventing child poverty and assisting middle income families with the costs of children in the simplest possible way. It has increasingly been used for purposes that are not clearly articulated or well targeted, such as the Baby Bonus and Schoolkids Bonus. It is time to simplify what has become a ramshackle and complex system and bring it ‘back to basics’.
Even more important, in recent years the value of the main family payment (Family Tax Benefit Part A) has been eroded by inadequate indexation so that, over time, in the absence of further reform child poverty will increase.
2.2 What has gone wrong?
Failure to maintain the benchmarks of the additional cost of children
Our family payment system was the basis of the Hawke Government’s much maligned, poorly understood but very important commitment to eliminate child poverty. In 1988, for the first time, the cost of raising a child relative to the costs of an adult was carefully evaluated and proper relativities were set between child and adult payments within the social security system. Expert estimates at the time indicated that the resulting increases in family payments reduced child poverty by over one-third16.
The role of family payments in reducing poverty was embedded in legislation to benchmark family payments for those on low incomes to set percentages of the married rate of pension, and therefore to movements in wage rates (16.6% of the couple pension rate for each child under 13 year and 21.6% for each child 13-15 years). This followed many years in which pensions were indexed to both wages and inflation but family payments were left to fall behind. These
15 Brownlee & King (1989), ‘The estimated impact of the family package on child poverty’, in Edgar et al (1989), ‘Child poverty’, Australian Institute of Family Studies, Melbourne.
16 Brownlee & King (1989), ibid.
12
‘anti-poverty benchmarks’ were maintained throughout the period of the Howard Government, suggesting a bipartisan commitment to stem child poverty.
However, the crucial role of family payments in shielding children from poverty was undermined when the Government decided in 2009 to remove the link between maximum rates of Family Tax Benefit Part A and pension rates. Ironically, this may have been done to help pay for the decision in the same year to substantially increase pensions, as it yielded Budget savings that rose to almost $500 million in 2012-13.
In the absence of ad hoc increases (such as the increase in the 2012 Budget of $300 per year to maximum Family Tax Benefit Part A payments), this means that family payments for low income families are frozen in real terms, and that they will progressively fall behind community living standards. The almost inevitable result is that child poverty, as it is normally measured, will increase over time. This problem is similar to that experienced by people receiving Newstart Allowance, which has been frozen in real terms since 1994.
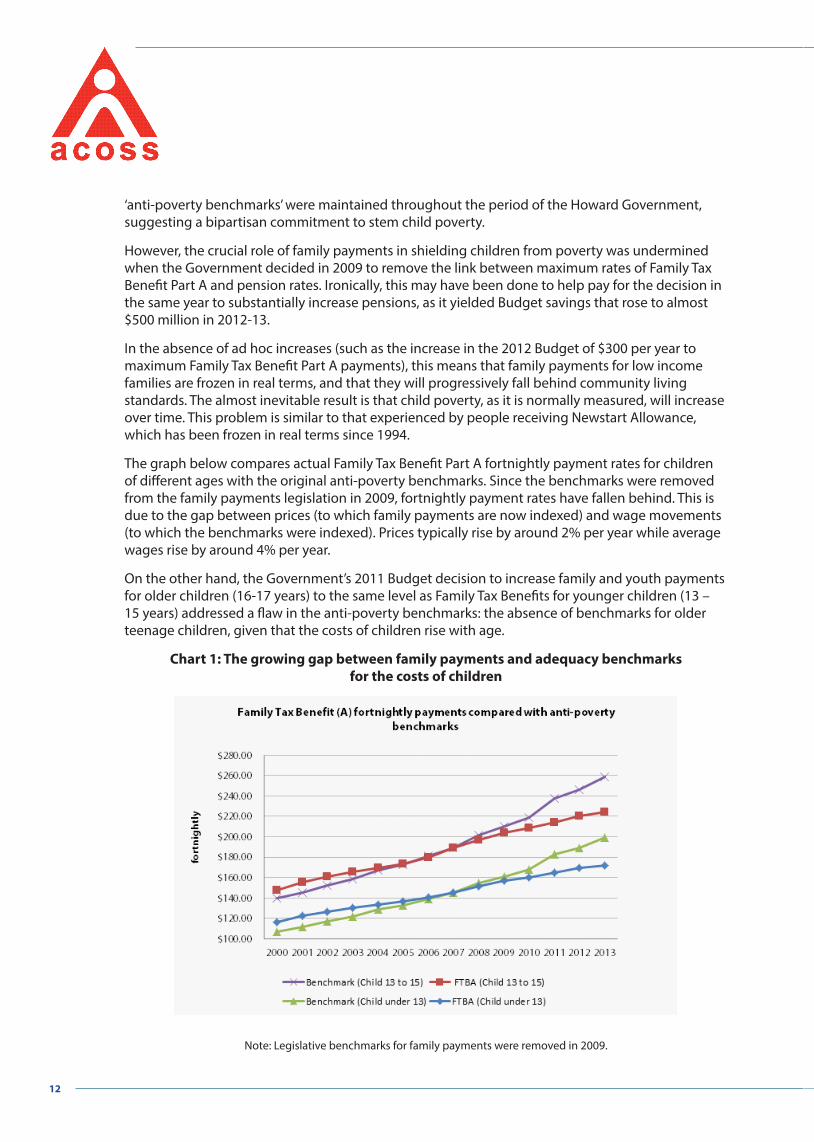
The graph below compares actual Family Tax Benefit Part A fortnightly payment rates for children of different ages with the original anti-poverty benchmarks. Since the benchmarks were removed from the family payments legislation in 2009, fortnightly payment rates have fallen behind. This is due to the gap between prices (to which family payments are now indexed) and wage movements (to which the benchmarks were indexed). Prices typically rise by around 2% per year while average wages rise by around 4% per year.
On the other hand, the Government’s 2011 Budget decision to increase family and youth payments for older children (16-17 years) to the same level as Family Tax Benefits for younger children (13 – 15 years) addressed a flaw in the anti-poverty benchmarks: the absence of benchmarks for older teenage children, given that the costs of children rise with age.
Chart 1: The growing gap between family payments and adequacy benchmarks for the costs of children
Note: Legislative benchmarks for family payments were removed in 2009.
Back to Basics: Simplifying Australia’s family payments system to reduce child poverty
Back to Basics
Family Tax Benefit Part B fails to reflect the costs of raising children alone for sole parents
Another shield against child poverty within sole parent families is the Family Tax Benefit Part B payment. For sole parent families, this replaced a previous payment called ‘Guardian Allowance’, which aimed to compensate sole parent families for the higher costs of raising a child alone, so that they could attain a similar living standard to couples with children on income support. For example, sole parent families lack the economies of scale available to couples with children and sole parents are also time-poor. Early research suggested that a sole parent family with one child needed around 90% of the income of a married couple without children in order to attain the same living standard17
This purpose is quite different to that of the ‘Part B’ payment for couples, which was intended to assist parents to care for their children ‘at home’. The main problem with Family Tax Benefit B for sole parents is that, because its purpose was confused with assisting parents to care for young children at home, the rate of payment drops by $22 per week once the youngest child reaches 5 years. Yet the extra costs of raising a child alone are likely to increase as the child grows older.
In addition, the risk of poverty among sole parent families with older children has been seriously increased by the Welfare to Work legislation of 2006, and last year’s Federal Budget decision to move all remaining sole parents whose youngest child has turned eight from the higher Parenting Payment to the lower Newstart Allowance, resulting in a typical loss of income for the poorest sole parent families of $60 per week18.
Part B for couple families is poorly targeted
The ‘Part B’ payment for couples is poorly designed. While its stated policy goal is to enable one parent (usually the mother) to care for a young child fulltime ‘at home’, it extends to the primary carers of children up to 18 years old. Such support for fulltime care at home might be justified when children are below school age, but it is hard to justify for secondary school students. This also contradicts recent policies (described above) to restrict the Parenting Payment for low income parents to those with a child under 8 years of age (in sole parent families) or 6 years in married couple families.
In order to target the Part B payment to couples where one partner is a fulltime carer, it is strictly income tested on the income of the ‘second earner’ (usually the mother). Once her earnings exceed $5,037 a year, the payment is reduced by 20 cents per extra dollar earned. The problem with this kind of targeting is that it discourages mothers from increasing their paid working hours. It has a similar effect on work incentives to ‘income splitting’ within the tax system.
‘Bonuses’ confuse the purpose of family payments – Baby Bonus and Schoolkids Bonus
Other poorly designed additions to family payments in recent years include the Baby Bonus and Schoolkids Bonus. The purpose of these payments has not been clearly articulated.
Although, on the surface, the Baby Bonus was supposed to assist with up front capital costs associated with a new baby, its main purpose appears to be to ‘compensate’ parents who are not employed for their lack of access to paid parental leave. It is paid for first three months to parents of a new child not eligible for paid parental leave. This confuses the purpose of family payments with
17 Whiteford (1998), The costs of sole parenthood’ Social Policy Research Centre Reports and Proceedings, Sydney.
18 The impact of this change is illustrated in the discussion of our modelling of family ‘cameos’ in section 3.4.2 below

14
that of parental leave, which is different and distinct. Providing the same level of financial support to ‘at home’ carers and those with paid jobs is false equity since their needs are different.
The purpose of the Schoolkids Bonus, which replaced the School Tax Refund, is also unclear. If low and middle income families are struggling with increased child related costs, the simplest way for government to help is to increase the maximum rate of Family Tax Benefit Part A and index it properly. Parents could then decide whether to allocate their family payments to school costs or other more pressing needs.
In addition, because the payment is not available for dependent children who are no longer at school, it acts as a ‘penalty’ (an $83 a week payment reduction) for 16 to 17 year old children not enrolled at school. The use of reduced family payments in this way is harsh and counterproductive. It detracts from the purpose of family payments to ease poverty among children and has no proven positive impact on school attendance.
Of course these ‘bonus’ payments provide much needed assistance to many families, so to simply abolish them without increasing other family payments would erode family living standards (especially given the lack of proper indexation of the main family payment). So we propose that savings from removing these ‘bonuses’ be redirected to increases in maximum rates of the main ‘Part A’ Family Tax Benefit. ACOSS opposes moves to abolish the Baby Bonus or Schoolkids Bonus to restore the budget bottom line: the savings should instead be used to improve the budget bottom line of low and middle income families.
Baby bonus changes in 2013
The pattern of ad hoc changes continued in the recent 2013-14 Federal Budget. In that Budget the Baby Bonus was effectively abolished. However, rather than redirect the savings to strengthen the Family Tax Benefit for families with very young children, only part of the savings were returned to families.
The Baby Bonus will be replaced by increasing Family Tax Benefit Part A (FTB A) payments by $2,000 for a first child and $1,000 for subsequent children. It will be paid over seven fortnightly instalments. The new arrangements will replace the Baby Bonus from 1 March 2014 and will save the Government $266 million in the first full year and $300 million by 2015-16.
While the replacement of the Baby Bonus by an FTB Part A payment improves the Family Tax Benefit system, the change further erodes the adequacy of family payments and retains a payment related to the birth of a child, rather than better targeting these resources by increasing the maximum FTB A rate of families with younger children.
The ACOSS proposal for reform that follows has been based on the current payment arrangements and does not take account of the above savings that will come into effect after March 2014.

Back to Basics: Simplifying Australia’s family payments system to reduce child poverty
Back to Basics
3. The ACOSS proposals
3.1 Restructure family payments to target families at risk of poverty and simplify the family payments system
Because of our growing concerns that without changes the family payment system child poverty will increase, and that family payments are too complex and poorly targeted, ACOSS has proposed an integrated package of reforms.
Their purpose is to restore the integrity and effectiveness of the system - to simplify family payments and focus them more clearly on the purposes of preventing child poverty and helping parents with the direct costs of children. All the existing expenditure associated with family payments, including the Baby Bonus and Schoolkids Bonus, would be consolidated in a package that is revenue neutral in 2014-15. The changed indexation arrangements would mean that the overall cost of the package over the forward estimates to 2017-18 is $1.3 billion19. Note that this is modelled on the existing payment structure, without the $300 million cut to the Baby Bonus announced in last year’s Budget. This restores a system of indexation to payments for families in poverty that should not have been removed in the first place.
These proposals have been modelled for ACOSS by NATSEM and the results of the modelling are included in the following section. They are based on the status quo, projected forward. That is, they do not take account of the decision to abolish the Baby Bonus in the 2013-14 Budget and redirect only part of the funds into FTB Part A. If this Budget saving is reversed, as we propose, there is a net cost to the Budget in 2014-15 of $300 million.
3.1.1 The proposed reforms
Aims
The package of reforms has a number of aims, to:
• reduce child poverty;
• keep pace with overall living standards through adequate indexation;
19 In 2014-15 dollars.
“What am I going to do about money?I see my mum who worked all her life But she has no money. So Yeah,It’s pretty badWhen you work all your life and your only income is the pension.”
Alicia, What body Part do I need to sell?, Jobs Australia pg23

16
• improve support with the extra costs of raising a child alone – particularly for sole parent families with school age children, many of who have been affected by recent cuts to their income support payments;
• replace outdated supports for one parent in a married couple to care for high school age children at home with increases in other family payments;
• simplify the system by replacing poorly conceived ‘bonus’ payments (Baby Bonus and Schoolkids Bonus) with increases in family payments generally.
Changes to improve the design of Family Tax Benefit
To achieve this ACOSS proposes four changes:
1. Redirect current expenditures on the Baby Bonus to increase the maximum rate of FTB Part A for parents of children aged between 0 – 4. In effect, this spreads expenditure on the Baby Bonus across the first five years, and targets it more consistently to low income families
2. Redirect current expenditures on the Schoolkids Bonus to increase the maximum rate of FTB Part A for school age children in two ways:
• Reflect the progressively higher costs of older children by increasing the maximum rate for 13 to 15 year olds by 50% more than the increase for primary school aged children (5 to 12 year olds), and 100% more for 16 to 17 year olds; and
• Extended the new rates for 16 – 17 year olds to those not at school, recognising that the cost of supporting such children are not different (and that the purpose of the family payments system is to reduce child poverty rather than provide other social incentives)20
3. Change FTB Part B to make its purpose more coherent and to target it more effectively to poorer families:
• For sole parents, convert FTB Part B into a new Sole Parent Supplement (at the same rate for parents of school age children as the current rate for parents with a preschool age child) to reflect the higher costs and demands of caring for children as a sole parent.
• For couples with children, limit eligibility for those whose youngest child is less than 13 years old, by which time there is no longer a case for supporting a parent to care for the child fulltime at home.
• The tighter targeting is achieved by lowering the ‘free area’ of the income test on the income of the primary income earner so that entitlement to the Part B payment ends before the base rate of FTB Part A begins to decrease21.
4. Index Family Tax Benefit payments to average earnings as well as the CPI.
These changes would be implemented from July 2014.
20 Children aged 18 to 19 years who are still undertaking secondary study would receive an increase in Youth Allowance instead.
21 The Part B payment currently ends once the primary earner’s income exceeds $150,000. After the change it would end once the family income exceeds $94,316 (in 2013 dollars). As well as better targeting the Part B payment to low and middle income families, this change avoids any overlap between the income tests for the Part B payment and that for the base rate of the Part A payment. Otherwise, some parents would lose 50 cents per extra dollar earned.

Back to Basics: Simplifying Australia’s family payments system to reduce child poverty
Back to Basics
3.2 Changes to rates of payment and income tests
The following table compares payments rates in the current system (projected to 2014-15) and those proposed in the ACOSS package.
Table 2: Payment rates and income tests (in 2014-15)
* Excluding FTB A supplement ($740.95 p.a. in 2014 - 15 dollars) and Clean Energy payments
3.3 The cost of the proposed restructure
The proposed package has been constructed to be budget neutral in its first year, aside from improved indexation.
The reform package was developed in the following stages:
1. Abolish the Baby Bonus and the Schoolkids Bonus. This will save Government a total of $2.136 billion22. Note that this does not take account of the 2012 Budget decision to reduce the Baby Bonus, which results in savings of approx. $300 million in 2014-15. ($0.829 billion from the Baby Bonus and $1.307 from the Schoolkids Bonus).
- This would represent a saving across the forward estimates to 2015-16 of $8.852 billion.
22 In 2014-15 dollars.
18
2. Reallocate these savings to increase the maximum rate for FTB Part A – allocating the savings from abolishing the Baby Bonus to increase the rate for children aged under 5 (this in effect ‘spreads’ the payment over the first four years of the child’s life); and allocating the savings from abolishing the Schoolkids Bonus to families with children aged 5 to 18 years, but better reflecting the cost of older children.
- No net cost to Government23.
3. Tighten eligibility for FTB Part B for couples and target more tightly; and replace FTB Part B for sole parents with a new Sole Parent Supplement with an increase for those with children under 5 years.
- This yields a net saving of $279.91 million.
4. Reallocate these savings to further increase FTB Part A.
- No net cost to Government24.
However, the final crucial aspect of the package is to maintain the relative value of family payments and avoid increasing poverty, by indexing FTB Part A to movements in average weekly earnings (assumed to rise by 4 per cent per annum rather than 2.5 per cent for the CPI).
This would cost of $1.259 billion over the forward estimates to 2017-18.
3.4 Benchmarking FTB rates to the Couple Pension Rate
A key goal of the proposed reforms is to maintain the value of maximum FTB Part A payments for low income families relative to community living standards. This means that the payment should be indexed to movements in wages, in addition to the current indexation to the consumer price index. This could be done by restoring legislative benchmarks linking FTB Part A payments to the couple pension rate, since pensions are indexed to movements in Male Total Average Weekly Earnings.
While the specific mechanism to ensure payments are indexed to wages is less important, the following table shows the relativities between the maximum fortnightly rates of Family Tax Benefit Part A and the couple pension rate that applied before and after the removal of the anti-poverty benchmarks in 2009, compared with those that would result from maximum FTB Part A rates in the ACOSS proposals.
Once the maximum fortnightly rates of FTB Part A are increased, one way to ensure that they increase in line with wage movements is to legislate to restore a link between those payments and the pension couple rate, but at the higher levels indicated in the third column of the table below.
23 In effect, the $300 million saved by the Government through its cut to the Baby Bonus would be reallocated to increase Family Tax Benefits (Part A), at a net cost to the Budget of $300 million.
24 If this last step was not taken (so that FTB Part A is not further increased), the net cost of the above elements of the package would be close to zero, setting aside the effects of the Budget decision to save $300 million in 2014-15 by cutting the Baby Bonus..

Back to Basics: Simplifying Australia’s family payments system to reduce child poverty
Back to Basics
Table 3: Anti-poverty benchmarks for fortnightly Family Tax Benefits (Part A)
*Note that the relativity for payments for a preschool age child would initially be higher under the ACOSS proposal (19.2%), but we propose that that payment rate be indexed to the CPI only until the payment for 5-12 year olds ‘catches up’ with it, so that eventually the same maximum rate would apply to all children aged 0-12 years (benchmarked to 17.7% of the couple pension rate).
Ideally, research would be conducted to compare the costs of children of different ages with typical living costs for adults (for example, using a pensioner couple as the benchmark), and the benchmarks would be based on the findings. This is likely to result in higher maximum payments for older children25. However, that would be difficult to achieve in a revenue neutral reform. The ACOSS proposals should therefore be seen as a step towards this ideal system.
In the interim, one problem that would need to be resolved is that the proposed replacement of the Baby Bonus with higher FTB Part A payments for preschool age children would result in a higher payment for children aged 0-4 than that for children aged 5-12. While this helps cushion any income losses for families with newborn child from removal of the Baby Bonus, it would be simpler and fairer to maintain the same rate of payment for each child aged 0-12 years (as in the present system), since the costs of children generally do not fall with age.
This could be achieved over time by setting the anti-poverty benchmark at the maximum level of payment for children aged 5-12 years (17.7% of the couple pension rate as indicated in the table above). The maximum payment for primary school age children would then increase in line with wage movements while that for preschool age children would only rise in line with CPI movements, until these two payment levels are identical.
25 See for example, Henman, et al (2007), ‘Costs of children, research commissioned by the Ministerial taskforce on child support’, Dept of Families, Community Services and Indigenous Affairs, Canberra.

20
4. What difference will the reforms make to families?
At the supermarket yesterdayIce-cream was $2 cheaper the day before.Walked out with nothing becauseIt’s today Not yesterday. They’re the kinds of things that upset meThat we can’t give her what other kids have”
”Eliza, What body Part do I need to sell?, Jobs Australia pg35
In order to understand what difference the restructuring of Family Tax Benefit would make, ACOSS commissioned NATSEM to model the impact of the proposed reforms26. Each element of the package was modelled as well as the cumulative effect. The modelling shows the effect on each of three household types:
• Couples with children
• Sole parent families
• Other families with children (e.g. nuclear families living with other relatives)
The modelling also shows the effect on these family types by household income quintile. The average gain or loss for each family type by quintile is also modelled.
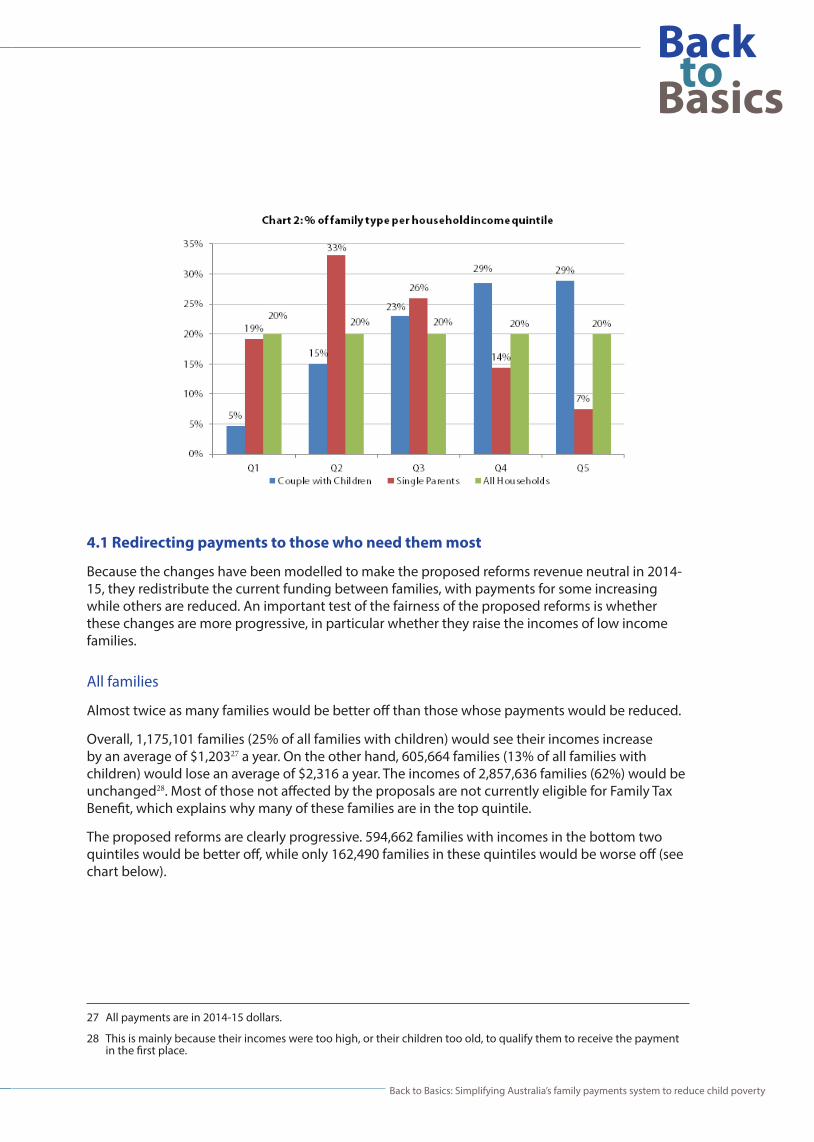
Household income quintiles rank all households by their income. However, different family types are more highly represented in some household income quintiles than others. (See Chart 2). For example, 52% of sole parent families are in the bottom two quintiles. This should be borne in mind when considering the effects of the proposed changes.
26 Phillips, B (2013) Modelling of ACOSS FTB options: Summary of methods and results. NATSEM, March 2013
Back to Basics: Simplifying Australia’s family payments system to reduce child poverty
Back to Basics
4.1 Redirecting payments to those who need them most
Because the changes have been modelled to make the proposed reforms revenue neutral in 2014-15, they redistribute the current funding between families, with payments for some increasing while others are reduced. An important test of the fairness of the proposed reforms is whether these changes are more progressive, in particular whether they raise the incomes of low income families.
All families
Almost twice as many families would be better off than those whose payments would be reduced.
Overall, 1,175,101 families (25% of all families with children) would see their incomes increase by an average of $1,20327 a year. On the other hand, 605,664 families (13% of all families with children) would lose an average of $2,316 a year. The incomes of 2,857,636 families (62%) would be unchanged28. Most of those not affected by the proposals are not currently eligible for Family Tax Benefit, which explains why many of these families are in the top quintile.
The proposed reforms are clearly progressive. 594,662 families with incomes in the bottom two quintiles would be better off, while only 162,490 families in these quintiles would be worse off (see chart below).
27 All payments are in 2014-15 dollars.
28 This is mainly because their incomes were too high, or their children too old, to qualify them to receive the payment in the first place.

22
The proportion of lower income families that benefit is substantially higher than those whose payments are reduced (chart 4). Around half the families in the bottom two quintiles would receive increased payments, a third would experience no change, while only 14% would see their payments reduce. Payments to 50% of families in the lowest income quintile would increase and only 8% would reduce.
Sole parent families
Sole parent families would particularly benefit (chart 5). The ACOSS Report, Poverty in Australia, found that in 2009-10, 25% of sole parents and their children (572,500 people) were living in poverty in 2019-1029. The proposals would increase payments for almost 80% of sole parent families
29 ACOSS (2012) ‘Poverty in Australia’.

Back to Basics: Simplifying Australia’s family payments system to reduce child poverty
Back to Basics
(469,923 families) by an average of $1,472 a year. Only 12% would have reduced payments, by an average of $2,704 a year.
Chart 6 shows that sole parent families in the bottom income quintile overwhelmingly benefit. Payments increase for 93% of such families and reduce for only 3%.
Couples with children
Couples with children are more likely to be found in the top two quintiles of the income distribution than the bottom two. Thus, nine per cent of couples with children are at risk of poverty, compared to the 25% of single parents noted above.
24
More couples with children also benefit from the proposed reform than would receive reduced payments – but not to the same extent as sole parents30.
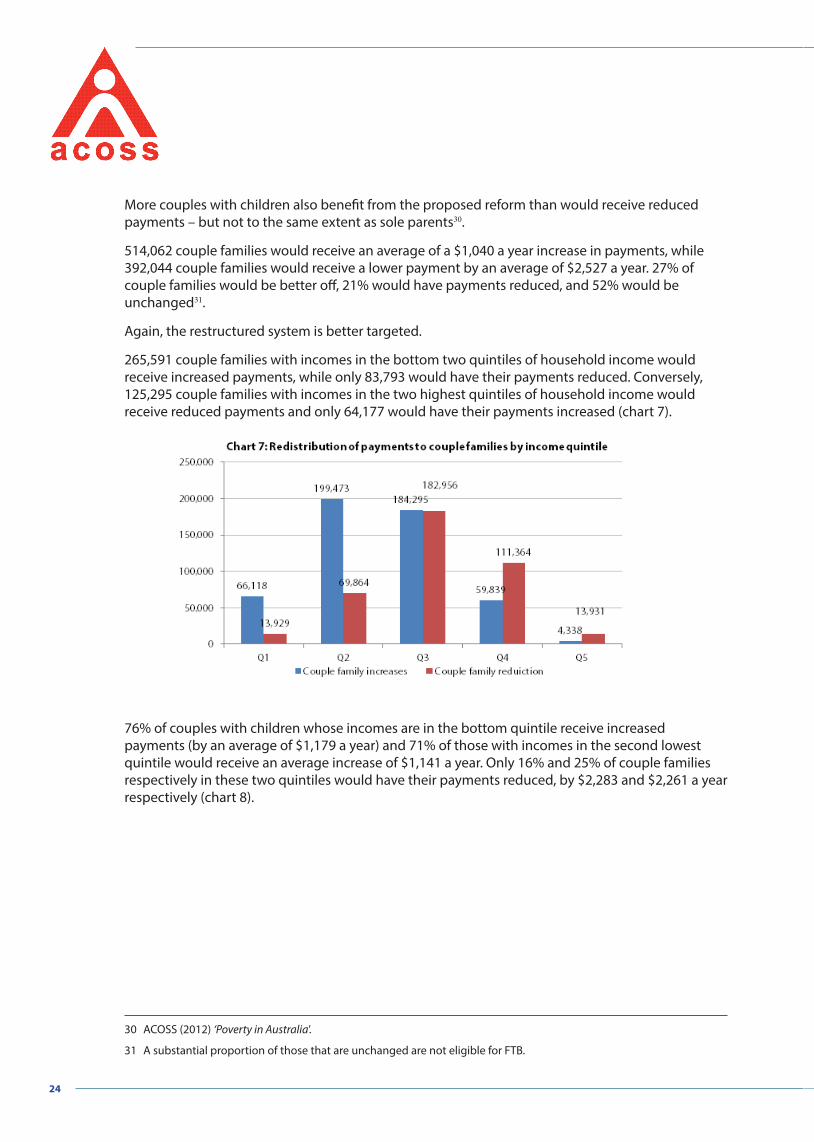
514,062 couple families would receive an average of a $1,040 a year increase in payments, while 392,044 couple families would receive a lower payment by an average of $2,527 a year. 27% of couple families would be better off, 21% would have payments reduced, and 52% would be unchanged31.
Again, the restructured system is better targeted.
265,591 couple families with incomes in the bottom two quintiles of household income would receive increased payments, while only 83,793 would have their payments reduced. Conversely, 125,295 couple families with incomes in the two highest quintiles of household income would receive reduced payments and only 64,177 would have their payments increased (chart 7).
76% of couples with children whose incomes are in the bottom quintile receive increased payments (by an average of $1,179 a year) and 71% of those with incomes in the second lowest quintile would receive an average increase of $1,141 a year. Only 16% and 25% of couple families respectively in these two quintiles would have their payments reduced, by $2,283 and $2,261 a year respectively (chart 8).
30 ACOSS (2012) ‘Poverty in Australia’.
31 A substantial proportion of those that are unchanged are not eligible for FTB.

Back to Basics: Simplifying Australia’s family payments system to reduce child poverty
Back to Basics
The increases and reductions for both single parent families and couple families within each quintile of household income are summarised in the following table:
Table 4: Payment increases and reductions by family type and income quintile

26
4.2 What will it mean for illustrative low income households?
As well as looking at the average effect on the whole population, the impact of the proposed changes can be seen by looking at their effects on particular families – specifically its impact on poverty levels among low income families.
NATSEM estimated the impact of the changes of a set of 32 hypothetical or ‘cameo’ families. Half were sole parents and half were couple families, and of each group half had no employment

Back to Basics: Simplifying Australia’s family payments system to reduce child poverty
Back to Basics
income and half had one job paying the minimum fulltime wage32. The number and ages of children also varied among the cameos (see table 4 below).
All of the cameo families receive at least a ‘part’ income support payment from Centrelink. Two of the sole parent cameos (those with a four year old child) receive the higher Parenting Payment Single payment while the other 30 cameo families receive full or part payment of a lower Allowance payment (Newstart Allowance or Parenting Payment Partnered).
All cameo families receive the maximum rate of Family Tax Benefit Part A as their incomes fall below the free area of the family income test. Some also receive the Part B payment. To simplify the analysis, Rent Assistance was not included.
Their total disposable incomes before and after the proposed changes were compared with the relevant poverty line, based on 50% of median disposable household income33. It should be noted that, in the absence of robust poverty measures that take account of the higher costs of older children, these poverty lines assume that the costs of children of different ages are equal. An analysis that took account of the higher costs of older children would be likely to find a higher incidence of poverty among families with older children.
The results of the cameo modelling are shown in table 5 below.
Table 5: Results of cameo modelling: disposable incomes compared to poverty lines before and after proposed reforms
32 Estimated to be $32,188 a year in 2014-15 dollars.
33 Using the modified OECD equivalence scale.

28
Source: NATSEM, using STINMOD hypothetical model.Cells shaded in red are below the poverty line.
4.2.1 Impact on poverty
The present situation
Of the 32 cameos, one-quarter were in poverty under the current arrangements. None of the cameo families with modest employment income had disposable incomes below the poverty line for that household type; but half the cameo families depending solely on income support and family payments were in poverty. Two were sole parent families and six were couple families. For this reason, we focus on the families without paid employment in the following discussion.
The sole parent households living below the poverty line are those with primary school age children. This reflects the fact that (unlike those with younger children) those without paid employment receive the lower Newstart Allowance and also receive lower FTB Part B payments. The poverty gap (the difference between disposable income and the poverty line) for the cameo sole parent household with one child between 5 and 12 was over $20 a week, while for the one with two such children, the gap was almost $15 a week. Were these households to receive the same rate of FTB Part B as those with very young children (as we propose) they would be lifted out of poverty.
On the other hand, those with older teenage children receive higher FTB Part A payments and this may explain why their incomes are above the poverty line (especially since the poverty line does not take account of the higher costs of teenage children).
More of the couple families without overall employment income are below the poverty line. This is partly because all receive the lower Allowance payments rather than pensions, and partly because

Back to Basics: Simplifying Australia’s family payments system to reduce child poverty
Back to Basics
their FTB Part B payments are lower. Only those couple families with two older children receive sufficient child related payments to lift the family out of poverty.
Nevertheless, the risk of poverty is higher for sole parent families (as indicated in chart 4, 19% of sole parent families compared with only 5% of couples with children were in the bottom quintile of the income distribution. In this sense, the cameos are not representative of families on the lowest incomes. We use them for illustrative purposes only.
The impact of the proposed changes
• Single parent families
The proposed changes increase income for all sole parent cameo families by between $1,050 and $1,446 a year for sole parent families with one child and between $1,550 and $2,100 for those with two children34. As a result both the sole parent cameo families initially below the poverty line are lifted out of poverty.
This can be seen by considering the following ‘cameo’ family:
The cameos also show the improved recognition of the cost of older children, for example cameo seven below:
34 Reflecting the fact shown in the section above that almost all sole parent families in the bottom quintile of household incomes (93%) are better off under the proposed changes
Cameo 3
This household is made up of a single parent and her eight year old child. Because of the child’s age, the family primary income is a Newstart Allowance of $14,5571 a year. There is no income from employment. In addition to the base allowance the family currently receives $5,760 a year in FTB Part A and $3,155 from FTB Part B, as well as a further $1,056 in supplements. The household’s total disposable income is $24,528 a year. This is $1,056 a year below the poverty line of $25,584 for this household type2.
Under the proposed reforms to Family Tax Benefit, the family’s FTB Part A payment would increase by $600 to $6,360 a year. FTB Part B would be replaced by the proposed new Sole Parent Supplement which would be $3,935 a year (an increase of $780 over the previous FTB Part B for a child over 4 years old). The family disposable income would rise to $25,908, lifting the family out of poverty.
1 At the rate hypothesised for 2014-15
2 This poverty line is the austere OECD measure of 50% of median equivalised household income.

30
• Couple families
For the couple family cameos, the effects are more mixed. The effects on the incomes of those cameo families without employment income range from $2,100 a week better off to $1,806 worse off. Nonetheless, one of the six cameo families that were in poverty under the current arrangements is lifted out of poverty, while in another case the poverty gap is reduced from over $30 a week to just over $10 a week.
The changes that affect these low income couple family cameos are: increases to the FTB Part A maximum rate from savings from abolishing the Baby Bonus (for children 0-4) and Schoolkids Bonus (for older children), increases from tighter targeting of FTB Part B (partly redistributed in the form of higher Part A payments), and the loss of FTB Part B by couple families whose youngest child has turned 1335.
The result of the mix of these changes is that the incomes of low income families with children under 5 increase significantly (and in one case, lifting the family out of poverty). For those with children between 5 and 12, the changes largely balance out, resulting in smaller increases and these are not enough to lift them out of poverty. For those cameo families whose children are 13 or over, the loss of FTB Part B outweighs the other gains. Those with only one such child were already in poverty and so the poverty gap is increased.
These varying outcomes can be seen in the following cameos:
35 Other, higher income couple families are affected by the tighter income test for FTB B on the proposed model, but this does not affect the low income cameo families.
Cameo 7
This household too is made up of a single parent on Newstart, but in this case the child is aged 16 years. This family receives $14,557 in Newstart Allowance. They also receive $7,171 in FTB Part A and $3,155 from FTB Part B, as well as supplements of $1,486. This household has a total annual disposable income of $26,369.
In the proposed reform, FTB A payments increase by $1,100 to $8,271 a year. The new Sole Parent Supplement replacing FTB Part B is $3,502 (an additional $347). Total disposable income is increased by $1,446 to $27,815.
Cameo 19
This couple family has one child aged 8 years. Neither parent has paid work and they receive a combined Newstart payment of $24,291. FTB Part A is $5,760. Because of the age of the child FTB Part B is at the lower rate of $1,792, and they receive $1,209 in supplements. This gives them a disposable family income of $33,053 - $2,371 below the poverty line.
After the proposed reforms, the FTB Part B payment increases by $600 to $6,360. Supplements fall by $430, leaving them $170 better off, but still below the poverty line.
Back to Basics: Simplifying Australia’s family payments system to reduce child poverty
Back to Basics
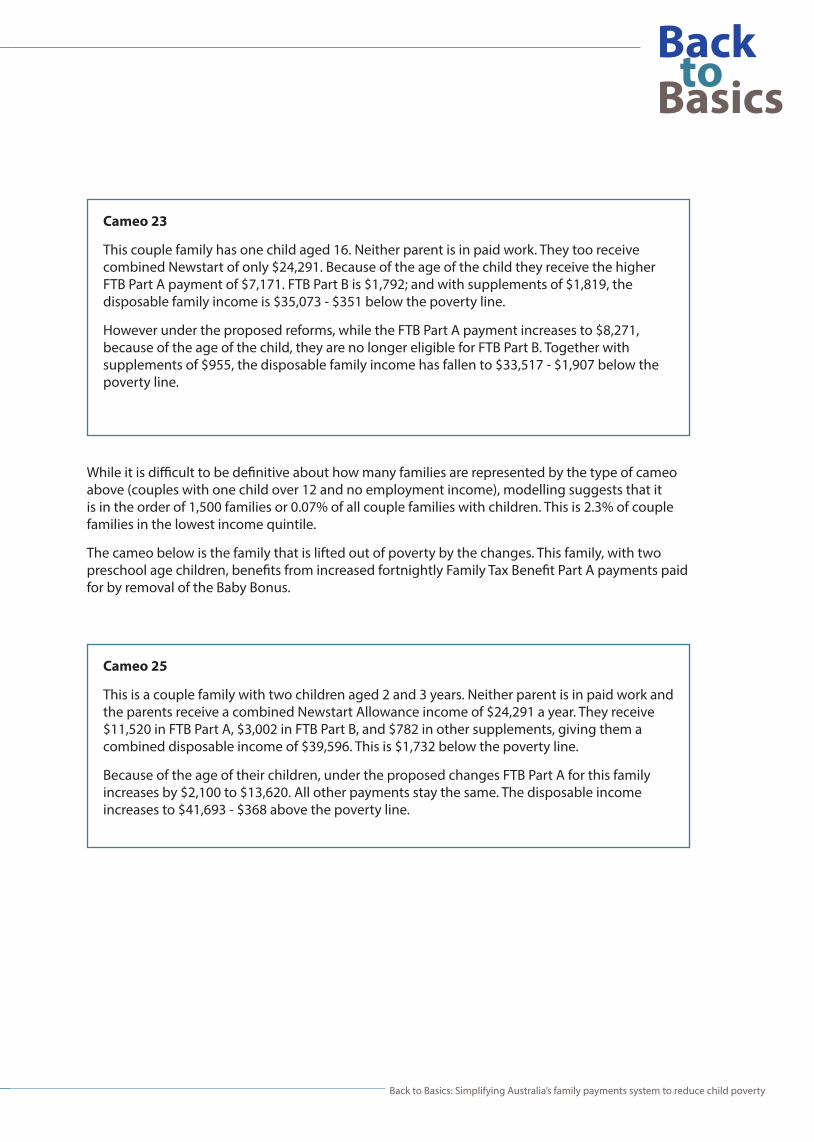
While it is difficult to be definitive about how many families are represented by the type of cameo above (couples with one child over 12 and no employment income), modelling suggests that it is in the order of 1,500 families or 0.07% of all couple families with children. This is 2.3% of couple families in the lowest income quintile.
The cameo below is the family that is lifted out of poverty by the changes. This family, with two preschool age children, benefits from increased fortnightly Family Tax Benefit Part A payments paid for by removal of the Baby Bonus.
Cameo 23
This couple family has one child aged 16. Neither parent is in paid work. They too receive combined Newstart of only $24,291. Because of the age of the child they receive the higher FTB Part A payment of $7,171. FTB Part B is $1,792; and with supplements of $1,819, the disposable family income is $35,073 - $351 below the poverty line.
However under the proposed reforms, while the FTB Part A payment increases to $8,271, because of the age of the child, they are no longer eligible for FTB Part B. Together with supplements of $955, the disposable family income has fallen to $33,517 - $1,907 below the poverty line.
Cameo 25
This is a couple family with two children aged 2 and 3 years. Neither parent is in paid work and the parents receive a combined Newstart Allowance income of $24,291 a year. They receive $11,520 in FTB Part A, $3,002 in FTB Part B, and $782 in other supplements, giving them a combined disposable income of $39,596. This is $1,732 below the poverty line.
Because of the age of their children, under the proposed changes FTB Part A for this family increases by $2,100 to $13,620. All other payments stay the same. The disposable income increases to $41,693 - $368 above the poverty line.

32
References
ACOSS (2012) ‘Poverty in Australia’, Australian Council of Social Service, Strawberry Hills
Brownlee & King (1989), ‘The estimated impact of the family package on child poverty’, in Edgar et al (1989), ‘Child poverty’, Australian Institute of Family Studies, Melbourne
Henman, et al (2007), ‘Costs of children, research commissioned by the Ministerial taskforce on child support’, Dept of Families, Community Services and Indigenous Affairs, Canberra
Melbourne Institute (2013) ‘Families, Incomes and Jobs, Volume 8: A Statistical Report on Waves 1 to 10 of the Household, Income and Labour Dynamics in Australia (HILDA) Survey’, University of Melbourne
OECD Social Policy Division (2012) ‘Child poverty’. Directorate of Employment, Labour and Social Affairs: Last updated 27/01/2012 http://www.oecd.org/els/soc/CO2.2%20Child%20poverty%20-%20update%20270112.pdf
Phillips, B (2013) ‘Modelling of ACOSS FTB options: Summary of methods and results.’ NATSEM, March 2013
Treasurer, ‘Federal Budget Paper No 2’ (various years), Australian Government
Whiteford (1998), ‘The costs of sole parenthood’, Social Policy Research Centre Reports and Proceedings, Sydney


Australian Council of Social Service