back the price free cash flow in the investment process
TRANSCRIPT
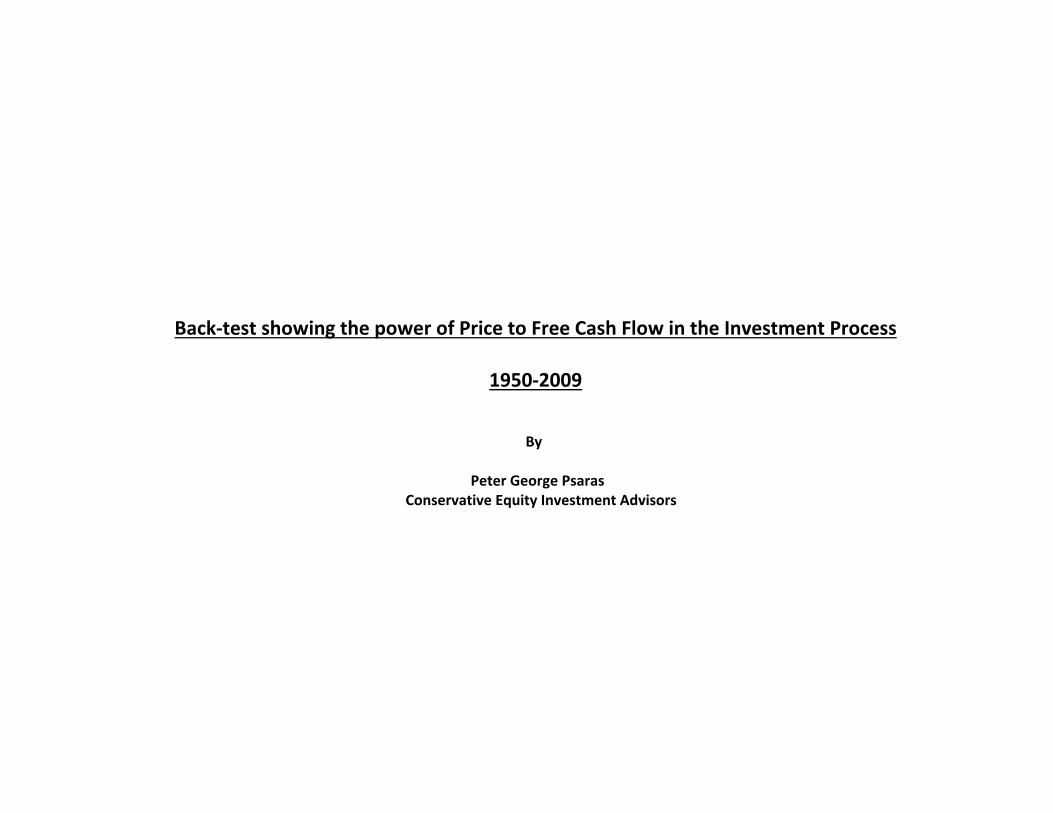
Back‐test showing the power of Price to Free Cash Flow in the Investment Process
1950‐2009
By
Peter George Psaras Conservative Equity Investment Advisors

The following is a backtest that will be used as a proof on just how well the component of free cash flow works in the investment process. The key formula to be used in this backtest is the one for “price to free cash flow per share”, which we calculate as follows;
P/FCF = (Market Price per share)/((cash flow‐capital spending)/ (diluted shares outstanding))).
This I believe to be the most important ratio in finance and the core foundation of all my work.
In order to validate my theories I needed to see how a backtest of price to free cash flow per share would turn out if it were back‐tested over a multi‐year time frame. Accordingly, I undertook a back‐test for the years 1950 to 2009, and used the thirty stocks that make up the Dow Jones Industrial Average (DJIA) to do so. Starting on January 1st of each year from 1950 to 2009 inclusive, I determined which companies in the DJIA would have been purchased using companies that came in at around 15 times their price to free cash flow per share. I then purchased these companies and held them for exactly one year, selling them on December 31st of the same year. I repeated this process for all subsequent years, for a total of sixty years. The results confirm the validity of our methods and show conclusively that a Free Cash Flow based strategy not only works, but works very well. Specifically, in terms of relative performance, my free cash flow picks beat the DJIA in fifty‐five of sixty years tested. Moreover, the average gain for the FCF Portfolio was +21.08% per year over sixty years, compared to an average gain of the DJIA Portfolio of just +6.77%, over sixty years. Thus, if I started with $10,000 in each of the two portfolios (FCF vs. DJIA), at the conclusion sixty years, the DJIA would be worth $511469.76 and the FCF would be worth $965,001,511. This means that the FCF system beat the DJIA by 1887 times, or in relative performance terms, by 188,700%. In introducing the actual data, I have broken it down into four parts, as follows: Part 1: The components of the DJIA for each year. Since the components were similar for many consecutive years, we decided to post the updated DJIA list only in those years where changes were made to the index. Part 2: The side‐by‐side comparison of yearly percentage gain for the FCF Portfolio vs. that of the DJIA Index performance. Part 3: Purchases made using “Free Cash Flow” for the years 1950‐2009, which enable the performance of each purchase to be evaluated retrospectively. Part 4: Yearly side‐by‐side cumulative performance of “Free Cash Flow” vs. that of the DJIA, in actual dollars, starting with $10,000 in each portfolio on January 1, 1950, and ending December 31, 2009.

PART 1
The Components of the Dow Jones Industrial Average 1950‐2009
1950‐1955
Allied Chemical Allied Can
American Smelting American Telephone & Telegraph
American Tobacco Bethlehem Steel
Chrysler Corn Products Refining
Du Pont Eastman Kodak General Electric General Foods General Motors
Goodyear International Harvester International Nickel Johns‐Manville
Loew's National Distillers National Steel
Procter & Gamble Sears Roebuck & Co
Standard Oil of California Standard Oil (N.J.) Texas Corporation Union Carbide United Aircraft
U.S. Steel Westinghouse Electric
Woolworth
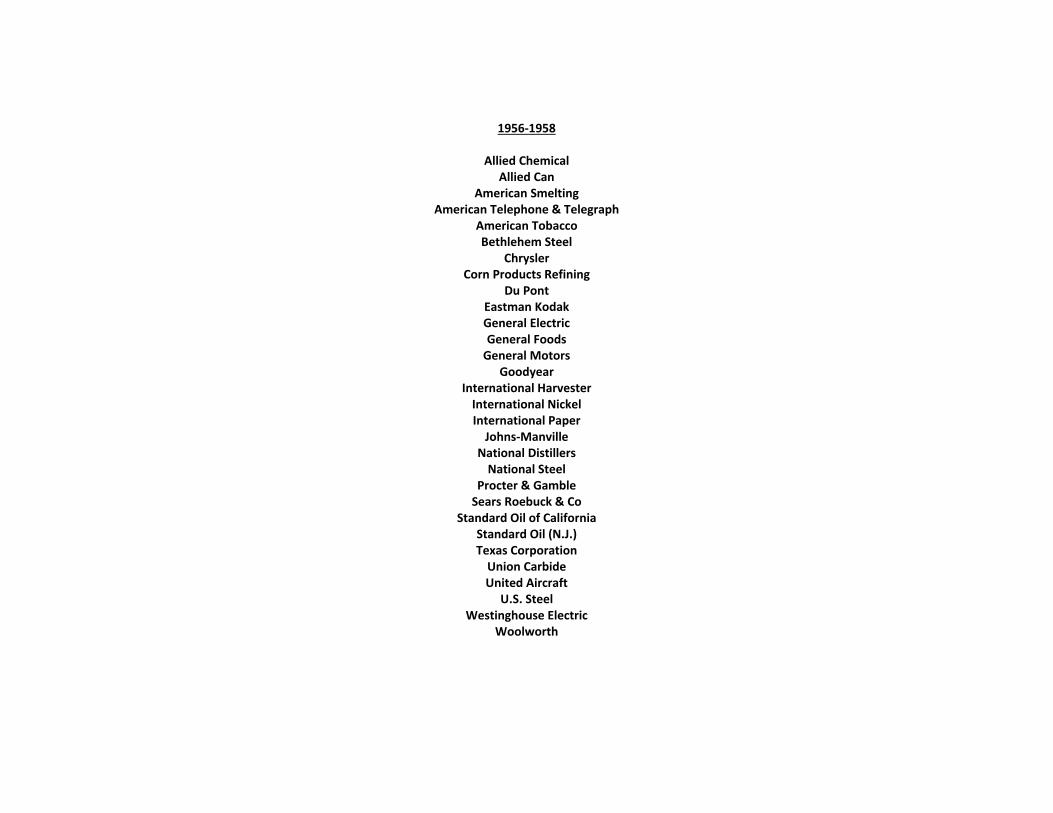
1956‐1958
Allied Chemical Allied Can
American Smelting American Telephone & Telegraph
American Tobacco Bethlehem Steel
Chrysler Corn Products Refining
Du Pont Eastman Kodak General Electric General Foods General Motors
Goodyear International Harvester International Nickel International Paper Johns‐Manville
National Distillers National Steel
Procter & Gamble Sears Roebuck & Co
Standard Oil of California Standard Oil (N.J.) Texas Corporation Union Carbide United Aircraft
U.S. Steel Westinghouse Electric
Woolworth

1959‐1975
Allied Chemical Aluminum Company of America
American Can American Telephone & Telegraph
American Tobacco Anaconda
Bethlehem Steel Chrysler Du Pont
Eastman Kodak General Electric General Foods General Motors
Goodyear International Harvester
International Nickel (name changed to Inco on April 21, 1976) International Paper Johns‐Manville
Owen's‐Illinois Glass Procter & Gamble Sears Roebuck & Co
Standard Oil of California Standard Oil (N.J.) (name changed to Exxon on November 1, 1972)
Swift & Co. (name changed to Esmark on May 30, 1973) Texas Corporation Union Carbide
United Aircraft (name changed to United Technologies on May 1, 1975) U.S. Steel
Westinghouse Electric Woolworth

1976‐1978
Allied Chemical Aluminum Company of America
American Can American Telephone & Telegraph
American Tobacco Bethlehem Steel
Chrysler Du Pont
Eastman Kodak Esmark Exxon
General Electric General Foods General Motors
Goodyear International Harvester
Inco International Paper Johns‐Manville
Minnesota Mining & Manufacturing Owen's‐Illinois Glass Procter & Gamble Sears Roebuck & Co
Standard Oil of California Texas Corporation Union Carbide
United Technologies U.S. Steel
Westinghouse Electric Woolworth
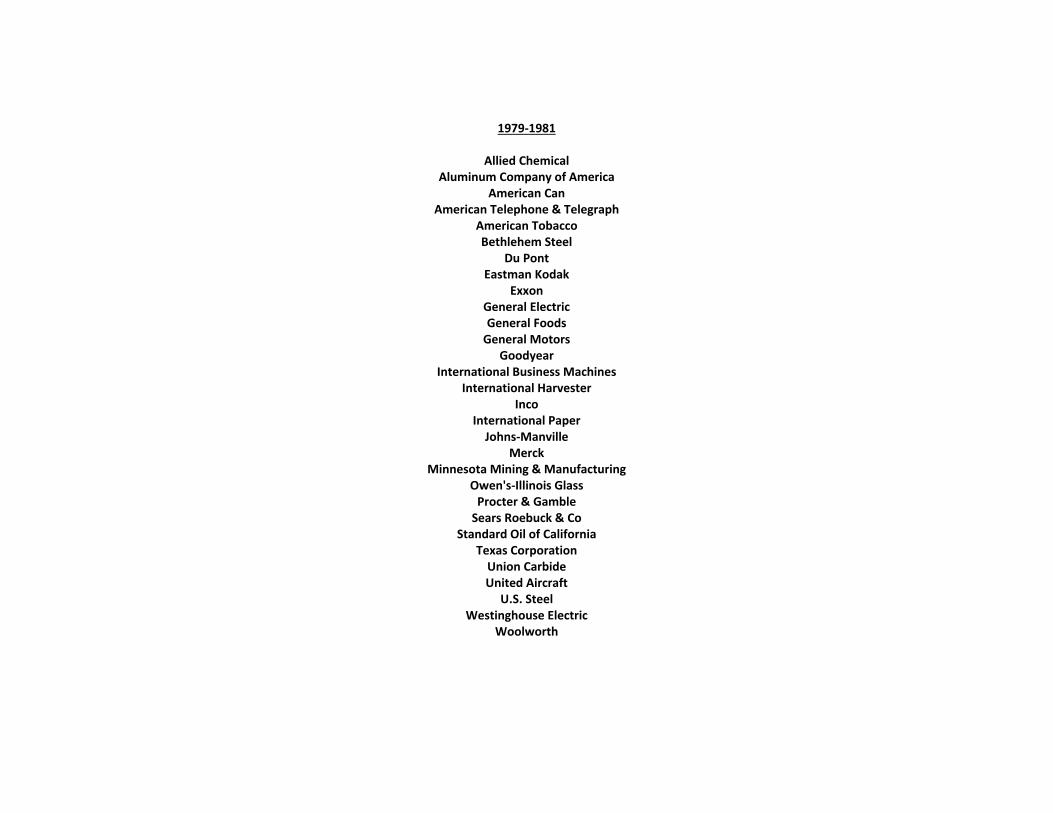
1979‐1981
Allied Chemical Aluminum Company of America
American Can American Telephone & Telegraph
American Tobacco Bethlehem Steel
Du Pont Eastman Kodak
Exxon General Electric General Foods General Motors
Goodyear International Business Machines
International Harvester Inco
International Paper Johns‐Manville
Merck Minnesota Mining & Manufacturing
Owen's‐Illinois Glass Procter & Gamble Sears Roebuck & Co
Standard Oil of California Texas Corporation Union Carbide United Aircraft
U.S. Steel Westinghouse Electric
Woolworth

1982‐84
Allied Chemical (renamed Allied‐Signal Inc. in 1985) Aluminum Company of America
American Can American Express Co.
American Telephone & Telegraph American Tobacco Bethlehem Steel
Du Pont Eastman Kodak
Exxon General Electric General Foods General Motors
Goodyear International Business Machines
International Harvester Inco
International Paper Merck
Minnesota Mining & Manufacturing Owen's‐Illinois Glass Procter & Gamble Sears Roebuck & Co
Standard Oil of California (renamed Chevron in 1984) Texas Corporation Union Carbide United Aircraft
U.S. Steel Westinghouse Electric
Woolworth
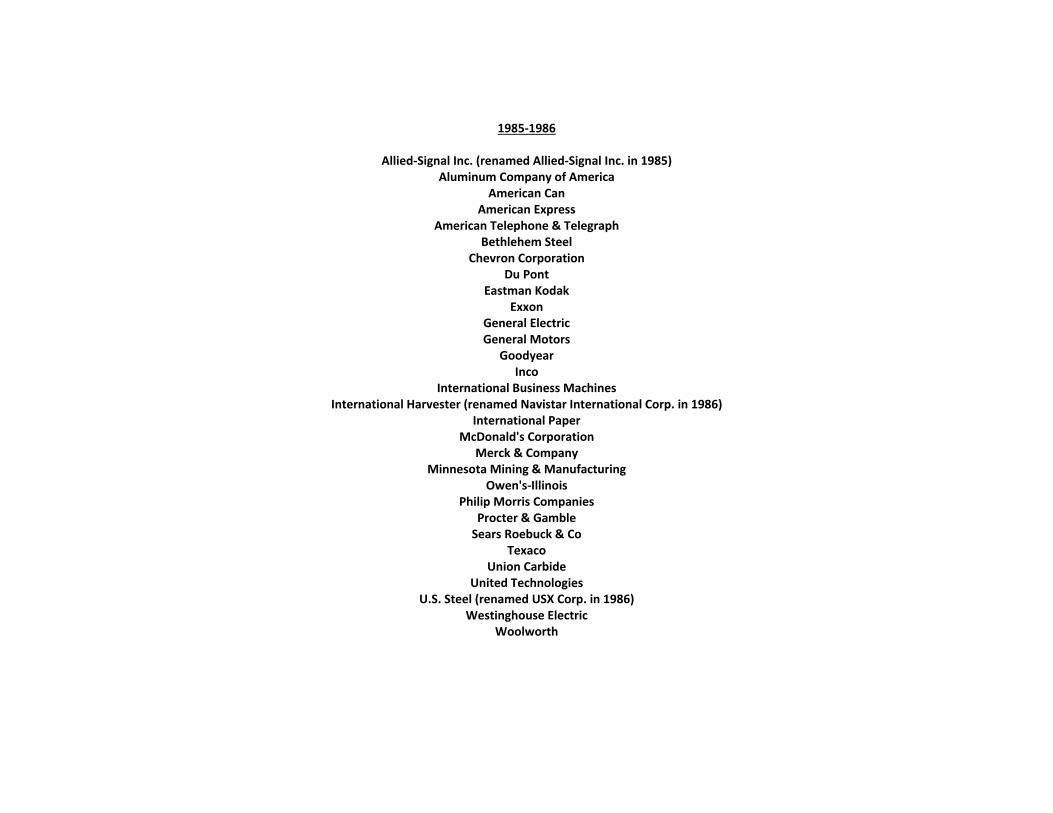
1985‐1986
Allied‐Signal Inc. (renamed Allied‐Signal Inc. in 1985) Aluminum Company of America
American Can American Express
American Telephone & Telegraph Bethlehem Steel
Chevron Corporation Du Pont
Eastman Kodak Exxon
General Electric General Motors
Goodyear Inco
International Business Machines International Harvester (renamed Navistar International Corp. in 1986)
International Paper McDonald's Corporation
Merck & Company Minnesota Mining & Manufacturing
Owen's‐Illinois Philip Morris Companies
Procter & Gamble Sears Roebuck & Co
Texaco Union Carbide
United Technologies U.S. Steel (renamed USX Corp. in 1986)
Westinghouse Electric Woolworth
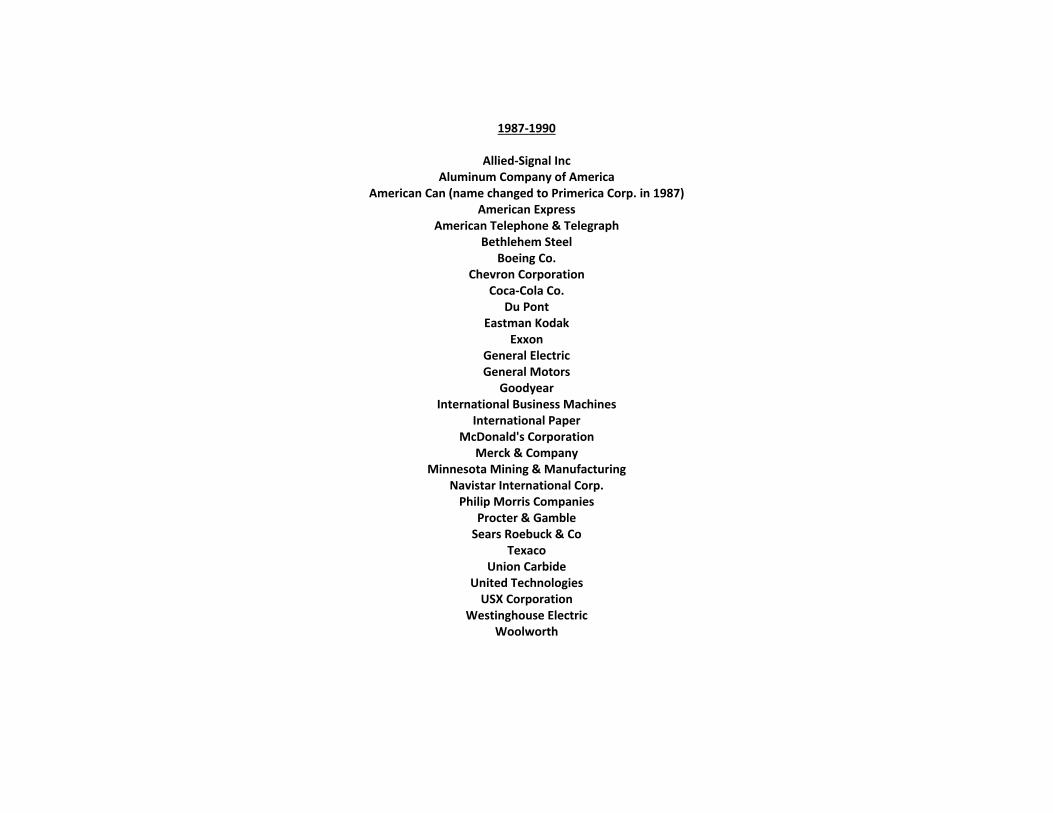
1987‐1990
Allied‐Signal Inc Aluminum Company of America
American Can (name changed to Primerica Corp. in 1987) American Express
American Telephone & Telegraph Bethlehem Steel
Boeing Co. Chevron Corporation
Coca‐Cola Co. Du Pont
Eastman Kodak Exxon
General Electric General Motors
Goodyear International Business Machines
International Paper McDonald's Corporation
Merck & Company Minnesota Mining & Manufacturing
Navistar International Corp. Philip Morris Companies
Procter & Gamble Sears Roebuck & Co
Texaco Union Carbide
United Technologies USX Corporation
Westinghouse Electric Woolworth
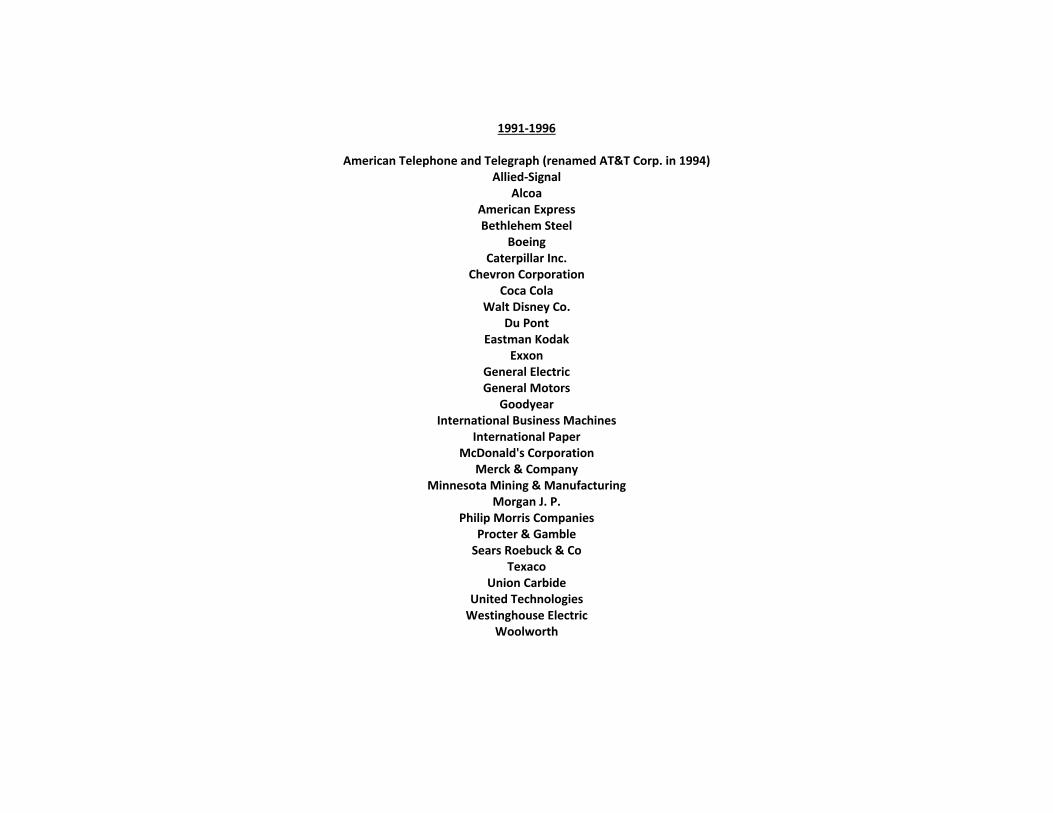
1991‐1996
American Telephone and Telegraph (renamed AT&T Corp. in 1994) Allied‐Signal
Alcoa American Express Bethlehem Steel
Boeing Caterpillar Inc.
Chevron Corporation Coca Cola
Walt Disney Co. Du Pont
Eastman Kodak Exxon
General Electric General Motors
Goodyear International Business Machines
International Paper McDonald's Corporation
Merck & Company Minnesota Mining & Manufacturing
Morgan J. P. Philip Morris Companies
Procter & Gamble Sears Roebuck & Co
Texaco Union Carbide
United Technologies Westinghouse Electric
Woolworth
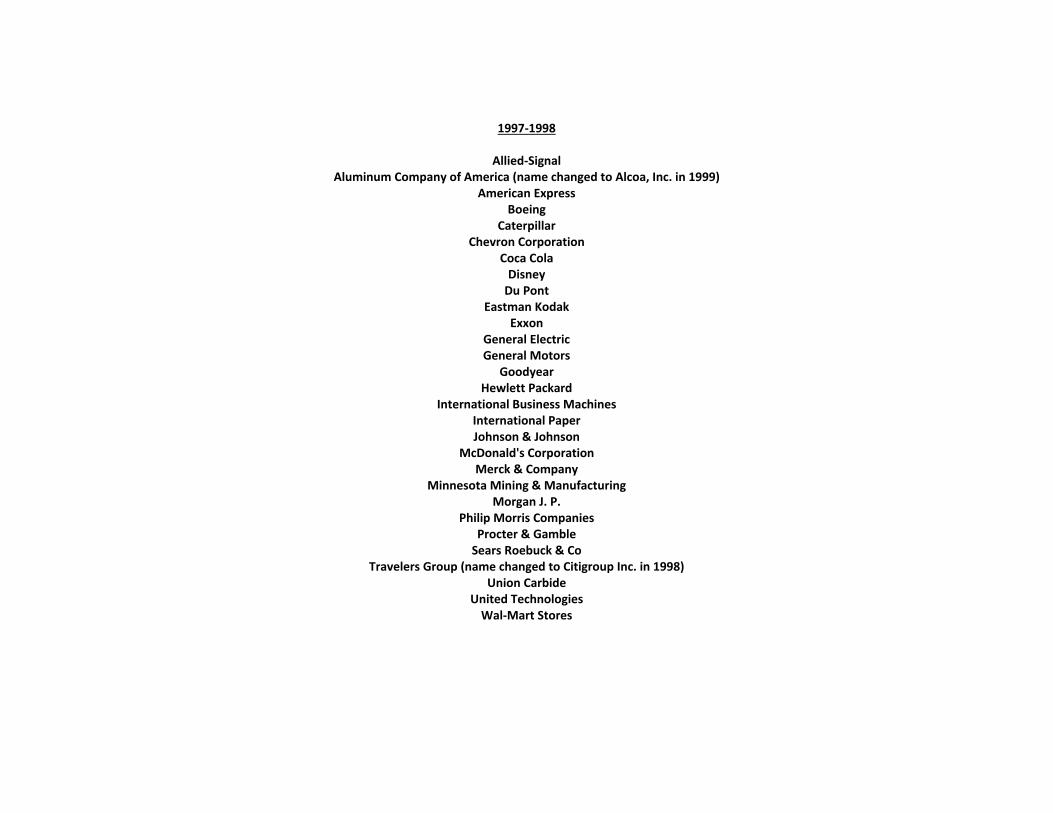
1997‐1998
Allied‐Signal Aluminum Company of America (name changed to Alcoa, Inc. in 1999)
American Express Boeing
Caterpillar Chevron Corporation
Coca Cola Disney Du Pont
Eastman Kodak Exxon
General Electric General Motors
Goodyear Hewlett Packard
International Business Machines International Paper Johnson & Johnson
McDonald's Corporation Merck & Company
Minnesota Mining & Manufacturing Morgan J. P.
Philip Morris Companies Procter & Gamble Sears Roebuck & Co
Travelers Group (name changed to Citigroup Inc. in 1998) Union Carbide
United Technologies Wal‐Mart Stores

1999‐2006
AT&T Alcoa
American Express Boeing
Caterpillar Citigroup Coca Cola Disney Du Pont
Eastman Kodak Exxon (name changed to Exxon Mobil Corp. in 1999)
General Electric General Motors Hewlett Packard Home Depot
Honeywell International Inc. Intel Corporation
International Business Machines International Paper Johnson & Johnson
McDonald's Corporation Merck & Company
Microsoft Corporation Minnesota Mining & Manufacturing
Morgan J. P. (name changed J. P. Morgan Chase and Co. in 2001 after merging with Chase Manhattan Corp.) Philip Morris Companies
Procter & Gamble SBC Communications United Technologies Wal‐Mart Stores

2007‐2008
AT&T Alcoa
Altria Group American Express
Boeing Caterpillar Citigroup Coca Cola Disney Du Pont
Exxon Mobil Corp. General Electric General Motors Hewlett Packard Home Depot
Honeywell International Inc. Intel Corporation
International Business Machines Johnson & Johnson
McDonald's Corporation Merck & Company
Microsoft Corporation Minnesota Mining & Manufacturing
J. P. Morgan Chase Pfizer
Procter & Gamble United Technologies
Verizon Wal‐Mart Stores
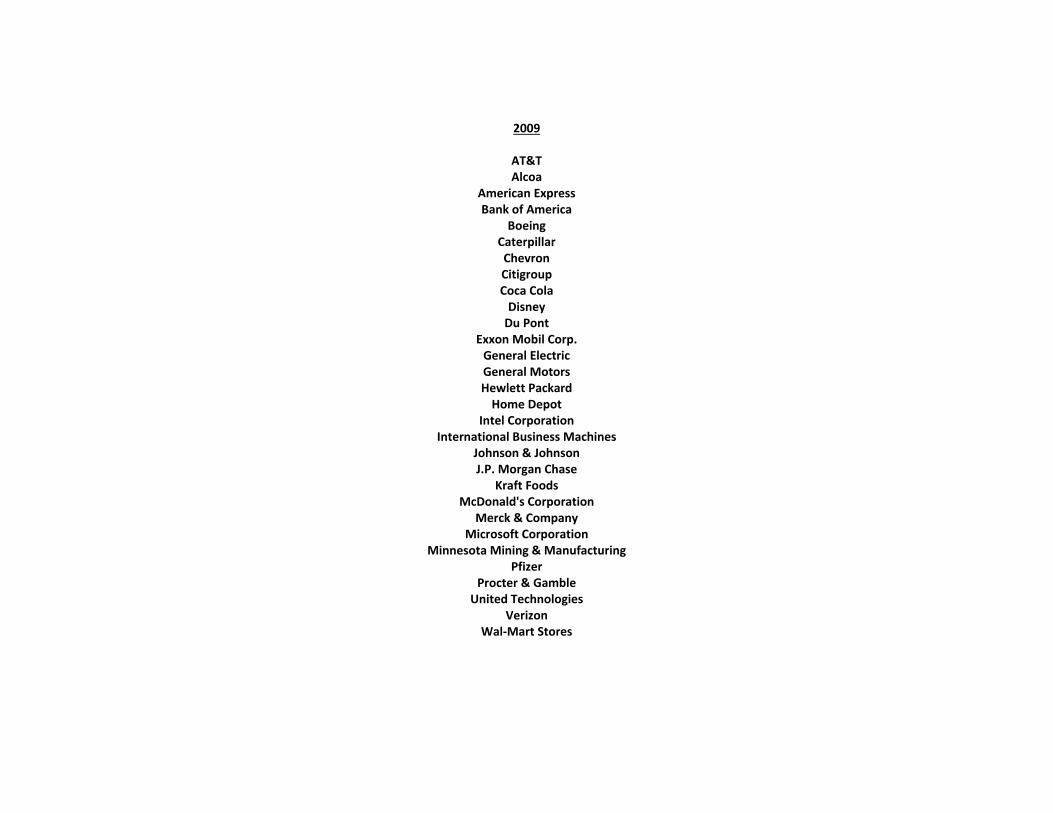
2009
AT&T Alcoa
American Express Bank of America
Boeing Caterpillar Chevron Citigroup Coca Cola Disney Du Pont
Exxon Mobil Corp. General Electric General Motors Hewlett Packard Home Depot
Intel Corporation International Business Machines
Johnson & Johnson J.P. Morgan Chase
Kraft Foods McDonald's Corporation
Merck & Company Microsoft Corporation
Minnesota Mining & Manufacturing Pfizer
Procter & Gamble United Technologies
Verizon Wal‐Mart Stores
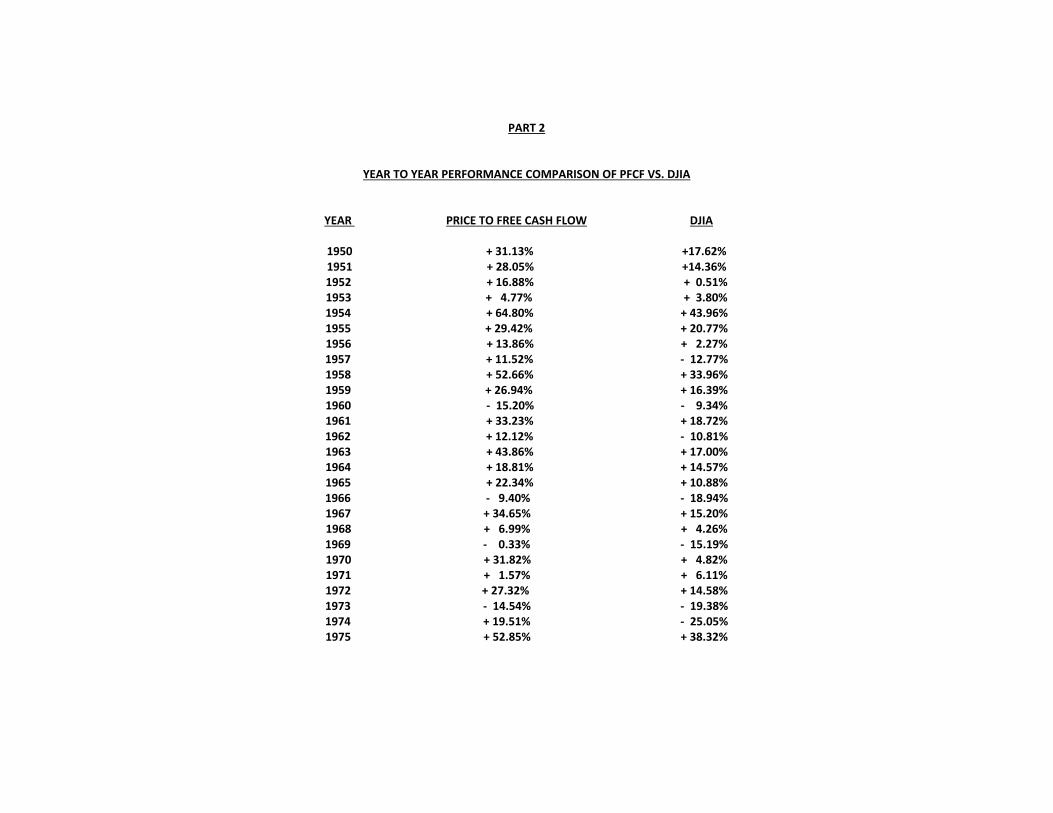
PART 2
YEAR TO YEAR PERFORMANCE COMPARISON OF PFCF VS. DJIA
YEAR PRICE TO FREE CASH FLOW DJIA
1950 + 31.13% +17.62% 1951 + 28.05% +14.36% 1952 + 16.88% + 0.51% 1953 + 4.77% + 3.80% 1954 + 64.80% + 43.96% 1955 + 29.42% + 20.77% 1956 + 13.86% + 2.27% 1957 + 11.52% ‐ 12.77% 1958 + 52.66% + 33.96% 1959 + 26.94% + 16.39% 1960 ‐ 15.20% ‐ 9.34% 1961 + 33.23% + 18.72% 1962 + 12.12% ‐ 10.81% 1963 + 43.86% + 17.00% 1964 + 18.81% + 14.57% 1965 + 22.34% + 10.88% 1966 ‐ 9.40% ‐ 18.94% 1967 + 34.65% + 15.20% 1968 + 6.99% + 4.26% 1969 ‐ 0.33% ‐ 15.19% 1970 + 31.82% + 4.82% 1971 + 1.57% + 6.11% 1972 + 27.32% + 14.58% 1973 ‐ 14.54% ‐ 19.38% 1974 + 19.51% ‐ 25.05% 1975 + 52.85% + 38.32%

YEAR PRICE TO FREE CASH FLOW DJIA
1976 + 46.48% + 17.86% 1977 ‐ 1.77% ‐ 17.26% 1978 + 12.45% ‐ 3.15% 1979 + 18.57% + 4.19% 1980 + 33.57% + 14.93% 1981 + 10.62% ‐ 9.23% 1982 + 55.82% + 19.60% 1983 + 35.23% + 20.26% 1984 + 6.49% ‐ 3.73% 1985 + 35.77% + 27.66% 1986 + 35.17% + 22.58% 1987 + 34.19% + 2.26% 1988 + 23.44% + 11.85% 1989 + 35.96% + 26.96% 1990 + 27.16% ‐ 4.36% 1991 + 99.09% + 20.32% 1992 + 23.17% + 4.17% 1993 + 34.21% + 13.72% 1994 + 14.20% + 2.14% 1995 + 32.84% + 33.45% 1996 + 21.72% + 26.01% 1997 + 36.30% + 22.64% 1998 + 37.71% + 16.10% 1999 + 16.50% + 25.22% 2000 + 19.96% ‐ 6.17% 2001 ‐ 3.91% ‐ 7.10% 2002 ‐ 3.58% ‐ 15.87% 2003 + 28.96% + 23.98% 2004 + 8.94% + 3.14% 2005 + 3.41% ‐ 0.11% 2006 + 31.10% + 16.29% 2007 + 16.72% + 6.34% 2008 ‐ 22.39% ‐ 32.71% 2009 + 22.95% + 15.43%
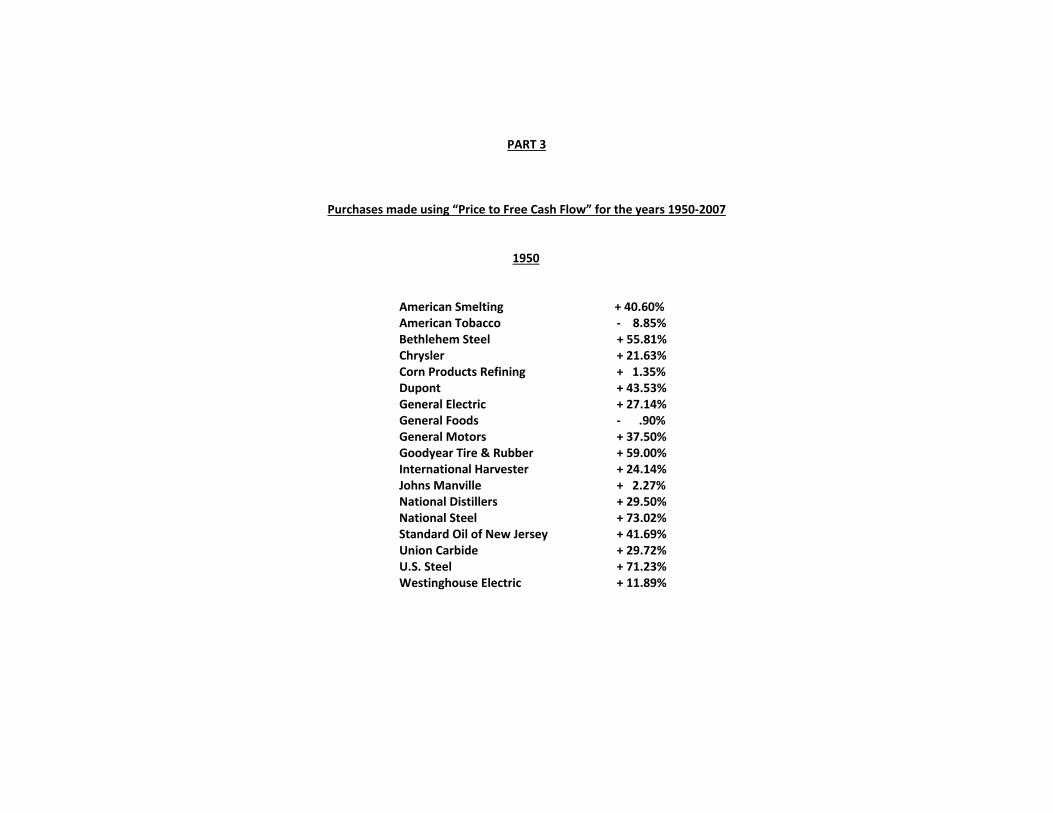
PART 3
Purchases made using “Price to Free Cash Flow” for the years 1950‐2007
1950
American Smelting + 40.60% American Tobacco ‐ 8.85% Bethlehem Steel + 55.81% Chrysler + 21.63% Corn Products Refining + 1.35% Dupont + 43.53% General Electric + 27.14% General Foods ‐ .90% General Motors + 37.50% Goodyear Tire & Rubber + 59.00% International Harvester + 24.14% Johns Manville + 2.27% National Distillers + 29.50% National Steel + 73.02% Standard Oil of New Jersey + 41.69% Union Carbide + 29.72% U.S. Steel + 71.23% Westinghouse Electric + 11.89%

1951
American Smelting + 38.23% American Tobacco + 2.92% Bethlehem Steel + 14.59% Corn Products Refining + 8.42% General Motors + 25.36% Goodyear Tire & Rubber + 40.85% International Harvester + 13.69% Johns Manville + 49.71% Standard Oil of California + 16.15% Standard Oil of New Jersey + 70.57%
1952
American Smelting ‐ 2.64% American Tobacco + 6.58% Chrysler + 47.86% Corn Products Refining + 9.72% General Motors + 40.10% International Harvester ‐ 0.14%
1953
American Tobacco + 0.38% Bethlehem Steel ‐ 2.26% Corn Products Refining +11.14% Goodyear Tire & Rubber + 2.97% International Harvester ‐ 11.45% United Aircraft +27.84%

1954
American Smelting + 70.07% American Tobacco + 12.60% Bethlehem Steel +126.24% Corn Products Refining + 20.01% Dupont + 59.53% General Foods + 33.42% Goodyear +112.26% International Nickel + 74.97% Standard Oil of California + 51.30% Standard Oil of New Jersey + 59.92% United Aircraft + 77.48% U.S. Steel + 93.99% Westinghouse Electric + 50.60%
1955
American Smelting + 15.53% American Tobacco + 31.16% Bethlehem Steel + 55.22% Corn Products Refining + 4.97% Dupont + 40.60% General Foods + 26.92% General Motors + 46.88% Goodyear Tire & Rubber + 26.11% International Harvester + 1.99% International Nickel + 44.83%

1956
American Smelting + 25.06% American Tobacco ‐ 3.99% Corn Products Refining + 9.07% International Harvester + 10.96% International Nickel + 32.93%
1957
American Tobacco + 11.20% Chrysler ‐ 20.36% Corn Products Refining + 20.68%
1958
American Tobacco + 30.92% Bethlehem Steel + 50.58% Corn Products Refining + 63.50% General Foods + 52.89% General Motors + 53.73% International Harvester + 64.35%
1959
Allied Chemical + 27.44% Anaconda + 8.87% American Tobacco + 16.73% Swift + 35.52% International Harvester + 18.26% Westinghouse Electric + 54.81%

1960
Anaconda ‐ 28.13% American Tobacco + 24.74% Chrysler ‐ 42.22%
1961
Anaconda + 17.53% American Tobacco + 58.19% Chrysler + 30.34%
General Motors + 45.23% International Harvester + 14.87%
1962
Anaconda ‐ 11.57% Chrysler + 53.32% General Motors + 6.58% International Harvester + .16%
1963
American Tobacco + 2.13% Chrysler +130.37% General Motors + 40.43% Johns Manville + 18.02% U.S. Steel + 28.37%

1964
Anaconda + 17.11% American Tobacco + 21.49% Swift + 36.05% International Harvester + 30.03% Union Carbide + 8.38% U.S. Steel ‐ .23%
1965
Anaconda + 54.30% American Tobacco + 21.43% Johns Manville + 7.24% U.S. Steel + 6.37%
1966
Johns Manville ‐ 9.40%
1967
American Tobacco + 9.88% Chrysler + 89.43%
General Motors + 31.39% International Harvester + 7.90%
1968
Allied Chemical ‐ 5.25% American Tobacco + 23.11% Chrysler + 3.11%

1969
American Tobacco ‐ 0.33%
1970
American Brands + 31.82%
1971
American Can ‐ 10.50% American Brands ‐ 2.77% Chrysler + 4.38% International Harvester +15.18%
1972
American Can + .60% American Brands + 5.97% Chrysler + 45.33% General Motors + 5.00% International Harvester + 33.81% Alcoa + 25.90% Standard Oil of California + 48.54% Union Carbide + 23.08% United Aircraft + 57.62%

1973
American Can ‐ 10.04% American Brands ‐ 18.01% Bethlehem Steel +16.43% General Motors ‐ 37.66% International Harvester ‐ 29.25% Standard Oil of California ‐ 8.45% Union Carbide ‐ 27.75% United Aircraft ‐ 42.58% U.S. Steel +26.25%
1974
American Can + 18.86%
American Brands + 1.18% Union Carbide + 27.33% United Aircraft + 44.95%
U.S Steel + 5.25%
1975
American Can + 15.78% American Brands + 24.99% General Foods + 62.38% General Motors + 98.46% Goodyear Tire and Rubber + 76.85% United Technologies + 48.05% Westinghouse Electric + 43.77%

1976
American Can + 29.88% American Brands + 25.07% United Technologies + 71.51% General Foods + 14.57% Chrysler + 94.05% General Motors + 41.00% Westinghouse Electric + 39.04% International Harvester + 56.84% Standard Oil of California + 46.38%
1977
American Can + 5.13% American Brands + .11% Du Pont ‐ 7.11% General Motors ‐ 12.90% International Harvester ‐ 3.18% Standard Oil of California + .06% United Technologies ‐ 4.66% Westinghouse Electric + 8.37%

1978
MMM + 33.66% American Brands + 24.08% Bethlehem Steel + 0.00% Du Pont + 9.45% Eastman Kodak + 18.78% General Motors ‐ 3.69% Alcoa + 6.06% Standard Oil of California + 28.62% Westinghouse Electric ‐ 2.91%
1979
American Brands + 41.94% Bethlehem Steel + 12.74%
Du Pont + 1.88% Eastman Kodak ‐ 14.11% General Foods + 9.90% International Harvester + 13.72% INCO + 55.24% Alcoa + 20.16% Standard Oil of California + 25.70%

1980
MMM + 22.19% American Brands + 27.82% Eastman Kodak + 50.75% General Foods ‐ 3.67% Goodyear Tire and Rubber + 34.37% INCO ‐ 12.11% Standard Oil of California + 81.64% U.S. Steel + 50.57% Owens Illinois + 32.15% Westinghouse Electric + 52.03%
1981
American Brands + 2.45% Bethlehem Steel ‐ 5.78% Goodyear Tire and Rubber + 26.88% Alcoa ‐ 8.67% U.S. Steel + 27.17% Owens Illinois + 21.67%
1982
Goodyear Tire and Rubber + 91.05% American Brands + 33.57% General Foods + 31.73% General Electric + 70.76% Procter and Gamble + 51.98%
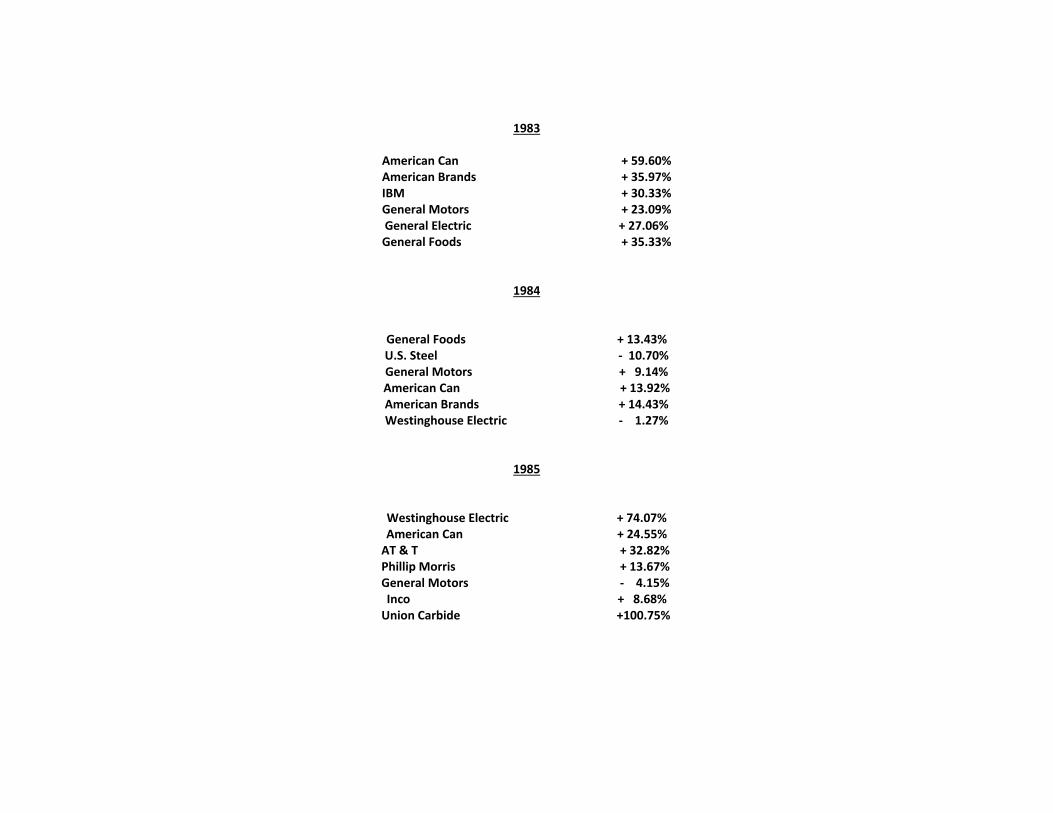
1983
American Can + 59.60% American Brands + 35.97% IBM + 30.33% General Motors + 23.09% General Electric + 27.06% General Foods + 35.33%
1984
General Foods + 13.43% U.S. Steel ‐ 10.70% General Motors + 9.14% American Can + 13.92% American Brands + 14.43% Westinghouse Electric ‐ 1.27%
1985
Westinghouse Electric + 74.07% American Can + 24.55%
AT & T + 32.82% Phillip Morris + 13.67% General Motors ‐ 4.15%
Inco + 8.68% Union Carbide +100.75%

1986
American Can + 45.04% AT & T + 4.80% Philip Morris + 73.13% Chevron + 25.31% Westinghouse Electric + 27.58%
1987
Bethlehem Steel +168.00% IBM ‐ 0.29% Philip Morris + 21.87% Texaco + 12.20% Union Carbide + 1.70% USX Corp. + 43.95% Westinghouse Electric ‐ 8.34%

1988
Alcoa + 22.35% AT&T Corp. + 10.93% Bethlehem Steel + 38.81% Boeing + 67.64% Chevron + 21.51% Texaco + 39.26% General Motors + 44.20% General Electric + 4.34% Westinghouse Electric + 9.07% United Technologies + 25.53% USX Corp. + 2.35% Union Carbide + 24.71% Proctor and Gamble + 5.07% Philip Morris + 23.44% International Paper + 13.24%
1989
Allied Signal + 12.85% Alcoa + 36.25% AT&T Corp. + 64.76% Bethlehem Steel ‐ 20.43% Coca Cola + 75.80% Union Carbide ‐ 4.78% General Motors + 7.96% Philip Morris + 67.18% General Electric + 47.26% Westinghouse Electric + 44.29% Proctor & Gamble + 75.83% International Paper + 24.58%

1990
Philip Morris + 27.16%
1991
Goodyear Tire & Rubber + 202.76% General Electric + 36.61% Philip Morris + 57.90%
1992
General Electric + 17.09% Goodyear Tire & Rubber + 29.25%
1993
Boeing + 9.94% Caterpillar + 67.09% General Electric + 25.28% General Motors + 71.18% Goodyear Tire & Rubber + 34.62% IBM + 21.77% United Technologies + 32.78% Westinghouse Electric + 10.99%

1994
Boeing + 10.98% Caterpillar + 24.55% Du Pont + 19.97% General Motors ‐ 21.78% IBM + 32.88% Philip Morris + 8.04% Union Carbide + 34.64% United Technology + 4.31%
1995
United Technologies + 53.92% Allied Signal + 41.68% Caterpillar + 7.39% Union Carbide + 30.21% Alcoa + 23.75% General Motors + 26.29% Goodyear Tire & Rubber + 37.17% Eastman Kodak + 43.87% Du Pont + 27.74% General Electric + 44.00% IBM + 25.68% International Paper + 3.24% Philip Morris + 61.92%

1996
Philip Morris + 29.06% Allied Signal + 42.69% United Technologies + 41.81% Alcoa + 22.27% Bethlehem Steel ‐ 36.04% Caterpillar + 30.64% General Motors + 3.74% Goodyear Tire & Rubber + 15.31% IBM + 66.89% International Paper + 11.56% Union Carbide + 11.00%
1997
Caterpillar + 58.25% IBM + 38.64% General Motors + 12.00%
1998
General Motors + 21.82% United Technologies + 53.60%
1999
Boeing + 28.72% General Motors + 4.28%

2000
Boeing + 61.43% Caterpillar + 3.39% Eastman Kodak ‐ 37.95% General Motors ‐ 27.17% Philip Morris +100.09%
2001
Eastman Kodak ‐ 20.31% General Motors ‐ 0.66% Philip Morris + 9.25%
2002
Boeing ‐ 13.17% Eastman Kodak + 25.17% General Motors ‐ 20.04% Philip Morris ‐ 6.28%

2003
AT&T Corp. ‐ 19.19% Alcoa + 69.44% Eastman Kodak ‐ 23.46% General Motors + 50.29% Hewlett Packard + 33.54% International Paper + 26.14% McDonalds + 55.54% Altria Group + 40.78% SBC Communication + 1.22% United Technologies + 55.33%
2004
AT&T Corp. ‐ 1.43% Eastman Kodak + 27.58% Exxon Mobil + 27.61% General Motors ‐ 21.23% Altria Group + 17.46% SBC Communications + 3.64
2005
Altria + 23.23% AT&T ‐ 4.69% Exxon Mobil + 9.98% General Motors ‐ 53.38% Hewlett Packard + 35.56% Merck ‐ 0.56% Pfizer ‐ 14.61%

2006
Altria + 14.47% AT&T + 45.98% Boeing + 26.19% Caterpillar + 5.62% Exxon Mobil + 25.82% General Motors + 60.67% Hewlett Packard + 40.68% Honeywell + 21.55% IBM + 17.83% Merck + 34.07% Pfizer + 9.51% United Technologies + 10.75% Walt Disney + 42.32%
2007
AT&T + 23.35% Caterpillar + 20.83% Exxon Mobil + 28.51% General Motors ‐ 15.48% IBM + 11.13% Merck + 32.00% Pfizer ‐ 13.54% United Technologies + 21.86%

2008
Dupont ‐ 39.16% Exxon Mobil ‐ 13.46% International Business Machines ‐ 18.34% Pfizer ‐ 18.59%
2009
AT&T + 4.22% Boeing + 20.75% Chevron + 3.73% Dupont + 34.10% Exxon Mobil ‐ 14.56% General Electric ‐ 1.56% Hewlett Packard + 42.66% Home Depot + 20.72% International Business Machines + 52.96% Johnson & Johnson + 10.26% Merck + 24.66% Microsoft + 50.68% MMM + 44.74% Pfizer + 4.57% United Technologies + 30.66% Walt Disney + 38.72%

PART 4
Compounded return of $10,000 invested in 1950 in each would be worth
YEAR PRICE TO FREE CASH FLOW DJIA
1950 $ 13,113 $ 11,762 1951 $ 16,791 $ 13,451 1952 $ 19,625 $ 13,519 1953 $ 20,561 $ 14,032 1954 $ 33,884 $ 20,201 1955 $ 43,852 $ 24,397 1956 $ 49,930 $ 24,951 1957 $ 51,847 $ 21,765 1958 $ 79,150 $ 29,156 1959 $ 100,473 $ 33,935 1960 $ 85,201 $ 30,766 1961 $ 113,513 $ 36,525 1962 $ 127,270 $ 32,577 1963 $ 183,090 $ 38,115 1964 $ 217,529 $ 43,668 1965 $ 266,125 $ 48,420 1966 $ 241,109 $ 39,249 1967 $ 324,654 $ 45,215 1968 $ 347,347 $ 47,141 1969 $ 346,201 $ 39,981 1970 $ 456,362 $ 41,907 1971 $ 463,527 $ 44,468 1972 $ 590,163 $ 50,952 1973 $ 504,353 $ 41,077 1974 $ 602,752 $ 30,787 1975 $ 921,307 $ 42,585

YEAR PRICE TO FREE CASH FLOW DJIA 1976 $ 1,349,530 $ 50,191 1977 $ 1,325,644 $ 41,527 1978 $ 1,490,687 $ 40,220 1979 $ 1,767,507 $ 41,904 1980 $ 2,360,859 $ 48,161 1981 $ 2,611,582 $ 43,716 1982 $ 4,069,367 $ 52,284 1983 $ 5,503,006 $ 62,877 1984 $ 5,860,151 $ 60,531 1985 $ 7,956,327 $ 77,274 1986 $ 10,754,726 $ 94,723 1987 $ 14,431,767 $ 96,864 1988 $ 17,814,573 $ 108,343 1989 $ 24,220,693 $ 137,552 1990 $ 30,799,033 $ 131,554 1991 $ 61,317,795 $ 158.287 1992 $ 75,525,128 $ 164,886 1993 $ 101,362,274 $ 187,510 1994 $ 115,756,717 $ 191,522 1995 $ 153,769,894 $ 255,586 1996 $ 187,168,715 $ 322,064 1997 $ 255,110,959 $ 394,980 1998 $ 351,313,302 $ 458,571 1999 $ 409,279,996 $ 574,233 2000 $ 490,972,284 $ 538,802 2001 $ 471,775,267 $ 500,548 2002 $ 454,885,713 $ 421,111 2003 $ 586,620,615 $ 522,093 2004 $ 639,064,498 $ 538,487 2005 $ 660,869,431 $ 532,500 2006 $ 866,433,448 $ 619,233
2007 $1,011,301,128 $ 658,492 2008 $ 784,873,128 $ 443,100 2009 $ 965,001,511 $ 511,470

©2014 Peter George Psaras
All Research is written and produced as an information source only, and is not a solicitation to buy or sell securities. This research may not be construed as investment advice. Investing in securities is speculative and carries a high degree of risk. Past performance does not guarantee future results. All information contained in this research should be independently verified. Investors are reminded to perform their own due diligence with respect to any investment decision. Factual material is obtained from sources believed to be reliable, but the publisher is not responsible for any errors or omissions. Nothing herein should be construed as an offer to buy or sell securities or to give individual investment advice. RIGHTS OF REPRODUCTION AND DISTRIBUTION ARE RESERVED TO THE PUBLISHER. This Publication is strictly for subscriber’s own, non‐commercial, internal use. No part of it may be reproduced, resold, stored or transmitted in any printed, electronic or other form, or used for generating or marketing any printed or electronic publication service or product without the written consent of the above named.