bachelor of science in...
TRANSCRIPT

UNIVERSITY OF NAIROBI
INVESTIGATION OF THE PERFORMANCE OF NATURAL FIBRES
AS A MICRO REINFORCEMENT IN CONCRETE.
BY
WAWERU NANCY MUGURE
REG. NO: F16/2315/2009
A project submitted as a partial fulfilment
for the requirement for the award of the degree of
BACHELOR OF SCIENCE IN CIVIL&CONSTRUCTION
ENGINEERING
APRIL 2014

i
DEDICATION
To my beloved parents Mr. and Mrs. Samuel Waweru, for all the selfless love you gave me and
investing in my education, thank you so much. You keep the spirits alive.
To my brothers and sisters, your love and constant encouragement during the studies made my
education at the university a success.

ii
ACKNOWLEDGEMENT
I wish to express my profound gratitude to Eng. Dr. S.W. Mumenya for her guidance, ideas, moral
support and encouragement for the success of this project. Her objectivity and suggestions were
helpful throughout the project period. I am also grateful to all the other lecturers and staff members
for helping me gain the necessary skills during my five years at the University.
My sincere gratitude also goes to the laboratory technicians for providing me with necessary
guidance and equipment to perform various tests in this thesis, and for the endurance during all the
laboratory experiments.
I am also indebted to my family for their love, support and encouragement during my entire
education.
Mention must also be made of my friends and classmates who have been a source of
encouragement and support, and who assisted me in one way or another during the project period.
Above all, this thesis will not be complete without giving thanks and adoration to the Almighty God
for his divine health, provision and knowledge he has granted on to me throughout my study in the
University of Nairobi.
May God bless you all.

iii
ABSTRACT
Over the years, the prices of raw materials have been rising every single day. There has also been a
lot of emphasis on the conservation of the environment by advocating for the use of renewable
sources for materials in the construction industry and even in the other fields like energy
production. The use of synthetic fibre was more dominant in reinforcement of concrete but now
natural fibre is becoming more popular. These have been produced in an effort to develop low cost
materials and sustainable constructions. More recently, the use of natural fibres in construction has
been incorporated in thin elements for roofing, cladding, and internal and external partitioning
walls; as a substitute for asbestos [4]
. One way to reduce the harmful destruction of the ecosystem is
to have policies encouraging the use of natural fibres as micro-reinforcing composites in light
concrete structures. It is bio-degradable, eco-friendly and sustainable over a long period. It also has
social-economic gains especially in developing countries.
The aim of this research was to determine the effectiveness of the use of naturally occurring fibres
as a micro-reinforcement in concrete, mortar and cements. The various types of natural fibres
available for reinforcing concretes, the mix proportions, the method of mixing, handling and
placing, and the properties of fresh and hardened natural fibre reinforced concretes are described in
this report.
Since concrete is brittle, reinforcement of brittle matrices with natural fibres of different kinds has
been shown to improve the mechanical properties of concrete and mortars mixes. In this research,
mechanical properties of natural fibre reinforced concrete were examined using the cube crushing
test, tensile test, and the Four-point bending test. The Flexural strength, Tensile strength, Toughness
and the Interfacial bond strength were examined .Two forms of reinforcements we re-examined
under varying volume fractions. These were, parallel fibre reinforcement with uniaxial fibres
aligned in the direction of the stress field, and chopped fibres randomly reinforced in the matrix.
Experiments were conducted on concrete beams, cylinders and cubes with various percentages of
natural fibre i.e. 0%, 1%, 2%, and 3% by weight. For each combination of proportions of concrete
one beam, one cylinder and three cubes were tested for their mechanical properties. By testing of
cubes, cylinders and beams we found that there is an increment in the various properties and
strength of concrete by the addition of fibre as reinforcement, up to an optimum percentage where
the strength starts to drop. The Flexural strength and the Tensile strength were seen to increase
considerably with fibre volume fractions for chopped fibre reinforcement by about 60% and

iv
19%.For parallel fibres , samples were tested in flexure only. During failure, fibre pull-out was
observed and the composites behaved in a ductile manner with the fibres being able to sustain some
load even when cracks had developed fully across the specimen.
However, research needs to be done to come up with admixtures that prevent or reducing balling of
the fibres and also reduce the deterioration of the fibers in concrete mix. Treatment methods are
also under investigation to increase the fibre strength.
From the research, it was discovered that natural fibres are being used by engineers as structural
elements in various projects one of them being the Pensmore-Chateau mansion, that is a castle
being built to withstand large forces from natural and manmade disasters. Studies are also being
done on incorporating natural fibres in bio-concrete production (a type of concrete that heals itself
preventing progression of cracks).
v
Table of Contents
DEDICATION ...................................................................................................................................... i
ACKNOWLEDGEMENT ................................................................................................................... ii
ABSTRACT ........................................................................................................................................iii
FIGURES...........................................................................................................................................ix
PLATES..............................................................................................................................................x
TABLES........................................................................................................................................... xii
CHARTS......................................................................................................................................... xiii
CHAPTER ONE: INTRODUCTION .............................................................................................. 1
1.1 General ................................................................................................................................. 1
1.1.1 Unprocessed Natural Fibres (UNF) ............................................................................... 2
1.1.2 Processed Natural Fibres (PNF)..................................................................................... 2
1.2 Historical use ............................................................................................................................. 3
1.3 Applications ............................................................................................................................... 3
1.4 Advantages and Disadvantages of natural fibre reinforced concrete ......................................... 4
1.5 Objective and aim of the study. ................................................................................................. 4
1.5.1 General Objective ............................................................................................................... 4
1.5.2 Specific Objective ............................................................................................................... 4
CHAPTER TWO: LITERATURE REVIEW ................................................................................. 6
2.1 Chemical properties of Portland cement .................................................................................... 6
2.2 Fibre Reinforcing Mechanism ................................................................................................... 7
2.3 Fibre-Matrix Bond ..................................................................................................................... 9
2.5 Chemical and Physical Properties of Different Fibres ............................................................. 11
2.6 Materials with Extractable Fibres. ........................................................................................... 14
2.6.1 Sisal Fibre ......................................................................................................................... 15
2.6.1.1 Growing Conditions In Kenya..................................................................................15

vi
2.6.1.2 Fibre Extraction and treatment................................................................................17
2.6.1.3 Properties of sisal fibre.............................................................................................18
2.6.1.4 Environmental impact...............................................................................................19
2.6.2 Sugarcane Bagasse Fibre .................................................................................................. 19
2.6.2.1 Growing Conditions and Production in Kenya.....................................................20
2.6.2.2 Sugarcane harvesting and extraction......................................................................21
2.6.2.3 Properties of sugarcane bagasse............................................................................22
2.6.2.4 Comparison between oven dried bagasse and sun dried (raw) bagasse............... 23
2.6.3 Coconut (Coir) Fibre ......................................................................................................... 25
2.6.3.1 Varieties of Coir.........................................................................................................25
2.6.3.1.1 Brown coir.........................................................................................................25
2.6.3.1.2 White coir.........................................................................................................26
2.6.3.2 Growing conditions and production in Kenya .......................................................26
2.6.3.3 Harvesting and fibre extraction...............................................................................28
2.6.3.4 Fibre Treatment........................................................................................................29
2.6.3.5 Properties of coir fibre..............................................................................................30
2.6.3.6 Other benefits of coir fibre.......................................................................................30
2.6.4 Human Hair Fibre ............................................................................................................. 31
2.6.4.1 Structural properties of human hair ......................................................................31
2.6.4.2 Use of human hair as a micro reinforcement in concrete........................................32
2.6.4.3 Mechanical properties of human hair.......................................................................33

vii
2.6.4.4 Failure mechanism of hair fibre...............................................................................33
2.6.4.5 Classification of human hair.....................................................................................34
2.7 Existing Natural Fibre Reinforced Concrete Structures. ......................................................... 35
CHAPTER THREE: MATERIALS AND METHODOLOGY ................................................... 43
3.1 Material Characterization and experimental plan .................................................................... 43
3.1.1 Tests on coarse aggregates ................................................................................................ 43
3.1.2 Sieve Analysis on fine aggregates .................................................................................... 43
3.1.3 Portland Cement................................................................................................................ 44
3.1.4 Water ................................................................................................................................. 44
3.1.5 Mix Proportions ................................................................................................................ 44
3.1.6 Moulding and casting ........................................................................................................ 46
3.1.7 Parallel aligned fibres ....................................................................................................... 47
3.2 Testing methods ....................................................................................................................... 49
3.2.1 Tests on fresh concrete...................................................................................................... 49
3.2.1.1 Compacting Factor Test (Workability)..................................................................49
3.2.1.2 Slump Test..............................................................................................................51
3.2.2Mechanical Strength Tests ................................................................................................. 52
3.2.2.1 Cube Crushing Test...............................................................................................52
3.2.2.2 Splitting Tensile Test.............................................................................................53
3.2.2.3 Flexure Test-Third Point Loading Method............................................................56
CHAPTER FOUR: RESULTS AND ANALYSIS ........................................................................ 59
4.1 Particle size distribution (Sieve analysis) ................................................................................ 59
4.2 Workability tests ...................................................................................................................... 60
4.3 Mechanical tests ....................................................................................................................... 61
4.3.1 Cube crushing Test ........................................................................................................... 61
4.3.2 Splitting Tensile Test ........................................................................................................ 64

viii
4.3.3 Flexural/Bending Test ....................................................................................................... 65
CHAPTER FIVE: DISCUSSION ................................................................................................... 67
5.1 Compaction factor .................................................................................................................... 67
5.2 Slump test................................................................................................................................. 68
5.3 Mechanical strength ................................................................................................................. 70
5.3.1 The variation of strength of concrete with an increase in fibre content (%) ..................... 70
5.3.2 Plain concrete (control) as compared to natural fibre reinforced concrete in general ...... 72
5.3.3 Comparison of the compressive, tensile and flexural strength of concrete. ..................... 74
5.3.3.1 Compressive vs. Tensile strength..........................................................................74
5.3.3.2 Compressive vs. Flexural strength........................................................................74
5.3.3.3 Tensile vs. Flexural strength.................................................................................74
5.3.4 Plain concrete (control) compared with sisal fibre reinforced concrete ........................... 75
5.3.5 Plain concrete (control) compared with coir fibre reinforced concrete ............................ 77
5.3.6 Plain concrete (control) compared with bagasse fibre reinforced concrete ...................... 79
5.3.7 Plain concrete (control) compared with human hair fibre reinforced concrete ................ 82
5.4 Plain concrete compared to the sisal twine and double twisted sisal rope............................... 84
5.5 Summary of the strength of the different fibres. ...................................................................... 86
CHAPTER SIX: CONCLUSION AND RECOMMENDATIONS. ............................................ 87
6.1 Conclusion ............................................................................................................................... 87
6.2 Recommendations .................................................................................................................... 89
7 REFERENCES .............................................................................................................................. 90
8 APPENDICES ............................................................................................................................... 93
8.1 Appendix 1 ............................................................................................................................... 93
8.2 Appendix 2 ............................................................................................................................... 95
8.3 Appendix 3 ............................................................................................................................. 101

ix
FIGURES
Figure 2.1 Tensile Load versus Deformation for Plain and Fibre Reinforced Concrete………….8
Figure 2.2 Illustration of fibre critical length under tension…………………………………..…10
Figure 2.3 Sisal Plant and Leaf dimensions……………………………………………………...16
Figure 2.4 Current technological processes for extraction of sugar juice from cane in sugarcane
mill (Elsunni, 1993)…………………………………………………………….......…………...22
Figure 2.5 Examples of traditional dwellings made of grasses and leaves (Sidamo dwelling,
Ethiopia: basket-like structure)…………………………………………………………..............35
Figure 3.1Showing a cylinder with compression loading along the vertical diameter…………...54
Figure 3.2 The four-point loading of a beam specimen…………………………………………...57
Figure 3.3 Third-point bending test…………………………………………………………….....57
Figure 3.4 Four-pointing bending test..…………………………………..…...…………………..57
Figure 5.1 Showing (a) Collapse slump, (b) Shear slump and (c) True slump…………………....68
x
PLATES
Plate 1.1 A sisal fibre mesh…………………………………………………..................................2
Plate 1.2 Woven jute fibres forming a sheet or felt………………………………..........................2
Plate 2.1 A sisal plant 18………………………………………………………............................15
Plate 2.2Sisal fibre being sun dried…………………....................................................................17
Plate 2.3 Graded sisal fibres……………………………...............................................................18
Plate 2.4 Sugarcane bagasse………………………………………………………………….......20
Plate 2.5 Cut cane stalks……………………………………………………………………….....21
Plate 2.6 A photo showing sun-dried bagasse (on the left) as compared to oven- dried
bagasse (on the right)………… ………………………….......…………………………..............24
Plate 2.7 Brown coir…………………………………………………………………………........25
Plate 2.8 Green coconut………………………………………………………………………......26
Plate 2.9 A white coir batch…………………………………………………………………........26
Plate2.10 People extracting coir fibre in Sri Lanka……………………………………………....29
Plate 2.11 A hair strand at 200× magnification ………………………….................................... 31
Plate 2.12 Human hair ready for mixing in concrete …………………………………….............33
Plate 2.13 A wall of bamboo fibre reinforcement in concrete,a form of green
construction……………………………………………................................................…............36
Plate 2.14The Pensmore-Chateau mansion……………………………………............................37
Plate 2.15 The birds eye view of the calabash like soccer city
stadium……………………………...............................................................................................38
Plate 2.16 Part of the inside of the soccer city stadium showing beams and
columns……………......................................................................................................................38
Plate 2.17 The ambience of modern vaulted ceilings in a French restaurant…………………....39
Plate 2.18 Showing the irrestible and timeless appeal of fibre reinforced cocncrete composites
ceilings……………………………………………………………………...................................39
Plate 2.19 The dome under construction…………………………………………………………40
Plate 2.20The dome when complete with cladding………………………………………...........41
xi
Plate 2.21 Showing a natural fibre reinforced concrete sidings giving the rough texture of a
wooden structure...........................................................................................................................42
Plate 3.1: Showing a ball of sisal fibre in the concrete mix……………………………………...46
Plate 3.2 NFRC cubes and cylinders ……………………………………………………….........46
Plate 3.3NFRC beam………………………………………………………………….................46
Plate 3.4 A beam being compacted on the vibrating table…………………………………….....47
Plate 3.5 Freshly cast NFRC concrete specimens in moulds…………………………….........…47
Plate 3.6 Double twisted sisal rope…………………………………………………………........48
Plate 3.7 A sisal twine……………………………………………………………………………48
Plate 3.8 Measurement of cover in double twisted sisal during
moulding………………………....................................................................................................48
Plate 3.9 Double twisted sisal rope during placement…………………………………………..49
Plate 3.10 Sisal twines during placement. ………………………………………………............49
Plate 3.11 Compaction factor apparatus
…………………………………………………………...............................................................50
Plate 3.12 Compaction Test on sisal fibre reinforced concrete………………………………...50
Plate 3.13 Showing (a) the tamping procedure, (b) the slump cone and (c) measuring the
slump…………………………………………………………………………………………......51
Plate 3.14 Compression testing machine………………………………………………...............52
Plate 3.15 A cube being tested for compressive strength……………………………………......53
Plate 3.16 Showing cylinder splitting tensile Test (a) side view and (b) front view……………
Plate 3.17 Showing cracks on a specimen subject to compression and horizontal
tension………………………………………………………………………………....................55
Plate 3.18 Flexural stress testing apparatus loading. …………………………………………....55
Plate 3.19 A beam under four-point…………………………………………………………......57
Plate 8.1Showing a storm drain made using glass and sisal fibre precast reinforced
concrete………………………………………………………………………………………....101
Plate 8.2 Carbon fibre reinforced tunnel in a mine in South Africa………………………........101
Plate 8.3 Concrete blocks made with chopped sisal fibres…………………………………......102
Plate 8.4 High-performance concrete piles which are fibre reinforced to reduce or eliminate
reinforcement, reduce amount of material, increase ductility and durability, and reduce
maintenance…………………………………………………………………………………….102
Plate 8.5 Showing a retaining wall with an external fibre reinforced concrete cladding to

xii
reduce cracks formation……………………………………………………………………..….103
Plate 8.6 Fiber reinforced polymer concrete filled shells used for lightly loaded structures. This
photo shows approximately five FRP concrete filled shells that are foundations for a foot
bridge…………………………………………………………………………………………...103
Plate 8.7 A column being renovated using a sisal fibre mesh strengthened with epoxy resin being
glued on the outside……………………………………………………………………….........104
Plate 8.8 Fibre Reinforced Shotcrete Drain……………………………………………….........104
xiii
TABLES
Table 2.1: Showing typical Properties of Synthetic Fibre………………………………….........12
Table 2.2: Showing typical Properties of Natural Fibres. …………………………........……….13
Table 2.3: Showing ministry of Agriculture Estimations on Coconut Production by District,
2004 ……………………………………………………………………………….......................28
Table 3.1: Showing different grades of concrete and their applications…………………………44
Table 3.2: Mixture constituents of the various concrete mixes.....................................................45
Table 4.1- sieve analysis results………………………………………………………………….59
Table 4.2: Showing the compaction factor results…………………………………………….....60
Table 4.3: Showing the slump test results…………………………………………………........61
Table 4.4: Showing results obtained from 7days compression test and the corresponding
compressive stress. ………………………………………………………….............................62
Table 4.5: Showing results obtained from 28days compression test and the corresponding
compressive stress……………………………………………………………….........................63
Table 4.6: Showing results obtained from splitting tensile test and the corresponding tensile
stress…………………………………………………………………………………...................64
Table 4.7: Showing results obtained from flexural/bending test and the corresponding flexural
stress…………………………………………………………………...........................................65
Table 4.8: Showing results obtained from flexural/bending test and the corresponding flexural
stress of parallel aligned sisal fibres……………………………………………….....................66
Table 5.1: Showing different consistency and compaction factor thereof…………………........67
Table 5.2: Comparison of the compaction factor and the slump of different
samples……………......................................................................................................................69
Table 8.1: Showing results obtained from compression test and the corresponding compressive
stress at 7days for all cubes tested………….....................………………………………………93
Table 8.2: Showing results obtained from compression test and the corresponding compressive
stress at 28days for all cubes tested……….........………………………………………………..94
xiv
CHARTS
Chart 4.1Particle distribution curve for fine aggregates…………………………………………59
Chart 5.1 Illustration of optimum fibre content in 28days compressive strength………………..70
Chart 5.2 Illustration of optimum fibre content in 28days compressive strength………………..71
Chart 5.3: Illustration of optimum fibre content in 28days flexural strength…………………....73
Chart 5.4: Showing a graph for compressive stress (N/mm2) Vs sisal fibre ….…………...........74
Chart 5.5: Showing bar graph for tensile stress Vs varying sisal fibre content………………….75
Chart 5.6: Showing line graph for tensile stress Vs varying sisal fibre content………………....76
Chart 5.7: Showing bar graph for flexural stress Vs varying sisal fibre content………………...76
Chart5.8: Showing line graph for flexural stress Vs varying sisal fibre content………………...77
Chart 5.9: Showing bar graph for compressive stress Vs varying coir fibre content……………77
Chart 5.10: Showing bar graph for compressive stress Vs varying coir fibre content…………..77
Chart 5.11: Showing bar graph for tensile stress Vs varying coir fibre content…………………77
Chart 5.12: Showing line graph for tensile stress Vs varying coir fibre content………………...78
Chart 5.13: Showing bar graph for flexural stress Vs varying coir fibre content………………..78
Chart 5.14: Showing line graph for flexural stress Vs varying coir fibre content. ..…………….79
Chart 5.15: Showing bar graph for compressive stress Vs varying bagasse fibre content………79
Chart 5.16: Showing line graph for compressive stress Vs varying bagasse fibre content……...80
Chart 5.17: Showing line graph for tensile stress Vs varying bagasse fibre content. …………...80
Chart 5.18: Showing bar graph for flexural stress Vs varying bagasse fibre content. ………......80
Chart 5.19: Showing line graph for flexural stress Vs varying bagasse fibre content…………...80
Chart 5.20: Showing bar graph for compressive stress Vs varying human hair fibre
content……………………………………………………………………………………………81
Chart 5.21: Showing line graph for compressive stress Vs varying human hair fibre
content……………………………………………………………………………………………81
Chart 5.22: Showing bar graph for tensile stress Vs varying human hair fibre content. ………..82
Chart- 5.23: Showing line graph for tensile stress Vs varying human hair fibre content………..82
Chart 5.24: Showing bar graph for flexural stress Vs varying human hair fibre
content. …………………………………………………………………………………………..83
Chart 5.25: Showing line graph for flexural stress Vs varying human hair fibre content
Chart ……………………………………………………………………………………………..83
xv
5.26: Bar graph showing7days flexural stress with varying fibre content for parallel aligned
sisal………………………………………………………………………………………………84
Chart 5.27: Bar graph showing7days flexural stress with varying fibre content for parallel aligned
sisal…………………………………………………………………………………….................84
Chart 8.1: Line graph showing the 7days compressive stress with varying fibre content.
……………………………………………………………………………………………………85
Chart 8.2: Line graph showing the 7days compressive stress with varying fibre content.
……………………………………………………………………………………………………85
Chart 8.3: Bar graph for 7days compressive stress with varying fibre content. ………………....95
Chart 8.5: Line graph showing the 7days tensile stress with varying fibre content. …....…….. .95
Chart 8.6: Line graph showing the 28days tensile stress with varying fibre content………….....96
Chart 8.7: Bar graph for 7days tensile stress with varying fibre content………………………...96
Chart 8.8: Bar graph for 28days tensile stress with varying fibre content……………………….96
Chart 8.9: Line graph showing the 7days flexural stress with varying fibre content ………........97
Chart 8.10: Line graph showing the 28days flexural stress with varying fibre content. ………...97
Chart 8.11: Bar graph showing7days flexural stress with varying fibre content. ……………….97
Chart 8.12: Bar graph showing 28days flexural stress with varying fibre content. ……………..97
Chart 8.13: Bar graph showing7days flexural stress with varying fibre content for parallel aligned
sisal.…………………………………………………………………………………….................98
Chart 8.14: Bar graph showing7days flexural stress with varying fibre content for parallel aligned
sisal. ……………………………………………………………………………………................99
Chart 8.15: Bar graph showing7days flexural stress with varying fibre content for parallel aligned
sisal. …………………………………………………………………………………….................99
Chart 8.16: Bar graph showing7days flexural stress with varying fibre content for parallel aligned
sisal. …………………………………………………………………………………….................99
1
CHAPTER ONE: INTRODUCTION
1.1 General
Advanced cement-based composites and the fundamental understanding of their behavior is an area
of civil engineering that is expanding rapidly. Cement-based components (also referred to here
generically as ―concrete‖) can be engineered to have outstanding combination of strength and
energy absorption capacity (ductility) that is fundamentally different from plain concrete made with
Portland cement. Conventional concrete is of brittle nature, which is strong in compression but
weak in tension, thus reinforcement is necessary to improve its tensile strength.
The science of incorporating one or more materials in concrete to improve strength and satisfy
design requirements is not new. Since the 17th Century, man has been known to make composite
materials to achieve the desired design strengths [1]
.
Mostly concrete is reinforced with steel bars .Over the years scientists have been doing research on
reinforcing concrete with fibres. The approach of replacing steel by incorporating the natural fibres
in concrete is termed as Natural Fibre Reinforced Concrete (NFRC).The use of fibre reinforced
concrete can be dated back since 1870‘s [1]
.Since then researchers have been working on concrete
reinforced with wood fibre, waste glass, sisal fibres and vegetable fibres such as elephant grass, and
many more. In particular, the natural fibres are sometimes used as reinforcement together with steel
in concrete so as to reduce cracking and spalling of the structures.
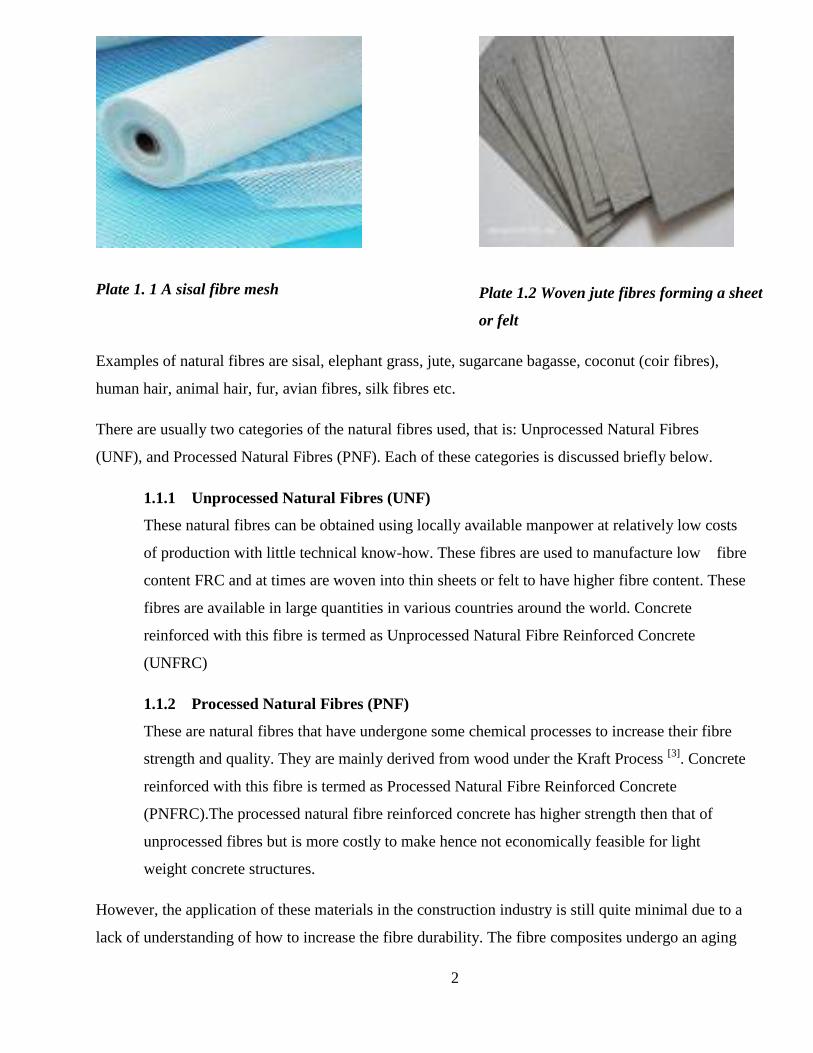
Natural fibres are hair like materials that are continuous filaments which are found in animals or
plants. The thickness of most fibres ranges from 12-29 microns. They can be used as component of
composite materials, for example concrete and mortar. They can also be twisted or woven into
sheets or felt as illustrated in Figure 1.1 and Figure 1.2 below.
2
Plate 1. 1 A sisal fibre mesh
Plate 1.2 Woven jute fibres forming a sheet
or felt
Examples of natural fibres are sisal, elephant grass, jute, sugarcane bagasse, coconut (coir fibres),
human hair, animal hair, fur, avian fibres, silk fibres etc.
There are usually two categories of the natural fibres used, that is: Unprocessed Natural Fibres
(UNF), and Processed Natural Fibres (PNF). Each of these categories is discussed briefly below.
1.1.1 Unprocessed Natural Fibres (UNF)
These natural fibres can be obtained using locally available manpower at relatively low costs
of production with little technical know-how. These fibres are used to manufacture low fibre
content FRC and at times are woven into thin sheets or felt to have higher fibre content. These
fibres are available in large quantities in various countries around the world. Concrete
reinforced with this fibre is termed as Unprocessed Natural Fibre Reinforced Concrete
(UNFRC)
1.1.2 Processed Natural Fibres (PNF)
These are natural fibres that have undergone some chemical processes to increase their fibre
strength and quality. They are mainly derived from wood under the Kraft Process [3]
. Concrete
reinforced with this fibre is termed as Processed Natural Fibre Reinforced Concrete
(PNFRC).The processed natural fibre reinforced concrete has higher strength then that of
unprocessed fibres but is more costly to make hence not economically feasible for light
weight concrete structures.
However, the application of these materials in the construction industry is still quite minimal due to a
lack of understanding of how to increase the fibre durability. The fibre composites undergo an aging

3
process in humid environments in which they may suffer a reduction in post-cracking strength and
toughness.
This durability problem is associated with an increase in fibre fracture and a decrease in fibre pull-out
due to the weakening of the fibres by a combination of alkali attack, fibre mineralization due to
migration of hydration products to lumens and to the middle lamella, and volume variation in these
fibres due to their high water absorption. A durable cement composite reinforced with natural fibres
should be produced in the construction industry, and research is underway to find suitable
admixtures. It has also been proven that the development of durable cementitious composites
reinforced by sisal fibre for semi-structural and structural purposes is possible [5]
.
1.2 Historical use
Historically, it is widely known that the Egyptians used to make mud bricks reinforced with sun dried
straws made from papyrus reeds in 1200-1400BC [2]
. At times they would also use horse-hair to
increase the mechanical strength in mortars. This is what led to the advent of conventional reinforced
concrete. Since the advent of fibre reinforcing of concrete in the 1940's, a great deal of testing has
been conducted on the various fibrous materials to determine the actual characteristics and
advantages for each product [2]
.
The use of some of the best known natural fibres was mostly limited to making things like ropes,
mats and fabrics. Only recently did scientist start carrying out researches on the use of fibres, and of
cement composites made with these fibres was undertaken. The results indicated that these natural
fibres can be successfully used in light concrete structures for walls, roofing and low-loaded
pavements. Subsequently, production and processing was started in countries in Asia, Africa and
Central America.
1.3 Applications
These Natural Fibres have been used mainly in the developing countries in Africa. Sisal fibre
reinforced concrete has been used to make roof tiles, corrugated sheets, pipes, silos, gas and water
tanks. Elephant grass reinforced concrete and mortar sheets are used in Zambia for low cost housing
projects. Sisal and coconut fibres are also being used to make cement composite panel lining, eaves,
soffits and for sound insulation. The durability of these products under conditions of outdoor
exposure has been demonstrated to be around 10years of commercial use of these products.

4
1.4 Advantages and Disadvantages of natural fibre reinforced concrete
• Advantages
1. Are more resistant to cracking and reduce internal forces by blocking microscopic cracks from
forming within the concrete.
2. Lighter than traditional concrete [16]
and as a result substantial weight saving can be realized
using relatively thin NFRC sections having the equivalent strength of thicker plain concrete
sections.
3. Has a unique crack behavior in that it maintains a crack width below 100µm when loaded
beyond the elastic range [15]
.
4. Has an advantage over steel since corrosion does not take place at its interface with concrete
[17]. Suitable for structures where corrosion is to be avoided at maximum.
• Disadvantages
The main disadvantage of NFRC is in the placement of the fibres in concrete mix as sometimes
balling occurs.
However, the advantages of NFRC override the disadvantages.
1.5 Objective and aim of the study.
1.5.1 General Objective
The main aim of this research is to investigate the performance of natural fibres as micro
reinforcement in concrete mixes when used to improve the mechanical properties of the concrete.
1.5.2 Specific Objective
To characterize the natural fibre reinforced concrete using experimental methods on their mechanical
strength.
The objectives will be achieved by testing different concrete cubes and beams which have been cast
with a varying fibre content percentage by weight of cement. From a control of 0% fibre content, then
increasing the fibres as follows 1%, 2% and 3%.The tests to be done are the cube crushing tests and

5
the flexural bending tests. Tensile strength of the fibres will be tested using the indirect method of
splitting cylinder test.
The natural fibres used in this study were:
• Sisal fibre
• Sugarcane bagasse
• Coconut (coir) fibres
• Human hair

6
CHAPTER TWO: LITERATURE REVIEW
2.1 Chemical properties of Portland cement
Concrete is a mixture of cement (commonly Portland cement), aggregates (gravel and sand), water
and admixtures. In 1824 Joseph Aspdin invented the modern cement which known as Portland
cement. It is obtained by mixing together calcareous material, such as limestone or chalk (CaCO3)
and argillaceous materials such as clay or shale (SiO2, AL2O3) at clinkering temperature (1500 °C)
and girding the resulting clinker[7-9]
. The main compounds which form Portland cement are
Tricalcium Silicate (C3S) which represents 45-55% and it is responsible for early strength, Dicalcium
Silicate (C2S) which represents 20-25% and it is responsible for strength at later ages, Tricalcium
Aluminate (C3A) which represents 10-12% and it facilitates the combination of lime and silica, and
Tetracalcium Aluminoferrite (C4AF) which represents 4-8% and it accelerate the hydration of the
silicates. Gypsum (CaSO4) is added in small amounts during clinker grinding to control the setting
time of the finished cement [10]
.
When water is added to cement powder, a chemical reaction-referred to as hydration, takes place (in
the paste formed) and a supersaturated solution of the hydrated compounds is formed which
eventually coagulates to form an amorphous mass called gel. This is the reaction by virtue of which
Portland cement becomes a bonding agent, the hydrated cement bonding firmly to the untreated
cement any other aggregate or filler material present.
A complete reaction of all the cement constituents with the main hydration productions as Tricalcium
Disilicate (3 CaO.SiO2.2H2O) is given below [7, 10]
;
• Tricalcium Silicate hydration:-
2(3CaO.SiO2) + 6H2O →3CaO.2SiO2.3H2O = 3 Ca(OH) 2
• Dicalcium Silicate hydration:-
2(2CaO.SiO2) + 4H2O →3CaO.2SiO2.3H2O + Ca(OH) 2
• Tricalcium Aluminate hydration:-
3CaO.Al2O3 + 6H2O →3CaO.Al2O3.6H2O
7
Ferric Oxide reacts with lime giving compounds analogous to those formed by Alumina; and the
hydration reaction represented as follows:
4CaO.Al2O3.Fe2O3 + 2Ca (OH) 2 + 10H2O →3CaO.Al2O3.6H2O + 3CaO.Fe2O3.6H2O
The Aluminate components react only after all the gypsum added to clinker has reacted completely.
When in contact with water, the gypsum reacts with aluminate compounds precipitating finally as
calcium sulpho-aluminate as shown below [7]
;
3CaO.Al2O3 + 3CaSO4 + 32H2O →3CaO.Al2O3.3CaSO4.32H2O
The hardened cement paste consists of hydrates of the various compounds discussed above, crystals
of Ca(OH) 2, some minor components, unhydrated cement and voids in form of gel pores and
capillary pores. These voids are normally filled with water but become minimised as hydration
proceeds and the products of hydration slowly deposited. The gel pores are approximately 15-20Ao in
diameter, while the capillary pores are estimated to be about 1.3 µm [10]
.
2.2 Fibre Reinforcing Mechanism
The main role of the fibres in cement paste and mortar is secondary reinforcement by modifying the
mechanical behaviour of the cementitious matrix. Specifically, the fibres account for improvement of
ductility of the composite and modification of cracking mechanism.
Concrete carries flaws and micro-cracks both in the material and at the interfaces even before an
external load is applied. These defects and micro-cracks emanate from excess water, bleeding, plastic
settlement, thermal and shrinkage strains and stress concentrations imposed by external restraints [17]
.
Under an applied load, distributed micro-cracks propagate coalesce and align themselves to produce
macro-cracks. When loads are further increased, conditions of critical crack growth are attained at the
tips of the macro-cracks and unstable and catastrophic failure occurs.
The micro and macro-fracturing processes described above can be favourably modified by adding
suitable fabrics of various suitable materials. Thus fabrics not only suppress the formation of cracks,
but also prevent further propagation and growth of these cracks.
Soon after placement, evaporation of the mix water and the process of concrete hydration create
shrinkage strains in concrete. If restrained, this contraction can cause stresses far in excess of those
needed to cause cracking. In spite of every effort, plastic shrinkage cracking remains a serious

8
concern, particularly in large surface area placements for instance slabs on grade, thin surface repairs,
patching and shot Crete linings. With large surface areas, fabrics engage water in the mix and reduce
bleeding and segregation. The result is that there is less water available for evaporation and less
overall free shrinkage [18]
. When combined with post-crack bridging capability of fabrics, fabrics
reduce crack widths and crack areas when concrete is retrained.
In the hardened state, when fabrics are properly bonded, they interact with the matrix at the level of
micro-cracks and effectively bridge these cracks thereby providing stress transfer media that delays
their coalescence and unstable growth. If the fabric volume fraction is sufficiently high, this may
result in an increase in the tensile strength of the matrix. Indeed, for some high volume fraction fabric
composite, a notable increase in the tensile/flexural strength over and above the plain matrix has been
reported. Once the tensile capacity of the composite is reached, and coalescence and conversion of
micro-cracks to macro-cracks has occurred, fabrics, depending on their length and bonding
characteristics continue to restrain crack opening and crack growth by effectively bridging across
macro-cracks. This post-peak macro-crack bridging is the primary reinforcement mechanism in the
majority of commercial fabric reinforced concrete composites.
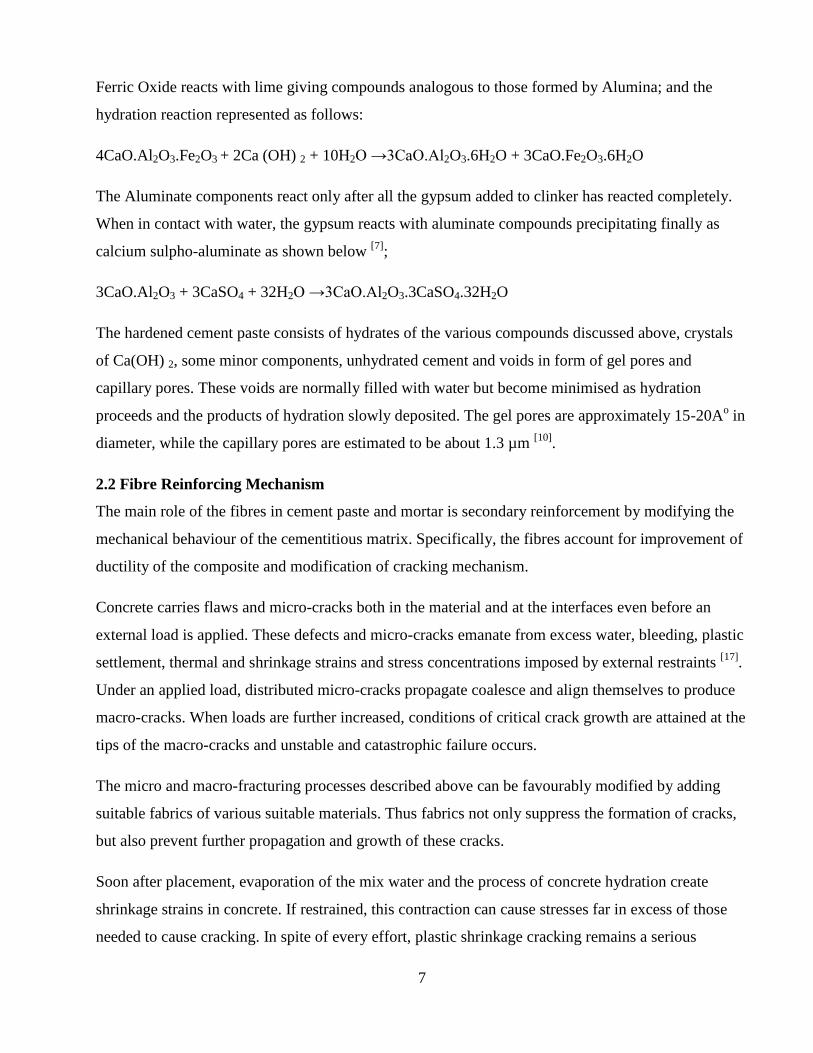
Figure 2.0.1 Tensile Load versus Deformation for Plain and Fibre Reinforced Concrete
The behavior of FRC under loading can be understood from the Figure 2.1 above. The plain concrete
structure cracks into two pieces when the structure is subjected to the peak tensile load and cannot
9
withstand further load or deformation. The fibre reinforced concrete structure cracks at the same peak
tensile load, but does not separate and can maintain a load to very large deformations. The area under
the curve shows the energy absorbed by the FRCs when subjected to tensile load. This can be termed
as the post cracking response of the FRCs.
In Fibre Reinforced Composites (FRCs) with low to medium volume fraction of fibres, fibres do not
enhance the tensile/flexural strength of the composite and benefits of fibre reinforcement are limited
to energy absorption or toughness enhancement in the post-cracking regime only. On the other hand,
for high performance fibre reinforced with a high fibre dosage, benefits of fibre reinforcement are
noted in an increased tensile strength, strain-hardening response before localization and enhanced
toughness beyond the crack localization.
2.3 Fibre-Matrix Bond
For fibres that are hydrophobic (do not absorb water), the bonding with cementitious matrices is not
chemical, but bonding is rather by mechanical interaction [19]
.
As in any fabric reinforced composite, fabric-matrix bond in FRC is of critical importance. However,
unlike fibre reinforced polymers (FRPs) used in aerospace and automobile industries where fibres are
employed to enhance strength and elastic modulus, in FRCs, ‗toughness‘ or energy absorption
capability is of primary interest. Therefore, inelastic bond failure mechanisms such as interfacial
crack growth, crack tortuosity and fibre slip are of greater relevance. Fibre pull-out tests are often
performed to assess fibre efficiency in FRC and in such tests fibre bond and slip are monitored
simultaneously [4, 20]
.
For a fibre embedded in a cementitious matrix and subjected to a pull-out load, shear-lag will occur
and interfacial debonding will begin to occur at the point of fibre entry which will slowly propagate
towards the free end of the fibre. Thus, some energy absorption will occur at the fibre-matrix
interface while the bond is being mobilized and the fibre prepares to slip.
Most commercial macro-fibres of steel and other materials (polypropylene, for example) are now
deformed to enhance their bond with the surrounding matrix. However, even here there is a limit. If
deformed excessively, fibres may develop stresses that exceed their strength and fracture in the
process. The energy absorption in such cases is limited, and although some fibre slippage may
10
precede fracture, poor toughening ensues. For maximized fibre efficiency, a pull-out mode of fibre
failure where pull-out occurs at a fibre stress close to its tensile strength is preferred. It is important to
mention that fibre failure mode is highly dependent on the angle at which fibre is inclined with
respect to the direction of the pull-out force. But when the fibres are woven into a fabric, the angle of
direction of pull-out force has a slight lesser effect on the failure mode due to intra-fabric bonding.
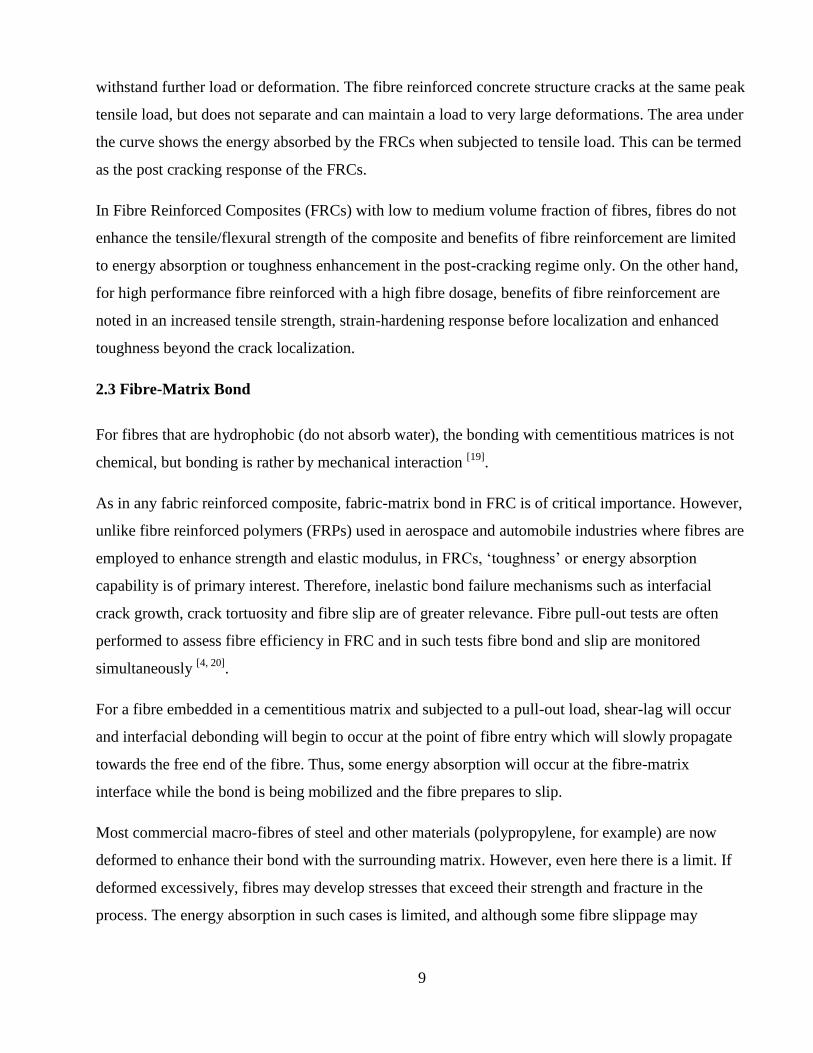
2.4 Fibre critical fracture length
The fibre should be embedded in the matrix for a minimum length for effective strengthening and
stiffening of the composite material i.e. NFRC. The fibre critical fracture length is defined as twice
the length of fibre embedment which will cause fibre failure during pull-out.
Figure 2.2 Illustration of fibre critical length under tension
From the above schematic, the fibre critical fracture length, lc, can be calculated from equation below
lc= fud/2 s
Assuming ultimate fibre tensile strength ( fu), fibre diameter (d), and the shear stress (2 s) developed
at the interface are all uniform.
The fibres for which length is greater than lc are called continuous fibre (I>15lc). Discontinuous fibres
have shorter lengths than 15 lc.
Continuous fibre composites can be either single layer or multilayered. The single layer continuous
fibre composites can be either unidirectional or woven, and multilayered composites are generally
referred to as laminates. The material response of a continuous fibre composite is generally
orthotropic.
11
Material systems composed of discontinuous reinforcements are considered single layer composites.
The discontinuities can produce a material response that is anisotropic, but in many instances the
random reinforcements produce nearly isotropic composites.
The combination of more than one fibre is termed as the Hybrid fibres.
If the length of the fibre is less than lc , the matrix deforms around the fibre such that there is no stress
transference and little reinforcement by the fibre.
For good effectiveness, the fibre should have sufficient length to ensure that failure occurs by
complete pull-out of the fibre from the matrix before the rupture of the fibre due to tensile forces.
The critical fracture length of fibres in FRC composites has been found to be between 18 and 24 mm
[36].When a fibre reinforced concrete specimen is under tension, at a given strength there is a break of
the elastic bond between the fibre and the matrix, the fibre starts to pull out. The force resisting pull-
out is not proportional to the length of embedment but is dominated by the highest local resistances
present due to the fibre morphology. As pull-out proceeds, anchor spots developed and the force
required rises or falls in an apparently random manner. When the anchorage is too strong to be
dislodged by the maximum force the fibre can carry, tensile fracture of the fibre occurs.
There is a "critical fracture length" of embedment for each fibre type, e.g. for the sisal fibre it is
approximately 30 mm. When the embedment is shorter, fibre tends to be pulled out, and when it is
longer they tend to break. This "critical fracture length‖ is not the length for which a uniformly
distributed frictional stress reaches its critical values under the maximum sustainable tensile load, as
is commonly assumed as in the equation above, but it corresponds to the length around which the
probability of a local strong anchorage becomes high[36]
.
2.5 Chemical and Physical Properties of Different Fibres
Synthetic Fibres
Synthetic fibres are man-made fibres resulting from research and development in the petrochemical
and textile industries. There are two different physical fibre forms: monofilament fibres and fibres
produced from fibrillated tape. Currently there are two different synthetic fibre volumes used in
application, namely low-volume percentage (0.1 to 0.3% by volume) and high-volume percentage

12
(0.4 to 0.8% by volume). Most synthetic fibre applications are at the 0.1% by volume level. At this
level, the strength of the concrete is considered unaffected and crack control characteristics are
sought. Fibre types that have been tried in cement concrete matrices include: acrylic, aramid, carbon,
nylon, polyester, polyethylene and polypropylene. Table 1 summarizes the range of physical
properties of some synthetic fibres.
Fibre type Equivalen
t
diameter
μm
Relative
Density
Tensile
strength
MPa
Elasti
c
modu
lus
GPa
Ultimate
elongatio
n
%
Ignition
temperatu
re
°C
Melt,
oxidation,
or
decomposit
ion
temperatur
e °C
Water
absorption
per
ASTM D
570,
% by
mass
Acrylic 13 - 104 1.16 -1.18 270 - 1
000
14 -
19
7,5 -
50,0
- 220 - 235 1.0 – 2.5
Aramid I 12 1.44 2900 60 4.4 high 480 4.3
Aramid II+
10 1.44 2350 115 2.5 high 480 1.2
Carbon, PAN
HM
8 1.6-1.7 2500-
3000
380 0.5-0.7 high 400 Nil
Carbon, PAN
HT§
9 1.6-1.7 3450-
4000
230 1.0-1.1 high 400 Nil
Carbon, pitch
GP**
10-13 1.6-1.7 480-790 27-35 2.0-2.4 high 400 3-7
Carbon, pitch
HP††
9-18 1.8-2.15 1500-
3100
150-
480
0.5-1.1 high 500 Nil
NylonΔΔ
23 1.14 970 5 20 - 200-220 2.8-5.0
Polyester 20 1.34-1.39 230-
1100
17 12-150 600 260 0.4
PolyethyleneΔ
Δ
25-1000 0.92-0.96 75-590 5 3-80 - 130 Nil
Polypropylene
ΔΔ
- 0.90-0.91 140-700 3.5-
4.8
15 600 165 Nil
Notes
* Not all fibre types are currently used for commercial production of FRC
† High modulus
Δ Polyacrylonitrile based, high modulus
§ Polyacrylonitrile based, high tensile strength
** Isotropic pitch based, general purpose
†† Mesophase pitch based, high performance
ΔΔ Data listed is only for fibres commercially available for FRC
Table 2.1: Showing typical Properties of Synthetic Fibres.

13
Natural Fibres
Natural reinforcing materials can be obtained at low cost and low levels of energy using local
manpower and technology. Utilization of natural fibres as a form of concrete reinforcement is of
particular interest to less developed regions where conventional construction materials are not readily
available or are too expensive. Sisal-fibre reinforced concrete has been used for making roof tiles,
corrugated sheets, pipes, silos and tanks. Elephant-grass-reinforced mortar has been used for low-cost
housing projects. Wood-cellulose-fibre reinforced cement has commercial applications in the
manufacture of flat and corrugated sheet and non-pressure pipes. Typical properties of natural fibres
are shown in Table 2.
Fibre type
Fibre
length
[mm]
Fibre
diameter
[mm]
specific
gravity
Modulus of
elasticity
[106 MPa]
Ultimate
tensile
strength
[103 MPa]
Elongation
at break
[%]
Water
absorption
[%]
Coconut 51-102 0.10-0.41 1.12-1.15 19-26 120-200 10-25 130-180
Sisal N/A N/A N/A 13-26 276-568 3-5 60-70
Sugar cane
Bagasse N/A 0.20-0.41 1.2-1.3 15-19 184-290 N/A 70-75
Bamboo N/A 0.05-0.41 1.5 33-40 350-500 N/A 40-45
Jute 178-305 0.10-0.20 1.02-1.04 26-32 250-350 1.5-1.9 N/A
Flax 508 N/A N/A 100 1000 1.8-2.2 N/A
Elephant
grass N/A N/A N/A 4.9 178 3.6 N/A
Water reed N/A N/A N/A 5.2 70 1.2 N/A
Plantain N/A N/A N/A 1.4 92 5.9 N/A
Musamba N/A N/A N/A 0.9 83 9.7 N/A
Wood fibre
(kraft pulp) 3-5 0.03-0.08 1.5 N/A 700 N/A 50-75
Human hair 5-50 0.017-0.1 N/A 30 N/A
Table 2.2: Showing typical Properties of Natural Fibres.

14
2.6 Materials with Extractable Fibres.
There are various materials with extractable fibres. The most considered natural materials are from
plants and include:
Sisal fibre
Coconut (coir) fibre
Elephant grass fibre
Sugarcane bagasse fibre
Bamboo fibre
Jute fibre
Water reed fibre
Plantain fibre
Palm fibre
Wood fibre
However, natural fibres from animals have also become common and there are studies on human
hair and animal (mainly horse) hair as a structural material [11]
.
Considering the availability of these materials locally in Kenya, this research was narrowed
down to study four of the natural fibres. These are:
Sisal fibre
Sugar cane bagasse fibre
Coconut (coir) fibre
Human hair
A brief description of these materials which are available in Kenya is discussed below.

15
2.6.1 Sisal Fibre
The sisal plant, scientifically known as Agave Sisalana, is a perennial monocot that consists of a
rosette of sword-shaped leaves about 1.5 to 2m long. The leaves yield a stiff fibre traditionally
used for making twine and rope. Sisal fibre is derived from the leaves of the sisal plant usually
by manually scrapping the leaf or by machine decortications. It has its origin in Central America
where, from early times, wild growths have been exploited for their fibres for indigenous uses [6]
.
Plate 2.1 A sisal plant
.
2.6.1.1 Growing Conditions In Kenya
Sisal is the only plant that resists the semi-arid climate conditions. The sisal plant does well in
tropics and subtropics at temperatures above 25 degrees Celsius and a lot of sunshine. The plant
has a 7-10 year life span and typically produces 200-250 commercially usable leaves. Brazil is
the largest sisal producer in the world at 45,000 tons/year, followed by China at
36,000tons/year.; Tanzania at 24,000 tons/year; Kenya at 25,000 tons/year; and Madagascar at
15,000 tons/year [12]
.
The sisal plant is propagated by using bulbils produced from bulbs in the flower stalk or by
suckers growing around the base of the plant, which are grown in nursery fields until large
enough to be transplanted into their final position. Invitro multiplication of selected genetic
16
materials using meristematic tissue culture (MST) has been considered to offer considerable
potential for the development of improved genetic material [13]
.
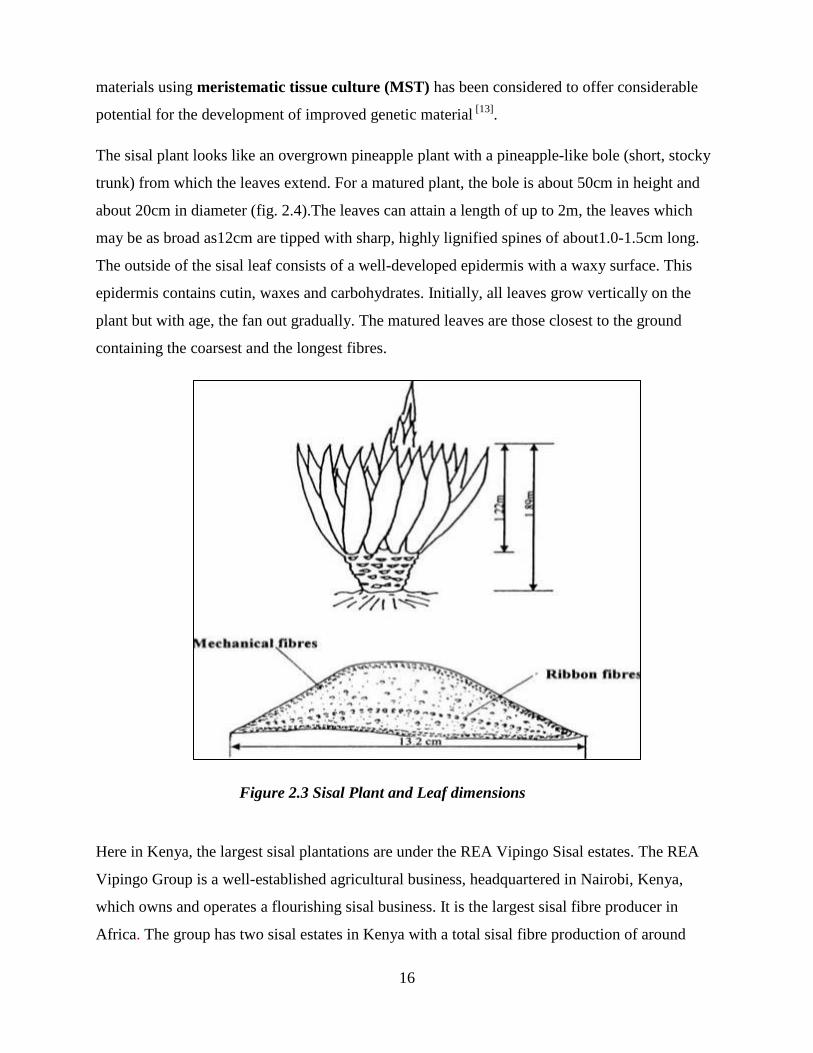
The sisal plant looks like an overgrown pineapple plant with a pineapple-like bole (short, stocky
trunk) from which the leaves extend. For a matured plant, the bole is about 50cm in height and
about 20cm in diameter (fig. 2.4).The leaves can attain a length of up to 2m, the leaves which
may be as broad as12cm are tipped with sharp, highly lignified spines of about1.0-1.5cm long.
The outside of the sisal leaf consists of a well-developed epidermis with a waxy surface. This
epidermis contains cutin, waxes and carbohydrates. Initially, all leaves grow vertically on the
plant but with age, the fan out gradually. The matured leaves are those closest to the ground
containing the coarsest and the longest fibres.
Figure 2.3 Sisal Plant and Leaf dimensions
Here in Kenya, the largest sisal plantations are under the REA Vipingo Sisal estates. The REA
Vipingo Group is a well-established agricultural business, headquartered in Nairobi, Kenya,
which owns and operates a flourishing sisal business. It is the largest sisal fibre producer in
Africa. The group has two sisal estates in Kenya with a total sisal fibre production of around

17
12,000 tons per annum. The sisal plantations are in Kimbwezi, a few kilometers from the capital
city-Nairobi, and at Kilifi, closer to the second city of Mombasa.
2.6.1.2 Fibre Extraction and treatment
The sisal fibre is extracted by a process called decortication, where leaves are crushed and beaten
by rotating wheel set with blunt knives, so that only fibres remain. In Kenya, the leaves are
transported to a central decortication plant, where water is used to wash away the waste parts of
the plant. Superior fibre quality is found in East Africa mainly Kenya and Tanzania [14]
. Clean
water is used to wash away the green sap after the extraction.
Plate 2.2Sisal fibre being sun dried
After washing, the fibre is sun-dried. Proper drying is important as the quality of fibre depends
largely on the moisture content. Artificial drying has been seen to be better than sun drying but is
not economically feasible in developing countries where sisal is mostly produced.
The sisal fibre is then graded into three different grades depending on the quality and strength of
the fibre.
The higher-grade fibre is type 1/Grade I, converted into yarns and used in car industry as
reinforcement with asbestos or fibre glass.
The medium grade fibre is type 2/Grade II, in cordage industry for making rope and
twine.
The lower grade fibre is type 3/Grade III, mainly used in paper industry.
18
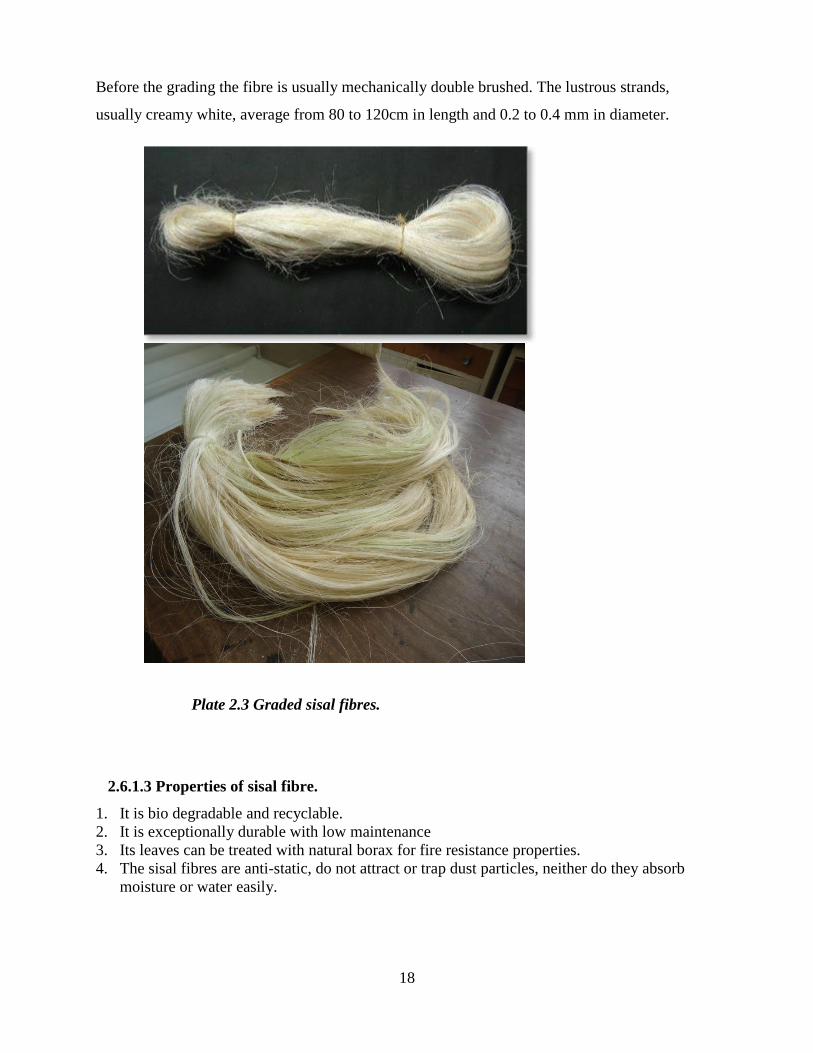
Before the grading the fibre is usually mechanically double brushed. The lustrous strands,
usually creamy white, average from 80 to 120cm in length and 0.2 to 0.4 mm in diameter.
Plate 2.3 Graded sisal fibres.
2.6.1.3 Properties of sisal fibre.
1. It is bio degradable and recyclable.
2. It is exceptionally durable with low maintenance
3. Its leaves can be treated with natural borax for fire resistance properties.
4. The sisal fibres are anti-static, do not attract or trap dust particles, neither do they absorb
moisture or water easily.
19
2.6.1.4 Environmental impact
No chemicals are used in sisal farming, and the occasional herbicides used have negligible
effects on the soil and ground water. Initially it caused environmental degradation since farmers
were clearing forests for sisal plantations, but this has been curbed by the introduction of
agroforestry. The effluent from decortication process causes serious pollution when allowed to
flow into rivers. There are plans to use it as a bio fuel.
2.6.2 Sugarcane Bagasse Fibre
Sugarcane is a tall perennial plant that belongs to the grass family, which has fibrous stalks that
are rich in sugar, and measure two to six meters (6-19 ft.).There are about 32 species of
sugarcane and are scientifically called the genus name Saccharum.
Sugarcane is the world‘s largest crop [21]
.In 2010, FAO estimated its cultivation to be about 23.8
million hectares in more than 90 countries, with a world harvest of about 1.69 billion tons [22]
.The
average yield of cane stalk is 60-70 tons per hectare per year. Sugarcane is a cash crop but is also
used for livestock folder.
The mature sugarcane stalks are mechanically crushed to extract the juice which is used to
produce sugar. This accounts for 80% of sugar in the world. (The other 20% is from beetroots
and artificial sugars) .The remaining solid, which is fibrous in nature, after the crushing is known
as sugarcane bagasse.

20
Plate 2.4 Sugarcane bagasse.
It is mainly used as a bio-fuel, animal feed, and in the manufacture of pulp and building
materials. In some regions, people use sugarcane reeds to make pens, mats, screens, and thatch.
2.6.2.1 Growing Conditions and Production in Kenya
Sugarcane is a tropical plant that is sensitive to the climate, soil type, irrigation, fertilizers,
insects, disease control, varieties and harvest period. It thrives best in tropical hot sunny areas, at
a latitude of 36.7o N and 31.0
o S, from a sea level of altitude 1000m or more. It requires a long
warm growing season with high incidence of solar radiation and adequate moisture .And a fairly,
sunny and cool but frost free ripening and harvesting period. Rainfall of 1100-1500mm is
adequate provided the distribution is right, followed by a dry period for ripening. A temperature
of 30oC-34
oC is required during the vegetative state, but lowers to 15
oC-19
oC during ripening.
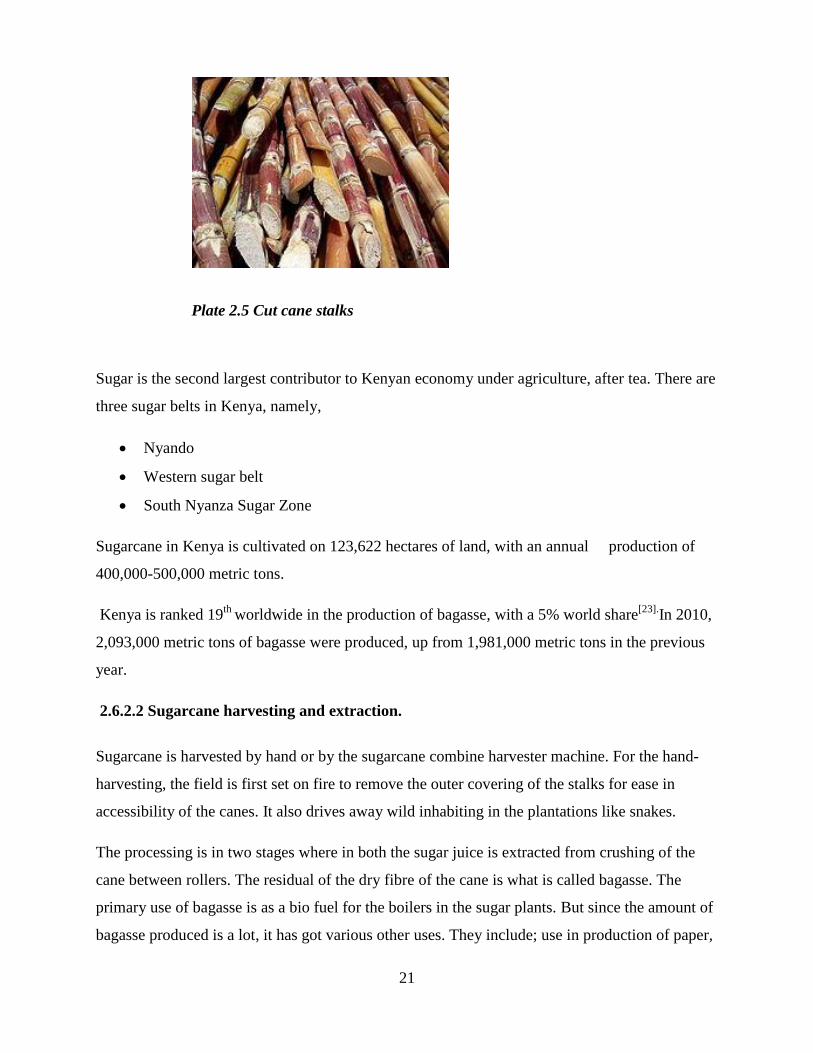
The most common mode of reproduction of sugarcane is by stem cutting. Each cutting must at
least contain one bud, and the cuttings are sometimes hand-planted. In developed countries like
the USA, they use billet planting method which is mechanized.
21
Plate 2.5 Cut cane stalks
Sugar is the second largest contributor to Kenyan economy under agriculture, after tea. There are
three sugar belts in Kenya, namely,
Nyando
Western sugar belt
South Nyanza Sugar Zone
Sugarcane in Kenya is cultivated on 123,622 hectares of land, with an annual production of
400,000-500,000 metric tons.
Kenya is ranked 19th
worldwide in the production of bagasse, with a 5% world share[23].
In 2010,
2,093,000 metric tons of bagasse were produced, up from 1,981,000 metric tons in the previous
year.
2.6.2.2 Sugarcane harvesting and extraction.
Sugarcane is harvested by hand or by the sugarcane combine harvester machine. For the hand-
harvesting, the field is first set on fire to remove the outer covering of the stalks for ease in
accessibility of the canes. It also drives away wild inhabiting in the plantations like snakes.
The processing is in two stages where in both the sugar juice is extracted from crushing of the
cane between rollers. The residual of the dry fibre of the cane is what is called bagasse. The
primary use of bagasse is as a bio fuel for the boilers in the sugar plants. But since the amount of
bagasse produced is a lot, it has got various other uses. They include; use in production of paper,
22
paperboards, production of chemicals and construction industry as a cement base. Researchers
are now using the bagasse as a micro-reinforcement in cement based composites.
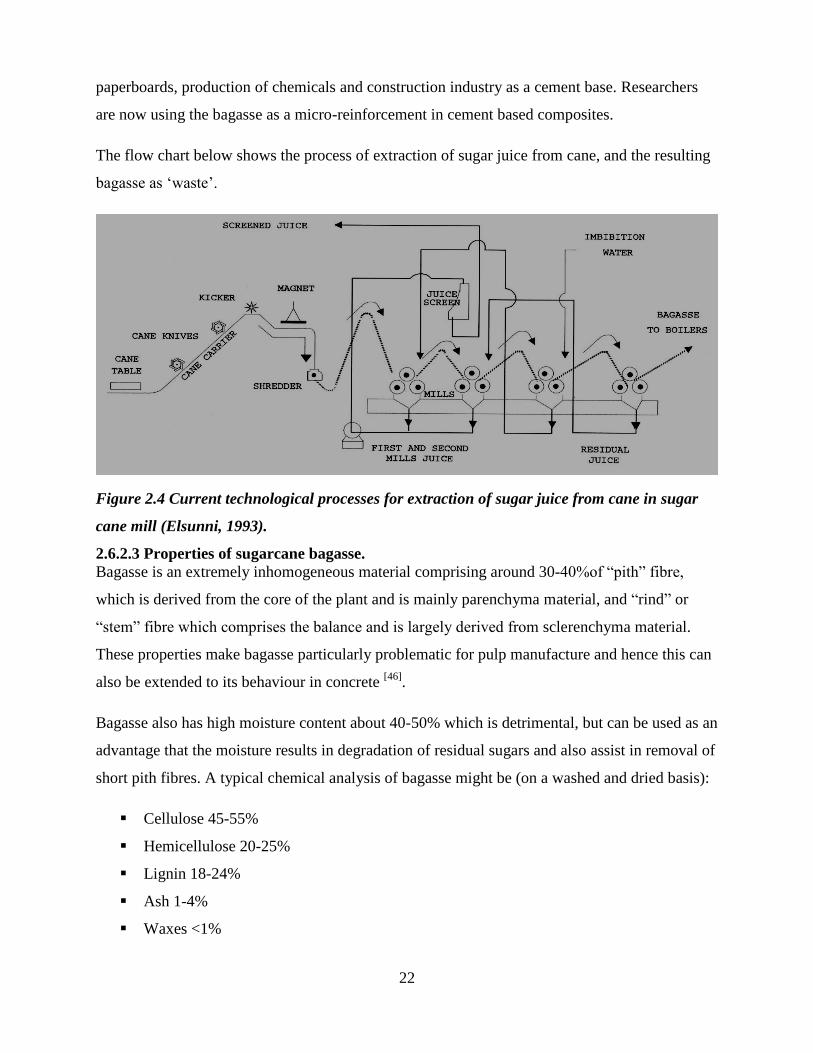
The flow chart below shows the process of extraction of sugar juice from cane, and the resulting
bagasse as ‗waste‘.
Figure 2.4 Current technological processes for extraction of sugar juice from cane in sugar
cane mill (Elsunni, 1993).
2.6.2.3 Properties of sugarcane bagasse. Bagasse is an extremely inhomogeneous material comprising around 30-40%of ―pith‖ fibre,
which is derived from the core of the plant and is mainly parenchyma material, and ―rind‖ or
―stem‖ fibre which comprises the balance and is largely derived from sclerenchyma material.
These properties make bagasse particularly problematic for pulp manufacture and hence this can
also be extended to its behaviour in concrete [46]
.
Bagasse also has high moisture content about 40-50% which is detrimental, but can be used as an
advantage that the moisture results in degradation of residual sugars and also assist in removal of
short pith fibres. A typical chemical analysis of bagasse might be (on a washed and dried basis):
Cellulose 45-55%
Hemicellulose 20-25%
Lignin 18-24%
Ash 1-4%
Waxes <1%

23
Research has shown that this hemicellulose can interfere with the binding action of the cement in
concrete mix. Hence the hemicellulose can be reduced by treating the bagasse samples with 1N
NaOH or 1 N H2SO4 for 24 hours i.e. soaking them.
2.6.2.4 Comparison between oven dried bagasse and sun dried (raw) bagasse
The bagasse fibre has a lot of sucrose left on it and hence it is washed in clean cold water before
use so as to remove the sucrose. Drying is necessary to remove the excess water before
incorporating it in the concrete mix so as not to upset the water-cement ratio. During this study it
was noted that there is a very big difference between oven dried bagasse and sun dried bagasse,
not just physically but also chemically.
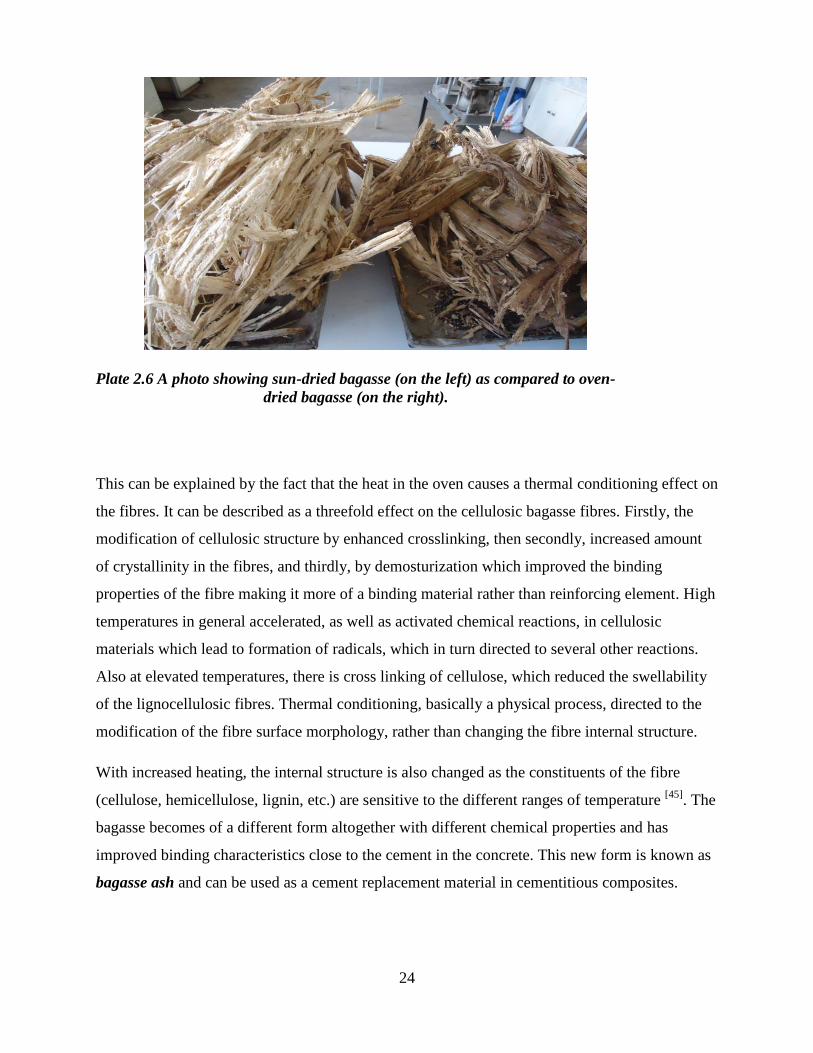
A sample of bagasse was put in the conventional oven for 24hours, and a second sample was left
to dry in the open. The two samples had clear visually observable differences as shown in figure
2.9 below. By touch, the oven dried bagasse tended to break apart while the sun dried bagasse
was still strong.
The oven dried bagasse is burnt on the outside since the heat is generated outside and conveyed
by conduction or convection. Hence, the surface gets heated first and afterwards the heat flowed
towards the inside, which always remained colder than the outer surface. In this conventional
method of heating, since the heat was transferred molecule by molecule from the outside to the
inside, hence oven drying displayed the effect of overheating the outer surface of the material
[44].
24
Plate 2.6 A photo showing sun-dried bagasse (on the left) as compared to oven-
dried bagasse (on the right).
This can be explained by the fact that the heat in the oven causes a thermal conditioning effect on
the fibres. It can be described as a threefold effect on the cellulosic bagasse fibres. Firstly, the
modification of cellulosic structure by enhanced crosslinking, then secondly, increased amount
of crystallinity in the fibres, and thirdly, by demosturization which improved the binding
properties of the fibre making it more of a binding material rather than reinforcing element. High
temperatures in general accelerated, as well as activated chemical reactions, in cellulosic
materials which lead to formation of radicals, which in turn directed to several other reactions.
Also at elevated temperatures, there is cross linking of cellulose, which reduced the swellability
of the lignocellulosic fibres. Thermal conditioning, basically a physical process, directed to the
modification of the fibre surface morphology, rather than changing the fibre internal structure.
With increased heating, the internal structure is also changed as the constituents of the fibre
(cellulose, hemicellulose, lignin, etc.) are sensitive to the different ranges of temperature [45]
. The
bagasse becomes of a different form altogether with different chemical properties and has
improved binding characteristics close to the cement in the concrete. This new form is known as
bagasse ash and can be used as a cement replacement material in cementitious composites.

25
2.6.3 Coconut (Coir) Fibre
The fibre that is extracted from the coconut fruit is called coir. Coir is the fibrous material from
the husk of a coconut and has a variety of uses such as floor mats, brushes, mattresses, etc. There
are typically two varieties of coir depending on the stage of growth of the coconut fruit:
Brown coir
White coir
The coconut husk is available in large quantities as residue from coconut production in many
areas, which is yielding the coarse coir fibre. Coir is a ligno cellulosic natural fibre. It is a seed
hair fibre obtained from the outer cell, or husk of the coconut. The total world coir production is
250000 tonnes. The coir fibre industries are particularly important in some areas of the
developing world. Over 50% of the coir fibre produced annually throughout the world is
consumed by in the countries of origin, mainly India.
2.6.3.1 Varieties of Coir
2.6.3.1.1 Brown coir
It is harvested from a ripe brown coconut. The coir is mainly used for making upholstery
padding, sacks, etc. It is thick, strong and has high abrasion resistance. It contains more lignin
and less cellulose compared to other fibres such as flax. And for these, it is less flexible.
Plate 2.7 Brown coir.
26
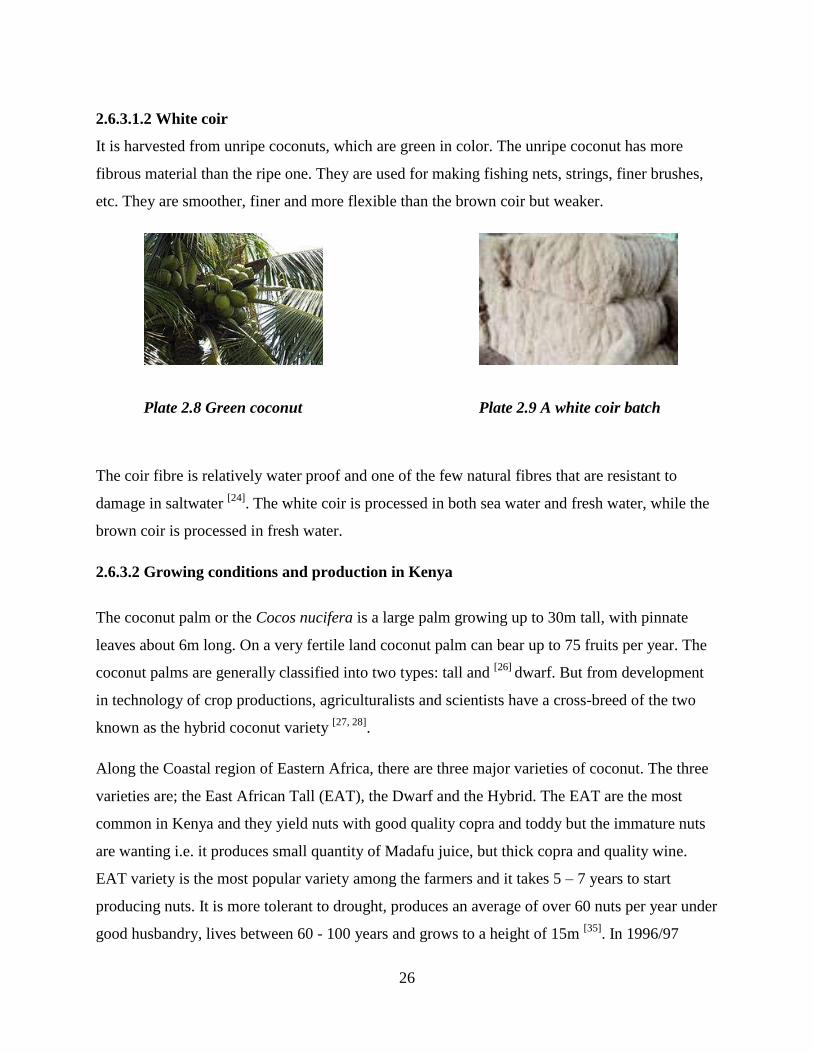
2.6.3.1.2 White coir
It is harvested from unripe coconuts, which are green in color. The unripe coconut has more
fibrous material than the ripe one. They are used for making fishing nets, strings, finer brushes,
etc. They are smoother, finer and more flexible than the brown coir but weaker.
Plate 2.8 Green coconut
Plate 2.9 A white coir batch
The coir fibre is relatively water proof and one of the few natural fibres that are resistant to
damage in saltwater [24]
. The white coir is processed in both sea water and fresh water, while the
brown coir is processed in fresh water.
2.6.3.2 Growing conditions and production in Kenya
The coconut palm or the Cocos nucifera is a large palm growing up to 30m tall, with pinnate
leaves about 6m long. On a very fertile land coconut palm can bear up to 75 fruits per year. The
coconut palms are generally classified into two types: tall and [26]
dwarf. But from development
in technology of crop productions, agriculturalists and scientists have a cross-breed of the two
known as the hybrid coconut variety [27, 28]
.
Along the Coastal region of Eastern Africa, there are three major varieties of coconut. The three
varieties are; the East African Tall (EAT), the Dwarf and the Hybrid. The EAT are the most
common in Kenya and they yield nuts with good quality copra and toddy but the immature nuts
are wanting i.e. it produces small quantity of Madafu juice, but thick copra and quality wine.
EAT variety is the most popular variety among the farmers and it takes 5 – 7 years to start
producing nuts. It is more tolerant to drought, produces an average of over 60 nuts per year under
good husbandry, lives between 60 - 100 years and grows to a height of 15m [35]
. In 1996/97

27
attempts to measure productivity were made in Mtwapa whereby a selection of high yielding
Palms of EAT of twelve trees ages varying between 15 and 25 years was done. The results drawn
from 20 years observation indicated that the yield ranged between 18 and 128 nuts per palm with
the best tree giving consistent yield of over 100 nuts per year.
The dwarf coconut variety produces excellent sweeter coconut juice (from Madafu) but little
copra. This implies they are good for ―madafu‖ but more are needed in production of oil
compared to the EAT variety. They start to produce at the age of 3 -5 years and have the ability
to produce over 100 nuts per year. It requires a lot of rainfall or water, fertile and well-drained
soil and good crop husbandry. In Kenya, it is mainly grown around the homestead for ease of
watering (but also for ornamental purposes) and can live between 40 – 50 years. On a pure stand,
dwarf coconut trees can yield up to 12,000 nuts per ha under recommended spacing of 9m x 9m.
On the other hand, hybrid (Minazi Chotora) is a cross breed of EAT and dwarf variety and
therefore contains the characteristics of both varieties. It starts producing at the age of 4 – 5 years
and produces nut with thick copra flesh and has good quality immature nuts, hence good for both
Madafu and oil production. It has the ability to produce an average of 60 nuts per annum and can
live for more than 60 years. It requires a fertile and a well-drained soil, a lot of rain and good
management. Hybrid variety was imported from Ivory Coast and established at Mtwapa (20
Plants) and Msabaha (15 plants) in 1978. They performed dismally and have since died. The
cause of death was lethal bole rot disease [36]
.The current research status in Kenya shows that
there has been no research on coconut since 1990 at Mtwapa except for maintenance of germ
plasm. This has been due to national research priorities, which have given coconut a low rating,
inadequate personnel and lack of funds.
Generally, the coconut palms thrive on sandy soils and are highly tolerant of salinity. It prefers
areas with abundant sunlight and regular rainfall (1500-2500mm), which makes colonizing
shorelines of the tropics relatively straight forward. They require humidity (70-80 %+) for
optimum growth and temperatures high enough above 240C.
In Kenya, coconut grows along the coastal shows of the Coast Province in places like Kwale,
Kinango, Kilifi, Malindi, Lamu etc. The distribution of the population of coconut trees in Coast
Province is in such a way that there are clearly identifiable production clusters. Defined as areas
of concentration in the population of trees within a small zone with a radius of 5-7 Kilometers,
the Survey identified at least 36 production clusters in the province with Kwale and Kilifi
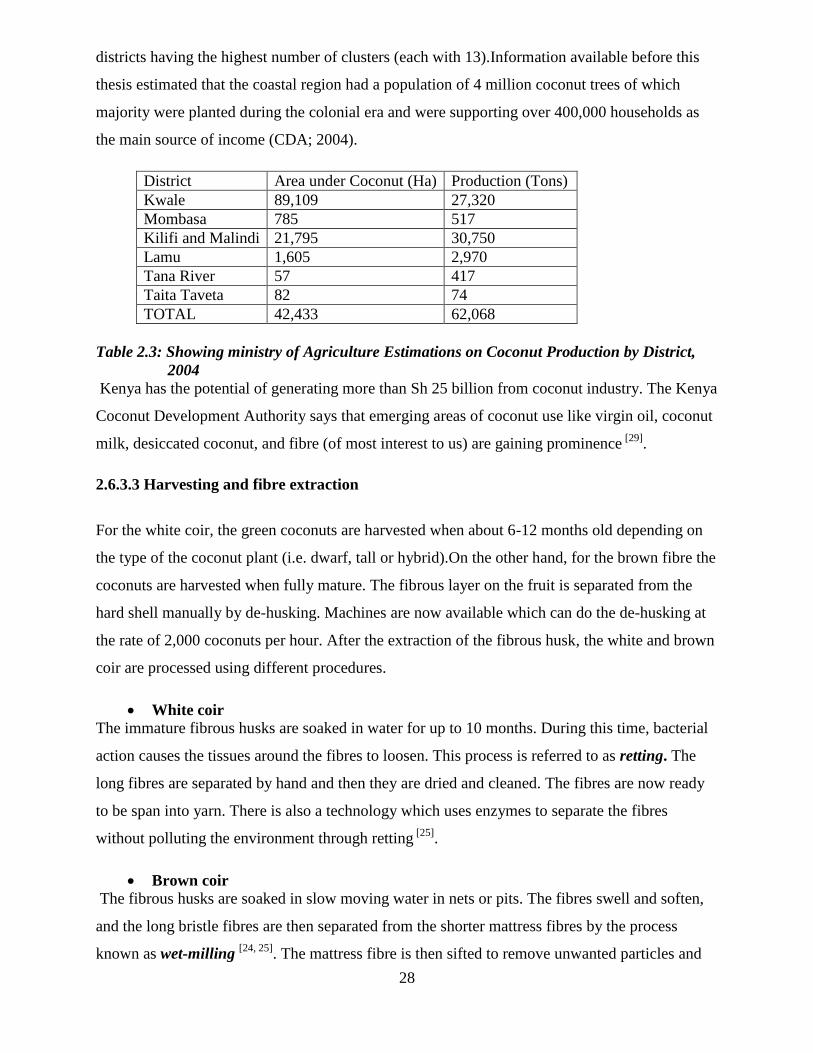
28
districts having the highest number of clusters (each with 13).Information available before this
thesis estimated that the coastal region had a population of 4 million coconut trees of which
majority were planted during the colonial era and were supporting over 400,000 households as
the main source of income (CDA; 2004).
District Area under Coconut (Ha) Production (Tons)
Kwale 89,109 27,320
Mombasa 785 517
Kilifi and Malindi 21,795 30,750
Lamu 1,605 2,970
Tana River 57 417
Taita Taveta 82 74
TOTAL 42,433 62,068
Table 2.3: Showing ministry of Agriculture Estimations on Coconut Production by District,
2004
Kenya has the potential of generating more than Sh 25 billion from coconut industry. The Kenya
Coconut Development Authority says that emerging areas of coconut use like virgin oil, coconut
milk, desiccated coconut, and fibre (of most interest to us) are gaining prominence [29]
.
2.6.3.3 Harvesting and fibre extraction
For the white coir, the green coconuts are harvested when about 6-12 months old depending on
the type of the coconut plant (i.e. dwarf, tall or hybrid).On the other hand, for the brown fibre the
coconuts are harvested when fully mature. The fibrous layer on the fruit is separated from the
hard shell manually by de-husking. Machines are now available which can do the de-husking at
the rate of 2,000 coconuts per hour. After the extraction of the fibrous husk, the white and brown
coir are processed using different procedures.
White coir
The immature fibrous husks are soaked in water for up to 10 months. During this time, bacterial
action causes the tissues around the fibres to loosen. This process is referred to as retting. The
long fibres are separated by hand and then they are dried and cleaned. The fibres are now ready
to be span into yarn. There is also a technology which uses enzymes to separate the fibres
without polluting the environment through retting [25]
.
Brown coir
The fibrous husks are soaked in slow moving water in nets or pits. The fibres swell and soften,
and the long bristle fibres are then separated from the shorter mattress fibres by the process
known as wet-milling [24, 25]
. The mattress fibre is then sifted to remove unwanted particles and
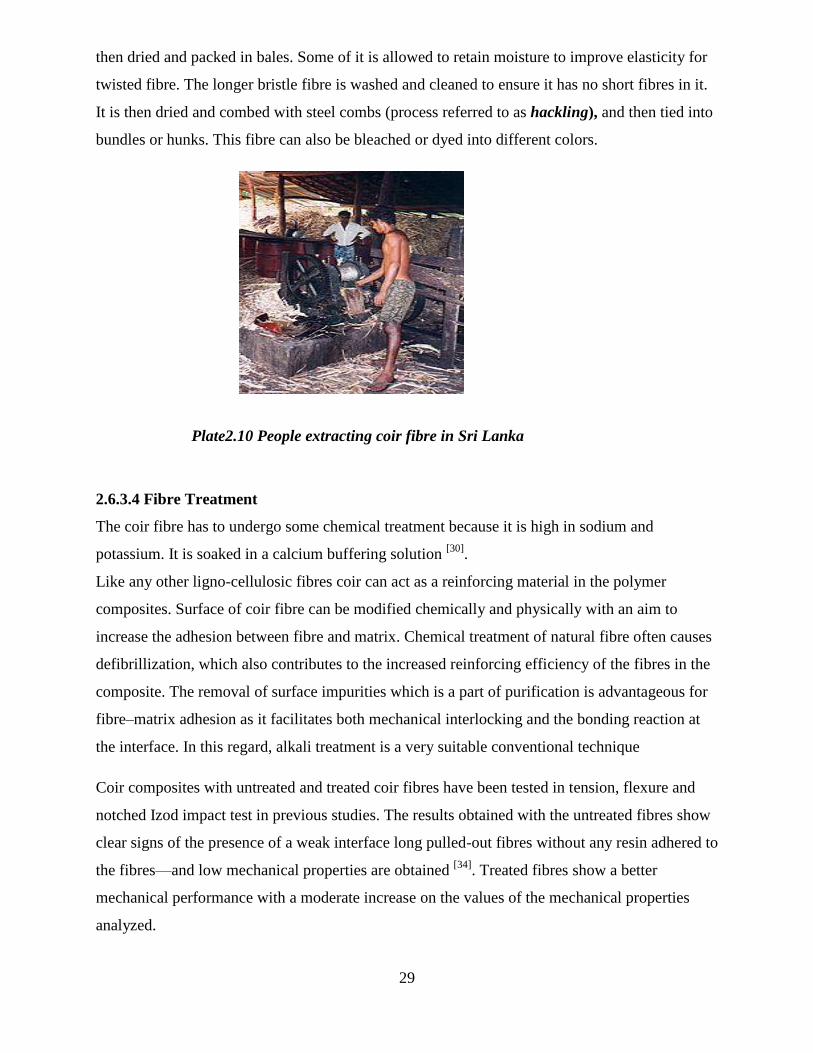
29
then dried and packed in bales. Some of it is allowed to retain moisture to improve elasticity for
twisted fibre. The longer bristle fibre is washed and cleaned to ensure it has no short fibres in it.
It is then dried and combed with steel combs (process referred to as hackling), and then tied into
bundles or hunks. This fibre can also be bleached or dyed into different colors.
Plate2.10 People extracting coir fibre in Sri Lanka
2.6.3.4 Fibre Treatment
The coir fibre has to undergo some chemical treatment because it is high in sodium and
potassium. It is soaked in a calcium buffering solution [30]
.
Like any other ligno-cellulosic fibres coir can act as a reinforcing material in the polymer
composites. Surface of coir fibre can be modified chemically and physically with an aim to
increase the adhesion between fibre and matrix. Chemical treatment of natural fibre often causes
defibrillization, which also contributes to the increased reinforcing efficiency of the fibres in the
composite. The removal of surface impurities which is a part of purification is advantageous for
fibre–matrix adhesion as it facilitates both mechanical interlocking and the bonding reaction at
the interface. In this regard, alkali treatment is a very suitable conventional technique
Coir composites with untreated and treated coir fibres have been tested in tension, flexure and
notched Izod impact test in previous studies. The results obtained with the untreated fibres show
clear signs of the presence of a weak interface long pulled-out fibres without any resin adhered to
the fibres—and low mechanical properties are obtained [34]
. Treated fibres show a better
mechanical performance with a moderate increase on the values of the mechanical properties
analyzed.

30
This alkali treatment leads to the fibrillation which causes the breaking down of the composite
fibre bundles into smaller fibres. So a better adhesion between the fibre and matrix occurs [33]
.
2.6.3.5 Properties of coir fibre
Coir fibres are light in weight, strong and elastic and have a low light resistance and a high
durability. The fibre composition is as such:
Cellulose 35-45%
Lignin 40-45%
Pectin 2.7-4%
Hemicellulose 0.15-0.25%
2.6.3.6 Other benefits of coir fibre
The other benefits of coir fibre are:
1. 100% organic, biodegradable, renewable resources.
2. High water and nutrition holding capacity, expands to hold up to 5 times its weight in
water.
3. Strong air porosity for excellent aeration.
4. Absorption properties repel snails.
5. pH 5.8 to 6.4.
6. low electrical conductivity
7. Water holding capacity up to 30%.
8. low density of around 1.15 -1.33 kg/mᶟ

31
2.6.4 Human Hair Fibre
Human hair is the filamentous appendage of the skin serving to protect the body mainly against
coldness and wetness. Hair is a filamentous biomaterial that grows from follicles found in the
dermis. It is a complex filamentous nanocomposite biomaterial, primarily composed of keratin, a
fibrous protein rich in the amino acid cysteine. Hair is one of the defining characteristics of
mammals. The human body is covered in follicles which produce thick terminal and fine vellus
hair. It is mainly concentrated on the head.
Plate 2.11 A hair strand at 200× magnification
2.6.4.1 Structural properties of human hair
Keratin is the key structural component of hair (and nails).Keratin monomers assemble into
bundles to form intermediate filaments, which are tough and insoluble and form strong
unmineralized tissues found in reptiles, birds, amphibians, and mammals. The only other
biological matter known to approximate the toughness of keratinized tissue is chitin [47]
. Because
of the strength of keratin, studies on hair as a micro reinforcement material in concrete are now
being carried out.
The more flexible and elastic keratins of hair have fewer interchain disulfide bridges than the
keratins in mammalian fingernails, hooves and claws (homologous structures), which are harder

32
and more like analogs in other vertebrate classes. Hair and other keratins consist of α-helically
coiled single protein strands (with regular intra-chain H-bonding), which are then further twisted
into super helical ropes that may be further coiled. The β-keratins of reptiles and birds have β-
pleated sheets twisted together, then stabilized and hardened by disulfide bridges.
Due to insolubility of keratin, human hair is hydrophilic. The major force that keeps the coiled-
coil structure is hydrophobic interactions between polar residues along the keratins helical
segments [15]
.Fibrous keratin molecules super coil to form a very stable , left-handed super
helical motif to multimerise, forming filaments consisting of multiple copies of the keratin
monomer[14]
.
2.6.4.2 Use of human hair as a micro reinforcement in concrete
As strong, healthy and beautiful hair has been universally desired across various cultures, it has
been the topic of many studies from various disciplines. Human hair fibres are stressed under
tensile forces as they are combed, groomed and styled; thus, many of the studies have focused on
the mechanical properties in tension.
Hair is used as a fibre reinforcing material in concrete for the following reasons:
1. It has a high tensile strength which is equal to that of a copper wire with similar diameter.
2. Hair, a non-degradable matter is creating an environmental problem so its use as a fibre
reinforcing material can minimize the problem.
3. It is also available in abundance and at a very low cost.
4. It reinforces the mortar and prevents it from spalling.

33
Plate 2.12 Human hair ready for mixing in concrete
2.6.4.3 Mechanical properties of human hair
Theoretical models have been proposed to interpret experimental tensile stress–strain curves of
wool, hair and other α-keratin fibres using structural mechanics [48]
.Previous studies have been
done where the stress–strain curve and the instantaneous Young‘s modulus of hair was
measured by employing sonic velocity measurement[49]
. A multi scale modeling approach to link
mechanical properties of human hair fibres to structural information was discussed and from
these derivations were made on the use of human hair in cementitious mix as a micro
reinforcement [49, 50]
.Microscopic simulations of keratin proteins, meso scale modeling of a
macrofibril and a theoretical macroscopic model were used to link the microscopic scale to
macroscopic observables, i.e. experimental stress–strain curves. The stress–strain curve of
human hair was estimated using an atomic force microscope and a custom built tensile sample
stage. From the above it was concluded that hair is strong in tension and it is from this that this
study was based to see if the tensile strength can be made use of in concrete reinforcement.
2.6.4.4 Failure mechanism of hair fibre
Failures in ductile materials in tension are frequently caused by necking where strain is
concentrated at a small region of the material. In the necking process, the strength increase by
strain-hardening is less than the stress increase by the reduction in cross-section [51, 52]
. So, if a
particular cross-section becomes infinitesimally smaller than the remainder of the material, all
subsequent deformation will concentrate at that section until final failure. Failure by unstable
necking can be identified by significant local thinning at the failed section .This analysis

34
provides insight into the failure mechanism of hair. When hair is loaded in tension, irregularities
on the surface cause stress concentration and strain localization at a particular section. This
section might be locally deformed up to the maximum range; however, the neck initiation would
lead to much higher strain-hardening rate than the cross sectional reduction rate in that region,
thus the neck ceased to form any further in that section, but propagates into the neighbouring
section in a stable manner. As the maximum range of necking is relatively low, macroscopically
the hair is uniformly deformed across the entire length. Therefore, it is believed that final failure
is not attained by the local reduction in cross-sectional area, but by the scission of keratin chains
in a brittle manner.
2.6.4.5 Classification of human hair
Hair is habitually classified as Asian, Caucasian and African hair. It is easily identifiable by its
color and form, but also by something less obvious to the naked eye-the way it grows.
Asian hair holds the sped record for growth with 1.3cm a month. It has lower density than any
other group. The way its follicle is implanted causes the hair to grow straight, perpendicular to
the scalp.
African hair, generally black hair, has the slowest growing rate of all, at less than 0.9cm a month.
On the other hand it is slightly more dense than Asian hair and grows almost parallel to the scalp,
twisting around itself as it grows.
As far as the rate of growth is concerned, Caucasian hair comes between the other two at 1.2cm a
month, but it has the highest density of all. It grows at an oblique angle to the scalp and is
slightly curved. Research has shown that human hair from the Caucasian people (i.e. people from
Europe, America and some part of North Africa, who are light-skinned) has high tensile strength
as compared to other types of hair and is generally stronger.
The hair used in this study was African kinky hair and was obtained from a hair salon and barber
shop in Buruburu area.

35
2.7 Existing Natural Fibre Reinforced Concrete Structures.
The concept of fibre reinforced structures is very old. Its origin is from old age practices where
man is known to have made structures from natural fibres such as jute, bamboo and sisal.
Figure 2.5 Examples of traditional dwellings made of grasses and leaves (Sidamo dwelling,
Ethiopia: basket-like structure)
It is from above structures that engineers added mud and bricks and later on research on
incorporating the fibres in concrete was developed.
Below is a photo of a house being constructed with bamboo and elephant grass fibre as
reinforcement in concrete. The fibres are first put in place, and then a formwork is done in which
fresh concrete is poured and left to cure.

36
Plate 2.13 A wall of bamboo fibre reinforcement in concrete, a form of green construction.
One of the structures that have been built is the Pensmore-Chateau, a three storey building on the
Ozark Mountains of Missouri. It is a high-tech castle built to withstand major natural and man-
made disasters like earthquakes, tornados, fires, insect damage and explosions .It is said to
withstand F5 tornados [56]
.
Plate 2.14 The Pensmore-Chateau mansion.

37
The Pensmore-Chateau is 72,000 sq. ft. on ground and the technology applied is the use of
insulated concrete which contains a mix of helix steel fibres that provide reinforcement in every
direction, which results in a very strong yet elastic material able to withstand geological
disturbances. The helix steel fibres provide a longer cure time for the concrete which enables it
to reach maximum strength. The result is a concrete mixture that is 50% stronger than standard
poured concrete. This concrete/fiber/wire mix is said to be strong enough to possibly withstand
explosions, in addition to the natural disasters it was designed to withstand.
Even though the fibres used in this structure are synthetic, it is of interest to us since the
engineers working on this project, TF Forming Systems, are doing side tests on parts of the
structure using highly processed sisal and bamboo fibres.
Pensmore-Chateau, once completed, will act as a ―living laboratory‖ or a showcase of sorts for
the latest construction technologies that can offer increased protection from natural disasters, all
while increasing efficiency.
Another project worth to mention is the soccer city stadium in South Africa [55]
.
Plate 2.15 The bird’s eye view of the calabash like soccer city stadium
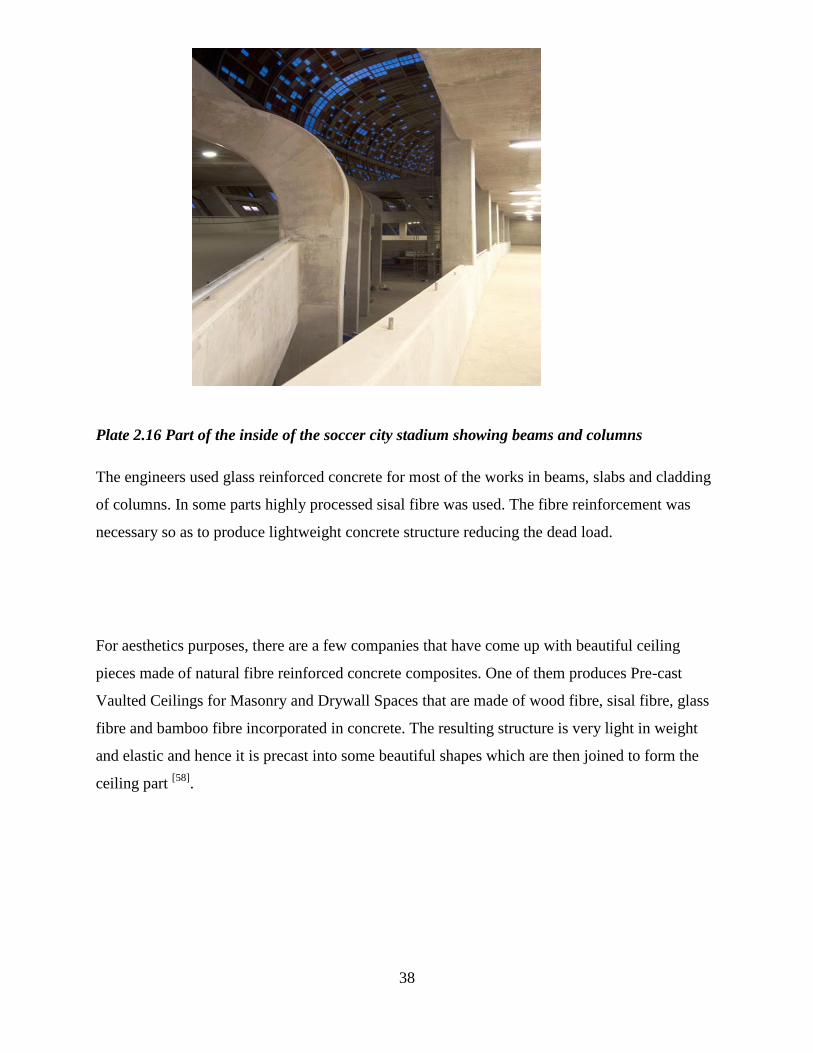
38
Plate 2.16 Part of the inside of the soccer city stadium showing beams and columns
The engineers used glass reinforced concrete for most of the works in beams, slabs and cladding
of columns. In some parts highly processed sisal fibre was used. The fibre reinforcement was
necessary so as to produce lightweight concrete structure reducing the dead load.
For aesthetics purposes, there are a few companies that have come up with beautiful ceiling
pieces made of natural fibre reinforced concrete composites. One of them produces Pre-cast
Vaulted Ceilings for Masonry and Drywall Spaces that are made of wood fibre, sisal fibre, glass
fibre and bamboo fibre incorporated in concrete. The resulting structure is very light in weight
and elastic and hence it is precast into some beautiful shapes which are then joined to form the
ceiling part [58]
.

39
Plate 2.17 The ambience of modern vaulted ceilings in a French restaurant.
Plate 2.18 Showing the irresistible and timeless appeal of fibre reinforced concrete composites
ceilings
The timeless shape of vaulted ceilings holds its own quite well in combination with
contemporary architecture and interior design. Its structure and presence complement open and
glass-filled spaces exceptionally well, creating new possibilities in the juxtaposition of traditional
and modern design. The most well-known company doing these is called diArco Vaulted
Ceilings Systems and offers pre-cast barrel and cross-shaped vault models using natural fibres
composite materials chosen specifically to meet the demands of masonry and stud wall
structures.

40
The ambience of modern vaulted ceilings can bring a special touch to any renovation or building
project: from private homes to hotels, fine restaurants and vineyards, wherever quality of living
counts.
There is also a housing project in Australia where dome like houses are being constructed at low
costs and with the shortest construction time as possible. It involves a few steps laying a
foundation and putting up a wooden frame to act as the support and then cladding with fibre
reinforced plastic or roofing sheets [57]
.
Plate 2.19 The dome under construction.
From the above picture, the foundation laid is made of lightweight hollow precast concrete
blocks made using jute, sisal or steel fibres as reinforcement. A fibre reinforced concrete mix is
then laid on top of the blocks to produce a smooth surface. After the frame is finished as above,
the cladding is done and the resulting structure is as below.

41
Plate 2.20 The dome when complete with cladding.
The building parts come in a kit with fixed dimensions of different sizes hence it is very easy to
construct. They are called the EconOdome kits .
In other places wood, jute and sisal fibres have been used to make precast concrete panels that
are used for siding in houses. The Panels are of light weight, high strength, natural ( and for
some, synthetic) fiber reinforced concrete. The Siding Panels have an advantage over plain wood
panels in that they will not burn, warp, twist, shrink, or settle[54]
. They are used to produce a
unique hand hewn texture unlike anything else in the manufactured siding market, replicating the
grain, knots, and checks commonly found in natural wood timbers. They are good for cottages or
hotels that want to provide a look like for those old houses but at the same time long lasting, and
are an instant and dramatic improvement to any structure. Below is a house in Australia made of
the NFRC panels.

42
Plate 2.21 Showing natural fibre reinforced concrete sidings giving the rough texture of a
wooden structure.
Another special case where the concept of natural fibre reinforced concrete composites is under
use is in the production of bio-concrete. This is a type of concrete that is self-healing over time
and stops cracks from forming in the concrete. The cement used has a healing agent composed of
bacterial spores and a feed. The oncoming water activates the bacterial spores, causing them to
convert the feed into limestone, which seals the cracks. Research is underway where scientists
from Dutch are looking into vegetable fibres and even wood fibres to see if they can act as feeds
such that when bacteria feeds on them in presence of other agents, the lignocellulose can be
hardened and replicate limestone or calcite sealing the cracks too.
The production of the calcite is not to actually increase the strength of concrete but to stop the
progression of the cracks therefore increasing the life of the structure.
There are other various structures that have natural fibres used as reinforcement in them.
Appendix three shows a number of photos taken of the structures. However, it should be noted
that we have very few structures made purely of natural fibre reinforced concrete as is the case
for synthetic fibres especially glass and steel. This is because research is still underway to see
various way of strengthen the natural fibres and ensuring they do not deteriorate in the concrete
mix
43
CHAPTER THREE: MATERIALS AND METHODOLOGY
3.1 Material Characterization and experimental plan
3.1.1 Tests on coarse aggregates
Coarse aggregates of a normal weight and with a maximum diameter of
or 10mm were used.
The 10mm size was used instead of the 20mm diameter aggregate because moulds used were of
100 ×100 × 100mm.The 20mm aggregates are used in the 150 ×150×150mm moulds. Use of the
(10mm) coarse aggregates in the 100x100x100mm moulds ensures that the surface area to
volume ratio of the aggregate in the mix is appropriate hence proper binding .20mm aggregates
will occupy a large volume in a mould of the same size and, lowers the surface area to volume
ratio hence improper binding leading to segregation. Also, the most important factor is to ensure
uniform dispersion of the fibres and to prevent segregation or balling of the fibres during mixing.
Segregation or balling during mixing is affected by many factors, which can be summarized as
follows:
Aspect ratio (l/df),which is most important
Volume percentage of the fibre
Coarse aggregate size, gradation, and quantity
Water/cementitious materials ratio and the method of mixing
A maximum aspect ratio of l/df and fibre content in excess of 3% by weight make it difficult to
achieve a uniform mix. Although conventional mixing procedures can be used, it is advisable to
use (10mm) maximum aggregate size. Where l is the fibre length and df is the fibre diameter.
Excess fines in course aggregates were removed by sieving through 4.76mm sieve to conform to
requirements of BS 8500-2-2002. Previous research has shown that the fines have a detrimental
effect on the quality of concrete. Fines contain many impurities and results in strength loss in the
concrete [4]
. Excess fines also increase the surface area for water absorption increasing the water
absorption characteristics of the mix. There was therefore need to sieve the aggregates to reduce
the amount of fines.
3.1.2 Sieve Analysis on fine aggregates
This is the process of dividing a sample of aggregates into fractions of same particle size in order
to determine the size distribution of the aggregates. A sample of air dried aggregate was graded
according to BS 812: Part 1: 1975, by shaking a nest of stacked sieves, with the largest sieve at

44
the top for specified time so that the material retained on each sieve represents the fraction
coarser than the sieve in question but finer than the sieve above. The range of sieves used was
between 0.149mm to 2.83mm.River sand from Machakos was used in this experiment.
3.1.3 Portland Cement
Blue Triangle Ordinary Portland cement Cem IV/B 32.5N was used throughout the study in
preparing the concrete mixes.
3.1.4 Water
Water is essential for the hydration reaction of Portland cement to take place. The water used
was potable water which was fresh, odourless and tasteless, free from organic matter of any type.
It was obtained from the laboratory taps.
A constant water cement ratio of 0.65 was used in this study.
3.1.5 Mix Proportions
There are various mix designs classified on the strength of the resulting concrete. They are M-25,
M-30 and M-40, et cetera. The M stands for ‗Mix‘. In respect to the ratios of cement, coarse
aggregates and fine aggregates respectively. A cubical block made with that mix design can take
a load of 25MPa, 30MPa and 40MPa respectively.
Class 7 days strength
(N/mm2)
28 days strength
(N/mm2)
Application
25 17 25 General building works
30 20 30 Bridges, high rise buildings, and
Other important RC structures
40 28 40 Prestressed concrete heavily loaded
RC structures
Table 3.1: Showing different grades of concrete and their applications
The M25 mix design was used in this study. The ratio of proportions for Class M-25 is 1:1.5:3,
i.e. cement, fine aggregates and coarse aggregates respectively. The fibre quantity used was
given as a percentage to the total weight of cement used in every mix, and since the weight of
cement was kept constant, then the fibre content can be said to be as a percentage of the total
weight of the mix.
The production technology applied was that of combining fibres with matrix in a pan mixer as if
the fibres were an extra ingredient in the common method of producing a cementitious mix. One

45
mix with 0% fibre was prepared and this was the control. Three mixes of varying amount of
fibres were prepared, then an optimum amount selected. An optimum fibre length of 35mm was
chosen, considering good workability the mix had as compared to higher lengths.
After settling on the optimum fibre length of 35mm,three mixes were now prepared for each
fibre type with a fibre content of 1%,2% and 3%.And there were a total of four fibre types i.e.
sisal, coir, bagasse and human hair, hence a total of 13mixes including the control.
Description Cement
(Kg)
Fine
Aggregates
(Kg)
Coarse
Aggregates
(Kg)
Fibre
Content
(Kg)
Water
(Ltrs)
Control
Concrete
15.8 23.7 47.5 0 10.27
Mix with 1%
Of fibre by total
weight
15.8 23.7 47.5 0.158 10.27
Mix with 2%
Of fibre by total
weight
15.8 23.7 47.5 0.316 10.27
Mix with 3%
Of fibre by total
weight
15.8 23.7 47.5 0.474 10.27
Table 3.2: Mixture constituents of the various concrete mixes
NB: - Note that the fibres added were not used to replace cement or aggregates since the same
principle as that used in reinforcing concrete with steel was followed. In steel reinforced concrete
none of the composites i.e. cement or aggregates, is replaced by steel.
The percentage range of 0% to 3% was used since it was observed that additional of more fibre
past 3% caused balling to occur during mixing and hence difficulties in fabrication. And the
resulting concrete was of lower strength.
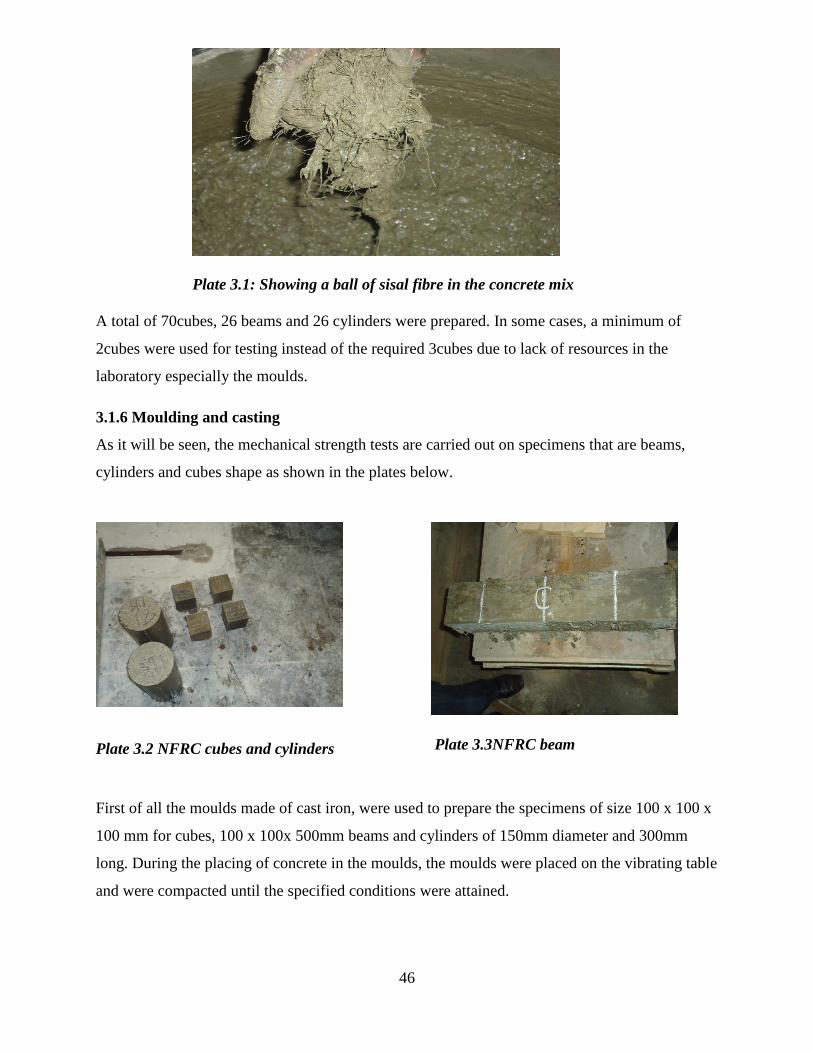
46
Plate 3.1: Showing a ball of sisal fibre in the concrete mix
A total of 70cubes, 26 beams and 26 cylinders were prepared. In some cases, a minimum of
2cubes were used for testing instead of the required 3cubes due to lack of resources in the
laboratory especially the moulds.
3.1.6 Moulding and casting
As it will be seen, the mechanical strength tests are carried out on specimens that are beams,
cylinders and cubes shape as shown in the plates below.
Plate 3.2 NFRC cubes and cylinders
Plate 3.3NFRC beam
First of all the moulds made of cast iron, were used to prepare the specimens of size 100 x 100 x
100 mm for cubes, 100 x 100x 500mm beams and cylinders of 150mm diameter and 300mm
long. During the placing of concrete in the moulds, the moulds were placed on the vibrating table
and were compacted until the specified conditions were attained.

47
Plate 3.4 A beam being compacted on the
vibrating table
Plate 3.5 Freshly cast NFRC concrete
specimens in moulds
The cast concrete specimens were then marked and dated. After 24 hours the specimens were
removed from the moulds and immediately submerged in water for curing in the dark room.
After 7 and 28 days the specimens were tested using the cube crushing test, tensile test, and the
Four-point bending test.
3.1.7 Parallel aligned fibres
More tests were done on sisal fibre where the fibres of about 450mm long were laid parallel on
the beam spacemen during moulding. Only the beam specimen was used for parallel fibres since
placeability of the fibres in the smaller cube of 100x100x100mm and the cylinder was difficult.
Hence the parallel fibres were only tested for flexural strength.
Additional, sisal was the only fibre with long strands that could be used along the length of the
beam.
The sisal fibre used was in two different forms; a sisal twine of diameter 3mm and a double
twisted twine of around 1.5mm diameter each.
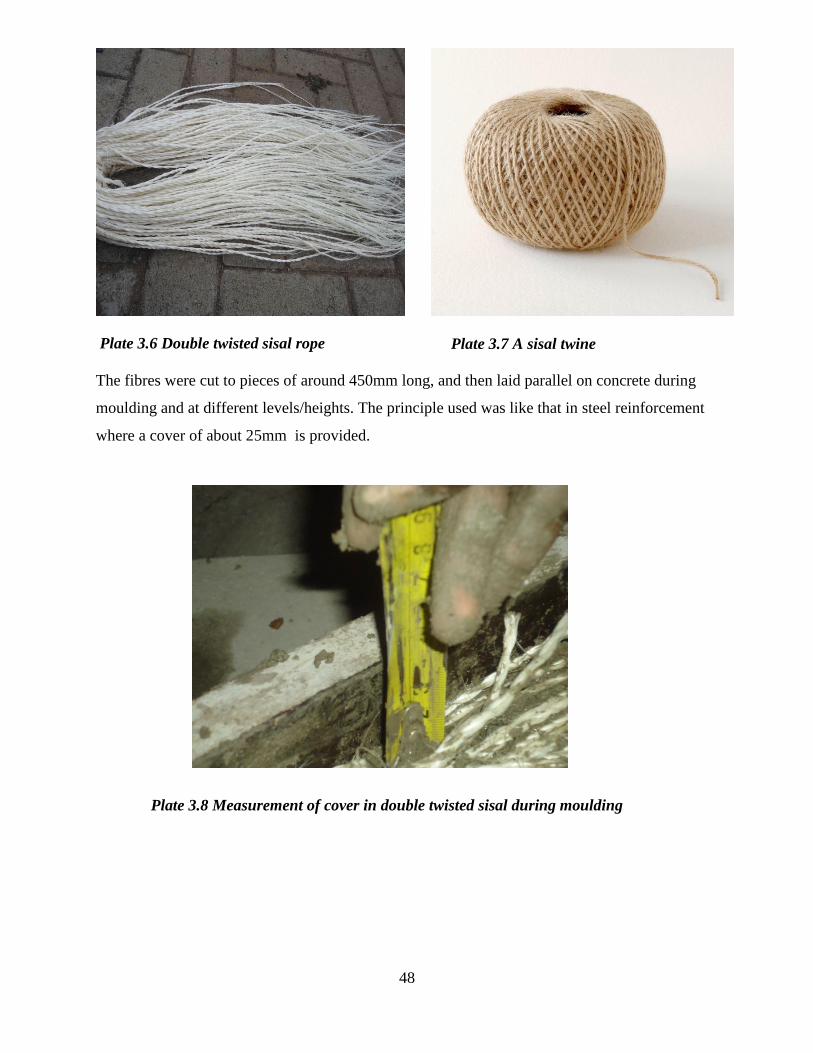
48
Plate 3.6 Double twisted sisal rope
Plate 3.7 A sisal twine
The fibres were cut to pieces of around 450mm long, and then laid parallel on concrete during
moulding and at different levels/heights. The principle used was like that in steel reinforcement
where a cover of about 25mm is provided.
Plate 3.8 Measurement of cover in double twisted sisal during moulding
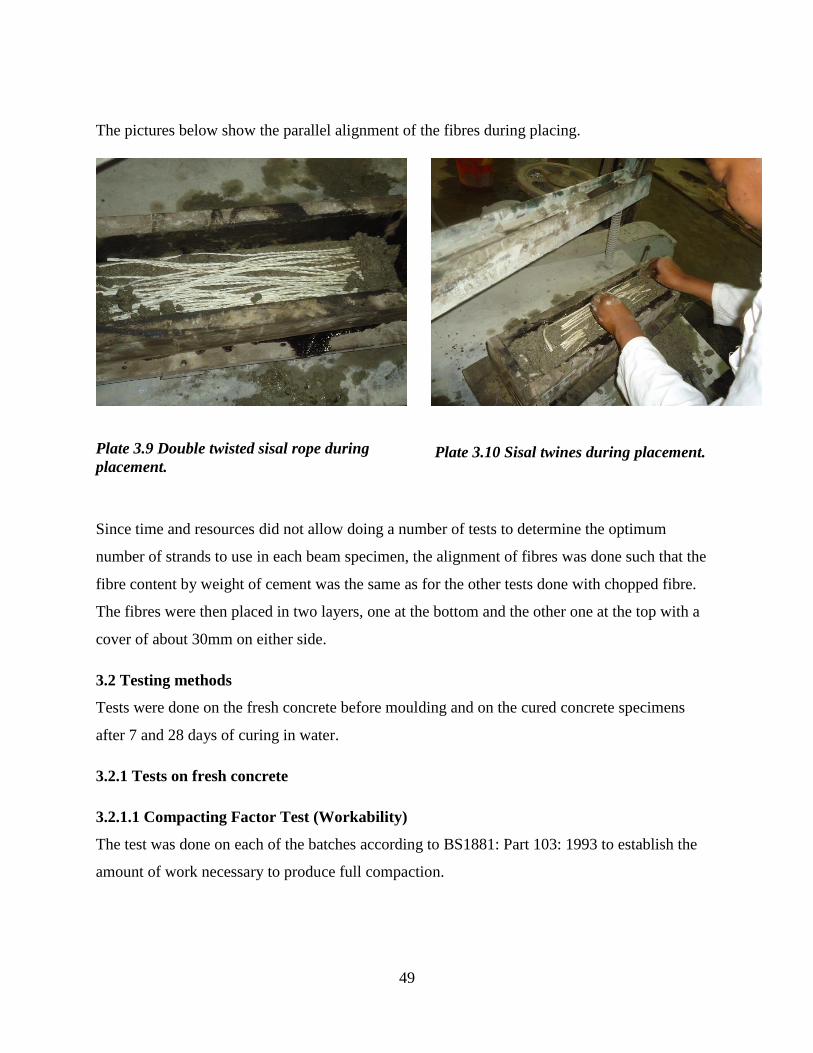
49
The pictures below show the parallel alignment of the fibres during placing.
Plate 3.9 Double twisted sisal rope during
placement.
Plate 3.10 Sisal twines during placement.
Since time and resources did not allow doing a number of tests to determine the optimum
number of strands to use in each beam specimen, the alignment of fibres was done such that the
fibre content by weight of cement was the same as for the other tests done with chopped fibre.
The fibres were then placed in two layers, one at the bottom and the other one at the top with a
cover of about 30mm on either side.
3.2 Testing methods
Tests were done on the fresh concrete before moulding and on the cured concrete specimens
after 7 and 28 days of curing in water.
3.2.1 Tests on fresh concrete
3.2.1.1 Compacting Factor Test (Workability)
The test was done on each of the batches according to BS1881: Part 103: 1993 to establish the
amount of work necessary to produce full compaction.
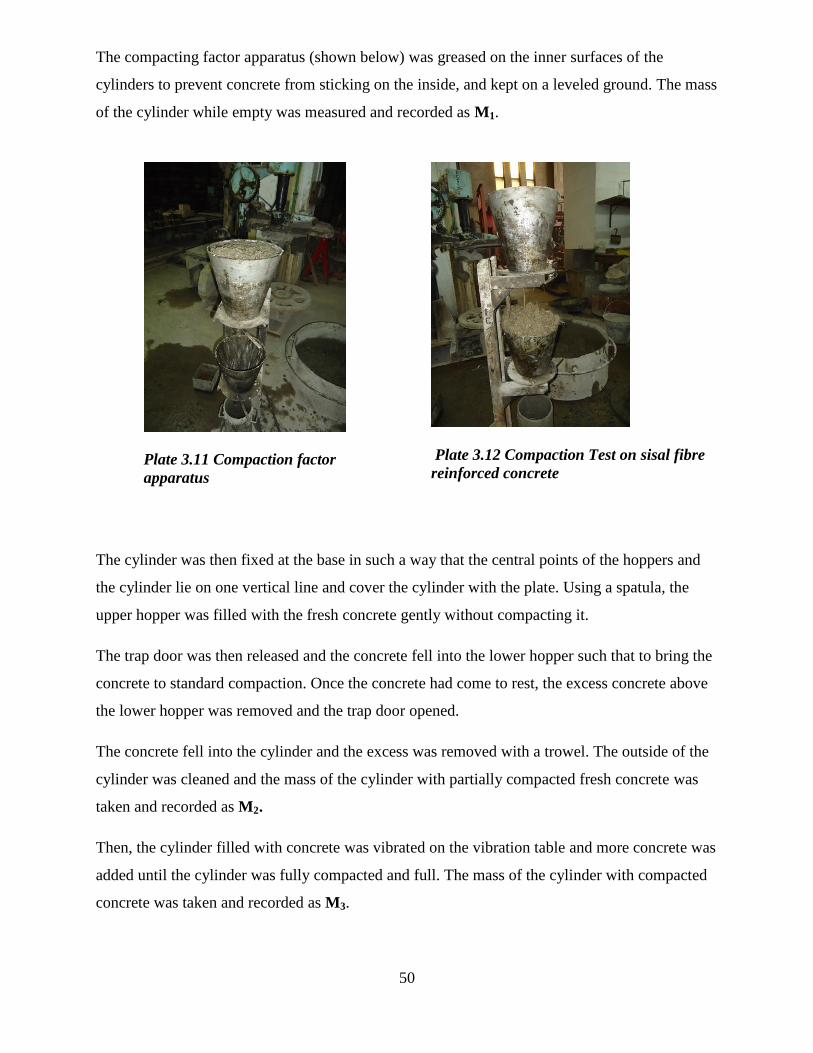
50
The compacting factor apparatus (shown below) was greased on the inner surfaces of the
cylinders to prevent concrete from sticking on the inside, and kept on a leveled ground. The mass
of the cylinder while empty was measured and recorded as M1.
Plate 3.11 Compaction factor
apparatus
Plate 3.12 Compaction Test on sisal fibre
reinforced concrete
The cylinder was then fixed at the base in such a way that the central points of the hoppers and
the cylinder lie on one vertical line and cover the cylinder with the plate. Using a spatula, the
upper hopper was filled with the fresh concrete gently without compacting it.
The trap door was then released and the concrete fell into the lower hopper such that to bring the
concrete to standard compaction. Once the concrete had come to rest, the excess concrete above
the lower hopper was removed and the trap door opened.
The concrete fell into the cylinder and the excess was removed with a trowel. The outside of the
cylinder was cleaned and the mass of the cylinder with partially compacted fresh concrete was
taken and recorded as M2.
Then, the cylinder filled with concrete was vibrated on the vibration table and more concrete was
added until the cylinder was fully compacted and full. The mass of the cylinder with compacted
concrete was taken and recorded as M3.
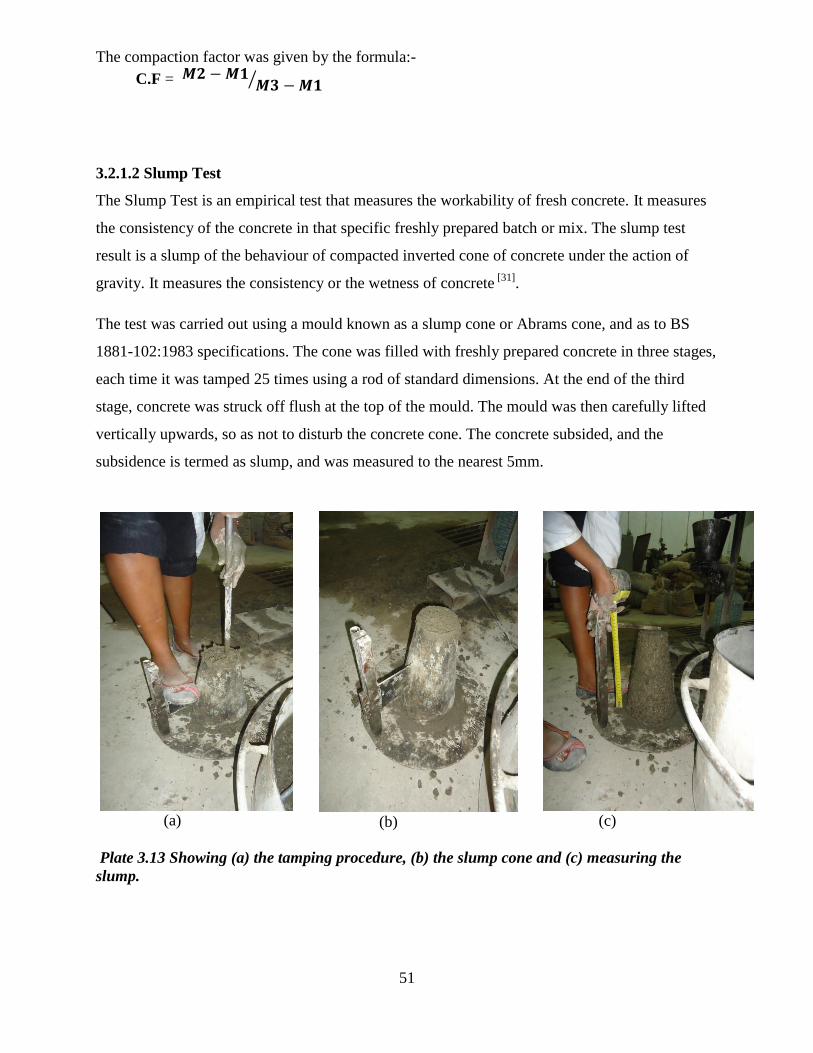
51
The compaction factor was given by the formula:-
C.F = ⁄
3.2.1.2 Slump Test
The Slump Test is an empirical test that measures the workability of fresh concrete. It measures
the consistency of the concrete in that specific freshly prepared batch or mix. The slump test
result is a slump of the behaviour of compacted inverted cone of concrete under the action of
gravity. It measures the consistency or the wetness of concrete [31]
.
The test was carried out using a mould known as a slump cone or Abrams cone, and as to BS
1881-102:1983 specifications. The cone was filled with freshly prepared concrete in three stages,
each time it was tamped 25 times using a rod of standard dimensions. At the end of the third
stage, concrete was struck off flush at the top of the mould. The mould was then carefully lifted
vertically upwards, so as not to disturb the concrete cone. The concrete subsided, and the
subsidence is termed as slump, and was measured to the nearest 5mm.
(a)
(b)
(c)
Plate 3.13 Showing (a) the tamping procedure, (b) the slump cone and (c) measuring the
slump.
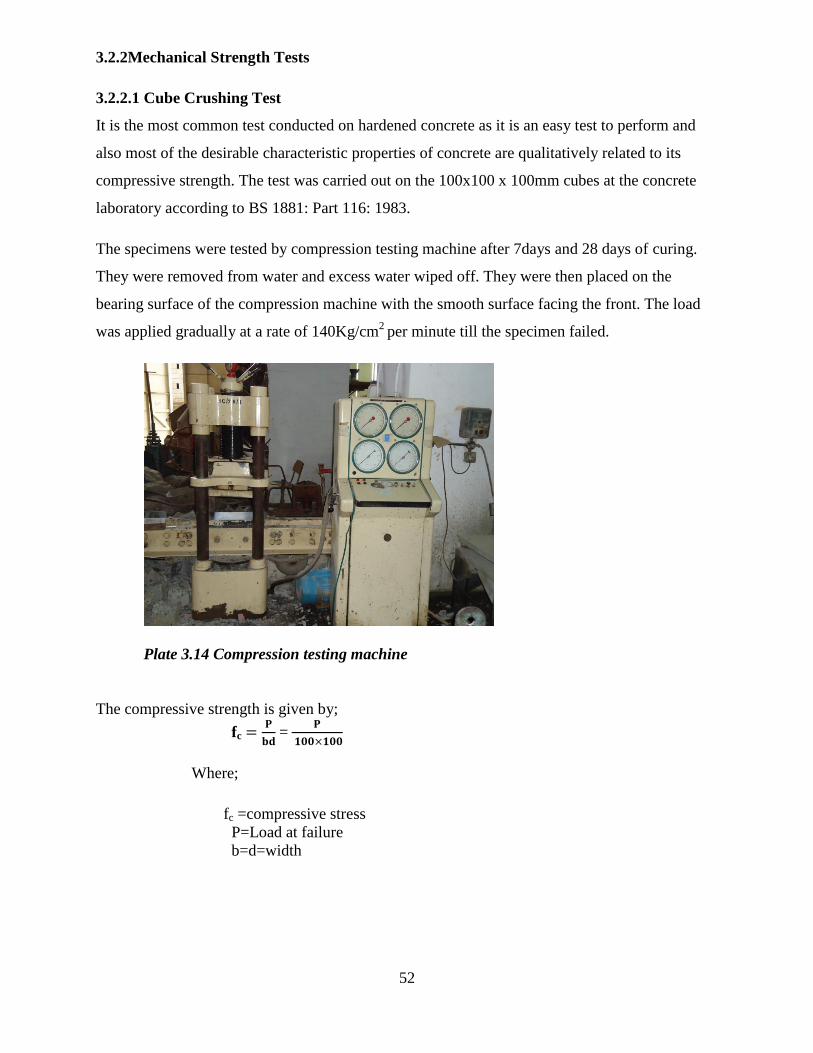
52
3.2.2Mechanical Strength Tests
3.2.2.1 Cube Crushing Test
It is the most common test conducted on hardened concrete as it is an easy test to perform and
also most of the desirable characteristic properties of concrete are qualitatively related to its
compressive strength. The test was carried out on the 100x100 x 100mm cubes at the concrete
laboratory according to BS 1881: Part 116: 1983.
The specimens were tested by compression testing machine after 7days and 28 days of curing.
They were removed from water and excess water wiped off. They were then placed on the
bearing surface of the compression machine with the smooth surface facing the front. The load
was applied gradually at a rate of 140Kg/cm2
per minute till the specimen failed.
Plate 3.14 Compression testing machine
The compressive strength is given by;
fc
=
Where;
fc =compressive stress
P=Load at failure
b=d=width

53
Plate 3.15 A cube being tested for compressive strength
3.2.2.2 Splitting Tensile Test
The tensile strength of the fibres is obtained by the direct uniaxial tensile test, but the gripping of
the fibres causes a major challenge. In more developed countries a micro force testing system
(Tyron 250, MTS systems, Minneapolis) is used. A steel ‗V‘ shaped mechanical clamping grip is
used to grip the fibres. After loading, the displacement of the fibres is measured by a short-stroke
transducer with a resolution of about 0.1µm.
Locally, there is no such advanced equipment and the splitting tensile test is used as an
alternative, because it is much simpler and less expensive. The splitting tensile test, also known
as the split-cylinder test is an indirect method to measure the tensile strength in concrete and
therefore signifying the relative tensile stress of the fibres. This test is performed in accordance
to IS: 5816-1970.
Apparatus
Standard test cylinder of concrete specimen(300mm length x 150mm diameter)
Compression testing machine
Procedure
The standard cylinder of concrete specimen was placed horizontally between the loading
surfaces of the Compression Testing Machine (Fig 3.2).The compression load was then applied
uniformly along the length of the cylinder until failure of the cylinder along the vertical diameter.
Strips of ply wood were placed between the specimen and the loading surfaces to ensure uniform
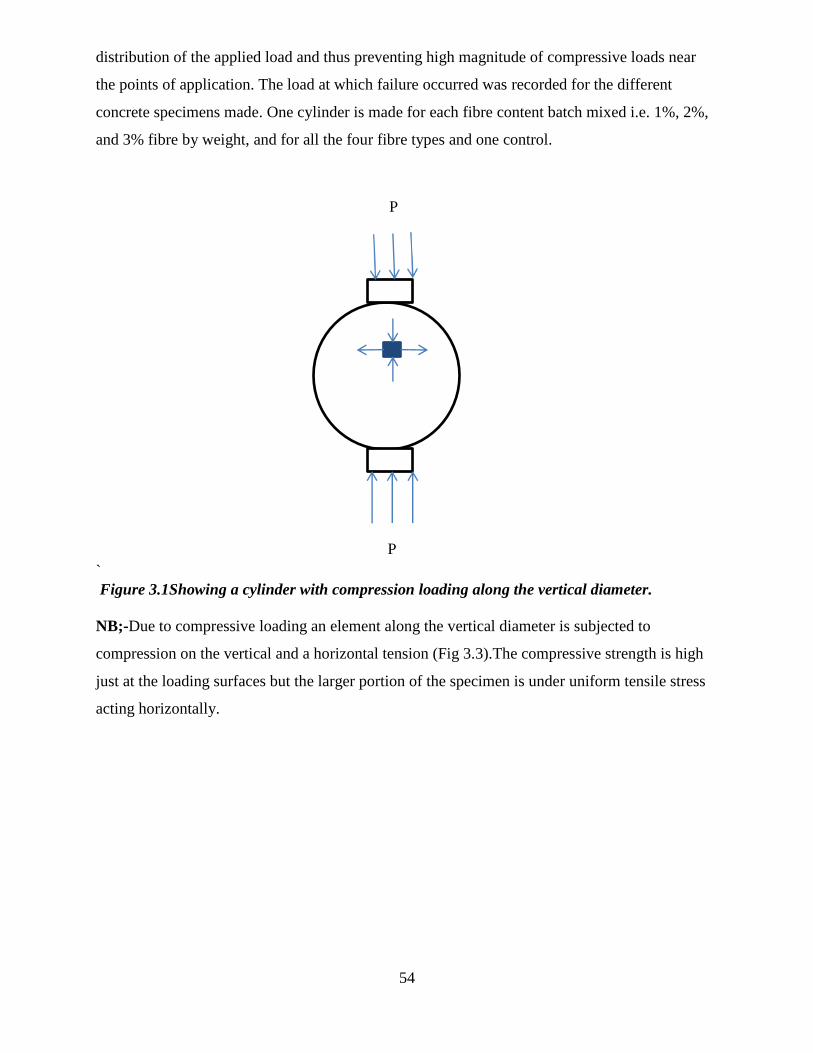
54
distribution of the applied load and thus preventing high magnitude of compressive loads near
the points of application. The load at which failure occurred was recorded for the different
concrete specimens made. One cylinder is made for each fibre content batch mixed i.e. 1%, 2%,
and 3% fibre by weight, and for all the four fibre types and one control.
`
Figure 3.1Showing a cylinder with compression loading along the vertical diameter.
NB;-Due to compressive loading an element along the vertical diameter is subjected to
compression on the vertical and a horizontal tension (Fig 3.3).The compressive strength is high
just at the loading surfaces but the larger portion of the specimen is under uniform tensile stress
acting horizontally.
P
P
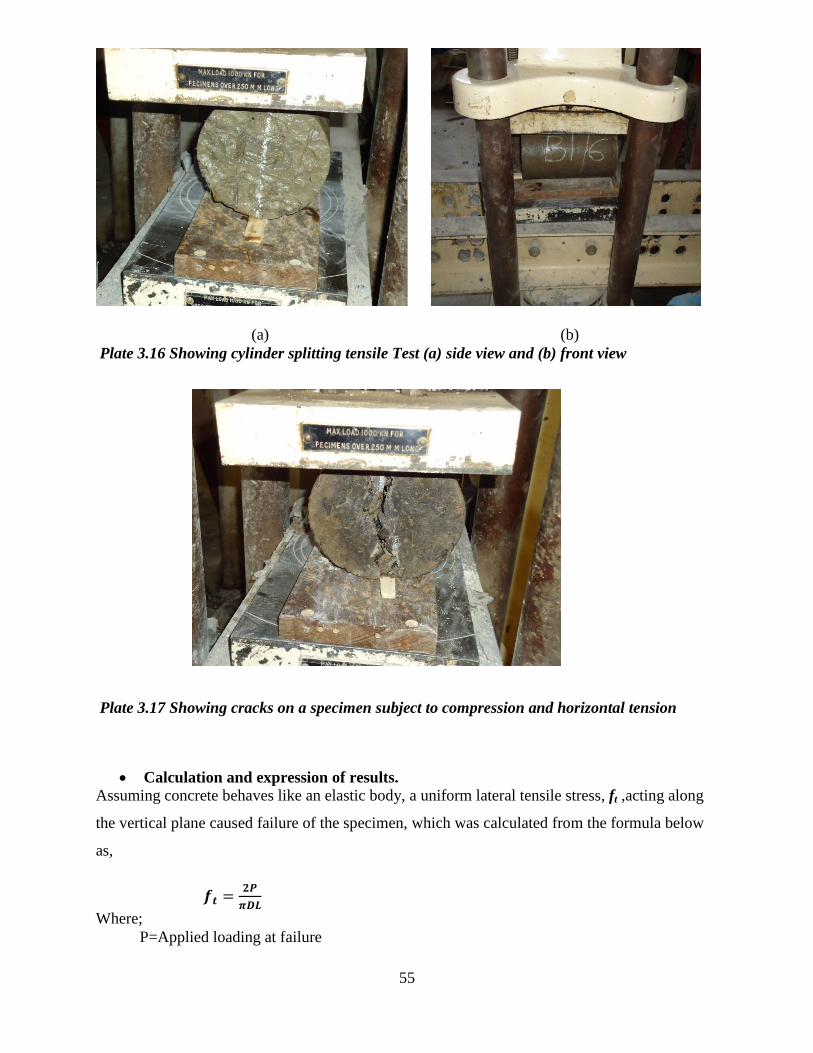
55
(a) (b)
Plate 3.16 Showing cylinder splitting tensile Test (a) side view and (b) front view
Plate 3.17 Showing cracks on a specimen subject to compression and horizontal tension
Calculation and expression of results.
Assuming concrete behaves like an elastic body, a uniform lateral tensile stress, ft ,acting along
the vertical plane caused failure of the specimen, which was calculated from the formula below
as,
Where;
P=Applied loading at failure

56
L=Length of cylinder
D=Diameter of cylinder
3.2.2.3 Flexure Test-Third Point Loading Method
This test was used to measure the flexural strength of the NFRC. It was performed in accordance
to BS 1881: Part 118: 1983
Apparatus
Standard test beam of concrete specimen(100 x 100x 300mm)
Flexural testing machine
Plate 3.18 Flexural stress testing
apparatus loading.
Plate 3.19 A beam under four-point
Procedure
A simple NFR concrete beam of standard size of 100 x 100x 300mm was loaded at one third
points from supports as shown in fig 3.4 below. One beam was made for each fibre content batch
mixed i.e. 1%, 2%, and 3% fibre by weight, and for all the four fibre types and one control.
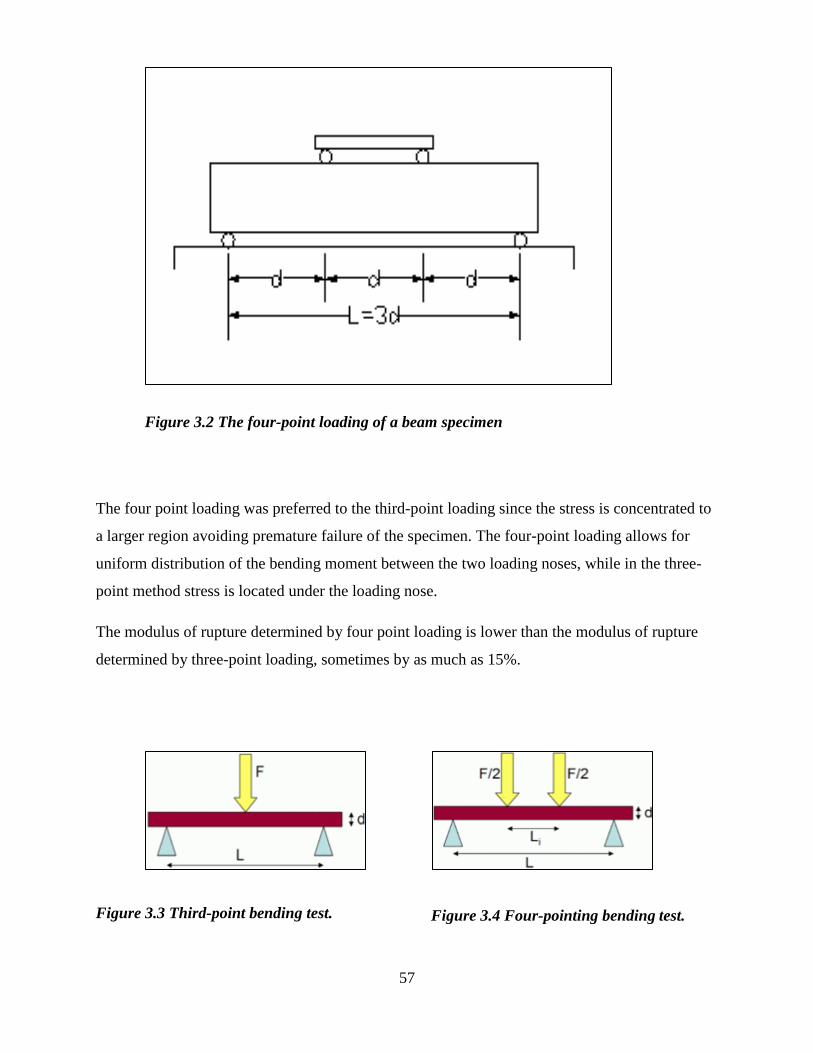
57
Figure 3.2 The four-point loading of a beam specimen
The four point loading was preferred to the third-point loading since the stress is concentrated to
a larger region avoiding premature failure of the specimen. The four-point loading allows for
uniform distribution of the bending moment between the two loading noses, while in the three-
point method stress is located under the loading nose.
The modulus of rupture determined by four point loading is lower than the modulus of rupture
determined by three-point loading, sometimes by as much as 15%.
Figure 3.3 Third-point bending test.
Figure 3.4 Four-pointing bending test.
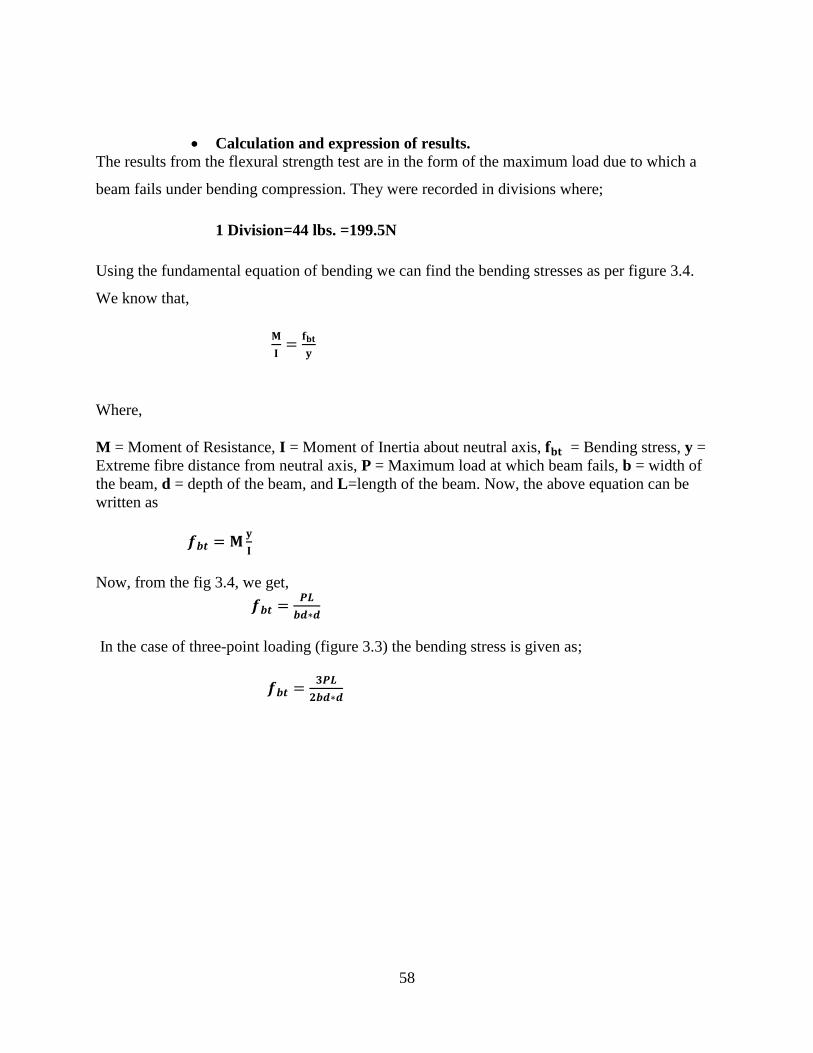
58
Calculation and expression of results.
The results from the flexural strength test are in the form of the maximum load due to which a
beam fails under bending compression. They were recorded in divisions where;
1 Division=44 lbs. =199.5N
Using the fundamental equation of bending we can find the bending stresses as per figure 3.4.
We know that,
Where,
M = Moment of Resistance, I = Moment of Inertia about neutral axis, = Bending stress, y =
Extreme fibre distance from neutral axis, P = Maximum load at which beam fails, b = width of
the beam, d = depth of the beam, and L=length of the beam. Now, the above equation can be
written as
Now, from the fig 3.4, we get,
In the case of three-point loading (figure 3.3) the bending stress is given as;

59
CHAPTER FOUR: RESULTS AND ANALYSIS
4.1 Particle size distribution (Sieve analysis)
From the sieve analysis, the fine aggregate fitted into zone 2 grading according to BS 882 1992.
The fine aggregate grading, upper and lower limits bounds are shown on fig 2. For the coarse
aggregates, the grading done fitted into the 5 – 10 mm size bracket for aggregates according to
table 3 of BS 882-1992.
Sieve
size
No
Sieve
sizes
(mm)
mass
retained (g)
Cumulative
mass
retained(g)
% retained %Cumulative
mass retained
%Cumulative
mass passing
7 2.83 0 0 1.90 0 100
14 1.41 164 164 17.64 12.69 87.13
18 1.0 165 329 43.58 25.46 74.54
25 0.707 180 509 26.84 39.40 60.60
35 0.5 255 764 7.52 59.13 40.87
52 0.297 342 1106 1.76 85.60 14.4
100 0.149 154 1260 0.76 97.52 2.48
>100 32 1292 100 0
TOTAL 1292
Table 4.1- sieve analysis results
Chart 4.1Particle distribution curve for fine aggregates.
0
20
40
60
80
100
120
0.1 1 10
Particle size distribution curve for fine aggregates.
%Cumulative masspassing
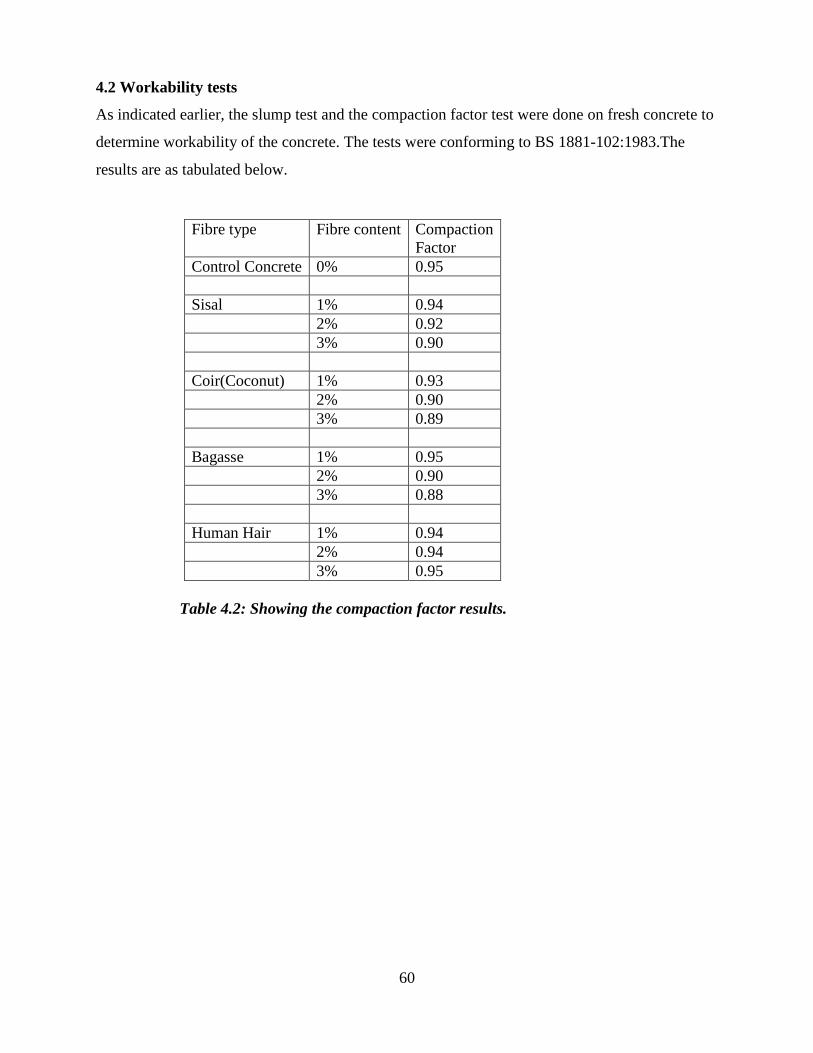
60
4.2 Workability tests
As indicated earlier, the slump test and the compaction factor test were done on fresh concrete to
determine workability of the concrete. The tests were conforming to BS 1881-102:1983.The
results are as tabulated below.
Fibre type Fibre content Compaction
Factor
Control Concrete 0% 0.95
Sisal 1% 0.94
2% 0.92
3% 0.90
Coir(Coconut) 1% 0.93
2% 0.90
3% 0.89
Bagasse 1% 0.95
2% 0.90
3% 0.88
Human Hair 1% 0.94
2% 0.94
3% 0.95
Table 4.2: Showing the compaction factor results.

61
Fibre type Fibre content Slump
(mm)
Control Concrete 0% 37
Sisal 1% 24
2% 25
3% 24
Coir(Coconut) 1% 17
2% 15
3% 12
Bagasse 1% 15
2% 15
3% 10
Human Hair 1% 24
2% 24
3% 27
Table 4.3: Showing the slump test results.
From the experiment it was realized that there was a variation on the consistency and workability
of the concrete mix depending on the fibre used and the volume of the fibre in the mix. The
results are discussed further in chapter five.
4.3 Mechanical tests
4.3.1 Cube crushing Test
The results are briefly tabulated and are shown in table 4.4 and table 4.5. Table 4.4 shows results
of the test performed on cubes for the7days compressive strength with the various proportions of
varying percentages of fibre by the weight of cement, while table 4.5 shows the strength at
28days.The two tables show the average results for the cubes tested, for the detailed results of
each cube tested, see appendix 1.
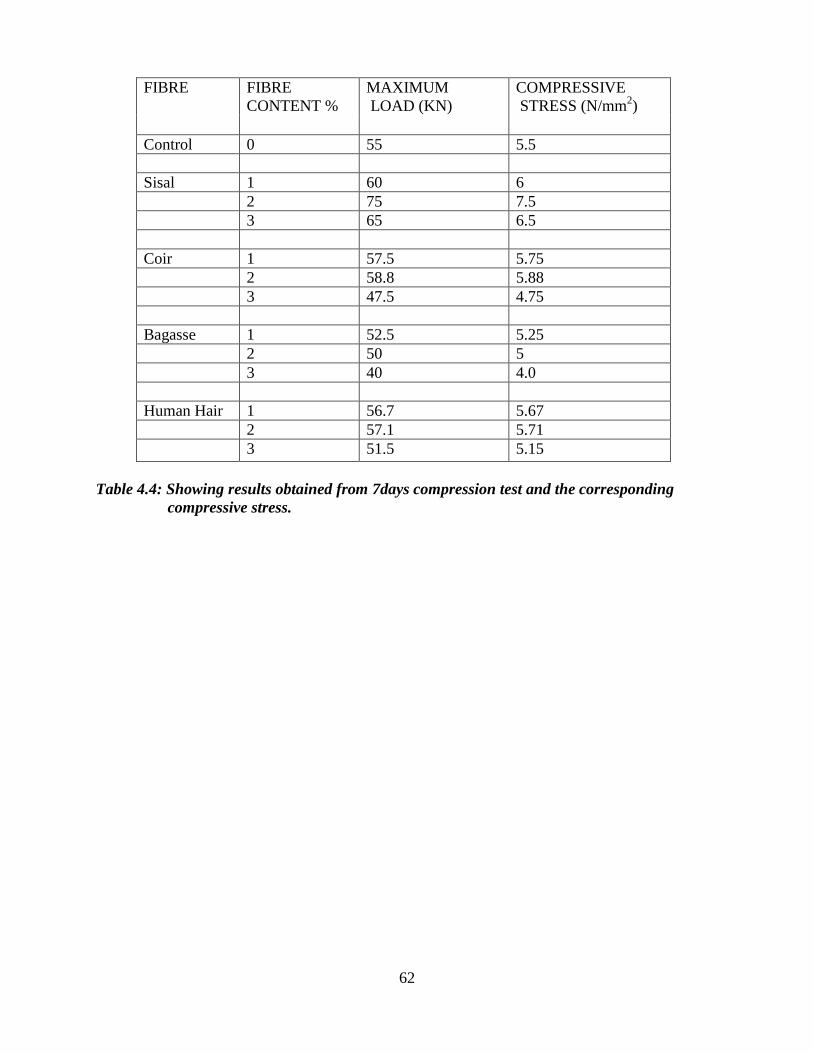
62
FIBRE FIBRE
CONTENT %
MAXIMUM
LOAD (KN)
COMPRESSIVE
STRESS (N/mm2)
Control 0 55 5.5
Sisal 1 60 6
2 75 7.5
3 65 6.5
Coir 1 57.5 5.75
2 58.8 5.88
3 47.5 4.75
Bagasse 1 52.5 5.25
2 50 5
3 40 4.0
Human Hair 1 56.7 5.67
2 57.1 5.71
3 51.5 5.15
Table 4.4: Showing results obtained from 7days compression test and the corresponding
compressive stress.

63
FIBRE FIBRE
CONTENT %
MAXIMUM LOAD
RECORDED (KN)
COMPRESSIVE
STRESS (N/mm2)
Control 0 156 15.6
Sisal 1 180 18
2 140 14
3 100 10
Coir 1 176.5 17.65
2 179 17.9
3 160 16.0
Bagasse 1 172.5 17.25
2 160 16.0
3 70 7.0
Human Hair 1 170 17
2 180 18
3 140 14
Table 4.5: Showing results obtained from 28days compression test and the corresponding
compressive stress.
The addition of fibre was seen to increase the compressive strength of concrete by about 13% but
in some cases like in 2% sisal and 3% human hair, it reduced the strength by about 6%.The
results are discussed in detail in chapter five.

64
4.3.2 Splitting Tensile Test
The table below shows the results of the splitting tensile test done on a cylinder specimen
moulded for each batch of concrete produced.
FIBRE FIBRE
CONTENT %
7 DAYS 28 DAYS
LOAD
(KN)
STRESS
(N/mm2)
LOAD
(KN)
STRESS
(N/mm2)
Control 0 45 0.63 100 1.41
Sisal 1 60 0.84 115 1.62
2 90 1.27 120 1.69
3 65 0.91 100 1.41
Coir 1 60 0.84 115 1.62
2 74 1.04 119 1.68
3 65 0.91 85 1.2
Bagasse 1 58.5 0.82 105 1.48
2 55 0.77 90 1.27
3 30 0.42 30 0.42
Human Hair 1 80 1.13 117 1.65
2 60 0.84 119 1.68
3 55 0.77 110 1.55
Table 4.6: Showing results obtained from splitting tensile test and the corresponding tensile
stress.
The variation of the tensile stress with the type and volume of fibre used is also discussed in
chapter five.

65
4.3.3 Flexural/Bending Test
The results of the four point loading tests on beam specimens are shown below.
FIBRE FIBRE
CONTE
NT %
7 DAYS 28 DAYS
LOAD
(Div.)
LOAD
(KN)
STRESS
(N/mm2)
LOAD
(Div.)
LOAD
(KN)
STRESS
(N/mm2)
Control 0 15 2.99 0.45 25 4.98 0.747
Sisal 1 20 3.99 0.6 32 6.38 0.957
2 22 4.38 0.65 41 8.17 1.225
3 19 3.79 0.56 35 6.98 1.047
Coir 1 19 3.79 0.56 37 7.38 1.107
2 20 3.99 0.6 39 7.78 1.167
3 17 3.39 0.5 27 5.38 0.807
Bagasse 1 17 3.39 0.5 39 7.78 1.167
2 18.5 3.69 0.55 25 4.98 0.747
3 17 3.39 0.5 23 4.58 0.687
Human Hair 1 18 3.59 0.53 27 5.38 0.807
2 19 3.79 0.56 29 5.78 0.867
3 17.5 3.49 0.52 22 4.38 0.657
Table 4.7: Showing results obtained from flexural/bending test and the corresponding flexural
stress.
NB: - 1 Div. =44lbs=199.5N
As above, the results of the flexural test are discussed in chapter five.
Further tests were done on sisal fibre which was parallel aligned in a beam specimen during
moulding. These specimens were tested for flexure.
The results of flexural bending of the parallel sisal fibre were recorded as below

66
FIBRE
TYPE
FIBRE
CONTENT
%
7 DAYS 28 DAYS
LOAD
(Div.)
LOAD
(KN)
STRESS
(N/mm2)
LOAD
(Div.)
LOAD
(KN)
STRESS
(N/mm2)
Control 0 15 2.99 0.45 25 4.98 0.747
Twine 1 22 4.389 0.65 36 7.182 1.07
2 32 6.384 1.03 41 8.1795 1.22
3 29 5.7855 0.86 50 9.975 1.50
Twisted 1 24 4.788 0.71 39 7.7805 1.17
2 28 5.586 0.83 44 8.778 1.32
3 32 6.384 0.95 55 10.9725 1.65
Table 4.8: Showing results obtained from flexural/bending test and the corresponding flexural
stress of parallel aligned sisal fibres.
It was seen that the beams with the parallel aligned sisal fibres were able to take some more load
even after the first crack appeared. This is because the fibres were able to take more tensile stress
along there length before pull out occurred. This is further explained in chapter five.

67
CHAPTER FIVE: DISCUSSION
5.1 Compaction factor
After testing for the compaction factor, the mixture consistency was defined by referring to the
table below:
CONSISTENCY
COMPACTION FACTOR
(weight of partially
compacted /weight of fully
compacted concrete)
Very Dry 0.70
Very Hard 0.78
Hard 0.85
Plastic Hard 0.89
Plastic 0.92
Liquid 0.95
High Liquid 1.00
Table 5.1: Showing different consistency and compaction factor thereof,
From the compaction factor tests, it was shown that addition of fiber reduced the workability of
the fresh concrete. This is attributed to the fact that the fibres absorb some of the water in the
concrete mix making the mix be of less flow. Also, the fibres tangle or ball inside the mix and
this reduces the workability as well. A bagasse fibre content of 3% produced the least
compaction factor of 0.88, whereas the highest compaction factor was of 0.95 of plain concrete

68
and the human hair fibre at 3% fibre content. The two were categorized as plastic hard and liquid
respectively from table 5.1 above.
Human hair absorbs the least water from the mix, and bagasse the most. Probably, this is
attributed to the presence of keratin in hair which makes the hair hydrophilic and thus absorbs
very little water. On the other hand, the hemicellulose and cellulose; and the remaining sugars in
bagasse absorb a lot of water reducing the compaction factor the most. If a uniform compaction
factor is to be achieved across the mixes with the different fibres, then various tests should be
carried out so as to determine the suitable water/cement ratio for each of the mix.
5.2 Slump test
Whereas the principle of the compaction factor test is to quantitavely determine the degree of
compaction achieved by a standard amount of work done on the fresh concrete, the slump test is
a qualitative test that measures the consistency of a cone of fresh concrete. The slumped concrete
takes various shapes, and according to the profile of slumped concrete, the slump is termed as
true slump, shear slump or collapses slump. If a shear or collapse slump is obtained, a fresh
sample should be obtained and the test repeated. A collapse slump is an indication of too wet a
mix. It generally means that the mix is too wet or is a high workability mix, for which slump test
is not appropriate [31, 32]
.Only a true slump is of any use in the test.
(a) (b) (c)
Figure 5.1 Showing (a) Collapse slump, (b) Shear slump and (c) True slump
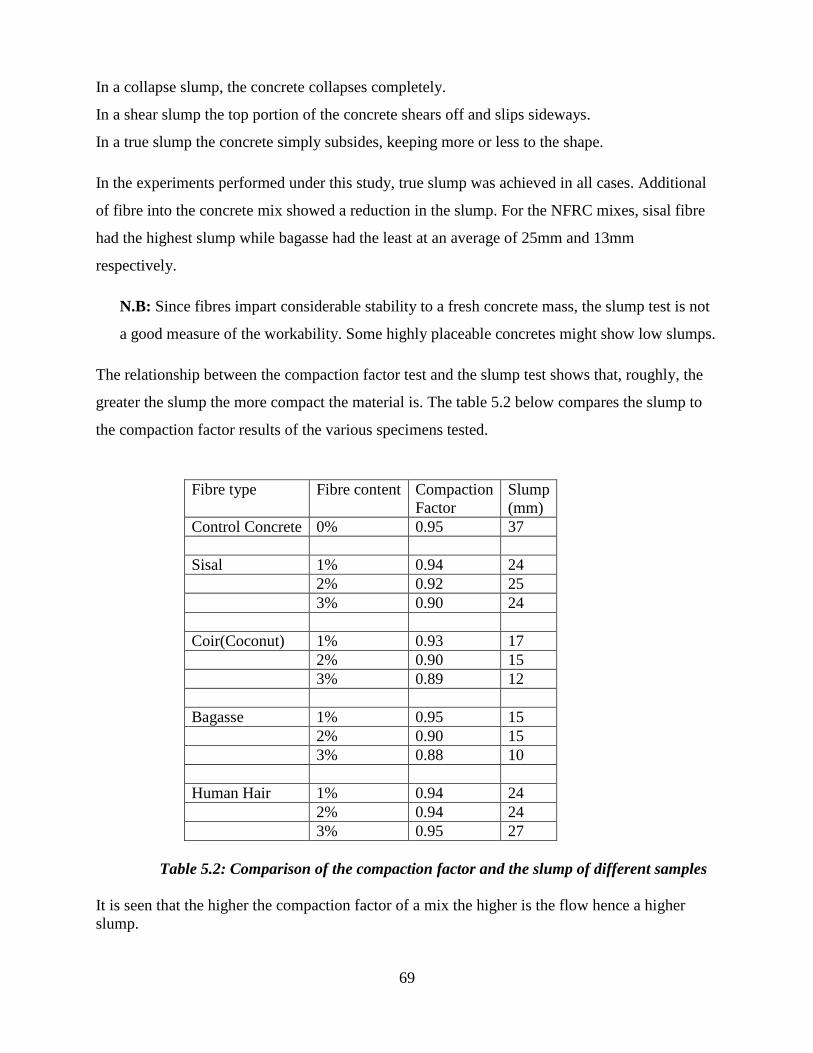
69
In a collapse slump, the concrete collapses completely.
In a shear slump the top portion of the concrete shears off and slips sideways.
In a true slump the concrete simply subsides, keeping more or less to the shape.
In the experiments performed under this study, true slump was achieved in all cases. Additional
of fibre into the concrete mix showed a reduction in the slump. For the NFRC mixes, sisal fibre
had the highest slump while bagasse had the least at an average of 25mm and 13mm
respectively.
N.B: Since fibres impart considerable stability to a fresh concrete mass, the slump test is not
a good measure of the workability. Some highly placeable concretes might show low slumps.
The relationship between the compaction factor test and the slump test shows that, roughly, the
greater the slump the more compact the material is. The table 5.2 below compares the slump to
the compaction factor results of the various specimens tested.
Fibre type Fibre content Compaction
Factor
Slump
(mm)
Control Concrete 0% 0.95 37
Sisal 1% 0.94 24
2% 0.92 25
3% 0.90 24
Coir(Coconut) 1% 0.93 17
2% 0.90 15
3% 0.89 12
Bagasse 1% 0.95 15
2% 0.90 15
3% 0.88 10
Human Hair 1% 0.94 24
2% 0.94 24
3% 0.95 27
Table 5.2: Comparison of the compaction factor and the slump of different samples
It is seen that the higher the compaction factor of a mix the higher is the flow hence a higher
slump.
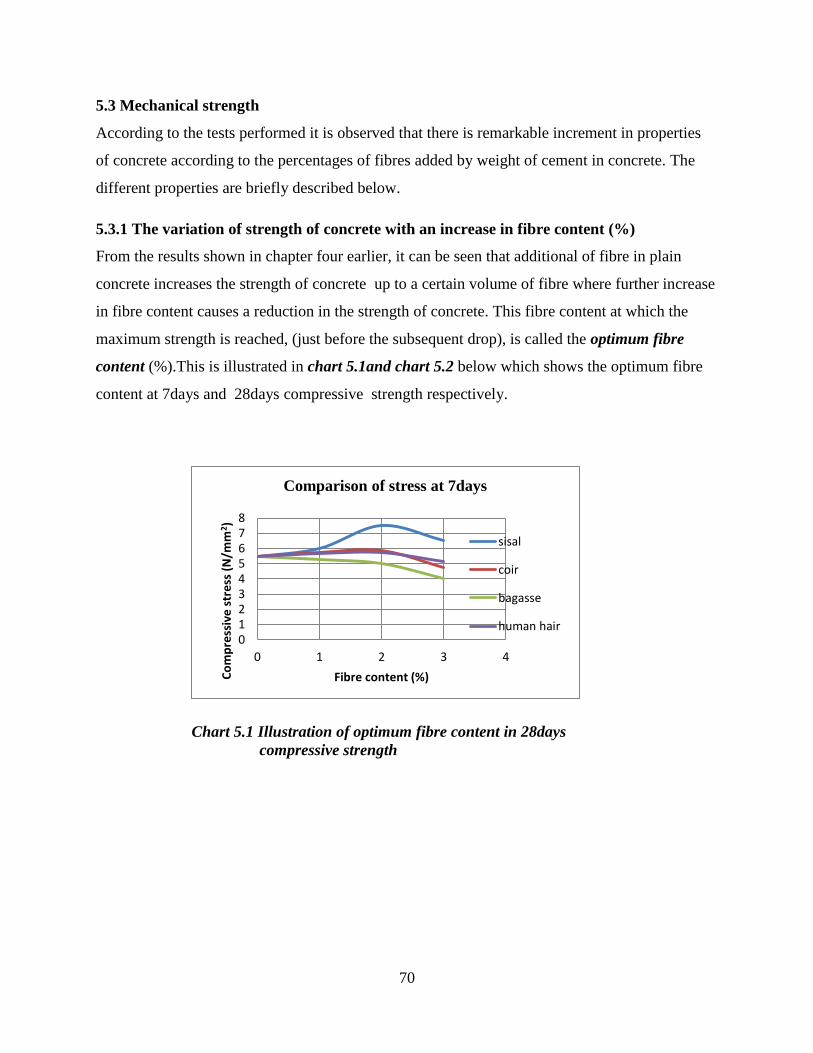
70
5.3 Mechanical strength
According to the tests performed it is observed that there is remarkable increment in properties
of concrete according to the percentages of fibres added by weight of cement in concrete. The
different properties are briefly described below.
5.3.1 The variation of strength of concrete with an increase in fibre content (%)
From the results shown in chapter four earlier, it can be seen that additional of fibre in plain
concrete increases the strength of concrete up to a certain volume of fibre where further increase
in fibre content causes a reduction in the strength of concrete. This fibre content at which the
maximum strength is reached, (just before the subsequent drop), is called the optimum fibre
content (%).This is illustrated in chart 5.1and chart 5.2 below which shows the optimum fibre
content at 7days and 28days compressive strength respectively.
Chart 5.1 Illustration of optimum fibre content in 28days
compressive strength
012345678
0 1 2 3 4
Co
mp
ress
ive
str
ess
(N
/mm
2)
Fibre content (%)
Comparison of stress at 7days
sisal
coir
bagasse
human hair

71
Chart 5.2 Illustration of optimum fibre content in 28days
compressive strength
For the sisal fibre the optimum fibre content is about 2.0%, whereas for the coir is around 1.8%,
at 7days.Bagasse is a very sensitive fibre and hence the consistent drop in strength with
additional of fibre. Strength reduction is due to the presence of entrapped air due to fibre
presence. This can be used to explain why bagasse fibre shows a reduced strength when added to
concrete. It has the most air trapped in the fibrous elements as compared to all the other fibres
used in this study.
Increase in fibre content also reduces the chemical bonding within the matrix. This is as a result
of the fibres forming thick strands that have interfaces not bonded to the cementitious paste. The
mechanical bonding of the fibres at the fibre-cement interface can also result to lower strength
due to shear failure, and this increases as the fibre content in the mix increases.
From chart 5.2, it can be seen that with a longer period of curing i.e. 28days, the optimum fibre
content can vary from that at 7days.This can be explained by the various chemical reactions that
undergo in the fibre-cement matrix and also the water absorption by the fibres. For instance the
optimum fibre content for sisal at 28days is about 1.0% down from 2.0% at 7days.This shows
that higher fibre content mixes have reduced strength as aging continues. This could be due to
lack of proper binding between the fibres, especially where balling could have occurred during
vibration. Also, as all water is used up during hydration, it leaves voids of the entrapped air
reducing the strength of the concrete. It could also be an indication that the fibre deteriorates in
the cementitious mix and more studies should be done to arrive at a suitable conclusion.
0
5
10
15
20
0 1 2 3 4
Co
mp
ress
ive
str
ess
(N
/mm
2 )
Fibre content(%)
Comparison of stress at 28days
sisal
coir
bagasse
humanhair
72
5.3.2 Plain concrete (control) as compared to natural fibre reinforced concrete in general
Compressive strength.
The results on Table 4.4 and Table 4.5 show that the addition of fibre in plain concrete increased
the compressive stress by some considerable amount. For the 7days strength there was an
increase of about 36% by incorporation of 2% sisal fibre and the lowest increase being of 3% by
addition of 1% human hair fibre.
In some cases, addition of fibre led to a decrease of the compressive strength of the mix as is
illustrated by a drop of 27% in the case of 3% bagasse fibre, 9.1% in 2% bagasse fibre
content,4.5% in 1% bagasse fibre content, and 13.36% in 3% coir fibre content. Generally,
bagasse fibre showed a decrease in the compressive strength at all three fibre content
percentages. The reduction, as earlier mentioned, is due to increased balling of the fibres in the
mix and also due to absorption of water in the mix by the hemicellulose and cellulose in the
bagasse fibre leaving little for complete hydration of the cement.
At 28days strength, sisal fibre (1%) and human hair(2%) gave the highest compressive strength
with an increase of 15.4%.Generally,as fibre was increased the compressive stress increased, but
after the optimum fibre content was reached the stress dropped, and on further increase the
resultant concrete was of lesser strength than the control. Sisal had the highest strength because
of its high aspect ratio. The keratin in human hair is a tough structural element and hence the
high strengths witnessed in human hair too.
It is assumed that concrete attains its highest strength at the age of 28days.
Tensile strength
Table 4.6 gives the results of the 7 days and 28 days tensile tests on cylinder specimens. As
above, additional of fiber increases the tensile strength of the concrete specimens. This applies in
all cases apart from the mixes with 3% fiber content of coir and bagasse fibres. The highest
increase of tensile stress (28days) is at 2% sisal fibre mix with an increase of 19.9%.
Flexural strength
From the results in Table 4.7, it can be seen that addition of fibres in concrete increase the
flexural/bending strength of the mass with as high as 63.9% in the case of 2% sisal fibre content

73
as at 28days of curing. The flexural strength increased across all the mixes apart from 3% fibre
content of bagasse and human hair where it was lower by 8% and 12% respectively.
These variations are clearly illustrated in Chart 8.9 to Chart 8.12 in appendix 2, showing the
comparison of the fibre bending strengths for both7day and 28days periods. The chart 5.3 below
illustrates the general trend in stress due to the different fibres under varying fibre volume. It
shows the 28days flexural stress of the specimens tested.
Chart 5.3: Illustration of optimum fibre content in 28days flexural strength.
NOTE: Downgrading of concrete mix.
From the results of the compressive strength tests, the grade of the concrete mix was
downgraded from Grade 25 to Grade 15 on the principle that the concrete grade is
the strength achieved by the control (unreinforced/plain concrete mix) at 28days of
age. The strength achieved was 15.6N/mm2.Prior studies have shown that the
compressive strength of the matrix depends on whether mortar or concrete (having
coarse aggregates) is used. A mix of mortar (without coarse aggregates) has less
0
0.2
0.4
0.6
0.8
1
1.2
1.4
0 0.5 1 1.5 2 2.5 3 3.5
Fle
xura
l str
en
gth
(N
/mm
2)
Fibre content (%)
Comparison of flexural strength at 28days
sisal
coir
bagasse
human hair
74
compressive strength to that of concrete; and it hence that for coarse aggregates of
lesser diameter is weaker in compression than of larger diameter aggregates.
The downgrading was necessary since cubes of 100x100x100mm size were used
instead of the standard cubes of 150x150x150mm,and the size of coarse aggregate
used was also smaller i.e. 10mm instead of the standard 20mm.Hence,it was not
possible to achieve a Grade 25 (25N/mm2) mix. However, this presumption is open
for further research.
5.3.3 Comparison of the compressive, tensile and flexural strength of concrete.
5.3.3.1 Compressive vs. Tensile strength
A correlation can be made between the compressive strength vs. the tensile strength. Concrete is
assumed have a 10% tensile strength when compared to its compressive strength .The tensile
strength is often taken as 6.7 times the square root of its compressive strength [37]
. Where a
conservative estimate is in order, a minimum tensile strength of 4 times the square root of the
compressive strength can be used.
5.3.3.2 Compressive vs. Flexural strength
The relationship is given in terms of the modulus of rupture, a more direct measure of flexural
strength .It can be found by raising the compressive strength to the 2/3 power and multiplying
that by 2.3[38]
.
5.3.3.3 Tensile vs. Flexural strength
The flexural strength would be the same as the tensile strength if the material were homogenous.
In fact, most materials have small or large defects in them which act to concentrate the stresses
locally, effectively causing a localized weakness. When a material is bent only the extreme fibres
are at the highest stress so, if those fibers are free from defects, the flexural strength will be
controlled by the strength of those intact fibers. However, if the same material was subjected to
only tensile forces, then all the fibres in the material are at the same stress and failure will initiate
when the weakest fibre reaches its limiting tensile stress [39]
. Therefore it is common for flexural
strengths to be higher than tensile strengths for the same material. Conversely, a homogenous
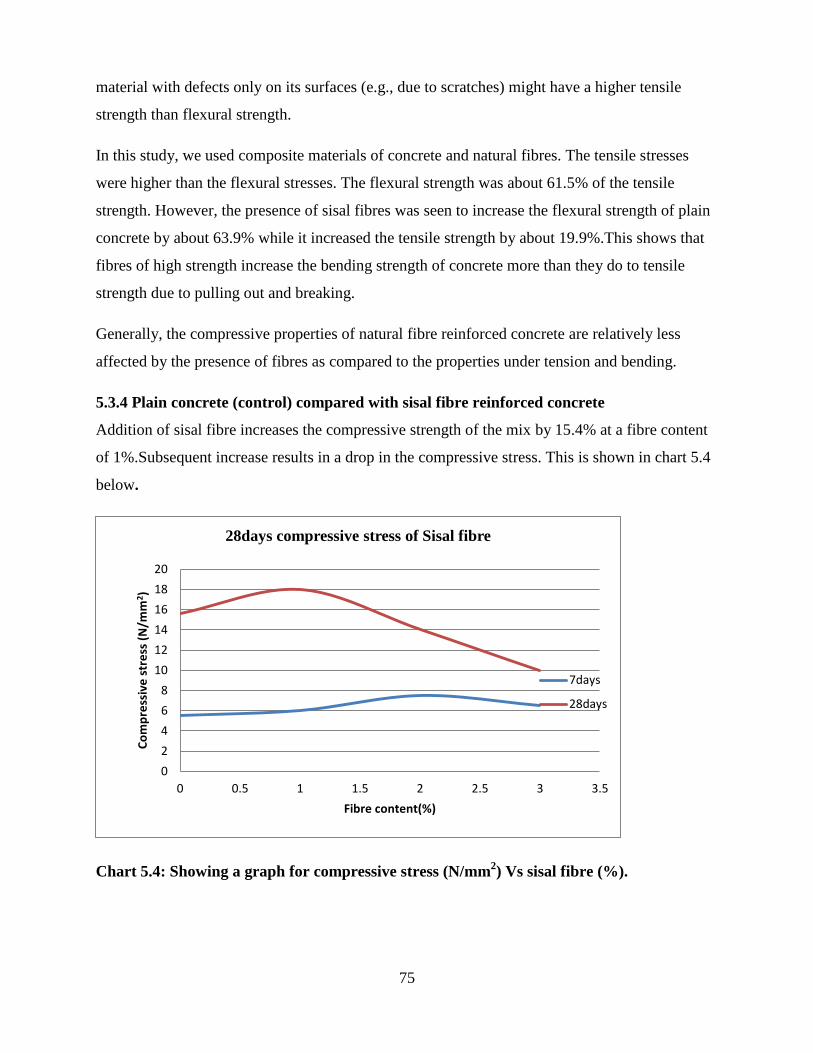
75
material with defects only on its surfaces (e.g., due to scratches) might have a higher tensile
strength than flexural strength.
In this study, we used composite materials of concrete and natural fibres. The tensile stresses
were higher than the flexural stresses. The flexural strength was about 61.5% of the tensile
strength. However, the presence of sisal fibres was seen to increase the flexural strength of plain
concrete by about 63.9% while it increased the tensile strength by about 19.9%.This shows that
fibres of high strength increase the bending strength of concrete more than they do to tensile
strength due to pulling out and breaking.
Generally, the compressive properties of natural fibre reinforced concrete are relatively less
affected by the presence of fibres as compared to the properties under tension and bending.
5.3.4 Plain concrete (control) compared with sisal fibre reinforced concrete
Addition of sisal fibre increases the compressive strength of the mix by 15.4% at a fibre content
of 1%.Subsequent increase results in a drop in the compressive stress. This is shown in chart 5.4
below.
Chart 5.4: Showing a graph for compressive stress (N/mm2) Vs sisal fibre (%).
0
2
4
6
8
10
12
14
16
18
20
0 0.5 1 1.5 2 2.5 3 3.5
Co
mp
ress
ive
str
ess
(N
/mm
2 )
Fibre content(%)
28days compressive stress of Sisal fibre
7days
28days

76
Chart 5.4 shows that the optimum fibre content percentage is around 1% for the sisal fibre after
attaining its highest strength at 28days of age. The 7days compressive stress is 33.3% of the
maximum 28days stress i.e.at 2% fibre content.
From chart 5.4 above, one maybe quick to assume that by extrapolation, a further increase in
fibre volume will result in the 7days and 28days strength becoming equal at some point. This is
not necessarily true since the stress will continue decreasing for each period and there is only so
much fibre we can add for the concrete to be workable and without excessive balling which will
result in a different matrix altogether. However, in cases of accelerated aging or where
admixtures have been used the phenomenal can occur [33]
.
As for the tensile strength, it is highest at 1.69N/mm2 for a fibre content of 2% at 28days of age.
This is an increase of 19.9% from that of control (1.41 N/mm2).The tensile strength also reduces
as the fibre content is increased beyond the optimum. This is clearly illustrated by the charts
below.
Chart 5.5: Showing bar graph for tensile
stress Vs varying sisal fibre content.
Chart 5.6: Showing line graph for tensile
stress Vs varying sisal fibre content.
A look at the flexural strength results indicate that addition of sisal fibre increased the flexural
strength of the concrete mass by up to 63.9% 9 (i.e. from 0.747N/mm2 to 1.225N/mm
2) at 2%
sisal fibre content. This is shown in the charts below.
0
0.2
0.4
0.6
0.8
1
1.2
1.4
1.6
1.8
0 1 2 3
Ten
sile
str
ess
(N
/mm
2)
Fibre content (%)
Sisal fibre
7days
28days
0
0.2
0.4
0.6
0.8
1
1.2
1.4
1.6
1.8
0 1 2 3 4
Ten
sile
str
ess
(N
/mm
2)
Fibre content (%)
Sisal fibre
7days
28days
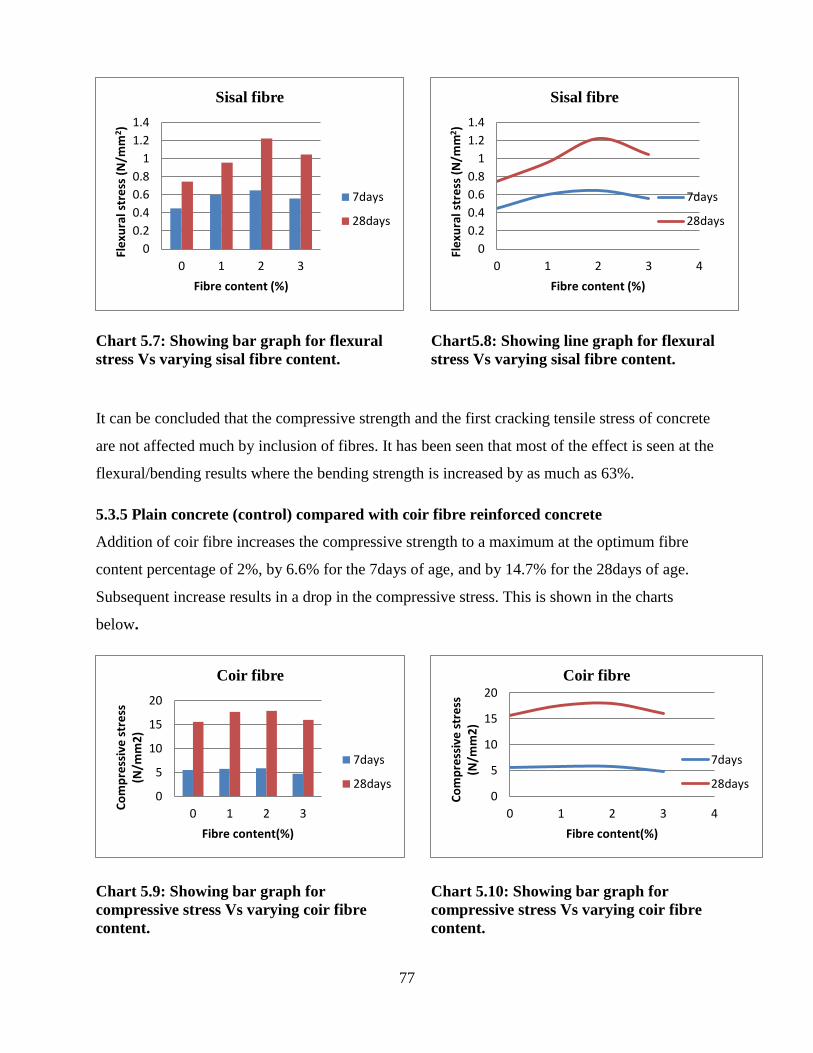
77
Chart 5.7: Showing bar graph for flexural
stress Vs varying sisal fibre content.
Chart5.8: Showing line graph for flexural
stress Vs varying sisal fibre content.
It can be concluded that the compressive strength and the first cracking tensile stress of concrete
are not affected much by inclusion of fibres. It has been seen that most of the effect is seen at the
flexural/bending results where the bending strength is increased by as much as 63%.
5.3.5 Plain concrete (control) compared with coir fibre reinforced concrete
Addition of coir fibre increases the compressive strength to a maximum at the optimum fibre
content percentage of 2%, by 6.6% for the 7days of age, and by 14.7% for the 28days of age.
Subsequent increase results in a drop in the compressive stress. This is shown in the charts
below.
Chart 5.9: Showing bar graph for
compressive stress Vs varying coir fibre
content.
Chart 5.10: Showing bar graph for
compressive stress Vs varying coir fibre
content.
0
0.2
0.4
0.6
0.8
1
1.2
1.4
0 1 2 3
Fle
xura
l str
ess
(N
/mm
2)
Fibre content (%)
Sisal fibre
7days
28days
0
0.2
0.4
0.6
0.8
1
1.2
1.4
0 1 2 3 4
Fle
xura
l str
ess
(N
/mm
2)
Fibre content (%)
Sisal fibre
7days
28days
0
5
10
15
20
0 1 2 3
Co
mp
ress
ive
str
ess
(N
/mm
2)
Fibre content(%)
Coir fibre
7days
28days0
5
10
15
20
0 1 2 3 4
Co
mp
ress
ive
str
ess
(N
/mm
2)
Fibre content(%)
Coir fibre
7days
28days

78
The maximum 7days strength (5.88N/mm2) is 33% of the highest 28days strength (17.9N/mm
2).
As for the tensile strength, it is highest at 1.68N/mm2 for a fibre content of 2% at 28days of age.
This is an increase of 19.1% from that of control (1.41 N/mm2).The tensile strength also reduces
as the fibre content is increased beyond the optimum. This is clearly illustrated by the charts
below
Chart 5.11: Showing bar graph for tensile
stress Vs varying coir fibre content.
Chart 5.12: Showing line graph for tensile
stress Vs varying coir fibre content.
The flexural strength results indicate that addition of coir fibre increased the flexural strength of
the concrete mass by up to 56.2% 9 (i.e. from 0.747N/mm2 to 1.167N/mm2) at 2% coir fibre
content (for 28days).Just like as discussed above, additional of fibre increase flexural strength up
to the optimum, and further increase of fibre results in a reduction in the flexural strength. This is
shown in the charts below.
0
0.5
1
1.5
2
0 1 2 3
Ten
sile
str
ess
(N
/mm
2)
Fibre content (%)
Coir fibre
7 days
28days
00.20.40.60.8
11.21.41.61.8
0 1 2 3 4Ten
sile
str
ess
(N
/mm
2)
Fibre content (%)
Coir fibre
7 days
28days

79
Chart 5.13: Showing bar graph for
flexural stress Vs varying coir fibre
content.
Chart 5.14: Showing line graph for
flexural stress Vs varying coir fibre
content.
Like in sisal fibres above, the coir fibres increases the flexural strength the most by up to 56.2%,
when compared to the compressive and tensile strengths at 14.7% and 19.1% respectively.
5.3.6 Plain concrete (control) compared with bagasse fibre reinforced concrete
From chart-25 and chart-26 below, at 7days of curing, addition of bagasse fibre is seen to reduce
the compressive strength consistently. Tests after 28days of curing show that the compressive
strength increases as fibre is increased to an optimum of 1%, where the strength starts to drop
with more increase of the fibre. The compressive strength is increased by up to 10.6% compared
to that of the control.
0
0.2
0.4
0.6
0.8
1
1.2
1.4
0 1 2 3
Fle
xura
l str
ess
(N/m
m2
)
Fibre content (%)
Coir fibre
7days
28days
0
0.2
0.4
0.6
0.8
1
1.2
1.4
0 1 2 3 4
Fle
xura
l str
ess
(N/m
m2
)
Fibre content (%)
Coir fibre
7days
28days

80
Chart 5.15: Showing bar graph for
compressive stress Vs varying bagasse
fibre content.
Chart 5.16: Showing line graph for
compressive stress Vs varying bagasse
fibre content.
The tensile strength was highest at 1.48N/mm2
for a fibre content of 1% at 28days of age. This is
an increase of 5.0% from that of control (1.41 N/mm2).The tensile strength also reduces as the
fibre content is increased beyond the optimum. This is clearly illustrated by the charts below.
Chart 5.16: Showing bar graph for tensile
stress Vs varying bagasse fibre content.
Chart 5.17: Showing line graph for tensile
stress Vs varying bagasse fibre content.
0
5
10
15
20
0 1 2 3Co
mp
ress
ive
str
ess
(N
/mm
2)
Fibre content(%)
Bagasse
7days
28days
0
5
10
15
20
0 1 2 3 4
Co
mp
ress
ive
str
ess
(N
/mm
2)
Fibre content(%)
Bagasse
7days
28days
0
0.2
0.4
0.6
0.8
1
1.2
1.4
1.6
0 1 2 3
Ten
sile
str
ess
(N
/mm
2)
Fibre content (%)
Bagasse fibre
7 days
28days
0
0.2
0.4
0.6
0.8
1
1.2
1.4
1.6
0 1 2 3 4
Ten
sile
str
ess
(N
/mm
2)
Fibre content (%)
Bagasse fibre
7 days
28days
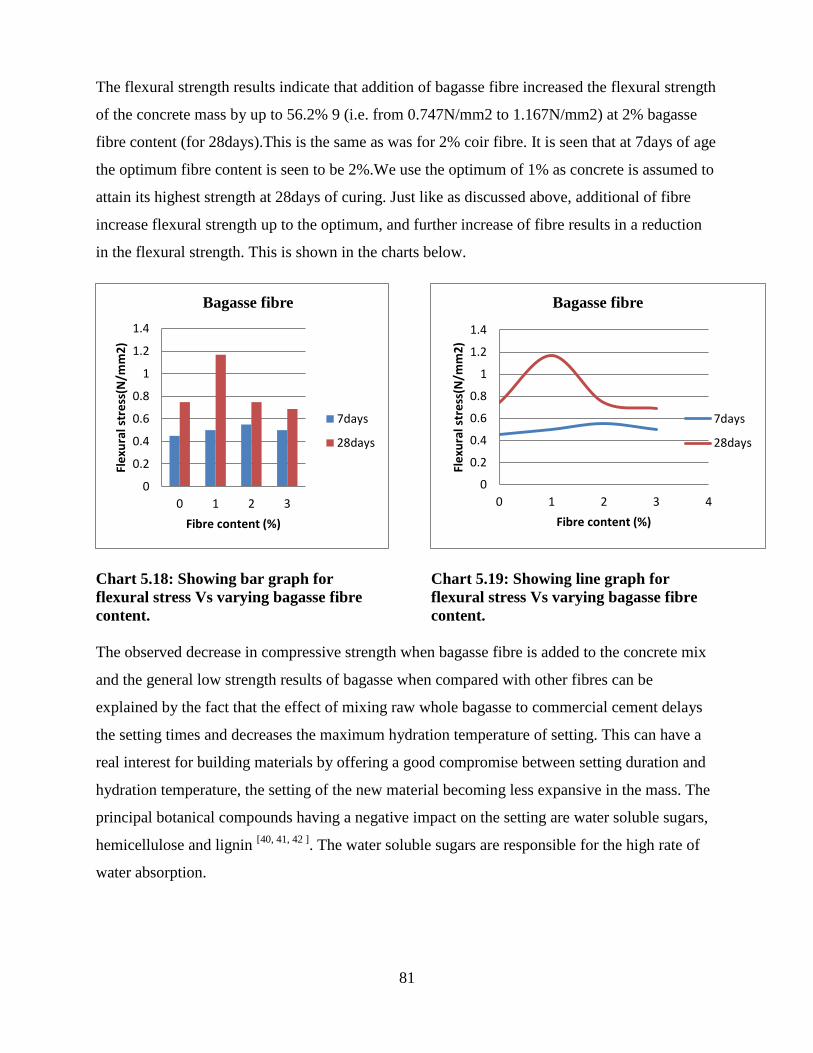
81
The flexural strength results indicate that addition of bagasse fibre increased the flexural strength
of the concrete mass by up to 56.2% 9 (i.e. from 0.747N/mm2 to 1.167N/mm2) at 2% bagasse
fibre content (for 28days).This is the same as was for 2% coir fibre. It is seen that at 7days of age
the optimum fibre content is seen to be 2%.We use the optimum of 1% as concrete is assumed to
attain its highest strength at 28days of curing. Just like as discussed above, additional of fibre
increase flexural strength up to the optimum, and further increase of fibre results in a reduction
in the flexural strength. This is shown in the charts below.
Chart 5.18: Showing bar graph for
flexural stress Vs varying bagasse fibre
content.
Chart 5.19: Showing line graph for
flexural stress Vs varying bagasse fibre
content.
The observed decrease in compressive strength when bagasse fibre is added to the concrete mix
and the general low strength results of bagasse when compared with other fibres can be
explained by the fact that the effect of mixing raw whole bagasse to commercial cement delays
the setting times and decreases the maximum hydration temperature of setting. This can have a
real interest for building materials by offering a good compromise between setting duration and
hydration temperature, the setting of the new material becoming less expansive in the mass. The
principal botanical compounds having a negative impact on the setting are water soluble sugars,
hemicellulose and lignin [40, 41, 42 ]
. The water soluble sugars are responsible for the high rate of
water absorption.
0
0.2
0.4
0.6
0.8
1
1.2
1.4
0 1 2 3
Fle
xura
l str
ess
(N/m
m2
)
Fibre content (%)
Bagasse fibre
7days
28days
0
0.2
0.4
0.6
0.8
1
1.2
1.4
0 1 2 3 4
Fle
xura
l str
ess
(N/m
m2
)
Fibre content (%)
Bagasse fibre
7days
28days
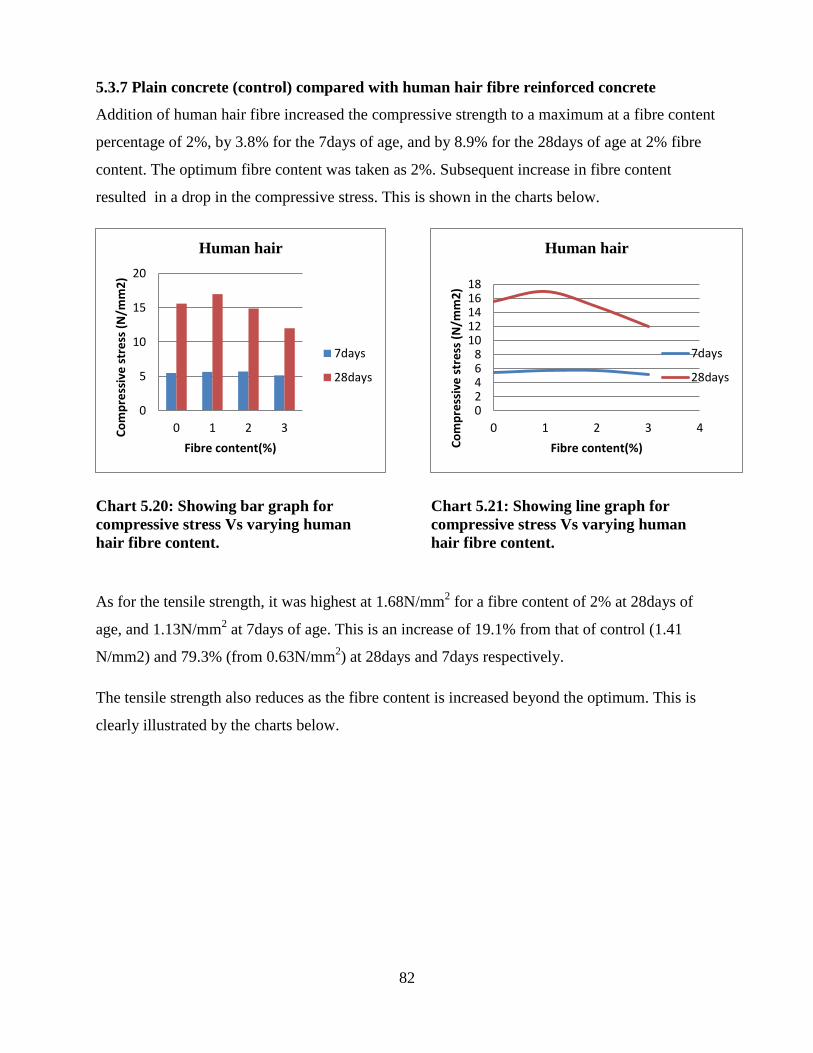
82
5.3.7 Plain concrete (control) compared with human hair fibre reinforced concrete
Addition of human hair fibre increased the compressive strength to a maximum at a fibre content
percentage of 2%, by 3.8% for the 7days of age, and by 8.9% for the 28days of age at 2% fibre
content. The optimum fibre content was taken as 2%. Subsequent increase in fibre content
resulted in a drop in the compressive stress. This is shown in the charts below.
Chart 5.20: Showing bar graph for
compressive stress Vs varying human
hair fibre content.
Chart 5.21: Showing line graph for
compressive stress Vs varying human
hair fibre content.
As for the tensile strength, it was highest at 1.68N/mm2 for a fibre content of 2% at 28days of
age, and 1.13N/mm2 at 7days of age. This is an increase of 19.1% from that of control (1.41
N/mm2) and 79.3% (from 0.63N/mm2) at 28days and 7days respectively.
The tensile strength also reduces as the fibre content is increased beyond the optimum. This is
clearly illustrated by the charts below.
0
5
10
15
20
0 1 2 3Co
mp
ress
ive
str
ess
(N
/mm
2)
Fibre content(%)
Human hair
7days
28days
02468
1012141618
0 1 2 3 4
Co
mp
ress
ive
str
ess
(N
/mm
2)
Fibre content(%)
Human hair
7days
28days
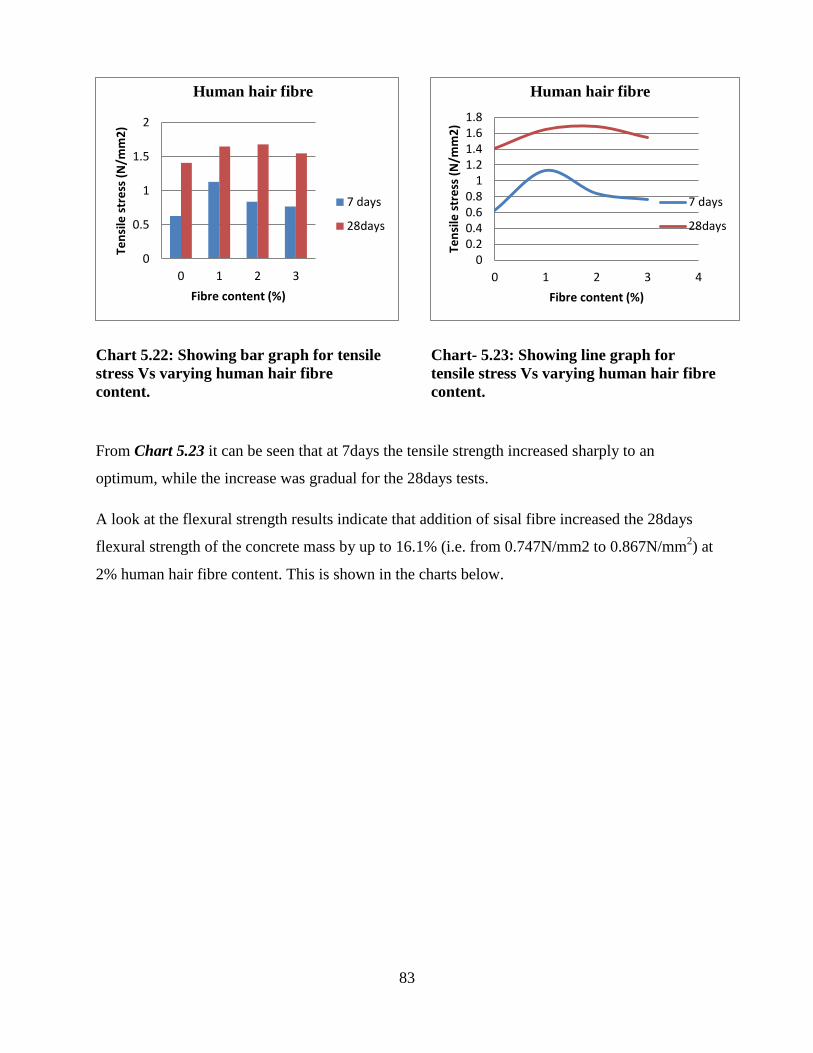
83
Chart 5.22: Showing bar graph for tensile
stress Vs varying human hair fibre
content.
Chart- 5.23: Showing line graph for
tensile stress Vs varying human hair fibre
content.
From Chart 5.23 it can be seen that at 7days the tensile strength increased sharply to an
optimum, while the increase was gradual for the 28days tests.
A look at the flexural strength results indicate that addition of sisal fibre increased the 28days
flexural strength of the concrete mass by up to 16.1% (i.e. from 0.747N/mm2 to 0.867N/mm2) at
2% human hair fibre content. This is shown in the charts below.
0
0.5
1
1.5
2
0 1 2 3
Ten
sile
str
ess
(N
/mm
2)
Fibre content (%)
Human hair fibre
7 days
28days
00.20.40.60.8
11.21.41.61.8
0 1 2 3 4
Ten
sile
str
ess
(N
/mm
2)
Fibre content (%)
Human hair fibre
7 days
28days
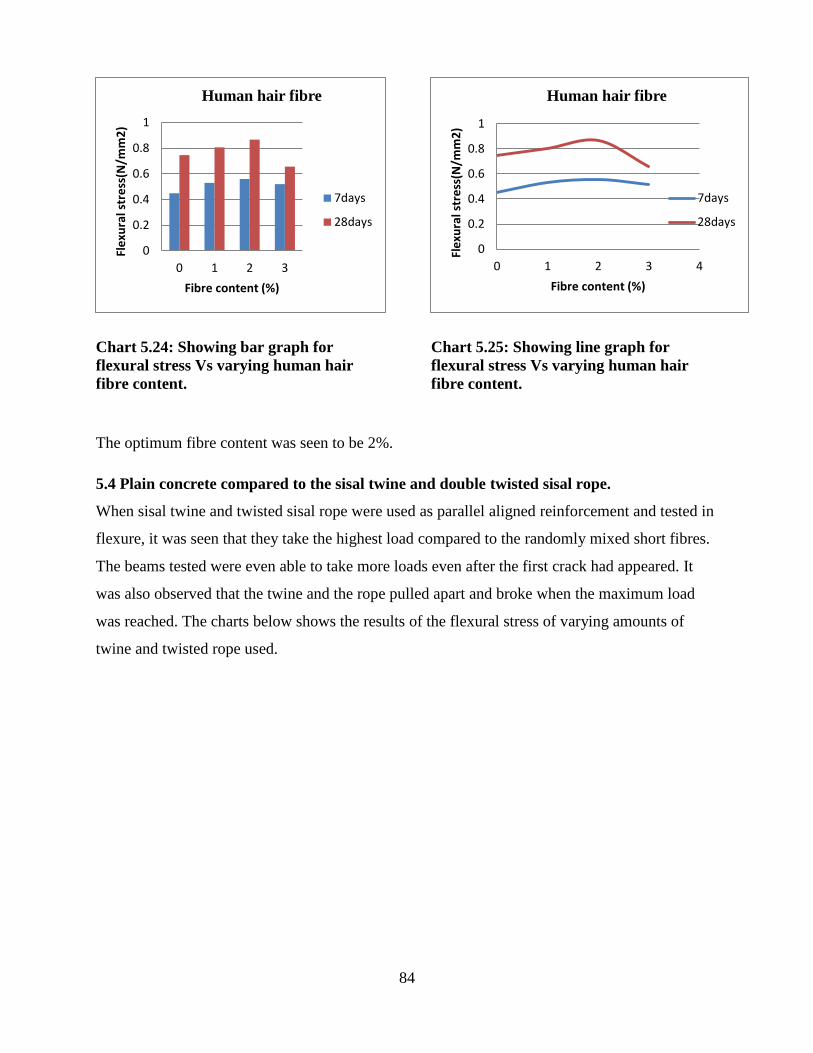
84
Chart 5.24: Showing bar graph for
flexural stress Vs varying human hair
fibre content.
Chart 5.25: Showing line graph for
flexural stress Vs varying human hair
fibre content.
The optimum fibre content was seen to be 2%.
5.4 Plain concrete compared to the sisal twine and double twisted sisal rope.
When sisal twine and twisted sisal rope were used as parallel aligned reinforcement and tested in
flexure, it was seen that they take the highest load compared to the randomly mixed short fibres.
The beams tested were even able to take more loads even after the first crack had appeared. It
was also observed that the twine and the rope pulled apart and broke when the maximum load
was reached. The charts below shows the results of the flexural stress of varying amounts of
twine and twisted rope used.
0
0.2
0.4
0.6
0.8
1
0 1 2 3
Fle
xura
l str
ess
(N/m
m2
)
Fibre content (%)
Human hair fibre
7days
28days
0
0.2
0.4
0.6
0.8
1
0 1 2 3 4
Fle
xura
l str
ess
(N/m
m2
)
Fibre content (%)
Human hair fibre
7days
28days

85
Chart 5.26: Bar graph showing7days
flexural stress with varying fibre content for
parallel aligned sisal.
Chart 5.27: Bar graph showing7days
flexural stress with varying fibre content for
parallel aligned sisal.
From chart 5.26 above, it is seen that addition of more twisted rope leads to a further increase in
flexural strength at all fibre percentages tested. And for the twine an optimum is reached at about 2%
fibre content for the 7days test. On the other hand, for both forms of sisal fibre, in 28days test, the
stresses are seen to increase throughout as shown in chart 5.27.Probably, the consistent increase in
stress can be attributed to the fact that the method of placement of the fibres (i.e. laid parallel to the
beam length) does not produce balling of fibres. Hence all fibres are bonded properly to other
constituents in the mix resulting in an almost uniform matrix. However, more tests should be done on
these two forms of sisal fibre to establish their behaviour in concrete for even longer periods of time.
These two forms of sisal fibre showed high bending strengths and this can be explained by the fact
that the ultimate load carrying capacity was reached by further widening of the first crack without
generation of any other cracks on the concrete beam. This is because the twine and the twisted rope
are able to take much more tensile stresses along their length as compared to the chopped fibres of
very small diameter, hence increasing the bending strength of the matrix.
0
0.2
0.4
0.6
0.8
1
1.2
0 1 2 3 4
Fle
xura
l str
ess
(N
/mm
2)
Fibre content (%)
comparison of Flexural stress at
7days for sisal twine and twisted
rope
Twine
Twistedrope
0
0.2
0.4
0.6
0.8
1
1.2
1.4
1.6
1.8
0 1 2 3 4
Fle
xura
l str
ess
(N
/mm
2)
Fibre content (%)
Comparison of flexural stress at
28days for sisal twine and twisted
rope
Twine
Twistedrope

86
5.5 Summary of the strength of the different fibres.
From this study, it was realized that the fibres are stronger in flexure than compression and tension
when in a concrete matrix. Sisal was the strongest fibre as compared to the other three fibres. It was
followed by human hair, then coir and the weakest was bagasse. This can be attributed to the high
aspect ratio of the sisal fibres and the keratin as the structural element in human hair.

87
CHAPTER SIX: CONCLUSION AND RECOMMENDATIONS.
6.1 Conclusion
At the beginning of this study a number of objectives were set out to be achieved, these objectives
were to:
Determine the performance of natural fibres as micro reinforcement in concrete mixes when
used to improve the mechanical properties of the concrete.
Characterize the natural fibre reinforced concrete using experimental methods on their
mechanical strength.
After the completion of testing and analysis, the following conclusions can be deduced:-
1. The inclusion of fibres in concrete generally causes a decrease in the workability of concrete.
Regardless of the fibre type, the loss of workability is proportional to the volume
concentration of the fibres in concrete.
2. There is an optimum fibre content for every fibre type and type of mix, at which the concrete
attains the highest strength. And beyond which the mechanical strength of concrete mass
begins to decrease consistently. This optimum was realized at 2% fibre content for sisal, coir
and human hair; and at 1% for bagasse fibre.
3. Adding fibres in concrete increases the mechanical strength of the concrete mass.
The compressive strength is increased by an average of 15% with sisal fibre at 1% and
human hair at 2% fibre content having the highest compressive strength (18N/mm2)
Additions of fibres also increase the tensile strength of the concrete mass with the
highest increase being of19.9% by sisal fibre at 2% fibre content by weight.
Flexural strength of the concrete was also increased by addition of fibre into the
concrete mix with as high as 63.9% in the case of 2% sisal fibre content as at 28days
of curing.
4. For the above mechanical strength results to be achieved, the critical fibre length must be put
into consideration during the preparations of the materials. It is shown that the critical lengths
vary between 18-24mm.In this study, the fibres were chopped to 35mm in length.
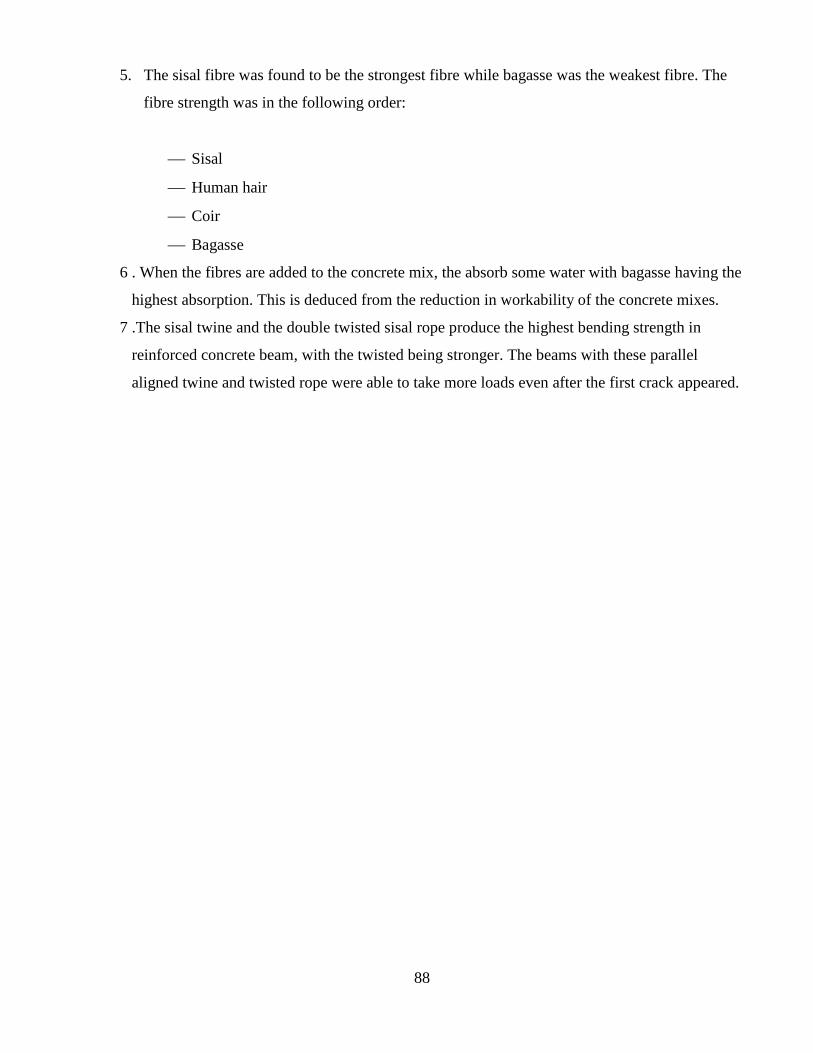
88
5. The sisal fibre was found to be the strongest fibre while bagasse was the weakest fibre. The
fibre strength was in the following order:
Sisal
Human hair
Coir
Bagasse
6 . When the fibres are added to the concrete mix, the absorb some water with bagasse having the
highest absorption. This is deduced from the reduction in workability of the concrete mixes.
7 .The sisal twine and the double twisted sisal rope produce the highest bending strength in
reinforced concrete beam, with the twisted being stronger. The beams with these parallel
aligned twine and twisted rope were able to take more loads even after the first crack appeared.

89
6.2 Recommendations
Having successfully undertaken the research, and the examination of the various natural fibres while
considering their necessity and the advantages that they offer, and their environmental compatibility
among other considerations; it is in my opinion that they should be applied more than is the case.
However, the following should be observed:
1. Further studies on the behaviour of the fibres in the alkaline cementitious mix for a longer time
period of more than 28 days (e.g. 3 months, 6 months, etc.). Since long term performance is one
of the major limitations, durability must be properly assessed and processes should be
developed to minimize this limitation.
2. The development of efficient methods of fibre extraction, pretreatment of fibres and conversion
in usable forms (filaments, mats, fabrics, rovings, etc.)
3. Physical and mechanical properties, impact and abrasive resistance, water absorption,
shrinkage, chemical resistance, acoustic requirements, thermal performance and durability of
natural fibre cement based products should be thoroughly evaluated so as to arrive at a series of
composites to be used in rural and civil construction.
4. Design procedures of natural fibre reinforced composites should be standardized.
5. A study of the influence of chemical admixtures in reducing balling of fibres during mixing and
also to increase workability should be undertaken. Admixtures to reduce the deterioration of the
fibres after a prolonged life in the cementitious mix should be under study so as to increase
durability.
6. Further studies on the performance of the fibers in different forms e.g. woven, mesh, ropes,
cords, twines, etc.
90
7 REFERENCES
1. D.R Lankard,Fibre Concrete Applications,RILEM Symposium UK
2. Majumdar A.J.,Fibre Cement and Concrete-a review,Gastron:Building Research Establishment
(1975)
3. Anon,A chemical Process of extracting wood pulp
4. Swift,D.F.,Smith,R.B.L., The flexural strength of cement based composite using low modulus
(sisal) fibres composite Pg 145-148,1979
5. Silva,F.A., et al, Behaviour of CRBP-AL Composites Subjected To Impact Load,in 17th
ASCE
Engineering Mechanics Conference,Delaware,Proceedings,2007
6. Bak D.C.O Sisal and other fibres,1963
7. Czermi,Wolfing,Cement Cleansing And Physics For Civil Engineers, Crossing Lockwood And
Sons ltd,1962
8. Blanks,Robert F.,Technology of Cement and Concrete vol.1,John Wiley and Sons,Inc
9. Orchard,D.F.,Concrete Technology 3rd
Edition,London,1975
10. Neville,A.M., Properties of Concrete,London,1972
11. Ahmed S., Ghani F. and Hasan M., Use of Waste Human Hair as Fibre Reinforcement in
Concrete, IEI Journal, Volume 91 FEB, Page no 43, (2011)
12. FAO, Fibre Statistical Bulletin
13. www.unido.org/sisal-plant, United Nations Industrial Development
14. Forest Conservation in the East Usambara Mountains,Tanzania
15. Fibre Reinforced Concrete,http://abandiI.1st.net/fibremsh.htm, January 15,2001
16. Hannat,D.J., Fibre Cements and Fibre Concretes,John Wiley and Sons Ltd,New York,1978
17. Ziad, B. and Gregory,Fibre Reinforced Cements and Concretes,Recent Developments,1989
18. Daniel,J.I.,Roller J.J. and Anderson E.D.,Fibre Reinforced Concrete,Portland Cement
Association.
19. Rice,et al.,1988
20. Sivaraja,et al.,Study On Durability Of Natural Fibre Concrete Composites Using Mechanical
Strength And Microstructural Properties,2009
21. ‗*Crop production‘ Food and Agriculture Organization of the United Nations
22. Srinivan and Han,1969
23. UN Data Source
24. Coir:From how products are made
91
25. ―Clean Technology for Coir Fibre Extraction‖ The Hindu,2009-04-30
26. T. Pradeepkema et al,Management of Horticultural Crops(Horticulture Science Series Vol II
2nd of 2 Part),New Delhi Publishing
27. Sarvan,Zac B, New Coconut yields High,The Manilla Bulletin,August 2010
28. Ravi,Rajesh ,Rise in Coconut Yield,Farming Area Put India on Top,The Financial
Express,March 2009
29. The Standard Digital,August 26th
, 2013
30. Hunt,Robert Reusing Media:Coco Coir Urban Garden Magazine
31. Gambhir,M.L.,Concrete Technology,(2004),Tata McGraw Hill
32. Slump Test,The Concrete Society,retrieved 2013-11-22
33. Gassan J and Bledzki A. K, “Possibilities for improving the mechanical properties of
jute/epoxy composites by alkali treatment of fibres”, Composite Science and Technology, 59
(9), 1999, pp. 1303-1309.
34. Harisha S, Peter Michaelb D, Benselyb A, Mohan Lalb D, Rajaduraic A, “Mechanical Property
Evaluation Of Natural Fiber Coir Composite”, Materials Characterization, 60, 2009, pp. 44-49.
35. Coconut Census Report, E. Krain and P.M.D Kalange, 1992.
36. Coconut Production at the Kenyan Coast, W. Mwangi and J. Njoba, 2000.
37. Andonian et al. (1979)
38. ACI 207R,Effect of Restraint,Volume Change, and Reinforcement on Cracking of Mass
Concrete.
39. ACI 330-R,Guide for Design and Construction of Concrete Parking Lots.
40. J.M. Hodgkinson,Mechanical Testing of Advanced Fibre Composites,Cambrudge Woodhead
Publishing,Ltd.(2000).
41. Fisher FD, Wienhau NR, Olbrecht J. Holztechnologie 1974.
42. Yoshimoto T, Hinami K. Mokuzai Gakkaishi 1976.
43. Zhengtian L, Mosleni AA. Forest Prod J 1986;36(1):53–4.
44. M.M. Kabir,et al., effects of natural fibre surface on composite properties:a review, in
Procedings of the 1st International Postgraduate Conference on Engineering ,Designing and
Developimg the Built Environment for Sustainable Wellbeing (eddBE`11)
45. Tara Sen and H. N. Jagannatha Reddy, Efficacy of Thermally conditioned Sisal FRP Composite
on the Shear Characteristics of Reinforced Concrete Beams,30th May,2013
46. Rainey,Thomas J,A Study Of The Permeability And Compressibility Properties Of Bagasse
Pulp,Brisbane Australia:Queensland University of Technology,2009

92
47. Vincenta,Julian F.V.,Design and mechanical properties of insect cuticle, Athropod structure
and development,1 July 2004
48. Hearle, J.W.S. ,A critical review of the structural mechanics of wool and hair fibres.
Internationa Journal in Biology Macromolecules. 27, 123–138 (2000).
49. Goldsmith, L.A. and Baden, H.P. The mechanical properties of hair I. the dynamic sonic
modulus,Dermatology Journal 256–259 (1970).
50. Akkermans, R.L.C. and Warren, P.B., Multiscale modelling of human hair, London Services,
1783–1793 (2004).
51. Hill, R. General theory of uniqueness and stability in elastic-plastic solids. Mechanical Physics
of Solids, 236–249 (1958).
52. Kwon, H.J. and Jar, P.-.B. ,The application of essential work of fracture concept to toughness
characterization of high-density polyethylene. 1327–1337 (2007).
53. GRC - Glassfibre Reinforced Concrete | Glassfibre Reinforced ...www.bcmgrc.co.uk -
1032 × 457 - Search by image>>>>storm drain
54. http://everlogs.com/eNewsletter/EverLogSystemsNewsletter4-11v18.html>>>>>siding panels
55. Soccer City Stadium: South Africa‘s theatre of dreams
56. http://www.buildipedia,com/aec-pros/construction-materials-and-methods/the-pensmore-
chateau
57. www.econodome.com/domekitprices.htm
58. www.diarco.de/en/home.html

93
8 APPENDICES
8.1 Appendix 1
This appendix shows the results of all the cubes tested in the compression test and the average results.
FIBRE FIBRE
CONT
ENT %
7 DAYS
MAXIMUM LOAD RECORDED
(KN)
COMPRESSIVE STRESS (N/mm2)
CUBE
1
CUBE
2
CUBE
3
AVERA
GE
CUBE
1
CUBE
2
CUBE
3
AVER
AGE
Control 0 60 54 51 55 6 5.4 5.1 5.5
Sisal 1 65 59 56 60 6.5 5.9 5.6 6
2 88 73.5 63.5 75 8.8 7.35 6.35 7.5
3 65 73 57 65 6.5 7.3 5.7 6.5
Coir 1 55.5 60 57 57.5 5.55 6.0 5.7 5.75
2 63 55 58.5 58.8 6.3 5.5 5.85 5.88
3 41.5 52.5 48.5 47.5 4.15 5.25 4.85 4.75
Bagasse 1 55 63 39.5 52.5 5.5 6.3 3.95 5.25
2 54.5 57 38.5 50 5.45 5.7 3.85 5
3 40 47 33 40 4.0 4.7 3.3 4.0
Human Hair 1 62.5 49 58.5 56.7 6.25 4.9 5.85 5.67
2 60 64.5 47 57.1 6.0 6.45 4.7 5.71
3 59 63 32.5 51.5 5.9 6.3 3.25 5.15
Table 8.1: Showing results obtained from compression test and the corresponding compressive
stress at 7days for all cubes tested.
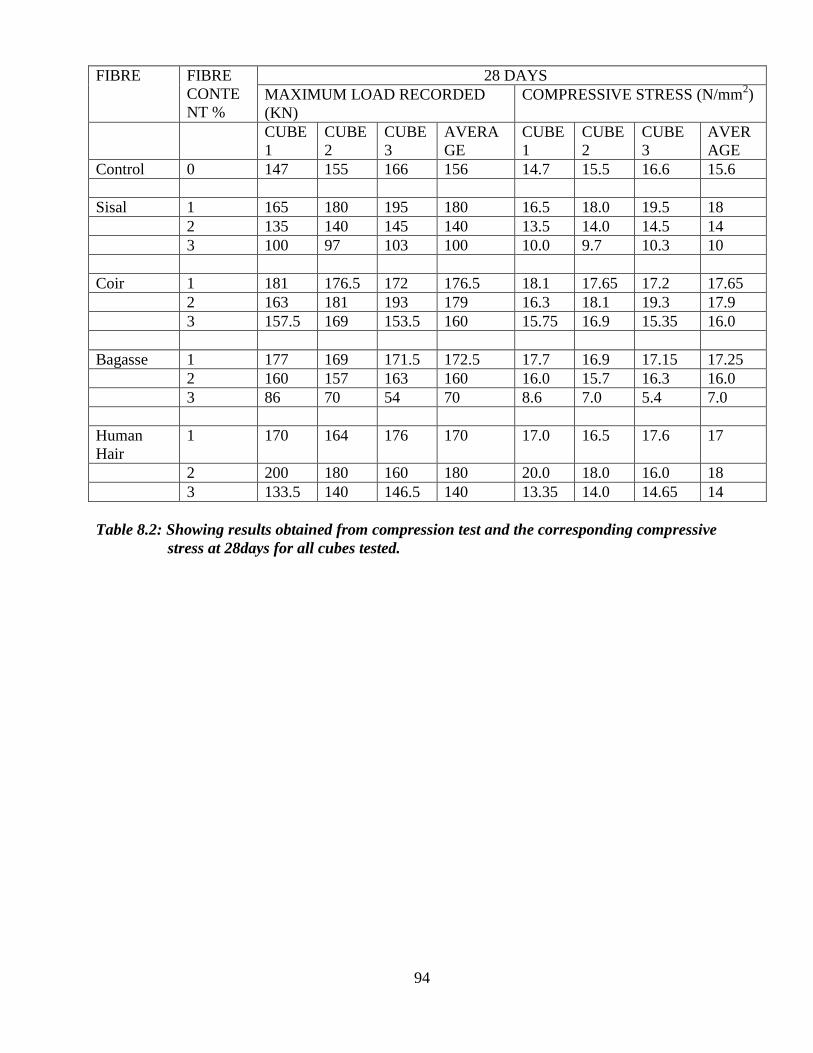
94
FIBRE FIBRE
CONTE
NT %
28 DAYS
MAXIMUM LOAD RECORDED
(KN)
COMPRESSIVE STRESS (N/mm2)
CUBE
1
CUBE
2
CUBE
3
AVERA
GE
CUBE
1
CUBE
2
CUBE
3
AVER
AGE
Control 0 147 155 166 156 14.7 15.5 16.6 15.6
Sisal 1 165 180 195 180 16.5 18.0 19.5 18
2 135 140 145 140 13.5 14.0 14.5 14
3 100 97 103 100 10.0 9.7 10.3 10
Coir 1 181 176.5 172 176.5 18.1 17.65 17.2 17.65
2 163 181 193 179 16.3 18.1 19.3 17.9
3 157.5 169 153.5 160 15.75 16.9 15.35 16.0
Bagasse 1 177 169 171.5 172.5 17.7 16.9 17.15 17.25
2 160 157 163 160 16.0 15.7 16.3 16.0
3 86 70 54 70 8.6 7.0 5.4 7.0
Human
Hair
1 170 164 176 170 17.0 16.5 17.6 17
2 200 180 160 180 20.0 18.0 16.0 18
3 133.5 140 146.5 140 13.35 14.0 14.65 14
Table 8.2: Showing results obtained from compression test and the corresponding compressive
stress at 28days for all cubes tested.
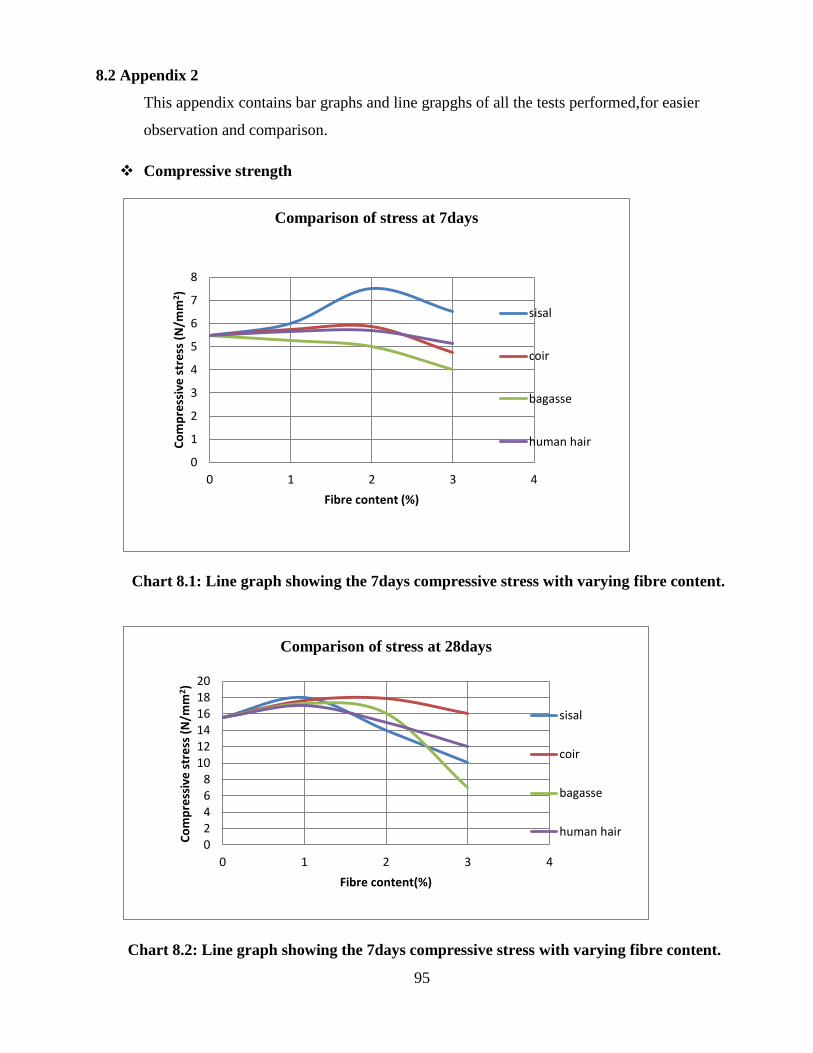
95
8.2 Appendix 2
This appendix contains bar graphs and line grapghs of all the tests performed,for easier
observation and comparison.
Compressive strength
Chart 8.1: Line graph showing the 7days compressive stress with varying fibre content.
Chart 8.2: Line graph showing the 7days compressive stress with varying fibre content.
0
1
2
3
4
5
6
7
8
0 1 2 3 4
Co
mp
ress
ive
str
ess
(N
/mm
2 )
Fibre content (%)
Comparison of stress at 7days
sisal
coir
bagasse
human hair
02468
101214161820
0 1 2 3 4
Co
mp
ress
ive
str
ess
(N
/mm
2)
Fibre content(%)
Comparison of stress at 28days
sisal
coir
bagasse
human hair

96
Chart 8.3: Bar graph for 7days compressive
stress with varying fibre content.
Chart 8.4: Bar graph for 28days
compressive stress with varying fibre
content.
Tensile strength
Chart 8.5: Line graph showing the 7days tensile stress with varying fibre content.
0
1
2
3
4
5
6
7
8
0 1 2 3Co
mp
ress
ive
str
ess
(N
/mm
2)
Fibre content (%)
Comparison of stress at 7days
sisal
coir
bagasse
human hair0
5
10
15
20
0 1 2 3
Co
mp
resi
ve s
tre
ss (
N/m
m2)
Fibre content (%)
Comparison of stress at 28days
sisal
coir
bagasse
human hair
0
0.2
0.4
0.6
0.8
1
1.2
1.4
0 0.5 1 1.5 2 2.5 3 3.5
Ten
sile
str
ess
(N
/mm
2)
Fibre content (%)
Comparison of tensile strenth at 7days
sisal
coir
bagasse
human hair
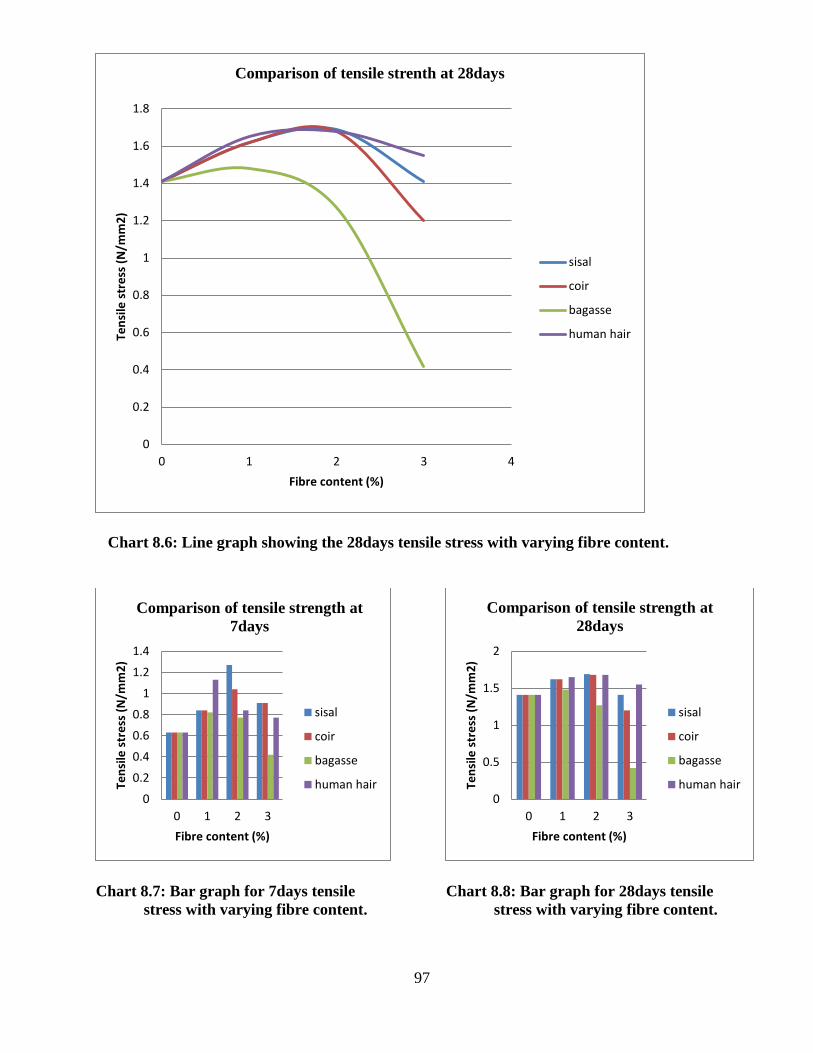
97
Chart 8.6: Line graph showing the 28days tensile stress with varying fibre content.
Chart 8.7: Bar graph for 7days tensile
stress with varying fibre content.
Chart 8.8: Bar graph for 28days tensile
stress with varying fibre content.
0
0.2
0.4
0.6
0.8
1
1.2
1.4
1.6
1.8
0 1 2 3 4
Ten
sile
str
ess
(N
/mm
2)
Fibre content (%)
Comparison of tensile strenth at 28days
sisal
coir
bagasse
human hair
0
0.2
0.4
0.6
0.8
1
1.2
1.4
0 1 2 3
Ten
sile
str
ess
(N
/mm
2)
Fibre content (%)
Comparison of tensile strength at
7days
sisal
coir
bagasse
human hair0
0.5
1
1.5
2
0 1 2 3
Ten
sile
str
ess
(N
/mm
2)
Fibre content (%)
Comparison of tensile strength at
28days
sisal
coir
bagasse
human hair
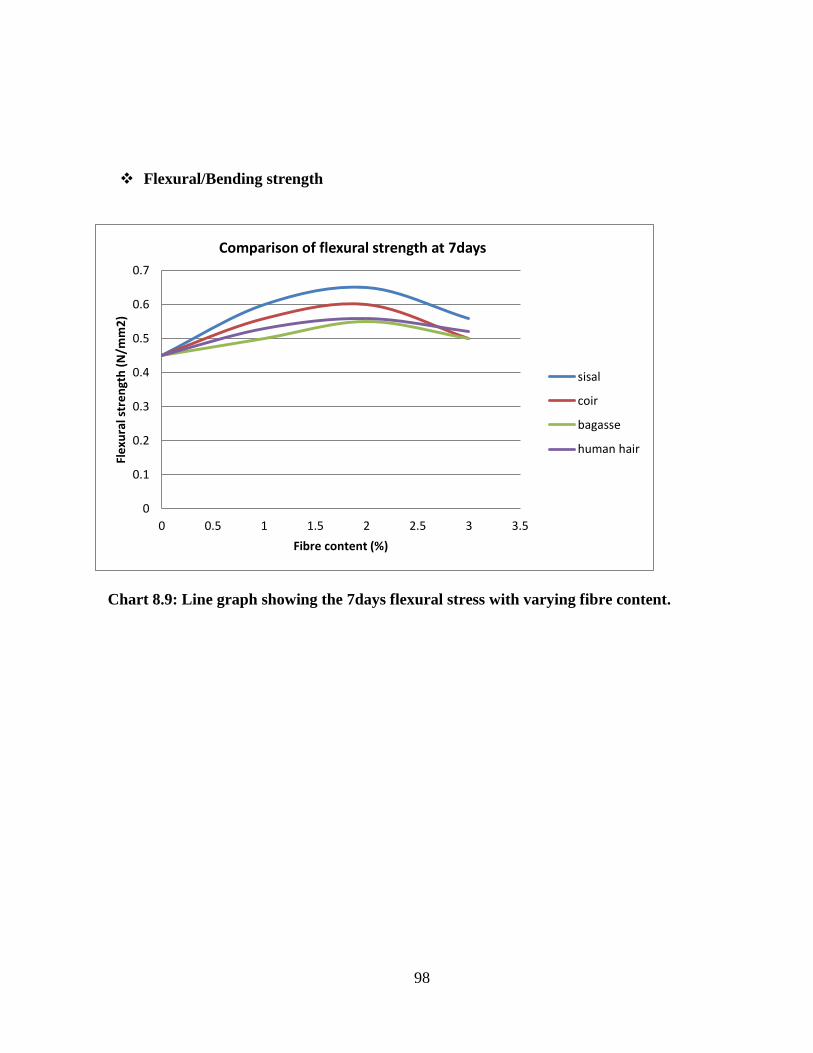
98
Flexural/Bending strength
Chart 8.9: Line graph showing the 7days flexural stress with varying fibre content.
0
0.1
0.2
0.3
0.4
0.5
0.6
0.7
0 0.5 1 1.5 2 2.5 3 3.5
Fle
xura
l str
en
gth
(N
/mm
2)
Fibre content (%)
Comparison of flexural strength at 7days
sisal
coir
bagasse
human hair
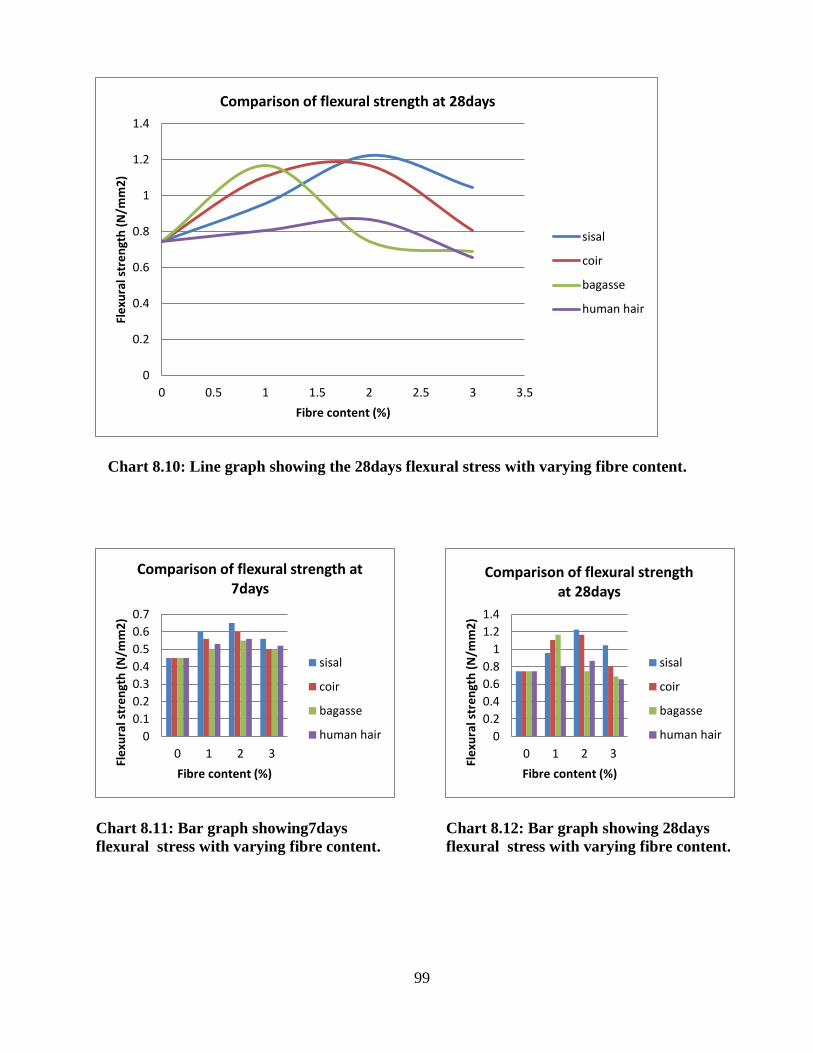
99
Chart 8.10: Line graph showing the 28days flexural stress with varying fibre content.
Chart 8.11: Bar graph showing7days
flexural stress with varying fibre content.
Chart 8.12: Bar graph showing 28days
flexural stress with varying fibre content.
0
0.2
0.4
0.6
0.8
1
1.2
1.4
0 0.5 1 1.5 2 2.5 3 3.5
Fle
xura
l str
en
gth
(N
/mm
2)
Fibre content (%)
Comparison of flexural strength at 28days
sisal
coir
bagasse
human hair
0
0.1
0.2
0.3
0.4
0.5
0.6
0.7
0 1 2 3
Fle
xura
l str
en
gth
(N
/mm
2)
Fibre content (%)
Comparison of flexural strength at 7days
sisal
coir
bagasse
human hair 0
0.2
0.4
0.6
0.8
1
1.2
1.4
0 1 2 3
Fle
xura
l str
en
gth
(N
/mm
2)
Fibre content (%)
Comparison of flexural strength at 28days
sisal
coir
bagasse
human hair

100
Chart 8.13: Bar graph showing7days
flexural stress with varying fibre content
for parallel aligned sisal.
Chart 8.14: Bar graph showing7days
flexural stress with varying fibre content
for parallel aligned sisal.
Chart 8.15: Bar graph showing7days
flexural stress with varying fibre content
for parallel aligned sisal.
Chart 8.16: Bar graph showing7days
flexural stress with varying fibre content
for parallel aligned sisal.
0
0.2
0.4
0.6
0.8
1
1.2
0 1 2 3Fle
xura
l str
ess
(N
/mm
2)
Fibre content (%)
comparison of Flexural stress at
7days for sisal twine and twisted
rope
Twine
Twisted rope
0
0.2
0.4
0.6
0.8
1
1.2
1.4
1.6
1.8
0 1 2 3
Fle
xura
l str
ess
(N
/mm
2)
Fibre content (%)
Comparison of flexural stress at
28days for sisal twine and twisted
rope
Twine
Twistedrope
0
0.2
0.4
0.6
0.8
1
1.2
0 1 2 3 4
Fle
xura
l str
ess
(N
/mm
2)
Fibre content (%)
comparison of Flexural stress at
7days for sisal twine and twisted
rope
Twine
Twistedrope
0
0.2
0.4
0.6
0.8
1
1.2
1.4
1.6
1.8
0 1 2 3 4
Fle
xura
l str
ess
(N
/mm
2)
Fibre content (%)
Comparison of flexural stress at
28days for sisal twine and twisted
rope
Twine

101
8.3 Appendix 3
Showing pictures of more structures made of natural fibre reinforced concrete structures.
Plate 8.1Showing a storm drain made using glass and sisal fibre precast reinforced concrete
Plate 8.2 Carbon fibre reinforced tunnel in a mine in South Africa.
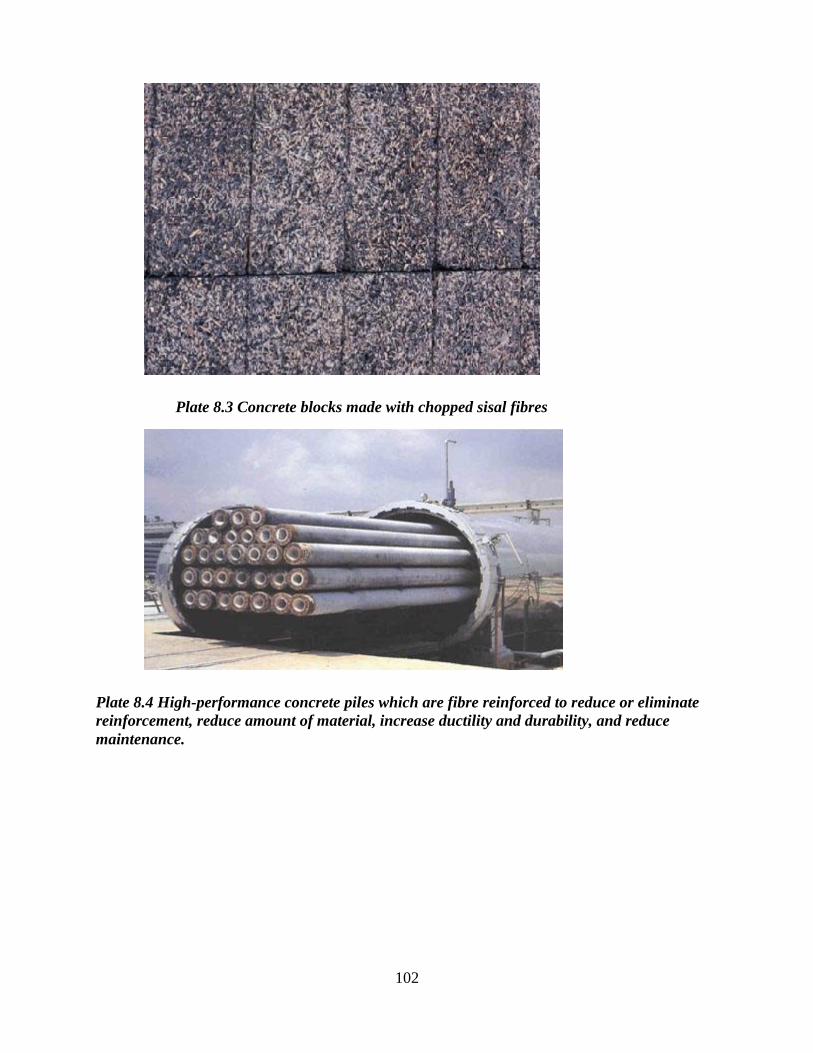
102
Plate 8.3 Concrete blocks made with chopped sisal fibres
Plate 8.4 High-performance concrete piles which are fibre reinforced to reduce or eliminate
reinforcement, reduce amount of material, increase ductility and durability, and reduce
maintenance.

103
Plate 8.5 Showing a retaining wall with an external fibre reinforced concrete cladding to
reduce cracks formation.
Plate 8.6 Fiber reinforced polymer concrete filled shells used for lightly loaded structures.
This photo shows approximately five FRP concrete filled shells that are foundations for a foot
bridge.

104
Plate 8.7 A column being renovated using a sisal fibre mesh strengthened with epoxy resin
being glued on the outside.
Plate 8.8 Fibre Reinforced Shotcrete Drain