bachelor of commerce best business research …...vodafone, colt, sonaecom, embratel...
TRANSCRIPT
JUNE 2012 | VOLUME 5
BACHELOR OF COMMERCE BEST BUSINESS RESEARCH PAPERS

Bachelor of Commerce | Best Business Research Papers Vol. 5
3|
Table of Contents
Note from the Editor 4 Carmen Galang Telecommunications in Portugal: 5 An Analysis of Portugal Telecom Nadia Aziz “Made in [East] Germany”: 15 An Analysis of East German Manufacturing Immediately Following Reunification and Today Scott Davidson Heineken N.V.: 26 Strategic Global Brand Management as a Source of Competitive Advantage Kyla Ganton Red Bull: 37 Success Using Buzz Marketing Amanda Gillander Climate Change and the Spanish Wine Industry: 47 What Can Wine Companies and Government do to Protect Spanish Wine? Brendan Harris
Bachelor of Commerce | Best Business Research Papers Vol. 5
|4
Note from the Editor
It is the University of Victoria’s Bachelor of Commerce program’s goal to provide our students with the essential
skills and knowledge required to be a successful business leader in today’s global economy. We also aim to
ensure that our students are given many opportunities to support and develop business research. At the Peter
B. Gustavson School of Business, we believe that international experience is essential for taking the lead in the
interdependent and intercultural world market that we are now in.
Our international exchange program is the largest in Canada with 79 active partnerships at universities in over
37 countries currently, and we continue to develop agreements in more new areas of the world. In the 2011-12
academic year, 160 BCom students participated in an international exchange. By travelling to and being
educated in these many countries, students develop an international management perspective through direct
experience with issues in their host country’s economy and organizations. During their exchange, many of our
students enrol in the International Business Research course (COM 470), which is designed to broaden their
knowledge of the nation and enhance their research and writing skills by analyzing a business issue related to
this destination. They can also focus on a specific aspect that pertains to a particular private, public or not-for-
profit organization.
Beginning with the 2007 cohort, we started choosing the top articles to showcase in a published collection of Best Business Research Papers. The topics range widely from global competition in tourism and the service industry to manufacturing and telecommunication strategies. Whatever the topic, these best in class papers continue to demonstrate the capacity for significant and thoughtful research from our students. On behalf of the Gustavson School of Business, I am pleased to present this volume honouring a small group of students from the class of 2012. We thank the many people behind the scenes that make this multifaceted international exchange opportunity work, including the International Programs team of Dr. A.R. Elangovan, Director; Brian Leacock, Associate Director; Jane Collins, Manager, International Exchange; Shawna Hooton, Outgoing Exchange Student Advisor; Allen Sun, International Student Advisor; Jennifer Oakes, Academic Advisor, Donna Davis, Programs Clerk and to Shannon Perdigao, Academic Projects Officer, for coordinating and compiling this edition of the Best Business Research Paper.
M. Carmen Galang, PhD Associate Professor, International Business Editor, Best Business Research Papers, Volume 5

Bachelor of Commerce | Best Business Research Papers Vol. 5
5|
Telecommunications in Portugal: An Analysis of Portugal Telecom Nadia Aziz Fall 2011 ABSTRACT
This paper provides an assessment of the telecommunications industry in Portugal, with a focus on the leading telecommunications company in the country, Portugal Telecom (PT). The purpose of this paper is to examine the current strategy of Portugal Telecom in order to gain insight on its position within the market. This paper also provides recommendations on future strategies for PT to sustain its business and facilitate growth. An evaluation of the global telecommunications industry is conducted through the use of Porter’s Five Forces Model, providing a further understanding of the attractiveness of the industry. A SWOT (Strengths, Weaknesses, Opportunities, and Threats) analysis determines the internal and external factors affecting the future of the company. Using the results of this analysis, this paper presents some implications that PT’s operations have on managers in the industry. Further, this paper ultimately concludes that PT should make improvements to its current human resource policies, re-focus its efforts to concentrate on penetrating developing markets, and improve its sustainability practices on a smaller, micro-level scale.
INTRODUCTION
The telecommunications industry plays a vital role in today’s globalized world. Society relies on telecommunications services to communicate through a wide range of networks all over the world. The utilization of these services will continue in the future and the industry is constantly innovating and providing new technologies for end users. In Portugal, the telecommunications industry has experienced tremendous growth over the last few years. As one of the highest contributors to gross domestic product (GDP) in the European Union (EU) (BuddeComm, 2011), the telecommunications market in Portugal is a vital component of the country’s economy. Competition amongst key players is intense, and companies are constantly competing to capture more customers and a larger market share. The industry’s leading company, Portugal Telecom (PT), is the market leader in every segment of the telecommunications sector. PT has evolved into an international company that is focused on pursuing growth and offering innovative products and services. An assessment of the company provides an overview of its current position within the market, its core strategies, and some recommendations for it to maintain its position as market leader while continuing to grow and create value for its shareholders. Managers can use PT’s strategy as a benchmark and can identify key industry structures and the future shape of the telecommunications industry.
HISTORY OF TELECOMMUNICATIONS IN PORTUGAL AND THE CREATION OF PORTUGAL TELECOM
In 1877, just one year after Alexander Graham Bell’s invention of the telephone, the first telephone experiments appeared in Portugal. In 1882, the Edison Gower-Bell Company established two telephone networks in the country’s primary cities, Lisbon and Porto. A few years later, the concession for these
Bachelor of Commerce | Best Business Research Papers Vol. 5
|6
networks was transferred to the Anglo Portuguese Telephone Company (APTC). After the company’s contract ran out in 1901, a new company was formed to support an increase in demand for telephone service. This company, Correios e Telecomunicaçoes de Portugal (CTT), was an expansion of Portugal’s existing postal and telegraph department. In addition to Lisbon and Porto, CTT built a continental telephone network that extended to the Madeira and Azores Islands and some of the country’s African colonies (Portugal Telecom, 2011). As a result of the overthrow of the monarchy in 1910, plans for the development of the country’s intercontinental telephone connection were discontinued. Instead, the new government decided to allow for a private operator: Companhia Portuguesa Rádio Marconi (CPRM), which began operations in 1925. However, CPRM had trouble keeping up with the high costs of rapid technological developments. It also faced competition from submarine-based international cable systems and illegal wireless transmissions conducted through the Portuguese Navy. The APTC renewed its contract in 1928 and served as another form of competition, although it faced the same challenges as CPRM (Funding Universe, 2004). When Salazar became Prime Minister in 1932, he saw Portugal’s telecommunications industry as a means of maintaining control of the country’s colonies. Consequently, the success of CPRM became the government’s primary focus and it worked to abolish the illegal wireless activity throughout the 1930s and 1940s before renewing the company’s contract in 1966. While APTC had continued its investments in networks in Lisbon and Porto, it was forced to lapse in 1967 when the government denied the renewal of its contract (Funding Universe, 2004). Instead, the government took control of the APTC’s operations and formed a new state-owned company in the following year, Telefones de Lisboa e Port (TLP). Consequently, CTT also transformed into a state-owned corporation. However, in 1992, the Portuguese government and the Public Service Television Corporation wanted to separate the transmitter network, which resulted in the creation of a state-owned company, Teledifusão de Portugal (TDP) (BuddeComm, 2011). In the same year, CTT separated its postal and telecommunications operations and the latter was renamed Telecom Portugal. The government commissioned the formation of a holding company, Comunicações Nacionais, SPGS, SA (CN), to manage all state activity within the sector: CTT, Telecom Portugal, TLP, CPRM, and TDP. However, two years later, fusion of the companies within the CN portfolio resulted in the birth of Portugal Telecom SGPS, SA (PT). PT enjoyed a monopoly until the mid 1990s with the liberalization of the Portuguese telecommunications market. The company had grown to become the most privatized of all European telecommunications companies as a result of the government selling all but 500 golden shares of the company by the end of the 21st century (Funding Universe, 2004). Throughout the 2000s, PT made significant investments in new technology while expanding its networks within Portugal. It also began to expand internationally and commenced operations in the Brazilian market. In 1998, PT partnered with Telefonica Moviles and acquired a controlling stake in Telesp Celular, the leading wireless operator in São Paulo state that represents a major share of Brazil’s economy. This led to the launch of what would eventually grow to be Brazil’s top mobile operator, Vivo, in 2003 (McKinsey Quarterly, 2011). In 2010, PT sold its stake in Vivo and partnered with Telemar Norte Leste (more commonly known as “Oi”), one of the largest telecommunications operators in Brazil (Investment U, 2011).
PORTUGAL TELECOM TODAY
Portugal Telecom is a global company that is widely recognized as the Portuguese organization with the largest national and international presence. It operates in the areas of fixed mobile, multimedia communications, information systems, research and development, satellite communications, and
Bachelor of Commerce | Best Business Research Papers Vol. 5
7|
international investments. The company provides a wide range of services, such as local, long distance and international telephone services, hiring of circuits, mobile, data and Internet communications, cable television, information systems and contents, the sale of telecommunications equipment, corporate solutions, and entertainment. In addition, it also offers Internet protocol television and direct-to-home satellite pay-TV services. With its headquarters in Lisbon, Portugal, PT also has a large presence in Brazil and parts of Africa, including Morocco, Mozambique, Timor, Angola, Kenya, São Tomé & Principe, and Namibia. PT is one of the most traded stocks in Euronext Lisboa Index and is also listed on the New York Stock Exchange (Portugal Telecom, 2011). Portugal Telecom is the national industry leader in each sector that it operates. It positions itself as an innovative, customer-oriented company with a strong brand image. PT has a commitment to sustainability and is a member of the Dow Jones Sustainability World Index. Its key competitors include Vodafone, Colt, Sonaecom, Embratel Participações, Vivo Participações, and ZON Multimedia (Business Monitor International, 2011).
PORTER’S FIVE FORCES MODEL
To provide insight into the competitiveness of the telecommunications industry on a global scale, I will conduct an analysis using Porter’s Five Forces Model (1979). The elements of this model that will be discussed are: the threat of new entrants, the threat of substitutes, the bargaining power of buyers, the bargaining power of suppliers, and the degree of rivalry amongst the industry competitors. The first of Porter’s Five Forces is the threat of new entrants. In the telecommunications industry, the risk of new players entering the market is low because it is a capital-intensive industry and high fixed costs are a barrier to entry. If new competitors were to enter the market, they would lose time establishing a high quality network and infrastructure. Due to the oligopolistic nature of the market, the key players have strong, established bands and a loyal customer base. This makes it difficult for a new company to gain market share. In addition, acquiring a license to operate is costly and time consuming. The threat of substitutes is high, as there are a number of alternative products and services that consumers can choose from. These are mainly between different segments in the industry; for instance, cable television and satellite operators are a means of competition, and programs such as Skype offer cheap alternatives to telephone services (Santos, 2011). The bargaining power of buyers is also relatively high due to the large selection of products and services that consumers can choose from. Also, because of the widespread nature of basic services within the industry, these products and services are treated as a commodity. This means that consumers seek low prices and want the most value for their money. However, with regards to switching costs, these are minimal for individual consumers but can increase for large businesses. This can become an important factor if the business relies on customized products or services. Supplier bargaining power is low, as it is diffused between the numerous manufacturers of telecommunications equipment. In addition, these manufacturers have little power in deciding which technology is introduced to the market and they are reliant on large telecommunications companies as a means of distribution. For instance, suppliers in the industry made large investments in research and development (R&D) in Voice over Internet Protocol (VoIP) technology because it was believed to be a substitute for mobile communication. However, mobile service providers believed VoIP technology to be a threat because it was a cheaper alternative. As a result, VoIP products did not sell well and suppliers struggled to make up for the large fixed costs associated with the investments. This causes the suppliers

Bachelor of Commerce | Best Business Research Papers Vol. 5
|8
to comply with buyers’ price negotiations on telecommunications equipment (as it is often bought in large volumes) in order to keep sales volumes high (BuddeComm, 2011). In the de-regulated telecommunications industry, rivalry among competitors is high. As it is an industry characterized by a necessity for new technological developments and innovations, companies are constantly competing in the development and delivery of new products and services. Competition to gain market share and a wide customer base is intense; in addition, each competitor is highly likely to remain in operation due to high exit costs. These costs are primarily associated with specialized equipment, as it is an asset that does not have other uses and it is difficult to liquidate.
SWOT ANALYSIS
The following SWOT analysis will determine the strengths, weaknesses, opportunities, and threats of Portugal Telecom.
Strengths
Portugal Telecom has proved to be highly successful in development of innovative technology. For example, it developed an original pre-paid business model and provided the first pre-paid mobile service in the world (Pitta, 2009). In addition, the company is actively implementing the recent trend of Fibre-To-The-Home (FTTH) networks in Portugal. It has already covered one million homes with FTTH and is seeking to cover 600,000 additional homes by the end of 2011. This earned the company an Innovation Award, “Deployment and Operation of FTTH networks,” by the FTTH Council Europe (Portugal Telecom, 2011). Not only is PT one of the leaders in the industry for developing innovative technology, it has also succeeded in cultivating a company culture based on innovation: “PT owes its remarkable success to a strategy of fostering innovation across the company and using clear metrics to guide each employee’s contribution” (Pitta, 2009). The company has achieved this by actively encouraging creativity across the company through the analysis, evaluation, and consideration of ideas. Portugal Telecom Chief Executive Officer (CEO), Zeinal Bava, described a creative challenge that is given to employees every two months. The challenge poses a question: for instance, how can PT work more closely with youth and with social media? Or, how can PT reduce waste and paper? From there, employees across the company invest in the generated ideas with a fictional currency, called “Opens”. If an individual invests in an idea that fails, he or she loses the investment. However, if several people invest in the same idea, it gains value and the investment becomes a vote of confidence. This ensures that employees make thoughtful investments and view them as having consequences. From there, the most highly valued ideas are presented to management for review. If they are feasible, they are implemented (Bava, 2011). The concept of rewards plays a central role in this investment system, as employees can earn Opens and redeem them for prizes. PT makes an effort to offer valuable prizes to serve as a source of motivation and
Figure 1: CEO Bava presenting at Universidade Catolica Portuguesa in Lisbon, Portugal (Bava,
2011)
Bachelor of Commerce | Best Business Research Papers Vol. 5
9|
productivity. For example, a courtesy room at the 2004 European Football Championships was offered in exchange for Opens (Pitta, 2009). PT’s investment system is successful in cultivating an innovative company culture because it creates a shared interest that focuses on both processes and outcomes. By reviewing ideas and selecting which ideas to invest in, all employees are involved in the formation of innovation – not just those who generate the ideas. In addition, the notion of making a tangible investment through the Opens facilitates commitment and widespread contribution. Another strength held by Portugal Telecom is its strong brand image. The company has successfully developed a prominent logo that is associated with its respected reputation: “brand image is something that PT views with high sense of responsibility, bearing in mind that it mirrors the committed and rational relationship that the company establishes with society” (Portugal Telecom, 2011). The company has a number of initiatives that foster the development and maintenance of the PT brand. For instance, the company monitors its brand image and records brand awareness by distributing annual market surveys to the public. To maintain consistency, it has a set of brand guidelines that include rules and recommendations for the correct application of PT Group brands. This includes the institutional, commercial, segment, convergent product, and instrumental brands (Portugal Telecom, 2011). According to Teresa Salema, Vice President of Sustainability at Portugal Telecom, the company’s code of conduct also plays a role in upholding PT’s brand image. For example, PT has a “Social Media Code of Conduct” that contains guidelines on how to effectively use the PT brand through social media (Salema, 2011).
Weaknesses
One of PT’s weaknesses involves the company’s human resource (HR) policies and procedures. Portugal Telecom practices Human Asset Management based on an Individual Performance Analysis model. The company highlights the fact that it is an equal opportunity employer, offers flexible schedules, and values the health and safety of employees (Portugal Telecom, 2011). Although these are important principles, there is significant room for improvement and a number of additional programs that the company could implement. PT will encounter difficulty in recruiting new talent if it does not offer competitive incentives and benefits to potential employees. PT has a heavy reliance on the domestic market for the majority of its revenue. With the current debt crisis facing Portugal and many parts of Europe, the Portuguese economy is extremely weak. In April 2011, Portugal requested a bailout package from the EU and the International Monetary Fund (IMF). The country is expected to suffer a negative GDP of 1.5% in 2011 and 0.5% in 2012 (Business Monitor International, 2011). This has a negative impact on the success of the company, as its stability – including its profitability, growth rate, and overall financial position – is largely dependent on consumer demand for its products and services. By having a large portion of its activity concentrated in a weak economy, PT’s business risk is high and there is limited growth potential. Although the company has a considerable amount of its operations overseas, it still generated 85.5% of its revenues in Portugal in 2010. Of the remaining amount, 7% was represented by Brazil and 7.5% was represented by Africa (Bloomberg Businessweek, 2011). By comparison, two of PT’s key competitors, Vodafone and Telefonica (a large-scale Spanish telecommunications company), generate a significantly larger amount of revenue from their international operations (DataMonitor, 2011).
Opportunities
The recent increase in worldwide data consumption is a potential opportunity for Portugal Telecom. This is largely due to the improved capacity of terminal equipment, which enables higher connectivity
Bachelor of Commerce | Best Business Research Papers Vol. 5
|10
(Portugal Telecom, 2011). The company can take advantage of this trend by offering a new set of products and services that cater to the change in consumer preferences. In addition to worldwide data consumption, the broadband market in Portugal has considerable growth potential. By the end of 2010, market penetration was only 19.5 per 100 people. By 2015, broadband users in Portugal are expected to reach approximately 7 million. Currently, PT provides triple and quintuple-play offers in the broadband market, including Pay-TV, fixed and mobile broadband, voice, and video-on-demand. This enabled the company to gain a market share of 46.8% (DataMonitor, 2011), placing it in a good position to experience the expected gains from the growth in the market. Another opportunity for PT is the increase in demand for telecommunications services in developing countries. As markets in developed nations are already highly saturated, many companies within the industry are beginning to seek out new markets in developing countries. Markets in this segment have grown twice as fast as developed countries and offer a new source of potential customers (Garbacz & Thompson, 2007). For these countries, the growth of telecommunications networks and services are fundamental to social and economic growth. This provides an opportunity for PT to reap the benefits of an untapped market, for it can gain significant market share and even obtain first-mover advantage. The worldwide demand for cloud computing services is expected to increase in the next few years. Cloud computing involves sharing computing resources to obtain high-performance computing power, enabling the delivery of software-as-a-service. Cloud computing is desirable for companies because it enables them to reduce expenses such as royalty and licensing payments, investments in hardware, and several other operating expenses. The market for cloud computing services recorded a growth of approximately 16% in 2010, and is expected to grow at a compound annual growth rate of 20% (DataMonitor, 2011). These factors, along with an improvement in overall connectivity and higher access speeds, means that telecommunications companies will be launching new products and services that provide a means for users to access a multitude of services, such as music, video, photos, applications, and retail. Not only are cloud-based services emerging in personal and residential segments, but they are also in demand by small businesses and large corporations (Portugal Telecom, 2011). Portugal Telecom has recently re-focused its efforts on the development of cloud computing services and has recognized it as a key growth driver. Since the end of 2010, the company has launched a number of cloud computing-based initiatives. In September of that year, it partnered with Cisco, the leading manufacturer of network equipment worldwide. The two companies developed and launched new cloud computing services, including virtual services and unified communications that help companies adopt more efficient business models (DataMonitor, 2011). In addition, the company began construction of a new data center located in Covilha, Portugal, in early 2011. This data center will have an installation capacity for over 50,000 servers and will focus on providing cloud computing services and data storage capacity to customers outside of Portugal (Portugal Telecom, 2011). The company’s increased activity within the cloud computing market will provide generous revenue and a wider customer base.
Threats
Portugal Telecom is subjected to a number of laws, regulations, and government policies that have a significant effect on its operations. For instance, the Portuguese telecommunications regulator, ANACOM, inflicted price controls on interconnection rates for the termination of calls on mobile networks. This had a direct impact on the revenues of PT’s mobile group, Telecomunicações Móveis Nacionais (TMN). Imposed regulations by the European Commission are also a threat to PT, for its review of roaming charges can cause a decline in mobile revenues (DataMonitor, 2011). In addition, the company provides a considerable portion of products and services under a concession granted by the Portuguese government, which is effective until 2025. This concession is also under licenses and
Bachelor of Commerce | Best Business Research Papers Vol. 5
11|
authorizations granted by ANACOM. The government can revoke this concession if it is in the public interest, and it can also terminate the concession if the company does not meet its terms and conditions (DataMonitor, 2011). Not only is PT subject to regulations in Portugal, but also in Brazil. Local telecommunications providers are faced with restrictions and obligations with regards to licenses, competition, taxes, and service rates. The Brazilian telecommunications operator in which PT has a stake in (Oi), is restricted from increasing the rates charged on its services if a devaluation in currency or an increase in interest rates causes the company’s costs to increase (Businesswire, 2011). These unfavourable rules and regulations affect PT’s ability to stay competitive and will adversely affect its business. Another threat facing the company is the additional risk resulting from changes in foreign currencies. For instance, fluctuations in exchange rates can significantly impact PT’s revenue from its Brazilian investments. Exchange rate risk is also present with regards to debt denominated in foreign currencies that are different from PT companies’ functional currencies (Investment U, 2011). Portugal Telecom is faced with intense competition by companies within the industry, for they are hoping to gain its position of market leader. This is occurring in several segments within the industry. For instance, PT’s wireline business is being challenged by the emergence of new fixed-line operators and mobile telephone service providers. The main competitors in this segment are Vodafone and Optimus. In the wireline voice, data communications, and Internet services segments, PT’s competitors include ZON Multimedia, Sonaecom, Oni Telecom-InfoComunicoes, Cabovisao, AR Telecom, and Colt. In the mobile sector, PT’s subsidiary TMN competes with Vodafone and Optimus. In Brazil, Oi is facing competition in the mobile sector from Vivo, TIM, and Telecom Americas Group. In addition, Nextel Brazil obtained licenses to provide 3G1 services throughout the country in December 2010 and is expected to launch commercial services on its 3G network at the end of 2011 (DataMonitor, 2011). With increasing competition in both Portugal and Brazil, PT might be forced to compete on price in order to retain its market share and continue to be profitable.
IMPLICATIONS FOR MANAGEMENT
There are a number of factors that have contributed to the success of Portugal Telecom. First, the company has excelled at identifying one of its core competencies – innovation – and has successfully turned it into a source of competitive advantage. PT makes significant investments in the ongoing development of new technology and perceives creativity as a powerful tool for driving business. By being able to recognize and capitalize on its strengths, PT has fostered unison throughout the company and has created a commitment to innovation. In addition, the company has developed a strong brand that is widely recognized. In Portugal, the PT logo is highly visible in many areas throughout the country. For instance, there is an abundance of telephone booths bearing the company logo scattered throughout downtown Lisbon. In this way, PT has established itself as a prominent brand. As evident by the company’s dominance of the market, a strong, well-developed brand is crucial for capturing new customers. Further, Portugal Telecom has proved that it is always cognizant of – and subsequently pursues – potential opportunities to expand its business. The company’s active pursuit of growth opportunities is one of the driving forces behind its rapid success. PT CEO Zeinal Bava touched on this notion in an interview with McKinsey Quarterly (2011): “by doing less than our best, we avoid learning what our true potential is”. An example of the company’s constant drive for new opportunities can be seen by its rapid expansion into Brazil. Its strategic partnership with Vivo, followed by its partnership with Oi, quickly grew to be an important source of revenue and the company is still seeking new methods for broadening its operations in the Brazilian market. Overall, Portugal Telecom is an
1 The term “3G” is a reference to the third-generation mobile network.
Bachelor of Commerce | Best Business Research Papers Vol. 5
|12
illustration of a company that has managed to establish itself as one of the leading companies in its sector and is actively continuing on a path towards additional success and rewards. The company’s ability to exploit its strengths, its established brand image, and its continuous pursuit of growth opportunities can be assessed and used as a reference by managers within the industry. Managers can adapt these factors as necessary and apply them to their own firm. In this way, PT’s strategic objectives can be used for managers to maximize the potential of and add value to their firm.
RECOMMENDATIONS
After completing my analysis, I have formulated a few recommendations for PT that will help the company sustain itself in the short and long term. Firstly, I believe that it is necessary for the company to make improvements to its current human resource (HR) practices. As indicated earlier in this paper, the company has been extremely successful in fostering a company culture based on innovation. However, by enhancing PT’s current HR policies and implementing new ones, the company can develop a workplace culture that is also focused on the importance of people and collaboration. This will result in loyal employees who take pride in their work and in the company, which will enhance overall productivity. This is especially important with regards to the current European debt crisis. Due to a lack of job opportunities, most college and university graduates will likely be seeking employment out of the region. For example, the company can show that it values its employees by offering benefits such as a competitive compensation package or stock option plan. Furthermore, employees are not simply seeking a job that allows them to make a living, but they are also seeking a role that provides opportunities for personal and professional development. By offering new programs for employees based on career and skill development, PT will be able to distinguish itself as a top employer and retain the best talent in the industry. For example, PT can offer workshops or seminars based on leadership development. Another recommendation for Portugal Telecom is to focus its efforts on penetrating developing markets. As noted by Bava:
In developing markets, people understand the value of education. I wouldn’t be surprised if we’ll see a disproportionate allocation of disposable income to technology in developing markets because it opens the doors to knowledge and establishes a level playing field for everyone (McKinsey Quarterly, 2011).
In the telecommunications industry, international expansion is an important means of value creation. Developing nations can serve as a source of growth for PT because they offer a wide range of investment opportunities. The company can use its core competencies to capture new markets. For instance, Brazil is a strategic market with one of the most important emerging economies after India and China. The poorer population has seen an increase in purchasing power, resulting in a change in consumer trends (Investment U, 2011). According to Business Monitor International (2011), Brazil’s economy has the most potential for growth in the mobile telecommunications industry in Latin America. Although its GDP in 2011 is approximately half of what it was in 2010, mobile phone subscriptions still increased by 1.67% from July to August. Between 2010 and 2015, the number of mobile phone subscriptions is expected to increase by 39%. In addition, the increasing widespread use of smart phones throughout the country is the reason behind a near 400% increase of 3G subscribers (DataMonitor, 2011). Portugal Telecom already has a large presence within Brazil, which has allowed the company to gain knowledge of cultural, political, and market factors within the country. This gives the company a significant advantage, and it should leverage on its presence to focus its efforts on penetrating additional market segments within the country.
Bachelor of Commerce | Best Business Research Papers Vol. 5
13|
Portugal Telecom is a sector reference in sustainability. It is one of the top nine telecommunications companies worldwide with the best practices in terms of sustainability, along with AT&T (United States), British Telecom (UK), Koninklijke KPN (Netherlands), KT (South Korea), Telecom Italia (Italy), Telefonica (Spain), Telus (Canada), and Verizon (United States) (Salema, 2011). PT was included in the Dow Jones Sustainability World Index for the second consecutive year and has recently improved its position. Sustainability is a strategic priority for PT in an economic, social, and environmental capacity. It is included as one of the three pillars of PT’s strategy, along with innovation and execution (Portugal Telecom, 2011). According to Salema (2011), the company’s sustainability strategy is the supporting factor behind the innovation and execution strategies through the principles of business ethics, environmental preservation, and positive social impacts. In addition, the company has a Sustainability Committee to approve strategies at the Board level. Despite all of the recognition and commitment that PT has for its sustainable initiatives, these efforts are at a macro level and are mostly company wide. As a TMN customer myself, I have noticed a number of ways that the company can improve its activities to be more sustainable. When I purchased a mobile phone, it came in a large blue plastic box and was delivered in a paper shopping bag. I felt that this was not environmentally friendly and the company could utilize alternative methods, such as condensing the packaging. In addition, I have been given numerous documents, papers, and business cards each time I visit a TMN outlet to add more money onto my pre-paid phone, a process that is also not environmentally friendly and seems quite unnecessary. To the average user, it appears that the company is not as committed to sustainability as its numerous awards reflect. For these reasons, I believe that PT should focus its sustainable initiatives on a smaller scale in addition to its current large-scale initiatives.
CONCLUSION
With the increasing interconnectivity of people and information across the globe, companies within the telecommunications industry are shifting their business models to be able to provide users with a continuous sequence of new, updated products and services. Portugal Telecom has enjoyed remarkable success since its formation in the early 1990s, and it is still continuing to strive for further growth opportunities. Its position as market leader in every segment that it operates can be attributed to its ability to foster the principle of delivering innovative products and services as a company-wide value. It has also developed a strong brand image and is successfully capturing new business opportunities as they arise. In order to stay competitive in the future, PT should adapt its current HR policies to have a larger focus on its employees by providing a wider range of benefits, rewards, and career development programs. This is especially important for retaining potential college and university graduates. Further, the company should focus on penetrating developing markets, specifically the Brazilian market. Brazil is an attractive market because its economy is growing and the company already has extensive knowledge of the local market. Lastly, Portugal Telecom should complement its current large-scale, macro-level sustainable initiatives by focusing on sustainability on a smaller scale.
REFERENCES
Bava, Zeinal, PT Road Show 11/12, Universidade Catolica Portuguesa, Lisbon, Portugal, November 25, 2011. Bloomberg Businessweek (2011). Portugal Telecom Third-Quarter Revenue Advances on Brazil. http://www.businessweek.com/news/2011-11-04/portugal-telecom-third-quarter-revenue-advances-on-brazil.html (accessed November 27, 2011). BuddeComm (2011), Portugal – Telecoms, IP Networks, Digital Media and Forecasts
Bachelor of Commerce | Best Business Research Papers Vol. 5
|14
http://www.budde.com.au/Research/Portugal-Telecoms-IP-Networks-Digital-Media-and-Forecasts.html#overview (accessed November 21, 2011). Business Monitor International (2011). Portugal Telecommunications Report Q2 2011. http://www.researchandmarkets.com/reports/1846054/portugal_telecommunications_report_q2_2011 (accessed November 30, 2011). Businesswire (2011). Research and Markets: Portugal - Broadband Market Insights, Statistics and Forecasts – 2011. http://www.businesswire.com/news/home/20111028005687/en/Research-Markets-Portugal-Broadband-Market-Insights (accessed November 25th, 2011). DataMonitor (2011). Portugal Telecom, SGPS, S.A. - SWOT Analysis. http://www.researchandmarkets.com/reports/1846054/portugal_telecommunications_report_q2_2011 (accessed November 30, 2011). Funding Universe (2004). Portugal Telecom SGPS S.A. http://www.fundinguniverse.com/company-histories/Portugal-Telecom-SGPS-SA-Company-History.html (accessed November 28, 2011). Garbacz, C. & Thompson Jr., HG. (2007). ”Demand for Telecommunications Services in Developing Countries.” Telecommunications Policy, 31(5), pp. 276-289. Investment U (2011). The Biggest Tech Trend in Brazil. http://www.investmentu.com/2011/October/brazil-mobile-telecom-industry-growth.html (accessed November 25, 2011). McKinsey Quarterly (2011). Remaking Portugal Telecom: An interview with CEO Zeinal Bava. https://www.mckinseyquarterly.com/Telecommunications/Remaking_Portugal_Telecom_An_interview_with_CEO_Zeinal_Bava_2789 (accessed November 20, 2011). Pitta, D.A. (2009). “Creating a Culture of Innovation at Portugal Telecom.” Journal of Product & Brand Management, 18(6), pp. 448-451. Porter, M. (1979). “The Five Competitive Forces that Shape Strategy’.”Harvard Business Review, 57(2), pp. 137-145.
Portugal Telecom (2011). Portugal Telecom. http://www.telecom.pt/InternetResource/PTSite/UK/Canais/SobreaPT/ (accessed November 30, 2011). Salema, T. (2011). Sustainability Initiatives at Portugal Telecom, Marketing in the New Era, Lisbon, Portugal, November 15, 2011. A class presentation. Santos, Vitor (2011). Competition and Oligopoly in Telecommunications Industry in the EU. http://www.scribd.com/doc/48599342/Competition-and-oligopoly-in-telecommunications-industry-in-the-EU (accessed November 28, 2011).

Bachelor of Commerce | Best Business Research Papers Vol. 5
15|
“Made in [East] Germany”: An Analysis of East German Manufacturing Immediately Following Reunification and Today Scott Davidson Fall 2011 ABSTRACT
This paper briefly examines the factors that led to the failure of many firms in the post-communist, freshly unified East Germany, which led to mass unemployment and business closures. Afterwards, the majority of the discussion will focus on how the rough transition from communism to capitalism has resulted in a unique and advantageous environment for manufacturers in modern day East Germany due to five main factors of production: land, affordable skilled labour, infrastructure, economic security, and government subsidies. In order to provide thorough and relevant information, both secondary and primary sources will be employed, including a survey of future employment plans of students at the HHL Graduate School of Management in Leipzig. Finally, an analysis of the two successful firms of Porsche and AMD will be included to illustrate East Germany’s opportunity for unparalleled manufacturing advantages put into practice.
INTRODUCTION
With the end of the Cold War came a wave of uprisings from the Eastern Bloc countries, breaking the hegemony of the Soviet Union over the region and bringing an end to the ailing communist system that it imposed. Nowhere was this more memorable than in East Germany, where the symbolic demolition of the Berlin Wall in 1989 provided the image that defined the period in history. For those living in the German Democratic Republic (East), this event was met with elation and new hope for the region that had suffered at the hands of communism for four decades, while still within earshot of the bustling capital markets of central Berlin. After a long wait, it seemed as though it was finally time for the east to start experiencing the economic growth and wealth that had been experienced everywhere west of the Iron Curtain. However, the reunification of East and West Germany posed an intimidating challenge for policy makers and government officials faced with the daunting task of reinventing the formerly communist east economy and bringing it up to par with the west. Although once again united as a single nation, the vast economic growth disparities between the thriving capitalistic west, and struggling east left a marked division of income and living conditions in the two areas. This meant a massive investment was needed to rebuild infrastructure and technology, with the bill being paid for by West German taxpayers. Meanwhile, the formerly nationally-owned businesses in the east now required private ownership, as well as an entire overhaul in order to adapt to the newly introduced and unfamiliar capitalism system. As a result, it soon became apparent that the rehabilitation of the anaemic eastern region would come at a great cost to residents of the west, and the positive effects of reunification may take a considerable period of time before being realized. This paper will briefly describe the initial difficulties faced by firms in East Germany during the transition to a
Bachelor of Commerce | Best Business Research Papers Vol. 5
|16
capital economy before investigating the current market conditions that now make East Germany an advantageous market for managers in search of a new production location.
EARLY YEARS
Although the fall of communism and the reunification of the nation was a joyous occasion for nearly all residents in East Germany, the few years to come were no doubt going to be difficult, and the benefits of capitalism were unlikely to be felt without a period of turbulence. The previous communist economy in Eastern Germany had been one of very low-competition and high government involvement, where suppliers were limited and prices fixed. Therefore, this economy was characterized by low product variety and a high degree of product scarcity, leading to rationing and the emergence of bartering and black market activity. Additionally, entrepreneurship was not popular, profitable, or viewed positively by the society, so the incentives were negligible. However, there is one exception of course being those entrepreneurs that took advantage of scarcity via black market sales (Fritsch, 2004).
Firm Conditions
Due to these previous conditions, the immediate implementation of the western economic and political systems came as a shock to the system, and put pre-existing East German firms in a challenging position. For many of these firms, formerly intended to produce a standard good with limited inputs, being thrown into a competitive market was disastrous. Firstly, the pillaging of German production equipment by the Russians, as well as the effects of the Iron Curtain largely cutting off the flow of knowledge (Fritsch, 2004), left the technology in the east far behind its western counterpart. This meant that the manufacturing industry was severely depleted and heavy investment was needed to bring factory equipment and methods up to a competitive level. Meanwhile, their internal processes lacked the efficiency of western firms and had to be entirely revamped to remove the rigid bureaucratic hierarchy that controlled all aspects of production. This was necessary to improve production efficiency, but created a great deal of confusion with employees who now needed to collaborate across departments and perform a wider variety of tasks than was previously demanded of them. Also, entirely new products and variety needed to be introduced and advertised, rather than simply manufacturing a limited number of standard, identical products. Finally, due to the low productivity resulting from these production factors, the introduction of new higher wages for eastern employees sent labour costs soaring to a level that the productivity of these firms could not sustain. As a result, many firms could not survive the transition to the capital market. By 1993, there was a sixty-five percent decline in the number of workplaces in the manufacturing sector, sending unemployment skyrocketing to over twenty percent (Fritsch, 2004).
Employment Conditions
As Segarra (1991) describes, after four decades of communism East German citizens found themselves talking for the first time about money and prices, as well as the need to organize insurance, bills, and investments for retirement. The radical reforms had forced the heart of the workforce age 25-50 to reinvent their entire lives, while also dealing with the discontent of West Germans who believed that the high government investment in the east was damaging the economic growth they had worked so hard to achieve. These radical changes and patronization from the west equated to a great deal of stress outside of the workplace, as well as confusion and overall dissatisfaction. As has been shown by many studies, stress outside of the workplace can be equally as damaging as work-related stress, and can lead to a sharp decline in productivity (Heylighen & Vidal, 2007). This is a problem currently facing the human resource departments of modern firms and has led to the creation of many new employee-friendly policies. Furthermore, the modern productivity issues of having a handful of employees with
Bachelor of Commerce | Best Business Research Papers Vol. 5
17|
non-work related stress could only be assumed to have been devastating to an early nineties East German firm when facing every employee at once. With the investment into entirely new equipment and processes came the necessity for equal investment into employee training. The slow pace of the rigid communist bureaucracy and its high division of labour gave way to a system requiring more responsibility and open collaboration between departments. Therefore, not only did workers need to be retrained on the use of equipment, but also on the new environment in which work was carried out. Furthermore, even more crucial than production-level workers was the need for competent upper management to direct the company. Due to the transition to a capital market and extreme adjustments to production, the knowledge stock of previous management quickly became obsolete; therefore replacement or complete retraining of management was necessary (Fritsch, 2004). This was made even more difficult due to the emigration of skilled labour to the west. Similar to the “Brain Drain” that had depleted the East German labour stock prior to the USSR closing the border in 1952, many of the best and brightest of East Germany’s labour market were able to secure higher paying jobs in the west, leaving eastern firms without proper strategic management. All told, some one million East Germans migrated west, creating a six percent decrease in population between the years of 1989 and 1991 (Burda & Hunt, 2001). As a result, in the first few years after reunification the productivity in the east was less than forty-five percent compared to that of the west, meaning that the forced rise in wages could not be supported by the level of production, and massive layoffs as high as eighty to ninety percent in some firms were necessary (Burda & Hunt, 2001).
Implications for Business
Despite East Germany opening up as an entirely new capital market, seemingly providing opportunities for businesses, this was clearly not the case. Even with the 1.5 trillion DM government investment into the east in the decade after reunification (Burda & Hunt, 2001), the area was still very unsupportive for foreign investment. Even for firms that had the money to bring in the necessary capital, the extremely low labour productivity in the region made manufacturing in the east near impossible for a firm intending to turn a profit. For this reason, the market was not attractive to new entrants and many pre-existing firms were forced out of business. In addition, many of the firms that did maintain production in the region did so at a loss, with government funds subsidizing their efforts (Burda & Hunt, 2001).
COMING OF AGE
Despite the initial inabilities for East German firms to adapt to the changes of a market economy, by the year 2000 conditions had greatly improved in many important areas. In addition to the monetary investment provided by the west totalling 1.5 trillion DM from 1990-2000, sharing a common language and government with the powerful western economy had facilitated the flow of knowledge to the region (Burda & Hunt, 2001). This had helped eastern firms recover from the devastating initial phase and make clear movements along the learning curve. A decade after reunification, East Germany had a solid handle on the basics of capitalism, and saw great strides in operational efficiency for firms and quality of life for citizens.
Capitalism as Intended
A decade after reunification, the benefits of government investment had begun to be seen in some of the fundamental areas necessary for success in a market economy such as labour productivity, wages, and consumption. Labour productivity grew from less than forty-five percent of the western level in 1991, to seventy-three percent by the beginning of the new millennium, and in many sectors, East

Bachelor of Commerce | Best Business Research Papers Vol. 5
|18
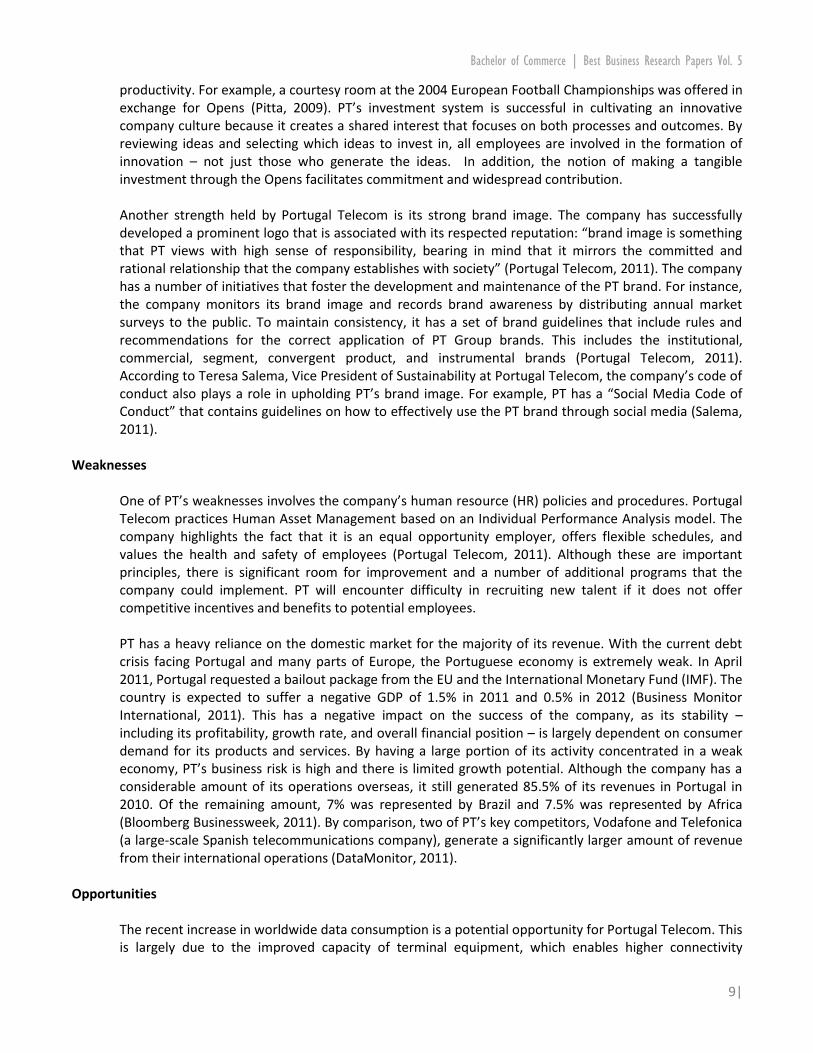
German labour productivity actually exceeded that in the west (Burda & Hunt, 2001). As a result of this productivity increase, businesses that operated in the area could produce at a much higher efficiency, justifying the high wages that had previously drove labour cost to dangerously high levels for firms trying to be profitable. This was also beneficial for employees as real wages saw a rise from about a third of western levels at the time of reunification, to three-quarters by 1996 (Burda & Hunt, 2001). With this tremendous raise in wages, the eastern population had significantly more disposable income to spend on goods that would previously have been considered luxury items, therefore providing new opportunities for businesses to offer increasingly diverse product lines. Since employees are also consumers, an increase in wages led to an equal increase in consumption, from forty-three percent of western levels in 1991, up to seventy-three percent by 1998. Figure 1.1 illustrates the rise in consumption described by Burda & Hunt (2001) with the use of familiar products.
Figure 1.1
At long last, the capital market in the east had begun to achieve some degree of rhythm with the perpetual cycle of increased production leading to higher wages, and increased income leading to higher consumption, requiring greater production. This was immensely promising for both firms and their employees, leading to an increase in entry to the market and the growth of specific industries in the east, especially the technology sector that is so prevalent today in cities like Jena and Dresden (Herbst, 2009). Eventually, the growth described above led to the creation of one of Europe’s most unique and beneficial regions for production.
BENEFITS OF THE EAST
After the initial struggles for East German firms and their employees to adjust to the radical changes that came with an immediate shift from the collective to the capital market, the region has developed into one of many advantages for manufacturers. Although GDP and real income may still lag behind the west, the government investments into the east have generated some incentives unique from the rest of the continent. The next section of this paper will be dedicated to taking an in-depth look at some of these factors that should make East Germany attractive to foreign investment.

Bachelor of Commerce | Best Business Research Papers Vol. 5
19|
Land
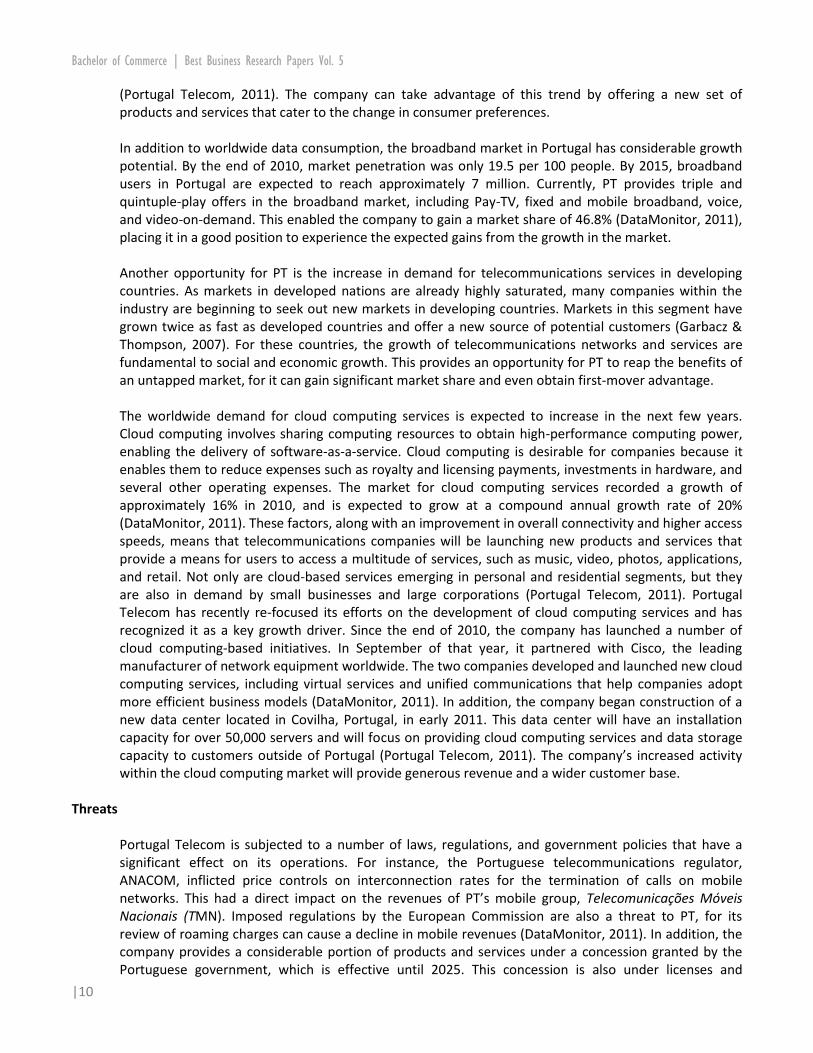
East Germany is characterized by a handful of bustling metropolitan areas and an abundance of rural areas with few inhabitants and high unemployment for those who do reside in the country. This has allowed East Germany to become a hotbed for renewable energy production in wind and solar. As these methods require a great deal of open space to operate, the Eastern countryside has long satisfied this requirement, and at a discount rate of purchase. More recently, manufacturing firms have started to take notice and the number of companies looking at production in the East has been increasing as previous land supplies are being depleted, sending prices soaring. This is due to the fact that there are open lots right on the outskirts of dense cities, rather than two hours out of town as is the case in some other more heavily populated regions. In fact, there are even large plots of land available in the downtown area where dilapidated buildings stand amongst renovated apartments and busy shops. One such location in Leipzig is a former Druckerei (printing) factory that sits on a sizable plot of land within eyesight of the city’s main square Augustusplatz. Photographs of the property and proximity to town are provided in Figure 1.2. A site this large in such a highly visible area could provide businesses in a wide array of industries with a profitable location for operations. Also, it should be noted that this is not a rare case either, as abandoned buildings like this one can be seen all throughout the city of Leipzig and Eastern Germany as a whole. However, some have already taken note of the potential and there are an ever-increasing number of developments already underway to transform these cheap central locations into lucrative businesses.
Figures 1.2 Affordable Skilled Labour
A major aid to the growth of Eastern Germany has been the increase in university student attendance from both the local population, and students around the world. Here in Leipzig, major construction to transform an old cathedral into the new Universität Leipzig has recently been completed to accommodate the rise in attendance. This is also the case in the university town of Jena, where the Friedrich-Schiller-Universität Jena provides the heartbeat of the community (Herbst, 2009). Meanwhile, the Financial Times (2011) recently rated the modest-sized HHL Graduate School of Management in Leipzig to be the number one entrepreneurial school in all of Europe. Due to my participation in this school, it is here where I conducted my survey to gauge future employment in the East German area. With migration of the brightest minds to the west being a major contribution to past businesses achieving sub-par performance, I decided to ask a few simple questions to determine whether or not the
Bachelor of Commerce | Best Business Research Papers Vol. 5
|20
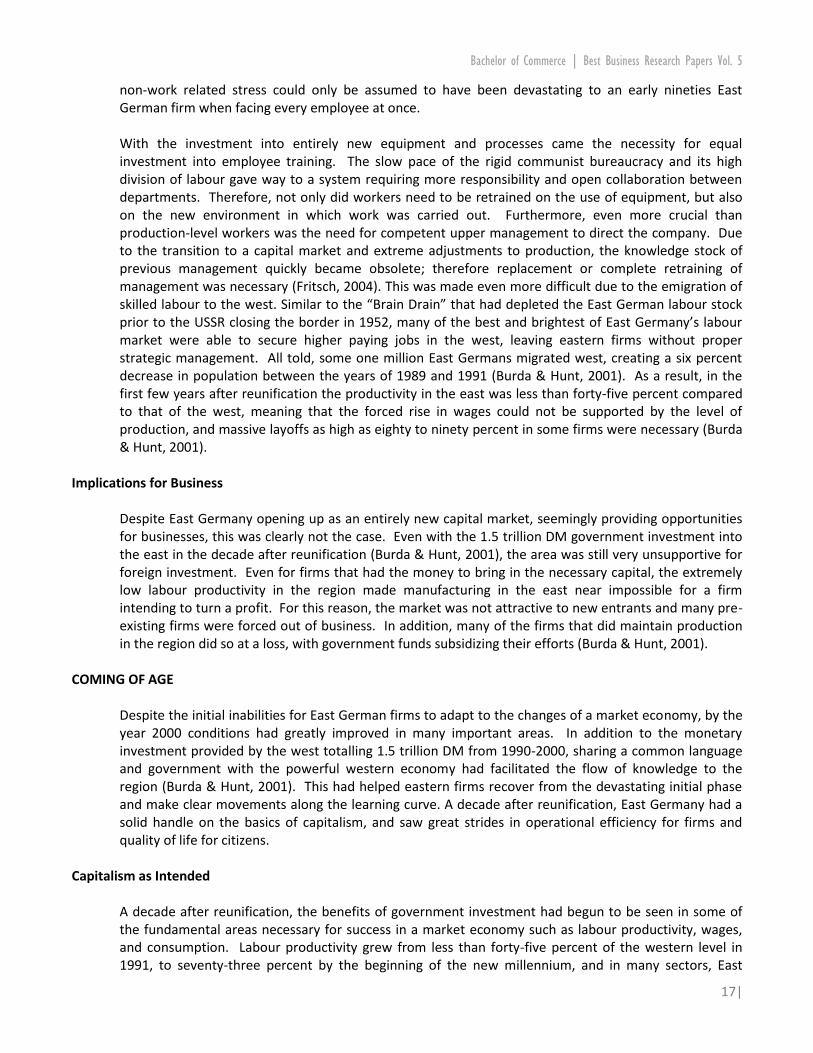
“Brain Drain” was still hindering East Germany’s expansion. The exact survey questions are written below:
1) Where did you live before coming to HHL? An Eastern German Province ___ A Western German Province ___ Outside of Germany ___
2) Given your experience, how interested are you in working in Saxony, or any other Eastern German Province after graduation?
Highly Interested ___ Interested ___ Disinterested ___ Highly Disinterested ___
3) Do you intend on starting an entrepreneurial venture after graduation? Yes ___ No ___ Unsure ___
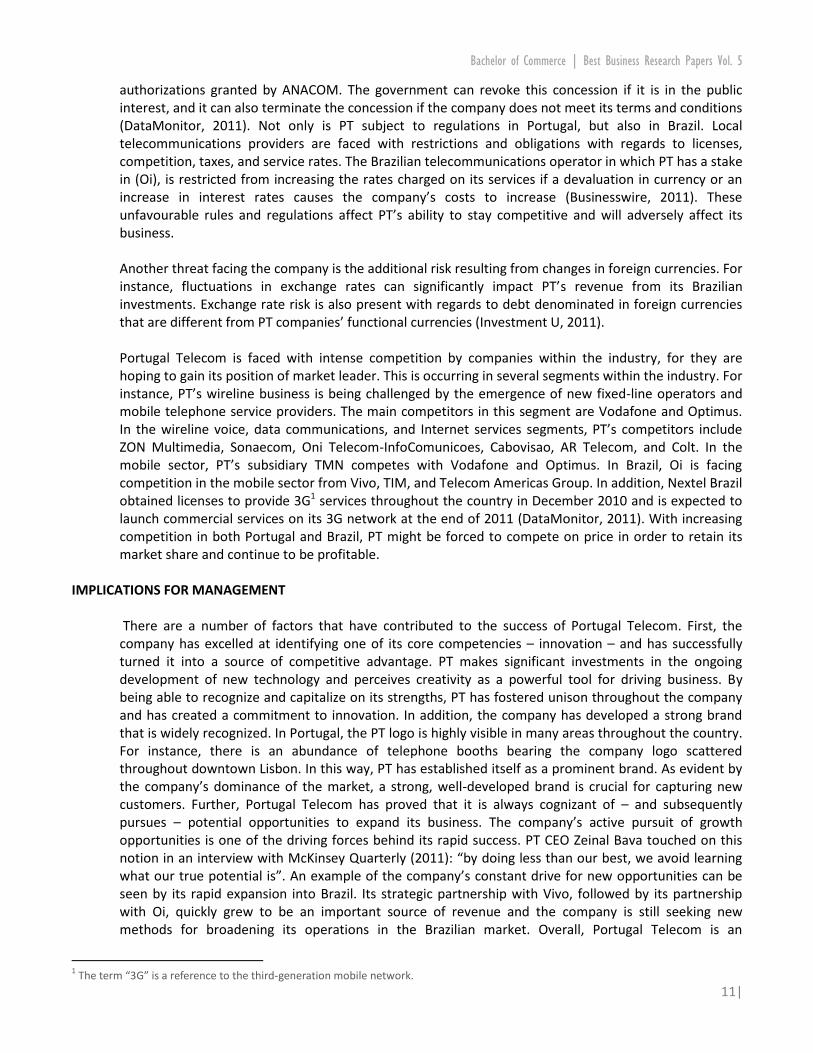
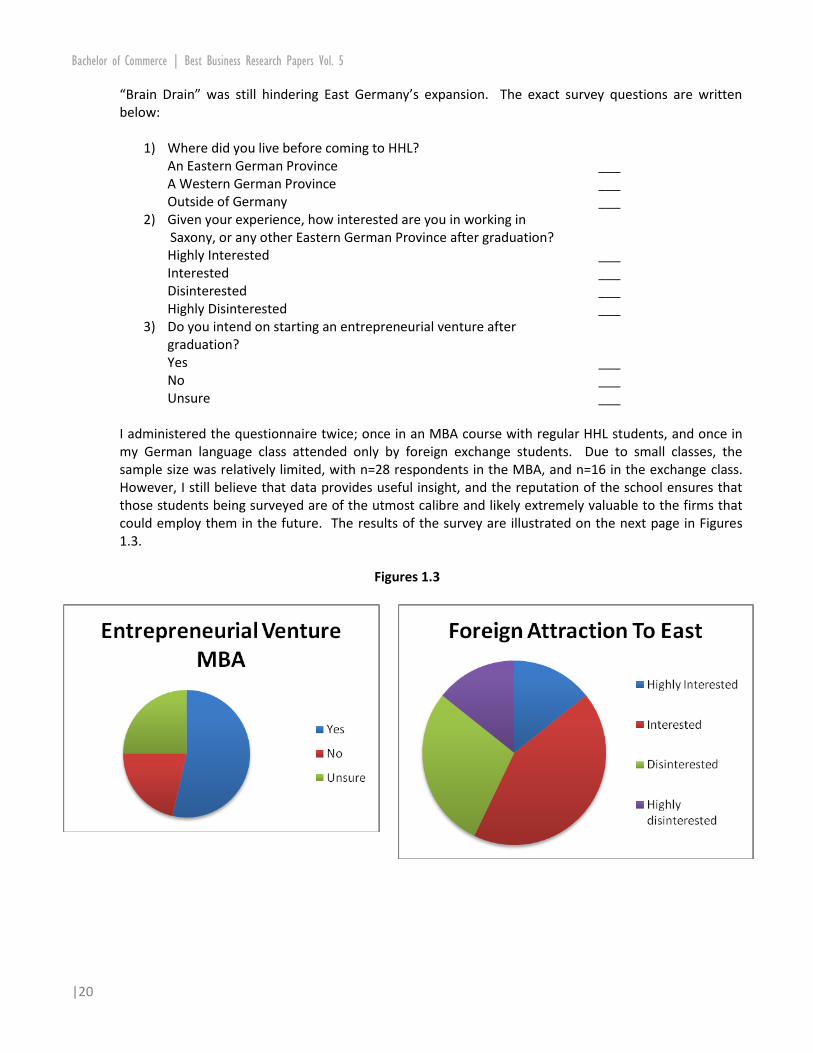
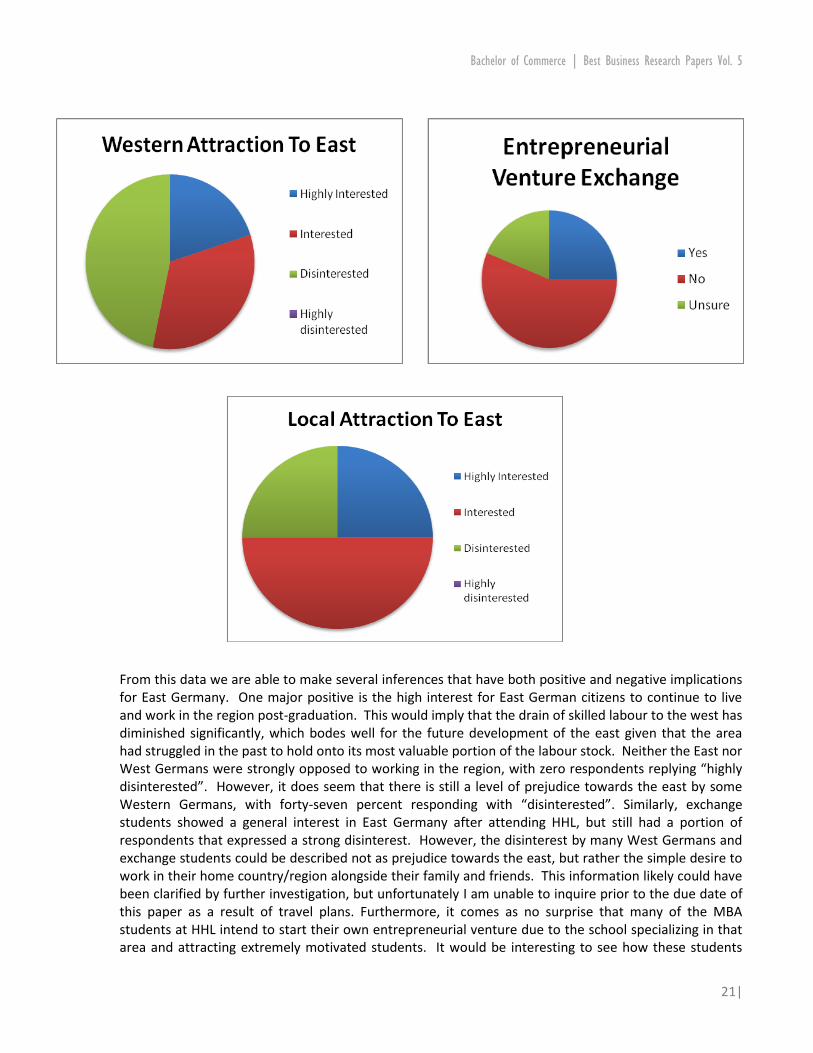
I administered the questionnaire twice; once in an MBA course with regular HHL students, and once in my German language class attended only by foreign exchange students. Due to small classes, the sample size was relatively limited, with n=28 respondents in the MBA, and n=16 in the exchange class. However, I still believe that data provides useful insight, and the reputation of the school ensures that those students being surveyed are of the utmost calibre and likely extremely valuable to the firms that could employ them in the future. The results of the survey are illustrated on the next page in Figures 1.3.
Figures 1.3
Bachelor of Commerce | Best Business Research Papers Vol. 5
21|
From this data we are able to make several inferences that have both positive and negative implications for East Germany. One major positive is the high interest for East German citizens to continue to live and work in the region post-graduation. This would imply that the drain of skilled labour to the west has diminished significantly, which bodes well for the future development of the east given that the area had struggled in the past to hold onto its most valuable portion of the labour stock. Neither the East nor West Germans were strongly opposed to working in the region, with zero respondents replying “highly disinterested”. However, it does seem that there is still a level of prejudice towards the east by some Western Germans, with forty-seven percent responding with “disinterested”. Similarly, exchange students showed a general interest in East Germany after attending HHL, but still had a portion of respondents that expressed a strong disinterest. However, the disinterest by many West Germans and exchange students could be described not as prejudice towards the east, but rather the simple desire to work in their home country/region alongside their family and friends. This information likely could have been clarified by further investigation, but unfortunately I am unable to inquire prior to the due date of this paper as a result of travel plans. Furthermore, it comes as no surprise that many of the MBA students at HHL intend to start their own entrepreneurial venture due to the school specializing in that area and attracting extremely motivated students. It would be interesting to see how these students

Bachelor of Commerce | Best Business Research Papers Vol. 5
|22
take advantage of the unique aspects of East Germany and its potential for new business due to the lower market saturation in the area (Suder, 2008).
These results seem to vaguely mirror some of the results observed by Risen (2009) in his Atlantic article, stating that “while many of the best workers have migrated west looking for better jobs, the growth of relatively high-wage sectors in the east is drawing some of them back: according to First Solar’s Wortmann, ten percent of its Frankfurt (Oder) employees are former [Easterners] returning from the West” (p. 1)”. This is promising news for those that have tried so hard to bring the east up to par with the west. However the disposable income of East Germans still remains at around seventy-nine percent of their western countrymen (Herbst, 2009). Although this is not especially joyous news for the employees, it provides a significant incentive for firms to produce in Eastern Germany where skilled labour can be acquired at a premium rate.
Infrastructure
East Germany’s introduction to capitalism created a lot of instability, forcing many pre-existing firms out of business. This was mainly the result of outdated equipment and a lack of infrastructure that stifled productivity and drove up costs with the introduction of new higher wages, therefore leaving many people out of work. This was the unfortunate result of trying to make the move to the capital markets too rapidly, and before systems could be put in place to allow these firms to become competitive. Fortunately, the necessary infrastructure was being developed the entire time, just not quickly enough for the organizations in this era to reap the benefits. However, modern firms have clearly realized the rewards of the 140 billion DM infrastructure investment between 1992 and 1998 (Burda & Hunt, 2001). Currently, East Germany boasts a rail system equally robust as that found in the west, while the autobahn that had been expertly developed during the fascist period and left to rot during communism has been fully restored to its glory days. This strong transportation infrastructure provides a major benefit to manufacturers in the region by allowing them to ship to anywhere in Europe in a timely manner. Logistics chains can be greatly simplified by having a railway track located on-site for immediate transfer from the production floor straight onto the train and off across the continent in less than a day. Not only does this simplify operations for the organization and promote a “pull” production process, but it also bolsters the company’s reputation as a supplier that always makes shipments on time, therefore promoting future business. In addition, transcontinental transportation is strong in the region due to the government funds invested into airports and northern harbour terminals, creating the ability for transportation to the lucrative US market. Finally, telecommunications and utilities have been greatly improved over the past two decades creating lower input costs and greater connectivity for firms in the eastern region (Burda & Hunt, 2001).
Economic Security
Another attractive quality of the eastern market is how minimally the economic crisis of the Eurozone has affected the region. As a whole, Germany has been the most secure economic region in the EU, with unemployment actually decreasing from 10.6% in 2005 down to 6.8% in 2010, while continuing to experience GDP growth, albeit at the lesser rate of 2.6% (Holland et al., 2011). What is even more astounding is that the east seems to be fairing even better than the west during this period. While Germany saw a shrinking in growth by 6% nationally, the eastern states only experienced a decrease of 4.5% (Risen, 2009). According to Risen (2009) this surprising fact comes as a result of the relatively small export market in the east, as most goods produced in the region are consumed domestically. Therefore, during the uncertain times of the current economic crisis, Eastern Germany actually appears to be the safest bet in the entirety of the Eurozone.
Bachelor of Commerce | Best Business Research Papers Vol. 5
23|
Government Subsidies
The final and most impressive incentive for firms to operate in Eastern Germany is the provision of government subsidies to organizations located in the region under the “Guidelines on National Regional Aid for 2007-2013”. Section 1 of this treaty reads as follows:
“On the basis of Article 87(3)(a) and (c) of the Treaty, State aid granted to promote the economic development of certain disadvantaged areas within the European Union may be considered to be compatible with the common market by the Commission. This kind of State aid is known as national regional aid. National regional aid consists of aid for investment granted to large companies, or in certain limited circumstances, operating aid, which in both cases are targeted on specific regions in order to redress regional disparities. Increased levels of investment aid granted to small and medium-sized enterprises located within the disadvantaged regions over and above what is allowed in other areas are also considered as regional aid (Regional Aid, 2006, pp. 1).”
This agreement requires the German government to provide subsidies to firms operating in the “disadvantaged region” of Eastern Germany, in order to attract newcomers to the area. These subsidies are given in annual allotments based on the size and scope of a firm, its economic contributions to GDP, and number of jobs created. Furthermore, any further investment into the region by a pre-existing firm will be subject to an increase in government aid provided. In total, this agreement and its predecessor have accounted for an incredible €1.5 trillion in subsidies since reunification, providing an incredible opportunity that cannot be ignored for firms looking for a new location for their production facility (Herbst, 2009). However, as will be shown in the following examples, these subsidies are not necessary for the east to be a profitable manufacturing market, but they are often an incentive that cannot be rejected.
SUCCESSFUL PRODUCTION EXAMPLES
In order to illustrate the tremendous production benefits provided by the East German environment, the two cases of Porsche and AMD can be examined. These two facilities are unique from each other due to their size and industry, but similar in their success and utilization of the unique East German market.
Porsche
Recently, I had the opportunity to visit the modern Porsche production factory located in Leipzig. This medium-sized factory that employs 800 was built in 2002 for production of the Cayenne and Panamera models and is still considered state-of-the-art to this day. It features a private test track for vehicles and a direct connection to the rail system, allowing for quick and easy transportation of completed vehicles. Porsche selected Leipzig in East Germany for its production site against seventeen other locations for many of the reasons outlined above. The ability to acquire an affordable plot of land of necessary size right on the outskirts of the metropolitan area was a unique benefit of the East German area. Additionally, the direct connection to the railway for minimal set-up costs allowed for the elimination of vehicular transportation of finished products to a hub, while also increasing the speed and ease of delivery to anywhere in Europe. Meanwhile, the abundance of affordable skilled labour in the area filled the factory with employees within a very short period, allowing it to start operation immediately, while producing at a lower cost than it would have been able to in most other European locations. However, what sets Porsche apart from other production facilities in East Germany is the fact that government subsidies played no part in its decision to set up shop in Leipzig. Porsche is very proud of this fact and
Bachelor of Commerce | Best Business Research Papers Vol. 5
|24
promotes their noble philosophy that luxury goods and government subsidies do not mix. This is an excellent example of how profitable and supportive the East German environment can be for manufacturers, even without the collection of government charity (Porsche-Leipzig, 2011).
AMD
AMD is a US microprocessor giant that supplies Microsoft, Adobe, and many more familiar names in the computing industry. AMD made the move to Dresden in 1996 for the manufacturing of its products with the expectation of investing about 1.9 billion USD and of employing some 3,500 in the area. However, the success of AMD’s operations in Dresden has led to an actual investment of just under 5 billion, while employment more than doubled to a total of 7,500, with plans for expansion still forthcoming (AMD, Europa, 2007). Once again, the abundance of discount skilled labour and available land ensured affordable set-up and production costs, while government subsidies provided an opportunity unlike anywhere in Europe. Unlike Porsche, AMD had no problems with accepting government aid, nor did the government object to issuing the funds to the massive factory that contributes so much to the economy in the east. In fact, in 2007 when AMD announced its plan to expand its facility with a 2.2 billion dollar investment, employing an additional 565 jobs to the province of Saxony, the German government was quick to cut a cheque for 262 million Euros in aid (Europa, 18 July 2007). Thus, the tremendous success of AMD is made that much sweeter for the firm, while the previously communist state of Saxony is finally witnessing the much-awaited benefits of capitalism.
CONCLUSION
Immediately following the collapse of the Soviet Union’s control over East Germany and the elimination of the communist ideology that had seen quality of life fall far behind that of the west, expectations were set high in the region. However, these expectations may have, in hindsight, led to an overambitious attempt by government to restore capitalism to a region wherein the majority of the population had never known anything but the Soviet-style collective economy. Radical changes were implemented quickly, opening eastern businesses to a highly competitive environment in which survival was all but impossible. Similar to releasing a domesticated animal into the wild, the security and assistance that had kept them alive was now gone, and instead replaced by much more athletic and experienced firms that quickly cannibalized these weak competitors. In total, the lack of knowledge, equipment, and productive labour led to the elimination of sixty-five percent of manufacturing firms in East Germany by 1993, with many others on life-support, operating at a loss with government subsidies to keep them producing (Fritsch, 2004). As a result of these firms closing down, twenty percent of East Germans were left without employment and likely, second thoughts. Fortunately, the twenty-first century began to show some indications of economic improvements, and the government aid in excess of 1.5 trillion DM that had been invested the previous decade started to payoff (Burda & Hunt, 2001). Wages, productivity, and local consumption all rose to previously unseen levels, which allowed firms in the area more success in both the manufacturing and sales of its products. Meanwhile, the wage increase meant that employees now had an incentive to remain in the east, rather than move to better paying employment in West Germany. This slowed the migration of skilled labour that had been so damaging to East Germany since the Iron Curtain lifted, allowing it to further develop to the state it is in today. Currently, East Germany provides an opportunity well suited for manufacturers that is unique to the rest of Europe. As previously described, the main advantages of the east are an abundance of land, affordable skilled labour, modern infrastructure, economic stability, and government subsidies. As
Bachelor of Commerce | Best Business Research Papers Vol. 5
25|
shown in the two cases of Porsche and AMD, these factors can provide a manufacturing company of any size with a competitive advantage in production due to cost, location, and transportation of goods. Unfortunately, success stories like these are far too rare, as this advantageous market has gone mostly untapped. However, as can be seen by the growing amount of construction around Leipzig, businesses are starting to take notice of the east over other parts of Europe, and even West Germany. Simply put, it is a region that offers affordable production in the heart of Europe, while allowing products to carry the trusted stamp “Made in Germany”.
REFERENCES
AMD (2007). “AMD in Dresden.” Europa. http://ec.europa.eu/information_society/events/ict_rd_globalisation/docs/deppe.pdf (accessed December 1, 2011). Burda, M. & Hunt, J. (2001). “From Reunification to Economic Integration: Productivity and the Labor Market in Eastern Germany”, Brookings Papers on Economic Activity, (2), pp. 1-92. Fritsch, M. (2004). “Entrepreneurship, Entry and Performance of New Businesses Compared in Two Growth Regimes: East and West Germany”, Discussion Papers on Entrepreneurship, Growth and Public Policy, pp. 1-29. Herbst, M. (2009). “East Germany 20 Years After Reunification”, Bloomberg Businessweek, 5 Nov. 2009. Heylighen, F. & Vidal, C. (2007). “Getting Things Done: The Science Behind Stress-Free Productivity”, Long Range Planning, 41(6), pp. 585-605. Holland, D. et al. (2011). “Prospects for Individual Economies”, National Institute Economic Review, (216) pp. 18-26. Porsche-Leipzig (2011). www.porsche-leipzig.com (accessed December 1, 2011). Press Release, (2007). “State aid: Commission endorses €262 million aid to AMD for large investment project in Dresden, Germany.” Europa, 18 July 2007. http://europa.eu/rapid/pressReleasesAction.do?reference=IP/07/1109 (accessed December 1, 2011). Regional Aid (2006). “Guidelines on National Regional Aid for 2007-2013”, Official Journal of the European Union, 54(13) pp. 1-32. http://eur-lex.europa.eu/LexUriServ/LexUriServ.do?uri=OJ:C:2006:054:0013:0044:EN:PDF (accessed December 1, 2011). Risen, C. (2009). “Underestimating East Germany.” The Atlantic, 6 Nov. 2009. Sagarra, E. (1991). “German Reunification: After Euphoria”, Studies: An Irish Quarterly Review, 80(317) pp. 77-86. Suder, G. (2008). Doing Business in Europe, SAGE Publications, London.
Bachelor of Commerce | Best Business Research Papers Vol. 5
|26
Heineken N.V.: Strategic Global Brand Management as a Source of Competitive Advantage Kyla Ganton Fall 2011 ABSTRACT
Within the international beer market today, Heineken International (or in Dutch: N.V.) is one of the true leaders, dominating the industry through strategic global branding. The implications of creating a global brand transcend to more than just products, and can be seen in the purchasing behaviour of consumers. In a market where there are many close substitutes and numerous associated risks, Heineken has built a strong platform with which it uses Corporate Social Responsibility (CSR) as a mitigation tool and as brand insurance. Similar to other strong global brands, the Dutch brewing company utilizes a multi-brand portfolio with over 250 beer and cider brands. This has been the result of over a century of firm expansion and acquisition strategies. With a large investment in festival sponsorship, charitable events, and sporting competitions, the Heineken brand name has developed many and memorable secondary brand associations. Through the company’s global presence in almost every continent, the brand has achieved first mover advantages and therefore competitive advantages. Creating and maintaining a global brand is no easy feat, comprising of many managerial implications such as costs of a global vs. local orientation. However, Heineken N.V. has successfully established its global brand to cover uncountable markets, using CSR as a risk mitigation tool, making it a master of the international beer industry.
INTRODUCTION
One of the most valuable intangible assets a company can possess is a strong brand. The power of a strong brand is more robust than its ability to create enhanced brand awareness. It also allows consumers to recognize an identity and its related image or personality, fostering favourable purchase behaviour. Therefore, there are strong implications for managers to develop and maintain a strategic brand, which sometimes results in creating a diversified portfolio of brands to reach new markets and fill gaps. Heineken International, which in the European market is labelled ‘Heineken N.V.’ (Naamloze Vennootschap: Nameless Partnership), has built an empire of over 250 brands that range from local to global orientations. The flagship brand of the same name has successfully created a global branding strategy that extends further than its originating market in the Netherlands to reach almost all of the continents today. The beer industry in the Netherlands has always fostered “national brews,” signifying the varieties in the positioning of Heineken across markets. To foster its global branding strategy, Heineken N.V. has successfully developed a House of Brands approach with its portfolio, using the necessary tactics to ensure personalized innovations while avoiding product or brand duplication. The difficulties in maintaining a global brand provide numerous implications for managers that can be seen in all stages of brand strategy development, therefore creating a need for risk management, of which Heineken is currently an avid participant of. The use of Corporate Social Responsibility (CSR) activities has allowed Heineken to preserve its brand and mitigate risks, all the while showing stakeholders that the brand is more than just beer. Utilizing a local vs. global orientation has allowed Heineken
Bachelor of Commerce | Best Business Research Papers Vol. 5
27|
International to create a diversified portfolio of strategic brands that are strengthened by its use of CSR activities.
BRAND MANAGEMENT AND STRATEGIC BRANDING
By definition, a brand is any name, logo, symbol, and design that identify a seller’s product or service as distinct from those of other sellers (American Marketing Association, year?). Brands are created to craft a valuable intangible asset for a seller, called brand equity, which is simply the value, added to a product or service that would not be added had it no brand (Keller, Aperia and Georgson, 2008). There are numerous elements of a brand that facilitate increased perception and recognition, such as logos, characters and jingles. Therefore, the implications of creating a strong brand are threefold (Kapferer, 2008): brands are considered to be a part of a company’s capital, thus the concept of brand equity. Secondly, creating and maintaining brand strength results in the development of brand knowledge, a concept comprising of brand image and brand recognition. Brand image is the way in which the consumer perceives a brand and holds personal opinions about it, which supports brand recognition, whereby the consumer can recall the brand when shown a relevant cue (Keller et al., year). Finally, developing a strong brand can often result in repeat purchasing and brand loyalty. Managers do not always stop at maintaining the strength of their brand. Eventually, brand strength can develop into using the brand strategically or generating a strategic brand. When a brand is strategic, it is more than just a name or logo to differentiate against competition; it is truly the driver for a company. Kapferer (2008) argues that, in order to support a strategic brand, a diversified portfolio should be formed that uses entirely different brands with different brand managers, thus creating a House of Brands approach (Aaker & Joachimsthaler, 2000), which will be discussed in detail later. The use of many brands in a given portfolio is often used by the most global brands, as seen in the cases of Unilever and Proctor and Gamble. Key guidelines to sustaining a multi-brand portfolio include strong coordination, personalized innovations according to positioning, and duplication avoidance (Kapferer, 2008). Utilizing a brand coordinator or a brand committee is useful to provide coordinated marketing strategies, particularly for flagship brands that guide an entire set of brands. Next, in regard to positioning, it is important that innovations are made on a case-by-case basis and do not blur the boundaries between brands. Finally, duplication in brands is common in any collection of items, which is why global brand managers need to be careful to clearly distinguish each brand in a portfolio in order to fill every “gap” in the market, targeting every and all niches. However, before any strategic branding decisions can be made, thorough market research must be conducted to assess the possibilities of expanding globally.
THE BEER INDUSTRY IN THE NETHERLANDS
The market for beer in the Netherlands is one of deep appreciation and national pride, based on inferences of personal experience. Consumers are more willing to purchase national or local beers than imported beers, which are reflected in the grocery stores and liquor depots. In contrast to other European countries, namely Germany, beer in the Netherlands is predominantly pale lagers or “witbier” (white beer). The manner in which Dutch beer is poured from the tap differs significantly from other nations of the world, adding a deeper cultural context of beer consumption. Beer from the tap must have a two-inch head, by carefully and slowly pouring, which is topped off to stop the formation of bubbles as to keep the foam longer. Furthermore, beer is usually served in 0.2 L portions, with variations in size and shape of beer glasses complementing the “beer experience.” Particularly in smaller Dutch cities, one of the three most famous Dutch brewery’s beers feature at the student bars and student organization locations, but is not openly advertised. In the region of Limburg, a southern Dutch state, lagers are more easily available in both restaurants and grocery stores than wine.
Bachelor of Commerce | Best Business Research Papers Vol. 5
|28
The market for beer will not likely see much expansion, as the Dutch people place value on tradition and culture, with Dutch beer being at the forefront of such culture (Marijke van Haag, Dutch Masters Student, Maastricht University, personal communication, November, 2011). Furthermore, beer consumption is extremely high, due to the Dutch cultural aspect of outdoor eating. On any given night, whether weekday or weekend, the outdoor seating at cafés is almost always full, with people merely enjoying a beer together. The art of cuisine and alcohol consumption is largely social and dinners can last up to three hours, due to the cultural social aspect. It is with this social aspect of enjoying beer that has fostered a successful growth of one of the most prized Dutch beers: Heineken.
HISTORY OF HEINEKEN: EXPANSION AND ACQUISITION
Heineken is perhaps one of the most recognized beers worldwide, competing successfully on both a regional, national, and global scale. Founded in 1863 in Amsterdam, Heineken began as an economic start-up by Gerard Adrian Heineken, growing rapidly in size due to the current decline in the Dutch beer industry. With a focus on quality, the innovative company created cooling systems to preserve the beer throughout the brewing process, technologies that were requested by other breweries across the globe. During the period of 1914 to 1940, Heineken N.V. experienced numerous expansions, particularly due to the change in leadership – Gerard’s son Henry Pierre took over after his father’s death. In 1929, the brewery began bottling their beer themselves, creating a higher quality product. Demand continued to grow, and by 1933, Heineken had entered the United States’ beer market, after the Prohibition period of the 1920s. It was this shift from national dominance to a pursuit of worldwide success that launched the beer to be known as an “international premium brand beer.” In 1948, the Heineken brand began to grow, after realizing the importance of successful brand management and its implications for a global strategy. Over the next ten years, the brand experienced many changes in labelling and advertising, to appeal to a broader market (Heineken International online: About Heineken). The English Allied Breweries group, consisting of many Dutch breweries including Heineken, took over the market-dominant Amstel brewery in 1968. As a current leader in the Dutch beer industry, Amstel posed a large threat for Heineken and the merger of the two breweries led to uneasiness over the national and global implications caused. Eventually the two brands formed a corporate culture and retained their traditional values. During the 1970s, Heineken focused their expansion strategy on the European market, whereby the company held a mere 2.8% market share. During this time, the success of their beer in the Netherlands rose, leading to the creation of a larger brewery in Zoeterwoede. In the 1980s, Heineken’s international brand recognition grew; the green bottle was available in 145 countries, with numerous other green “gadgets” contributing to the creation and expansion of brand knowledge. However, within the Netherlands at this time, the brand retained its traditional red and white labels, featuring different advertising campaigns than the ones shown globally. After the fall of the Berlin Wall in 1989, Heineken began expanding into East Germany. As the rapid international success of the brand grew, the beer took on the green logo in the Netherlands, adding a red start to the label to keep its heritage. Currently, the innovative company is focusing on extending its market reach to more than just beverages, including event sponsorship and even the creation of a nightclub to go “…beyond the design of beer packaging and *focus+ on the consumer experience in a bar” (Heineken N.V., 2011). Little do people know that Heineken N.V. is actually the brewer of over 250 beer and cider brands, including Strongbow, Amstel, and Cruzcampo, indicating the brewery has the most global footprint of any other in the world (Heineken N.V., 2011). Heineken has stated its intention “…to be a leading brewer in each of the markets in which we operate and to have the world’s most valuable brand portfolio” (Heineken
Bachelor of Commerce | Best Business Research Papers Vol. 5
29|
International Online: Company & Strategy, year). It is in this valuable brand portfolio that Heineken has created a dominating global position, focused on entering and governing as many markets as possible.
HEINEKEN’S GLOBAL POSITIONING
As the world’s most international brewer, Heineken prides itself as an independent brand, with an ever-expanding global strategy, producing their flagship beer alongside many other beers and ciders, and memorabilia featuring the internationally recognized green and white theme. The brand claims that “marketing excellence and innovation” are the keys to the internationalization of their growth (Heineken International online: Company & Strategy, year). During 2010, Heineken’s brand value rose by 8%, and more than 60% since 2005, providing proof of the brewery’s successful growth strategy (Heineken N.V., 2011). Within the Netherlands, Heineken is positioned as a traditional pale lager, built upon the fact that the Dutch value local products, taking pride in the fact that the beer they are consuming comes from their own country. In contrast to other brands, Heineken appears as a “local company that you want to support, even though it is such a global brand” (van Haag, 2011). The product itself differs between Europe and North America, featuring a smaller, stouter bottle in the European market. In North America the beer is packaged in long, slender bottles, similar to competing pale lagers. Furthermore, in the North American market, the beer is viewed as a premium lager, varying starkly from its Dutch identity. In Canada, Heineken is primarily purchased by people who really appreciate global beers, or who can afford a more expensive beer, similar to the case of Stella Artois. Within the national market, Heineken is viewed as a “comfortable beer that *people+ enjoy drinking because *they+ know it is always of upmost quality” (van Haag, 2011). The availability of Heineken truly echoes its national importance, with shelves upon shelves in every grocery store stocking the brand. It is often difficult to find imported beer, due to the popularity of the flagship brand. The various international identities of Heineken give proof to its global uniqueness and importance. To build brand credibility, Heineken sponsors many events, such as the Rugby World Cup 2011 and the UEFA Champions League, which are watched by a global audience. Sponsorship is a powerful communication medium due to the large audience reached, creation of a specialized message, and prevailing secondary associations (Keller et al., 2008). By supporting events and festivals that are advertised on an international scale, the Heineken name is strengthened and communicated farther than localized advertisements on television. Eventually, the brand name itself will be incorporated into the event, so that the two are inseparable, as seen in the case of Heineken Green Energy Festival. Apparently, attendees do not refer to the event as the green festival, but rather include the brand name, providing valuable brand associations (van Haag, 2011). Of course, implications of these actions can be seen even stronger when more than one brand is in a portfolio. The way multi-brand portfolios can be viewed is as a spectrum, by which different strategies are used.
HEINEKEN AS A HOUSE OF BRANDS: THE BRAND RELATIONSHIP SPECTRUM The rising challenge in brand management is attributed to changing environments and customer demands, which lead to the relatively new discipline of “brand architecture” that specify the role of the brand and relationships between brands (Aaker & Joachimsthaler, 2000, p. 8). Furthering this notion of brand architecture is a model that can support brand managers with the important task of positioning, particularly in a global strategy – the Brand Relationship Spectrum. As seen in Figure 1, this spectrum thrives on where the “driver role” of the brand is derived, and how it encourages purchase and usage situations (Aaker & Joachimsthaler, 2000). A Branded House strategy has multiple offerings within its brand, with the master brand at the heart of the driver role. Next, Endorsed Brands, brands endorsed by

Bachelor of Commerce | Best Business Research Papers Vol. 5
|30
stronger ones, whereby the endorser plays a limited driver role. In the case of Sub-brands, whereby brands are connected to a master brand, the master brand shares a driver role with its sub-brand, creating a dually enforcing relationship. Finally, and what this article will be focusing on, a House of Brands strategy involves numerous stand-alone brands with individual market penetration and driver roles (Aaker & Joachimsthaler, 2000). As seen in Figure 1, the House of Brands strategy uses a large set of independent stand-alone brands, which allows firms to clearly position brands based on functional benefits and filling current market gaps. Furthermore, the House of Brands strategy can be broken down to utilize one or both of two strategies.
Figure 1. The Brand Relationship Spectrum (Aaker & Joachimsthaler, 2000, p. 9)
Strategy: Not Connected
Utilizing a Not Connected strategy, a firm can avoid a brand association that would be incompatible with a particular offering. For example, one of the Heineken brand’s beers is Buckler, a low alcoholic beer that has been at the centre of a few controversial events. The beer was openly mocked by a Dutch comedian and was the beer of choice at a controversial arrest at the Beer Summit at the White House Rose Gardens (Heineken N.V.: Annual Report, 2006). Due to the subtle, if not zero, ties to the mother brand of Heineken, Buckler’s misfortunate shortcomings were not at all associated to it. In addition, not having direct connection to the flagship brand allows breakthrough advantages for new brand offerings (Aaker & Joachimsthaler, 2000). Finally, avoiding or minimizing channel conflict is a key benefit to the Not Connected path. The clear distinction from Heineken in the case of the brand Amstel, which focuses primarily in malts, is advantageous in the sense that the two brands clearly dominate their respective markets and do not directly compete against one another. The advantages of using these Not Connected tactics are two-fold. Firstly, any controversies or negative public opinions allow for little harm to the
Bachelor of Commerce | Best Business Research Papers Vol. 5
31|
mother brand, and secondly, it allows for penetration into new markets that may not have been previously possible.
Strategy: Shadow Endorser
The second strategy that can be implemented is acting as a Shadow Endorser, whereby the brand is not visibly connected to the flagship brand, but consumers are still aware of the connection. This can be seen in the case of the Brand brewery, which is known by the public to be affiliated with Heineken, therefore reinforcing its image, but not providing a direct linkage. The advantages of this strategy are that a known organization is backing the brand at the same time as minimalizing “association contamination” (Aaker & Joachimsthaler, 2000, p. 12). In order to deal with this risk, Heineken utilizes constant reputation management, due to the fact that both the Group and the most valuable brand share the same name (Heineken International online: Risk management and control system, year). Each brand that is shadow endorsed by a more popular brand has the ability to make a dramatic statement about itself, even after the link is discovered by the public. This also allows for expansion into new markets, where citizens may vaguely be aware of the flagship brand, but not be able to affordably consume it. A good example of this phenomenon can be seen in the case of the North American market, whereby Heineken is marketed as an international premium beer and Amstel is marketed as a unique and rare European Malt. Finally, within any strategy used, there are numerous risks, that are intensified when the brand is global.
RISKS OF GLOBAL BRANDING
As with any other venture, there are many risks involved in developing a brand, which are further accentuated when the brand is globalized. Due to the fact that global brands create advertising efforts and positioning in numerous countries and markets, communication tactics need to be considered. Differences in ethics and norms need to be considered, as well as the use of translation in advertising – not all phrases translate the same, as seen in historical advertising blunders. The differences in markets create a need for simultaneous branding strategies, which is both time consuming and costly. Few firms are able to sustain multiple brand identities while maintaining their flagship brand at the same time. Heineken has created many brand identities that can be seen even in the Western Europe market. Within the German market, the brand is perceived as prestigious and expensive, compared to local brands (van Haag, 2011), which for a manager can be seen as a need for a different branding campaign. Operating in a new market increases the possibility of consumer’s perceived risk of the product (Heineken N.V.: Annual Report, 2009). Without knowledge of the brand, such as many of the brands within Heineken’s portfolio that are not directly linked to the flagship name, consumers may observe an enhanced risk of purchasing, such as the possibility of the product not meeting expectations. This can be viewed as a consumers’ effort for risk aversion, due to cultural differences and new market offerings (Steenkamp, Batra & Alden, 2003). Furthermore, as with any multinational company, currency risk prevails. Operating in more than one currency can result in losses in exchange rates and difficulties within the supply chain. Additionally, risks can be seen in any international activity that involves secondary associations created or reinforced by Heineken. For example, if a spokesperson were to be used by the brand, any negative actions by the individual in the future would be unconsciously transferred to the Heineken brand by the consumer. This is why careful consideration needs to be put into the choice of advertising tactics. Finally, the international identity of a global brand is the core of its competitive advantage and corporate strategy, thus providing a need to protect and preserve it at all costs. Any negative press towards the brand or any subsidiary brand of Heineken must be carefully dealt with to ensure that brand loyalty is not hindered. As commonly known, it is more costly to attract new consumers than keep existing
Bachelor of Commerce | Best Business Research Papers Vol. 5
|32
consumers, which is why an effective and efficient consumer retention strategy should be utilized. One of the best ways an international brand can help mitigate these risks is to use corporate social responsibility as a strategic tool.
CORPORATE SOCIAL RESPONSIBILTY AS A TOOL TO MITIGATE RISK
As brands become more global, risk becomes more imminent, due to the increased exposure of a company and its actions. The likelihood of controversies heightens and therefore risk management tactics are required. This is due to the fact that “the values advocated by the branding process become benchmarks against which the firm’s actions are evaluated by customers, activist groups, and non-governmental organizations (NGOs)” (Werther & Chandler, 2005, p. 317-318). Moreover, as brands become stronger on a global scale, any negative externalities transpose more concretely into the minds of the consumer, meaning that secondary associations will be built up and maintained for longer. One of the strongest consequences that can happen to a brand is damaged brand loyalty, thus hindering purchasing behaviour. The foundation of risk mitigation can be thought of resting upon stakeholder theory, whereby stakeholders establish the social environment that a firm operates in, where the firm’s actions can affect all those who have an interest and vice versa (Jones, 2005). Stakeholder theory subsequently results in a need for a firm to satisfy all those at stake, which in the case of a global brand, can be done through acts of corporate social responsibility (CSR). CSR activities can be broadly defined as a company’s status and activities, with respect to its perceived societal obligations (Torelli, Monga & Kaikati, 2011). Undertaking CSR activities boosts purchasing intentions and frequency, as well as enhances the perceived image of a company or brand. Within this enhanced image, consumers will react more favourably to causes that are supported by the company (Torelli et al., 2011). The way in which stakeholders react to a company or brand’s CSR activities is especially important for globalized branding strategies. “CSR-related issues can easily erode the firm’s legitimacy and destroy the brand franchise upon which market value is built” (Werther & Chandler, 2005, p. 319), which is why firms whose brand strategy is at the core of their overall corporate strategy must be careful to include acts of CSR regularly, to mitigate such risks. Furthermore, the larger the stakeholder base, such as the case of Heineken with its international status, the more vivid the CSR activities become. Finally, CSR actions can act as “brand insurance,” because even the most prestigious brands will have substitutes, which is a large driving force for differentiation techniques within the beer industry. Werther and Chandler (2005) pose five strategies for firms to incorporate acts of CSR into their global brand management strategy, all of which Heineken N.V. uses, demonstrating its rise to international success.
Heineken and Corporate Social Responsibility
Heineken N.V. places great importance on their CSR activities, even before the global green craze began. Firstly, Werther and Chandler (2005) suggest that creating an internal CSR voice is crucial, which can be done with the appointment of a CSR Officer. Within management at Heineken, a CSR advisory board works to identify sustainable opportunities within the company’s processes, advises the Executive Board on strategy and priorities within the area of corporate responsibility (CR) and sustainability, as well as review the results of their actions (Heineken International online: Vision and governance, year). Next, measures and consequences must be established to engage both internal and external stakeholders. Heineken notes its dedication to CSR in every annual report it produces, as well as a detailed list of such activities on its international website. In this sense, these actions can be broadly measured, due to the fact that they are reported every year, and provide the consumer with transparent progress. As well, Heineken publishes an annual Sustainability Report that describes the efforts of the company to act green. Thirdly, perspectives should be taken from a multi-stakeholder standpoint, meaning that within every action a firm takes, all stakeholders should be considered.

Bachelor of Commerce | Best Business Research Papers Vol. 5
33|
The way in which Heineken N.V. includes all stakeholders can be seen in the company’s involvement in various sporting events, causes, charities, and community funds. Moreover, the firm’s annual reports do more than just state financial outcomes, they recognise the many stakeholders involved and how the company’s actions have taken them into consideration. This aspect builds upon the fourth criteria created by Werther and Chandler (2005), that proactive visibility is crucial to communicating a firm’s CSR activities. The many projects that Heineken is involved in are globally visible and communicated through their ad campaigns and on the company’s website. For example, in 2009, the company published its Milestones, which included the formation of an International Graduate Program, endorsing the UN Water Mandate, and creating the Heineken Africa Foundation to improve the health of Sub-Saharan African people (Heineken N.V.: Annual Report, 2009). Finally, the deliverables of a company, in relation to its CSR mandates, must exceed the actual promise. It is not good enough to merely meet consumer expectations as a global brand, the outcomes must be above and beyond the anticipated. Heineken continues to exceed consumer expectations with its initiatives to continuously strive for the reduction of its carbon footprint. There are numerous strategies to become greener and Heineken N.V. has utilized perhaps one of the most prominent ones as a global brand.
The Path to Green: Heineken’s Sustainable Future
According to Unruh and Ettenson (2010), there are three strategies that lead to becoming a more sustainable company, which require different resources and firm capabilities. The utilization of such “smart paths” can lead to first mover advantages and competitive advantages in the areas of sustainable competition.
Figure 2. The paths to green: Accentuate, acquire, and architect (Unruh &
Ettenson, 2010).
Firstly, as seen in Figure 2, an accentuate strategy can be used by firms who have little resources to become more green, but have a product(s) that already contains greenable attributes. This simply means that a product’s green aspects will be highlighted more than it was in the past, to make the product appear to be green, requiring no R&D, just a different advertising scheme (Unruh & Ettenson, 2010). Next, an acquire strategy can be used, whereby firms with little resources and un-green products can buy a
company or brand that is already green, in order to make their own brand appear more green. The implications of this path can lead to accusations of buying out competition, if the firm chooses to fade out the acquired brand. Finally, firms who have high green development capabilities and low greenable attributes, as in the case of Heineken, can use an architect strategy to create a greener brand. Companies who chose to architect their own green attributes, must have a history of innovation and have enough assets to sustain new product development or production methods (Unruh & Ettenson, 2010). In their 2010 Sustainability

Bachelor of Commerce | Best Business Research Papers Vol. 5
|34
report, Heineken N.V. stated that they are exploring ways to build carbon dioxide neutral breweries, which are being used and tested in Austria and Egypt (Heineken N.V.: Sustainability Report, 2010). This innovative idea will completely change the way beer is brewed and viewed globally. By means of an architect strategy, Heineken’s production methods could be adopted by the entire beer industry, creating first mover advantages that will ultimately create competitive advantage and favourable consumer evaluations. Eventually in the future, a combination of any of the three can be used, as seen in Figure 2. With the development of greening technologies by Heineken, it may give its products more greenable attributes and create a competitive platform. The rising world-wide importance of environmental concerns creates an attractive void in the beer industry, with which Heineken is on the path to fulfilling. Within these strategies, both with risk management and global expansion, there are many managerial considerations that should be addressed before and during the branding process.
MANAGERIAL IMPLICATIONS FOR GLOBAL BRANDING
For the most part, the creation of a global brand consists of building a strong consumer brand knowledge base that facilitates global recognition and a form of elitism. The most popular example of this phenomenon can be seen in the case of the Bavarian Motors Works (BMW), whereby the brand holds a prestigious position of quality and innovation that holds true for every market it serves. On the other hand, some brands choose to slightly alter their brand’s perception or image in an effort to differentiate their offering, as seen earlier with the Shadow Endorser concept. Even though most global brands are not completely identical from one country to another, as seen with Heineken’s brand meaning from country to country, becoming more global can foster many benefits (Aaker & Joachimsthaler, 1999).
Costs and Considerations of Global Branding
There are often many costs associated with creating a global brand, such as costly ad campaigns, difficulty in developing multiple brand strategies, and the lack of applicability to every market (Aaker & Joachimsthaler, 1999). A large part of Heineken’s success is their ability to create successful ad campaigns that are easily remembered and applicable in numerous markets. For example, many of the ads feature memorable characters such as cowboys, kung-fu assassins, and attractive females, which according to Keller et al. (2008): memorable brand characters are fundamental to building brand recognition, leading to increased and repeat product purchasing. In order to overcome the costly differences between creating local and global advertisement campaigns – such as language barriers, culture clash, etc. – Heineken uses entertainment, without cultural phrases or references, to sell its beer. This only further contributes to its global recognition and likability. Next, many brands struggle to achieve global market share, due in large part to the fact that it is extremely costly to create multiple brand strategies that will be superior in their respective markets. Heineken has successfully leveraged its brand by including many elements of its corporate identity during expansion (Aaker, 2004). In the Dutch market, Heineken emphasizes its heritage, due to its significance in Dutch culture. Comparatively, in the North American market, its value of perceived quality is important to customers who are searching for a “premium” beer. Furthermore, leveraging local vs. global orientation is especially important for global brands. Locally, in the Netherlands, Heineken is viewed as an aspect of daily culture, consumed by many people due to its wide availability in most pubs. This is particularly important due to the fact that is allows consumers to take pride in their “local” company, resulting in more frequent and steady purchasing patterns. In comparison, having global visibility adds prestige and recognition. For some consumers, a well trusted global brand will be more favourable to purchase than a local unknown brand. This brings forth the notion of difficulties with global brands being successful in every market. Some brands are

Bachelor of Commerce | Best Business Research Papers Vol. 5
35|
perceived as valuable attributes in one nation, which may be given in a market of another (Aaker & Joachimsthaler, 1999).
CONCLUSION
Creating and maintaining a global brand is much more than just altering the advertising campaigns to suit the respective country. Global brands must transcend cultural boundaries, targeting both a local market and an international one. The ability to create more than one successful branding strategy is rarely accomplished by firms. Heineken N.V. is a company that has effectively leveraged itself to create an internationally recognized beer, sold in over 150 countries world-wide. In order to achieve this feat, the company has gradually expanded across countries and continents, acquiring brands as to form a House of Brands whose reach extends to hundreds of markets and niches. Acting as a shadow endorser and not connected, the brand has both supported and added credibility to its portfolio. Although there are numerous risks to creating a global brand, such as currency risk and cultural differences, Heineken has developed a variety of CSR activities that mitigate such risks. Using five key strategies, the brand has been able to engage stakeholders and sustain brand loyalty by undertaking many initiatives to build a credible company. Furthermore, via an architect strategy, the firm will undoubtedly carve a new path within the beer industry with the use of CO2 emission neutral factories, further enhancing brand image. Finally, if the costs and considerations of maintaining a global brand are correctly fared by brand managers, both a local and global orientation will be achieved and therefore global market supremacy. Heineken is a true global House of Brands that successfully dominates each market it has entered by employing international strategies and easing risk through the use of strategic corporate social responsibility.
REFERENCES
Aaker, D. (2004). “Leveraging the corporate brand.” California Management Review, 41(3), pp. 102-24. Aaker, D.A. and Joachimsthaler, E. (1999). “The lure of global branding.” Harvard Business Review, November, pp. 137-144. Aaker, D.A. and Joachimsthaler, E. (2000). “The Brand Relationship Spectrum: The key to brand architecture challenge.” California Management Review, 42(4), pp. 8-23. Heineken International Online (n.d.). About Heineken. http://www.heinekeninternational.com/history_page.aspx (accessed November 3, 2011). Heineken International Online (n.d.). Company & strategy http://www.heinekeninternational.com/companystrategyprofile.aspx (accessed November 3, 2011). Heineken International Online (n.d.). Risk management and control system. http://www.heinekeninternational.com/riskmanagement_riskmanagement1.aspx (accessed November 20, 2011). Heineken International Online (n.d.). Vision and governance. http://www.heinekeninternational.com/vision.aspx (accessed November 20, 2011). Heineken N.V. (2007, March 19). Annual Report 2006 HEINEKEN N.V. http://www.heinekeninternational.com/annualreports.aspx (accessed November 14, 2011).
Bachelor of Commerce | Best Business Research Papers Vol. 5
|36
Heineken N.V. (2010, March 23). Annual Report 2009 HEINEKEN N.V. http://www.heinekeninternational.com/annualreports.aspx (accessed November 14, 2011). Heineken N.V. (2011, March 7). Annual Report 2010 HEINEKEN N.V. http://www.heinekeninternational.com/annualreports.aspx (accessed November 20, 2011). Heineken N.V. (2011, April 15). Sustainability Report 2010 HEINEKEN N.V. http://www.heinekeninternational.com/reportsandstatements.aspx (accessed November 19, 2011). Heineken N.V. (2011, August 16). “Heineken launches innovative new global design project.” [Press Release]. http://www.heinekeninternational.com/16082011_heineken+launches+innovative+ new.aspx (accessed November 29, 2011). Heineken N.V. (September 19, 2011). “HEINEKEN announces its new corporate visual identity.”[Press Release]. http://www.heinekeninternational.com/new_visual_identity_2011.aspx (accessed November 8, 2011). Heineken N.V. (October 4, 2011). ”Heineken® continues to go from strength to strength in Interbrand 2011 Best Global Brands report.” [Press Release]. http://www.heinekeninternational.com/041011_heineken_continues_to_go_from_strength.aspx (accessed November 1, 2011). Jones, R. (2005). Finding sources of brand value: Developing a stakeholder model of brand equity. Journal of Brand Management, 13(1), pp. 10-32. Kapferer, D. J-N. (2008). The new strategic brand management: creating and sustaining brand equity. http://books.google.nl/books?hl=nl&lr=&id=8PoItiB7bicC&oi=fnd&pg=PR5&dq=global+brand+management (accessed November 14, 2011). Keller, K.L., Aperia, T. and Georgson, M. (2008). Strategic Brand Management, A European Perspective, Harlow, England: Financial Times/Prentice Hall – Pearson Education. Chapters 1-4. Marketing Power (n.d.). In American Marketing Association online. http://www.marketingpower.com/ResourceLibrary/Pages/default.aspx (accessed November 1, 2011). Steenkamp J-B.E., Batra R., & Alden D.L. (2003). How perceived brand globalness creates brand value. Journal of International Business Studies 33(1), pp. 35-47. Torelli C.J., Monga A.B., and Kaikati A.M. (2011). Doing poorly by doing good: Corporate social responsibility and brand concepts. Journal of Consumer Research, p. 38. Unruh G. and Ettenson R. (2010). Growing green: Three smart paths to developing sustainable products. Harvard Business Review, June, pp. 94-100. Werther, W.B., & Chandler, D. (2005). Strategic corporate social responsibility as global brand insurance. Business Horizons 48(4), pp. 317-324.
Bachelor of Commerce | Best Business Research Papers Vol. 5
37|
Red Bull: Success Using Buzz Marketing Amanda Gillander Fall 2011 ABSTRACT
This paper will explore how Red Bull has established itself as an international brand and how they can maintain their position as the most popular energy drink on the market. A person would be hard pressed to find someone between the ages of fifteen and fifty who hasn’t heard of Red Bull. Whether you love it, or hate it for its medicinal taste and high price, it is undeniable that it has become a symbol of today’s youth. This paper will explore the success strategy of this energy drink pioneer, as well as give recommendations as to how they can maintain their position of power despite new threats. I will do so by analyzing the current position of the company using a strengths, weaknesses, opportunities, and threats (SWOT) analysis. I will then use Porter’s Five Forces to determine what the future of Red Bull might look like based on their current position in the industry. Then, based on research gathered from a number of articles and personal interviews, I will make the following recommendations for Red Bull: (1) permanently expand their limited edition line to North America, (2) establish a coffee line of the drink, (3) engage in charity work to improve brand image, and (4) employ more forms of conventional marketing to stay abreast of the competition.
ABOUT RED BULL
This section provides information regarding Red Bull’s company history according to the article The Powerful Sales Strategy Behind Red Bull (Gschwantner, 2004). Information from other sources will be indicated as needed. Red Bull Gesellschaft mit beschränkter Haftung (GmbH) is a private energy drink manufacturer with headquarters in Fuschl, Austria. The product, Red Bull, is an energy drink created by Austrian entrepreneur Dietrich Mateschitz. After graduating from the University of Vienna with a degree in World Trade, Mateschitz worked for a number of years as a travelling toothpaste salesman. It was a sales trip to Thailand that sparked Mateschitz’s ingenious creation. During this trip, he became fascinated with the success of a Thai energy drink called “Kratindaeng” that proved very popular with truck drivers who worked long hours and stopped at convenience stores to regain energy by consuming the drink. The recipe for the drink was outlined on the can and the company had no patent for protection. Mateschitz saw this as an entrepreneurial opportunity. When he returned home, he sought partnership from the son of his boss, Chalerm Yoovidhya. The duo collectively put down a million dollars to nurture their new venture and hoped for the best. It took the pair three years to finally attain their license to sell the drink and another two years after that to find a company that would bottle it. Red Bull was founded in 1984, but did not begin sales in Austria until 1987 (Red Bull, 2011). After establishing great success amongst students and club goers in Austria, the company decided to broaden its market. They began selling the product in Singapore in 1989, Hungary in 1992, Germany in 1994, and
Bachelor of Commerce | Best Business Research Papers Vol. 5
|38
the UK in 1995 (Red Bull, 2011). The success of their expansion led them to believe there was potential for success in North America, so they opened a branch in California in 1997 (Red Bull, 2011). Since the early days of development, Red Bull is now found in 161 countries (Red Bull, 2011). Most recently, the company has enjoyed great financial success in Turkey, Japan, Brazil, Germany and the United States of America (Red Bull, 2011). According to Red Bull’s official website, the product is a carbonated beverage that claims to “increase performance, concentration and reaction speed, improve vigilance, stimulate metabolism and make you feel more energetic and thus improve your overall well-being” (Red Bull, 2011). Currently, they only produce four product lines: Red Bull Energy Drink, Red Bull Sugar-free, Red Bull Energy Shot, and Red Bull Cola (Red Bull, 2011). The company has also recently released a limited edition line of the drink in a few European countries. The limited edition line consists of three fruity flavours: the Red Edition, Blue Edition, and Silver Edition. Unfortunately, due to the recent release of the products and their lack of existence in the English-speaking world, there is limited information available in English regarding its profitability and popularity. As listed on the standard version of the drink, the main ingredients include taurine, glucuronolactone, caffeine, B vitamins, sucrose, and glucose (Red Bull, 2011). The sugar-free version of course contains aspartame as well as the ingredients listed, while the Cola version of the drink contains traces of coca leaves (Red Bull, 2011). Red Bull has been credited with the extreme success and profitability of the energy drink category that it virtually created. As the pioneer of the product, Red Bull enjoyed a monopoly over the industry in its early stages; however, that did not last long. The company is now facing competition from a number of new entrants including, but not limited to, Monster, Rockstar, and Amp. Despite the increase in competition, Red Bull still continues to be the world’s number one energy drink (Red Bull, 2011). Red Bull is constantly finding new, innovative ways to promote the brand. (Specific techniques will be discussed in the section titled ‘Use of Buzz Marketing.’) According to a Red Bull generic email response from the company’s ‘Contact Us’ section on their website, part of the their success is attributed to keeping a lot of its marketing a secret. A quick look at the official company website will reveal that Red Bull does not like to give away too much information about anything that could be copied by competitors. It does however have a huge section dedicated to its numerous athletic teams, sponsorships and events.
USE OF BUZZ MARKETING
Red Bull’s domination of the energy drink industry was greatly brought forth by their experimental marketing techniques. From the beginning, Mateschitz has steered clear of traditional forms of mass marketing such as billboards, banners, and Web-marketing (Rodgers, 2011). Some insight into the benefits of experimental marketing came from the article Refocusing Marketing, which indicated that traditional marketing methods are less successful than experimental methods at catering to a wider range of segments and demographics (McCole, 2004). For example, this means that a commercial that may appeal to an athlete may not have the same effect on a university student. Another powerful result of Red Bull’s use of buzz marketing was the strong connection that it allowed them to establish with their customer base. According to Refocusing Marketing, unique events are an exemplar method of creating these types of customer relationships (McCole, 2004). Unique events form meaningful relationships with the target market and not only differentiate it from other products, but also greatly contribute to brand loyalty. Development of strong relationships with customers is a catalyst for brand loyalty, which is something that proves essential to success in an industry with such vast competition. For this reason, Red Bull has been able to establish a strong and loyal following.
Bachelor of Commerce | Best Business Research Papers Vol. 5
39|
As mentioned, the Austrian entrepreneur chose to take a more innovative marketing route with non-traditional methods commonly referred to as buzz marketing. One way in which Red Bull promoted their product to university students was by seeking out their target market directly and offering them free samples (Gschwantner, 2004). This method was effective at reaching all demographics and targets markets directly because they could actually experience the effects of the drink. This was accomplished by establishing marketing teams from Red Bull that would go to campuses to find trend-setting students to give cases of Red Bull to free of charge (Kumar, Linguri & Tavassoli, 2004). From there, the selected students would be hired to showcase the brand by hosting a party (Kumar et al., 2004). The logic behind this is that the product would become popular from experience and word-of-mouth, not by the media telling people that it is cool. One example of their non-traditional marketing techniques was presented to me during a personal communication with Johannes Kepler University student, Megan Hallar. Hallar informed me that on October 31st, 2011, two Red Bull marketers dressed as werewolves stormed into classrooms on campus and began wildly howling at students and staff. The two wolves left the classrooms only to return with free cases of Red Bull for the students to enjoy either after class, or for their Halloween celebrations that night (personal communication, M. Haller, November 2011). According to Megan, the unexpected event impressed students and made them feel more elite (personal communication, M. Haller, November 2011). Additionally, Red Bull’s debut on the bar scene resulted from employees that Mateschitz deemed “Musketeers” going to popular clubs and handing out free products for bartenders and staff to experiment with (Gschwantner, 2004). Needless to say, the craze of mixing alcohol and Red Bull did not take long to figure out. The drink virtually masks the taste of alcohol and allows patrons to consume a lot more. In addition to nightclub promotion, Red Bull promotion staff also worked with outlets such as supermarkets, colleges, gyms, and convenience stores to establish connections with industries in which the drink would be consumed away from the actual sales point (Hein, 2001). When emphasizing his less aggressive advertising techniques, Mateschitz was quoted as saying “We don’t bring the product to the consumer, we bring consumers to the product” (Gschwantner, 2004). These experimental forms of marketing were helpful in saving the company a lot of money that they otherwise would have poured into advertisements during their early stages. Now that they have developed further, the Red Bull is comfortable with spending huge sums of money on brand awareness of the product. In 2004, Mateschitz spent 30% of company revenues on brand awareness through marketing (Dolan, 2005). A lot of this money has been contributed to underscoring the company’s focus on athletes. To cater to athletes, Red Bull has expanded its original marketing techniques to include the sponsorship of a number of extreme sporting events. Some examples include X Fighters motocross freestyle, Flugtag flying contest, Street Dogs street skateboarding, Red Bull Rampage free ride mountain bike competition, and numerous others (Gschwantner, 2004). As of 2005, the company also provided financial support to over 500 athletes worldwide (Dolan, 2005). Additionally, Red Bull has been able to plaster their logo on the jerseys and uniforms of a number of company-owned sports teams including four football teams, two ice hockey teams, two Formula one racing teams, and a fighter jet team (Boome, 2011). While Red Bull predominately uses buzz marketing techniques, they have expanded their marketing to include a few cartoon television advertisements boasting their trademark slogan “Red Bull Gives You Wings” (Hein, 2001). Another more traditional method of marketing that they have recently engaged in is celebrity endorsements. In 2009, the company announced that football star Reggie Bush would endorse the product (Roenigk, 2009). According to Hein (2011), Red Bull uses its marketing techniques to simply reinforce the brand to create awareness of the product.
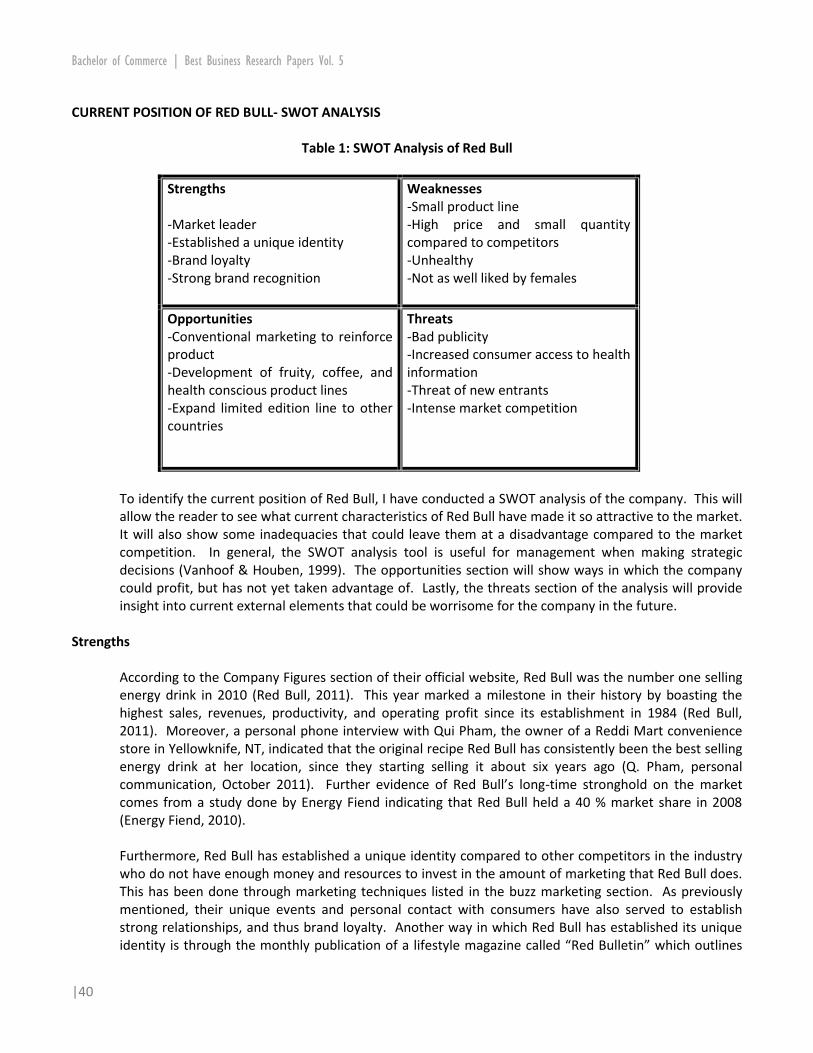
Bachelor of Commerce | Best Business Research Papers Vol. 5
|40
CURRENT POSITION OF RED BULL- SWOT ANALYSIS
Table 1: SWOT Analysis of Red Bull
Strengths -Market leader -Established a unique identity -Brand loyalty -Strong brand recognition
Weaknesses -Small product line -High price and small quantity compared to competitors -Unhealthy -Not as well liked by females
Opportunities -Conventional marketing to reinforce product -Development of fruity, coffee, and health conscious product lines -Expand limited edition line to other countries
Threats -Bad publicity -Increased consumer access to health information -Threat of new entrants -Intense market competition
To identify the current position of Red Bull, I have conducted a SWOT analysis of the company. This will allow the reader to see what current characteristics of Red Bull have made it so attractive to the market. It will also show some inadequacies that could leave them at a disadvantage compared to the market competition. In general, the SWOT analysis tool is useful for management when making strategic decisions (Vanhoof & Houben, 1999). The opportunities section will show ways in which the company could profit, but has not yet taken advantage of. Lastly, the threats section of the analysis will provide insight into current external elements that could be worrisome for the company in the future.
Strengths
According to the Company Figures section of their official website, Red Bull was the number one selling energy drink in 2010 (Red Bull, 2011). This year marked a milestone in their history by boasting the highest sales, revenues, productivity, and operating profit since its establishment in 1984 (Red Bull, 2011). Moreover, a personal phone interview with Qui Pham, the owner of a Reddi Mart convenience store in Yellowknife, NT, indicated that the original recipe Red Bull has consistently been the best selling energy drink at her location, since they starting selling it about six years ago (Q. Pham, personal communication, October 2011). Further evidence of Red Bull’s long-time stronghold on the market comes from a study done by Energy Fiend indicating that Red Bull held a 40 % market share in 2008 (Energy Fiend, 2010). Furthermore, Red Bull has established a unique identity compared to other competitors in the industry who do not have enough money and resources to invest in the amount of marketing that Red Bull does. This has been done through marketing techniques listed in the buzz marketing section. As previously mentioned, their unique events and personal contact with consumers have also served to establish strong relationships, and thus brand loyalty. Another way in which Red Bull has established its unique identity is through the monthly publication of a lifestyle magazine called “Red Bulletin” which outlines

Bachelor of Commerce | Best Business Research Papers Vol. 5
41|
current trends and stories in regards to art, culture, sports, and people (Red Bull, 2011). This is just further evidence that Red Bull has been able to diversify itself from the competition. Lastly, Red Bull has successfully used their consistent slogans, stylish packaging, and logo to establish a strong brand identity that is recognized by people all over the world. In an attempt to put Red Bull’s brand awareness to the test, I asked fifteen female university students and fifteen male university students from the University of Victoria and Johannes Kepler University if they could correctly identify the logo on a standard can of Red Bull, as well as the popular television slogan “Red Bull gives you wings” (Hein, 2001). Of the fifteen males, twelve were able to identify that the logo had two red bulls charging at each other. Only ten of the females were able to do the same. Similarly, all fifteen of the males identified the slogan of the company, while thirteen females could do the same. It is also interesting to note that the Austrian students that were interviewed were able to identify the slogan in both German and English. The survey was conducted over Facebook’s chat function. Though limited in its scope, the results of this survey emphasize that Red Bull’s brand is widely recognizable by its target market.
Weaknesses
With only four permanent product types available, Red Bull puts itself at risk of becoming monotonous and dull to the demanding market. This is especially worrisome to the company because industry competitors have already expanded way beyond the product line of Red Bull. This provides consumers with new and exciting products of which Red Bull has nothing to compete with aside from the original brand. To illustrate, in the same Facebook survey of thirty students, only seven said that Red Bull was their preferred energy drink brand. Monster was the number one selection with fifteen overall votes. Other favourite brands included Amp, Sobe, and Beaver Buzz. A more detailed explanation of this phenomenon will be explained in the industry competition section of Porter’s Five Forces.
Additionally, compared to industry competitors, the price of a can of Red Bull is relatively high. According to an article in Forbes, the drink is over double the price and caffeine content of a can of Coke (Dolan, 2005). With so many available options for consumers, they may be tempted to stray from their brand loyalty to Red Bull and switch to a more reasonably priced and healthier choice. Another shortcoming of Red Bull is that it is not as popular amongst females as it is amongst males. When I asked fifteen females what their favourite energy drink was, only two answered with Red Bull. While no exact statistical data could be found online, in a dialogue with Spanish club promoter Lara Uraga, she informed me that she rarely saw women drinking Red Bull during her shifts (L. Uraga, personal communication, October 2011). Lara speculated that this phenomenon was the result of the nutrition value, and medicinal taste of the product (L. Uraga, personal communication, October 2011).
Opportunities
While Red Bull certainly spends a lot of money on marketing techniques, they could profit from using more conventional methods such as print advertisements and more television ads. It could help to reinforce the image of the brand in the face of rivalry amongst competitors. This is not to say that they should discard their current strategies because they have clearly worked for them, but using more of a mixture of marketing techniques could be beneficial to them in the long run by reinforcing their product. The company could further benefit from catering more towards women, and other health-conscious consumers, by introducing a healthier, perhaps more fruity version of the drink. In addition, other energy drink competitors have introduced a coffee-flavoured variety that Red Bull has not yet established. For instance, their top competitor, Monster Energy, has released a variety of different

Bachelor of Commerce | Best Business Research Papers Vol. 5
|42
flavoured coffee energy drinks that they call Java Monster (Q. Pham, personal communication, October 2011). Moreover, Monster has surpassed them in another category by catering towards health-conscious consumers with a low carbohydrate version of their drink (Q. Pham, personal communication, October 2011). Furthermore, a quick glance at any convenience store would reveal that Monster Energy drinks provide consumers with an array of flavours under various lines of their product. Examples of lines of Monster drinks include Monster Rehab (the standard product), Monster Nitrous (more extreme product), Energy shots, tea, and coffee (Q. Pham, personal communication, October 2011). More generally, Red Bull could increase sales through expansion of their product line. This could include moving their limited edition line to North America where it is currently not available.
Threats
In recent years, Red Bull has faced a lot of negative publicity in regards to health concerns. According to Global Calgary, consumers of Red Bull may be at risk of rising heart rates, increased blood pressure, and even heart disease as a result of the high caffeine content in the drink (2010). As a result, Red Bull has been completely banned in a few countries such as France and Denmark (Kumar et al., 2004). One specific incident occurred when a 15-year-old boy stopped breathing after a paint-ball tournament and later died in hospital from heart failure (Global Calgary, 2010). The boy had been seen drinking Red Bull before the event and rumours were circulating that the drink was the cause of his death (Global Calgary, 2010). Moreover, the World Wide Web has given the young generation easy access to health information regarding the nutritional value and extreme caffeine content of Red Bull. This may cause them to consume the product less frequently, or even boycott it completely. During a Skype conversation, Aurora College student, Samantha Hicks, informed me that she no longer drinks Red Bull because she just became aware of the excessively high caffeine content and associated health risks (S. Hicks, personal communication, October 2011). Red Bull successfully paved the way for an entire industry, despite opposing factors. Since then, many other companies have tried to profit from the great success of Red Bull by copying their original idea. A detailed analysis of the threat of new entrants, as well as existing competition, will be provided with the analysis of Porter’s Five Forces.
FUTURE POSITION OF RED BULL - PORTER’S FIVE FORCES
Porter’s Five Forces is a useful model developed by Michael E. Porter that can help with industry analysis, as well as strategy development for the future of a company. The tool uses the dimensions of threat of new entrants, threat of substitute products, bargaining power of buyers, bargaining power of suppliers, and rivalry amongst competition to determine the attractiveness of a market (Porter, 1996). By evaluating each of these five dimensions, insight will be provided as to how the company’s current position has potential to change in the future. Within each category, I will further explain how the dimension can affect Red Bull specifically.
Threat of New Entrants
When new competition arises, it becomes more challenging for Red Bull to hold onto their majority of the market share. According to Porter, when a new competitor enters a market, they have the power to affect price, cost and rate of investment (Porter, 1996). Red Bull’s wild profitability led to a number of copycat brands trying to piggyback off of their success. To give a frame of reference, in 2000, Red Bull
Bachelor of Commerce | Best Business Research Papers Vol. 5
43|
was faced with twenty-three new competitors in the United Kingdom energy drink market; however, according to the article, Red Bull still held onto the majority of the market despite competition (Kumar et al., 2004). One factor that can decrease the instance of new competition is barriers to entry; however, there is little information available about specific legal barriers to entry in the energy drink industry. That being said, one definite restriction would be the government’s increasing strictness in terms of caffeine levels. According to the Globe and Mail article (2010), studies have shown that caffeine contents of energy drinks such as Red Bull can be detrimental to a person’s health, especially for children. Not only has this resulted in the bans in France and Denmark, but it also raised concern due to the controversy over health risks in the United States, Turkey, Ireland and the Netherlands (Kumar at al., 2004). Moreover, mixing energy drinks with alcohol is a controversial topic and could end up resulting in a ban of Red Bull in nightclubs and bars (Health Canada, 2010). Another mitigation against the threat of new entrants was illustrated by the million dollars that Mateschitz and his partner put into simply founding the company. Similarly, the tremendous amount of capital required to compete on the same level as major industry players is a huge deterrent to new entrants.
Threat of Substitute Products
The risk of a consumers turning to a different product that performs the same function as Red Bull is fairly troublesome. When asked what drink she now prefers after becoming aware of the exact caffeine content in Red Bull, Sam Hicks replied “Gatorade” (S. Hicks, personal communication, October 2011). Due to increasing concerns about caffeine content and health risks, consumers could turn to alternative products such as electrolyte-based energy drinks or regular soft drinks. It is difficult to say how high the risk of this happening is since Red Bull has managed to survive in the face of a number of public criticisms. In general, Red Bull also faces rivalry from other traditional drinks such as milk, water, coffee, tea, cola and juice. That being said, the stated effects of Red Bull have created a particular niche in the market that has helped mitigate against this threat.
Bargaining Power of Buyers
According to Porter, customers with high bargaining power have the ability to manipulate industry by bringing down prices while seeking the best value for their money (1996). In the case of Red Bull, there are many major buyers. The most prominent intermediate buyers include convenience stores, clubs, supermarkets, college/university cafeterias and restaurants (Gschwantner, 2004). Since there are so many buyers, it limits the ability of a particular institute to actually affect the market. In terms of the end-users of Red Bull, they also experience low buying power due to a huge volume of buyers. Therefore, this threat is not high for the industry.
Intensity of Competitive Rivalry
Currently, the intensity of competitive rivalry is probably the most intimidating factor for Red Bull. According to a study shown on Energy Fiend’s website, Red Bull held 42.6% market share in 2006, dropped to 35.2% in 2007, and climbed back up to 40% in 2008 (Energy Fiend, 2010). Fluctuations in market share are largely due to competitors such as Monster who held 14.4% in 2006, climbed to 27.3% in 2007, and declined to 23% in 2008 (Energy Fiend, 2010). This data is evidence that even the pioneer of the energy drink industry is not immune to competition. Moreover, according to their official website, Monster has adopted some of the same techniques as Red Bull by sponsoring extreme sports and using buzz marketing in clubs (2011).

Bachelor of Commerce | Best Business Research Papers Vol. 5
|44
The vast number of industry competitors drives up the amount of money that Red Bull is forced to spend on sponsorships and promotions, thus taking away a large sum of money that the company could have otherwise collected as profits. It is worrisome that the ongoing image contest amongst existing firms could become too expensive and drive companies, such as Red Bull, out of the market. This intensity is further illustrated by the fact that there are currently three hundred varieties and two hundred brands of energy drinks in the United States alone that all claim to fill the same niche as Red Bull (Heckman, Sherry & Gonzalez, 2010).
Bargaining Power of Suppliers
When bargaining power of suppliers is high, they have the ability to capture profits that could otherwise go directly back to the company. According to Porter, they do so by “charging higher prices, limiting quantities or services and shifting costs to industry participants” (Porter, 1996). Luckily for Red Bull, the bargaining power of their suppliers is quite low due to their fairly uncomplicated production process and short supply chain. This means that the suppliers actually rely on Red Bull for a lot of their profits, so they do not really have the ability to capture profit from Red Bull. According to their company website, the production facilities in Austria are the center for both packaging and production of the drink (Red Bull, 2011). This means that the production is not outsourced to another company and it is in complete control of Red Bull. In addition, the website also indicated that the drink is shipped right from the production plant in Austria to over 160 countries (Red Bull, 2011). This means that Red Bull relies on suppliers only for ingredients and packaging requirements. While there is limited information about availability of specific ingredients, the danger of relying on suppliers for aluminum was previously shown when Red Bull lost their number one position to an industry competitor called ‘Flying Horse’ when they could not find enough aluminum to meet production needs (Gschwantner, 2004). That being said, it would be relatively easy for Red Bull to simply change to another form of packaging like plastic or glass bottles if they had to. Overall, it seems that suppliers have little bargaining power over the energy drink industry. This dimension should not have a huge adverse affect on the market and potential for profit.
RECOMMENDATIONS
Based on my analysis of Red Bull’s current position, as well as the industry analysis, I will make some recommendations for strategic decisions that management could make in order to allow the company to continue to prosper in the current economic climate. These recommendations will be a result of my own opinions, insight gained from secondary sources, as well as some personal interviews that have been conducted throughout the course of my analysis.
Expansion of Product Line
During a personal interview with a student at the University of Victoria, Bryce Donnelly, he provided some interesting insight as to how Red Bull can stay afloat in the current competitive climate. To give a bit of context, Bryce is a 23-year old Mechanical Engineering student at the University of Victoria. His extreme academic workload, interest in athletics, and fondness of Victoria clubs make him the ideal target for Red Bull marketers. After recently spending some time in Austria and Germany, Bryce discovered the limited edition line of Red Bull. “It is the best tasting Red Bull that I have ever tried” he said in an interview (B. Donnelly, personal communication, October 2011). Bryce told me that he believes this product would be a huge hit in North America since it tastes quite a bit better than the versions available there and is available in three flavours (B. Donnelly, personal communication, October 2011). In addition to Bryce’s insight, I believe that marketing a better tasting version of the drink could
Bachelor of Commerce | Best Business Research Papers Vol. 5
45|
also capture the attention of more women. Lara S, who previously worked as a nightclub promoter in Spain, informed me that she found that most of the people drinking Red Bull at the Clubs she promoted were male; however, no exact statistical details could be located online (L. Uraga, personal communication, October 2011). While exact figures are not available in English, the amount of times that the Blue Version of the drink has been sold out at convenience stores in Linz is a true indication of its popularity. Knowing that the drink has gone over well in Austria would make Red Bull feel more confident bringing it into the North American market, and even other countries. In addition, Red Bull would also benefit from generally expanding its product line to compete with that of its competitors. If they expanded the limited edition line to a permanent position and brought it into all of their markets, they would cut research and development costs since the recipe has already been formulated and designs have already been created. That being said, the company should invest time and money into formulating a coffee line of the drink since a number of their competitors already possess one as indicated in the weaknesses section of the SWOT analysis.
Mitigation Against Bad Publicity
Without altering the recipe for Red Bull, and thus changing the taste, there is no way to avoid the health hazards that have been explored by the media. To counteract the bad publicity that Red Bull has faced in recent years, the company could greatly benefit from doing some charity work. They could go look beyond athletics and invest some money into a children’s hospital or perhaps a wing dedicated to Heart Disease, just to show that they are sensitive to the issue. Red Bull could also reduce the concerns of health officials by reducing the amount of caffeine in the drink to a more acceptable level. This change could make countries like Denmark and France lift their bans, or at the very least could discourage sceptical countries from creating a ban that would adversely affect profits for Red Bull.
The Fight for Market Share
As indicated by the dimensions of Porter’s Five Forces, Red Bull is also fairly vulnerable to new entrants and existing competition. Currently, Red Bull is in a fairly good position in terms of competition since they are the industry leader. To maintain this spot, they need to use a variety of conventional and non-conventional marketing methods to keep awareness of their brand high. It is difficult for the brand to completely get rid of the threat of substitutes because nobody is going to stop drinking tea or water. The most important thing for the brand is to maintain a niche in the market and keep on investing a lot of profits into its various marketing strategies to keep the company relevant and interesting to the consumers. Overall, Red Bull is currently in a good position for success. By implementing some of the suggestions listed above, I believe that Red Bull would continue to be successful in the long term.
REFERENCES
Boome, A. (2011). How Food Superbrands Manage to Become your Family. http://www.bbc.co.uk/news/business-13598581 Accessed Nov. 8, 2011. Dolan, R. (2005). “The Soda with Buzz.” Forbes. http://www.forbes.com/global/2005/0328/028_print.html (accessed Oct. 12, 2011). Energy Fiend (2010). The 15 Top Energy Drink Brands. http://www.energyfiend.com/the-15-top-energy-drink-brands (accessed Oct. 31, 2011).

Bachelor of Commerce | Best Business Research Papers Vol. 5
|46
Global Calgary (2010). Health Canada to Investigate Energy Drinks. http://www.globaltvcalgary.com/health+canada+to+investigate+energy+drinks/41455/story.html (accessed Oct. 23, 2011). The Globe and Mail (2010), Energy drinks pose serious health risk to kids: Canadian Medical Journal. http://www.theglobeandmail.com/life/health/energy-drinks-pose-serious-health-risk-to-kids-canadian-medical-journal/article1652080/ (accessed Oct. 20, 2011). Gschwandtner, G. (2004). “The Powerful Sales Strategy Behind Red Bull.” Selling Power, pp. 1-11. http://www.redbull.cz/cs/userfiles/file/Read%20full%20article%20-%20Selling%20power.pdf (accessed Oct 12, 2011). Health Canada (2010). Alcoholic Energy Drinks Not Approved for Sale by Health Canada. http://www.hc-sc.gc.ca/ahc-asc/media/ftr-ati/_2010/2010_83-eng.php (accessed Oct. 20, 2011). Heckman, M.A., Sherry, K., & Gonzalez de Mejia, E. (2010). “Energy Drinks: An Assessment of their Market Size, Consumer Demographics, Ingredient Profile, Functionality, and Regulations in the United States.” Comprehensive Reviews in Food Science and Food Safety, 9(3). Hein, K. (2001). “A Bull’s Market: The Marketing of Red Bull Energy Drink.” Brandweek http://findarticles.com/p/articles/mi_m0BDW/is_22_42/ai_75286777/pg_3/?tag=content%3Bcol1 (accessed Oct. 16, 2011). Kumar, N., Linguri, S. & Tavassoli, N. (2004). Red Bull: The Anti-Brand Brand, London Business School. McCole, P. (2004). “Refocusing Marketing to Reflect Practice: The Changing Role of Marketing for Business.” Marketing Intelligence & Planning, 22(5), pp. 531-539. Monster Energy Drink (2011). Sports. http://www.monsterenergy.com/at/de/sports/ (accessed Oct. 17, 2011). Porter, M. (1996). “The Five Competitive Forces that Shape Strategy.” Harvard Business Review, pp. 23-41. http://www.mktgsensei.com/AMAE/Strategy/HBR%20on%20Strategy.pdf#page=25 (accessed Oct. 31, 2011). Red Bull (2011). Official Website. http://www.redbull.com/ (accessed October 20, 2011). Rodgers, A.L. (2001). It’s a (Red) Bull Market After All. http://www.fastcompany.com/articles/2001/10/redbull.html (accessed Oct. 19, 2011). Roenigk, A. (2009). “Rare Air: Reggie Bush and Red Bull.” ESPN Sports. http://sports.espn.go.com/espnmag/story?id=3873150 (accessed Oct. 19, 2011). Vanhoof, K. & Houben, G. (1999). “A Knowledge-Based SWOT-Analysis System as an Instrument for Strategic Planning in Small and Medium Sized Enterprises.” Decision Support Systems, 26(2), pp. 125-135.

Bachelor of Commerce | Best Business Research Papers Vol. 5
47|
Climate Change and the Spanish Wine Industry: What Can Wine Companies and Government do to Protect Spanish Wine? Brendan Harris Fall 2011 ABSTRACT
In the midst of an economic crisis and accelerating climate change, vineyards – the growers of Spain’s most fragile agricultural product and the heart of the nation’s wine industry – are extremely vulnerable. While studies have suggested that wine makers find drops in sales to be the most urgent problem they face, issues brought by climate change will nevertheless present obstacles in the future. The industry therefore, is divided in its attitude towards global warming and while some viticulturists prepare for the potential weather changes, others make different use of their resources. This essay looks at the Spanish wine industry in its entirety and estimates the severity of climate change’s impact on its vineyards. Upon reaching an understanding of how global warming will affect Spain’s grape growing regions, this paper will undergo an analysis of the various coping mechanisms to decide what can be done to prepare the vineyards for climate changes in the future. Among these coping mechanisms are technological changes and agricultural methods of adaptation within the vineyards themselves, as well as government action that can make these changes more feasible. Ultimately, this paper will outline recommendations for the viticulturist and the industry regulator wherein they will be able to maintain the reputation of good quality Spanish wine and thus exports – despite disruptions from climate change.
INTRODUCTION
To begin with, it is important to appreciate that this agricultural sector is extremely fragile and responsive to change. Variables in the process of wine production and grape growing are numerous and specific, a fact that challenges studies in understanding the implications of climate change. Regional differences and growing techniques will often yield varying results in surveys and studies. Even adjacent vineyards can produce completely different tastes and yields based on soil composition, vineyard orientation, shading or variety of grape. The “effects on wine production” section will look further into this phenomenon. Such variation among vineyards is the reason why it is necessary that this research paper perform a macro analysis of the industry as a whole; any assessment of a single vineyard would be of misplaced bias and unfit to represent an arena of competition that is based on vintage differentiation. In order to determine the best response to climate change in the Spanish wine industry, it is imperative that the policies by which the industry functions are understood. Spanish wine is subject to rigorous regulation and is closely monitored by the government who wishes to gain control supply and demand. There is also an ongoing shift in the internationalization of the wine industry with demands changing from continental Europe to Asia and the Americas. While Spain deals with climate issues, it must also address the competition it faces from the up and coming vine cultures of the ‘new world’; this papers concluding recommendations are in respect to current industry and economic conditions. After discussing the characteristics of the Spanish wine industry, this paper will contemplate the variation of climate change forecasts for Spain. Temperature and rainfall trends from the past fifty years can give an
Bachelor of Commerce | Best Business Research Papers Vol. 5
|48
idea of the direction that Spanish climate is heading in. However, there also exist projections that differ from recent trends and place an increased importance on spreading desertification. This paper will analyse these forecasts to determine the real impact on grape growing in Spain. These first two sections of the research paper - the state of the industry and climate trends and projections - will provide a framework for the analyses of how Spain must prepare for the coming challenges. The sections that follow will determine reactions and solutions. This will be done by incorporating evidence from around the world regarding how climate changes have already affected vineyards. This includes the change in a grapes alcohol content and acidity and thus taste- as well as overall yield, due to temperature increases in the past 50 years. That being said, it must be acknowledged that some changes have had positive impacts in certain regions. In those regions that have suffered negative effects however, and in those innovative vineyards that anticipate the change, this paper seeks to understand their methods of adaptation. In this way the essay will outline possible coping methods and pro-active forms of adjusting to climate change. While this involves actions taken by the vineyards themselves, the last section of the paper will consider the possible actions of the Spanish government. Here it will become clear that certain regulatory policies restrict Spanish vineyards, while there are also aspects of Spanish agriculture that the government neglects and must reform.
STATE OF THE INDUSTRY
The Spanish wine industry is governed by multiple levels of jurisdiction. While Spanish vineyards find themselves subject to national regulations, some policies are shared by other wine producing nations in the EU such as France and Italy. These regulatory bodies shape the level of Spain’s international competitiveness as global consumption patterns and production patterns rapidly change. Three forces that govern the value and quantity of Spanish wine exports are regulatory control, the market conditions and competitors.
Regulatory Control
The context of the European wine industry exists within in the frameworks of the Common Market Organization (CMO) for wine. This organization is responsible for coordinating supply from European wine producers, as well as increasing the competitiveness of European wines on the global market. In preventing over-supply, the CMO enforces a prohibition on the planting of new vines, as well as restricts vineyards to designated regions (Montaigne, 2010). Another aspect of the reduction in grape harvest is a CMO led project to remove 175,000 hectares (5% of the European total) of European vineyards, replacing them instead with other suitable crops. This European attitude towards limiting production is particularly relevant to Spain because of the nation’s comparative grape growing area (see Table 1 of Appendix). Spain has nearly a third of total European winegrape acreage and constitutes the largest wine growing region in the world. Consequently, just over half of the EUs budget for winegrape acreage reduction is dedicated to Spain (see Table 3 of Appendix), which is used to provide viticulturists with monetary incentives to pull their vines. It should be noted however, that the distribution of this budget is a nationalized decision. Because of the low value of these one-time monetary incentives, they are specifically targeted towards low yielding vineyards, of which there are many in Spain (Montaigne, 2010). Despite being the world’s largest producer in terms of acreage, Spain is only the third largest producer in the world after France and Italy in terms of total litres produced suggesting a lack in productivity. The grape-growing regulations imposed on Spain by the CMO are of great importance in the sense that they can restrict vineyard manoeuvrability in response to climate changes. They will also affect agricultural decisions such as irrigation modernization, by aiming to maintain low productivity for supply reasons. While reduced rainfall and increasing temperatures make designated regions less

Bachelor of Commerce | Best Business Research Papers Vol. 5
49|
suitable for vintage wines, CMO policy encroaches on the bureaucratic level and can prevent what might be the best form of adaptation; relocation.
Market Conditions
While Spanish wine makers face a quick-changing climate, they are confronted with a faster changing global wine market. European wine consumption has decreased in recent decades with domestic wine per capita consumption falling 37% in Spain between 1989 and 2004. When this is coupled with the strong supply coming from southern European vineyards, the result is saturated domestic demand (Bardaji and Mili, 2009). On another note the emergence of foreign markets and the increases in disposable income that are associated with it has resulted in increased consumption outside of Europe. China, Southeast Asia and Eastern Europe are now leading in expected consumption growth. Ultimately, total global consumption increased by 9% percent between 2000 and 2008 according to the International Organization of Vine and Wine (OIV). A benefit to Spain, which excels in the production of “popular premium” and “super-premium” wines (sherry for example), is the trend in foreign markets’ perception towards wine and alcohol in general. As Bardaji & Mili (2009) note, “Wine increasingly will be considered in foreign markets as a quality product whose moderate consumption could be beneficial for health”, while “anti-alcoholic campaigns could increase” (Bardaji & Mili, 2009). This expectation suggests a transition from lower quality to higher quality alcoholic beverages such as wine. Among the results of the study by Berdaji & Mili (2009) on wine consumption trends, the general expectation was that foreign markets will demand more quality differentiated wines at average prices, as well as better differentiated styles of packaging and design. This consumer desire for differentiated packaging styles is incongruous with the mandatory labelling requirements imposed on wine producers in Spain, and highlights the need for the country to relax such regulations. As far as the international market for wine is concerned however, the largest areas of opportunity now lie outside of Europe in nations that have not yet been fully exposed to European wines. Despite the decrease in European consumption, Spanish wine exports have been increasing steadily to the extent that they have converged with Italian and French export levels (see Table 2 in Appendix).
Competitors
Though the decrease in European wine consumption is putting stress on Spanish wine producers, the particularly damaging ‘second blow’ is the surge of imported wines from outside the continent. Argentina, Chile, the United States, South Africa and Australia have recently become formidable competitors, and whose quality wines have resulted in decreased public support for European brands in Europe (Bardaji & Mili, 2009). Traditionally, European brands have used territory as a base for product differentiation, as many quality wines are recognized specifically by their region of origin. It is in this manner that the industry has a decentralized control over production resulting in higher barriers to international distribution; Spain’s top 5 companies for example, control only 10% of production. New world companies on the other hand have more centralized control with the top five companies in the United States controlling 73% of its production and the top five in Australia controlling 68%. New world companies further differentiate themselves from European producers by making more homogenous brands (marketing wine by grape variety for example) and by using high business concentration to their advantage for international marketing (Bardaji and Mili, 2009). Although European brands maintain the lead in international wine sales, the centrally organized structure of the new world wine companies and their innovative growing techniques have resulted in what Bardaji & Mili (2009) deem a “competitive crisis” for European wine producers.
Bachelor of Commerce | Best Business Research Papers Vol. 5
|50
The pressures on the Spanish wine industry are substantial when considering the strains of regulation, global supply and demand and increasing competition. The external forces that impact the industry’s export levels can be best summarized by the business environment diagram in Table 4 of the Appendix.
CLIMATE TRENDS & PROJECTIONS
Jones, White, Cooper and Storchmann (2005) note that: “While individual weather and climate factors can affect grape growth and wine quality (e.g., solar radiation, heat accumulation, temperature extremes and precipitation) growing season lengths and temperatures are critical aspects because of their major influence on the ability to ripen grapes to optimum levels.” (Jones et al., 2005).
The direct impacts of climate change that most concern the grape growing regions of Spain are increasing temperatures and projected reductions of rainfall. In tandem these issues are causing “desertification” in several regions of the country. The severity of global warming’s impact on wines will vary between grape varieties and regions in Spain. Agriculture in the southeast for example, is at higher risk of desertification than the north, while the centre of the Iberian Peninsula is expected to face the greater temperature increases. This section will review the various evidences that forecast the overall effect of climate change in Spain in respect to temperature, and rainfall and water security.
Temperature
As the Spanish grape harvesting season typically takes place in August, it is the changes in summer temperatures that are most relevant to the industry. In fact, temperature increases in the past 50 years have not been equal in winter and summer seasons. According to the Instituto Technológico Agrario of Spain (the Agrarian Technological Institute), temperatures are increasing at a trend of 0.4°C per decade during the winter and 0.6-0.7°C in the summer. This trend is supported by the findings of climate change researchers Schar & Jendritzky (2004), who warn that the average temperature of Spain’s central regions could increase by 5°C over the next 100 years (see Table 5 of Appendix). In fact, in the past 50 years temperatures have increased an average of 2°C resulting in grape harvesting as much as one month earlier (Wood, 2008; Alonso & O’Neill, 2011). As would be expected, longer term predictions come with greater variability in results. The higher estimate of temperature change comes from Jose Manuel Moreno, a professor of climatology at the University of Castilla La Mancha who has estimated an increase 7°C by the end of the century (Mulier, 2006). Summer temperatures are also subject to increasing intensity and frequency of heat waves (Iglesias, 2009). Despite this slight variability in projections the majority are consistent, and the point remains that temperatures in Spain are on the rise and that global warming is expected to affect average temperatures severely. While the temperature itself will have a direct impact on the composition of Spanish grapes, it is also inextricably linked to the amount of UV radiation, to water resource availability and ultimately desertification.
Rainfall and Water Security
The projections of annual rainfall are by no means positive for Spain in the next century. When observing rainfall levels from 1960-1990, the projections of 2050 levels show as much as a 40% decrease in precipitation in southern Spain, with a slight increase in rainfall in the north (Iglesias, 2009). The UN has also released its own projections that report a total national reduction of 40% by 2070 (Almendral, 2009). Predictions by the Agrarian Technological Institute can be seen in the Appendix in Table 7 and show similar estimates. Ana Iglesias (2009), an agricultural economist at the Universidad Politécnica de Madrid states that the reductions in precipitation rates are “the most important factor in determining

Bachelor of Commerce | Best Business Research Papers Vol. 5
51|
the likely impacts on the Mediterranean region”. These changes will also increase the variability in extreme weather patterns including droughts, which will ultimately lead to higher demand and competition for water resources (Iglesias, 2009). The threat of reduced water resources however, go beyond reductions in precipitation. Much of Spain’s fresh water comes from the glaciers of the Pyrenees which according to the Spanish Environmental Ministry have seen 90% of their mass disappear in the last 100 years. At that rate the glaciers could be gone within the next 10 to 20 years (Tremlett, 2009). This will prove especially problematic for the vineyards of the northeast at the foothills of the Pyrenees, whose water reserves are fed by those glaciers (see Table 6 in Appendix). Among these regions are La Rioja and the Penedés, which are the densest and highest producing regions in Spain (Alonso & O’Neill, 2011). The combination of higher temperatures, loss of glacier mass and reduced precipitation ultimately makes “Spanish water delivery systems…increasingly unstable and vulnerable” (Iglesias, 2009). This belief is backed up by the projections that Spanish watersheds will reduce flow by 40% in the next 100 years (Iglesias, 2009). Table 8 of the Appendix shows the forecasted disparities between supply and demand of water in the various regions. As Spanish aquifers continue to dry up and annual rainfall decreases, the risk of desertification intensifies (Almendral, 2009). This process has been further accelerated by increased demand for fresh water in arid coastal tourist destinations that see high prevalence of pools and golf courses (Almendral, 2009). Additionally, increasing temperatures can further aggravate the symptoms of desertification by accelerating evaporation and decreasing soil moisture (Iglesias, 2009). A drought in 2007 resulted in the depletion of a major reservoir outside of Barcelona, while another in 2008 nearly saw the loss of a reservoir in Saint Llorenç de Morunys (Almendral, 2009). The Spanish Environmental Ministry proposes that one third of Spain is currently at risk of desertification. These forecasts speak to all of Spanish agriculture, but especially to the wine industry that has only 25.2% coverage in irrigation systems (Bardaji & Mili, 2009; Alonso & O’Neill, 2011).
EFFECTS ON WINE PRODUCTION
The processes behind grape growing and wine making are extremely particular and dependant on the type of flavour and aroma a wine maker is trying to achieve. Especially in Southern Europe where wine companies rely heavily on vintage quality and product differentiation, specific levels of sugar, acidity and flavour need to be achieved to realize a given style. To reach these desired levels, viticulturists conduct various methods of growing techniques such as pruning vine leaves to adjust the amount of direct sunlight on grape bunches. Others will tamper with nitrogen levels by reducing or increasing fertilization (Somers & Quirk, 2008). Despite wine makers’ attempts to control chemical content at ripening however, many ‘optimum ripening levels’ are only possible in very narrow geographic regions with specific micro-climates; hence the popular recognition of quality wines by location (Jones et al., 2005). The fragility of wine quality can be fully appreciated in the findings of Jones et al. (2005), who went so far as to suggest that flavours of a vintage brand can be altered by changes in carbon dioxide an oak tree absorbs when the vintage is cured in barrels made from its wood. The level of intensity of the effects of global warming can result in differing chemical compositions in grapes and vines. For example, changes in skin color and accumulated sugars are an indicator of warmer temperatures whereas extreme highs in temperatures can impede sugar accumulation. Concurrently, while direct sun is often associated with more concentrated “fruitier” flavours, excessive UV radiation has been reported to cause leaf burn and smaller berry size (Somers & Quirk, 2008). Such effects are numerous and highly particular. This research paper however, will be placing an emphasis on the overarching impacts of global warming on tastes and yields as they relate to the economy of the Spanish wine industry.
Bachelor of Commerce | Best Business Research Papers Vol. 5
|52
Effects on Flavour
The most obvious effect of higher temperatures on grapes is early ripening, and thus an advanced harvest season. This entails an alteration of sugar and acidity concentrations within the grape and ultimately a change in flavour. Earlier ripening can also result in harvests before seeds and skins (which are largely responsible for flavour) are fully developed (Faris, 2011). However, studies by Jones et al, (2005) and Alonso & O’Neill (2011) have agreed that not every variety’s flavours will be negatively impacted by rises in temperatures and that in fact, some will experience positive changes. While cooler climates in northern Spain may find that more varieties of grapes become viable for ripening as a result of higher temperatures (such as a new ability to grow Mediterranean grapes), they may also benefit in yields of more “consistent vintage quality” on existing varieties (Jones et al., 2005). This was expressed most convincingly in “Climate Change and Global Wine Quality”, in which Jones et al, (2005) compared the vintage ratings of wines from around the world with the average temperatures of the season in which they were grown. The results showed a strong correlation between the two and also that “vintage quality wines (that) were obtained in the world’s highest quality wine-producing regions…incidentally had experienced growing season warming trends” (Jones et al., 2005). A wine maker surveyed by Alonso and O’Neill (2011) was not unique when he reported that “The drought situation in previous years has reduced volume of production but has increased the quality of the grapes”. As it turned out in the studies, many of the climates were previously too cold for the type of grape being grown there (Faris, 2011). Of those surveyed by Alonso & O’Neill (2011), 17% had noticed positive effects of climate change whereas only 6.4% had noticed negative effects. These results support the notion that changes are highly variable depending on region. They also suggest that further research and education is needed in terms of correlating climate change with its symptoms. These positive results are largely dependent on the variety of grape being grown, and what its optimal ripening conditions are. Varieties whose tastes were improved by upward temperature trends were clearly not at their optimal period before the increases. Jones et al (2005) stipulates that most Mediterranean vintages that are known for their regions micro-climate are already at their optimum ripening conditions. These better recognized wines are Spain’s “high quality” brands, which are also the most valuable in the sector. Should these “ideal” conditions change, “grapevines can have more rapid phonological development that results in loss of acidity and….unbalanced or ‘flabby’ wines” (Jones et al., 2005). A plant that receives too little water for example will experience higher stress levels and thus lower concentrations of flavours in the grape (Alonso and O’Neill, 2011). Effects like these could be devastating for high quality brands that are well established in their micro-climate. It should be noted that in Jones’ study, the observed vintage ratings increased in conjunction with an average 1.7 degree Celsius rise, while the global warming forecasts predict much more severe temperature changes in the next 50 years. At some point temperature increases will become a matter of yield rather than taste, as it “may become too warm to produce high quality wines of any kind” (Jones et al., 2005). According to projections, this is most likely to occur in the center and south of Spain in regions such as La Mancha, Alicante and Valencia (see Table 6 in Appendix).
Effects on Yield
Global warming can both explicitly and implicitly affect yield quantity. Directly, over-heating of the vineyard areas and reductions in precipitation has reduced volume by moving forward the harvest date (Alonso & O’Neill, 2011). In Australia, Somers and Quirk (2008) found that extended high temperatures and drought caused a 20-50% decrease in overall yields. An increased sense of danger has been applied
Bachelor of Commerce | Best Business Research Papers Vol. 5
53|
to vineyards that are on steep slopes (Schultz, 2010). These vineyards are more susceptible to drought and soil erosion causing further decreases in volume (Alonso & O’Neill, 2011). Intense heat waves can cause “cracked berries”, exposing grapes to diseases that ultimately make a portion of the crop unsuitable for harvest (Schultz, 2010). This is an example of an implicit reduction to yields. Milder winters can also make vines more susceptible to diseases, and vulnerable to pests and infestations (Jones et al., 2009; Alonso & O’Neill, 2011). This was already the case in the region of Sardinia that faced damaging pest increases due to a milder off-season in 2003 (Alonso & O’Neill, 2011). Grape growing regions in the center and south of Spain will find that they face the most severe symptoms of climate change and are most likely to suffer impacts that extend beyond variations in wine tastes, and slight reductions in yield. There are legitimate concerns that some of Spain’s best vintages will be ruined. Alonso & O’Neill (2011) warn that “Spain’s wine regions are particularly vulnerable to global warming. Moreover, Spain could be one of the first wine growing areas in the world where grape growing becomes unviable”.
COPING MECHANISMS
In responding to changes in climate, vineyards have reacted both pro-actively and apathetically. Alonso and O’Neill (2011) noticed during their study of vineyards in Spain’s three densest regions that only 41.5% of those surveyed reported noticeable changes to production as a result of global warming. Furthermore, only 6.5% of respondents considered the effects of climate change to be a “main challenge” that they face. Drops in sales on the other hand received a 64.9% response rate (Alonso & O’Neill, 2011). When this standpoint is compared to the financial solvency of the companies that are being pro-active, it is clear that only the most successful wine makers can afford the costs associated with adaptation. A handful of wine companies have reacted to projections by installing “green” technology such as solar panel electrical systems to reduce their own carbon footprint (Roberts, 2009). While these actions attempt to get at the root of global warming, this research paper will concern itself primarily with direct coping techniques that are about survival and not responsibility. Those that have taken initiative to protect their vines have undertaken short term solutions, varietal and regional adjustments as well as more comprehensive research.
Short Term Adaptation
Direct activities that can reduce the effect of drought and increased temperatures are just as numerous as the symptoms. The most obvious change to production practices according to the study by Alonso & O’Neill (2011) is early ripening which necessitates logistical changes within the company. Viticulturists can also alter their levels and styles of pruning, conduct soil moisture retention techniques, apply canopies for shading purposes and adjust fertilizer application (Somers & Quirk, 2008). Most of these activities are normal agricultural practice however, and represent only moderate adjustments to changing weather patterns. Bolder techniques for adjusting to sun exposure and temperature are displayed when vineyards rotate the orientation of the vines so that they receive a differing amount of shade. In a method that can protect vines from both excessive UV radiation and temperatures, some vineyards are conducting reforestation projects around their vineyards that provide natural shade, carbon dioxide absorption, and a moderate cooling affect (Alonso & O’Neill, 2011; Wood, 2011; Somers & Quirk, 2008). Gramona Vineyards near Barcelona makes sparkling wine which is especially sensitive to heat. To protect fresh harvests from unusually high temperatures, Gramona has begun to harvest it’s grapes at night (Wood, 2008). These forms of adaptation are mostly in response to effects that threaten the taste of wine, rather than the yield. Although they will help vineyards adjust to slight changes in growing conditions, they will be

Bachelor of Commerce | Best Business Research Papers Vol. 5
|54
insufficient when more severe increases in temperature and extreme levels of drought make yield and survival of greater consequence. To respond to these demands, vineyards must undertake long term adjustments.
Grape Variety and Regional Shifts
A form of long term adjustment that is occurring throughout European vineyards is the experimental use of different varieties of grapes. Cooler regions are taking advantage of temperature changes and are starting to plant grapes such as Chardonnay and Pinot Noir that were traditionally grown in relatively warmer regions (Roberts, 2008). Vineyards that existed in micro climates ideal for pinot noir in turn are swapping their vines for the more heat resistant zinfandel (Faris, 2011). Of those vineyards that were surveyed in Alonso & O’Neill’s (2011) study, 8.5% were experimenting with grape varieties that are more resistant to heat. Particularly innovate was the creation of a strain called ‘ruby cabernet’ – a cross between cabernet sauvignon flavours and carignan heat resistance that was developed in California (Faris, 2011). Spanish wine maker Miguel Torres, owner of the Bodegas Torres Wine Company, has operations in multiple regions of Spain and is among top national wine exporters. Torres is expecting the relocation of his Merlot vines to northern areas at higher altitude (Wood, 2008). He has also taken precautions a step further and begun to purchase land in the cooler regions of the Pyrenees with the intention of using them for vineyards in the future (Faris, 2011). By these actions, he is using property in cooler regions as a hedge against his ‘bets’ on climate change. With sales of over 42 million bottles per year, the Bodegas Torres wine company is one of the few wine companies in Spain that can dedicate a budget of this kind towards adaptation to climate change, which also includes five million Euros towards offsetting company emissions (Faris, 2011). Similar regional shifts are occurring in other wine growing nations that look to be impacted by climate change, specifically Australia (Alonso & O’Neill, 2011). Jones et al. (2005) similarly noted that “Spatial modeling research has indicated potential geographical shifts and/or expansion of viticulture regions with parts of southern Europe becoming too hot to produce high quality wines and northern regions becoming viable once again”. Ultimately, this suggests that the regional landscape for wine growing in Spain (see Table 6 of Appendix) could experience a substantial shift in size, productivity levels, density and flavour through the century. These changes represent the most natural form of adaptation to climate change. To assist wine makers with these changes which can be economically traumatic, better research and policy changes are necessary.
Research and Education
In another precaution to global warming, Bodegas Torres monitors two climate controlled greenhouses to test projected weather patterns on new varieties of grapes:
“In one (greenhouse), temperatures are kept at the historic average. In the other, the air is made an average 3 degrees C hotter…half of the vines in each greenhouse are given half the usual amount of water to simulate the drop in rainfall that is expected to hit the region.” (Faris, 2011).
This kind of research and development is imperative for the future of Spanish wines. Jones et al. (2005) concluded their study by suggesting that “focused research is needed in…climate simulations more appropriate for assessing microclimates critical for grape growing”. Such research will lessen the trauma experienced by vineyards in the future by better preparing them for the changes. A viticulturist in Alsonso and O’Neill’s (2011) study commented that “From our side we have not adopted any change in the way we grow the vineyards. We have, however, noted certain changes with regard to pests, but we cannot conclude that such phenomenon is related to climate change”. This common scenario highlights the need for more scrupulous monitoring of Spanish vineyards to find the

Bachelor of Commerce | Best Business Research Papers Vol. 5
55|
correlation between their health and reduced precipitation or increased temperatures. Clearly, recognizing the symptom is different from diagnosing the cause. Gramona Vineyards north of Barcelona has installed an entire weather station in one of their vineyards that connects to the vines via a series of cables. This monitoring system can then read the sugar and acidity levels and directly correlates them to changes in climate (Wood, 2008). The two types of research privately undertaken by Gramona and Bodegas Torres are providing valuable information to vineyards in Spain. Their forms of study emphasize how little is really known about the effects of climate change, and also that more scrupulous research is needed. As Alonso and O’Neill (2011) noticed, a substantial class of global warming “non-believers” existed in their survey. Together, stronger education and research will increase preparedness of vineyard collectives. Alonso and O’Neill (2011) summarized their study in saying “the research community needs to double up efforts and closely monitor the effects of climate change on vineyards”. Furthermore, “those who refuse to accept scientific fact or are sceptical about the real effects of climate change refuse to alter their operations. Whether this is as a result of obstinacy or fear of change, the need for education at all levels is clearly a factor”. The Spanish case is well compared to the Australian case, as Australian vineyards are facing severe effects of global warming as well. However, the relatively new industry in Australia is not as “traditionally entrenched” as that in Spain (Schultz et al., 2010). Research, information and training is readily available to vineyards in the form of the Australian “Grapevine Management Guide” (2008) that uses a collective staff of over 70 experts from throughout the industry. Spain would do well to have an equivalent organization that provides science based vineyard outreach.
GOVERNMENT INOLVEMENT
As seen in the previous sections, only companies such as Gramona and Bodegas Torres have the means to be proactive in response to climate change or to conduct expensive research. With the drop in sales suffered by 64.9% of vineyards surveyed in the study by Alonso and O’Neill (2011), it is clear that the investments required for new viticulture techniques, research and varietal experimentation are too costly for the majority vineyards. Additionally, vineyards in Spain must work under conditions set by EU policies that aim to reduce production and limit the planting of new vines in designated regions. These policies may be prohibitive to movements that are beneficial to an independent vineyard. It becomes clear that for the Spanish wine industry to cope with costs of change, they will need some form of government intervention. This section outlines two fundamental ways that the CMO and Spanish government can assist vineyards in adapting to climate change. The first method discusses protecting vineyards from reduced precipitation by strengthening irrigational infrastructure. The other addresses potential changes in regulation and policy that will help vineyards to adapt.
Irrigation Systems
While vineyards may be able to change varieties of grapes or shade their vines to protect themselves from increased temperatures, very little can be done to protect themselves from the projected 40% decrease in precipitation by 2070. Spanish vineyards are especially exposed to this change as only 25.2% of their total surface is currently irrigated. In the absence of rain only an irrigated system can deliver water to the vines and therefore a more widespread and strengthened irrigation system will be needed. Alonso and O’Neill (2011) recognize that “with the increasing pressures due to population growth and depletion of key natural resources, efficient use of water might be critical in slowing the effects of climate change”. To really address the problem of water security, the current irrigation system which is riddled with inefficiencies must be updated entirely. Greenpeace claims that lack of maintenance and out-dated systems result in 18.5% of water being lost due to leaks (Almendral, 2009). Additionally, 45%

Bachelor of Commerce | Best Business Research Papers Vol. 5
|56
of total water extraction in Spain is attributed to illegal wells which are estimated to be over half a million nation-wide (Almendral, 2009). The Spanish government would be well off to strengthen its irrigational infrastructure; however such an investment cost is unimaginable in the current wake of the Euro-zone crisis and widespread economic austerity. Were the European Union to adopt a more Keynesian approach to the situation, irrigation investment would be of great value to the underproductive Spanish agricultural sector. Iglesias (2009) summarized her study by stating that improved land use and water management were essential to the well-being of the Spanish agriculture sector. Updating the current system will lead to more efficient use of the scarce water there is, while also providing agriculture with water during times of drought. Eva Fernandez, an economics Professor at the University of Carlos III de Madrid, specializes in the field of agriculture and the Spanish wine industry. In response to the possibility of the Spanish government installing an improved irrigation system she notes:
The problem with strengthening irrigation systems across the board is that it would increase yields and production, which goes against the main European Union and CMO policies that want to cut down the supply. So I think it is unlikely that they would finance an operation like this. The wine sector is divided into two main subsets. You have high quality wines and low quality wines. The European Union is trying to keep the low quality wine sector in a state of low productivity because especially in Italy and Spain that sector is bloated, so they want to control the production and force prices up. But in southern Spain, if the sherry industry has problems with lack of water the government will do what it can to protect them because they are an important and highly recognized sector in Spain. (Personal Interview, November 10th, 2011)
Clearly, the Spanish government runs on separate policies that favour quality Spanish wines over lower quality ‘table wines’. While the industry benefits from low productivity among poor quality wine producers, it is important to protect the highest quality wines that are the only sector experiencing increased sales in Europe (Bardaji & Mili, 2009). Therefore, to maintain supply levels and to assist highest quality wines adapt to climate change, the Spanish government should prioritize regions for updating irrigational systems. Meanwhile, they may find that their mandate to reduce yields in Spain is in fact being helped by climate change.
CMO Policy
As was suggested in the ‘coping mechanisms’ section of this paper, Spain should expect a substantial movement in the prominence of “quality” grape growing regions. It is likely that the country will see a movement of grape growing from southern based vineyards to more northern based vineyards, as well as expanded viticulture on the Pyrenees as new regions become viable. To allow for wine companies to relocate, the CMO prohibition on new plantations that is set to expire near the end of 2015 will inevitably have to be modified. It should be noted that major geographical changes in terms of the vineyard landscape may take decades, offering the CMO plenty of time before they are forced to amend the policy. When the time comes, it is possible that prohibition to reduce yields will no longer be necessary. However, for the sake of high quality grapes and their survival it would also be appropriate if limited planting be permitted today. Planting in new regions can be helpful for research purposes and varietal experimentation, and will ease transitions in the future. In addition to the amendments on prohibition of planting, Spain must consider what it does with its vine removal budget of 252 m Euros, provided by the CMO. As seen in the coping mechanism section, vineyards are in need of financing and subsidies for the sake of research, education, agricultural changes
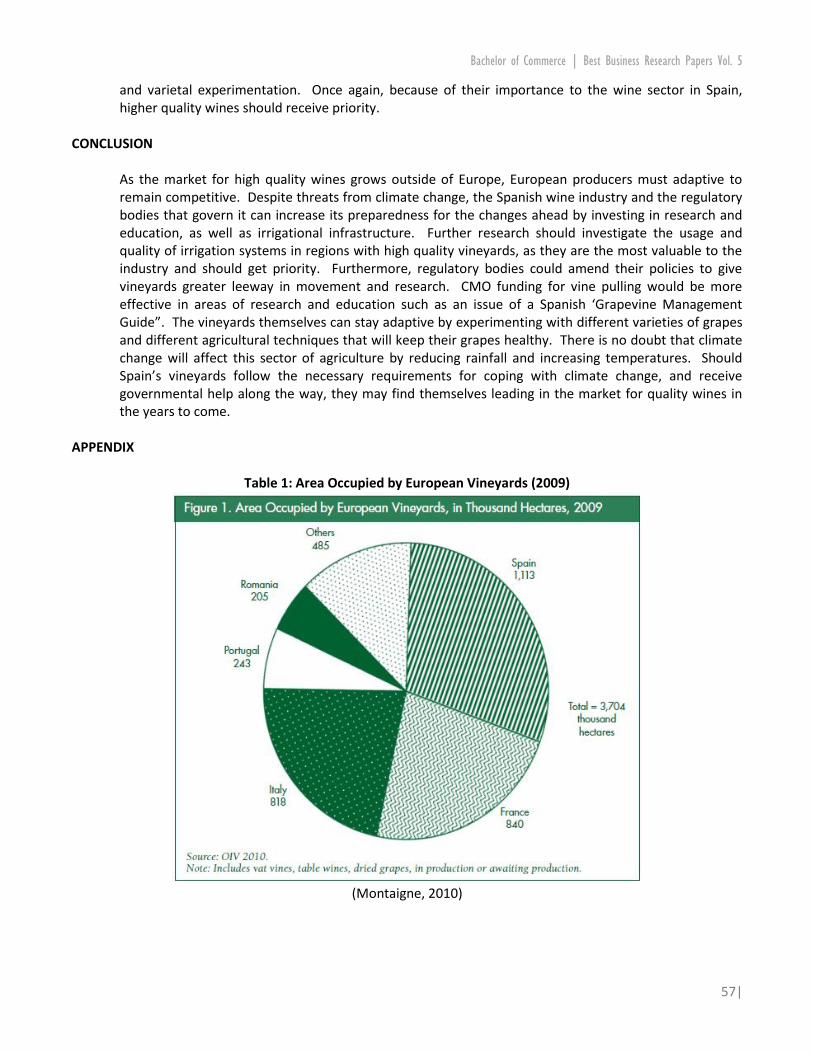
Bachelor of Commerce | Best Business Research Papers Vol. 5
57|
and varietal experimentation. Once again, because of their importance to the wine sector in Spain, higher quality wines should receive priority.
CONCLUSION
As the market for high quality wines grows outside of Europe, European producers must adaptive to remain competitive. Despite threats from climate change, the Spanish wine industry and the regulatory bodies that govern it can increase its preparedness for the changes ahead by investing in research and education, as well as irrigational infrastructure. Further research should investigate the usage and quality of irrigation systems in regions with high quality vineyards, as they are the most valuable to the industry and should get priority. Furthermore, regulatory bodies could amend their policies to give vineyards greater leeway in movement and research. CMO funding for vine pulling would be more effective in areas of research and education such as an issue of a Spanish ‘Grapevine Management Guide”. The vineyards themselves can stay adaptive by experimenting with different varieties of grapes and different agricultural techniques that will keep their grapes healthy. There is no doubt that climate change will affect this sector of agriculture by reducing rainfall and increasing temperatures. Should Spain’s vineyards follow the necessary requirements for coping with climate change, and receive governmental help along the way, they may find themselves leading in the market for quality wines in the years to come.
APPENDIX
Table 1: Area Occupied by European Vineyards (2009)
(Montaigne, 2010)
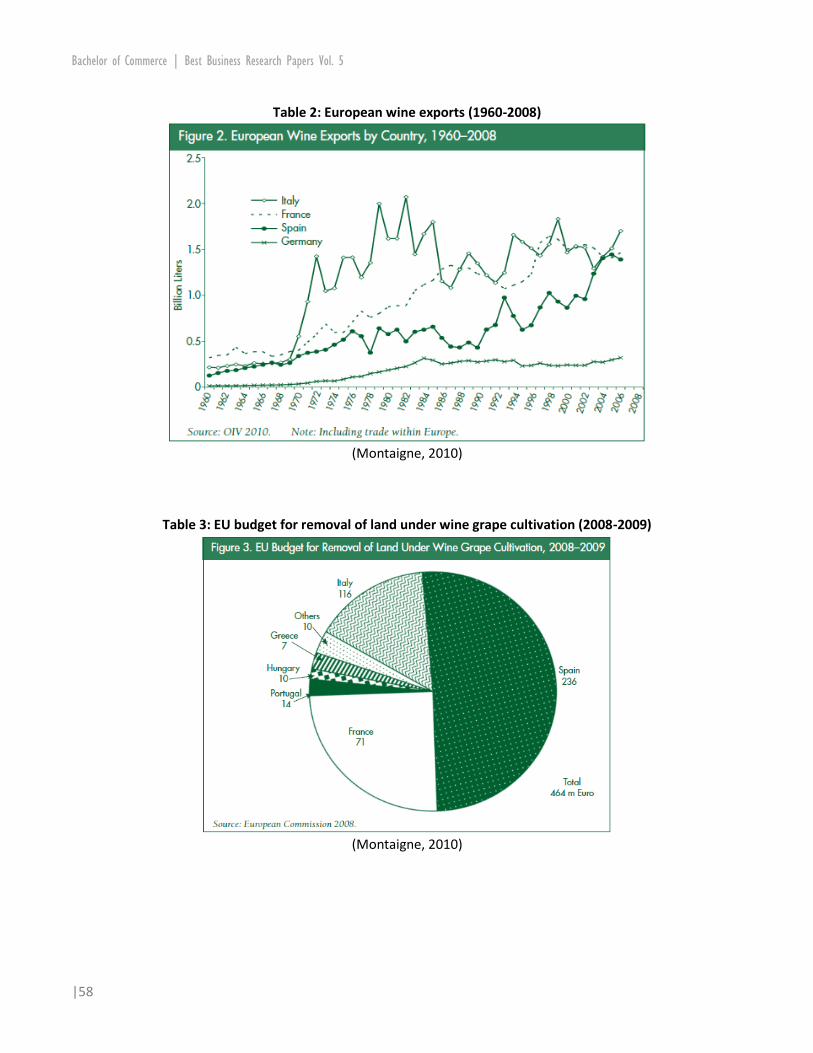
Bachelor of Commerce | Best Business Research Papers Vol. 5
|58
Table 2: European wine exports (1960-2008)
(Montaigne, 2010)
Table 3: EU budget for removal of land under wine grape cultivation (2008-2009)
(Montaigne, 2010)

Bachelor of Commerce | Best Business Research Papers Vol. 5
59|
Table 4: External forces affecting wine exports
(Bardaji and Miri, 2009)
Table 5: Predicted temperature increases in degrees Celsius (2100)
(Schar and Jendritzky, 2004)
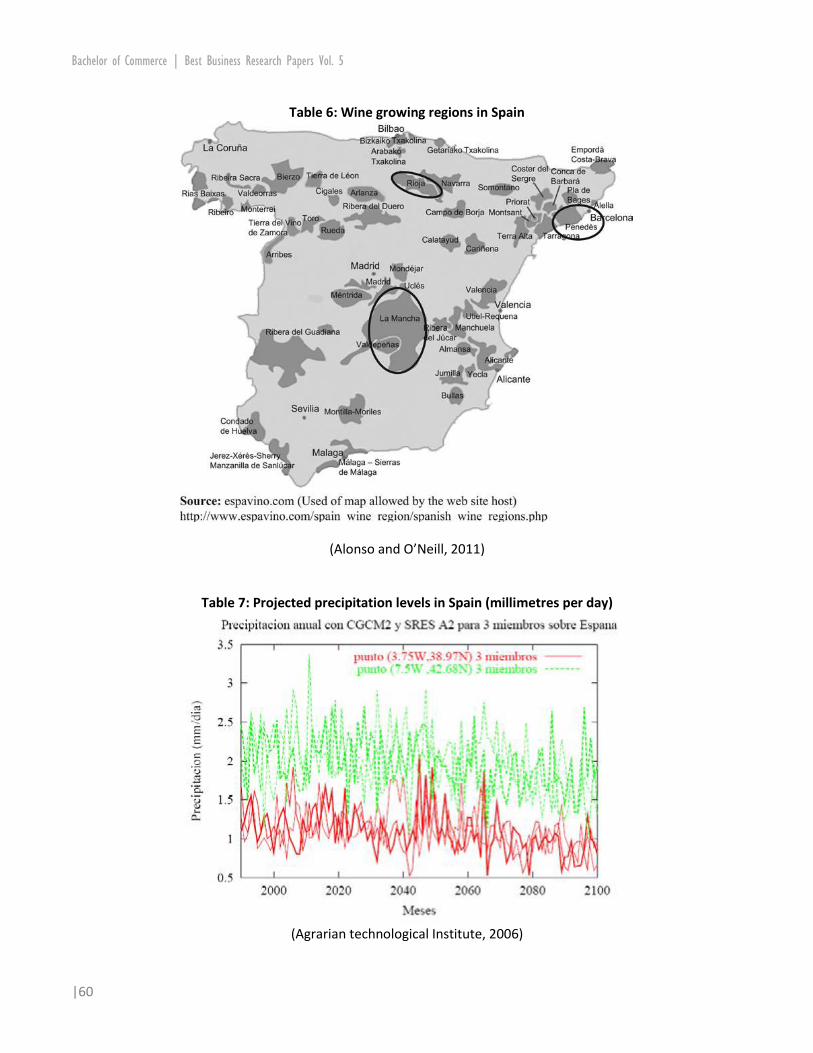
Bachelor of Commerce | Best Business Research Papers Vol. 5
|60
Table 6: Wine growing regions in Spain
(Alonso and O’Neill, 2011)
Table 7: Projected precipitation levels in Spain (millimetres per day)
(Agrarian technological Institute, 2006)

Bachelor of Commerce | Best Business Research Papers Vol. 5
61|
Table 8: Changes in water supply and demand with climate change
(Iglesias, 2009)
REFERENCES
Alonso, A. & O’Neill, M. (2011). “Climate Change From the Perspective of Spanish Wine Growers: A Three Region Study.” The British Food Journal, 113(2), pp. 205-221. Almendral, V. (2009). Spain Faces Growing Desertification, Forum of Federations Magazine: February 2, 2009. Angeli, F. (2003). Wine in The Old World: New Risks and Opportunities, Tipomonza, Milan. Bardaji, I. & Miri, S. (2009). “Prospective Trends in Wine Export Markets – Expert Views From Spain.” International Association of Agricultural Economists Conference, pp. 1-18. Bardaji, I. & Miri, S. (2009). “An Exploration of International Challenges Facing Wine Sector in Spain.” A Resilient European Food Industry and Food Chain in a Challenging World, pp. 1-12. Faris, S. (2011). Heading for the Hills: Spanish Winemakers Adapt to Global Warming, Time Magazine Europe, 29 Aug. Fernandez, Ana: Economics professor at Universidad Carlos III De Madrid. Personal interview on November 10, 2011.
Bachelor of Commerce | Best Business Research Papers Vol. 5
|62
Instituto Tecnologico Agrario Official (2006). Climate Change, Vulnerability and Adaptation in Agriculture – The Situation in Spain, 1st General ADAGIO Meeting, BOKU, Vienna, pp. 1-23 (This document was obtained directly from the OEMV office in Madrid). Iglesias, A. (2007). “Policy Issues Related to Climate Change in Spain.” Time to Adapt, Berlin, pp. 1-34. Jeffs, J. (1999). The Wines of Spain, Faber and Faber Ltd, London. Jones, G., White, M., Cooper, O. & Storchmann, K. (2005). “Climate Change and Global Wine Quality.” Climatic Change, 3(3), pp.319-343. Montaigne, E. (2010). European Wine Market Issues and Prospects in the Context of the Changes to the Common Market Organization for Wine, Giannini Foundation of Agricultural Economic, pp. 1-3. Mulier, T. (2006). Global Warming Hurts Spain’s Vineyards, Force Vintners to Move, Bloomberg: May 21, 2006. Perini, S. (2010). Wine Annual- Report and Statistics, Global Agricultural Information Network, pp. 1-13. Roberts, G. (2008). Some Vineyards Suffer While Others Thrive, Plenty Magazine, May 19, 2008: pp. 13-14. Schultz, H. & Jones, G. (2010). “Observations, Predictions and Implications of Global Climate Change on Global Wine Production.” GRC Geisenham, pp.1-79. Somers, T. & Quirk, L. (2008). “Grapevine Management Guide.” NSW Department of Primary Industries, pp 1-107. Tremlett, G. (2009). Climate Change Lays Waste to Spain’s Glaciers, The Guardian: February 23, 2009. Wood, D. (2008). Spanish Wine Makers Fight Climate Change, BBC, September 8, 2008. Wines From Spain (2000). Spanish Institute for Foreign Trade. http://www.winesfromspain.com (accessed October 2, 2011).