bach2 immunodeficiency illustrates an association between
TRANSCRIPT

BACH2 immunodeficiency illustrates an association between super-enhancers and haploinsufficiency
Behdad Afzali1,2,*,†, Juha Grönholm3,*, Jana Vandrovcova4,5,*, Charlotte O’Brien5, Hong-Wei Sun1, Ine Vanderleyden6, Fred P Davis1, Ahmad Khoder5, Yu Zhang3, Ahmed N Hegazy7,8, Alejandro V Villarino1, Ira W Palmer1, Joshua Kaufman1, Norman R Watts1, Majid Kazemian9, Olena Kamenyeva3, Julia Keith7, Anwar Sayed5, Dalia Kasperaviciute10, Michael Mueller10, Jason D. Hughes11, Ivan J. Fuss3, Mohammed F Sadiyah6, Kim Montgomery-Recht12, Joshua McElwee11, Nicholas P Restifo13, Warren Strober3, Michelle A Linterman6, Paul T Wingfield1, Holm H Uhlig7,14, Rahul Roychoudhuri6, Timothy J. Aitman5,15, Peter Kelleher5, Michael J Lenardo3, John J O’Shea1, Nichola Cooper5,†,‡, and Arian DJ Laurence7,16,‡
1Lymphocyte Cell Biology Section (Molecular Immunology and Inflammation Branch), Biodata Mining and Discovery Section and Protein Expression Laboratory, National Institutes of Arthritis, and Musculoskeletal and Skin Diseases, National Institutes of Health, Bethesda, MD, USA
2MRC Centre for Transplantation, King’s College London, UK
3Molecular Development of the Immune System Section, NIAID Clinical Genomics Program, Biological Imaging Section (Research Technologies Branch) and Mucosal Immunity Section, National Institute of Allergy and Infectious Diseases, National Institutes of Health, Bethesda, MD USA
4Molecular Neuroscience, Institute of Neurology, Faculty of Brain Sciences, University College London, UK
5Department of Medicine, Imperial College London, UK
6Laboratory of Lymphocyte Signaling and Development, Babraham Institute, Cambridge, UK
7Translational Gastroenterology Unit, Nuffield Department of Medicine, John Radcliffe Hospital, Oxford, UK
Users may view, print, copy, and download text and data-mine the content in such documents, for the purposes of academic research, subject always to the full Conditions of use: http://www.nature.com/authors/editorial_policies/license.html#terms†Correspondence to: Behdad Afzali ([email protected]; [email protected]); Nichola Cooper ([email protected]).*These authors contributed equally to this work‡These authors contributed equally to this work
Author contributions: B.A., J.G. and J.V. designed and performed experiments, analyzed data and wrote the manuscript. C.O’B., I.V., F.P.D., A.K., A.N.H., J.Ke., M.F.S., A.S., R.R., M.A.L., O.K., H-W.S., Y.Z. performed experiments and/or analyzed data. I.J.F., W.S., T.J.A., P.K., N.C. provided patient samples and clinical and scientific input. K.M-R. co-ordinated patient samples. Patient sequencing and sequence analysis was carried out by J.V., N.C., T.J.A., D.K., M.M., J.D.H., J.McE. and Y.Z. A.V.V., N.W., H.H.U., M.K. provided scientific input. P.T.W. I.W.P., J.Ka. provided scientific input, performed protein chemistry experiments and analyzed data. N.P.R. provided murine reagents for these experiments. M.J.L., J.J.O’S., N.C and A.D.J.L provided scientific input, supervised the project and wrote the manuscript.
Competing financial interests: The authors have no competing interests to declare. Unrelated to this project, H.H.U. declares industrial project collaboration with Lilly, UCB Pharma and Vertex Pharmaceuticals. Travel support was received from Actelion, and MSD.
HHS Public AccessAuthor manuscriptNat Immunol. Author manuscript; available in PMC 2017 November 22.
Published in final edited form as:Nat Immunol. 2017 July ; 18(7): 813–823. doi:10.1038/ni.3753.
Author M
anuscriptA
uthor Manuscript
Author M
anuscriptA
uthor Manuscript

8Kennedy Institute of Rheumatology, Nuffield Department of Orthopaedics, Rheumatology and Musculoskeletal Sciences, University of Oxford, UK
9Departments of Biochemistry and Computer Science, Purdue University, West Lafayette, IN, USA
10Imperial BRC Genomics Facility Hammersmith hospital, Du Cane road, London, UK
11Merck Research Laboratories, Merck & Co. Inc., Boston, MA, USA
12Clinical Research Directorate/CMRP, Leidos Biomedical Research Inc., NCI at Frederick, Frederick, MD, USA
13National Cancer Institute, National Institutes of Health, Bethesda, MD, USA
14Department of Paediatrics, University of Oxford, UK
15Centre for Genomic and Experimental Medicine, Institute of Genetics and Molecular Medicine, University of Edinburgh, UK
16Department of Haematology Northern Centre for Cancer Care, Freeman road, Newcastle upon Tyne, UK
Abstract
Transcriptional programs guiding lymphocyte differentiation depend on precise expression and
timing of transcription factors (TFs). BACH2 is a TF essential for T- and B-lymphocytes and is
associated with an archetypal super-enhancer (SE). Single nucleotide variants in the BACH2 locus
associate with multiple autoimmune diseases but BACH2 mutations causing Mendelian
monogenic primary immunodeficiency have not previously been identified. We describe a
syndrome of BACH2-related immunodeficiency and autoimmunity (BRIDA) resulting from
BACH2 haploinsufficiency. Patients had lymphocyte maturation defects, causing immunoglobulin
deficiency and intestinal inflammation. The mutations disrupted protein stability by interfering
with homodimerization or by causing aggregation. Analogous lymphocyte defects existed in
Bach2 heterozygous mice. More generally, we found that genes causing monogenic
haploinsufficient diseases are substantially enriched for TFs and SE-architecture. These
observations show a new feature of SE-architecture in Mendelian diseases of immunity, that
heterozygous mutations in SE-regulated genes identified on whole exome/genome sequencing
may have greater significance than recognized.
Introduction
The inheritance pattern of genetic diseases consists of a spectrum, ranging from the vast
majority representing polygenic susceptibility variants (usually identified on GWAS studies)
to the minority, which are monogenic and manifest in either a recessive or dominant manner.
It is now appreciated that mutations in over 300 different genes can cause primary
immunodeficiency (PID), many of which affect T and B lymphocyte function1–4. PIDs are
often paradoxically associated with autoimmunity3–7. Common variable immunodeficiency
(CVID), a major form of PID with antibody deficiency, is typically associated with recurrent
infections and autoimmunity8. Recently developed gene-sequencing technologies now allow
Afzali et al. Page 2
Nat Immunol. Author manuscript; available in PMC 2017 November 22.
Author M
anuscriptA
uthor Manuscript
Author M
anuscriptA
uthor Manuscript
for rapid identification of PIDs but have also raised the important question of how to
interpret the many heterozygous mutations seen in both patients and healthy controls.
Relatively few PID syndromes are caused by haploinsufficiency, an autosomal dominant
pattern of disease inheritance, where one allele is damaged and only a single functional
allele remains9. Genes, such as CTLA4, are particularly susceptible to haploinsufficiency
and the reasons are unknown10. In the light of many healthy people that harbor heterozygous
loss of function or hypomorphic variants, why should partial changes in gene expression
have significant consequences to health?
Promoters and enhancer elements govern gene expression. Most, such as housekeeping
genes like actin, are regulated by a limited number of associated enhancers, known as
“typical enhancers”11. By contrast, 5–10% of genes have a complex enhancer structure
consisting of multiple enhancers that collectively are described as SEs12,13. Genes with
associated SEs have a highly regulated pattern of gene expression; single nucleotide
polymorphisms associating in GWAS studies with autoimmune diseases are preferentially
enriched within SE regions14. These findings suggest that minor changes in regulatory
function at SE regions could have significant consequences to the immune system for genes
regulated by SEs.
BACH2 is a typical example of an SE-regulated gene associated with autoimmune disease. It
is a highly conserved member of the basic and leucine zipper domain (bZIP) superfamily of
TFs and a critical regulator of both T and B lymphocyte differentiation and maturation15,16.
Polymorphisms in the human gene locus associate with multiple autoimmune diseases,
including asthma17, insulin dependent diabetes mellitus18, Crohn’s and celiac diseases19,20,
vitiligo21 and multiple sclerosis16,22. The Bach2 gene locus has the largest SE structure seen
in mouse lymphocytes14. Homozygous deletion of Bach2 in mice results in spontaneous
fatal autoimmunity between 3 and 9 months of age15. Functionally, BACH2 acts as a
repressive “guardian” TF that regulates the balance between a network of other TFs critical
to T and B cell specification and maturation. In B cells, BACH2 controls the balance
between Pax5 and Blimp1 by repressing the latter23,24, to decelerate plasma cell
differentiation and permit antibody class switch recombination (CSR) (allowing expression
of IgA, G and E isotypes)25. Consequently, mice lacking BACH2 have B cells with impaired
CSR that rapidly differentiate into IgM-restricted plasma cells. In T cells, BACH2 regulates
networks of genes that control T cell effector lineages14 and cellular senescence26, thus
limiting differentiation into effector cells15 and promoting development of FoxP3+
regulatory T cells (Treg). Treg cells are a non-redundant suppressive lineage of T cells that
prevent development of autoimmune diseases by controlling over-activation of the immune
system27. Thus, mice deficient in BACH2 demonstrate both a paucity of Treg cells and an
excess of memory/effector T cells that age and die prematurely, resulting in autoimmunity.
Structurally, BACH2 contains a BTB/POZ domain that mediates homo-and hetero-
dimerization at its N-terminus and a bZIP domain at the C-terminus required for DNA
binding. The dimerization domain is an alpha-helical structure containing a cysteine residue
that is capable of forming a disulphide bond with its opposite partner28. Thus homo-
dimerization is likely to be stabilized by a covalent modification that occurs soon after
protein folding. BACH2 dimers translocate to the nucleus where they interact with target
Afzali et al. Page 3
Nat Immunol. Author manuscript; available in PMC 2017 November 22.
Author M
anuscriptA
uthor Manuscript
Author M
anuscriptA
uthor Manuscript

DNA loci at palindromic Maf recognition elements (MARE), either alone or in collaboration
with other members of the bZIP family, such as the small Maf proteins (MafF, MafG and
MafK)16. This interaction, for example at the Prdm1 locus that encodes Blimp1, represses
gene expression.
Here we describe a novel PID caused by haploinsufficiency of BACH2 and propose a shared
genetic mechanism to explain why some genes are particularly susceptible to causing
disease by haploinsufficiency. We conclude that the interpretation of heterozygote variants in
these genes should be regarded as significant and be prioritized in any investigation of novel
genetic disease by whole exome sequencing.
Results
BACH2 mutations associate with CVID and colitis
We investigated a female (Figs. 1a and 1b – Family A) with infancy-onset colitis, who
became ill at 19 years old with non-infectious fever, splenomegaly (21.7 cm, compared to
10–12 cm in normal adults) (Fig. 1c) and pancytopenia. Fever and cytopenia improved with
corticosteroids, but lymphopenia, deficiency in immunoglobulin (Ig)M, IgG, IgA and IgE,
ongoing colitis, lung infiltrates and recurrent upper respiratory tract infections persisted (Fig.
1c, Table 1 and Supplementary Table 1). A colonic biopsy demonstrated inflammatory
changes with crypt branching and prominent lymphocytic infiltrates around the crypts (Fig.
1d), with significantly reduced FoxP3+ regulatory T (Treg) cells compared with healthy
controls or patients with classical IBD (Fig. 1e). The early disease onset and unusual
symptoms in the absence of family history prompted us to perform whole exome sequencing
on the patient and healthy parents as a trio. After excluding all variants with minor allele
frequency (MAF) >0.01, no candidate variants remained to support a hypothesis of recessive
inheritance. We found a novel heterozygous de novo, non-synonymous mutation in BACH2,
c.T71C, predicted to be deleterious (Supplementary Table 2), substituting a highly conserved
leucine with proline (L24P), and not present in healthy family members (Fig. 1b and
Supplementary Figure 1). A second family (Family B) that had been previously investigated
by exome sequencing (Fig. 1a) was found to have a heterozygous point mutation in BACH2,
c.G2362A (Fig. 1b), substituting glutamic acid with lysine (E788K) in a father and daughter,
both of whom presented with inflammation of both small and large bowel, together with
pulmonary disease, including recurrent sino-pulmonary infections, bronchiectasis and
fibrosis (Fig. 1c and Supplementary Table 1). The BACH2 mutation was not seen in healthy
family members (Supplementary Figure 1). The father (proband) was deficient in all Ig sub-
types; his daughter had undetectable IgA (Supplementary Table 1). Detailed clinical features
are described in the Supplementary notes, Tables 1 and Supplementary Fig 1. We found no
low MAF variants nor causative mutations in genes causing monogenic IBD or other
recognized primary immunodeficiencies29–31.
In the lymphocytes of affected individuals, we found decreased expression of FoxP3 in
CD4+CD25hiCD127lo regulatory T cells (Treg) (Fig. 2a) and increased expression of the TH1
transcription factor T-bet and two gut-homing receptors, CCR9 and β7-integrin on CD4+ T
cells32,33 (Fig. 2b). In the patient B cells, we found a marked reduction in CD19+CD27+
memory and IgG class-switched CD27+IgG+ B cells (Fig. 2c). These features were not
Afzali et al. Page 4
Nat Immunol. Author manuscript; available in PMC 2017 November 22.
Author M
anuscriptA
uthor Manuscript
Author M
anuscriptA
uthor Manuscript
present in healthy controls or patients with inflammatory bowel disease (IBD)
(Supplementary Fig. 2a). Furthermore, CD24+CD38+ transitional B cells were increased in
patients (Supplementary Fig. 2b). In vitro activation of naïve B cells from patients resulted
in significantly impaired plasmablast generation, class-switch recombination and class-
switched antibody secretion in the presence of IL-21 (Figs. 2d and 2e), suggesting a defect
in B cell maturation towards memory and plasma cells, similar to Bach2 knockout mice34.
Polyclonal activation of T cells resulted in reduced CD4+ T cell proliferation compared with
healthy controls (Supplementary Fig. 2c). In summary, the immunophenotype of patients
with mutations in BACH2 consisted of compromised Treg cells, enhanced TH1
differentiation, impaired proliferation and defective B cell maturation and Ig class switching.
BACH2 silencing mimics patient lymphocyte phenotypes
We next measured BACH2 protein expression by flow cytometry and found it was reduced
in patient CD4+, CD8+ and B lymphocytes despite normal mRNA expression (Figs. 3a,b).
We measured protein expression of Flag-tagged vectors encoding wild-type (WT) or mutant
forms of BACH2 in transfected HEK293T cells and found that mutant forms of the protein
accumulated less than WT (Fig. 3c), at all time points measured and concentrations of vector
used (Supplementary Fig. 3a–b). PRDM1, which encodes the protein BLIMP1, is a target of
BACH2-mediated transcriptional repression24. We found that patient naïve B cells and CD4+
T cells expressed significantly higher levels of PRDM1 mRNA compared with healthy
controls suggesting a release from BACH2 repression (Figs. 3d,e). Furthermore, this
difference could be reversed by forced expression of WT BACH2 in patient CD4+
lymphocytes (Fig. 3e). These observations suggested a causal relationship between reduced
BACH2 expression in patients and their cellular phenotype. To confirm this relationship, we
silenced BACH2 expression in healthy control T and B cells using RNAi by ~50% and
carried out functional phenotyping (Supplementary Figs. 4a,b). Silencing BACH2 in control
CD4+ T cells led to a significant rise in PRDM1 mRNA (Fig. 3f) and resulted in reduced
proliferation of CD4+ T cells (Supplementary Fig. 4c), in a similar fashion to that seen in
primary CD4+ T cells from patients (Supplementary Fig. 2c). In addition, silencing BACH2
in healthy control B cells, significantly suppressed in vitro class switch recombination
towards the IgG and IgA isotypes (Fig. 3g). Thus, experimental silencing of BACH2 in
healthy T and B cells recapitulated the phenotype seen in primary cells of the patients.
BACH2 gene mutations impair protein stability
Both mutations that we identified affect highly conserved amino acid residues in BACH2
(Fig. 4a). Murine and human BACH2 share 90% sequence identity and L24 is conserved
across species and with other members of the BTB/POZ domain family (Supplementary
Figs. 5a,b and Supplementary Table 2). L24 resides within α-helix-1 (residues 18–34) of the
BTB/POZ domain, a key part of the BACH2 homo-dimerization interface (Figs. 4b and 4c).
The mutant proline residue likely perturbs α-helix-1 of the BTB/POZ domain and places a
polar residue into the hydrophobic face of that helix, which we predicted would decrease
dimer stability (Supplementary Table 2). We expressed and purified the BTB domains from
both WT and L24P mutant proteins. The WT protein was soluble and formed dimers (Fig.
4d), whereas the L24P mutant was insoluble in solution, likely misfolded, and formed
multiple aggregated species (Fig. 4e). E788, the site of the C-terminus mutation, is again
Afzali et al. Page 5
Nat Immunol. Author manuscript; available in PMC 2017 November 22.
Author M
anuscriptA
uthor Manuscript
Author M
anuscriptA
uthor Manuscript

highly conserved (Supplementary Fig. 5a). Though not characterized by structural studies, it
is in proximity to a nuclear export signal (Fig. 4a). We found that wild-type BACH2 protein
was evenly distributed in both cytoplasm and nucleus, whereas the E788K mutant protein
was aggregated in the cytoplasm with relatively little in the nucleus (Fig. 4f and
Supplemental Movies 1–2). Similar protein aggregates were observed in HEK293T cells
transfected with this C-terminal variant (Supplementary Fig. 5c and Supplemental Movies
3–4). By contrast, aggregates were not detected in lymphocytes expressing the L24P mutant
from patient A.II.1, although, as noted, L24P mutant BACH2 protein expression levels were
lower than WT control (Supplementary Fig. 5d). Thus, both gene mutations impair BACH2
protein stability.
BACH2 mutations are not dominant negative
In both families, the BACH2 gene mutations could potentially act in a dominant negative
manner. To test this, HEK293T cells were co-transfected with Flag-tagged WT together with
untagged WT or mutant BACH2 protein-expressing constructs. Neither patient mutant
altered WT protein expression (Fig. 5a). The experiment was repeated with HEK293T cells
co-transfected with vectors encoding two tagged WT (HA-BACH2 and Flag-BACH2) forms
of the proteins together with either untagged WT or mutant BACH2 protein-coding
constructs (Fig. 5b). Co-immunoprecipitation studies showed that WT untagged BACH2, but
not mutant forms of the protein, interfered with dimerization between HA and Flag-tagged
WT BACH2. Furthermore, when WT Flag-BACH2 was co-transfected together with HA-
tagged WT, L24P or E786K BACH2, we detected reduced mutant HA-BACH2 bound to
Flag-tagged WT BACH2 after immunoprecipitation, in proportion to the reduction in protein
accumulation, implying limited, if any, effects on WT BACH2 (Supplementary Fig. 6a). All
these results were consistent with our earlier findings of loss of stability of the mutant
proteins compared with wild-type proteins (Fig. 4). Finally, we used retroviral constructs
encoding murine WT or mutant BACH2 to transduce Prdm1-YFP transgenic CD4+ T cells.
Forced expression of wild-type BACH2 alone led to a significant reduction in the expression
of Prdm1-YFP, but co-transduction with either mutant form of BACH2 did not interfere with
repression of the Prdm1 reporter in primary mouse lymphocytes (Fig. 5c). Collectively, these
data indicate that neither BACH2 mutation exerted a dominant negative effect.
Bach2+/− mice have impaired lymphocyte development
In the absence of a dominant negative effect we next turned to haploinsufficiency as an
explanation. Complete absence of Bach2 in mice results in B cell immunodeficiency and
fatal autoimmunity later in life15,16. If haploinsufficiency is responsible for the defects in
lymphocyte development observed in our patients, we would expect to see a similar effect in
mice heterozygous for WT and null alleles (Bach2+/−). We found that Bach2+/− mice
manifest reduced Bach2 mRNA (Fig. 6a) and protein expression (Fig. 6b) together with
elevated Prdm1 mRNA (Supplementary Fig. 7a). There was no difference in the numbers of
CD4+ and CD8+ T cells, B cells or plasma cells in unchallenged mice (Supplementary Figs.
7b and 7c) but Bach2+/− mice did have a small but significant reduction in FoxP3+ cells
together with significant increases in CCR9+ and β7-integrin+ cells in CD4+ T cells (Figs.
6c, 6d and 6e). We next immunized WT and Bach2+/− mice with 4-hydroxy-3-
nitrophenylacetyl hapten-conjugated chicken gamma globulin (NP-CGG) in alum and
Afzali et al. Page 6
Nat Immunol. Author manuscript; available in PMC 2017 November 22.
Author M
anuscriptA
uthor Manuscript
Author M
anuscriptA
uthor Manuscript

analyzed the splenic B cell response. Immunized Bach2+/− mice exhibited minimal
induction of both IgG1 class switched-B220hiCD138− B cells and B220loCD138+ plasma
cells compared to WT mice (Fig. 6f). The proportion of germinal center B220+Ki67+Bcl6+
B cells was also reduced in Bach2+/− mice (Fig. 6g), supporting a haploinsufficiency model.
Super-enhancer regulated genes associate with haploinsufficiency
Taken together, our data argue that the maintenance of a threshold concentration of BACH2
is crucial for proper immunoregulation. Mutations of other TFs have been reported to cause
haploinsufficient disorders35. BACH2 expression is regulated in a complex manner and the
BACH2 locus contains an archetypal SE (Fig. 7a)12–14,16,36,37. We therefore hypothesized
that SE structure may be enriched among genes causing haploinsufficiency (HI) diseases. To
this end, we compared genetic disorders mediated by HI (372 genes) versus autosomal
recessive (AR) inheritance (259 genes) to haplosufficient (HS) genes (those where single
allele deletions are inconsequential; 901 genes) (Ref. 38 and Online methods). To validate
these three groups, we evaluated the probability of loss-of-function intolerance (pLI) score
(as estimated by ExAc39), where a score of 0 predicts that loss of a single copy of the gene is
well tolerated whereas a score of 1 predicts that loss of a single copy is poorly tolerated and
likely to result in a disease. As expected, the median pLI score for our HI list was
significantly higher than the others (median values of 0.86, 0.0005 and 0.004 for HI, HS and
AR recessive genes, respectively) (Fig. 7b). Moreover, HI genes were substantially more
likely to have SE architecture, as denoted by especially high acetylated histone H3 lysine 27
(H3K27Ac) signal, a hallmark of active enhancers40 (Figs. 7c,d, Supplementary Fig. 8a and
Supplementary Tables 3,4). In contrast, there was no difference in the frequency of typical
enhancers between the three groups (Fig. 7d). We next compared the function of genes
between the three groups and found that HI genes were more likely to encode transcription
factors than genes associated with AR inheritance or HS genes (Fig. 7e, Supplementary
Figs. 8b, c). To address any potential confounding abundance of transcription factor genes in
SE, we also divided our list of HI genes into those that code for transcription factors and
those that code for all other proteins and compared the frequency of SEs (Supplementary
Fig. 8c). We found that even after discounting TF genes, haploinsufficiency disease-causing
genes are heavily enriched for SE architecture compared to HS and AR genes
(Supplementary Fig. 8d). We next asked whether SE-bearing genes have lesser tolerance to
loss-of-function mutations and whether the ‘size’ of the SE correlates with this effect. We
expanded our analysis to a collection of genes regulated by SEs from across more than 100
tissues (dbSuper database41) and observed both a striking increase in the probability of loss-
of-function intolerance score with increasing SE signal size and a concomitant increase in
the proportion of transcription factor genes (Fig. 7f). Thus, not only the presence of an SE
but also its “size” correlates with likelihood of disease caused by haploinsufficiency.
SE architecture was previously shown to associate with human disease loci in genome-wide
association studies (GWAS)14,36,42. This is the case for BACH216,22, which was consistently
in the top 1% of human SE genes by H3K27Ac SE signal intensity in naïve CD4+ T, naïve
CD8+ T and B cells (Supplementary Figs. 8e–g). Based on the SE enrichment among HI
genes, we next asked whether there would be general enrichment of GWAS “hits” in genes
associated with haploinsufficient disease. In agreement with this hypothesis, we found that
Afzali et al. Page 7
Nat Immunol. Author manuscript; available in PMC 2017 November 22.
Author M
anuscriptA
uthor Manuscript
Author M
anuscriptA
uthor Manuscript
there was a highly significant enrichment of disease-associated SNVs within this gene set
(Fig. 7g and Supplementary Table 5). To exclude gene size as a potential confounding factor,
the analysis was repeated on subsets of genes of less than 50 kb and again we found more
GWAS associations in genes associated with HI syndromes compared to HS genes
(Supplementary Fig. 8h). Thus, HI genes are enriched for both SEs and GWAS “hits”.
Discussion
Adaptive immunity is critically dependent on appropriate differentiation and maturation of
lymphocytes. Several complex differentiation steps are required to form mature cells that
occupy specific niches and carry out defined roles within the immune system. Key to the
regulation of lymphocyte differentiation is precise control over expression of many
transcription factors (TFs) that form complex regulatory networks. The identification of both
mice and humans with dramatic early onset stereotypical autoimmune disease associated
with a homozygous loss of gene expression has led to the identification of many key
regulatory TFs, most notably FoxP3, the master TF of Treg cells27.
The reduction in the cost and time it takes to perform whole exome sequencing has allowed
patients with no family history to be analysed for genetic mutations. Comparing patients’
DNA sequence with healthy parents identifies the appearance of de novo mutations that
would otherwise be missed if a positive family history was required prior to any
investigation. Using this strategy a number of heterozygous mutations associated with
autoimmune diseases have recently been discovered.
BACH2 plays a major role in the regulation of the adaptive immune system. Its own
expression is tightly regulated by the presence of a large super-enhancer region within the
Bach2 locus14. The role of BACH2 has been elucidated by the investigation of BACH2-
deficient mice that have a defect in B cell class switch recombination together with a
deficiency of Treg cell differentiation. In mice, this combination results in a chronic variable
immunodeficiency together with a late onset, but progressively fatal, autoimmune syndrome
that includes inflammatory enteropathy and respiratory infiltrates15. In keeping with its
place as an SE-associated gene, there is a link between single nucleotide polymorphisms
within the BACH2 locus and a number of autoimmune/inflammatory diseases.
Herein we describe three patients from two families that have heterozygous mutations in
BACH2. Two of the three presented with a history of early onset autoimmune
gastrointestinal disease and the third presented later in life. All three have developed a
chronic variable immunodeficiency characterized by recurrent respiratory tract infections
associated with an inability to generate appropriate antibody responses to vaccination. Our
findings support a role for human BACH2 as a key regulator of the human adaptive immune
system critical to maintain Treg cell function and B cell maturation. BACH2-deficient mice
exhibit accelerated T cell senescence26,43 and, in keeping with this, T cells from our patients
have a defect in cell proliferation associated with a progressive T cell lymphopenia. Many of
the autoimmune phenomena in our patient with the L24P mutation have been successfully
treated with corticosteroids although this has not reduced her chronic variable
immunodeficiency nor her pneumonitis, which is of some concern as this is a key cause of
Afzali et al. Page 8
Nat Immunol. Author manuscript; available in PMC 2017 November 22.
Author M
anuscriptA
uthor Manuscript
Author M
anuscriptA
uthor Manuscript
early mortality in BACH2-deficient mice. The father with the E788K mutation developed
bronchiectasis later in life. It remains to be seen whether the pneumonitis will be progressive
in our L24P patient and result in chronic lung damage.
In the first family, the mutant BACH2T71C gene resulted in a protein that is predicted to be
unable to dimerize and is unstable. In the second family, the mutant BACH2E788K protein
again showed some evidence of a defect in stability but this was less dramatic, and we saw
more evidence of a defect in the localisation of the protein with reduced nuclear localisation.
We found little evidence that either mutant protein acted in a dominant negative manner.
Thus we attribute the clinical phenotype to BACH2 haploinsufficiency and this conclusion
was consistent with our findings and previous reports44 that Bach2+/− heterozygote have
defects in CSR antibody responses.
Mammalian cells contain tens of thousands of gene enhancer sites that cluster in large
numbers around a select subset of genes that make up some 5–10% of the total human
genome. These clusters are collectively known as SEs. GWAS mutations tend to associate
with these gene loci but the significance of this remains unclear. Previous work would
suggest that SE genes code for proteins whose function is highly dependent on transcription,
small changes of which would lead to significant changes in cell development. From this we
hypothesise that SE genes would be susceptible to gene dosage effects in patients with
heterozygous mutations. We conclude that the relationship between GWAS studies and SE
regulated genes occurs not simply because these genes transcribe proteins that are important
per se but because small changes in the expression of SE genes result in large functional
changes in the affected cells.
In summary, we describe a new disorder, BACH2-related immunodeficiency and
autoimmunity (BRIDA) due to heterozygous mutations in BACH2. We found that the
mechanism of disease is BACH2 haploinsufficiency and that BACH2 is a prototype
haploinsufficiency gene exhibiting SE architecture. Given the prevalence of heterozygous
variants in non-consanguineous human genomes45, it is difficult to predict which ones cause
disease. We demonstrate that haploinsufficiency diseases are associated with heterozygous
mutations in SE-regulated genes. As SEs allow complex regulation of gene transcription, we
conclude that haploinsufficiency genes are carefully regulated due to their SE association
and that small changes in their expression level can potentially lead to amplified changes in
their associated network, especially for TF genes, resulting in significant pathology. Thus,
SE-regulated genes should be more significantly prioritized when interpreting heterozygous
variants discovered on whole exome/genome sequencing.
Online Methods
Ethics approvals
Patients and their relatives provided written informed consent and were investigated under
National Institute of Allergy and Infectious Diseases (NIAID) Institutional Review Board–
approved research protocols 89-I-0158 and 06-I-0015, West London Research Ethics
Committee approval (Ethics Protocol Reference Number 11/LO/0883) and Oxford IBD
cohort study (monogenic IBD subproject). All animal studies were performed according to
Afzali et al. Page 9
Nat Immunol. Author manuscript; available in PMC 2017 November 22.
Author M
anuscriptA
uthor Manuscript
Author M
anuscriptA
uthor Manuscript

National Institutes of Health guidelines for the use and care of live mice and were approved
by the Institutional Animal Care and Use Committee of National Institute of Arthritis,
Musculoskeletal and Skin Diseases (Protocol number A014-03-02).
Histology and Immunohistochemistry
A colonic biopsy was performed on patient A.II.1 at the time of her presentation, aged 19
years. The biopsy was stained with Hematoxylin and Eosin stain and reviewed by
pathologists at the Hammersmith hospital, London, UK. Immunohistochemical staining of
formalin-fixed paraffin-embedded (FFPE) sections was performed on patient and tissue-
matched FFPE sections from healthy control donors as well as age-matched donors
diagnosed with classical Crohn’s Disease (provided by the Oxford Centre of Histopathology
Research and the Oxford Gastrointestinal Illness Biobank) using antibodies to FOXP3
(Abcam; 236A/E7) followed by TSA amplification (PerkinElmer) and CD3 (Dako; F7.2.38)
followed by Alexa Flour 488-conjugated goat anti-mouse IgG (LifeTechnologies). Nuclei
were stained using Vectashield antifade mounting medium with DAPI (Vector Laboratories)
and slides were examined with a Zeiss LSM510 inverted confocal microscope. ImageJ
(ImageJ) and Photoshop (Adobe) were used for the processing and presentation of the
images.
Antibodies, cell lines and media
The following antibodies and reagents were used in the study: anti-human BACH2
(ab83364) was purchased from Abcam, anti-human CD19 (HIB19), anti-human CD24
(ML5), anti-mouse CD3 (145-2C11), anti-mouse CD8 (53-6.7), anti-mouse CCR9 (9B1),
anti-human-CCR9 (LO53E8), anti-human/mouse β7-integrin (FIB504) (all BioLegend),
anti-human CD4 (OKT4), anti-human CD25 (2A3), anti-human CD27 (M-T271), anti-
human CD38 (HB-7), anti-human IgG (GI8-145), human Fc Block, anti-mouse CD4
(RM4-5), anti-mouse CD25 (7D4), anti-mouse CD44 (IM7), anti-mouse CD62L (MEL-14),
anti-mouse CD138 (281-2), anti-mouse B220 (RA3-6B2), anti-mouse CXCR5 (2G8), anti-
mouse IgG1 (A85-1), anti-mouse IgM (R6-60.2), streptavidin-APC, streptavidin-FITC (all
BD), anti-human CD3 (OKT3), anti-human CD8 (RPA-T8), anti-human CD38 (HB7), anti-
human-CD127 (eBioRDR5), anti-human T-bet (eBio4B10), anti-human FoxP3 (PCH101),
anti-mouse CD25 (BC61.5), anti-mouse CD127 (A7R34), anti-mouse GL7 (GL-7), anti-
mouse Fas (15A7), anti-mouse NKp46 (29AI.4), anti-mouse IgD (11–26), anti-mouse IgM
(11/41), anti-mouse PD1 (J43), anti-mouse GITR (DTA-1), anti-mouse Foxp3 (FJK-16s),
anti-Thy1.1 (HIS51) (all eBioscience), mouse anti-FLAG M2 (Sigma) and goat anti-rabbit-
IgG-AlexaFluor488 (A-11034) (LifeTechnologies). Live-Dead Flixable Aqua Dead Cell
stain was purchased from Thermofisher (Boston, USA). Raji, Ramos and HEK293T cell
lines were purchased from ATCC. Unless specified, human cells and cell lines were
maintained in RPMI 1640 supplemented with 2mM L-glutamine, penicillin/streptomycin
(100 IU/mL and 100 ug/mL respectively; all from LifeTechnologies) and 10% FBS (Atlanta
Biologicals). Mouse cells were cultured in identical medium supplemented in addition with
2 mM β-mercaptoethanol (Sigma Aldrich). HEK293T cells were maintained in DMEM
(LifeTechnologies) supplemented as with human cell culture medium.
Afzali et al. Page 10
Nat Immunol. Author manuscript; available in PMC 2017 November 22.
Author M
anuscriptA
uthor Manuscript
Author M
anuscriptA
uthor Manuscript
Mice
C57BL/6J mice were purchased from The Jackson Laboratory. Bach2−/− and Bach2+/− mice
were generated and housed as previously described15. Blimp1-YFP BAC transgenic mice
have been previously described49. No statistical methods were used to predetermine sample
size.
Cell isolation and culture
Human PBMC were isolated from patient and healthy donor blood by density gradient
centrifugation using Ficoll (GE Healthcare) followed by lysis of red blood cells with RBC
lysis buffer (eBioscience). CD4+ T cells, naïve CD4+ T cells and naïve B cells were purified
from PBMC by negative selection using human CD4 T cell isolation kit, human naïve CD4
T cell isolation kit II and human naïve B cell isolation kit II, respectively (all
MiltenyiBiotec) according to manufacturer’s instructions. B-cell subsets were sort purified
by FACSAria (BD Immunocytometry Systems, San Jose, CA, USA.) using APC conjugated
anti-CD19 (BioLegend, San Diego, CA, USA), PE conjugated anti-CD27 (BD Biosciences,
San Jose, CA, USA.), PerCP-Cy5.5 conjugated anti-IgM (BD Biosciences). Naïve B cells
were defined as CD19+CD27-IgM+ B cells with a purity typically more than >98%50.
CD4+ T cells from spleens and lymph nodes of 6- to 8-week-old mice were purified by
negative selection and magnetic separation (Miltenyi), followed by sorting of naive
CD4+CD25−CD62L+CD44− population with a FACSAria II. Naïve Blimp1-YFP CD4+ T
cells were activated for 3d by plate-bound anti-CD3 (2C11; BioXCell) plus CD28 (37.51;
BioXCell), each at a concentration of 10 μg/ml in medium. Cells were stimulated in the
presence of mouse IL-12 (20ng/ml) and anti-mouse IL-4 (10 μg/ml) (Th1 conditions) (both
from R&D systems) for 3 days, then split into fresh uncoated plates and supplemented with
fresh medium and 100 IU/mL human IL-2 (NIH/NCI BRB Preclinical Repository).
B cell cultures and induction of class-switch recombination
Purified naïve B cells were cultured in RPMI 1640 containing L-glutamine (Sigma Aldrich,
St. Louis, MO, USA), 10% fetal bovine serum (Sigma Aldrich), 10 mM HEPES (pH 7.4;
Sigma-Aldrich), 0.1 mM nonessential amino-acid solution (Sigma- Aldrich), 1 mM sodium
pyruvate and 40 μg/ml apo-transferrin (Sigma-Aldrich) and supplemented with 60 μg/ml
penicillin and 100 μg/ml streptomycin. To induce class switch recombination, recombinant
human CD40L (1μg/ml; R&D Systems, Minneapolis, MN, USA), Fab fragment anti-human
IgM (Jackson Immunoresearch, West Grove, PA, USA), IL-2 (100 IU/ml; PeproTech) and
IL-21 (50 ng/ml; PeproTech, Rocky Hill, NJ, USA) were added at the beginning of the
culture. Cells were cultured in 96-well round bottom well plates (NuncTM, Roskilde,
Denmark) for 5 days. Culture supernatants were collected for ELISA at the end of the
culture.
IgG and IGA ELISA
IgG and IgA secretion was determined with the Ready-set-go total IgG and IgA kits
(Thermofisher) according to manufacturer protocols. Absorbance was read at 450 nm within
30 minutes of stopping of the reaction. The sensitivities and linear ranges were obtained
using the provided standard immunoglobulin.
Afzali et al. Page 11
Nat Immunol. Author manuscript; available in PMC 2017 November 22.
Author M
anuscriptA
uthor Manuscript
Author M
anuscriptA
uthor Manuscript

Whole exome sequencing
DNA was extracted from EDTA blood using Maxwell 16 Blood DNA Purification Kit
(Promega) or PBMC using DNeasy Blood & Tissue Kit (Qiagen). Total of 3 ug of DNA
were sheared using E220 focused sonicator (Covaris) and exome libraries were generated
using the SureSelect Human All Exon Kits (Agilent) according to manufactures’ protocol.
The quality of generated libraries was inspected using Agilent High Sensitivity DNA Kit
(Agilent) and quantified using qPCR kit (Agilent). Samples were sequenced on Illumina
HiSeq2000 (Illumina) generating 100 bp paired end reads. Sequences were aligned to a
human reference genome GRCh37 using bwa v 0.6.1 with default parameters51. Variant
calling (Single nucleotide variants and indels) was performed using GATK v.252 and variants
were annotated using Annovar53. An in-house custom analysis pipeline was used to filter
and prioritize variants based on the likely genetic models and clinical pedigree for patients.
Sanger sequencing
DNA samples were extracted from blood or saliva using Maxwell 16 Blood DNA
Purification Kit (Promega) and Oragene DNA (OG500) (Oragene), respectively. The
candidate mutations in affected and unaffected individuals of both families were validated
using BigDye Terminator Sequencing kit (Life technologies) and sequenced on ABI3730xl
genetic analyser (Applied Biosystems). PCR primer sequences are available on request.
Flow cytometry
All flow cytometry was carried out in a final staining volume of 100–200 μL, with data
acquisition on an LSR II, LSRFortessa or FACSVerse (all BD Biosciences) within 24 h.
Appropriate internal controls, isotype controls and Fluorescence Minus One (FMO) controls
were used to assign gates. Rat anti-mouse CD16/CD32 (clone 2.4G2; BD) was used for Fc
blockade in mouse flow cytometry experiments. FACS data were analysed using FlowJo
(Tree Star Inc., Oregon). For Intracellular staining, BD Cytofix/Cytoperm™ plus Fixation/
Permeabilization Solution Kit was used according to manufacturer’s instructions. For
cytokine staining, 4h re-stimulation with PMA (50ng/mL) and ionomycin (1mM) (both
Sigma) in the presence of Brefeldin A (GolgiPlug™ (BD) was carried out prior to fixation
and permeabilization. Foxp3 staining was carried out using the kit from eBiosciences as per
manufacturer’s instructions. Relative FoxP3 and BACH2 levels were calculated by dividing
the geometric mean fluorescence intensity (MFI) of patient cells by that of matched healthy
control in each run. For assessment of cell proliferation by flow cytometry, T cells were
stained with CellTrace™ Violet as per manufacturer’s instructions followed by culture in the
presence of anti-CD3 and anti-CD28 (1ug/mL of each) (clones HIT3α and CD28.2,
respectively, both from Biolegend) for five days before live/dead staining and data
acquisition.
In vivo class switch assay
8–10 week old Bach2+/− heterozygous and Bach2+/+ WT mice were i.p. injected with 50 ug
of NP-conjugated chicken gamma globulin (NP-CGG)(Biosearch technologies) in 1:1 Alum
(Thermo Scientific) (vol:vol). Spleens were harvested after 8 days and single cell
Afzali et al. Page 12
Nat Immunol. Author manuscript; available in PMC 2017 November 22.
Author M
anuscriptA
uthor Manuscript
Author M
anuscriptA
uthor Manuscript
suspensions were made by passing the cells through 40 μm strainer followed by surface
staining and flow cytometry as described above.
Quantitative RT-PCR
Total RNA was extracted using TRIzol reagent (Invitrogen) and treated with DNAseI
(Qiagen). RNA was reverse transcribed to cDNA using iScriptcDNA synthesis kit (Bio-Rad)
following the manufacturer’s instructions. Quantitative real-time PCR (qRT-PCR) was
performed in triplicate using Taqman® Universal PCR Master Mix (Applied Biosystems) in
total reaction volumes of 20 μL and thermocycled in a CFX284 TouchTM Real-Time PCR
Detection System (Bio-Rad). The following Taqman gene-specific primer probes were
purchased from Applied Biosystems: human BACH2 (Hs00222364_m1), PRDM1 (Hs00153357_m1), ACTB (Hs99999903_m1) and 18S (Hs99999901_s1), mouse Bach2 (Mm00464379_m1), Prdm1 (Mm00476128_m1), Bcl6 (Mm00477633_m1) and Actb (Mm00607939_s1). Cycle threshold (Ct) values were exported and normalized against the
control probe using the 2−ΔCt method and reported as expression relative to a control
condition.
Silencing of BACH2 and BACH2 over-expression
5 × 10⁶ PBMCs per sample were nucleofected with 300 nM DsiRNA negative control or
predesigned BACH2 DsiRNA (both TriFECTa®, Integrated DNA technologies) using
Amaxa human T cell nucleofector kit (Program-U014, Lonza), according to manufacturer’s
instructions. 24 hours after nucleofection cells were labeled with CellTrace violet cell
proliferation kit (Thermo) and rested for 6 hours in culture before activation of 1 × 10⁵ cells
per 96-well plate with plate bound anti-CD3 (1ug/ml, clone HIT3α) and anti-CD28 (1ug/ml,
clone CD28.2 both BioLegend). Cells were surface stained and proliferation was analyzed
by flow cytometry after 5 days.
Naïve B cells or CD4+ T cells were nucleofected with 2 uM MISSION universal negative
control siRNA (Sigma) or BACH2 siRNA (Hs01_00214431, Sigma) using P3 primary cell
96-well Nucleofector™ kit (Lonza) according to manufacturer’s instructions. Cells were
cultured for 24h at 37°C in the presence of 100 ng/ml human IL-7 before activation for
class-switch recombination as described earlier.
5×10⁶ blasting human CD4+ T cells or were mixed with 2–5μg of either BACH2 or eGFP
mRNA (TriLink) in 50 μl of HyClone™ MaxCyte® buffer and electroporated in OC-100 PA
electroporation chamber using MaxCyte® GT Instrument (Program T-02). After
electroporation cells were incubated 20 min at 37°C in electroporation buffer in 96-well
plates and after that transferred to 12-well plates in complete RPMI containing 100 IU/ml
human IL-2. PRDM1 expression was analyzed after 24 – 48h by qPCR.
Plasmid DNA and point mutagenesis
Wild-type Bach2 cDNA expression vectors pMSCV-IRES-GFP (pMIGR1-Bach2) and
pMSCV-IRES-Thy1.1 DEST (pMIT-Bach2) have been described previously15. Gene
synthesis was performed to achieve an N-terminal fusion of Flag and HA sequences
preceded by a methionine translation initiation codon (MDYKDDDDK and
Afzali et al. Page 13
Nat Immunol. Author manuscript; available in PMC 2017 November 22.
Author M
anuscriptA
uthor Manuscript
Author M
anuscriptA
uthor Manuscript
MYPYDVPDYA, respectively) to the wild-type BACH2 open reading frame. Synthesized
DNA was subcloned into pMIT to generate pMIT-Flag-BACH2 and pMIT-HA-BACH2.
Point mutagenesis to introduce the Bach2T71C (Bach2L24P) and Bach2G2356A (Bach2E786K)
mutations were carried out using Agilent QuickChange II XL Site-directed mutagenesis kit
(Agilent Technologies) according to the manufacturer’s instructions, with the following
primer pairs: Bach2T71C: forward, 5′-CATTGAGGCCCAGGGGGATGTTGGCACAG-3′ and reverse, 5′-CTGTGCCAACATCCCCCTGGGCCTCAATG-3′; Bach2G2356A: forward,
5′-AGAGGTACAATTCTTAGAGGTGTTGCTGGGCACC-3′ and reverse, 5′-
GGTGCCCAGCAACACCTCTAAGAATTGTACCTCT-3′.
Transfection and production of retrovirus
Transfection was carried out in antibiotic-free medium using lipofectamine LTX and Plus
reagent (Invitrogen). Medium was replaced 7 h later. For production of retrovirus, payload
retroviral plasmid was co-transfected with pCL-Eco helper virus plasmid as previously
described54. Transfected cells were harvested and viral supernatant collected 48 h after
transfection.
Retrovirus transduction
Prdm1-YFP BAC Tg CD4+ T cells were activated for 24 h with plate-bound anti-CD3 +
anti-CD28. Activated cells were transduced with supernatants containing retrovirus
encoding Thy1.1 alone (EV) or together with mouse Bach2 or mutant mouse Bach2 conforming to the L24P or E786K mutation, in the presence of polybrene (4 μg/ml) by
centrifugation at 2200 rpm for 50 min at 22°C. Medium was replaced afterwards with fresh
culture medium and cells harvested 48 h after transduction.
Western blotting and FLAG immunoprecipitation (IP)
Clarified protein extracts were prepared by lysis of cell pellets in Pierce™ IP lysis buffer
(ThermoScientific) containing 1x cOmplete Protease Inhibitor cocktail (Roche). Protein
concentrations were quantified (Micro BCA protein assay kit (ThermoScientific) to ensure
equal loading. Proteins were resolved by SDS-PAGE on Any kD™Criterion™ TGX™ gels
(Bio-Rad) and electrotransferred onto nitrocellulose membranes (Bio-Rad). Immunoblotting
was performed using rabbit anti-BACH2 (Abcam), mouse anti-FLAG® M2 (Sigma), mouse
anti-Hsp70 (SantaCruz Biotechnology) and goat anti-mouse IRDye® 800CW (Li-Cor)
following by scanning on an Odyssey imaging system (Li-Cor Biotechnology) or anti-HA-
HRP for development using SuperSignal® West Pico Chemiluminescent Substrate
(ThermoScientific) and imaging on a ChemiDocTM MP Imaging system (Bio-Rad). FLAG
IP was carried out using EZview™ Red Anti-FLAG® M2 Affinity gel (Sigma) according to
manufacturer’s instructions followed by elution using 3X FLAG® Peptide (Sigma).
Confocal microscopy
HEK293T cells (ATCC) were cultured and transfected on poly-L-lysine (Sigma) coated
round cover slips. Primary PBMC were spun onto poly-L-lysine coated cover slides using a
Cytospin3 centrifuge (Shandon). Cells were fixed with 4% paraformaldehyde, permeabilized
with 0.1% TritonX-100 in TBS, blocked with TBS containing 5% horse serum and 0.01%
Afzali et al. Page 14
Nat Immunol. Author manuscript; available in PMC 2017 November 22.
Author M
anuscriptA
uthor Manuscript
Author M
anuscriptA
uthor Manuscript
NaN3 and stained with primary antibodies for 1–2 h at room temperature. Staining with
secondary antibodies was performed for 40 min at room temperature in the dark together
with 1:10000 of Hoechst. Cells were mounted with ProLong Diamond antifade mountant
(LifeTechnologies). The following antibodies and dilutions were used for confocal
microscopy: 1:100 mouse anti-FLAG M2 (Sigma), 1:25 rabbit anti-human BACH2
(Abcam), 1:500 goat anti-mouse IgG-AlexaFluor 488 (LifeTechnologies), 1:500 goat anti-
rabbit IgG-AlexaFluor 568 (LifeTechnologies). Confocal microscopy of immunostained
cells was performed using Leica SP8 inverted 5 channel confocal microscope equipped with
a motorized stage and ultra-sensitive hybrid detectors (Leica Microsystems). The following
laser lines were used: diode for 405 nm, Argon for 488 nm, and DPSS for 561 nm excitation
wavelengths. Microscope configuration was set up for 3D (x, y, z) sequential scanning using
63x objective, and z stacks of 0.3 μm optical slices (total of 10–15 μm) were collected. For
statistical analysis of BACH2 localization, tiled images of transfected cell layer at total cell
number of 200 cells per field were collected. Images were processed using Imaris (Bitplane,
Switzerland) and Huygens (Scientific Volume Imaging, Netherlands) software. The number
of cells containing protein aggregates was determined from at least 3 tiled images. Pearson’s
Correlation Coefficients was calculated using Imaris.
Recombinant protein expression and purification of BACH2 and variants
Synthetic genes with codons optimized for E. coli expression were from Genscript.
BL21(DE3) cells with pET 28 vectors were grown in a fermenter and cells were broken and
initially processed as previously described55. The proteins: full-length human p.BACH21–841
and p.L24P variant; murine p.Bach21–133 and murine p.Bach21–133 L24P all contained an N-
terminal his-tag to facilitate purification (NB The sequence difference between human
p.BACH21–133 and murine p.Bach21–133 is at one position, amino acid 8, which is Asp in
human and Ala in murine). Human WT p.BACH21–841 was extracted from cell lysate with
100 mM sodium bicarbonate, pH 9.5 containing 2 M urea and the L24P variant with 8 M
guanidine-HCl. WT proteins were expressed as a soluble protein but L24P variants were
insoluble and extracted with 8M guanidine-HCl. Proteins were purified using a combination
of Ni-chelate and size exclusion chromatographies using Ni-chelate Sepharose and
Sephadex S200 (both from GE Healthcare). The L24P variants were folded by dialysis
against 4 M urea and then stepped through lower concentrations until the urea was removed.
DTT was present in all buffers to keep proteins reduced.
Analytical ultracentrifugation
A Beckman Optima XL-I analytical ultracentrifuge, absorption optics, an An-60 Ti rotor and
standard double-sector centerpiece cells were used. Equilibrium measurements were at 20°C
and concentration profiles recorded after 16 h at 20,000 rpm (BACH2133) or 10,000 rpm
(BACH2841). Baselines were established by over-speeding at 45,000 rpm for 3 h. Data (the
average of eight scans collected using a radial step size of 0.001 cm) were analyzed using
the standard Optima XL-I data analysis software. Sedimentation velocity experiments were
performed at 40,000 rpm with scans recorded every 6 minutes for 3 h. Protein partial
specific volumes, calculated from the amino acid compositions, and solvent densities were
estimated using the program SEDNTERP (http://www.rasmb.bbri.org/).
Afzali et al. Page 15
Nat Immunol. Author manuscript; available in PMC 2017 November 22.
Author M
anuscriptA
uthor Manuscript
Author M
anuscriptA
uthor Manuscript
Protein concentrations
Estimated from amino compositions: absorbencies at 280 nm of 1 mg/ml of mBach2133 and
hBACH2841 of 0.69 and 0.41 respectively, were used.
Analysis of mutations
Conservation scores for mutated sites (PhyloP, PhastCons and GERP) were obtained from
the UCSC genome browser (GRCh37/hg19). Polyphen2, SIFT, LRT, MutationAssessor
Functional Impact, MutationTaster and CADD scaled scores were derived using dbNSFP, as
described56,57. The CADD-based mutation significance cutoff (MSC) at 99% confidence
interval (CI) was calculated as described58.
Curation of haploinsufficient and autosomal recessive disease genes and haplosufficient genes
Haploinsufficient genes were retrieved from PubMed and Online Mendelian Inheritance in
Man (OMIM), using the semi-automated method of Dang et al.59. Searches were restricted
to the period from 12th November 2007 to the 25th of October 2015 and merged with the
existing dataset prior to 12th November 200759. All retrieved items were manually curated
by two independent physicians, to ensure that only true positives (genes causing
haploinsufficient disease) were kept for further analysis. Autosomal recessive genes were
identified by downloading the OMIM database and extracting all entries inherited in an
autosomal recessive fashion. Haplosufficient genes were obtained from a list of high-
confident predictions (Pr(HI)<0.05) in Huang et al.38. The predictions were further screened
by removing those that match HI genes (3 genes in total). Functional annotation analysis for
genes was carried out using Gene Ontology enrichment analysis via DAVID60,61 and
Ingenuity Pathway Analysis (Qiagen).
Super-enhancer (SE) structures
Sequencing data were downloaded from GEO. URLs for data used in this manuscript are
listed in table S4. Reads were mapped to hg19 with bowtie0.12.862. The HOMER suite of
programs63 was used to call super enhancers and typical enhancers following the guidelines
presented by Whyte et al64. Enhancers were assigned to the closest genes with PAPST65.
K27Ac signal graphs were created using data generated with HOMER.
We obtained estimated probabilities of human gene intolerance to loss of function mutations
from the EXAC database39 (n=18,225 genes, release 0.3.1: ftp://ftp.broadinstitute.org/pub/
ExAC_release/release0.3.1/functional_gene_constraint/
fordist_cleaned_exac_r03_march16_z_pli_rec_null_data.txt; accessed 2016 Aug 18). We
obtained super-enhancers calls (n=65,950 super-enhancers from 99 tissues/cells) from
dbSuper41 (http://bioinfo.au.tsinghua.edu.cn/dbsuper/data/bed/hg19/all_hg19_bed.bed;
accessed 2016 Aug 17). These super-enhancers were ranked according to signal intensity
within each cell/tissue. We assigned each super-enhancer to the closest protein-coding gene
promoter within 50kb66 (ENSEMBL GRCh37.75; http://ftp.ensembl.org/pub/release-75/gtf/
homo_sapiens/Homo_sapiens.GRCh37.75.gtf.gz; accessed 2016 Aug 18) using
BEDTOOLS67. If a gene was near multiple super-enhancers, we assigned it the highest
observed super-enhancer rank. Finally, to explore the relationship between pLI score and
Afzali et al. Page 16
Nat Immunol. Author manuscript; available in PMC 2017 November 22.
Author M
anuscriptA
uthor Manuscript
Author M
anuscriptA
uthor Manuscript
enhancer architecture, we combined this gene-centric table of super-enhancer ranks with the
EXAC pLI table. Specifically, we determined the median pLI score observed with varying
thresholds of super-enhancer rank. To explore the specific role of transcription factors, we
obtained a comprehensive list of human transcription factors from AnimalTFDB68 (http://
www.bioguo.org/AnimalTFDB/download/Homo_sapiens_TF_EnsemblID.txt; accessed
2016 Sep 14). We then determined the fraction of transcription factors with varying
thresholds of super-enhancer rank. We created the plots using the R project.
GWAS data (gwas_catalog_v1.0) were downloaded from http://www.ebi.ac.uk/gwas/docs/
downloads. The hg38 SNP coordinates were converted to hg19 coordinates with liftOver
from the UCSC Genome Browser (http://hgdownload.cse.ucsc.edu/
downloads.html#source_downloads). Genomic region overlapping analyses were conducted
with BEDTools67. A SNP was assigned to a gene if its co-ordinate was within the gene body
(transcription start to transcription end, as defined by RefSeq hg19). HS and HI genes with
GWAS associations are listed in table S5. Fisher exact tests were carried out using R3.2.0.
Data extraction, data reformatting, and data preparation for analysis were all facilitated with
customized scripts of Bash, Python, and R.
Data analysis and visualization
Data were analyzed using Microsoft Excel and GraphPad Prism (Graph Pad Software) and
visualized using CLC Main Workbench 7 (CLCbio, Qiagen) and DataGraph 3.2 (Visual
Data Tools, Inc). Molecular graphics and analyses were performed with the UCSF Chimera
package. Chimera is developed by the Resource for Biocomputing, Visualization, and
Informatics at the University of California, San Francisco (supported by NIGMS P41-
GM103311). Statistical analyses were performed using appropriate parametric and non-
parametric tests as appropriate. Multiple datasets were compared by repeated measures
ANOVA. Statistical analysis of data in contingency tables was carried out using the Fisher
exact test. Two-tailed p-values of <0.05 were considered statistically significant throughout.
Data availability
The data that support the findings of this study are available from the corresponding author
upon request.
Supplementary Material
Refer to Web version on PubMed Central for supplementary material.
Acknowledgments
We thank the patients and healthy donors for their support and Helen Matthews and Clare Neurwirth for coordinating control blood samples. This research was supported by the Intramural Research Programs of NIAMS, the Division of Intramural Research, National Institute of Allergy and Infectious Diseases, Clinical Center, and National Human Genome Research Institute, National Institutes of Health. This project has been funded in whole or in part with federal funds from the National Cancer Institute, National Institutes of Health, under Contract No. HHSN261200800001E. The content of this publication does not necessarily reflect the views or policies of the Department of Health and Human Services, nor does mention of trade names, commercial products, or organizations imply endorsement by the U.S. Government. This work was supported by Crohn’s & Colitis Foundation of America (A.L., H.H.U.), National Institutes of Health (KHL125593A awarded to M.K.), Sigrid Juselius and Emil Aaltonen Foundations (both J.G.), Wellcome Trust (097261/Z/11/Z awarded to B.A.,
Afzali et al. Page 17
Nat Immunol. Author manuscript; available in PMC 2017 November 22.
Author M
anuscriptA
uthor Manuscript
Author M
anuscriptA
uthor Manuscript

105663/Z/14/Z awarded to R.R.), European Molecular Biology Organization (ALTF 11602012 awarded to A.N.H.), a Marie Curie fellowship (FP7-PEOPLE-2012-IEF, proposal 330621 awarded to A.N.H.), Imperial College National Institute for Health Research (NIHR) Biomedical Research Centre (N.C. and P.K.), Oxford NIHR Biomedical Research Centre (H.H.U.), Chelsea & Westminster Hospital Charity (C.O’B.), UK Biotechnology and Biological Sciences Research Council (BB/N0077941/1 awarded to R.R and M.F.S.), Cancer Research UK (C52623/A22597 to R.R.), Westminster Medical School Research Trust (P.K), Biotechnology and Biological Sciences Research Council (BBS/E/B/000C0407 awarded to M.A.L and I.V) and Cambridge Trust (I.V), Leona M. and Harry B. Helmsley Charitable Trust and ESPGHAN (H.H.U.), the MRC Clinical Sciences Centre (CSC) (T.J.A.) and by the CSC Genomics Core Laboratory and by MRC transition funding (T.J.A.). We acknowledge the contribution of the BRC Gastrointestinal biobank/Oxford IBD cohort study, which is supported by the NIHR Oxford Biomedical Research Centre. We thank G. Vahedi, E. Mathé, S. Parker, C. Kanellopoulou and S. Muljo for critically reading the manuscript, J. Kabat for his help on confocal image analysis and S.S. De Ravin and H. Malech for their advice in the use of MaxCyte. Molecular graphics and analyses were performed with the UCSF Chimera package, developed by the Resource for Biocomputing, Visualization, and Informatics at the University of California, San Francisco (supported by NIGMS P41-GM103311). This study utilized high-performance computational capabilities of Helix Systems at the NIH, Bethesda, MD (http://helix.nih.gov).
References
1. Bousfiha A, et al. The 2015 IUIS Phenotypic Classification for Primary Immunodeficiencies. J Clin Immunol. 2015; 35:727–738. [PubMed: 26445875]
2. Picard C, et al. Primary Immunodeficiency Diseases: an Update on the Classification from the International Union of Immunological Societies Expert Committee for Primary Immunodeficiency 2015. J Clin Immunol. 2015; 35:696–726. [PubMed: 26482257]
3. Arason GJ, Jorgensen GH, Ludviksson BR. Primary immunodeficiency and autoimmunity: lessons from human diseases. Scand J Immunol. 2010; 71:317–328. [PubMed: 20500682]
4. Notarangelo LD. Primary immunodeficiencies. J Allergy Clin Immunol. 2010; 125:S182–94. [PubMed: 20042228]
5. Conley ME, Casanova J-L. Discovery of single-gene inborn errors of immunity by next generation sequencing. Curr Opin Immunol. 2014; 30:17–23. [PubMed: 24886697]
6. Deau M-C, et al. A human immunodeficiency caused by mutations in the PIK3R1 gene. J Clin Invest. 2015; 125:1764–1765. [PubMed: 25831445]
7. Lo B, et al. Patients with LRBA deficiency show CTLA4 loss and immune dysregulation responsive to abatacept therapy. Science. 2015; 349:436–440. [PubMed: 26206937]
8. Cunningham-Rundles C. The many faces of common variable immunodeficiency. Hematology Am Soc Hematol Educ Program. 2012; 2012:301–305. [PubMed: 23233596]
9. Rieux-Laucat F, Casanova J-L. Immunology. Autoimmunity by haploinsufficiency. Science. 2014; 345:1560–1561. [PubMed: 25258064]
10. Lo B, et al. CHAI and LATAIE: new genetic diseases of CTLA-4 checkpoint insufficiency. Blood. 2016; 128:1037–1042. [PubMed: 27418640]
11. Vahedi G, et al. STATs shape the active enhancer landscape of T cell populations. Cell. 2012; 151:981–993. [PubMed: 23178119]
12. Whyte WA, et al. Master Transcription Factors and Mediator Establish Super-Enhancers at Key Cell Identity Genes. Cell. 2013; 153:307–319. [PubMed: 23582322]
13. Lovén J, et al. Selective inhibition of tumor oncogenes by disruption of super-enhancers. Cell. 2013; 153:320–334. [PubMed: 23582323]
14. Vahedi G, et al. Super-enhancers delineate disease-associated regulatory nodes in T cells. Nature. 2015; 520:558–562. [PubMed: 25686607]
15. Roychoudhuri R, et al. BACH2 represses effector programs to stabilize T(reg)-mediated immune homeostasis. Nature. 2013; 498:506–510. [PubMed: 23728300]
16. Igarashi K, Ochiai K, Itoh-Nakadai A, Muto A. Orchestration of plasma cell differentiation by Bach2 and its gene regulatory network. Immunol Rev. 2014; 261:116–125. [PubMed: 25123280]
17. Ferreira MAR, et al. Identification of IL6R and chromosome 11q13.5 as risk loci for asthma. Lancet. 2011; 378:1006–1014. [PubMed: 21907864]
18. Cooper JD, et al. Meta-analysis of genome-wide association study data identifies additional type 1 diabetes risk loci. Nat Genet. 2008; 40:1399–1401. [PubMed: 18978792]
Afzali et al. Page 18
Nat Immunol. Author manuscript; available in PMC 2017 November 22.
Author M
anuscriptA
uthor Manuscript
Author M
anuscriptA
uthor Manuscript
19. Franke A, et al. Genome-wide meta-analysis increases to 71 the number of confirmed Crohn's disease susceptibility loci. Nat Genet. 2010; 42:1118–1125. [PubMed: 21102463]
20. Dubois PCA, et al. Multiple common variants for celiac disease influencing immune gene expression. Nat Genet. 2010; 42:295–302. [PubMed: 20190752]
21. Jin Y, et al. Genome-wide association analyses identify 13 new susceptibility loci for generalized vitiligo. Nat Genet. 2012; 44:676–680. [PubMed: 22561518]
22. International Multiple Sclerosis Genetics Consortium. Genetic risk and a primary role for cell-mediated immune mechanisms in multiple sclerosis. Nature. 2011; 476:214–219. [PubMed: 21833088]
23. Nakayama Y, et al. A limited number of genes are involved in the differentiation of germinal center B cells. J Cell Biochem. 2006; 99:1308–1325. [PubMed: 16795035]
24. Ochiai K, et al. Plasmacytic transcription factor Blimp-1 is repressed by Bach2 in B cells. J Biol Chem. 2006; 281:38226–38234. [PubMed: 17046816]
25. Muto A, et al. The transcriptional programme of antibody class switching involves the repressor Bach2. Nature. 2004; 429:566–571. [PubMed: 15152264]
26. Kuwahara M, et al. The Menin-Bach2 axis is critical for regulating CD4 T-cell senescence and cytokine homeostasis. Nat Commun. 2014; 5:3555. [PubMed: 24694524]
27. Povoleri GAM, et al. Thymic versus induced regulatory T cells - who regulates the regulators? Front Immunol. 2013; 4:169. [PubMed: 23818888]
28. Rosbrook GO, Stead MA, Carr SB, Wright SC. The structure of the Bach2 POZ-domain dimer reveals an intersubunit disulfide bond. Acta Crystallogr. D Biol Crystallogr. 2012; 68:26–34. [PubMed: 22194330]
29. Uhlig HH, et al. The diagnostic approach to monogenic very early onset inflammatory bowel disease. Gastroenterology. 2014; 147:990–1007.e3. [PubMed: 25058236]
30. Deane S, Selmi C, Naguwa SM, Teuber SS, Gershwin ME. Common variable immunodeficiency: etiological and treatment issues. Int Arch Allergy Immunol. 2009; 150:311–324. [PubMed: 19571563]
31. Salzer U, Grimbacher B. Monogenetic defects in common variable immunodeficiency: what can we learn about terminal B cell differentiation? Curr Opin Rheumatol. 2006; 18:377–382. [PubMed: 16763458]
32. Iwata M, et al. Retinoic acid imprints gut-homing specificity on T cells. Immunity. 2004; 21:527–538. [PubMed: 15485630]
33. Cassani B, et al. Gut-Tropic T Cells That Express Integrin α4β7 and CCR9 Are Required for Induction of Oral Immune Tolerance in Mice. Gastroenterology. 2011; 141:2109–2118. [PubMed: 21925467]
34. Igarashi K, Ochiai K, Muto A. Architecture and dynamics of the transcription factor network that regulates B-to-plasma cell differentiation. J Biochem. 2007; 141:783–789. [PubMed: 17569706]
35. Seidman JG, Seidman C. Transcription factor haploinsufficiency: when half a loaf is not enough. J Clin Invest. 2002; 109:451–455. [PubMed: 11854316]
36. Hnisz D, et al. Super-enhancers in the control of cell identity and disease. Cell. 2013; 155:934–947. [PubMed: 24119843]
37. Qian J, et al. B Cell Super-Enhancers and Regulatory Clusters Recruit AID Tumorigenic Activity. Cell. 2014; 159:1524–1537. [PubMed: 25483777]
38. Huang N, Lee I, Marcotte EM, Hurles ME. Characterising and predicting haploinsufficiency in the human genome. PLoS Genet. 2010; 6:e1001154. [PubMed: 20976243]
39. Lek M, et al. Analysis of protein-coding genetic variation in 60,706 humans. Nature. 2016; 536:285–291. [PubMed: 27535533]
40. Creyghton MP, et al. Histone H3K27ac separates active from poised enhancers and predicts developmental state. Proc Natl Acad Sci. 2010; 107:21931–21936. [PubMed: 21106759]
41. Khan A, Zhang X. dbSUPER: a database of super-enhancers in mouse and human genome. Nucleic Acids Res. 2016; 44:D164–71. [PubMed: 26438538]
42. Parker SCJ, et al. Chromatin stretch enhancer states drive cell-specific gene regulation and harbor human disease risk variants. Proc Natl Acad Sci. 2013; 110:17921–17926. [PubMed: 24127591]
Afzali et al. Page 19
Nat Immunol. Author manuscript; available in PMC 2017 November 22.
Author M
anuscriptA
uthor Manuscript
Author M
anuscriptA
uthor Manuscript

43. Roychoudhuri R, et al. BACH2 regulates CD8(+) T cell differentiation by controlling access of AP-1 factors to enhancers. Nat Immunol. 2016; 17:851–860. [PubMed: 27158840]
44. Shinnakasu R, et al. Regulated selection of germinal-center cells into the memory B cell compartment. Nat Immunol. 2016; 17:861–869. [PubMed: 27158841]
45. 1000 Genomes Project Consortium. A map of human genome variation from population-scale sequencing. Nature. 2010; 467:1061–1073. [PubMed: 20981092]
46. Abolhassani H, Aghamohammadi A, Hammarstrom L. Monogenic mutations associated with IgA deficiency. Expert Rev Clin Immunol. 2016; 12:1–15. [PubMed: 26561053]
47. Johnson ML, et al. Age-related changes in serum immunoglobulins in patients with familial IgA deficiency and common variable immunodeficiency (CVID). Clin Exp Immunol. 1997; 108:477–483. [PubMed: 9182895]
48. Aghamohammadi A, et al. Progression of selective IgA deficiency to common variable immunodeficiency. Int Arch Allergy Immunol. 2008; 147:87–92. [PubMed: 18520152]
49. Rutishauser RL, et al. Transcriptional repressor Blimp-1 promotes CD8(+) T cell terminal differentiation and represses the acquisition of central memory T cell properties. Immunity. 2009; 31:296–308. [PubMed: 19664941]
50. Khoder A, et al. Regulatory B cells are enriched within the IgM memory and transitional subsets in healthy donors but are deficient in chronic GVHD. Blood. 2014; 124:2034–2045. [PubMed: 25051962]
51. Li H, Durbin R. Fast and accurate short read alignment with Burrows-Wheeler transform. Bioinformatics. 2009; 25:1754–1760. [PubMed: 19451168]
52. McKenna A, et al. The Genome Analysis Toolkit: a MapReduce framework for analyzing next-generation DNA sequencing data. Genome Res. 2010; 20:1297–1303. [PubMed: 20644199]
53. Wang K, Li M, Hakonarson H. ANNOVAR: functional annotation of genetic variants from high-throughput sequencing data. Nucleic Acids Res. 2010; 38:e164–e164. [PubMed: 20601685]
54. Naviaux RK, Costanzi E, Haas M, Verma IM. The pCL vector system: rapid production of helper-free, high-titer, recombinant retroviruses. J Virol. 1996; 70:5701–5705. [PubMed: 8764092]
55. Wingfield PT, et al. Biophysical and functional characterization of full-length, recombinant human tissue inhibitor of metalloproteinases-2 (TIMP-2) produced in Escherichia coli. Comparison of wild type and amino-terminal alanine appended variant with implications for the mechanism of TIMP functions. J Biol Chem. 1999; 274:21362–21368. [PubMed: 10409697]
56. Liu X, Jian X, Boerwinkle E. dbNSFP: a lightweight database of human nonsynonymous SNPs and their functional predictions. Hum Mutat. 2011; 32:894–899. [PubMed: 21520341]
57. Liu X, Jian X, Boerwinkle E. dbNSFP v2.0: A Database of Human Non‐synonymous SNVs and Their Functional Predictions and Annotations. Hum Mutat. 2013; 34:E2393–E2402. [PubMed: 23843252]
58. Itan Y, et al. The mutation significance cutoff: gene-level thresholds for variant predictions. Nature Methods. 2016; 13:109–110. [PubMed: 26820543]
59. Dang VT, Kassahn KS, Marcos AE, Ragan MA. Identification of human haploinsufficient genes and their genomic proximity to segmental duplications. Eur J Hum Genet. 2008; 16:1350–1357. [PubMed: 18523451]
60. Huang DW, Sherman BT, Lempicki RA. Systematic and integrative analysis of large gene lists using DAVID bioinformatics resources. Nature Protocols. 2009; 4:44–57. [PubMed: 19131956]
61. Huang DW, Sherman BT, Lempicki RA. Bioinformatics enrichment tools: paths toward the comprehensive functional analysis of large gene lists. Nucleic Acids Res. 2009; 37:1–13. [PubMed: 19033363]
62. Langmead B, Trapnell C, Pop M, Salzberg SL. Ultrafast and memory-efficient alignment of short DNA sequences to the human genome. Genome Biol. 2009; 10:R25. [PubMed: 19261174]
63. Heinz S, et al. Simple combinations of lineage-determining transcription factors prime cis-regulatory elements required for macrophage and B cell identities. Mol Cell. 2010; 38:576–589. [PubMed: 20513432]
64. Whyte WA, et al. Master Transcription Factors and Mediator Establish Super-Enhancers at Key Cell Identity Genes. Cell. 2013; 153:307–319. [PubMed: 23582322]
Afzali et al. Page 20
Nat Immunol. Author manuscript; available in PMC 2017 November 22.
Author M
anuscriptA
uthor Manuscript
Author M
anuscriptA
uthor Manuscript

65. Bible PW, et al. PAPST, a User Friendly and Powerful Java Platform for ChIP-Seq Peak Co-Localization Analysis and Beyond. PLoS ONE. 2015; 10:e0127285. [PubMed: 25970601]
66. Aken BL, et al. The Ensembl gene annotation system. Database (Oxford). 2016; 2016:baw093. [PubMed: 27337980]
67. Quinlan AR, Hall IM. BEDTools: a flexible suite of utilities for comparing genomic features. Bioinformatics. 2010; 26:841–842. [PubMed: 20110278]
68. Zhang H-M, et al. AnimalTFDB: a comprehensive animal transcription factor database. Nucleic Acids Res. 2012; 40:D144–9. [PubMed: 22080564]
69. Hart M, et al. Loss of discrete memory B cell subsets is associated with impaired immunization responses in HIV-1 infection and may be a risk factor for invasive pneumococcal disease. J Immunol. 2007; 178:8212–8220. [PubMed: 17548660]
70. Kircher M, et al. A general framework for estimating the relative pathogenicity of human genetic variants. Nat Genet. 2014; 46:310–315. [PubMed: 24487276]
Afzali et al. Page 21
Nat Immunol. Author manuscript; available in PMC 2017 November 22.
Author M
anuscriptA
uthor Manuscript
Author M
anuscriptA
uthor Manuscript

Figure 1. Pedigrees and phenotype of patients with mutations in BACH2(a) Pedigrees of two families with heterozygous missense coding mutations in BACH2,
resulting in L24P (left) and E788K (right) amino acid substitutions. Shown are affected
heterozygotes (filled symbols) and unaffected family members (open symbols). Arrows
indicate probands; WT = wild-type allele; Mut = mutant allele. (b) Sanger sequencing
chromatograms of the affected individuals in both families. For each individual, the two
alleles of the sequenced region of BACH2 and base positions are shown above the
chromatograms. Subject A.II.1 had a heterozygous T to C mutation at coding position 71
Afzali et al. Page 22
Nat Immunol. Author manuscript; available in PMC 2017 November 22.
Author M
anuscriptA
uthor Manuscript
Author M
anuscriptA
uthor Manuscript
whereas patients B.II.1 and B.III.2 were heterozygous for G to A base substitutions at
position 2362. (c) Computerized tomography scans showing splenomegaly (arrow in upper
left) and pulmonary nodules (red circle in upper right) in patient A.II.1 and bronchiectasis
(dilated airways; arrow in lower left) and fibrosis (“honeycombing” circled in lower right) in
subject B.II.1. (d) Photomicrograph of a hematoxylin and eosin-stained section from a
colonic biopsy from patient A.II.1 showing crypt branching and lymphocytic inflammatory
infiltrate around the crypts. (e) Immunofluorescent staining of colonic biopsy from patient
A.II.1, control IBD patient and healthy control for nuclear DNA (DAPI, blue), CD3 (green)
and FoxP3 (orange). Shown are representative sections (left) and cumulative (mean ± sem)
quantification (right) from four low power fields per patient (500–3000 CD3+ cells counted
per low power field); white scale bar = 100 μm in main image and 2 μm in insets. *p<0.05,
**p<0.01 by t-test.
Afzali et al. Page 23
Nat Immunol. Author manuscript; available in PMC 2017 November 22.
Author M
anuscriptA
uthor Manuscript
Author M
anuscriptA
uthor Manuscript

Figure 2. Immunophenotype of patients with mutations in BACH2(a–c) Treg cells (a), T cell (b) and B cell (c) immunophenotype of patient and healthy control
peripheral blood cells. Shown are total FoxP3 expression (mean fluorescent intensity (MFI))
within CD4+CD25hiCD127lo cells (a), expression of the transcription factor T-bet and gut-
homing receptors (CCR9 and β7-integrin) in bulk CD4+ T cells (b) and total memory (c, left) and class-switched memory B cells (c, right) in bulk B cells. (d-e) Plasmablast
formation (d, left panels), IgG class switch recombination (d, right panels) and Ig secretion
(e) in naïve patient and healthy control B cells activated in vitro as indicated. Shown are
Afzali et al. Page 24
Nat Immunol. Author manuscript; available in PMC 2017 November 22.
Author M
anuscriptA
uthor Manuscript
Author M
anuscriptA
uthor Manuscript

representative flow cytometry plots and cumulative data. N.D. = not detected; very low
values are shown above the bars for clarity. In (a-d) representative flow cytometry plots are
shown together with cumulative data from all patients and matched controls. Note that IgG
secretion in (e) does not include patient B.III.2, who has normal IgG secretion. Bars show
mean ± sem throughout. *p<0.05 **p<0.01 ***p<0.001 by t-test (a-c), one-way ANOVA (d)
and Kruskal-Wallis test (e).
Afzali et al. Page 25
Nat Immunol. Author manuscript; available in PMC 2017 November 22.
Author M
anuscriptA
uthor Manuscript
Author M
anuscriptA
uthor Manuscript

Figure 3. The cellular phenotype is attributable to reduced BACH2 protein expression(a) BACH2 protein expression in primary immune cells of patients and controls. Shown are
representative flow cytometry plots with MFIs indicated (left panels) and cumulative
BACH2 protein expression (right panels) from patients relative to controls. (b) Cumulative
BACH2 mRNA expression from naïve B cells of patients and controls. (c) Representative
immunoblot for Flag and Hsp70 from lysates of HEK293T cells transfected with empty
vector (EV), Flag-tagged WT or mutant murine Bach2 (L24P or E786K, the murine
equivalent of E788K). Shown are a representative blot (left) and cumulative quantifications
Afzali et al. Page 26
Nat Immunol. Author manuscript; available in PMC 2017 November 22.
Author M
anuscriptA
uthor Manuscript
Author M
anuscriptA
uthor Manuscript

from n = 5 experiments (right). (d) PRDM1 mRNA expression in naïve B cells from patients
and healthy controls: cumulative data. (e and f) PRDM1 mRNA expression in CD4+ T
lymphocytes of healthy controls and patients transfected with either control or BACH2 (e)
and healthy donor CD4+ T lymphocytes transfected with control or BACH2 RNAi (f). (g)
Plasmablast formation, IgG class switch recombination and IgA secretion in naïve healthy
control B cells transfected with control RNAi or RNAi specific for BACH2 and activated in vitro as shown. Shown are representative flow cytometry examples and cumulative data (n =
5, 5 and 4 experiments, respectively). Bars show mean ± sem; *p<0.05, **p<0.01,
***p<0.001, ****p<0.0001 by t-test (a, d), Wilcoxon test (f) and ANOVA (c, e and g).
Afzali et al. Page 27
Nat Immunol. Author manuscript; available in PMC 2017 November 22.
Author M
anuscriptA
uthor Manuscript
Author M
anuscriptA
uthor Manuscript

Figure 4. BACH2 mutations produce unstable proteins(a) Domain schematic of BACH2 protein and point substitutions in patients. BTB/POZ, BR-
C, ttk and bab or Pox virus and Zinc finger domain; bZIP, basic leucine zipper; NES, nuclear
export signal. (b), Ribbon representations of BACH2 POZ domain (crystal structure form II,
PDB: 3OHV); wild-type protein (above) with expanded and rotated interface view (below);
yellow, intermolecular disulfide at position 20; orange, leucine residues at position 24. (c),
(top) WT POZ domain dimer interface (PDB: 3OHV); (bottom) homology model of
BACH2L24P: WT POZ hetero-dimer, illustrating local changes. In each, one monomer is
Afzali et al. Page 28
Nat Immunol. Author manuscript; available in PMC 2017 November 22.
Author M
anuscriptA
uthor Manuscript
Author M
anuscriptA
uthor Manuscript

rendered as a partially transparent hydrophobicity surface (orange = hydrophobic, white =
intermediate, blue = hydrophilic) and the other as a ribbon (green); selected side chains are
shown as sticks. Cys20 (yellow) and Ile23, Leu24, and Leu27 (all orange) form a
hydrophobic patch on α-helix-1; two of these patches are in close contact at the WT dimer
interface. N.B. the lower diagram is not meant to represent the structure accurately but is
shown merely to indicate regional changes. (d–e) Analytical ultracentrifugation of purified
wild-type (WT) p.BACH2 (d) and mutant p.BACH2L24P (e) BTB/POZ domain;
sedimentation direction is left to right; M = sample meniscus. WT protein is dimeric (35
kDa), as determined by sedimentation equilibrium measurements (shown in d, right),
migrating with single boundary with sedimentation coefficient (S) of 2.6. The mutant
exhibits several boundaries (S values from 4 to 18), indicating heterogeneous large protein
aggregates (e). (f) Representative confocal microscopy of primary lymphocytes from healthy
control and patient B.II.1 stained for BACH2 (green) and Hoechst (blue); arrows highlight
cytoplasmic aggregates. Scale bars: 5μm in main, 2μm in inset. Bars show quantification
(mean ± sem, n=3 experiments) of cells containing aggregates per high power field (HPF)
and BACH2 nuclear localization. *p<0.05 by t-test.
Afzali et al. Page 29
Nat Immunol. Author manuscript; available in PMC 2017 November 22.
Author M
anuscriptA
uthor Manuscript
Author M
anuscriptA
uthor Manuscript
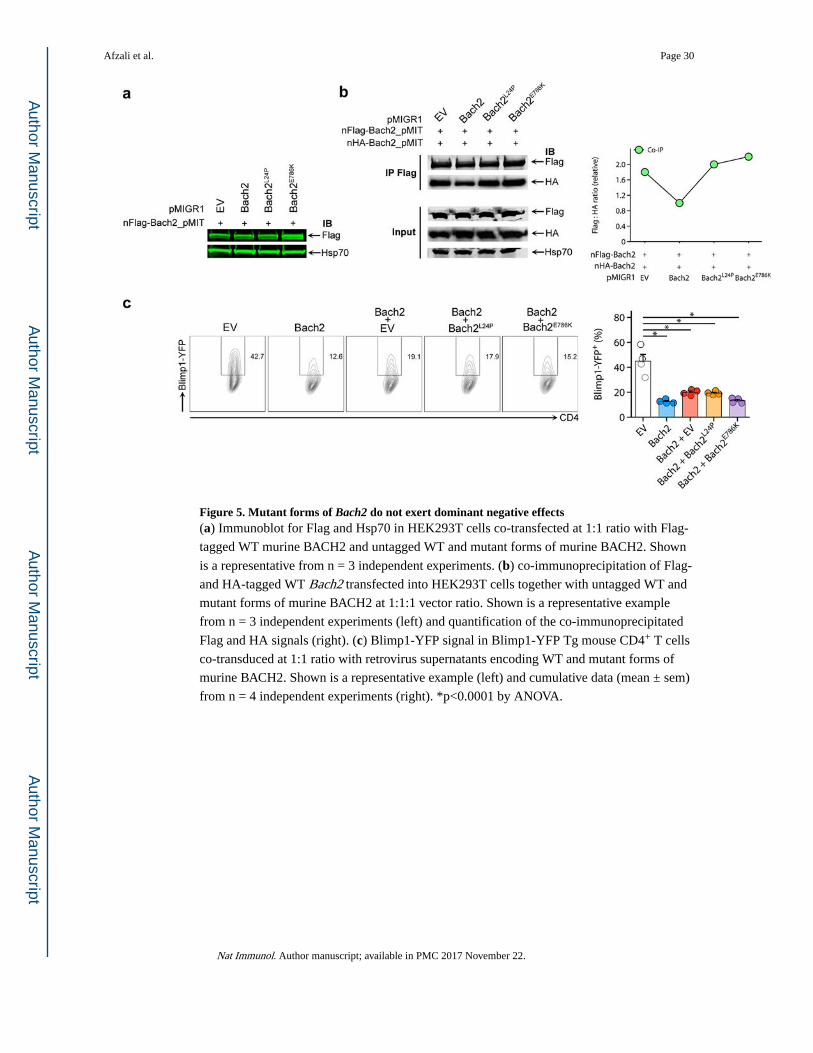
Figure 5. Mutant forms of Bach2 do not exert dominant negative effects(a) Immunoblot for Flag and Hsp70 in HEK293T cells co-transfected at 1:1 ratio with Flag-
tagged WT murine BACH2 and untagged WT and mutant forms of murine BACH2. Shown
is a representative from n = 3 independent experiments. (b) co-immunoprecipitation of Flag-
and HA-tagged WT Bach2 transfected into HEK293T cells together with untagged WT and
mutant forms of murine BACH2 at 1:1:1 vector ratio. Shown is a representative example
from n = 3 independent experiments (left) and quantification of the co-immunoprecipitated
Flag and HA signals (right). (c) Blimp1-YFP signal in Blimp1-YFP Tg mouse CD4+ T cells
co-transduced at 1:1 ratio with retrovirus supernatants encoding WT and mutant forms of
murine BACH2. Shown is a representative example (left) and cumulative data (mean ± sem)
from n = 4 independent experiments (right). *p<0.0001 by ANOVA.
Afzali et al. Page 30
Nat Immunol. Author manuscript; available in PMC 2017 November 22.
Author M
anuscriptA
uthor Manuscript
Author M
anuscriptA
uthor Manuscript

Figure 6. Bach2 haploinsufficient mice have abnormal B cell differentiation and Treg cell numbers(a) Expression of Bach2 mRNA in B cells of Bach2+/+ and Bach2+/– mice. (b) Bach2
protein expression in splenic naïve B cells of Bach2+/+ and Bach2+/– mice. Shown is a
representative example (left) and cumulative quantification (mean ± sem) (right) from n=3
independent experiments. (c–e) Flow cytometry analysis of CD4+ splenocytes in Bach2+/+
and Bach2+/– mice showing percentage Foxp3+ (c), CCR9+ (d) and β7-integrin+ (e) cells. (f) IgM and IgG1 staining of B cells (upper panels) and plasma cells (lower panels) in
Afzali et al. Page 31
Nat Immunol. Author manuscript; available in PMC 2017 November 22.
Author M
anuscriptA
uthor Manuscript
Author M
anuscriptA
uthor Manuscript

splenocytes of Bach2+/+ and Bach2+/– mice 8 days following immunization with 4-
Hydroxy-3-nitrophenylacetyl hapten-conjugated chicken gamma globulin (NP-CGG) in
alum. (g) B220+Ki67+Bcl6+ germinal center B cells in splenocytes of Bach2+/+ and
Bach2+/– mice 8 days after immunization with NP-CGG in alum. Shown in (c-f) are
representative flow cytometry plots together with bar charts (mean ± sem). In vivo
experiments were carried out twice. *p<0.05, **p<0.01, ***p<0.001 by t-test (a-b), one-
way ANOVA (f) and Mann-Whitney U-test (all other panels).
Afzali et al. Page 32
Nat Immunol. Author manuscript; available in PMC 2017 November 22.
Author M
anuscriptA
uthor Manuscript
Author M
anuscriptA
uthor Manuscript
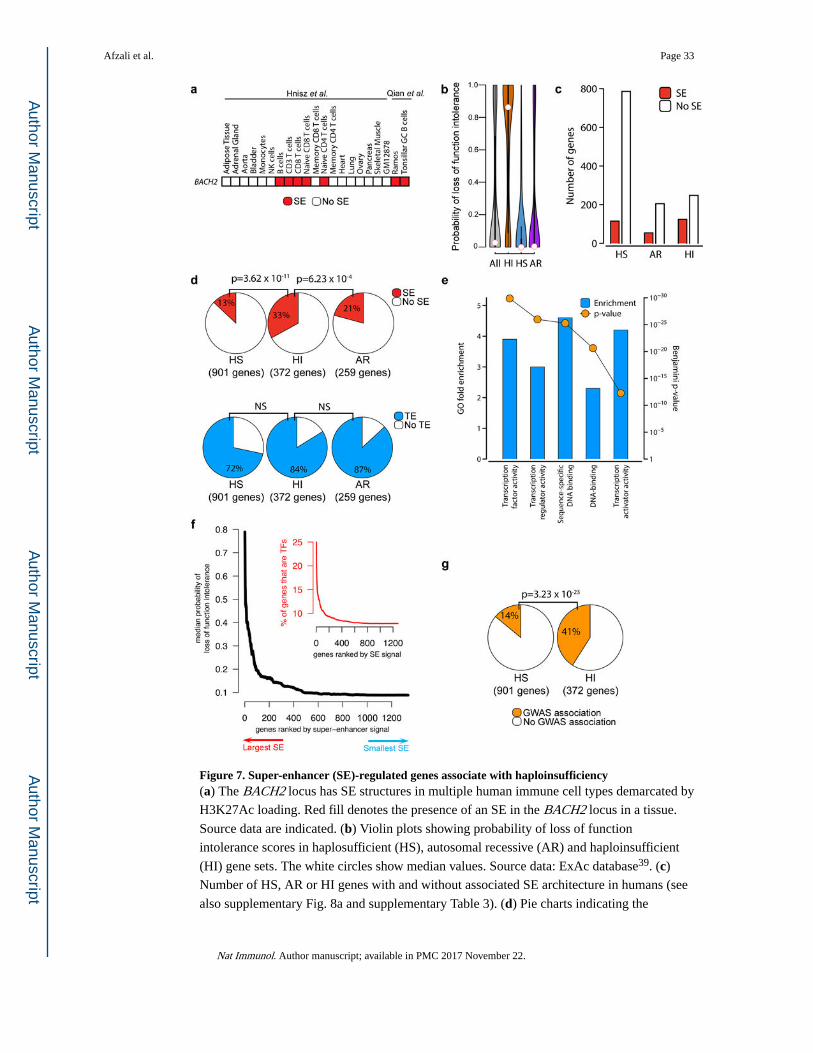
Figure 7. Super-enhancer (SE)-regulated genes associate with haploinsufficiency(a) The BACH2 locus has SE structures in multiple human immune cell types demarcated by
H3K27Ac loading. Red fill denotes the presence of an SE in the BACH2 locus in a tissue.
Source data are indicated. (b) Violin plots showing probability of loss of function
intolerance scores in haplosufficient (HS), autosomal recessive (AR) and haploinsufficient
(HI) gene sets. The white circles show median values. Source data: ExAc database39. (c)
Number of HS, AR or HI genes with and without associated SE architecture in humans (see
also supplementary Fig. 8a and supplementary Table 3). (d) Pie charts indicating the
Afzali et al. Page 33
Nat Immunol. Author manuscript; available in PMC 2017 November 22.
Author M
anuscriptA
uthor Manuscript
Author M
anuscriptA
uthor Manuscript
frequency of SE (upper panels) and typical enhancer (TE; lower panels) structures in HS
(left), HI (middle) and AR (right) genes. (e) Gene ontology (GO) functional annotation
enrichment in HI genes. Shown are enrichment scores (blue bars) and Benjamini p-values
(in orange) for the top 5 most significantly enriched terms. (f) Median probability of loss of
function intolerance (black line) against SE signal size; the percentage of genes that are
transcription factors (TF, red line) against SE signal size is shown in the inset. For reference,
the red line asymptotes to the expected level (mean percentage of genes in the human
genome that are TFs is 7.5%). Source data: ExAc39 and dbSuper41 databases. (g) Pie charts
indicating the percentage of HS or HI genes that have GWAS disease associations. p-values
in d and g are Fisher exact tests; NS = non-significant; GWAS = genome-wide association
study.
Afzali et al. Page 34
Nat Immunol. Author manuscript; available in PMC 2017 November 22.
Author M
anuscriptA
uthor Manuscript
Author M
anuscriptA
uthor Manuscript
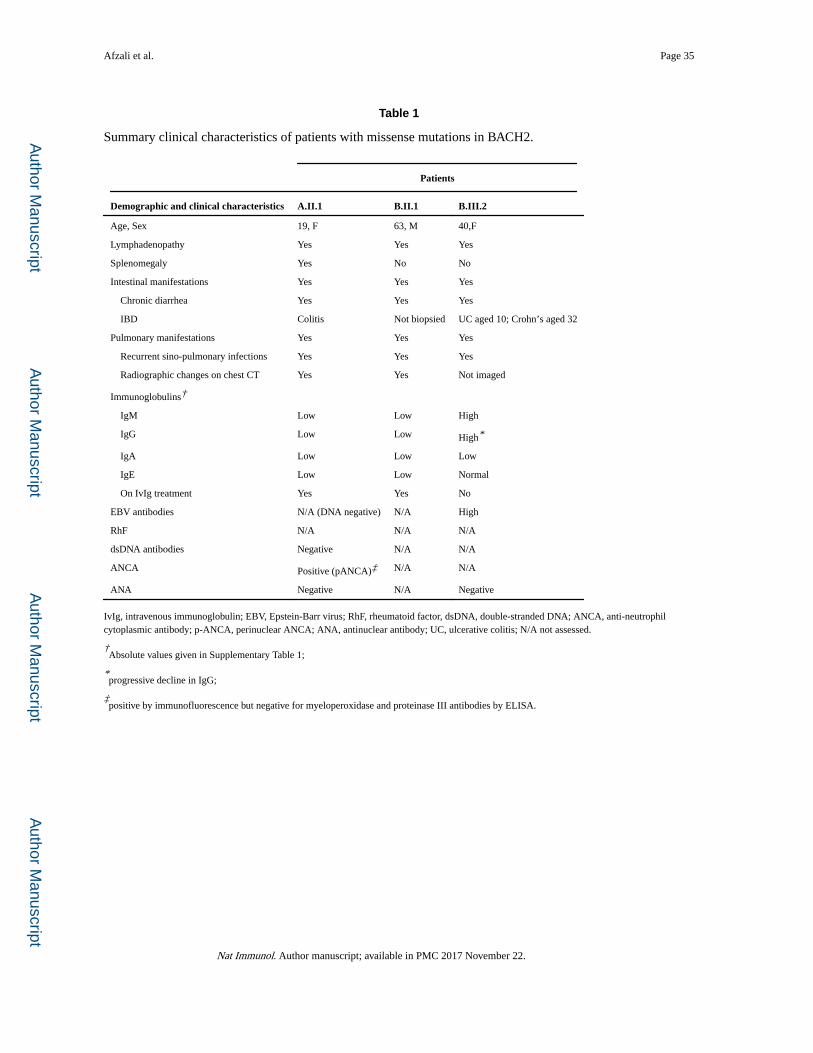
Author M
anuscriptA
uthor Manuscript
Author M
anuscriptA
uthor Manuscript
Afzali et al. Page 35
Table 1
Summary clinical characteristics of patients with missense mutations in BACH2.
Patients
Demographic and clinical characteristics A.II.1 B.II.1 B.III.2
Age, Sex 19, F 63, M 40,F
Lymphadenopathy Yes Yes Yes
Splenomegaly Yes No No
Intestinal manifestations Yes Yes Yes
Chronic diarrhea Yes Yes Yes
IBD Colitis Not biopsied UC aged 10; Crohn’s aged 32
Pulmonary manifestations Yes Yes Yes
Recurrent sino-pulmonary infections Yes Yes Yes
Radiographic changes on chest CT Yes Yes Not imaged
Immunoglobulins†
IgM Low Low High
IgG Low Low High*
IgA Low Low Low
IgE Low Low Normal
On IvIg treatment Yes Yes No
EBV antibodies N/A (DNA negative) N/A High
RhF N/A N/A N/A
dsDNA antibodies Negative N/A N/A
ANCA Positive (pANCA)‡ N/A N/A
ANA Negative N/A Negative
IvIg, intravenous immunoglobulin; EBV, Epstein-Barr virus; RhF, rheumatoid factor, dsDNA, double-stranded DNA; ANCA, anti-neutrophil cytoplasmic antibody; p-ANCA, perinuclear ANCA; ANA, antinuclear antibody; UC, ulcerative colitis; N/A not assessed.
†Absolute values given in Supplementary Table 1;
*progressive decline in IgG;
‡positive by immunofluorescence but negative for myeloperoxidase and proteinase III antibodies by ELISA.
Nat Immunol. Author manuscript; available in PMC 2017 November 22.