bach vu thesis
TRANSCRIPT

The Pennsylvania State University
Department of Civil and Environmental Engineering
SEISMIC PERFORMANCE OF BASE ISOLATED BUILDINGS AND STRATEGIES
TO MITIGATE VERTICAL ACCELERATION DEMANDS
A Thesis in
Civil Engineering
by
Bach Xuan Vu
Submitted in Partial Fulfillment
of the Requirements
for the Degree of
Master of Science
August 2012

ii
The thesis of Bach Xuan Vu was reviewed and approved* by the following:
Gordon Warn Assistant Professor of Civil Engineering Thesis Advisor
Swagata Banerjee Basu Assistant Professor of Civil Engineering
Ali M. Memari Bernard and Henrietta Hankin Chair in Residential Building Construction Professor of Architectural Engineering Peggy Johnson Professor of Civil Engineering Head of the Department of Civil and Environmental Engineering *Signatures are on file in the Graduate School.

iii
Abstract
Elastomeric bearing constructed of rubber layers bonded to intermediate steel shim plates
is a seismic isolation device used for protecting a structure against earthquake ground shaking.
The rubber layers provide the low lateral stiffness required to shift the period whereas the close
spacing of the intermediate steel shim plates provides a vertical stiffness that is several thousand
times larger than a horizontal stiffness. However, the low vertical isolation frequency can align
with the dominant frequency content of the vertical spectrum leading to significant amplification
of accelerations. An analytical study was conducted to investigate the influence of the vertical
component of ground shaking on the performance of nonstructural systems within multi-story
seismically isolated buildings. The research focuses on two dimensional analytical models of 3
and 9-story frames. Three model configurations are explored namely: frames with conventional
base isolation, frames with base isolation and viscous dampers, and lastly frames with base
isolation and column isolators. Fragility curves are used to assess damage to ceiling systems in
both frames. Results from analytical analyses suggests that damage to ceiling systems might be
mitigated in low-rise structure using moderate shape factor elastomeric bearings and
supplemental damping, and in middle rise structure using high shape factor base bearings and
column isolators.
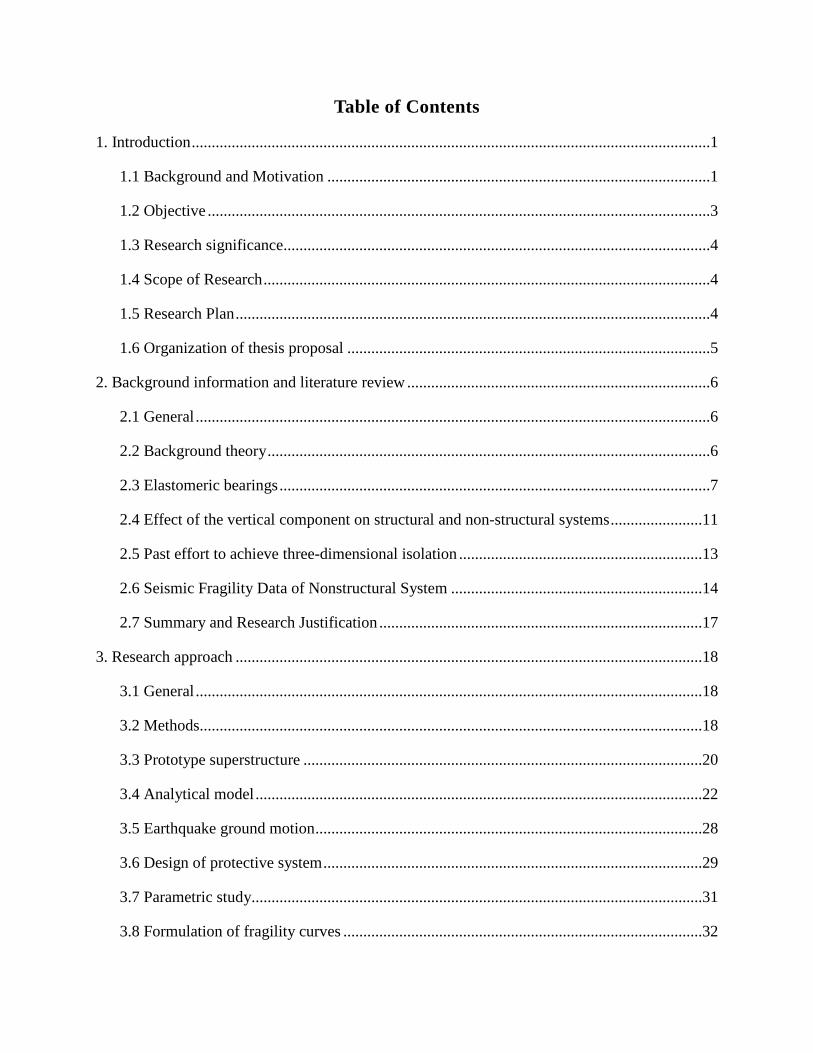
Table of Contents
1. Introduction ..................................................................................................................................1
1.1 Background and Motivation ................................................................................................1
1.2 Objective ..............................................................................................................................3
1.3 Research significance ...........................................................................................................4
1.4 Scope of Research ................................................................................................................4
1.5 Research Plan .......................................................................................................................4
1.6 Organization of thesis proposal ...........................................................................................5
2. Background information and literature review ............................................................................6
2.1 General .................................................................................................................................6
2.2 Background theory ...............................................................................................................6
2.3 Elastomeric bearings ............................................................................................................7
2.4 Effect of the vertical component on structural and non-structural systems .......................11
2.5 Past effort to achieve three-dimensional isolation .............................................................13
2.6 Seismic Fragility Data of Nonstructural System ...............................................................14
2.7 Summary and Research Justification .................................................................................17
3. Research approach .....................................................................................................................18
3.1 General ...............................................................................................................................18
3.2 Methods..............................................................................................................................18
3.3 Prototype superstructure ....................................................................................................20
3.4 Analytical model ................................................................................................................22
3.5 Earthquake ground motion .................................................................................................28
3.6 Design of protective system ...............................................................................................29
3.7 Parametric study.................................................................................................................31
3.8 Formulation of fragility curves ..........................................................................................32

3.9 Estimate probability of failure for ceiling systems ............................................................35
4. Analytical results .......................................................................................................................37
4.1 General ...............................................................................................................................37
4.2 Results from parameter study of the base isolated frames .................................................37
4.3 Results for base isolated frames with supplemental damping ...........................................46
4.4 Results for base isolated frames with column isolators .....................................................49
4.5 Summary ............................................................................................................................54
5. Summary and conclusions .........................................................................................................55
5.1 Summary ............................................................................................................................55
5.2 Limitations of the study .....................................................................................................55
5.3 Conclusions ........................................................................................................................56
References ......................................................................................................................................57
Appendix A: Basic loading conditions ..........................................................................................62
Appendix B: Description of ground motions .................................................................................63
Appendix C: Push over analysis ....................................................................................................65
Appendix D: Elastomeric bearings properties ...............................................................................66
Appendix E: Viscous damper properties .......................................................................................70
Appendix F: Fragility curves .........................................................................................................71
Appendix G: Column isolators ......................................................................................................74
Appendix H: Vertical periods of 3- and 9- story frame .................................................................76

1
Chapter 1
Introduction
1.1 Background and Motivation
Seismic isolation is a technique used to protect structures and nonstructural systems from
the damaging effect of horizontal earthquake ground motion. This is accomplished by
decoupling the superstructure from the substructure using isolation bearings with low lateral
stiffness. The low lateral stiffness is required to shift the period of the structure into the long
period range, e.g., 2.5s to 4s. This period shift translates into reduced spectral acceleration
demands as illustrated by the shaded region on the elastic response spectra shown in Fig. 1.1a
(generated using the recorded earthquake ground motions detailed in Chapter 3). The period
shift, however, does result in increased displacement demands concentrated at the isolation
interface that must be accommodated by the seismic isolation bearings. Seismic isolation
bearings fall into two general categories, namely: (1) elastomeric and (2) sliding. Each type has
low lateral stiffness to achieve the desired period shift and a large vertical stiffness to support the
gravity and vertical forces imposed on during service and seismic loading, respectively.
For elastomeric bearing, the total thickness of rubber provides the low lateral stiffness
whereas closely spaced steel shim plates provide a vertical stiffness that is several thousand
times larger than the horizontal stiffness. Consequently, the vertical isolation frequencies,
typically ranging from 0.03 to 0.15 seconds, can align with the dominant frequency content of
the vertical spectrum leading to significant amplification of accelerations. For sliding bearings,
the low lateral stiffness is achieved using bearing material such as polytetrafluoroethylene
(PTFE) type material mated to polished stainless steel providing a low sliding coefficient of
friction ranging from 0.07 to 0.18 (Mohka et al. 1990a, b) with values as low as 0.03 (EPS 2012).
However, the materials used to construct sliding bearings produce a large vertical stiffness and
thus a low vertical isolation period, typically around 0.03 seconds (EPS 2012).
The short vertical isolation period produced by typical elastomeric and sliding isolation
bearing, e.g., 0.03 to 0.15 seconds, can align with dominant frequency content of vertical
spectrum as shown by the shaded region plotted in Fig. 1.1b superimposed on spectra generated
using the vertical components of recorded earthquake ground motions. Therefore, bearings
2
widely used for seismic isolation provide isolation only in the horizontal direction and are not
designed to protect against vertical ground shaking.
Observations from reconnaissance following the 1995 Kobe earthquake in Japan and the
1994 Northridge earthquake in the United States indicate that damage to structural and non-
structural components in fixed-base structure were due to demands imposed on these elements
from the vertical components of earthquake ground shaking (Papazoglou and Elnashai 1996).
Other studies (Kageyama et al. 2004; Yoo et al. 1997) suggest the larger vertical stiffness
provided by isolation systems composed of elastomeric bearings could result in acceleration
demands that are greater than those in an equivalent non-isolated structure. This suggests
structures isolated on bearings with large vertical stiffness could sustain damage to structural and
non-structural components due to the vertical component of ground motion.
Recently, two independent test programs on full scale isolated buildings with weights of
5,000-10,000 kN have been conducted at the National Institute for Earth Science and Disaster
Prevention (NIED) E-Defense shaking table of Japan (Sato et al. 2010; Ryan et al. 2012). While
the influence of vertical excitation has not yet been reported from the Sato et al. tests (2010),
Ryan et al. (2012) observed damage to suspended ceilings. Observed damage included ceiling
panels falling and in the most extreme cases localized failures of the ceiling grid support system
(Soroushian et al. 2012).
Figure 1.1. Elastic, 5% damping, earthquake response spectra from Bin 1: (a) horizontal
component; (b) vertical component
3
1.2 Objective
To date, no comprehensive analytical or experimental study has been conducted to
understand the impact of the vertical component of ground shaking on the performance of
nonstructural systems within multi-story seismically isolated buildings. Yet, damage to these
systems could adversely affect the post event functionality of critical facilities such as hospitals
and emergency centers for which seismic isolation is typically employed (Sato 2011).
The first objective of this study is to investigate how the isolation system's properties,
specifically vertical stiffness and vertical damping, affect vertical acceleration demands in the
upper levels of the building and the probability of damage to suspended ceiling systems.
Suspended ceiling systems were chosen as the nonstructural component because damage to this
nonstructural system was observed during recent full scale testing of a base isolated structure
(Soroushian et al. 2012). Furthermore, seismic fragility data for suspended ceiling systems is
available in the literature (Badillo et al. 2006) though a number of assumptions are required to
apply the data to this study as described in subsequent sections.
Secondly, past efforts to achieve three-dimensional isolation have been investigated as
will be discussed in the literature review section of this proposal (Tajirian et al. 1990; Huffmann
1984; Kageyama et al 2002 and Takahashi et al. 2008). However, each of these strategies has
concentrated on the horizontal and vertical flexibility at the base of the structures. In structures
where the center of mass is elevated above the plane of isolation, this vertical flexibility
translates into reduced rocking periods of vibration that increases the participation of rocking
response, in turn increasing horizontal and vertical acceleration demands in the upper levels of
the building. Furthermore, decreasing the vertical stiffness of the isolation device to the point of
achieving vertical isolation typically requires using a device with limited stability and is difficult
to achieve in practice. Rather than concentrating vertical flexibility at the base to achieve three-
dimensional isolation, a strategy is proposed in this study to distribute the vertical flexibility up
the height of the building. One possibility to achieve this “distributed vertical flexibility” could
be through the use of elastomeric laminated bearings that are laterally restrained, similar to pot
bearings, installed at various locations up the height of the building. The effect of supplemental
vertical damping located at the base of the building will also be explored.

4
1.3 Research Significance
First, this study offers a systematic analytical parametric study of the influence of bearing
shape factor on vertical acceleration demands in multi-story seismically isolated frames.
Secondly, this study proposes a use of non-structural fragility data to estimate the likelihood of
damage to non-structural components (namely suspended ceiling systems) for evaluation of
various systems. Finally, this study provides a development and demonstration of the vertically
distributed flexibility concept.
1.4 Scope of Research
This research is limited to analytical studies of two-dimensional, three-story and nine-
story models based on the SAC Los Angeles buildings from Gupta and Krawinkler (1999). There
are three system configurations considered in this research. The first is structures with
conventional base isolation; the second is structures with conventional base isolation and
supplemental vertical viscous dampers located at the plane of base isolation. The third
configuration is base isolation with vertically distributed flexibility. Finally, fragility curves
adapted from Badillo et al. (2006) were used to assess damage due to vertical component of
earthquake excitation to ceiling systems and to evaluate the three configurations.
1.5 Research Plan
The objectives of this research will be achieved through the following research plan
consisting of four tasks:
1. Perform an analytical parametric study to systematically investigate the influence of
the isolation system properties, specifically vertical stiffness, on the vertical
acceleration demands in the upper stories of seismically isolated buildings.
2. Assess the probability of damage to suspended ceilings in the upper stories of
seismically isolated buildings using seismic fragility data.
3. Explore new systems to minimize damage to suspended ceiling systems in
seismically isolated buildings.
4. Using fragility curves to verify the efficacy of the new systems through an analytical
study.

5
1.6 Organization of thesis proposal
This proposal is organized into the following seven sections: (1) Introduction; (2)
Background information and literature review; (3) Research approach; (4) Analytical results; (5)
Summary and conclusions; (6) References; (7) Appendices.

6
Chapter 2
Background information and literature review
2.1 General
This chapter provides background information and a review of literature pertaining to
seismic isolation and elastomeric bearings. Additionally, seismic fragility testing of suspended
ceiling systems will be reviewed as data from an experimental test program by Badillo et al.
(2006) was adapted for this study.
2.2 Background theory
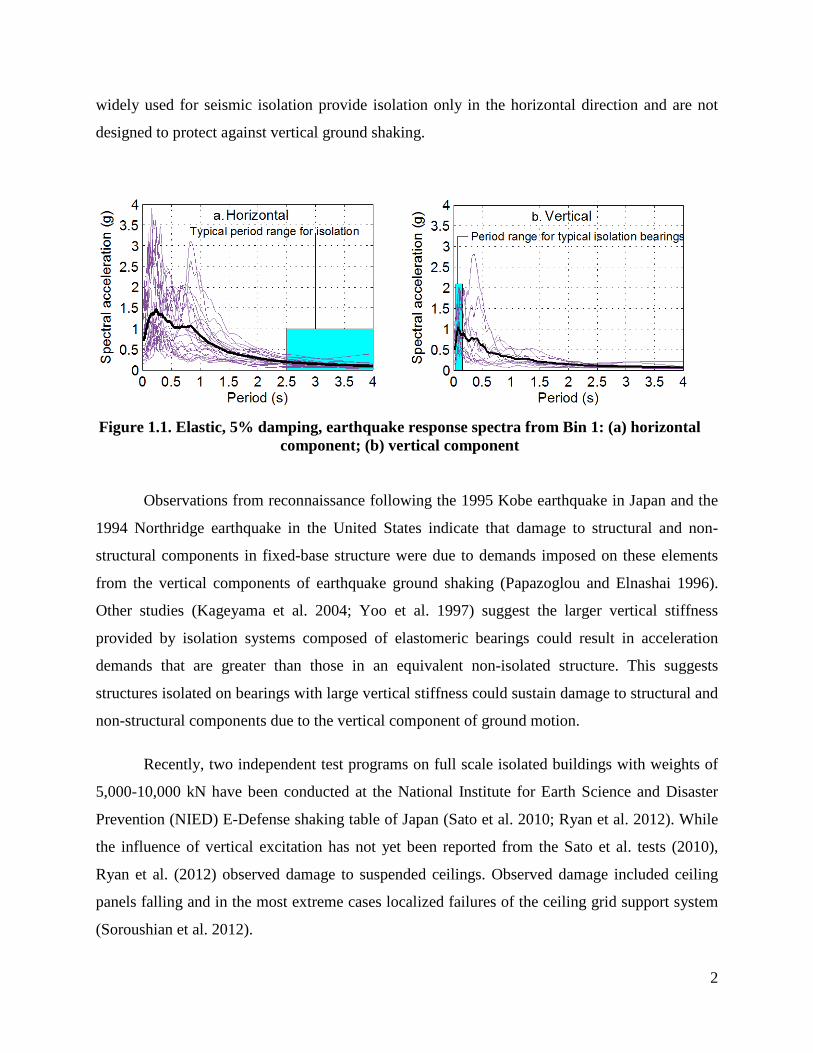
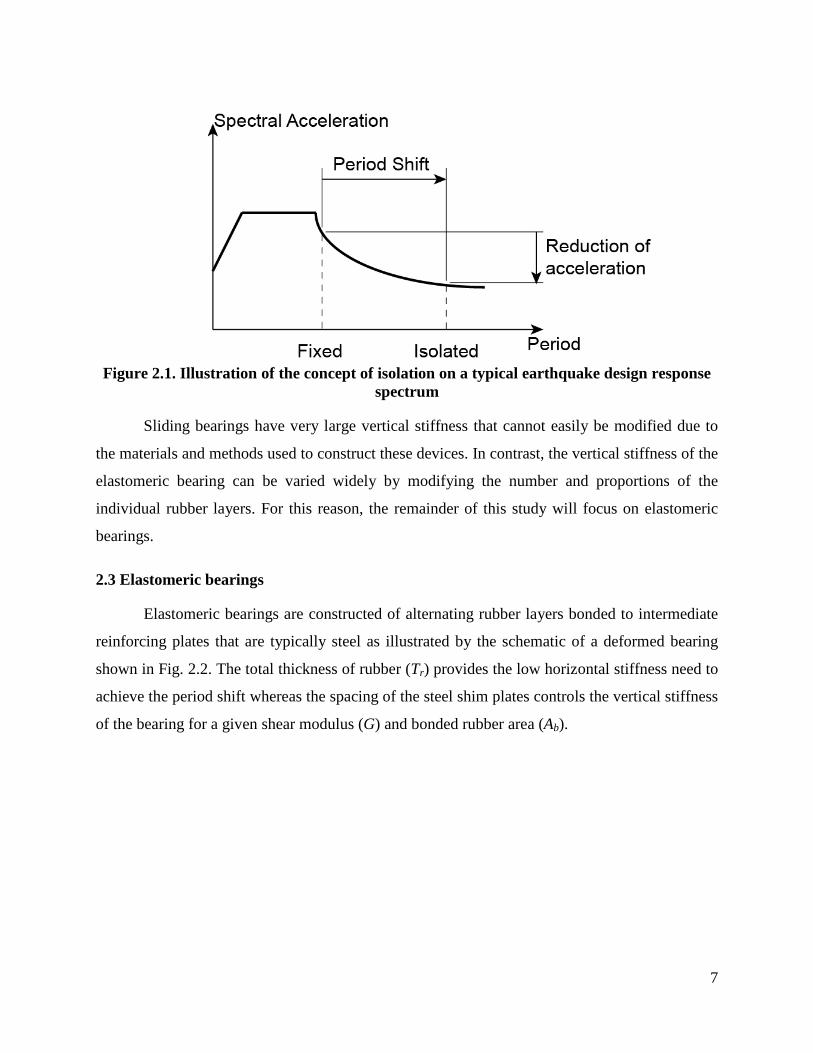
Figure 2.1 illustrates the concept of isolation using a typical design earthquake response
spectrum. A fixed base structure that would be a candidate for seismic isolation will have a short
fundamental period, e.g., smaller than 1 second corresponding to a region of the spectrum where
there is significant amplification of spectral acceleration demands. Seismic isolation is achieved
by shifting the fundamental period of the structure into the long period range, e.g., 2.5s to 4s,
with the aim of reducing spectral acceleration demands below the peak ground acceleration. The
reduced demands allow the superstructure to be designed to remain elastic, or nearly elastic,
following the design level event. Furthermore, the reduced demands minimize the likelihood of
damage to displacement sensitive and acceleration sensitive equipment, nonstructural
components and contents. The period shift, however, does result in increased displacement
demands concentrated at the isolation interface that must be accommodated by the seismic
isolation devices. The simultaneous reduction in horizontal acceleration and inter-story drift
demands achieved with seismic isolation makes it one of the most effective strategies for
protection against horizontal ground shaking.
7
Figure 2.1. Illustration of the concept of isolation on a typical earthquake design response spectrum
Sliding bearings have very large vertical stiffness that cannot easily be modified due to
the materials and methods used to construct these devices. In contrast, the vertical stiffness of the
elastomeric bearing can be varied widely by modifying the number and proportions of the
individual rubber layers. For this reason, the remainder of this study will focus on elastomeric
bearings.
2.3 Elastomeric bearings
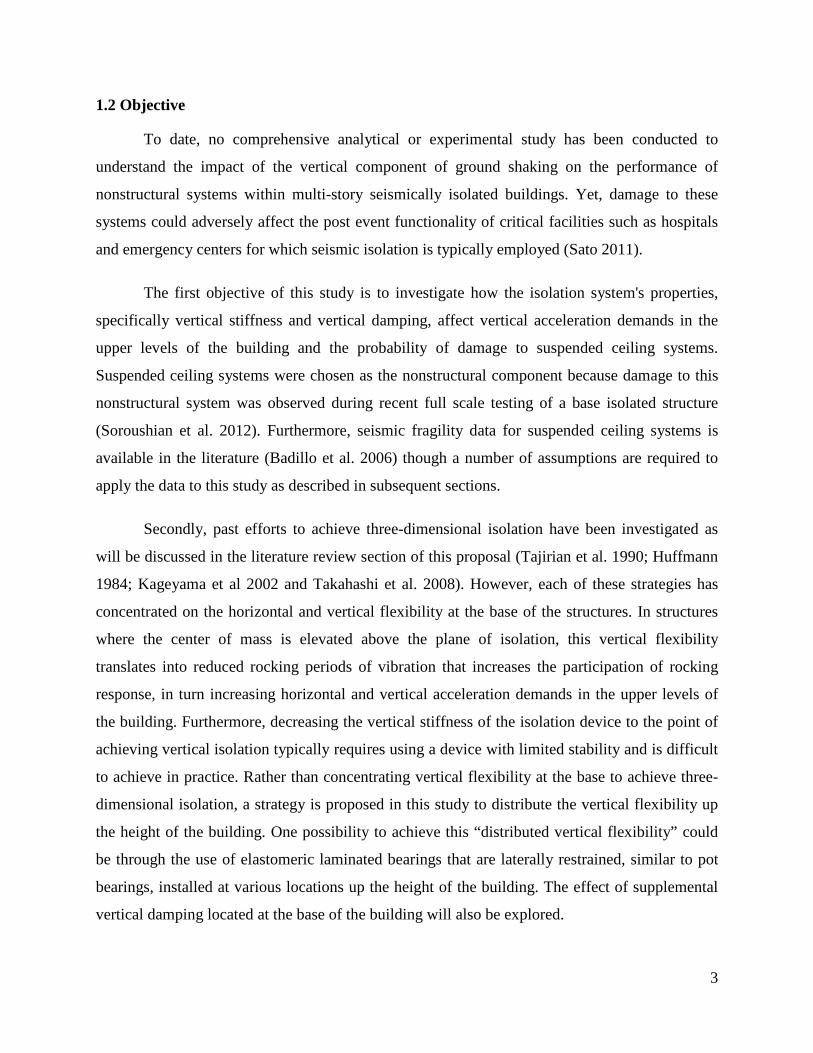
Elastomeric bearings are constructed of alternating rubber layers bonded to intermediate
reinforcing plates that are typically steel as illustrated by the schematic of a deformed bearing
shown in Fig. 2.2. The total thickness of rubber (Tr) provides the low horizontal stiffness need to
achieve the period shift whereas the spacing of the steel shim plates controls the vertical stiffness
of the bearing for a given shear modulus (G) and bonded rubber area (Ab).

8
Figure 2.2. Schematic of an elastomeric bearing in the laterally deformed configuration
2.3.1 Mechanical behavior
The horizontal stiffness of an elastomeric bearing (Kelly 1997) is calculated as:
eff bh
r
G AK
T= (2.1)
where Geff is the effective shear modulus, Ab is the bonded rubber area of the bearing. The total
thickness of rubber (Tr) is equal the number of rubber layers (n) times the individual rubber layer
thickness (tr). The vertical stiffness of an elastomeric bearing (Kelly 1997) is calculated
according to:
c bv
r
E AKT
= (2.2)
where Ec is the instantaneous compression modulus of the rubber-steel composite.
The compression modulus (Ec) for an individual rubber layer is controlled by the shape
and thickness of the individual rubber layers. For a solid circular rubber pad, the compression
modulus assuming incompressible material (Chalhoub and Kelly 1990) is:
26c effE G S= (2.3)
The shape factor S (Kelly 1997) is a dimensionless geometric parameter defined as:
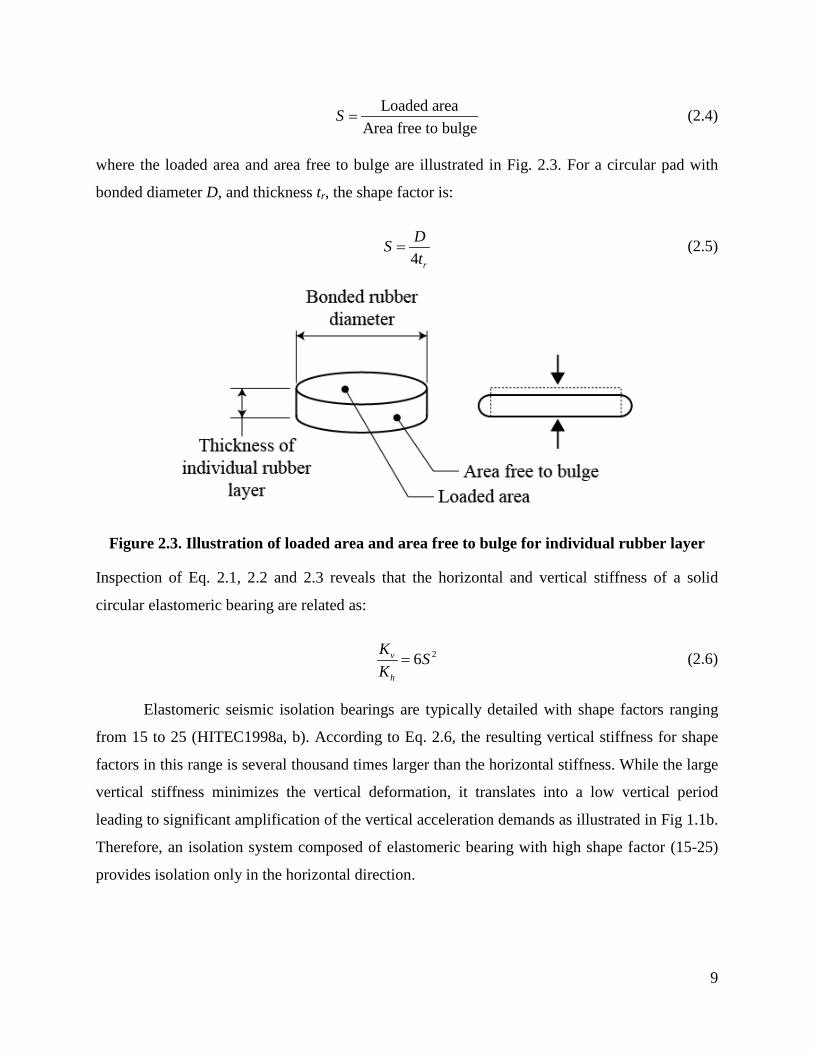
9
Loaded areaArea free to bulge
S = (2.4)
where the loaded area and area free to bulge are illustrated in Fig. 2.3. For a circular pad with
bonded diameter D, and thickness tr, the shape factor is:
4 r
DSt
= (2.5)
Figure 2.3. Illustration of loaded area and area free to bulge for individual rubber layer
Inspection of Eq. 2.1, 2.2 and 2.3 reveals that the horizontal and vertical stiffness of a solid
circular elastomeric bearing are related as:
26v
h
K SK
= (2.6)
Elastomeric seismic isolation bearings are typically detailed with shape factors ranging
from 15 to 25 (HITEC1998a, b). According to Eq. 2.6, the resulting vertical stiffness for shape
factors in this range is several thousand times larger than the horizontal stiffness. While the large
vertical stiffness minimizes the vertical deformation, it translates into a low vertical period
leading to significant amplification of the vertical acceleration demands as illustrated in Fig 1.1b.
Therefore, an isolation system composed of elastomeric bearing with high shape factor (15-25)
provides isolation only in the horizontal direction.
10
2.3.2 Stability of elastomeric bearings
The isolation devices are typically installed between the superstructure and foundation
(substructure). Therefore, these devices must be designed to remain stable for service level
loading and seismic loading. Elastomeric bearings, however, have limited stability for the lateral
un-deformed configuration (service) that is reduced further with lateral displacement (seismic) so
that stability is an important consideration in the design of an isolation system composed of
elastomeric bearings.
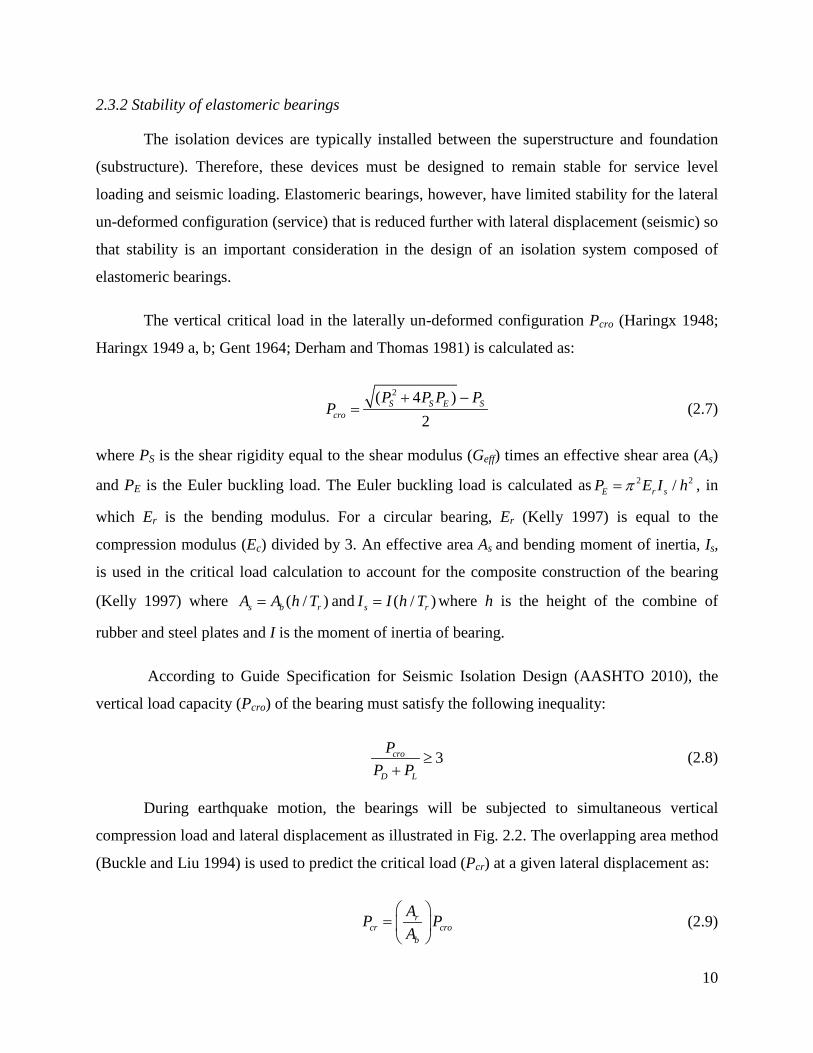
The vertical critical load in the laterally un-deformed configuration Pcro (Haringx 1948;
Haringx 1949 a, b; Gent 1964; Derham and Thomas 1981) is calculated as:
2( 4 )
2S S E S
cro
P P P PP
+ −= (2.7)
where PS is the shear rigidity equal to the shear modulus (Geff) times an effective shear area (As)
and PE is the Euler buckling load. The Euler buckling load is calculated as 2 2/E r sP E I hπ= , in
which Er is the bending modulus. For a circular bearing, Er (Kelly 1997) is equal to the
compression modulus (Ec) divided by 3. An effective area As and bending moment of inertia, Is,
is used in the critical load calculation to account for the composite construction of the bearing
(Kelly 1997) where ( / )s b rA A h T= and ( / )s rI I h T= where h is the height of the combine of
rubber and steel plates and I is the moment of inertia of bearing.
According to Guide Specification for Seismic Isolation Design (AASHTO 2010), the
vertical load capacity (Pcro) of the bearing must satisfy the following inequality:
3cro
D L
PP P
≥+
(2.8)
During earthquake motion, the bearings will be subjected to simultaneous vertical
compression load and lateral displacement as illustrated in Fig. 2.2. The overlapping area method
(Buckle and Liu 1994) is used to predict the critical load (Pcr) at a given lateral displacement as:
rcr cro
b
AP PA
=
(2.9)

11
where Ar is the reduced area corresponding to the overlapping area between the top and the
bottom bearing end-end plate as illustrated in Fig.2.4.
Figure 2.4. Illustration for overlapping area on a laterally deformed circular bearing
From Eq. 2.9, it can be concluded that the predicted vertical load capacity is zero when
the shear displacement is equal to the diameter of the bearing. Past experimental data (Weisman
and Warn 2012; Sanchez et al. 2011) has shown the overlapping area method to be conservative
at large lateral displacements. Despite the inaccuracy, the overlapping area method is used in this
study as it is currently employed in practice.
2.4 Effect of the vertical component of earthquake ground shaking on structural and non-structural systems
Historically for design purposes the demands due to the vertical component of ground
shaking was assumed to be 2/3 of the horizontal demands (IBC 2000). However, inspection of
recorded near-field ground motion (Loma Prieta 1989, Northridge 1994) has shown the vertical-
horizontal spectral ratio can exceed 2/3 with values ranging as high as 1.7 for short periods
(Bozorgnia et al. 1995). Due to the alignment of the structure period with the dominant vertical
spectrum of earthquake excitations, researchers have recognized the damage potential of the
vertical component of earthquake ground motion to fixed-base structures.
12
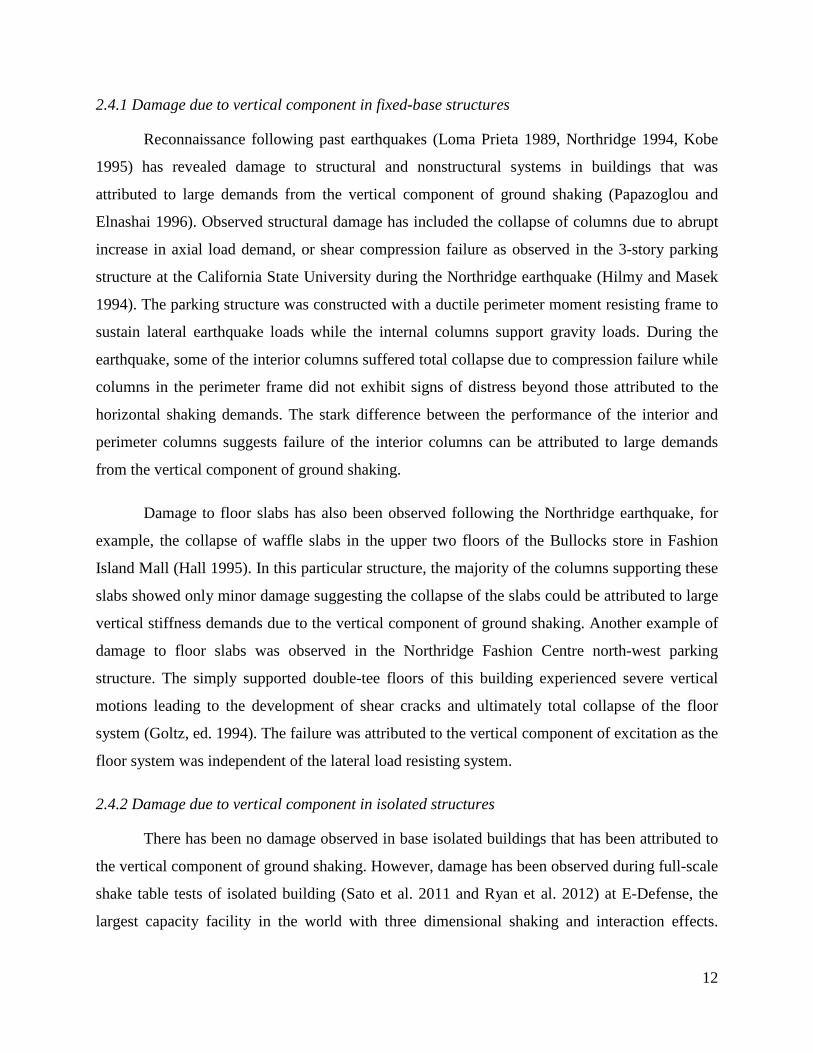
2.4.1 Damage due to vertical component in fixed-base structures
Reconnaissance following past earthquakes (Loma Prieta 1989, Northridge 1994, Kobe
1995) has revealed damage to structural and nonstructural systems in buildings that was
attributed to large demands from the vertical component of ground shaking (Papazoglou and
Elnashai 1996). Observed structural damage has included the collapse of columns due to abrupt
increase in axial load demand, or shear compression failure as observed in the 3-story parking
structure at the California State University during the Northridge earthquake (Hilmy and Masek
1994). The parking structure was constructed with a ductile perimeter moment resisting frame to
sustain lateral earthquake loads while the internal columns support gravity loads. During the
earthquake, some of the interior columns suffered total collapse due to compression failure while
columns in the perimeter frame did not exhibit signs of distress beyond those attributed to the
horizontal shaking demands. The stark difference between the performance of the interior and
perimeter columns suggests failure of the interior columns can be attributed to large demands
from the vertical component of ground shaking.
Damage to floor slabs has also been observed following the Northridge earthquake, for
example, the collapse of waffle slabs in the upper two floors of the Bullocks store in Fashion
Island Mall (Hall 1995). In this particular structure, the majority of the columns supporting these
slabs showed only minor damage suggesting the collapse of the slabs could be attributed to large
vertical stiffness demands due to the vertical component of ground shaking. Another example of
damage to floor slabs was observed in the Northridge Fashion Centre north-west parking
structure. The simply supported double-tee floors of this building experienced severe vertical
motions leading to the development of shear cracks and ultimately total collapse of the floor
system (Goltz, ed. 1994). The failure was attributed to the vertical component of excitation as the
floor system was independent of the lateral load resisting system.
2.4.2 Damage due to vertical component in isolated structures
There has been no damage observed in base isolated buildings that has been attributed to
the vertical component of ground shaking. However, damage has been observed during full-scale
shake table tests of isolated building (Sato et al. 2011 and Ryan et al. 2012) at E-Defense, the
largest capacity facility in the world with three dimensional shaking and interaction effects.

13
Furthermore, an elastomeric bearing with high shape factor (S = 30) has its vertical frequencies
in a same magnitude range compared to that of fixed-base structure (Appendix H). Therefore,
damage observed in fixed-base buildings is likely to happen for buildings isolated on high shape
factor bearings.
Ryan et al. (2012) performed a full-scale testing of a 5-story steel moment resisting frame
building isolated on triple friction pendulum and cross linear lead rubber bearings. The building
was subjected to two-dimensional excitations (horizontal) and three-dimensional excitations
(horizontal and vertical). Ryan reported a content disruption and ceiling tiles falling in the fifth
floor of the buildings which was explained as an amplification of floor vertical accelerations in
fifth floor to ground motion input (4g at 5th floor compared to 1.3g PGA). The vertical floor
acceleration was further amplified when the building was subjected to three-dimensional
excitations, which could be explained by the rotation of the shaking table because of the couple
between horizontal and vertical excitations.
2.5 Past effort to achieve three-dimensional isolation:
Researchers have recognized the potential adverse effect of the vertical component of
ground motion for critical structures (e.g., hospitals, nuclear, among others) isolated on
traditional high shape factor elastomeric and sliding bearings. Tajirian et al. (1990) proposed
using low shape factor elastomeric bearings (i.e., 2.3S = ) to achieve flexibility in both horizontal
and vertical direction for three-dimensional isolation of nuclear structures. In their research,
Tajirian performed dynamic tests on six quarter size prototypes of low shape factor elastomeric
bearings. The results of the analysis and design work suggested that low shape factor is feasible
for low rise building like SAFR (Sodium Advanced Fast Reactor) as the rocking and overturning
effect is lessened due to the low height-width ratio of the structure. However, system level
testing and analysis were not performed to verify the low shape factor concept. Furthermore, one
challenge with using low shape factor approach will be balancing the conflicting objectives of
shifting the period, that requires sufficient mass, and ensuring bearing stability.
A three-dimensional isolation system composed of helical springs, the GERB vibration
controlled system, was developed by Huffmann (1984) and originally implemented for the three-
dimensional seismic protection of diesel and turbo generator. An experimental study performed

14
by Huffmann (1984) on a reduced scale 3-bay, 5-story structure showed a reduction of horizontal
acceleration could be achieved with the GERB system compared to the structure in the fixed-
base configuration. However, amplification of ground acceleration was observed in a residential
building in California isolated with the GERB system shaken during the 1994 Northridge
earthquake (Makris and Deoskar, 1996). The maximum recorded top floor acceleration was
approximately 0.63g in comparison to the estimated peak ground acceleration of 0.5g suggesting
the GERB system did not provide effective isolation and raised questions regarding the
effectiveness of the GERB system.
Research for three-dimensional isolation has been actively pursued in Japan to protect
nuclear power plants against severe earthquakes. Three-dimensional seismic isolation system has
been proposed by Takahashi et al. (2008) using a combination of air springs, laminated rubber
bearings, and dampers with rocking prevention mechanism. This system consists of high
damping laminated bearing, which is responsible for isolation in horizontal direction, sitting on
top of a steel frame supported by air springs providing vertical isolation. Dampers are used to
further dissipate energy in the system as well as limiting rocking from vertical motion. Two oil
dampers are connected by cross-coupled pipes so that oil can move between dampers. When
both dampers move up simultaneously, the pipes move up together. However when rocking
occurs (one damper moves up, the other moves down), the cross-coupled pipes will restrict this
movement and suppress rocking. Kageyama et al. (2002, 2004) proposed a concept of three-
dimensional isolation air springs. This device supports and isolates a superstructure by
compressed air springs, which consist of rubber layers between the inner and outer cylinders
reinforcing polyester fabric and wire cables. The gap between inner and outer cylinders allows
the device to move in both horizontal and vertical directions providing a reported fundamental
period exceeding 3 seconds in both horizontal and vertical directions. However, these systems
are unlikely to be implemented in United States due to their complexity, cost and unproven
reliability.
2.6 Seismic Fragility Data of Nonstructural System
Fragility analysis has been used in recent years as a main tool to assess seismic
vulnerability of structural and nonstructural systems. Seismic fragility has been defined as the
conditional probability of failure of a system for a given intensity of a ground motion. Failure
15
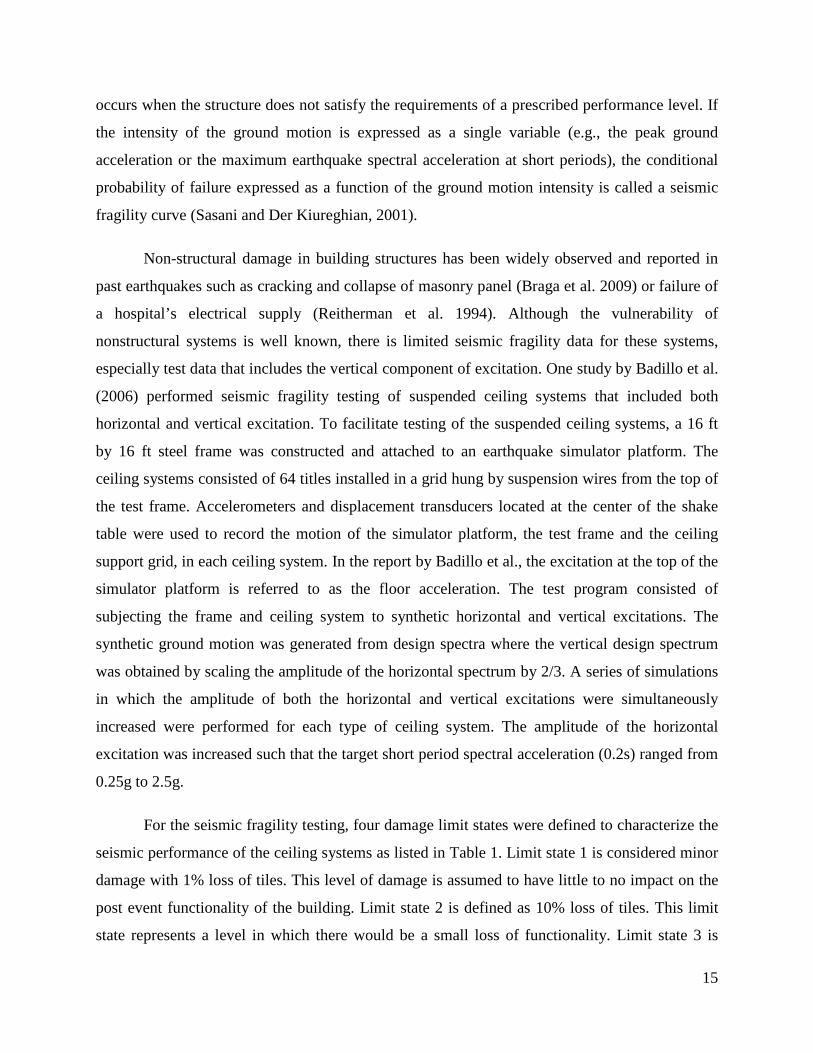
occurs when the structure does not satisfy the requirements of a prescribed performance level. If
the intensity of the ground motion is expressed as a single variable (e.g., the peak ground
acceleration or the maximum earthquake spectral acceleration at short periods), the conditional
probability of failure expressed as a function of the ground motion intensity is called a seismic
fragility curve (Sasani and Der Kiureghian, 2001).
Non-structural damage in building structures has been widely observed and reported in
past earthquakes such as cracking and collapse of masonry panel (Braga et al. 2009) or failure of
a hospital’s electrical supply (Reitherman et al. 1994). Although the vulnerability of
nonstructural systems is well known, there is limited seismic fragility data for these systems,
especially test data that includes the vertical component of excitation. One study by Badillo et al.
(2006) performed seismic fragility testing of suspended ceiling systems that included both
horizontal and vertical excitation. To facilitate testing of the suspended ceiling systems, a 16 ft
by 16 ft steel frame was constructed and attached to an earthquake simulator platform. The
ceiling systems consisted of 64 titles installed in a grid hung by suspension wires from the top of
the test frame. Accelerometers and displacement transducers located at the center of the shake
table were used to record the motion of the simulator platform, the test frame and the ceiling
support grid, in each ceiling system. In the report by Badillo et al., the excitation at the top of the
simulator platform is referred to as the floor acceleration. The test program consisted of
subjecting the frame and ceiling system to synthetic horizontal and vertical excitations. The
synthetic ground motion was generated from design spectra where the vertical design spectrum
was obtained by scaling the amplitude of the horizontal spectrum by 2/3. A series of simulations
in which the amplitude of both the horizontal and vertical excitations were simultaneously
increased were performed for each type of ceiling system. The amplitude of the horizontal
excitation was increased such that the target short period spectral acceleration (0.2s) ranged from
0.25g to 2.5g.
For the seismic fragility testing, four damage limit states were defined to characterize the
seismic performance of the ceiling systems as listed in Table 1. Limit state 1 is considered minor
damage with 1% loss of tiles. This level of damage is assumed to have little to no impact on the
post event functionality of the building. Limit state 2 is defined as 10% loss of tiles. This limit
state represents a level in which there would be a small loss of functionality. Limit state 3 is
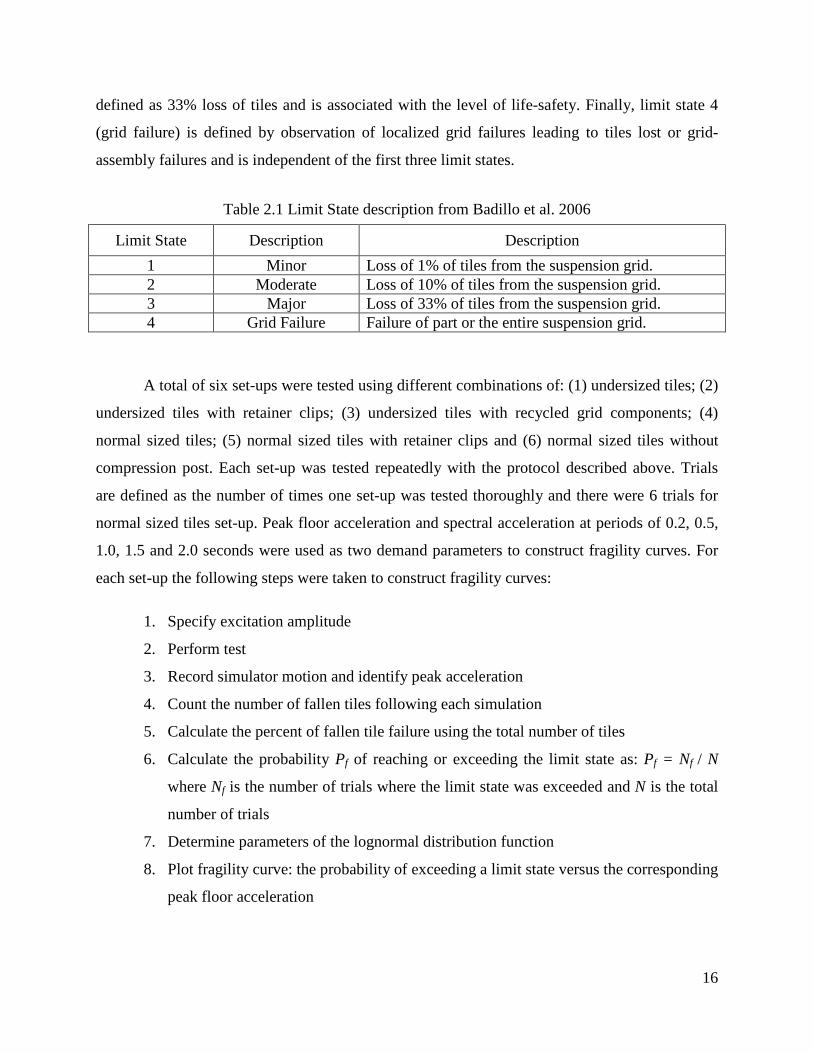
16
defined as 33% loss of tiles and is associated with the level of life-safety. Finally, limit state 4
(grid failure) is defined by observation of localized grid failures leading to tiles lost or grid-
assembly failures and is independent of the first three limit states.
Table 2.1 Limit State description from Badillo et al. 2006
Limit State Description Description 1 Minor Loss of 1% of tiles from the suspension grid. 2 Moderate Loss of 10% of tiles from the suspension grid. 3 Major Loss of 33% of tiles from the suspension grid. 4 Grid Failure Failure of part or the entire suspension grid.
A total of six set-ups were tested using different combinations of: (1) undersized tiles; (2)
undersized tiles with retainer clips; (3) undersized tiles with recycled grid components; (4)
normal sized tiles; (5) normal sized tiles with retainer clips and (6) normal sized tiles without
compression post. Each set-up was tested repeatedly with the protocol described above. Trials
are defined as the number of times one set-up was tested thoroughly and there were 6 trials for
normal sized tiles set-up. Peak floor acceleration and spectral acceleration at periods of 0.2, 0.5,
1.0, 1.5 and 2.0 seconds were used as two demand parameters to construct fragility curves. For
each set-up the following steps were taken to construct fragility curves:
1. Specify excitation amplitude
2. Perform test
3. Record simulator motion and identify peak acceleration
4. Count the number of fallen tiles following each simulation
5. Calculate the percent of fallen tile failure using the total number of tiles
6. Calculate the probability Pf of reaching or exceeding the limit state as: Pf = Nf / N
where Nf is the number of trials where the limit state was exceeded and N is the total
number of trials
7. Determine parameters of the lognormal distribution function
8. Plot fragility curve: the probability of exceeding a limit state versus the corresponding
peak floor acceleration
17
The fragility data for normal tile size configuration was adapted for this study. Due to the
2/3 vertical-horizontal relationship, data had to be interpolated for use in this study. The
procedure for interpolating data from Badillo et al. (2006) is described in Chapter 3.
2.7 Summary and Research Justification
• Damage to structural elements in fixed-base structures has been observed and attributed to the vertical component of ground shaking.
• Isolation systems composed of high shape factor bearings (15<S<25) have low vertical periods (0.03s-0.15s) that aligns with the region of the vertical spectrum where there is significant amplification.
• Vertical acceleration demands ranging from 1.3g to 4g were observed in the upper stories of a full-scale five-story steel building during recent earthquake simulation tests that included the vertical component of excitation. Damage to suspended ceiling systems was also observed attributed to large vertical acceleration demands.
• Past efforts to achieve three-dimensional isolation are either not viable (low shape factor) or costly and have unproven reliability (Japanese systems).
• There is a lack of a systematic understanding of how the vertical properties of the isolation system affect vertical demands and the likelihood of damage to structural and nonstructural components.
18
Chapter 3
Research approach
3.1 General
This chapter provides details of the prototype structures, analytical models and protective
systems considered in this study. Twenty sets of ground motions used for response history
analysis are briefly described. Finally, information to formulate fragility curves used to estimate
damage to suspended ceiling system is provided at the end of this chapter.
3.2 Methods
1. Develop analytical models of base isolated frames.
2. Perform parameter study on shape factor (S)
3. Evaluate performance of suspended ceiling system using fragility curves adopted from
Badillo et al. 2006
4. Modify based isolated frames to mitigate damage as follow:
• Added vertical damping
• Vertical distributed flexibility
5. Evaluate mitigation schemes
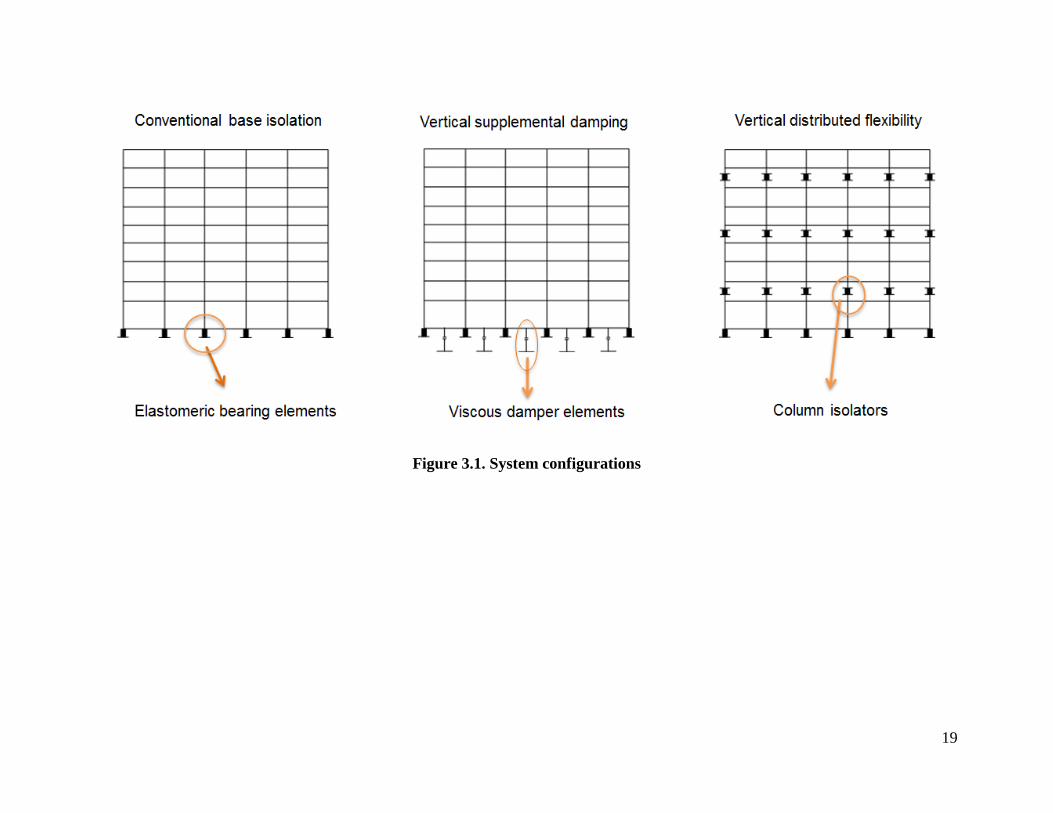
Figure 3.1 illustrates three different analytical model configurations used in this study,
namely: (1) structure with conventional base isolation, (2) structure with conventional base
isolation and vertical supplemental dampers, and (3) structure with conventional base isolation
and column isolators.
19
Figure 3.1. System configurations

20
3.3 Prototype superstructure
The three-story and nine-story pre-Northridge steel moment frames developed by Gupta
and Krawinkler (1999) for the SAC (a joint venture of the Structural Engineers Association of
California, Applied Technology Council and California Universities for Research in Earthquake
Engineering) steel project were selected as the prototype super-structural systems for the models
used in this study. These structures are office buildings located in Los Angeles, California,
designed according to the 1994 UBC building code. Schematics for the floor plans and
elevations of the three-story and nine-story buildings are shown in Fig. 3.2. Both structures
consist of perimeter moment resisting frames to resist lateral earthquake loads and interior
gravity frames. For this study, only the north-south perimeter moment frames were considered
for the two dimensional analytical model. Member section sizes for the perimeter moment
frames of the three-story and nine-story frames are summarized in Tables 3.1 and 3.2. In Fig 3.2,
“L” indicates lateral force resisting frame and “G” indicates gravity frame. Further details
pertaining to the design of the moment frames can be found from Gupta and Krawinkler (1999)
report.
21
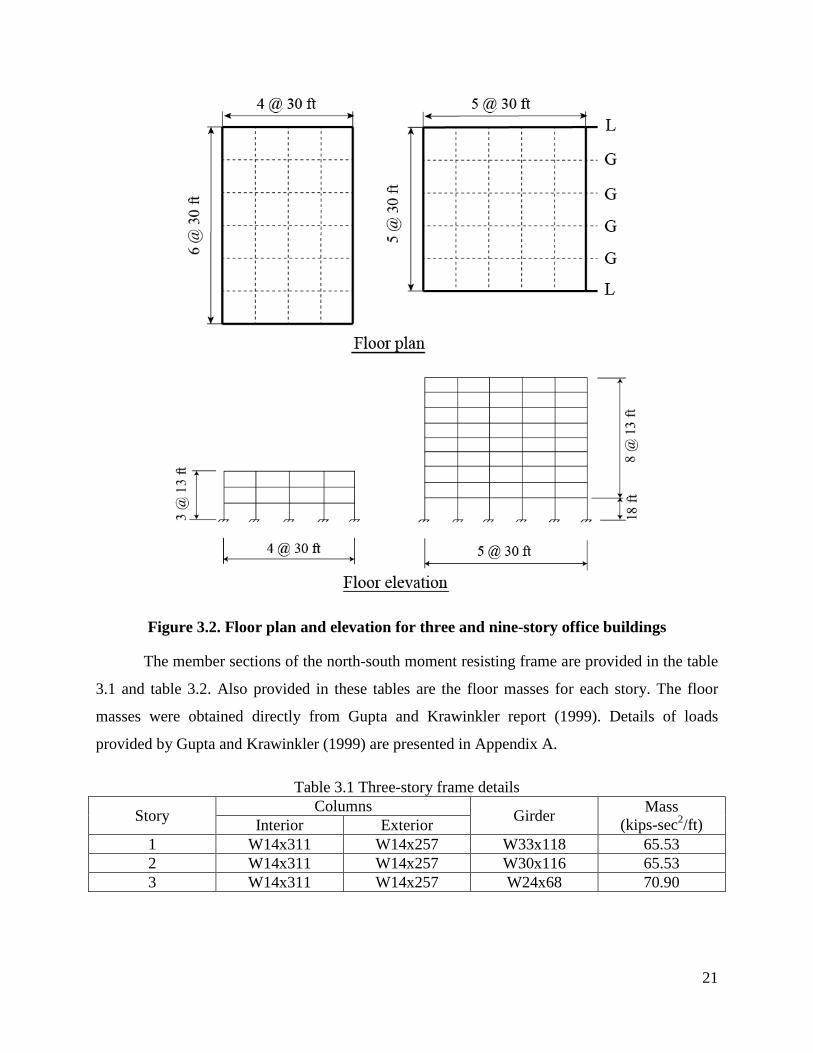
Figure 3.2. Floor plan and elevation for three and nine-story office buildings
The member sections of the north-south moment resisting frame are provided in the table
3.1 and table 3.2. Also provided in these tables are the floor masses for each story. The floor
masses were obtained directly from Gupta and Krawinkler report (1999). Details of loads
provided by Gupta and Krawinkler (1999) are presented in Appendix A.
Table 3.1 Three-story frame details
Story Columns Girder Mass (kips-sec2/ft) Interior Exterior
1 W14x311 W14x257 W33x118 65.53 2 W14x311 W14x257 W30x116 65.53 3 W14x311 W14x257 W24x68 70.90

22
Table 3.2 Nine-story frame details
Story Columns Girder Mass (kips-sec2/ft) Interior Exterior
1 W14x500 W14x370 W36x160 69.04 2 W14x500 W14x370 W36x160 67.86 3 W14x455 W14x370 W36x135 67.86 4 W14x455 W14x370 W36x135 67.86 5 W14x370 W14x283 W36x135 67.86 6 W14x370 W14x283 W36x135 67.86 7 W14x283 W14x257 W30x99 67.86 8 W14x283 W14x257 W27x84 67.86 9 W14x257 W14x233 W24x68 73.10
3.4 Analytical model
In this research, only north-south perimeter moment resisting frames (“L” as shown in
Fig. 3.2) were considered for the analytical study. The gravity frames have negligible effect on
seismic response and the design of north-south and east-west moment resisting frames is similar.
Two-dimensional models were used instead of three-dimensional models to eliminate difficulty
with modeling floor system. Models were developed using the OpenSees (Open System for
Earthquake Engineering Simulation 2009) software that is developed and provided by the Pacific
Earthquake Engineering Research (PEER) Center (http://opensees.berkeley.edu).
3.4.1 Superstructure system
The base isolation system was proportioned using the yield strength of the perimeter
frames obtained from push-over analysis (Gupta and Krawinkler 1999) so that the base isolated
super-structure would remain elastic or nearly elastic during a design basis event. For this reason,
the superstructure elements were modeled using beam-column elements with linear elastic
material properties. Each element was assigned the appropriate member's cross-sectional area
and moment of inertia according to the prototype frames (see Tables 3.1 and 3.2). The modulus
of elasticity and Poisson’s ratio for each member were specified to be 29,000 ksi and 0.3,
respectively. Finally, beam-column connections were modeled rigidly.
3.4.2 Mass and Loadings
In these models, mass is lumped at nodes at the intersections of the beams and columns.
In order to represent a three-dimensional building using a two-dimensional model the mass had
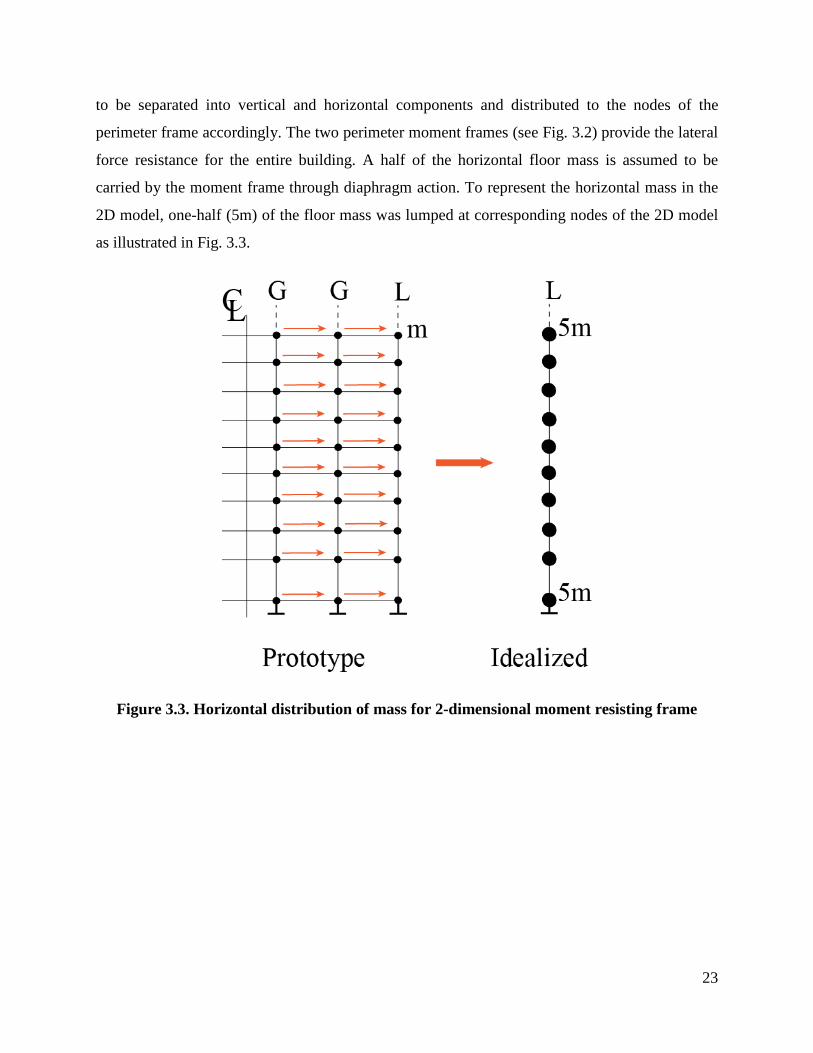
23
to be separated into vertical and horizontal components and distributed to the nodes of the
perimeter frame accordingly. The two perimeter moment frames (see Fig. 3.2) provide the lateral
force resistance for the entire building. A half of the horizontal floor mass is assumed to be
carried by the moment frame through diaphragm action. To represent the horizontal mass in the
2D model, one-half (5m) of the floor mass was lumped at corresponding nodes of the 2D model
as illustrated in Fig. 3.3.
Figure 3.3. Horizontal distribution of mass for 2-dimensional moment resisting frame
24
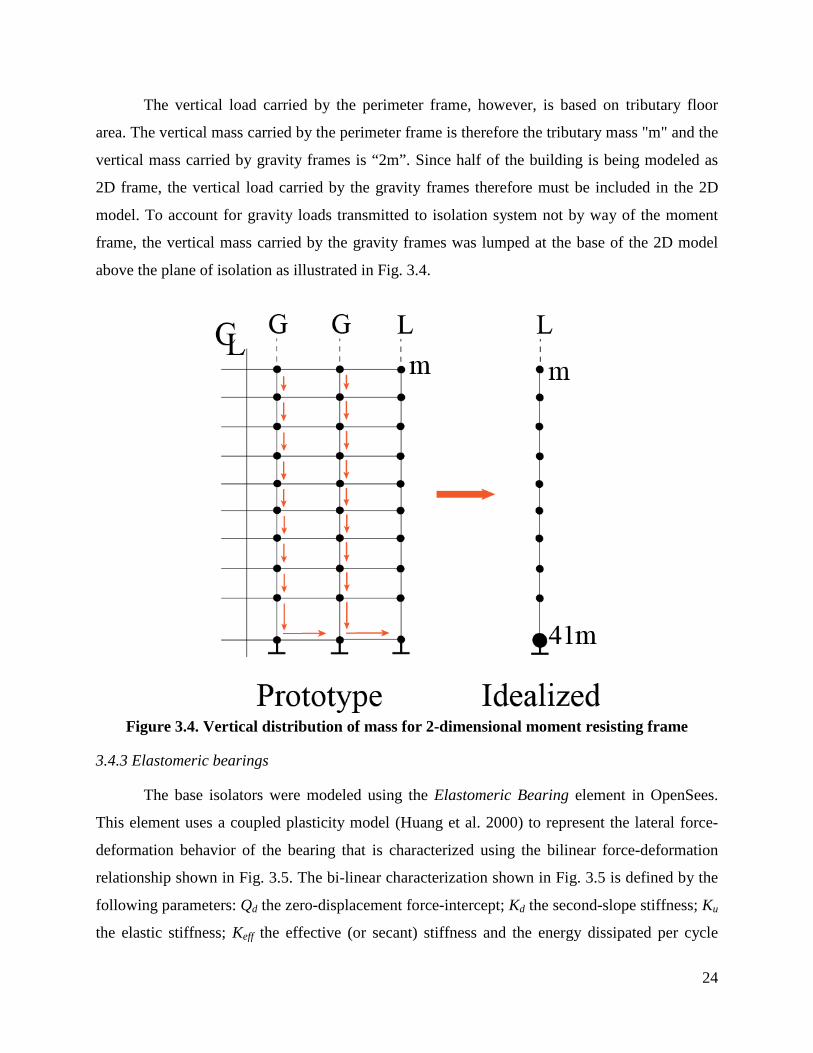
The vertical load carried by the perimeter frame, however, is based on tributary floor
area. The vertical mass carried by the perimeter frame is therefore the tributary mass "m" and the
vertical mass carried by gravity frames is “2m”. Since half of the building is being modeled as
2D frame, the vertical load carried by the gravity frames therefore must be included in the 2D
model. To account for gravity loads transmitted to isolation system not by way of the moment
frame, the vertical mass carried by the gravity frames was lumped at the base of the 2D model
above the plane of isolation as illustrated in Fig. 3.4.
Figure 3.4. Vertical distribution of mass for 2-dimensional moment resisting frame
3.4.3 Elastomeric bearings
The base isolators were modeled using the Elastomeric Bearing element in OpenSees.
This element uses a coupled plasticity model (Huang et al. 2000) to represent the lateral force-
deformation behavior of the bearing that is characterized using the bilinear force-deformation
relationship shown in Fig. 3.5. The bi-linear characterization shown in Fig. 3.5 is defined by the
following parameters: Qd the zero-displacement force-intercept; Kd the second-slope stiffness; Ku
the elastic stiffness; Keff the effective (or secant) stiffness and the energy dissipated per cycle

25
(EDC). Further details needed to model the elastomeric bearings for three and nine-story frames
are provided in Appendix D.
The vertical force-deformation behavior was also modeled having bi-linear relationship
(Fig 3.5) to account for inherent vertical damping property of rubber. Fig 3.6 illustrates the first
system configuration considered in this research: 3- and 9-story frame with conventional base
isolation.
Figure 3.5. Bilinear force-deformation characterization for elastomeric bearing
Figure 3.6. Illustration of 3- and 9-story frame with conventional base isolation

26
3.4.4 Dampers
As described in section 3.2, the benefit of viscous fluid dampers for mitigating damage to
nonstructural systems in the upper stories of the base-isolated superstructure is explored as part
of this study. The viscous dampers were modeled at the plane of isolation and oriented in the
vertical direction as illustrated in Fig. 3.7. The dampers are modeled using Truss element in
OpenSees (2009). Each truss element was assigned viscous-elastic material to represent the rate
dependent force-deformation behavior of viscous-fluid dampers. The damper elements were
assumed to be linear-viscous with a velocity exponent equal to 1 and a damping coefficient c.
The damping force (FD) is expressed as follows: .DF cu= The length of the damper elements was
specified to be equal to the height of the first story of each frame to minimize rotation from the
vertical orientation due to lateral displacement of the isolation system.
Figure 3.7. Illustration of 3- and 9-story frame with conventional base isolation and supplemental viscous dampers
3.4.5 Column isolators
As described in section 3.2, a vertically distributed flexibility scheme is considered in this
study to minimize or eliminate damage to nonstructural systems due to the vertical component of
ground shaking. Vertical flexibility in the superstructure is achieved by introducing bearings in
the column line of the upper levels of the superstructure as illustrated in Fig. 3.8. Zero-length
elements (OpenSees 2009) were used to model column bearings. The zero-length element is
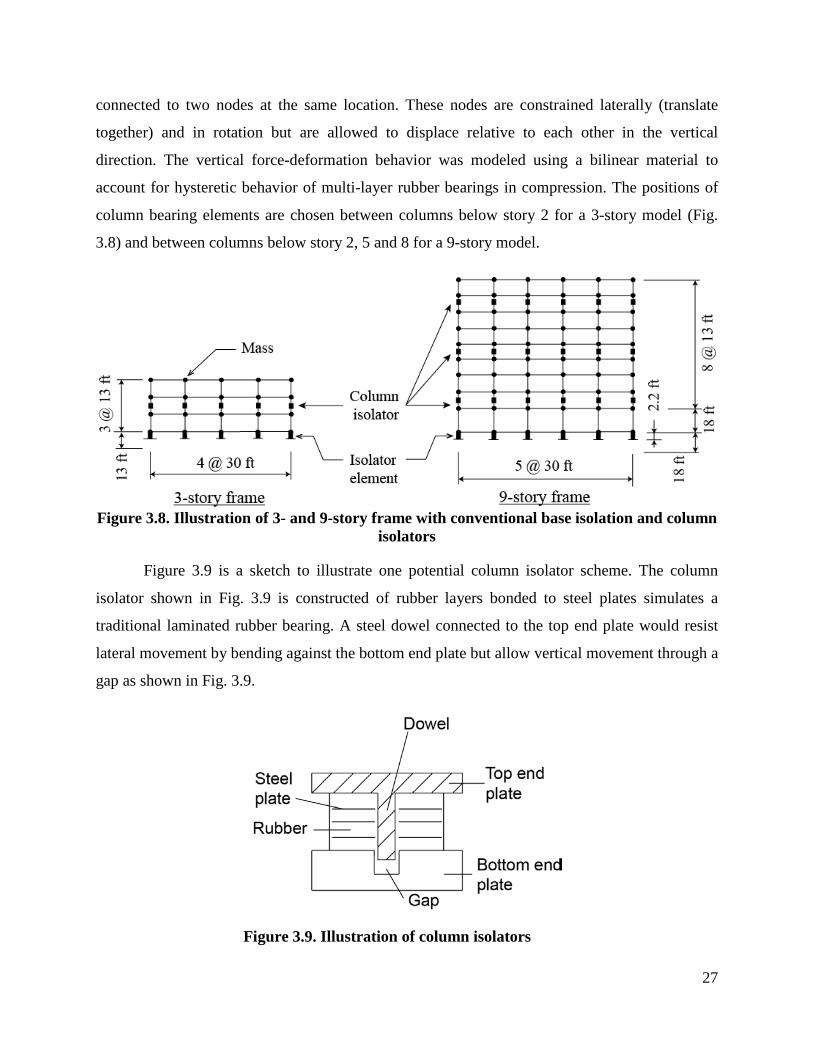
27
connected to two nodes at the same location. These nodes are constrained laterally (translate
together) and in rotation but are allowed to displace relative to each other in the vertical
direction. The vertical force-deformation behavior was modeled using a bilinear material to
account for hysteretic behavior of multi-layer rubber bearings in compression. The positions of
column bearing elements are chosen between columns below story 2 for a 3-story model (Fig.
3.8) and between columns below story 2, 5 and 8 for a 9-story model.
Figure 3.8. Illustration of 3- and 9-story frame with conventional base isolation and column isolators
Figure 3.9 is a sketch to illustrate one potential column isolator scheme. The column
isolator shown in Fig. 3.9 is constructed of rubber layers bonded to steel plates simulates a
traditional laminated rubber bearing. A steel dowel connected to the top end plate would resist
lateral movement by bending against the bottom end plate but allow vertical movement through a
gap as shown in Fig. 3.9.
Figure 3.9. Illustration of column isolators

28
3.5 Earthquake ground motions
Recorded earthquake ground motions obtained from historical earthquake events were
collected and used to facilitate response history analysis of the analytical models. A set contains
2 horizontal and 1 vertical component ground motions which are obtained from the Pacific
Earthquake Engineering Research ground motion database (PEER 2011). Twenty sets of
earthquake ground motions were organized into a bin. Summary information for this bin is
presented in Table 3.3. Details of the individual ground motions contained in Bin 1 can be found
in Appendix B. Individual and average elastic, 5% of critical damping, acceleration response
spectra generated from the horizontal and vertical components of ground motions contained in
Bin 1 are shown in Fig. 3.10. The average spectra presented in Fig. 3.10 was considered design
spectra and used to design the protective systems including the base isolation systems for the
three- and nine-story frames. A design 5 percent damped spectral acceleration parameter at 1s
period is 0.84g from Fig. 3.10.
Table 3.3 Summary of ground motion bins
Bin Number of ground motions/sets
Site class (USGS classification)
Distance to rupture surface (km)
Moment Magnitude
1 30/10 A & B 0.96 - 8.88 6.7 – 7.6
Figure 3.10. Elastic, 5% damping, earthquake response spectra for Bin 1: (a) horizontal spectra; (b) vertical spectra

29
3.6 Design of protective system
3.6.1 Base isolation
The base isolation system is designed so that the superstructure remains elastic under a
design level event. A push-over analysis of the fixed-base three- and nine-story frames was
performed to determine the elastic capacity of the frames (Vs). Results of the push-over analysis
of the three- and nine-story frames are provided in Appendix C.
From the push-over analysis, the maximum base shear that the structure can sustain while
remaining elastic (Vs) was determined. The following equation derived from Eq. 17.5-1 and Eq.
17.5-8 (ASCE 2010) is used to calculate the design period (TD) for the superstructure to remain
elastic:
1DD
I D s
S WTR B V
≥ (3.1)
where SD1 is a design 5 percent damped spectral acceleration parameter at 1s period in units of g
(acceleration due to gravity), BD is a numerical coefficient related to the effective damping of the
isolation system (BD = 1.2 for 10% damping), RI is the numerical coefficient related to the type
of seismic force-resisting system above the isolation system (RI = 1.5 for an isolated moment
resisting frame) and W is the weight of the entire structure (superstructure and seismic isolation
system).
The designed horizontal displacement of the isolation (ASCE 2010) is calculated as:
(3.2)
where g is the acceleration due to gravity calculated in units of in/s2. The effective horizontal
stiffness of the seismic isolation system (AASHTO 2010) is calculated as:
(3.3)
where m is the mass of the whole structure. The effective stiffness of the entire isolation system
is then distributed to each isolation bearings in the ratio of 1:2 for exterior and interior columns
124D D
DD
gS TDBπ
=
22
effD
K mTπ
= ×

30
so that the static pressure in every bearing is similar. Table 3.4 presents details of the designed
isolation systems for the 3- and 9-story frame. Further details for individual elastomeric bearings
are provided in Appendix D.
Table 3.4 Details of isolation system properties
Frame Design period (sec.)
Effective stiffness (kips/in)
Design displacement (in)
3 2 99 13.7 9 3.5 89 24
3.6.2 Column isolators
There is no codified procedure to proportion the column isolator. Instead, the column
isolators were proportioned so that the critical load capacity of the bearings satisfied the
AASHTO (2010) service stability requirement:
3cro
D L
PP P
≥+
(3.4)
where Pcro is the critical load capacity of the bearing in the laterally un-deformed configuration
(Eq. 2.7). It is assumed that the height of column bearings are 4 in and the static pressures in
these bearings range from 0.5-0.75 ksi. A summary of the column bearing design is presented in
Table 3.5 including the resulting vertical stiffness calculated according to Eq. 2.2 presented in
Chapter 2. Details for individual column isolators are provided in Appendix G.
Table 3.5 Summary of column isolators’ properties
Frame Gravity loads
(kips) Pcro
(kips) Pcro / Gravity load Vertical stiffness
(kips/in) Exterior Interior Exterior Interior Exterior Interior Exterior Interior
3 56 112 193 386 3.45 3.45 360 509 9-floor 2 253 506 809 1620 3.2 3.2 1304 1844 9-floor 5 155 309 475 948 3.07 3.07 669 944 9-floor 8 56 112 193 386 3.45 3.45 360 509
31
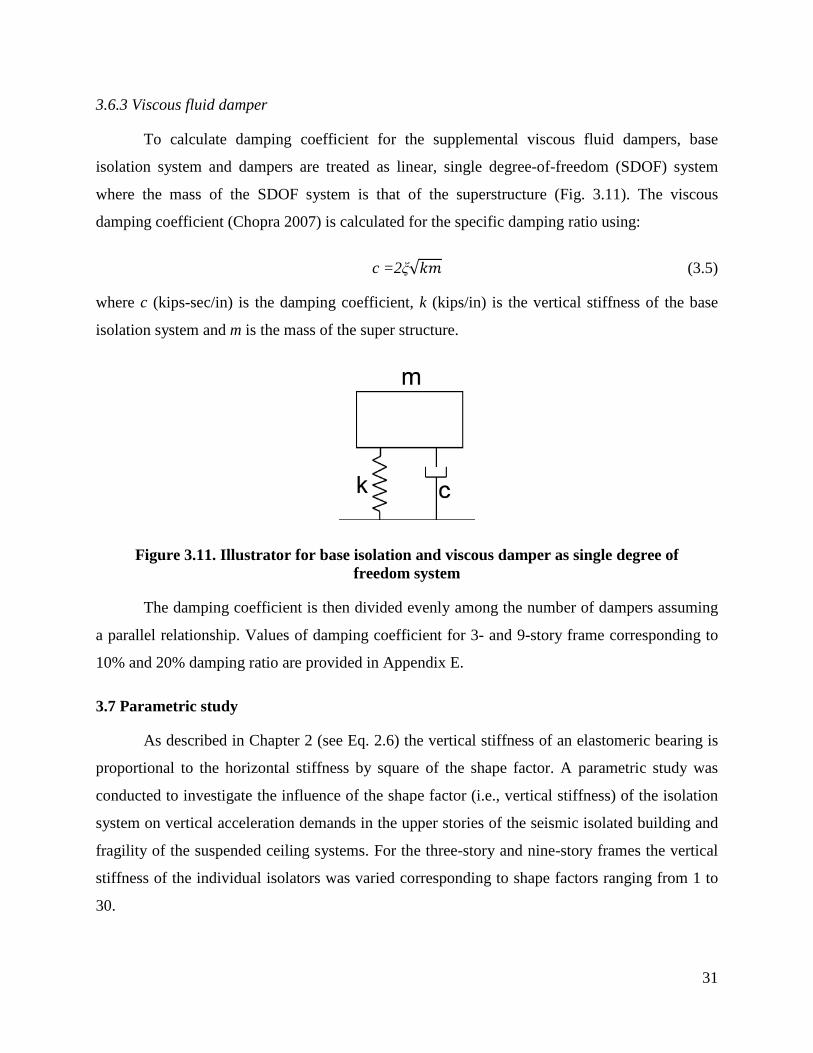
3.6.3 Viscous fluid damper
To calculate damping coefficient for the supplemental viscous fluid dampers, base
isolation system and dampers are treated as linear, single degree-of-freedom (SDOF) system
where the mass of the SDOF system is that of the superstructure (Fig. 3.11). The viscous
damping coefficient (Chopra 2007) is calculated for the specific damping ratio using:
c =2ξ√𝑘𝑚 (3.5)
where c (kips-sec/in) is the damping coefficient, k (kips/in) is the vertical stiffness of the base
isolation system and m is the mass of the super structure.
Figure 3.11. Illustrator for base isolation and viscous damper as single degree of freedom system
The damping coefficient is then divided evenly among the number of dampers assuming
a parallel relationship. Values of damping coefficient for 3- and 9-story frame corresponding to
10% and 20% damping ratio are provided in Appendix E.
3.7 Parametric study
As described in Chapter 2 (see Eq. 2.6) the vertical stiffness of an elastomeric bearing is
proportional to the horizontal stiffness by square of the shape factor. A parametric study was
conducted to investigate the influence of the shape factor (i.e., vertical stiffness) of the isolation
system on vertical acceleration demands in the upper stories of the seismic isolated building and
fragility of the suspended ceiling systems. For the three-story and nine-story frames the vertical
stiffness of the individual isolators was varied corresponding to shape factors ranging from 1 to
30.
32
In addition to varying the shape factor (i.e., vertical stiffness) the damping ratios for the
supplemental viscous fluid dampers (as described in section 3.2) were varied between 0 and 20%
of critical to investigate the influence of vertical supplemental viscous damping on vertical
acceleration demands in the upper stories of the super-structure and fragility of suspended ceiling
systems.
3.8 Formulation of fragility curves
Fragility data from Badillo et al. (2006) was adapted for this study to evaluate the
effectiveness of the mitigation strategies described in section 3.2. From the results of tests
conducted by Badillo et al. (2006), the performance of the suspended ceiling system is sensitive
to the type of seismic input. More specifically, higher degrees of damage were observed when
ceiling system was subjected to simultaneous horizontal and vertical excitations by comparison
to only horizontal or vertical excitation. However, the tests performed by Badillo used synthetic
ground motions that were generated from vertical and horizontal spectra related by the traditional
2/3 ratio. For a base isolated structure, the horizontal acceleration demands are expected to be
much lower than the vertical, requiring the data presented in Badillo et al. (2006) to be
interpolated for use in this study. Using data provided by Badillo et al (2006), fragility curves for
peak vertical floor acceleration corresponding to a specified horizontal acceleration demand were
developed. A step-by-step description of the process to construct the fragility curve for the minor
damage state is as follows:
• Assemble data from Badillo tests as shown in Table 3.6 for the probability of exceeding minor damage of ceiling system;
• Interpolate data in Table 3.6 to calculate probability of exceeding minor damage for each vertical acceleration demand with a specific horizontal acceleration demand; achieve Table 3.7. A value of 0.85g peak horizontal floor acceleration was chosen for purpose of illustration.
• Determine parameters of the lognormal distributions;
• Perform the Kolmogorov-Smirnov (K-S) test for 5% significance level to validate the log-normal distribution and optimize log-normal distribution parameters;
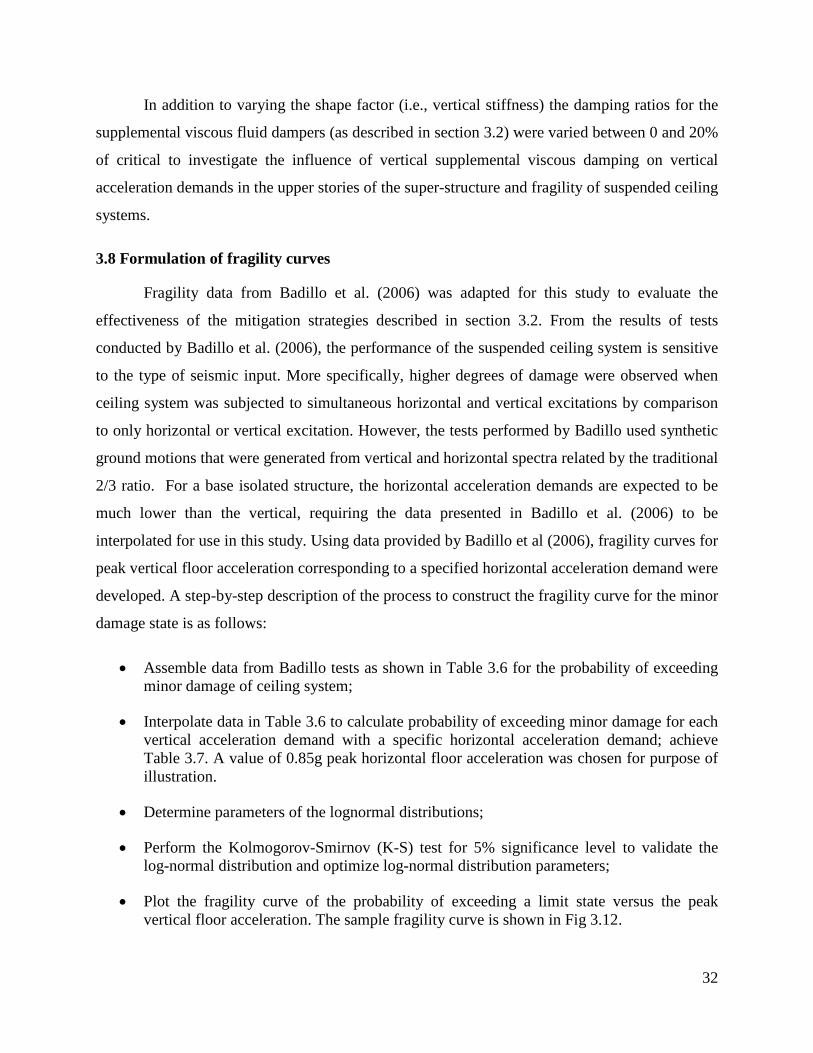
• Plot the fragility curve of the probability of exceeding a limit state versus the peak vertical floor acceleration. The sample fragility curve is shown in Fig 3.12.
33
Table 3.6 Badillo data for minor damage probability of failure Probability of failure (%) PVFA(g) 0 0.735 0.853 0.941 1.02 1.1 PHFA(g)
0 0 0 0 0 0 50 0.781 0 0 0.969 0 50 1.14 17 100 100 100 1.51 33 100 100 100
2 83 100 100 100
Table 3.7 Interpolated data for a specified peak horizontal floor acceleration
Probability of failure (%) PVFA(g) 0 0.735 0.853 0.941 1.1 1.15 PHFA(g)
0.85 0 0 44 75 87 100
Figure 3.12. Sample fragility curve for peak vertical floor acceleration corresponding to peak floor horizontal acceleration 0.85g
From Fig. 3.12, the probability of having minor damage for a 1g vertical and 0.85g
horizontal acceleration demand could be estimated as 79%. Fragility curves for peak vertical
acceleration corresponding to peak horizontal acceleration equal to 0.85g and 0.05g are
presented in Fig. 3.13 and 3.14. Curves are presented for the first three limit states that were
defined in Table 2.1. Tables 3.8 and 3.9 present the values of the mean, standard deviation of the

34
log-normal distribution used to construct those fragility curves. Details to formulate Figs 3.13
and 3.14 as well as Tables 3.8 and 3.9 can be found in Appendix F.
Figure 3.13. Fragility curve for peak floor vertical acceleration corresponding to peak floor horizontal acceleration 0.85g
Figure 3.14. Fragility curve for peak floor vertical acceleration corresponding to peak floor horizontal acceleration 0.05g
In Fig. 3.14, the major line coincides with the axis meaning major damage is not going to
happen until vertical acceleration demands exceed 6g.

35
3.9 Estimate probability of failure for ceiling systems
The probabilities of failure were calculated as the average values of twenty failure
probabilities calculated from twenty analyses (Pf). This section illustrates how to use fragility
curve to estimate probability of failure from vertical and horizontal acceleration demands from
one analysis (Pi).
(3.6)
As shown later in Chapter 4, peak floor horizontal acceleration ranges from 0.05g to
0.85g and by interpolating between the 0.05 and 0.85 fragility curves for a given vertical
acceleration demand, a probability of failure for a single analysis can be calculated as shown in
Fig. 3.15.
Table 3.8 Log-normal parameters of fragility curve for PHA = 0.05g
Mean (𝜆)
Standard Deviation (𝜉)
Difference (Dn)
Minor 0.112 0.134 0.069 Moderate 1.07 0.235 0.03
Major 5 0.5 N/A
Table 3.9 Log-normal parameters of fragility curve for PHA = 0.85g
Mean (𝜆)
Standard Deviation (𝜉)
Difference (Dn)
Minor -0.0956 0.114 0.151 Moderate 0.106 0.138 0.117
Major 0.422 0.219 0.075

36
Figure 3.15. Illustration for estimate probability having minor damage
For instance, a probability of exceeding minor damage state in ceiling system is needed
to be estimated knowing that the vertical and horizontal acceleration demands are 1g and 0.45g,
respectively. Figure 3.15 shows that probability having minor damage as peak vertical
acceleration = 1g and peak horizontal acceleration = 0.85g is 79%. Similarly, probability having
minor damage as peak vertical acceleration = 1g and peak horizontal acceleration = 0.05g is
21%. An interpolation to estimate probability having minor damage as peak vertical acceleration
= 1g and peak horizontal acceleration = 0.45g is (79+21)/2 = 50%.
37
Chapter 4
Analytical results
4.1 General
Results from the analytical studies are presented in this chapter. The primary metrics for
assessing the performance of the various systems described in Chapter 3 are the vertical absolute
acceleration demands in the superstructure and the probability that the suspended ceiling system
exceeds a given limit state. These metrics are used to evaluate the three configurations, namely:
base isolated frame; base isolation with supplemental damping and base isolation with vertically
distributed column isolators. The vertical acceleration demands presented in this chapter are the
average acceleration demands obtained from the results of twenty response history analyses of
each individual model using the ground motion sets in bin 1. Finally, rough estimations of the
probability of failure for ceiling systems were calculated using fragility data. It is important to
note that the failure probabilities are a metric for comparison and not prediction.
4.2 Results from parametric study of the base isolated frames
A parametric study was conducted to investigate the influence of the vertical stiffness
(i.e., shape factor) on acceleration demands and fragility of suspended ceilings in the upper
levels of base isolated frames. Eighteen values of the shape factor were analyzed ranging from 1
to 30.
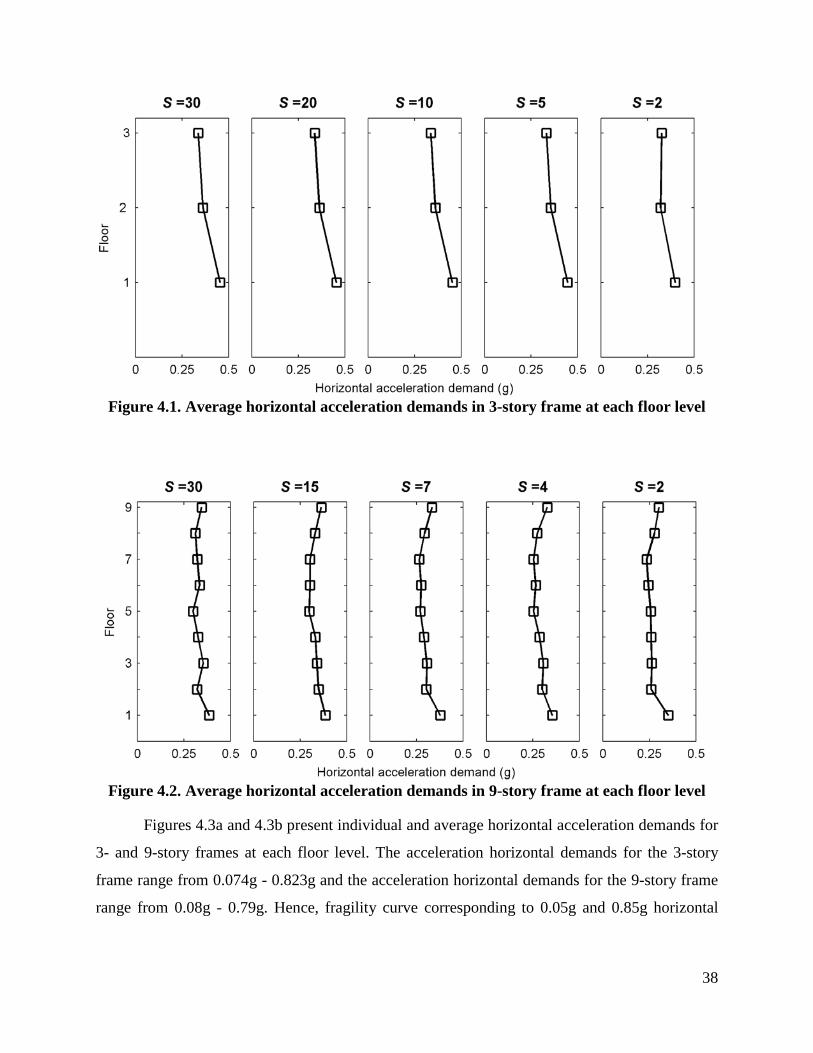
4.2.1 Horizontal acceleration demands
Average horizontal acceleration demands at all floor levels for 3-story and 9-story frames
are plotted in Figs. 4.1 and 4.2 respectively. Horizontal accelerations demand presented in Figs.
4.1 and 4.2 are the average of twenty peaks horizontal acceleration demands at a particular floor
in units of gravity (g). Figs. 4.1 and 4.2 show that the horizontal acceleration demands in both
the 3- and 9-story frames are nearly constant for each different shape factor. This result was
expected because changing shape factor only affects the vertical stiffness of the structures.
38
Figure 4.1. Average horizontal acceleration demands in 3-story frame at each floor level
Figure 4.2. Average horizontal acceleration demands in 9-story frame at each floor level
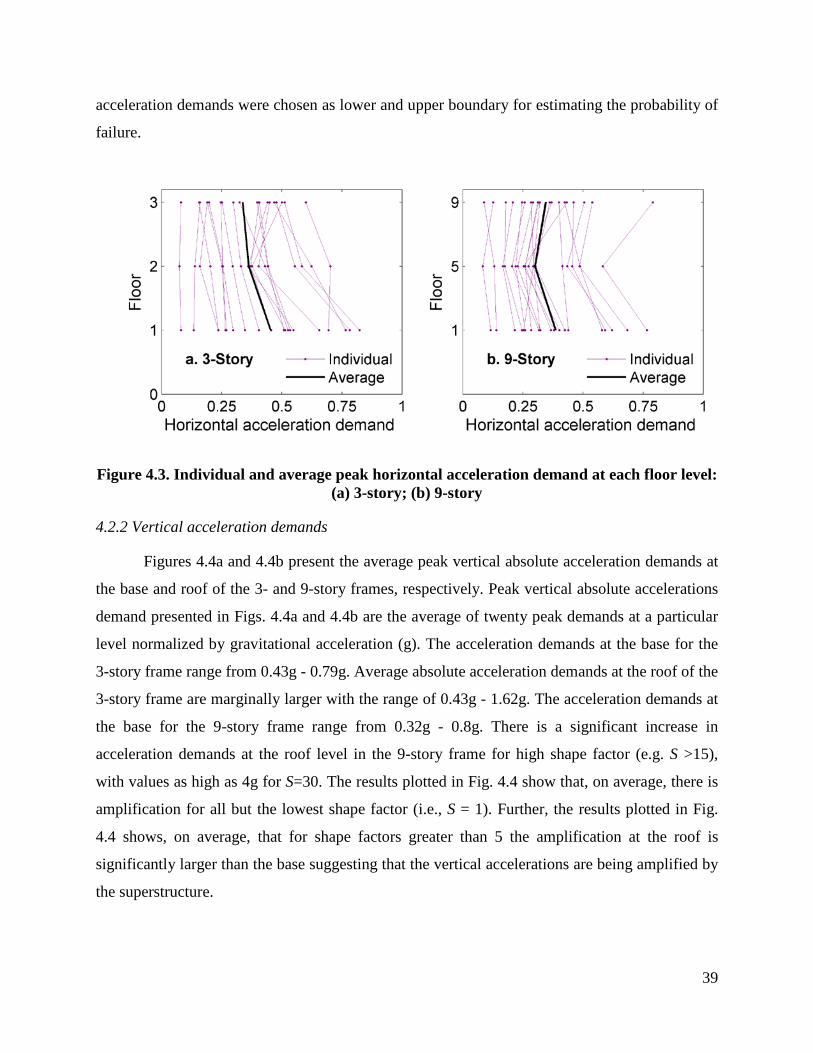
Figures 4.3a and 4.3b present individual and average horizontal acceleration demands for
3- and 9-story frames at each floor level. The acceleration horizontal demands for the 3-story
frame range from 0.074g - 0.823g and the acceleration horizontal demands for the 9-story frame
range from 0.08g - 0.79g. Hence, fragility curve corresponding to 0.05g and 0.85g horizontal
39
acceleration demands were chosen as lower and upper boundary for estimating the probability of
failure.
Figure 4.3. Individual and average peak horizontal acceleration demand at each floor level: (a) 3-story; (b) 9-story
4.2.2 Vertical acceleration demands
Figures 4.4a and 4.4b present the average peak vertical absolute acceleration demands at
the base and roof of the 3- and 9-story frames, respectively. Peak vertical absolute accelerations
demand presented in Figs. 4.4a and 4.4b are the average of twenty peak demands at a particular
level normalized by gravitational acceleration (g). The acceleration demands at the base for the
3-story frame range from 0.43g - 0.79g. Average absolute acceleration demands at the roof of the
3-story frame are marginally larger with the range of 0.43g - 1.62g. The acceleration demands at
the base for the 9-story frame range from 0.32g - 0.8g. There is a significant increase in
acceleration demands at the roof level in the 9-story frame for high shape factor (e.g. S >15),
with values as high as 4g for S=30. The results plotted in Fig. 4.4 show that, on average, there is
amplification for all but the lowest shape factor (i.e., S = 1). Further, the results plotted in Fig.
4.4 shows, on average, that for shape factors greater than 5 the amplification at the roof is
significantly larger than the base suggesting that the vertical accelerations are being amplified by
the superstructure.

40
Figure 4.4. Average vertical acceleration demands versus shape factor: (a) 3-story and (b) 9-story
4.2.3 Fragility of suspended ceilings
Fragility curves generated from data presented in Badillo et al. (2006) were used with the
vertical acceleration demands to estimate the probability of exceeding specific limit states. The
probability information was then used to evaluate the performance of the isolated frame with
different bearing shape factors. Average vertical acceleration demands at all floor levels for 3-
story and 9-story frames are plotted in Figs. 4.5 and 4.7 respectively and the probability of
exceeding three damage states for selected shape factors are plotted in Figs. 4.6 and 4.8. In Fig.
4.6, the first row plots presents the probability that damage from story 1 to 3 could exceed the
minor state; the second row is the probability that damage exceed moderate state. Finally, the
third row is the probability that damage exceed major state. The same interpretation could be
applied for Fig. 4.8.
The probabilities of failure were calculated as the average values of twenty failure
probabilities calculated from the vertical acceleration demands of twenty analyses. As described
in Chapter 2, peak vertical acceleration recorded at the shake table was used to formulate the
fragility curve for the ceiling system hence the peak vertical acceleration at floor 1 was used to
assess damage for the ceiling system at story 1. This calculation was repeated for floors 2 to 9.

41
Figure 4.5. Average vertical acceleration demands in 3-story frame at each floor level
Figure 4.6. Probability of exceeding minor, moderate and major damage states for suspended ceiling systems in 3-story frame
42
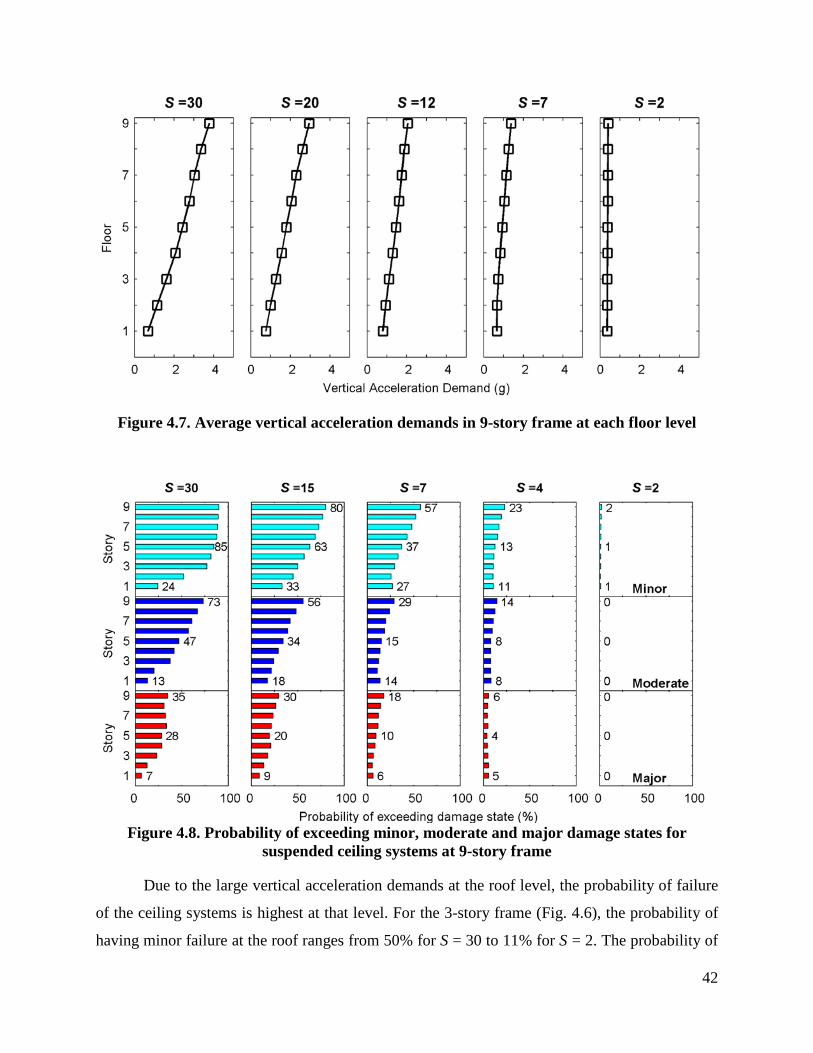
Figure 4.7. Average vertical acceleration demands in 9-story frame at each floor level
Figure 4.8. Probability of exceeding minor, moderate and major damage states for suspended ceiling systems at 9-story frame
Due to the large vertical acceleration demands at the roof level, the probability of failure
of the ceiling systems is highest at that level. For the 3-story frame (Fig. 4.6), the probability of
having minor failure at the roof ranges from 50% for S = 30 to 11% for S = 2. The probability of

43
having major damage is much smaller which ranges from 16% for S = 30 to 5% for S = 2. For
the 9-story frame (Fig 4.8), the probability of having minor failure at the roof ranges from 90%
for S = 30 to 2% for S = 2, and the probability of having major damage ranges from 35% for S =
30 to 0% for S = 2. The results plotted in Figs. 4.6 and 4.8 suggest that using low shape factors (S
≤ 2) effectively mitigates damage to ceiling systems in both 3- and 9-story frame. However, low
shape factor bearings have practical limitations as discussed in the subsequent section.
4.2.3 Stability and rocking limitations
As illustrated in Figs. 4.4a and 4.4b, isolation systems composed of bearing with low
shaper factor (e.g., S = 1 or 2) effectively limit vertical acceleration demands and thus limit the
likelihood of damage to suspended ceilings as shown in Figs. 4.6 and 4.8. However, stability
limit of the individual bearings and global rocking limit of the structure must be considered. To
identify the lowest shape factor that could practically be implemented, the stability of the
individual bearing in both the 3-story and 9-story frames were assessed using the current
methodology (as described in Chapter 2). Figure 4.9 presents a graphical plot of the stability
assessment for the 3-story frame and each isolation system considered. In this plot, the vertical
load demands at a given lateral displacement (shown by various symbols) are compared to the
predicted capacity of the bearing using the reduced area method (shown by the solid line).
Vertical load demands falling above the capacity of the bearing indicate systems that do not
satisfy the stability criteria. From Fig. 4.9, for the 3-story frame, it can be seen that isolation
systems with S < 5 do not satisfy the stability criteria and therefore are not feasible. For the 3-
story frame the lowest practical shape factor that could be used is S=5. Figure 4.10 presents the
stability assessment for the individual bearings in the 9-story frame. From the results plotted in
this figure the lowest shape factor that satisfies the stability criteria is S=7. Therefore, while the
lower shape factors reduce the likelihood of damage (see Figs. 4.6 and 4.8) they do not satisfy
the stability criteria according to current stability requirements (AASHTO 2010) and are not
feasible.

44
Figure 4.9. Feasible shape factor for 3-story frame
Figure 4.10. Feasible shape factor for 9-story frame

45
In addition to the stability assessment, the global drift or rocking of the superstructure
needs to be considered. In this study, rocking is assessed using the global drift ratio of the
superstructure that is the drift between the roof and base of the superstructure (excludes isolation
drift) divided by the total height of the superstructure. The global drift demands were then
compared to the widely accepted 2 percent value to determine the suitability of a particular
isolation system. Figure 4.11 presents peak global drift ratios versus isolation system shape
factor for the 3-story (Fig. 4.11a) and 9-story (Fig. 4.11b) structures. Plotted in each figure are
the drift ratio demands for each ground motion and shape factor for a given ground motion
(denoted Individual) and the average of the individual drift demands. From the results presented
in Fig. 4.11 the drift demands for all systems do not exceed 2% with a maximum value of 1.2.
Although the drift demands do not exceed the 2% limit for any system, a significant increase in
demand is observed for systems with shape factors less than or equal to 5. Based on these results
a shape factor of 5 was considered as the rocking drift limitation for the 3-story and 9-story
frames. For shape factors below 5, average peak drifts increased exponentially to the maximum
value of 1% for a shape factor of 1. The results presented in Fig 4.11 also suggest that the shape
factors need not be so high (i.e., greater than 20) to mitigate rocking in low- and mid-rise
structures as drift ratio demands are essentially constant for S > 5.
Figure 4.11. Peak drifts versus shape factor for frames with base isolation only: (a) 3-story; (b) 9-story
46
4.3 Results for base isolated frames with supplemental damping
A parametric study was conducted to investigate the influence of supplemental damping
on acceleration demands and fragility of suspended ceilings in the upper levels of base isolated
frames. Three values of the damping ratio were analyzed ranging from 0%, 10% and 20%.
4.3.1 Vertical acceleration demands
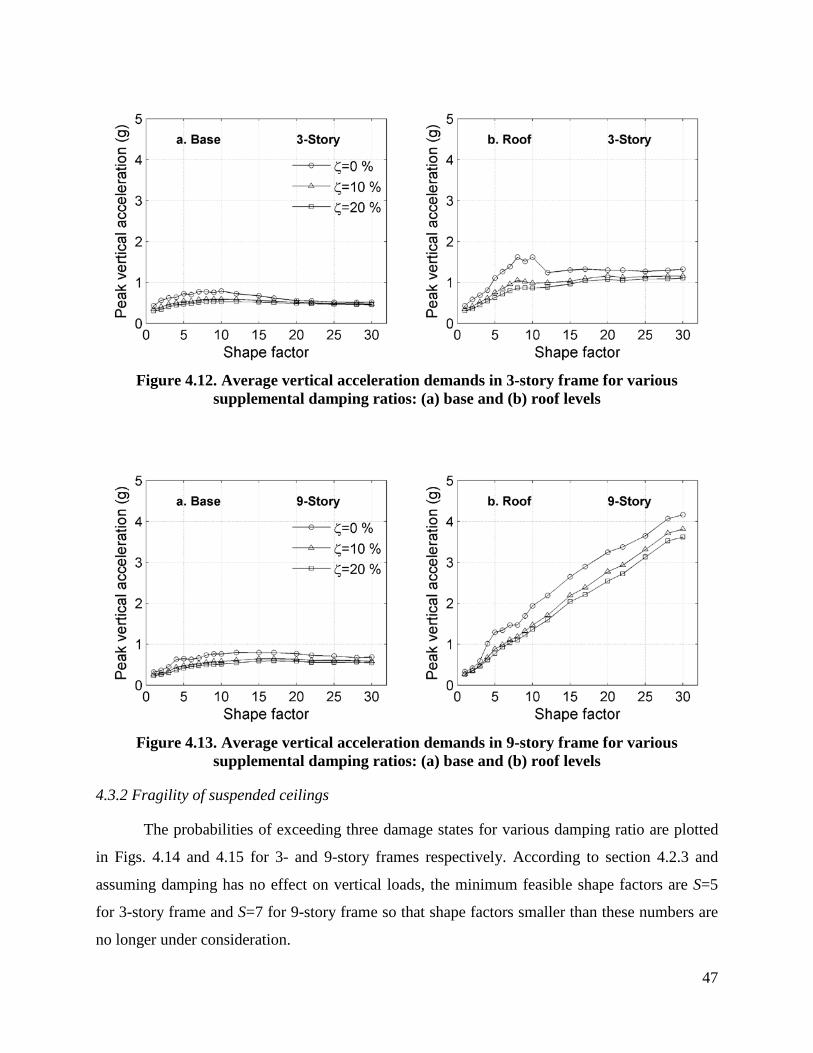
Figures 4.12 and 4.13 present the average peak vertical absolute acceleration demands at
the base and roof of the 3- and 9-story frames, respectively with various supplemental damping
ratios. Peak vertical absolute accelerations demand presented in Figs. 4.12 and 4.13 are the
average of twenty peak demands at a particular level normalized by gravitational acceleration
(g). Fig 4.12 and Fig 4.13 illustrate the influence of supplemental damping in reducing vertical
acceleration demands in which supplemental damping ratios range from 0% - 20% of critical
damping ratio. Results presented in Figs 4.12 and 4.13 show supplemental damping marginally
reduces the vertical acceleration demands at the base and roof of both 3- and 9-story. From Fig
4.13b, at the roof there is significant amplification of the vertical acceleration for S > 5 regardless
of the level of supplemental damping added at the base isolation level. From the results presented
in Figs. 4.12 and 4.13, the lower vertical stiffness (i.e., smaller shape factor) systems effectively
limit the peak vertical acceleration demands however other considerations such as rocking and
bearing stability limit the value of the shape factor that can practically be used as is discussed in
section 4.2.3.
47
Figure 4.12. Average vertical acceleration demands in 3-story frame for various supplemental damping ratios: (a) base and (b) roof levels
Figure 4.13. Average vertical acceleration demands in 9-story frame for various supplemental damping ratios: (a) base and (b) roof levels
4.3.2 Fragility of suspended ceilings
The probabilities of exceeding three damage states for various damping ratio are plotted
in Figs. 4.14 and 4.15 for 3- and 9-story frames respectively. According to section 4.2.3 and
assuming damping has no effect on vertical loads, the minimum feasible shape factors are S=5
for 3-story frame and S=7 for 9-story frame so that shape factors smaller than these numbers are
no longer under consideration.

48
Figure 4.14. Probability of exceeding minor, moderate and major damage states for suspended ceiling systems at 3-story frame
Figure 4.15. Probability of exceeding minor, moderate and major damage states for suspended ceiling systems at 9-story frame

49
The result presented in Figs. 4.14 and 4.15 suggested that adding supplemental damping
for high shape factor bearing system is less beneficial compared to adding supplemental damping
for low shape factor bearing. For shape factor S=30, the probability of exceeding damage for all
three states are almost similar regardless of the level of supplemental damping added at the base
isolation level. It can be explained as the large vertical stiffness (Kv) of high shape factor bearing
restrains the damper from dissipating energy. Furthermore, the combination of moderate shape
factor (S=5 for 3-story frame and S=7 for 9-story frame) with supplemental damping appear
effective for preventing major damage occur to the ceiling systems.
4.4 Results for base isolated frames with column isolators
As shown in the previous sections of this chapter isolation systems composed of low
shape factor bearing can reduce the likelihood of damage (especially major) to suspended ceiling
systems in both the 3- and 9-story frames. However, due to the stability limit of the bearings, low
shape factors, i.e., below 5 and 7, are not feasible. Recognizing this, an alternative strategy of
employing multiple planes of vertical flexibility in the upper stories of the build is explored. A
potential benefit of the vertically distributed flexibility is that a similar vertical period can be
achieved (similar to the low shape factor systems) but minimize stability issues and rocking
because the flexibility is not concentrated at the base but rather distributed along the height of the
building. This section presents results from an analytical exploration of the vertical distributed
flexibility concept also referred to as "base isolated with column isolation."
4.4.1 Stability and rocking considerations
The results of the response history analyses for the 3-story and 9-story frames with
column isolators installed as described in Chapter 3 were evaluated to determine peak drift
values. Since the column isolators were proportioned using stability criteria (see Chapter 3) it is
assumed that stability of the column isolators has been satisfied a priori. Figure 4.16 presents
peak drift at the roof of the 3- and 9-story frames with column isolators. Although the individual
drift values different from those without column isolators (i.e. Fig. 4.11), the average drift values
are similar to those shown in Fig. 4.11. Consideration of the stability of the base isolators
indicated that the lower limit of feasible shape factors for the 3- and 9-story frames remain to be
5 and 7, respectively.
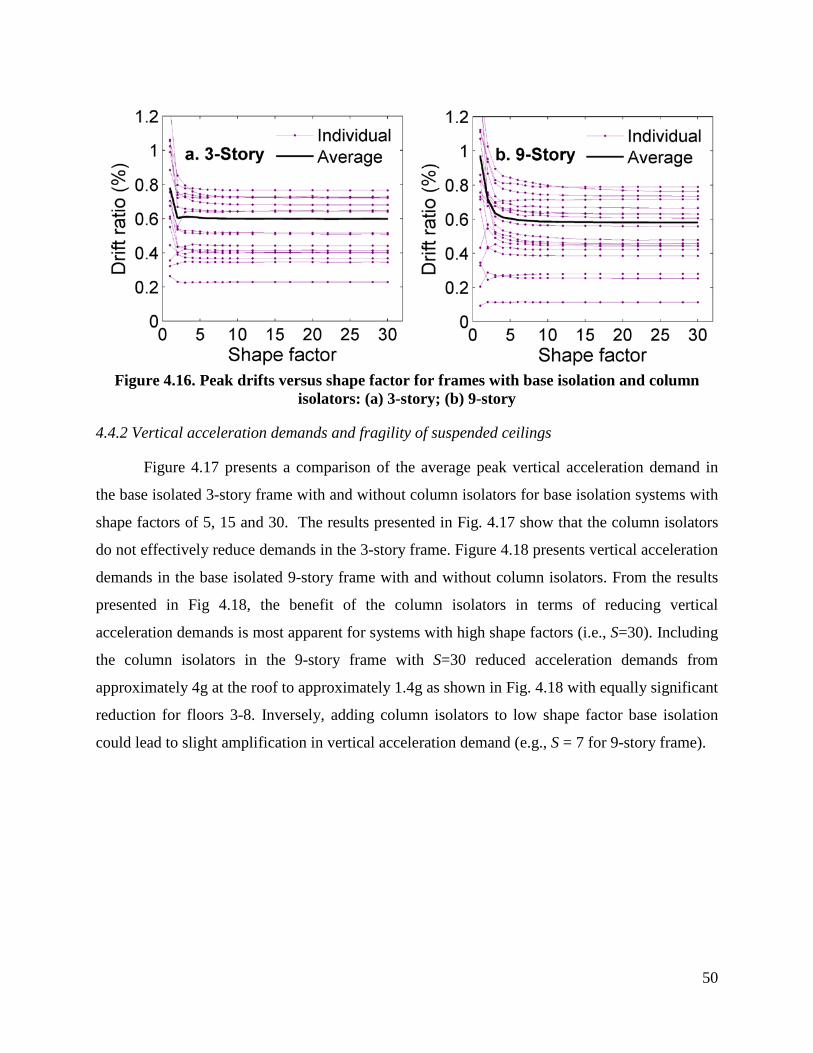
50
Figure 4.16. Peak drifts versus shape factor for frames with base isolation and column isolators: (a) 3-story; (b) 9-story
4.4.2 Vertical acceleration demands and fragility of suspended ceilings
Figure 4.17 presents a comparison of the average peak vertical acceleration demand in
the base isolated 3-story frame with and without column isolators for base isolation systems with
shape factors of 5, 15 and 30. The results presented in Fig. 4.17 show that the column isolators
do not effectively reduce demands in the 3-story frame. Figure 4.18 presents vertical acceleration
demands in the base isolated 9-story frame with and without column isolators. From the results
presented in Fig 4.18, the benefit of the column isolators in terms of reducing vertical
acceleration demands is most apparent for systems with high shape factors (i.e., S=30). Including
the column isolators in the 9-story frame with S=30 reduced acceleration demands from
approximately 4g at the roof to approximately 1.4g as shown in Fig. 4.18 with equally significant
reduction for floors 3-8. Inversely, adding column isolators to low shape factor base isolation
could lead to slight amplification in vertical acceleration demand (e.g., S = 7 for 9-story frame).
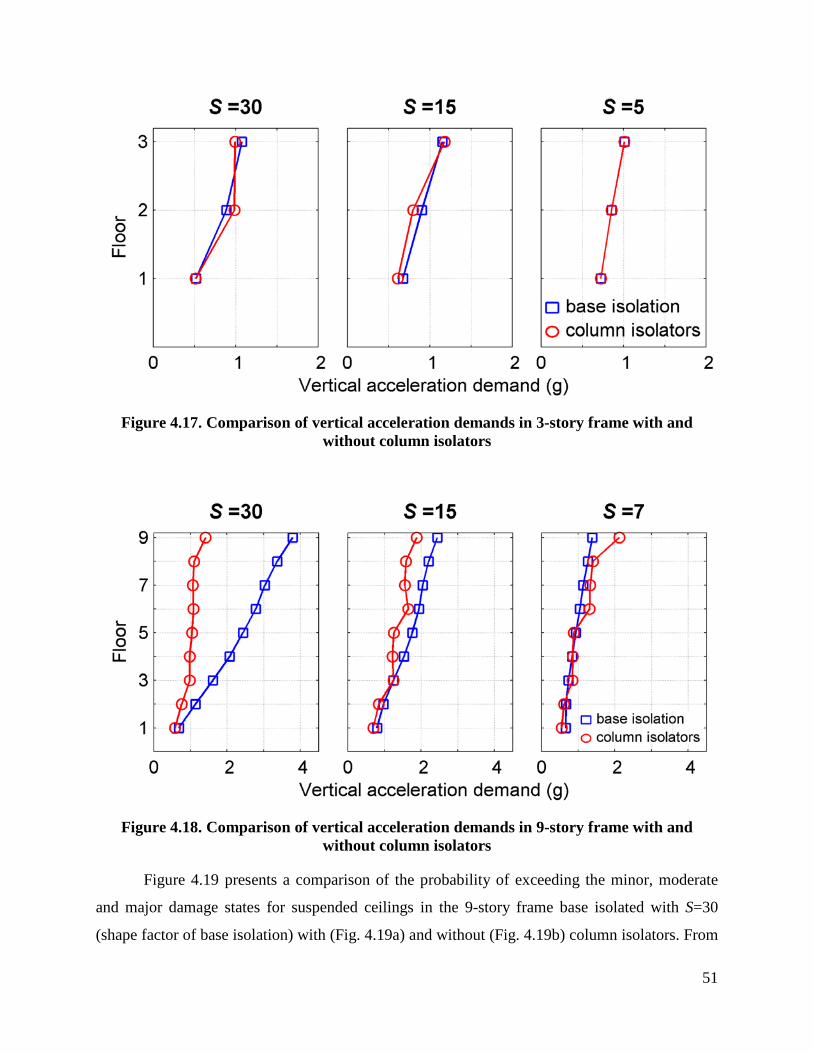
51
Figure 4.17. Comparison of vertical acceleration demands in 3-story frame with and without column isolators
Figure 4.18. Comparison of vertical acceleration demands in 9-story frame with and without column isolators
Figure 4.19 presents a comparison of the probability of exceeding the minor, moderate
and major damage states for suspended ceilings in the 9-story frame base isolated with S=30
(shape factor of base isolation) with (Fig. 4.19a) and without (Fig. 4.19b) column isolators. From

52
the comparison presented in Fig. 4.19 it can be seen that the column isolators effectively reduce
the likelihood of major and moderate damage to the suspended ceiling system at the majority of
the story levels.
Figure 4.19. Comparison of the probability of exceeding damage states for the base isolated 9-story frame: (a) S=30 with column isolators; (b) S=30 without column isolators
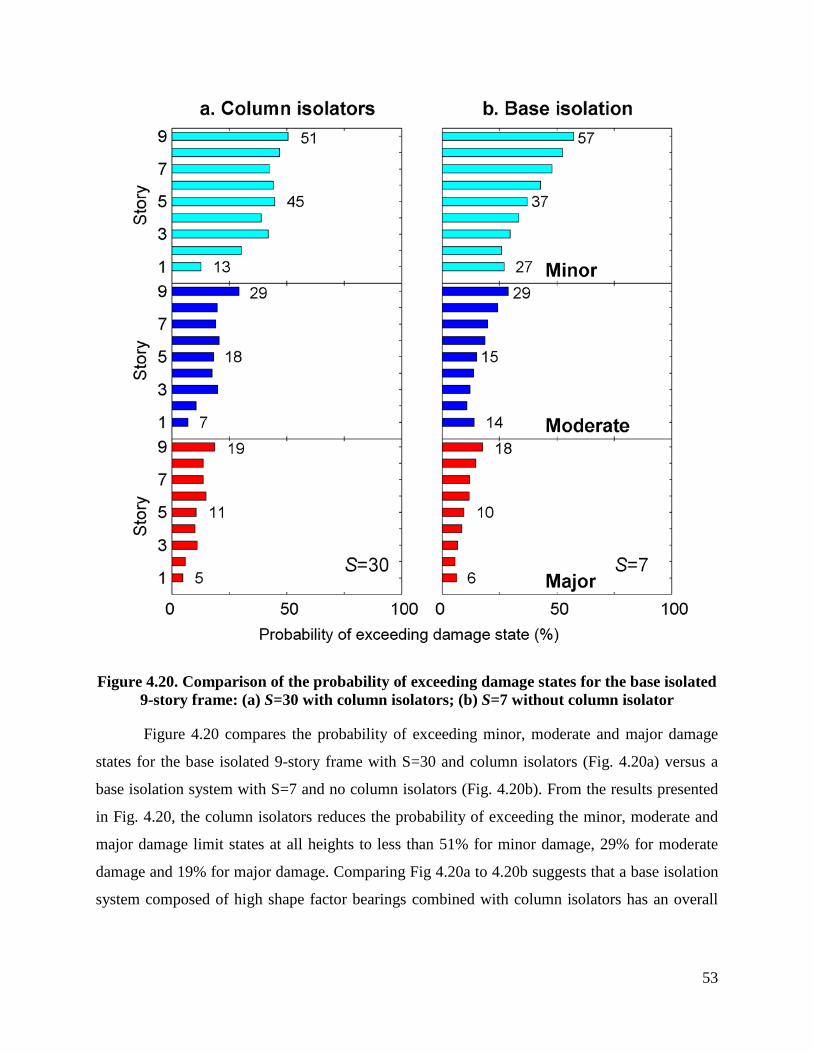
53
Figure 4.20. Comparison of the probability of exceeding damage states for the base isolated 9-story frame: (a) S=30 with column isolators; (b) S=7 without column isolator
Figure 4.20 compares the probability of exceeding minor, moderate and major damage
states for the base isolated 9-story frame with S=30 and column isolators (Fig. 4.20a) versus a
base isolation system with S=7 and no column isolators (Fig. 4.20b). From the results presented
in Fig. 4.20, the column isolators reduces the probability of exceeding the minor, moderate and
major damage limit states at all heights to less than 51% for minor damage, 29% for moderate
damage and 19% for major damage. Comparing Fig 4.20a to 4.20b suggests that a base isolation
system composed of high shape factor bearings combined with column isolators has an overall
54
similarity in performance i.e., reduced likelihood of damage, by comparison to a base isolation
system composed of moderate to high shape factor bearings and no column isolators.
4.5 Summary
This section presented results of an analytical study aimed at exploring the concept of
using low shape factor for base isolation and distributed flexibility up the height of structure via
column isolators. From the results presented in this section, rocking (global drift) is not a
limiting factor for S > 5 in these low and mid-rise buildings. Evaluation of the performance of
the various systems using fragility data from suspended ceiling systems suggests the most
effective strategy for minimizing damage to these systems in low-rise buildings could be the use
of low shape factor bearing whereas in mid-rise buildings (i.e. 9-story) the combination of base
isolators with high shape factors and column isolators appears to effectively reduce the
likelihood of damage to suspended ceiling systems.

55
Chapter 5
Summary and conclusions
5.1 Summary
This research presents an analytical study of the two dimensional 3- and 9-story base
isolated frame models subjected to earthquake excitation. The objectives of the research are to
twofold: first to study the responses of different frame protective system configurations under
seismic excitation, and second; to use fragility curves to estimate damage due to vertical
component of earthquake ground shaking to ceiling systems in the structures. This estimation is
used as a performance metric.
Twenty sets of ground motions used in this research are obtained from the Pacific
Earthquake Engineering Research ground motion database (PEER 2011). Ground motions
chosen have closest distance to rupture surface range from 0.96 km to 8.88 km and moment
magnitude from 6.7 to 7.6. The frame models were analyzed for bi-axial excitations
simultaneously in the horizontal and vertical directions.
Three and nine-story base isolated frames were developed and analyzed using OpenSees
(2009). These frames were modified versions of the SAC buildings presented in Gupta and
Krawinkler (1999). Three model configurations were considered in this research, specifically:
base isolated frame; base isolation with supplemental damping; and base isolation with vertically
distributed column isolators.
Fragility data from Badillo et al. (2006) was adapted to evaluate the probability of
exceeding damage states of the ceiling systems in three model configurations. Fragility curves
were generated from Badillo et al. (2006) study so that probability of failure is calculated for a
wide range of vertical to horizontal acceleration demands. Three damage states were defined by
Badillo to characterize the seismic performance of the ceiling systems, namely: minor damage,
moderate damage and major damage.
5.2 Limitations of the study
Although the research has reached its objectives, there were some limitations. The
availability of seismic fragility data for suspended ceilings in the public domain is limited. A
56
study by Badillo et al. (2006) provides fragility curves for suspended ceiling systems based on
experimental testing. Each fragility data point used to construct the fragility curves was based in
a small sample size (6 tests) so that confidence in the predictive capability of the curves is low.
However, for this study the Badillo et al. data was used to evaluate and compare various systems
rather than predicting an actual failure probability. Moreover, there have been a limited number
of experimental tests on seismically isolated buildings included vertical excitation. This
translates into a limited amount of data available to verify the analytical models used in this
study. However, results from recent full-scale testing of a 5-story base isolated steel frame (Ryan
et al. 2012) agree qualitatively with the results of the analytical models used in this study.
5.3 Conclusions
Based on the results presented in this thesis, following conclusions are provided:
• For the 2-dimensionl frame considered in this study, the limiting factor for the use of low
shape factor bearing does not appear to be rocking, as measured by the global drift ratio,
but rather stability of the individual bearings. Maximum drift ratios of approximately
1.2% were observed for bearings with shape factors equal to 1 though stability
considerations limited the shape factor to greater than or equal to 7.
• Low shape factors (i.e. less than 5) effectively limited damage to suspended-ceiling
systems, however stability considerations preclude the use of such low shape factors.
Therefore the low shape factor approach to achieve three-dimensional protection is not
feasible for low to mid rise buildings.
• The vertically distributed flexibility concept effectively reduced the likelihood of damage
to suspended ceiling systems in the 9-story frame by comparison to a traditional base
isolated frame on high shape factor bearings. The vertically distributed flexibility
concept, however, was not effective for the 3-story frame by comparison to a traditional
base isolated frame on high shape factor bearings. This suggest, a different approach is
needed for low-rise buildings such as a vertically flexible bearing (i.e. 5< S < 10) with
added supplemental damping to effectively protect suspended ceiling systems.
57
References
American Association of State Highways and Transportation Officials (AASHTO). (2010).
“Guide specifications for seismic isolation design.” AASHTO, Washington, DC.
Aiken, I. D., Kelly, J. M. and Tajirian, F. F. (1989). “Mechanics of low shape factor elastomeric
seismic isolation bearings.” Report No. UCB/EERC-89/13, Earthquake Engineering Research
Center, University of California, Berkeley, CA.
American Association of State Highways and Transportation Officials (AASHTO). (2010).
“Guide specifications for seismic isolation design.” AASHTO, Washington, DC.
American Society of Civil Engineers (ASCE). (2010). “Minimum Design Loads for Buildings
and other Structures.” ASCE, Virginia 20191.
Badillo, H., Whittaker, A. S. and Reinhorn, A. M. (2006). “Seismic Fragility of Suspended
Ceiling Systems.” Technical Report MCEER-06-0001, State University of New York at Buffalo,
Buffalo, New York.
Broderick, B. M., Elnashai, A. S., Ambraseys, N. N., Barr, J. J., Goodfellow, R. G. and Higazy,
E.M. (1994). “The Northridge (California) earthquake of 17 January 1994: Observations, strong-
motion and correlative response analyses.” Research Report ESEE-Y4/4, Imperial College.
Bozorgnia, M. N. and Campbell, K. W. (1995). “Characteristics of free-field vertical ground
motion during the Northridge earthquake.” Earthquake Spectra, 23, 515-525.
Buckle, I. G. and Liu, H. (1994a). “Critical loads of elastomeric isolators at high shear strain.”
Proc., 3rd U.S.-Japan Workshop on Earthquake Protective Systems for Bridges, National Center
for Earthquake Engineering Research, State Univ. of New York, Buffalo, NY.
Buckle, I. G. and Liu, H. (1994b). “Experimental determination of critical loads of elastomeric
isolators at high shear strain.” NCEER Bull., 8(3), 1–5.

58
Chalhoub, M. and Kelly, J. M. (1990). “Effect of Bulk Compressibility on the Stiffness of
Cylindrical Base Isolation Bearings.” International Journal of Solids Structures, 26, 743-760.
Chopra, K. A. (2006). “Dynamics of structures.” Prentice Hall. Upper Saddle River, New Jersey.
Dao, N., Ryan, K.L., Siavash, S., Manos, M., Eiji, S., Tomohiro, S. and Arash, Z. (2011).
“Experimental evaluation of an innovative isolation system for a lightweight steel moment frame
building at E-Defense.” Proc., ASCE Structures Congress, Las Vegas, NV.
Derham, C. J. and Thomas, A. G. (1981). “The design of seismic isolation bearings.” Control of
seismic response of piping systems and other structures by base isolation, Univ. of California,
Berkeley, CA, 21–36.
Gent, A. N. (1964). “Elastic stability of rubber compression springs.” J. Mech. Eng. Sci., 6(4),
318–326.
Goltz, J. D. (1994). “The Northridge, California earthquake of January 17, 1994 General
reconnaissance report.” Technical Report NCEER-94-0005.
Gupta, A. and Krawinkler, H. (1999). “Seismic demands for performance evaluation of steel
moment resisting frame structures.” Report no. 132. John A. Blume Earthquake Engineering
Center, Stanford University, Paolo Alto, CA.
Hall, J. F. (1995). “Northridge earthquake reconnaissance report.” Earthquake Spectra,
Supplement C to Volume 11.
Haringx, J. A. (1948). “On highly compressible helical springs and rubber rods and their
application for vibration-free mountings. I.” Philips Res. Rep., 3, 401–449.
Haringx, J. A. (1949a). “On highly compressible helical springs and rubber rods and their
application for vibration-free mountings. II.” Philips Res. Rep., 4, 49–80.
Haringx, J. A. (1949b). “On highly compressible helical springs and rubber rods and their
application for vibration-free mountings. III.” Philips Res. Rep., 4, 206–220.

59
Hilmy, S. I. and Masek, J. P., (1994). “Failure mechanisms of parking structures damaged during
the Northridge earthquake, January 17, 1994.” Special Report, Dames & Moore
Structural/Earthquake Engineering Group.
HITEC (1998a). “Evaluation findings for Skellerup base isolation elastomeric bearings.” Civil
Engineering Research Foundation, Washington, D.C.
HITEC (1998b). “Evaluation findings for Dynamic Isolation Systems, Inc. elastomeric
bearings.” Civil Engineering Research Foundation, Washington, D.C.
Huffmann, G. (1984). “Full base isolation for earthquake protection by helical springs and visco
dampers.” Nuclear Engineering and Design, 331-338.
IBC 2000. “International Building Code.” International Code Council, Country Club Hills, Ill,
USA, 2000.
Kageyama, M., IBA, T., Somaki, T. and Hisako, H. (2002). “Development of cable reinforced 3-
dimensional base isolation air spring.” ASME Pressure Vessels and Piping Conference,
Vancouver, Canada.
Kageyama, M., IBA, T., Somaki, T., Moro, S., Shinya, I. and Hisako, H. (2004). “Study on three
dimensional seismic isolation system for next generation nuclear power plant: independent cable
reinforced rolling-seal air spring.” 13th World Conference on Earthquake Engineering, August 1-
6, 2004, Vancouver, Canada.
Kelly, J. M. (1997). “Earthquake-Resistant Design with Rubber.” Springer Publishing Company,
New York 10036.
Makris, N. and Deoskar, H. S. (1996). “Prediction of observed response of base-isolated
structure.” Journal of Structural Engineering, vol. 122, no. 5, pp. 485–492.
Mokha, A., Constantinou, M. C. and Reinhorn, A. M. (1990a). "Experimental study and
analytical prediction of earthquake response of a sliding isolation system with a spherical
surface." Report No. NCEER-90-0020, Nat. Ctr. for Earthquake Engineering. Res., State Univ. of
New York, Buffalo, N.Y.
60
Mokha, A., Constantinou, M. C. and Reinhorn, A. M. (1990b). "Teflon bearings in base
isolation. I: Testing." Structural Engineering, ASCE, 116(2), 438-454.
Open system for earthquake engineering simulation framework (OpenSees). (2009). Version 2.3.
Pacific Earthquake Engineering Research Center, University of California, Berkeley.
(http://opensees.berkeley.edu/).
Papazoglou, A. J. and Elnashai, A. S. (1996). “Analytical and field evidence of the damaging
effect of vertical earthquake ground motion.” Earthquake Engineering and structural dynamics,
Vol. 25, 1109-1137.
PEER (2011). PEER NGA Database, Pacific Earthquake Engineering Research Center,
University of California, Berkeley, CA: http://peer.berkeley.edu/peer_ground_motion_database/
Reitherman, R. (1995). "Nonstructural Damage" Earthquake Spectra, Supplement to Volume 11,
Northridge Earthquake Reconnaissance Report, Earthquake Engineering Research Institute,
Oakland, California.
Ryan, K.L., Dao, N., Siavash, S., Manos, M., Eiji, S., Tomohiro, S. and Arash, Z. (2012).
“Seismic Interaction of Structural System and Non-structural Components in the NEES
TIPS/NEES Nonstructural/NIED Collaborative Tests at E-Defense.” Proc. 2012 ASCE
Structures Congress, Chicago, IL.
Sanchez, J., Masroor, A., Mosqueda, G. and Ryan, K. (2011). "Static and Dynamic Stability of
Elastomeric Bearings for Seismic Protection of Structures." Journal of Structural Engineering,
doi: 10.1061/(ASCE)ST.1943-541X.0000660
Sasani, M. and Kiureghian, A. (2001). “Seismic Fragility of RC Structural Walls: Displacement
Approach.” Journal of Structural Engineering, Vol. 127, No.2, pp. 219-228.
Sato, E., Furukawa, S., Kakehi, A. and Nakashima, M. (2011). “Full-scale shaking table test for
examination of safety and functionality of base-isolated medical facilities.” Earthquake
Engineering and Structural Dynamics, 40, 1435-1453.
61
Sato, E., Kajiwara, K., Furukawa, S., Ji, X. and Nakashima, M. (2010). “Full-Scaled Shaking
Table Test of a Hospital Made of Base-Isolated Four-Story Concrete Structure.” Proceedings
from the 9th US National and 10th Canadian Conference on Earthquake Engineering, Toronto,
CA.
Soroushian, S., Ryan, K.L., Maragakis, M., Sato, E., Sasaki, T., Okazaki, T., Tedesco, L., Zaghi,
A.E., Mosqueda, G., Alvarez, D. (2012). “Seismic response of ceiling/sprinkler piping
nonstructural systems in NEES TIPS / NEES Nonstructural /NIED collaborative tests on a full
scale 5-story building.” Proc. 2012 ASCE Structures Congress, Chicago, IL.
Takahashi, O., Hiromasa, A., Junji, S., Ryoichiro, M., Yasuo, T. and Takafumi, F. (2008).
“Construction of Civil Building using three dimensional seismic isolation system.” The 14th
World Conference on Earthquake Engineering, October 12-17, 2008, Beijing, China.
Tajirian, F.F., Kelly, J. M., Aiken, I.D., and Veljovich, W. (1990). “Elastomeric Bearings for
Three-Dimensional Seismic Isolation.” Proc. of the 1990 ASME PVP Conference, Nashville,
Tennessee, June.
Tetsuya, H., Junji, S. and Satoshi, M. (2004). “Three-Dimensional Seismic Isolation Device with
Rolling Seal Type Air Spring.” ASME Conf. Proc, 2004, 43.
Weisman, J. and Warn, G. (2012). “Stability of elastomeric and lead-rubber seismic isolation
bearings.” Journal of Structural Engineering, 138(2), 215-223.
Yoo, B., Lee, J. H., Koo, G. H. and Kim, Y. H. (1997). “A study of vertical seismic responses for
base isolated PWR using high damping rubber bearing.” 14th International conference on
Structural Mechanics in Reactor Technology, Lyon, France.

62
Appendix A
Basic loading conditions
The loading information was provided as follow:
Steel framing: 13 psf
Roofing: 7 psf average
Ceilings/Flooring: 3 psf average, including fireproofing
Mechanical/Electrical: 7 psf average for all floors, additionally 40 psf over penthouse area
for equipment
Partitions: 10 psf for seismic load, 20 psf for gravity design
Exterior Wall: 25 psf of wall surface average, including any penthouses.
Live Load: 50 psf
Wind Load: exposure B as per UBC 1994 definition
63
Appendix B
Description of ground motion
Ground motions representative of different hazard levels have been assembled in Bin 1
for this research. All these ground motions are assembled from The Pacific Earthquake
Engineering Research Center (PEER 2011) ground motion database as it includes a very large
and comprehensive set of ground motions recorded worldwide. Bin 1 consisted of recorded
ground motions representing return period of 2474 years (2% probability of being exceeded in 50
years). Bin 1 of ground motions consists of 30 time histories; 10 ground motions each with 2
orthogonal horizontal components and 1 vertical components. Table B.1 provides fundamental
information for the individual earthquake records constituting bin of ground motions.

64
Table B.1 Characteristic of ground motion records Earthquake Year Moment
Magnitude Station Compo
nent PGA (g)
Distance to Fault (km)
Site Class (USGS)
Mechanism
Kocaeli,Turkey 1999 7.4 Izmit Up 0.146 7.21 A SS Kocaeli,Turkey 1999 7.4 Izmit 000 0.152 7.21 A SS Kocaeli,Turkey 1999 7.4 Izmit 090 0.22 7.21 A SS
NorthRidge 1994 6.7 24207 Pacoima Dam (upper left) Up 1.229 7.01 A RN NorthRidge 1994 6.7 24207 Pacoima Dam (upper left) 000 1.585 7.01 A RN NorthRidge 1994 6.7 24207 Pacoima Dam (upper left) 090 1.285 7.01 A RN
Cape Mendocino 1992 7.1 89005 Cape Mendocino Up 0.754 6.96 A RN Cape Mendocino 1992 7.1 89005 Cape Mendocino 000 1.497 6.96 A RN Cape Mendocino 1992 7.1 89005 Cape Mendocino 090 1.039 6.96 A RN
Tabas, Iran 1978 7.4 9101 Tabas Up 0.688 2.05 A RN Tabas, Iran 1978 7.4 9101 Tabas 000 0.836 2.05 A RN Tabas, Iran 1978 7.4 9101 Tabas 090 0.852 2.05 A RN Loma Prieta 1989 6.9 57180 Los Gatos- Lexington Dam Up 0.536 5.02 A RO Loma Prieta 1989 6.9 57180 Los Gatos- Lexington Dam 000 0.515 5.02 A RO Loma Prieta 1989 6.9 57180 Los Gatos- Lexington Dam 090 0.367 5.02 A RO Loma Prieta 1989 6.9 58065 Saratoga - Aloha Ave Up 0.389 8.50 B RO Loma Prieta 1989 6.9 58065 Saratoga - Aloha Ave 000 0.512 8.50 B RO Loma Prieta 1989 6.9 58065 Saratoga - Aloha Ave 090 0.324 8.50 B RO
Kobe 1995 6.9 0 KJMA Up 0.343 0.96 B SS Kobe 1995 6.9 0 KJMA 000 0.821 0.96 B SS Kobe 1995 6.9 0 KJMA 090 0.599 0.96 B SS
NorthRidge 1994 6.7 LA Dam Up 0.424 5.92 B RN NorthRidge 1994 6.7 LA Dam 000 0.511 5.92 B RN NorthRidge 1994 6.7 LA Dam 090 0.349 5.92 B RN
Chi-Chi, Taiwan 1999 7.6 TCU089 Up 0.191 8.88 B RN Chi-Chi, Taiwan 1999 7.6 TCU089 000 0.333 8.88 B RN Chi-Chi, Taiwan 1999 7.6 TCU089 090 0.248 8.88 B RN Chi-Chi, Taiwan 1999 7.6 CHY080 Up 0.724 2.69 B RN Chi-Chi, Taiwan 1999 7.6 CHY080 000 0.968 2.69 B RN Chi-Chi, Taiwan 1999 7.6 CHY080 090 0.902 2.69 B RN

65
Appendix C
Push over analysis
In this study, push-over analysis for 3- and 9-story frame has been carried out using the
designed load pattern suggest in the ASCE 7-10. The governing equation for the load pattern is
given as:
1
x xx n
i ii
w hCw h
=
=
∑ (C.1)
where Cx is the normalized load at floor level x, wi and wx are the seismic weights at floor i and x
respectively, hi and hx are the heights from the ground level to floor i and x. The push-over plots,
i.e., the normalized base shear (base shear normalized by structure seismic weight, or V/W)
versus roof drift angle (roof displacement normalized by structure height) response for the 3- and
9-story models are shown in Fig C.1a and C.1b respectively.
Figure C.1. Push over analysis for: (a) 3-story and (b) 9-story
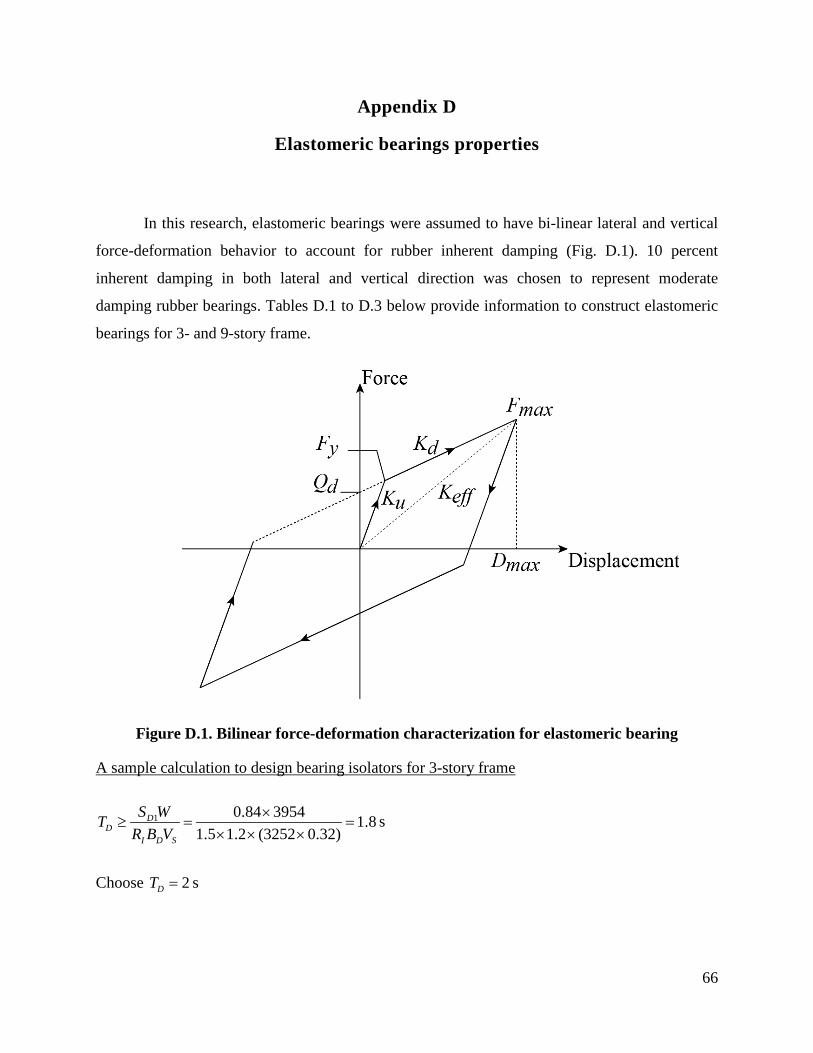
66
Appendix D
Elastomeric bearings properties
In this research, elastomeric bearings were assumed to have bi-linear lateral and vertical
force-deformation behavior to account for rubber inherent damping (Fig. D.1). 10 percent
inherent damping in both lateral and vertical direction was chosen to represent moderate
damping rubber bearings. Tables D.1 to D.3 below provide information to construct elastomeric
bearings for 3- and 9-story frame.
Figure D.1. Bilinear force-deformation characterization for elastomeric bearing
A sample calculation to design bearing isolators for 3-story frame
1 0.84 3954 1.81.5 1.2 (3252 0.32)
DD
I D S
S WTR B V
×≥ = =
× × ×s
Choose 2DT = s
67
2
386.4 0.84 2 13.74 1.5dDπ× ×
= =×
in
Assuming static pressure 0.5p = ksi for all cases,
3954 79080.5
WAp
= = = in2
Total thickness of rubber ( )rT required:
0.1 7908 7.83101r
eff
GATK
×= = = in
Choose 8rT = in
Recalculate 0.1 7908 998eff
r
GAKT
×= = = (kips/in)
Distribute total horizontal stiffness to individual interior and exterior bearing isolators:
12.4exterioreffK = kips/in
24.7interioreffK = kips/in
Proportion lateral characteristic parameter for 3-story exterior base isolator:
12.4exterioreffK = kips/in; 13.7dD = in
Assuming yield displacement 0.1 dY D= and inherent horizontal damping ratio is 10 %
2 20.1 12.4 13.7 29.62( ) 2 (13.7 1.37)
eff dd
d
K DQ
D Yπ ξ π× × × × × ×
= = =− × −
kips/in
29.612.4 10.213.7
dd eff
d
QK KD
= − = − = kips/in
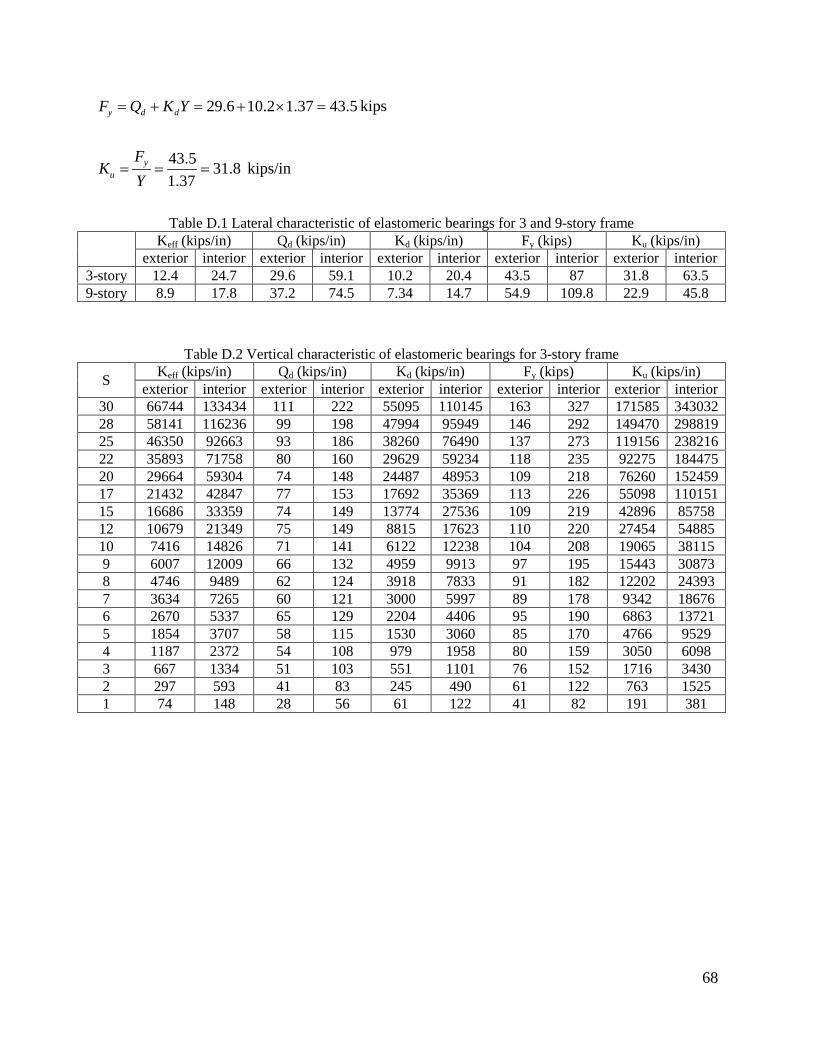
68
29.6 10.2 1.37 43.5y d dF Q K Y= + = + × = kips
43.5 31.81.37
yu
FK
Y= = = kips/in
Table D.1 Lateral characteristic of elastomeric bearings for 3 and 9-story frame Keff (kips/in) Qd (kips/in) Kd (kips/in) Fy (kips) Ku (kips/in)
exterior interior exterior interior exterior interior exterior interior exterior interior 3-story 12.4 24.7 29.6 59.1 10.2 20.4 43.5 87 31.8 63.5 9-story 8.9 17.8 37.2 74.5 7.34 14.7 54.9 109.8 22.9 45.8
Table D.2 Vertical characteristic of elastomeric bearings for 3-story frame
S Keff (kips/in) Qd (kips/in) Kd (kips/in) Fy (kips) Ku (kips/in) exterior interior exterior interior exterior interior exterior interior exterior interior
30 66744 133434 111 222 55095 110145 163 327 171585 343032 28 58141 116236 99 198 47994 95949 146 292 149470 298819 25 46350 92663 93 186 38260 76490 137 273 119156 238216 22 35893 71758 80 160 29629 59234 118 235 92275 184475 20 29664 59304 74 148 24487 48953 109 218 76260 152459 17 21432 42847 77 153 17692 35369 113 226 55098 110151 15 16686 33359 74 149 13774 27536 109 219 42896 85758 12 10679 21349 75 149 8815 17623 110 220 27454 54885 10 7416 14826 71 141 6122 12238 104 208 19065 38115 9 6007 12009 66 132 4959 9913 97 195 15443 30873 8 4746 9489 62 124 3918 7833 91 182 12202 24393 7 3634 7265 60 121 3000 5997 89 178 9342 18676 6 2670 5337 65 129 2204 4406 95 190 6863 13721 5 1854 3707 58 115 1530 3060 85 170 4766 9529 4 1187 2372 54 108 979 1958 80 159 3050 6098 3 667 1334 51 103 551 1101 76 152 1716 3430 2 297 593 41 83 245 490 61 122 763 1525 1 74 148 28 56 61 122 41 82 191 381

69
Table D.3 Vertical characteristic of elastomeric bearings for 9-story frame
S Keff (kips/in) Qd (kips/in) Kd (kips/in) Fy (kips) Ku (kips/in) exterior interior exterior interior exterior interior exterior interior exterior interior
30 48060 96120 529 1057 39672 79344 778 1557 123552 247105 28 41866 83731 474 947 34559 69117 698 1395 107628 215256 25 33375 66750 389 777 27550 55100 572 1145 85800 171601 22 25846 51691 300 600 21335 42669 442 884 66444 132888 20 21360 42720 263 526 17632 35264 388 775 54912 109824 17 15433 30865 198 396 12739 25478 291 583 39674 79348 15 12015 24030 166 332 9918 19836 244 489 30888 61776 12 7690 15379 142 284 6348 12695 209 418 19768 39537 10 5340 10680 148 296 4408 8816 218 437 13728 27456 9 4325 8651 145 290 3570 7141 214 428 11120 22239 8 3418 6835 133 265 2821 5642 195 391 8786 17572 7 2617 5233 123 246 2160 4320 181 363 6727 13453 6 1922 3845 117 234 1587 3174 173 345 4942 9884 5 1335 2670 114 229 1102 2204 168 337 3432 6864 4 854 1709 117 234 705 1411 172 344 2196 4393 3 481 961 89 179 397 793 132 263 1236 2471 2 214 427 56 112 176 353 83 165 549 1098 1 53 107 38 77 44 88 57 113 137 275
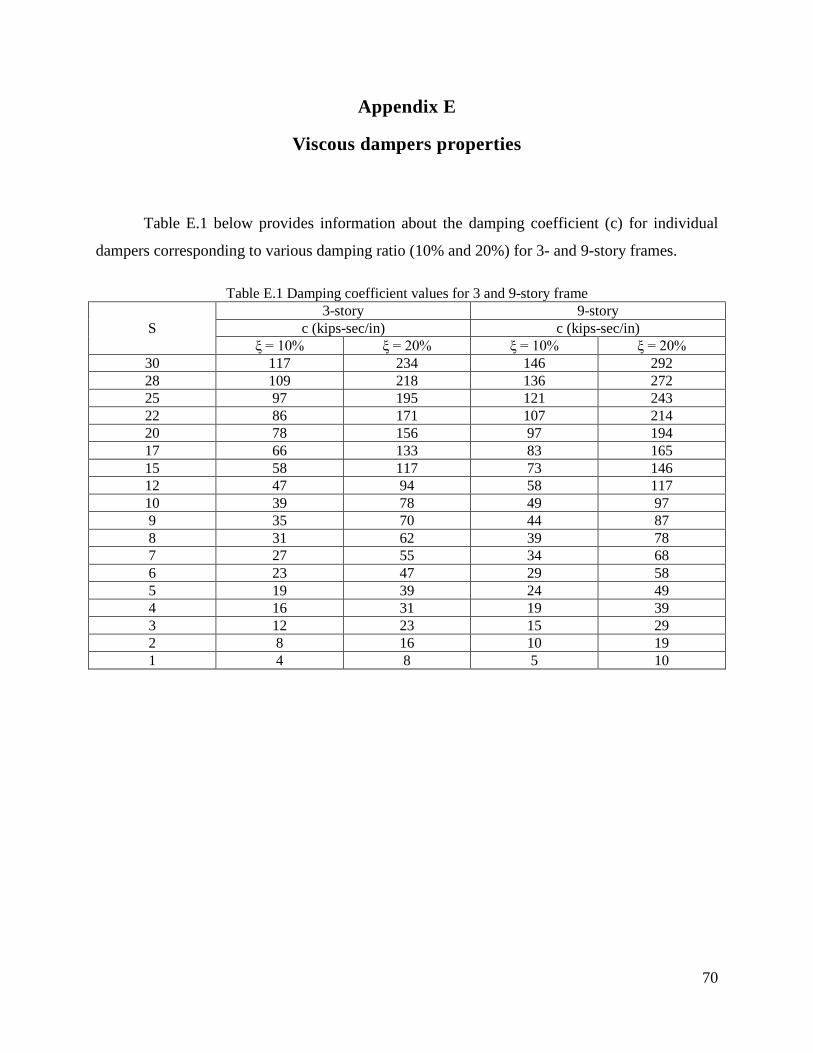
70
Appendix E
Viscous dampers properties
Table E.1 below provides information about the damping coefficient (c) for individual
dampers corresponding to various damping ratio (10% and 20%) for 3- and 9-story frames.
Table E.1 Damping coefficient values for 3 and 9-story frame
S 3-story 9-story
c (kips-sec/in) c (kips-sec/in) ξ = 10% ξ = 20% ξ = 10% ξ = 20%
30 117 234 146 292 28 109 218 136 272 25 97 195 121 243 22 86 171 107 214 20 78 156 97 194 17 66 133 83 165 15 58 117 73 146 12 47 94 58 117 10 39 78 49 97 9 35 70 44 87 8 31 62 39 78 7 27 55 34 68 6 23 47 29 58 5 19 39 24 49 4 16 31 19 39 3 12 23 15 29 2 8 16 10 19 1 4 8 5 10
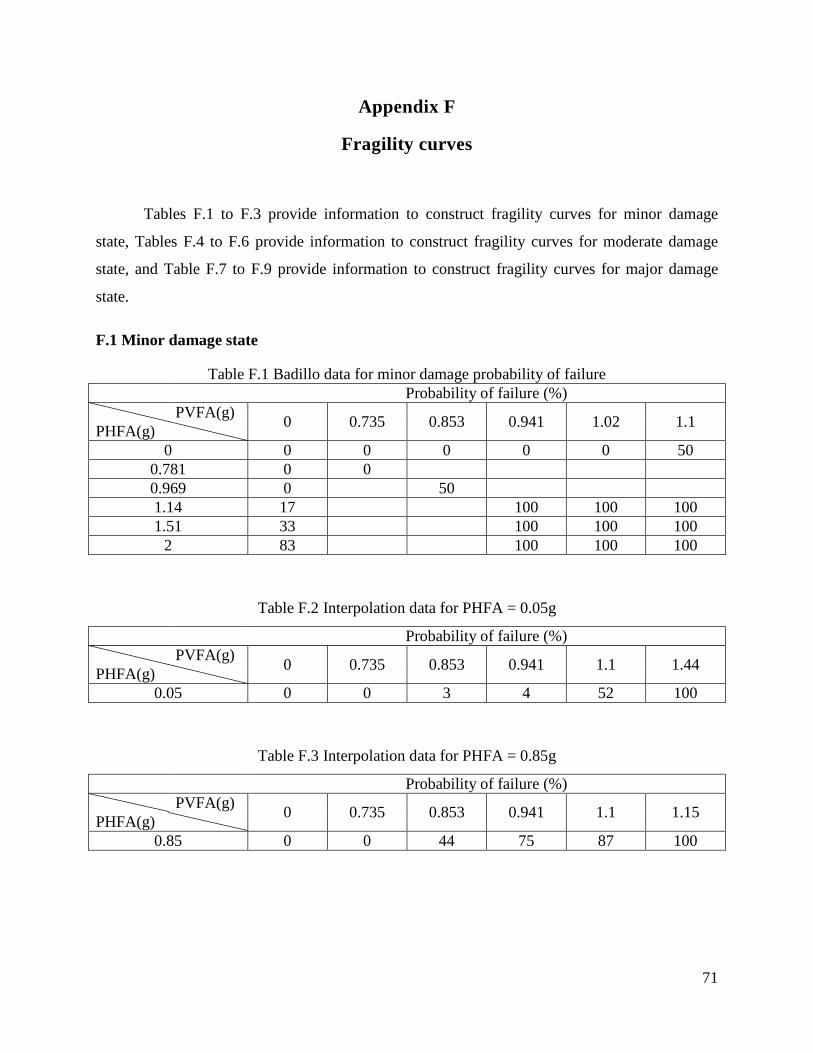
71
Appendix F
Fragility curves
Tables F.1 to F.3 provide information to construct fragility curves for minor damage
state, Tables F.4 to F.6 provide information to construct fragility curves for moderate damage
state, and Table F.7 to F.9 provide information to construct fragility curves for major damage
state.
F.1 Minor damage state
Table F.1 Badillo data for minor damage probability of failure Probability of failure (%) PVFA(g) 0 0.735 0.853 0.941 1.02 1.1 PHFA(g)
0 0 0 0 0 0 50 0.781 0 0 0.969 0 50 1.14 17 100 100 100 1.51 33 100 100 100
2 83 100 100 100
Table F.2 Interpolation data for PHFA = 0.05g
Probability of failure (%) PVFA(g) 0 0.735 0.853 0.941 1.1 1.44 PHFA(g)
0.05 0 0 3 4 52 100
Table F.3 Interpolation data for PHFA = 0.85g
Probability of failure (%) PVFA(g) 0 0.735 0.853 0.941 1.1 1.15 PHFA(g)
0.85 0 0 44 75 87 100
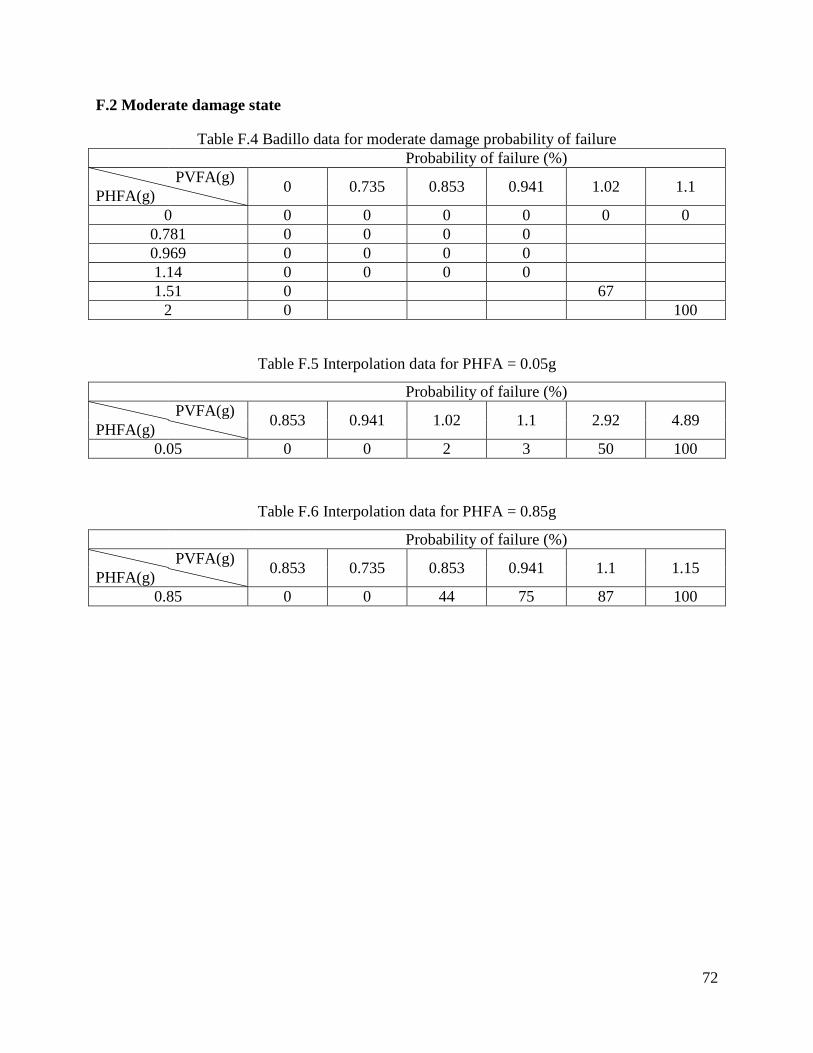
72
F.2 Moderate damage state
Table F.4 Badillo data for moderate damage probability of failure Probability of failure (%) PVFA(g) 0 0.735 0.853 0.941 1.02 1.1 PHFA(g)
0 0 0 0 0 0 0 0.781 0 0 0 0 0.969 0 0 0 0 1.14 0 0 0 0 1.51 0 67
2 0 100
Table F.5 Interpolation data for PHFA = 0.05g
Probability of failure (%) PVFA(g) 0.853 0.941 1.02 1.1 2.92 4.89 PHFA(g)
0.05 0 0 2 3 50 100
Table F.6 Interpolation data for PHFA = 0.85g
Probability of failure (%) PVFA(g) 0.853 0.735 0.853 0.941 1.1 1.15 PHFA(g)
0.85 0 0 44 75 87 100

73
F.3 Major damage state
Table F.7 Badillo data for moderate damage probability of failure Probability of failure (%) PVFA(g) 0 0.735 0.853 0.941 1.02 1.1 PHFA(g)
0 0 0 0 0 0 0 0.781 0 0 0 0 0.969 0 0 0 0 1.14 0 0 0 0 1.51 0 0
2 0 17
Table F.8 Interpolation data for PHFA = 0.05g
Probability of failure (%) PVFA(g) 0.853 0.941 1.02 1.1 2.92 4.89 PHFA(g)
0.85 0 0 0 0 0 0
Table F.9 Interpolation data for PHFA = 0.85g
Probability of failure (%) PVFA(g) 0.941 1.02 1.1 1.31 1.59 2.16 PHFA(g)
0.85 0 0 7 25 50 100

74
Appendix G
Column isolators
Similar to elastomeric bearings, column isolators were assumed to have bi-linear vertical
force-deformation behavior to account for rubber inherent damping. 5 percent inherent damping
in vertical direction was chosen to represent moderate damping rubber bearings. Tables G.1 and
G.2 below provide information to construct column isolators at different floor level for 3- and 9-
story frames.
A sample calculation to design exterior column isolators for 3-story frame
The vertical load demand is the sum of dead load and live load:
56D LP P+ = kips
Assuming static pressure 0.5p = ksi and shape factor 4S =
56 1120.5
WAp
= = = in2
Calculate diameter D of column isolator:
11.9D = in
Calculate height of a single rubber layer ( )rt :
11.9 0.754 4 4rDtS
= = =×
in
Using trial and error to find the maximum number of rubber of layers ( )n corresponding to
lowest vertical stiffness and still satisfy stability requirement 3( )cro D LP P P≥ + :
With 5n = : 153 3( ) 168cro D LP P P= ≤ + = (not satisfied)
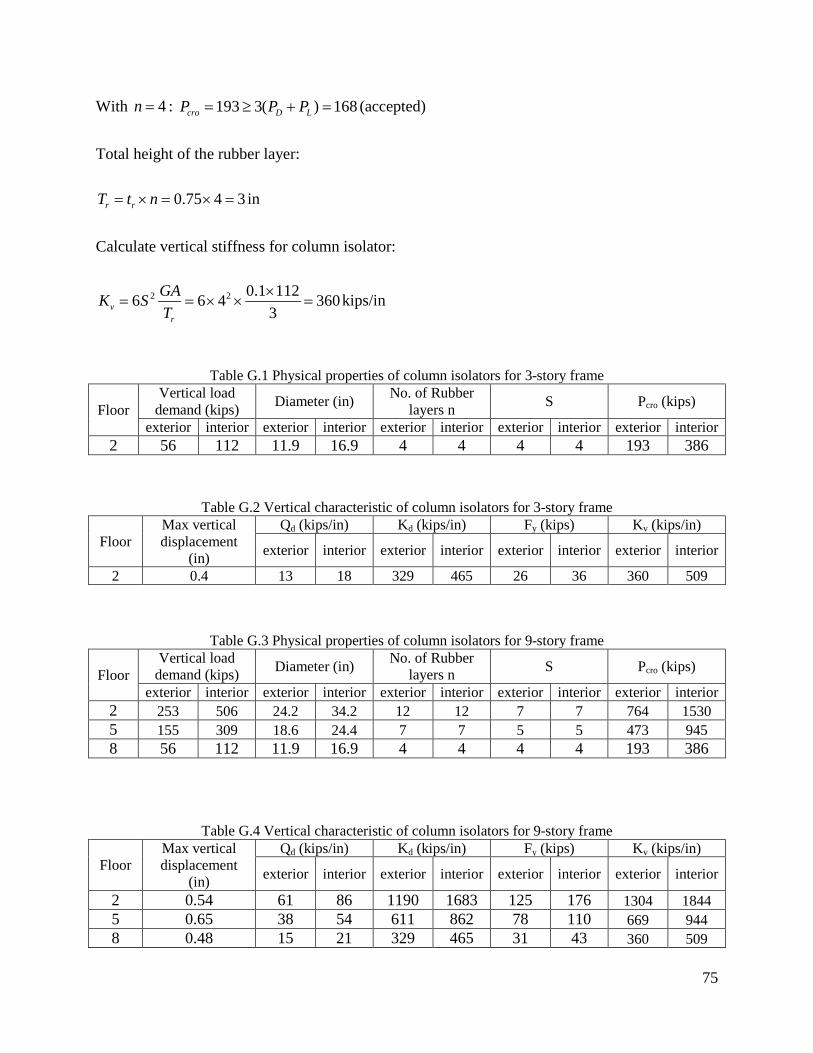
75
With 4n = : 193 3( ) 168cro D LP P P= ≥ + = (accepted)
Total height of the rubber layer:
0.75 4 3r rT t n= × = × = in
Calculate vertical stiffness for column isolator:
2 2 0.1 1126 6 4 3603v
r
GAK ST
×= = × × = kips/in
Table G.2 Vertical characteristic of column isolators for 3-story frame
Floor Max vertical displacement
(in)
Qd (kips/in) Kd (kips/in) Fy (kips) Kv (kips/in)
exterior interior exterior interior exterior interior exterior interior
2 0.4 13 18 329 465 26 36 360 509
Table G.1 Physical properties of column isolators for 3-story frame
Floor Vertical load
demand (kips) Diameter (in) No. of Rubber layers n S Pcro (kips)
exterior interior exterior interior exterior interior exterior interior exterior interior 2 56 112 11.9 16.9 4 4 4 4 193 386
Table G.3 Physical properties of column isolators for 9-story frame
Floor Vertical load
demand (kips) Diameter (in) No. of Rubber layers n S Pcro (kips)
exterior interior exterior interior exterior interior exterior interior exterior interior 2 253 506 24.2 34.2 12 12 7 7 764 1530 5 155 309 18.6 24.4 7 7 5 5 473 945 8 56 112 11.9 16.9 4 4 4 4 193 386
Table G.4 Vertical characteristic of column isolators for 9-story frame
Floor Max vertical displacement
(in)
Qd (kips/in) Kd (kips/in) Fy (kips) Kv (kips/in)
exterior interior exterior interior exterior interior exterior interior
2 0.54 61 86 1190 1683 125 176 1304 1844 5 0.65 38 54 611 862 78 110 669 944 8 0.48 15 21 329 465 31 43 360 509

76
Appendix H
Vertical periods of 3- and 9-story frame
S Fundamental vertical periods (s)
3-story frame 9-story frame Base-isolated Column isolators Base-isolated Column isolators
30 0.039 0.138 0.089 0.23 28 0.040 0.138 0.089 0.23 25 0.041 0.138 0.091 0.23 22 0.043 0.138 0.092 0.23 20 0.045 0.138 0.095 0.23 17 0.051 0.138 0.100 0.23 15 0.057 0.138 0.107 0.23 12 0.070 0.138 0.126 0.23 10 0.084 0.138 0.148 0.23 9 0.093 0.138 0.163 0.234 8 0.104 0.141 0.182 0.236 7 0.119 0.142 0.207 0.239 6 0.138 0.145 0.241 0.244 5 0.166 0.152 0.288 0.255 4 0.207 0.173 0.359 0.285 3 0.275 0.222 0.478 0.356 2 0.413 0.323 0.715 0.519 1 0.900 0.645 1.430 1.02
Fundamental vertical periods (s) 3-story frame 9-story frame
Fixed-base 0.037 0.086