bach dinh and hoa nguyen* - rutgers...
TRANSCRIPT

THE TIME VARYING PROPERTY OF FINANCIAL DERIVATIVES IN
ENHANCING FIRM VALUE
Bach Dinh and Hoa Nguyen*
School of Accounting, Economics and Finance Faculty of Business and Law
Deakin University 221 Burwood Highway
Burwood VIC 3125 Australia
Corresponding author Email: [email protected];
Phone: 03 92446190 Fax: 03 92446283

THE TIME VARYING PROPERTY OF DERIVATIVES IN ENHANCING FIRM
VALUE
Abstract
In this paper, we investigate the role of derivatives in enhancing firm value using a sample of
94 U.S oil and gas exploration and production companies between 2005 and 2008. More
importantly, we aim to examine whether the ability of financial derivatives to enhance firm
value through hedging exercises is time varying as a function of commodity price volatility.
Our results show that although hedging is associated with a firm value discount as measured
by Tobin’s Q for the entire sampling period, the hedging discount is only present in the
period characterised by increasing oil and gas prices. During the period of falling oil and gas
prices, hedging is found to enhance firm value. This result is consistent with the notion that a
hedging program is most valuable to a resources firm when commodity prices decline.
Key words: financial derivatives, firm value, hedging, resources firms
JEL Classification: G21, G32

1. Introduction
Can corporate risk management via the use of financial derivatives enhance firm value? That
is the question that a stream of corporate finance literature has been trying to address. Studies
that looked at incentives for corporate hedging appear to suggest that hedging can be a value
enhancing exercise since corporations hedge to minimize expected taxes, underinvestment
costs and financial distress costs (Nance, Smith and Smithson 1993). Nevertheless, studies
that investigate the direct relationship between hedging and firm value have met with
conflicting results. Allayannis and Weston (2001) examine the relationship between foreign
currency hedging and Tobin’s Q and conclude that hedging activities enhance firm value. The
notion of a hedging premium is further supported by Carter, Rogers, and Simkins (2006) in a
sample of US airlines. On the other hand, Jin and Jorion (2006) find that hedging does not
seem to affect firm value in oil and gas producers or even influences firm value negatively in
gold mining companies (Jin and Jorion 2007). While numerous factors could potentially
explain the discrepancy in these empirical findings, it appears that the success of a hedge in
monetary terms is largely dependent on treasury forecasts and once the hedging decision has
been made, the behaviour of the underlying source of risk. For example, in the context of a
resource firm that have revenue-based commodity price exposures, hedging is most
financially beneficial, at least in the short run, when commodity price falls and vice versa
when commodity price increases. Accordingly, in this paper, we aim to reinvestigate the
relationship between hedging, commodity price exposure and firm value in a sample of US
oil and gas companies that have been documented in Jin and Jorion (2006) in an updated
period of 2005 – 2008. In doing so, we pay particular attention to the behaviour of oil and gas
price and how such fluctuations in commodity price affect the dynamic of the relationship
between hedging and firm value. Our examination of the time varying property of derivatives
in affecting firm value constitutes a major contribution of this paper.
Oil and gas is chosen as the industry of interest for a number of reasons. First, the
movement in oil and gas prices has a direct and immediate effect on the cash flow of oil and
gas companies. Second, the homogeneity of the oil and gas industry can provide a unique
prospective from which to analyse the value of firms’ hedging activities. The identification of
the impact of corporate derivative use would be easier with a homogenous industry compared
to multi-sector industry where other significant factors may come into play. Comparison of Q
ratios in a multi-sector industry sample may be contaminated by the effect of other variables
not included in the analysis (Geczy et al. 1997). Finally, hedging in the oil and gas industry
may potentially influence firm value because the oil and gas reserves make up a significant
portion of the total value of companies in this industry.
The sampling period of 2005 – 2008 provides another interesting motivation for this
study. During this period, the price of oil and gas experienced unusually high volatility, partly
due to the turmoils in the financial markets caused by the global financial crisis. Hedging, by
definition, adds value by reducing the volatility of the firm’s expected cash flows. As the
result, the value of hedging activities is expected to be maximized during this volatile
sampling period. We also choose a sample of US firms as a significant advantage in using a
sample U.S companies is data availability. From the 1990s, US companies are required to
disclose information regarding market risk and usage of derivatives instruments in the
balance sheet. These improved reporting requirements provide a richer set of hedging data
available in financial reports for our study.
Our results show that although significant exposure to oil (gas) prices are evident in
approximately one third (sixth) of the firms, the extent of hedging as measured by the
proportion of production and reserves hedged does not appear to be associated with a lower
level of exposure. In addition, the incidence of hedging seems to link to a lower Tobin’s Q as
a proxy of firm value while the actual hedging deltas are not documented to bear any
relationship with firm value. However, a closer examination reveals that the hedging discount
was only present in periods of increasing oil and gas prices. For periods characterised by
falling oil and gas prices, hedging actually leads to an increase in firm value. Our finding
offers an alternative viewpoint about the motives behind corporate hedging. Hedging
discounts previously documented have been linked to a managerial aversion motive where
hedging is the product of managers aiming to maximize their own utility. In our study, the
hedging discount is more likely to be the result of consistent hedging policy over prolonged
period of increasing oil and gas price during the 2005 – 2007 period. As a result, the negative
impact on firm value from hedging is a manifestation of incorrect expectations of firms in
relation to future movements of oil and gas price rather than managerial risk aversion. From
this perspective, the hedging discount is not necessarily the result of managerial risk aversion.
Our finding that hedging activities only result in a discount in an inflationary environment
has an important implication for studies that investigate the relationship between firm value
and hedging. The dynamic of this relationship is time varying and largely depends on the
behaviour of commodity price during the sampling period.

The remainder of this paper proceeds as follows. The next section offers a brief literature
review. Data and methodology are documented in Section 3. We discuss our results in
Section 4 and Section 5 concludes.
2. Literature Review
As was previously mentioned, existing studies examining the relationship between hedging
and firm value did not provide a conclusive result and empirical evidence is mixed. Jorion
(1990) examines foreign currency hedging activities in a sample of U.S multinational
companies and finds that these firms’ foreign currency beta is close to zero which implies
that currency hedging would not affect firm value. On the other hand, Gagnon, Lypny and
McCurdy (1998) document that dynamic hedging strategies lead to risk reduction and utility
gain by constructing currency portfolios.
Rajgopal (1999) examines 38 U.S oil and gas companies and reports that oil and gas
reserves as a proportion of total asset has a positive impact on the sensitivities of stock return
to oil and gas price’s change. Similarly, Jin and Jorion (2006) provide supporting results in a
sample of 119 U.S oil and gas firms that there was no relationship between hedging and firm
value, but hedging plays an important role in reducing stock return sensitivity to changes in
oil and gas prices.1 In contrast, the magnitude of oil and gas reserves increases stock return
sensitivity to changes in oil and gas futures prices. In another study that looks at the gold
mining industry, Jin and Jorion (2007) find that firms with hedging activities are associated
with a discount to their firm value. Recently, Chen, Jin and Wen (2008) examine the impact
of hedging and executive compensation on firm value in a sample of U.S oil and gas
producers. They report that executive compensation motivates hedging decisions and
consequently a negative relationship between hedging activities and firm value is found.
In one of the pioneer papers that directly address the relationship between hedging
and firm value, Allayannis and Weston (2001) report a positive relationship between foreign
currency hedging and firm value as measured by Tobin Q ratio in a sample of 720 U.S non-
financial firms. Hedged firms are associated with a 5% on average hedging premium
compared to non hedged firms. However, Guay and Kothari (2003) examine a sample of 234
1 Geczy et al (1997) argue that examining the impact of hedging activities on multinational companies would be difficult because other factors such as foreign sales, foreign denominated debts and foreign tax also significantly affect firm value. Therefore, Jin and Jorion (2006) focuses on a homogeneous industry such as oil and gas or gold mining to provide more accurate results on the relationship between hedging and firm value.
large non-financial corporations and demonstrated that the proportion of hedging activities is
economically small in relation to their entity-level risk exposures and have no significant
effect on firm values. They also argue that the result from Allayannis and Weston (2001)
could be spurious as the increase in firm value is affected by other risk management activities
such as operational hedging which is correlated to derivative hedging. Carter, Rogers, and
Simkins (2006) examine jet fuel price hedging in a sample of 28 American airline companies
and report a similar result to that of Allayannis and Weston (2001). Fuel hedging in this
industry increases the firm value by a significant 12-16% for hedged firms. Similarly,
Bartram et al. (2003) find a positive impact of hedging activities on firm value by
investigating interest rate hedging in a large sample of multi industry companies.2
Dan et al (2005) investigate the impact of hedging on stock return and firm value in a
sample of Canadian oil and gas companies. The methodology in this research is different
from previous studies by using nonlinear regression in investigating the payoff from hedging
activities. They show that the relationship between stock returns and the change in oil and gas
prices is nonlinear and the stock returns do not decrease as oil and gas prices decrease. In
addition, gas hedging plays a more important role than oil hedging in reducing the sensitivity
of stock returns. The proportion of oil and gas reserve also has a greater influence on stock
return than hedging activities. Similarly, Dan et al (2005) examine the impact of hedging on
firm value by using both linear and non linear models and highlight that hedging,
profitability, leverage and reserves have significant effects on firm value. Furthermore, gas
production hedging activities have a marginally negative impact on firm value while gas
reserve hedging activities have a positive impact on firm value.
Most recently, Kapitsinas (2008) reports that hedged firms are associated with about 4.6%
hedging premium on average in a sample of 81 non-financial Greek companies from 2004-
2006. In addition, there is no evidence supporting the hypothesis that manager using hedging
activities for their own personal interest. Rossi and Laham (2008) provide a similar result in a
sample of non-financial Brazilian companies from 1996 to 2005. Similarly, Magee (2008)
finds that foreign currency hedging is positively related to past Tobin’s Q ratio in a sample of
408 large non-financial U.S companies. However, foreign currency hedging has no effect on
firm value after controlling for the dependency of foreign currency hedging on past amount
of Tobin’s Q ratio.
2 Bartram et al (2003), however, reported a statistically insignificant relationship between currency hedging and firm value

3. Data and Methodology
3.1 Data Set
Our initial sample is chosen by extracting from Compustat the list of firms with Global
Industry Classification Standard code of 1010 for Energy industry group. This industry group
includes five sub-classes: Integrated Oil and Gas, Oil and Gas Exploration and Production,
Oil and Gas Refining and Marketing, Oil and Gas Storage and Transportation Coal and
Consumable Fuels. However, only companies belonging to the Oil and Gas Exploration and
Production sub-classes were chosen into the sample as these companies are more likely to
have direct exposures to fluctuations in oil and gas prices, Furthermore, the value of these
firms are more dependent on oil and gas prices than companies in other sub-classes.
Consistent with Jin and Jorion (2006), only firms that meet the following selection
criteria are retained in the sample: the book value of total assets is greater than $20 millions,3
10-K reports are available from Edgar,4 proved oil and gas reserves are reported in 10-K
reports, sufficient information in 10-K reports for calculating hedging position. The
application of these restrictions produce a final sample of 94 firms from 2005 to 2008, or 322
firm year observations.
3.2 Variables Description
3.2.1 Hedging
Hedging information for each firm year observation is manually collected from the 10-K
annually from 2005-2008. The oil and gas industry in the US discloses more information
compared to other countries because of the strict requirement on information disclosure. The
U.S Security and Exchange Commission issued Financial Reporting Release No. 48 in
January 2007 which required the disclosure of market risk information for all firms for fiscal
year ending after June 1998. Under this rule, firms are required to report the quantitative
information about the market risk in one of three formats: tabular, sensitivity analysis or
value at risk; and oil and gas companies usually choose the tabular format.
3 Jin and Jorion (2006) states that firms with total assets of less than $20 million, called “small business issuers”, are required to disclose less information. Therefore, it is hard to indentify whether firms do not hedge or do not disclose hedging information. 4 All companies, foreign and domestic, are required to file registration statements, periodic reports, and other forms electronically through EDGAR.

Under the tabular disclosure method, financial instruments are classified by four
characteristics: fixed or variable rate assets or liabilities, long or short forwards or futures;
written or purchased put or call options; receive fixed or variable swaps (Jin and Jorion
2006). In addition, SFAS 105, released by the Financial Accounting Standards Board in June
1990, requires firms to disclose information about financial instruments with off balance
sheet risk for fiscal year ending after 1990. In general, SFAS 105 and FRR 48 require firms
to report contract amounts and the weighted average price at which these contracts were
entered into.
Following Jin and Jorion (2006), we measure hedging as the sum of delta equivalents
of each position reported at fiscal year-end.5 It is assumed that Δ = -1 for short position and
Δ=1 for long position in all linear hedging instruments of crude oil and gas such as short
futures and forwards, swaps and fixed price contracts. For nonlinear contracts such as
options and collars, hedging deltas are calculated by using the Black’s option pricing model
as follows: 6
∆ call e N d (1)
∆ put e N d (2)
dL S
Xσ T
σ√T (3)
After determining the delta for each contract, the deltas are aggregated to obtain the total
delta for crude oil and gas. We develop two measures of deltas as follows:
Relative delta oil (gas) production = - Total delta oil (gas)/ Next year oil(gas) production (4) Relative delta oil (gas) reserve = - Total delta oil (gas)/Same-year proved oil (gas) reserve (5) The first ratio demonstrates the degree of next year oil/gas production that is effectively
hedged and the second ratio shows the proportion of the current reserve that is hedged.
Panel A of Table Ι provides a snapshot of the number of observations that have
exposure to oil and gas prices while Panel B shows the number of observations that engage in
hedging. A firm is said to have oil/gas exposure when the firm explores and produces oil/gas
and thus is exposed to oil/gas price in that year. Out of 322 firm-year observations, 305 have
exposure to both oil and gas prices 17 have exposure to only oil prices. All firms, however,
have exposure to gas prices. Panel B breaks down the sample into observations of oil hedgers 5 This procedure provides a more precise measure of the extent of hedging than notional amounts or hedging dummy. This method also follows Tufano (1996). 6 In order to calculate the delta for nonlinear contracts in each firm year observation, an Excel program based on the Black’s option price model was written.
and non-oil hedgers, gas hedger and non-gas hedgers. The hedging policies are similar in that
most firms either hedge both oil and gas exposures (153 firm-years) or hedge neither of them
(94 firm-years).
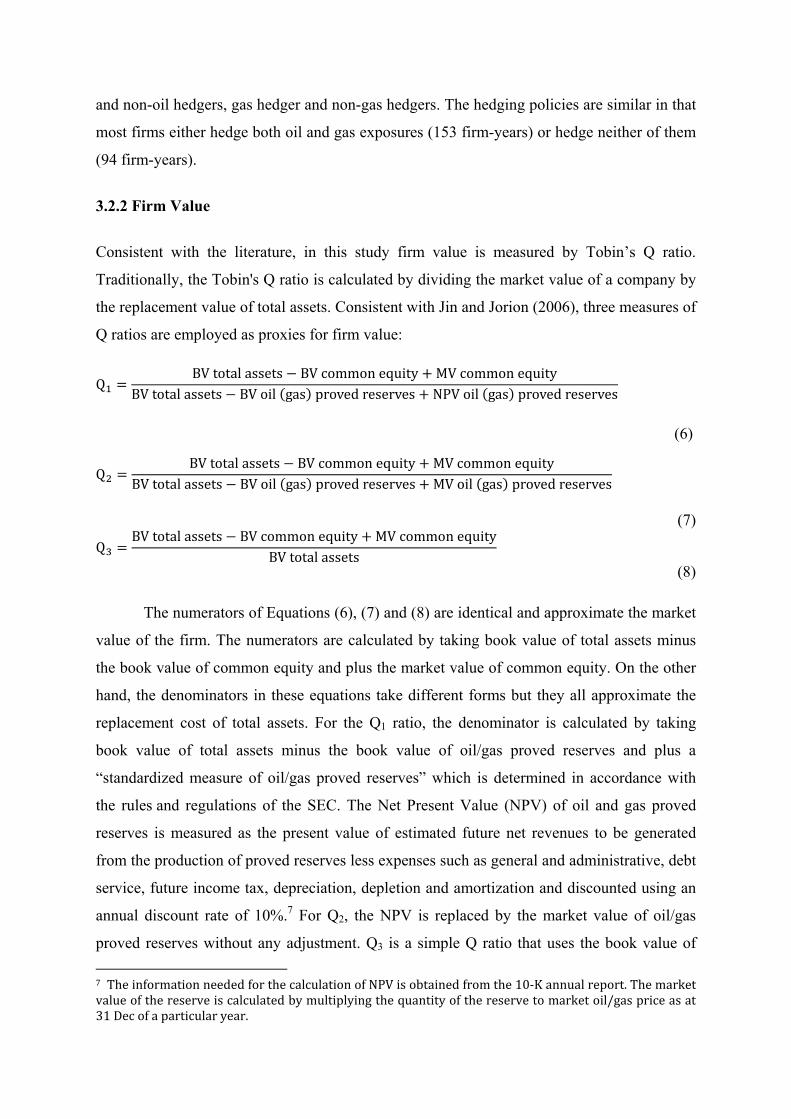
3.2.2 Firm Value
Consistent with the literature, in this study firm value is measured by Tobin’s Q ratio.
Traditionally, the Tobin's Q ratio is calculated by dividing the market value of a company by
the replacement value of total assets. Consistent with Jin and Jorion (2006), three measures of
Q ratios are employed as proxies for firm value:
QBV total assets BV common equity MV common equity
BV total assets BV oil gas proved reserves NPV oil gas proved reserves
(6)
QBV total assets BV common equity MV common equity
BV total assets BV oil gas proved reserves MV oil gas proved reserves
(7)
QBV total assets BV common equity MV common equity
BV total assets
(8)
The numerators of Equations (6), (7) and (8) are identical and approximate the market
value of the firm. The numerators are calculated by taking book value of total assets minus
the book value of common equity and plus the market value of common equity. On the other
hand, the denominators in these equations take different forms but they all approximate the
replacement cost of total assets. For the Q1 ratio, the denominator is calculated by taking
book value of total assets minus the book value of oil/gas proved reserves and plus a
“standardized measure of oil/gas proved reserves” which is determined in accordance with
the rules and regulations of the SEC. The Net Present Value (NPV) of oil and gas proved
reserves is measured as the present value of estimated future net revenues to be generated
from the production of proved reserves less expenses such as general and administrative, debt
service, future income tax, depreciation, depletion and amortization and discounted using an
annual discount rate of 10%.7 For Q2, the NPV is replaced by the market value of oil/gas
proved reserves without any adjustment. Q3 is a simple Q ratio that uses the book value of 7 The information needed for the calculation of NPV is obtained from the 10‐K annual report. The market value of the reserve is calculated by multiplying the quantity of the reserve to market oil/gas price as at 31 Dec of a particular year.

total assets as a proxy for replacement costs. The measures using NPV or market value of
proved reserves, however, are expected to better capture the replacement cost of total assets.
The descriptive statistics of the sample firms are presented in Table ІІ. Panel A
describes the whole sample. The sub-sample of oil hedging activities and gas hedging
activities are reported in Panel B and C respectively. Panel D reports descriptive statistics for
companies without hedging activities.
Total assets are measured at book value. The value of oil and gas reserve is the
standardized measure of proved oil and gas reserves which are reported in annual 10-K
reports. Oil (gas) production hedged (delta production) is the amount of production hedged
divided by the actual oil (gas) production next year. Effectively, this measure gives an
indication of the proportion of next year production that is hedged using financial derivatives.
The oil (gas) reserve hedged (delta reserves) is the amount of reserves hedged divided by the
oil (gas) reserve for the same year. As is indicated in Panel A of Table II, the average total
asset for the entire of sample is around $3.5 billion. In addition, 10 percent of the companies
have assets equal to or less than $69 million and similarly 10 percent of firms have total
assets of more than $8.8 billion. The median total asset is significantly less than the mean
which implies a skewed distribution caused by a number of extreme observations.
Panels B, C and D further show that the average total asset for oil hedging firms is
around $4.9 billion, $5.1 billion for gas hedging firms and $0.44 billion for non-hedging
firms. The mean total assets of non-hedging firms is significantly less than that of firms that
hedge. This result is consistent with previous studies that larger firms are more likely to
hedge than smaller firm. The MVE variable demonstrates similar patterns. The average MVE
for the entire sample is $2.8 billion, for oil-hedged firms is $3.7 billion and $4.2 billion for
gas-hedged firms. The non-hedged firms have an average MVE of $ 0.5 billion, which is 7.4
and 8.4 times smaller than oil hedgers and gas hedgers respectively. The mean of proved
reserve value for the sample is around $3 billion which is more than 85% of total asset. For
oil and hedging firm, the proved oil and gas reserves are 82.5% and 79% of their total assets
on average respectively.
The values of Q1 and Q3 ratios are quite similar in all settings and they are much
higher than the value of Q2 ratio. The reason is that the denominator of Q2 includes the
market value of oil and gas reserves. This variable is calculated by multiplying the quantity of
proved oil and gas reserves by the market price, and these values are substantially greater
than the book value of oil and gas reserves which leads to a higher denominator for Q2 .For
the whole sample, the average values of Q1, Q2, and Q3 are 1.72, 0.56 and 1.82 respectively

while the median are 1.59, 0.43 and 1.46. Q ratios which are greater than one indicate that the
market assess the firm to generate profits in excess to the cost of replacing its assets. A
comparison of the mean and median Q values also shows a skewed distribution. More
importantly, it is observed that Q ratios for oil and gas hedging firms are lightly lower than
that of non hedging firms. This observation holds for all three measures of Q ratios.
As mentioned in the preceding section, out of 305 firm year observations with oil
exposure from 2005 to 2008, 170 observations reported oil hedging activities. Of the firms
that hedge, the mean (median) production delta is 41.35% (36.3%) of next year oil production
which is approximately 4.7% (3.06%) of the proved oil reserve. Similarly, 211 observations,
out of 322 with gas exposure, are engaged in gas hedging activities. The mean (median) gas
delta is approximately 39% (34.32%) of next year gas production which amounts to roughly
4% (3.26%) of proved gas reserve. Compared to Jin and Jorion (2006), it can be seen that
during the 2005-2008, companies hedge oil prices more intensively while the delta for gas
hedging shows sign of declining compared to the 1998 – 2001 sampling period used in Jin
and Jorion (2006). In particular, Jin and Jorion (2006) show that U.S oil producers hedged
33% of their next year oil production while gas producer hedged 41% of their next year gas
production. There was not any firm with negative delta ratio in the entire sample which
indicates that all firms truly hedge or have a net short total delta with oil and gas exposure.
3.2.3 Control Variables
In order to accurately estimate the effect of hedging activities on firm value, it is necessary to
control other explanatory variable that potentially affect firm values. Following previous
studies, the following control variables are included in the regressions: Firm size (natural
logarithm of total assets), profitability (return on assets), investment growth (capital
expenditures to total assets), access to financial markets (a dummy variable equalling to unity
if the firm makes any payout to shareholders in a particular fiscal year and zero otherwise),
leverage (book value of debt to market value of equity) and production costs (the cost of
extracting oil and natural gas which includes both the lifting cost and production taxes). The
information regarding production cost is collected manually from firm’s 10-K annual reports
either on the basis of per Boe (Barrel of oil equivalent) or per Mcfe (thousand cubic feet
equivalent). The choice of our control variables is largely based on the literature.

3.3 Methodology
As the first step, we measure the sensitivity of individual firm monthly stock return to
changes in oil/gas prices. Subsequently, the oil/gas beta is allowed to interact with the
hedging variables to determine whether hedging has any impact on such sensitivity. The
impact of hedging on firm value, on the other hand, is tested by comparing the Tobin’s Q
ratio in hedged and non hedged firms by univariate and multivariate analyses.
3.3.1 Hedging and Firm Stock Sensitivity
Following the method from Jin and Jorion (2006), the sensitivity of monthly firm stock return
to changes of oil and gas prices are estimated by using a two or three factor model specified
as below:
, , , , , , (9)
, , , , , , (10)
, , , , , , , , (11)
where , is the total stock return for firm i in month t., , is the monthly rate of change in the stock market index, , is the monthly rate of change in the price of crude oil, ,
is the monthly rate of change in the price of natural gas and , is the error term.
The effect of hedging on and and are examined by estimating the following
equations:
, , ∆ ,
, ,
,
(12)
, , , ∆ ,
,
,
(13)
, , ∆ ,
,
∆ ,
, ,
(14)

where ∆ is the relative production delta and oil reserve/MVE is the dollar value of reserves
divided by the total market value of equity. Definitions of other variables remain the same as
before.
Following the method of Jin and Jorion (2006), the betas of oil and gas in Equations (9) to
(11) are replaced by a function of hedging delta and oil/gas reserves proportional to total
assets. Hedging activities are expected to reduce the stock prices sensitivities to oil and gas
prices therefore γ2 and γ5 are predicted to have a negative sign. On the other hand, the higher
proportion of the assets in the form of oil and gas reserves is expected to increase the
sensitivities of the stock return with the changes in oil and gas prices. This implies a positive
sign for γ3 and γ6.
3.3.2 Hedging and Firm Value
To test for the relationship between hedging and firm value, the following regressions are
estimated:
∑ (15)
∑ (16)
∑ (17)
where Q ratios are proxy for firm value. The natural logarithmic of Q ratios are used to
control the skewness of the variables which has been discussed previously. This exercise is
also essential to transform the distribution of the variable to a normal distribution. 8 In the
above regressions, hedging variables include hedging dummy, delta production and delta
reserves. The hedging dummy is equal 1 if the firm implements hedging activities in that
year. Delta production is the ratio between total hedging positions and next year oil/gas
production. Delta reserves is the ratio of total hedges to the proved oil/gas reserves at same
year. Equations (15) to (17) are run for both oil and gas.
One of our important aims in this paper is to examine how commodity price volatility
impacts the dynamic of the relationship between hedging and firm value. In particular,
derivative usage is expected to provide benefits for the firm when oil and gas price falls as
derivative contracts allow them to lock in a selling price that is likely to be higher than the
market price at the time of delivery and vice versa. The sample from 2005-2008, when oil 8 This method is also implemented in Jin and Jorion (2006), Lang and Stulz (1994) and Allayannis and Weston (2001) and in most other related studies

and gas prices experience high volatility, provides a perfect setting for this analysis to take
place. In particular, as is evident from Figure I that plots the monthly prices of world crude
oil and natural gas over the period of 2005-2009, oil and gas price demonstrate both an
increasing and declining pattern in this period. To test for the impact of commodity price
volatility on hedging firm value relationship, we develop two dummy variables and .
equals 1 if the observation is in year 2008 and 0 otherwise. equals 1 if the observation
is between 2005-2007 and equal 0 otherwise. The cut-off date is arbitrarily chosen based on
the observation that the first period 2005-2007 corresponds to price increases while the fiscal
year 2008 corresponds to price decreases. The sub-sample has an annual cut off due to the
fact that hedging variables such as delta production and delta reserves can only be collected
on an annual basis. The dummy variables are allowed to interact with the hedging variables
as specified below:
∑
(18)
∑
(19)
∑
(20)
4. Results
4.1 Stock Return Sensitivity and Hedging
Table ΙΙΙ presents the statistical properties of the exposure coefficients from the two-factor
and three-factor models. Two models are estimated for 94 firms by using monthly data over
the period from 2006 to 2009, which are the years following the sample period over which
hedging data are collected. Panel A presents the result for two-factor model for both oil and
gas, while the result for three-factor model is reported in Panel B. In general, the table shows
that the exposures to oil and gas prices are mostly positive and significant. This result is
consistent with expectation as the most significant market risk of oil and gas companies is the
volatility of commodity prices. A decrease in oil and gas price would lead to a significant
decrease in revenue and cash flows, as well as firm value as the major assets of these firms
are in the form of oil/gas reserves. Out of 94 regressions in the two-factor model, around 85%
and 80% of coefficients are positive and significant for oil and gas models respectively. In
terms of economic significance, the changes in oil price have more effect on the firm stock
returns than the changes in gas price. For the median firms, a 1% increase in oil prices leads
to an increase of 0.28% in the stock returns. The magnitude of this oil beta is largely
consistent with previous studies (see Rajgopal 1999, Jin and Jorion 2006 and Dan et al 2005).
However, a 1% increase in gas prices leads to an increase of 0.14% in the stock returns which
is slightly higher than what is reported in Dan et al (2005) (0.1%) and much lower that the
result found by Rajgopal (1999) (0.41%) and Jin and Jorion (2006) (0.29%).
Interestingly, none of the betas are significantly negative in both oil and gas models.
24.47% (10.64%) of oil (gas) betas are positive and significant at 5% level; and 36.17%
(17.02%) of oil (gas) betas are positive and significant at 10% level.9 As expected, market
betas are statistically and economically significant. Specifically, a 1% change in market
return leads to a 1.26% change in stock return on average. Around 98% percent of the market
coefficients are positive; 76% and 80% of them are significant at 5% level and 10% level
respectively. Similar to the oil and gas beta, market betas are largely positive.
Similar results are obtained from the three-factor model. However, compared to the
two-factor model, oil and gas betas have less economic significance. The mean oil beta
reduces from 0.317 to 0.294 and the gas beta from 0.143 to 0.083. The number of firms that
have significant exposures to oil and gas price changes also declines. The three-factor model
records 26.6% of firms with significant oil exposure and 13.83% of firms with significant gas
exposure compared to 36.17% and 17.02% in the two factor model.
4.1.2 Effect of hedging on stock price sensitivity to oil and gas prices
Table IV summarises pooled cross-sectional time-series regressions of stock returns on the
market and oil (gas) price changes, with coefficients adjusted for the effect of hedging and
reserves, over the years 2006 to 2009. Panel A estimates separately the sample of oil and gas
hedging firms and Panel B combines them. The signs of γ2 and γ5 are expected to be negative
because hedging activities aim at reducing the exposure to oil and gas prices. However, the
higher quantity of oil and gas reserves is expected to increase the sensitivities of the stock
return with the changes in oil and gas prices. The implied expected sign for γ3 and γ6 is
therefore positive. Table IV suggests that hedging activities and the proportion of oil and gas
9 Jin and Jorion (2006) and Rajgopal (1999) used one-sided tests for statistical significance. However, the proportion of significant of oil and gas beta is not significantly higher than the result from our study, which made use of two-sided tests.

reserves to total assets do not have any impact on the stock prices sensitivities to oil and gas
price exposures, as is evident by the lack of statistical significance of , , , .
The change in oil prices and market returns remains positive and significant
parameters in estimating the firm stock returns. The effect of oil prices exposure to firm stock
return is stronger in this model than in models without hedging and reserves variables. A 1%
increase in oil return leads to an increase by 0.53%, 0.31% and 0.44% to firm stock return in
separate oil model, gas model and in joint model respectively. The market return coefficients
are consistent with previous estimations whereby a 1% increase in market return can lead to
an increase in the region of 1.25-1.27% in firm stock return. However, gas return does not
significantly affect stock return in either oil and gas separate models or joint model.
4.2 Firm Value and Hedging
4.2.1 Univariate Analysis
Results of univariate tests that investigate the difference in the mean Q ratio of hedgers and
non-hedgers as a group are reported in Table V. As is evident from Table V, the Q ratios of
firms with hedging activities are consistently lower than Q ratios of firms that do not hedge
across different measures of Q. This result is similar to that of Jin and Jorion (2007) and Chen
et al (2008). Both of these studies find that hedgers are associated with discount to their firm
values. Chen et al (2008) further report that hedging activities are motivated by managerial
risk aversion.
Panels A and B display the results in relation to oil hedging. Panel A compares Q
ratios, total asset and market value of equity between oil hedging firms and non-oil hedging
firms. The Q ratios of hedged firms are significantly lower than non-hedged firms in both
panels. In Panel A, the average Q1 value for hedgers is 1.58 and for non-hedger is 1.87,
resulting a 0.29 difference which is approximately 18.3% and 15.5% of oil hedgers' and non-
oil hedgers’ firm value respectively. A comparison between median Q values of hedgers and
non-hedgers yield similar result that firms that hedge have lower firm value than firms that do
not hedge in relation to Q3. Hedgers and non-hedgers, however, are not statistically different
in relation to Q1 and Q2. In addition, the difference in median Q values is not as substantial
compared to the mean difference. Panel B compares oil hedging firms with firms that do not
engage in any type of hedging. The results in this Panel continue to suggest that oil hedgers
have lower firm values than non-hedgers. The magnitude of the difference is even more

significant compared to Panel A. The difference in mean Q1, Q2 and Q3 is 0.38, 0.33 and 0.76
respectively in favour of non-hedgers.
Similar results are found for firms with gas exposure. Comparisons between gas
hedging firms with respect to non-gas hedging firms and non-hedging firms are reported in
Panel C and D respectively. In Panel C, the value discount of hedging amounts to 0.25, 0.33
and 0.52 for Q1, Q2 and Q3 respectively. These differences in firm value increase to 0.32, 0.35
and 0.59 in Panel D.
Table V also presents the result for the mean equality test in relation to firm size. On
average, oil hedging firms have 2.5 times more assets than non-oil hedging firm and 11 times
more assets than non-hedging firms. Similarly, the total assets of gas hedging firms are 10.7
times greater than those of non-gas hedging firms and 11.7 times of non-hedging firms. The
essence of the results does not change when the median values are used in the test. Overall,
the univariate analysis shows uniformly the presence of a significant hedging discount for
both oil and gas hedging activities. Furthermore, consistent with expectations, hedgers are
found to be significantly larger than non-hedgers.
4.2.2 Multivariate Analysis
The results of multivariate analysis are reported in Table VI, where Panel A shows the
outcome of pooled cross-sectional time-series least squares regression with the firm value
measured by Ln(Q1), while in Panels B and C the same regression is re-estimated but the
dependent variables are Ln(Q2)and Ln(Q3).
In order to make the analysis comparable to other studies, initially we focus on
analysing result from panel C with Q3 measure of which the denominator is the book value of
total assets in Panel C. One of the main variables used to test the relationship is the hedging
dummy that equal 1 if a firm uses oil or/and gas hedging activities and 0 otherwise. The
coefficients of the hedging dummy are negative and significant, at 1 % level for oil regression
and 10% level for gas regression, which suggests that the existence of hedging activities
significantly reduces the firm value. As the hedging dummy coefficient is interpreted as a
change of x% in firm value due to full hedging ceteris paribus, firms with oil hedging
activities are associated with a lower market value of the magnitude of 15.3 % and gas
hedging activities associate with lower firm value by 12.3%. The result is similar in Panel A
where firm value is measured by Q1 ratio. Firms with oil hedging activities have a 14% lower
market value, significant at 5% level. The most striking result in relation to the hedging
dummy is the fact that hedging is associated with a firm value discount, in a range of 12.3 to
15.5% depending on the nature of the hedge (oil or gas).
Another important hedging variable is delta production. Panel C reports negative
coefficients of production hedging for both oil and gas regressions, once again indicating that
hedging associates with lower firm value. In particular, the coefficient of delta production for
oil (gas) companies is – 0.146 (-0.233) which imply that firms that hedge 100% of their oil
(gas) production next year would have a lower firm value of 14.6% (23.3%). However, gas
producers, on average, hedge around 39% of their next year gas production therefore the
effect from hedging activities to their firm values is only 9.1% discount. The production
hedging are not significant to firm values neither for Q1 and Q2 measures, but the signs of
their coefficients are the same and suggest that production hedging has a negative
relationship with firm value.
The results are mixed in relation to the delta reserves variable, measured as the ratio
of total hedge position over proved oil/gas reserves of the same fiscal year. The coefficients
for delta reserves are not significant across the Panels except in gas regression in Q2 measure.
The gas producing firms that hedge 100% of their proved gas reserve would obtain a
premium of 126.9% in their firm values. However, those firms hedge about 4% of their
reserve therefore the hedging activities actually enhance their values by 5.1%. The coefficient
of delta reserves in gas model with Q3 measure has a negative value but it is insignificant.
Those coefficients are not economically as well as statically significant in oil model in Panel
A and C.
Table VI shows that most control variables have expected signs across all panels. The
coefficients of log total assets are negative and significant at 1% level in Panels B and C, but
it is not significant with Q1 measure. Negative coefficient of log total asset suggests that
smaller firms appear to have higher Q ratios. This result is consistent with the studies of Lang
and Stulz (1994) and Allayannis and Weston (2001). The return on asset variable has a
positive sign, as expected, which is consistent with result of Allayannis and Weston (2001).
The result indicates that highly profitable firms appear to have higher Q ratios. This positive
relationship is significant at 1% level in both oil and gas regression in Panel C, but it is
insignificant in Q1 and Q2 models. The coefficients of growth opportunity, measured as the
ratio of capital expenditure over total assets, show a statistically positive significant
relationship with respect to firm value. The market seems to highly value firms with high
capital expenditure and investment opportunities, which supports the evidence from
Allayannis and Weston (2001). Firms with any form of payout (dividend or share repurchase)
during the fiscal year have significantly higher Q ratio as payout can indicate positive signals
from management about future profitability. Firms with higher leverage level are associated
with a lower Q ratio, which is consistent with Kapitsinas (2008) who examine the impact of
derivative use in Greek companies. The results are strongly significant at 1% level in Panels
B and C for both oil and gas models and at 10% level in gas model in Panel A. Production
costs, on the other hand, do not appear to have any impact on firm value.
4.2.3 The value of hedging and commodity price volatility
The results of our investigation on the impact of commodity price volatility on the dynamic
of the relationship between hedging and firm value are reported in Table VII.10 The
introduction of dummy variables that proxy for periods of increasing/decreasing oil and gas
prices produces major qualitative and quantitative changes to the results. Firms with hedging
activities before fiscal year 2008 are associated with a significant discount to firm values
compared to firms without derivative hedging. The coefficients for the hedging dummy
which depicts the effect of derivative usage on firm value in the increasing price period
are negative across the panels in both oil and gas models and are strongly significant at 1%
level using Q2 and Q3. In comparison with the results in the entire sample as presented in
Table VI, the magnitudes of the hedging dummy during this period are extremely negative
with the values of -0.350 and -0.376 in oil model; -0.484 and -0.406 in gas model using Q2
and Q3 respectively. The coefficients provide a manifestation that firms with oil hedging are
associated with a discount of 35%-37.6% to their firm values; while firms with gas hedging
activities have lower firm value by approximately 40.6% to 48.4%.
On the other hand, the coefficients of the hedging dummy (DA) for the second period,
characterised by falling commodity prices, have positive signs, as expected, which can be
interpreted as hedged firms were observing hedging premiums. A premium in a range of
15.6% - 17.3%, is present in firms with exposure to crude oil price through the use of
derivatives. The premium of derivatives usage is consistent with the previous research of
Allayannis and Weston (2001) and in line with Carter et al (2006) and Lookman (2003), who
report that hedging created premium of 3.6% - 14% and in some excessive cases, the
premium can reach 16% -26%.
The result from other hedging variable, delta production, also supports the hypotheses
that hedging activities in 2005-2007 is associated with a lower firm value while firm value is 10 The coefficients relating to the control variables are not reported in Table VII to conserve space and are available from authors upon request.

actually enhanced via hedging activities in 2008. The oil model reports significant negative
coefficients of delta production for firm year observations before 2008 with the value -0.438
and -0.317 using Q2 and Q3 measures. The result can be interpreted as firms with oil
derivatives in years 2005-2007 who hedge 100% of next year oil production, have lower firm
value by a magnitude of 31.7% to 43.8 %. However, the oil production companies hedge
41.35% of their next year production on average, therefore the impacts of hedging actually
are 13.1% or 18.1% lower Q ratio which are in line with the result for the entire sample
reported in Table VI.
Derivative usage to hedge gas price exposure provides a similar result. For a firm in
2005-2007 that hedges 100% of their next year gas production, a discount of 59% to 73.5% to
is documented. However, since firms do not hedge 100% of production, the actual impacts of
gas hedging are a discount of 23% to 28.65%. These results are strongly statically significant
at 1% level using Q2 and Q3 measures. The positive coefficients for delta production in fiscal
year 2008 provide the evidence that oil hedging activities are highly rewarded by the market
in times of declining oil and gas price. For the firms with oil hedging, the firm value would
increase by 29.6% if a full hedge is observed. Given that a full hedge is not undertaken by
firms in 2008, firms that engage in hedging are associated with higher firm values of
approximately 12.2% on average. The impact of gas hedging activities is not significant in
this case.
The final hedging variable, delta reserves, provides a similar result and supports the
hypotheses. The signs of coefficients in oil model fluctuate and in general are not significant
across the panels. However the results in the gas model are strongly significant at 1% level
using Q2 and Q3 measures and are in accordance with the expectations. Firms with hedging
activities in years 2005-2007 have lower value by a range of 592.2% to 635.8% if they hedge
100% of their proved reserve gas. On average, their total hedge position is about 4% of the
quantity of reserve. Therefore the actual reduction is from 23.7% to 25.4%. On the other
hand, firms that hedge during the decreasing period of gas price (2008) are rewarded by
investors with higher valuation. The positive coefficient with the magnitude of 1.593 is found
in Panel B using Q2 measure indicating that the users of gas derivatives have higher firm
value than nonuser by 159.3% if they hedge 100% of their reserve. On average firms hedge
4% of their reserves, therefore the hedging impact in the sample is a 6.4% discount.

4.3 Robustness Checks
We conduct a number of robustness checks to ensure the reliability of the results reported
earlier. In particular, this section will provide empirical test for potential non-linearity
between hedging and firm value. In addition, to eliminate the concern that the results might
have been impacted upon by the existence of outliers, the regressions are re-estimated on an
adjusted sample after outliers are removed. The final robustness check that is conducted
replaces the OLS model by the fixed effect model in estimating the coefficients. These
robustness tests are detailed below.
4.3.1 Testing for Non Linearity
Dan et al (2005) find that hedging activities affect firm value and firm monthly stock return
in a non-linear manner in a sample of Canadian oil and gas firms by employing nonlinear
semi-parametric additive models. To test for non-linearity, the square of delta production and
delta reserves variables are introduced in Equations (14) to (16), specifically, the following
equations are estimated:
∑
(21)
(22)
The coefficient of interest here is δ as a statistically significant δ indicates a non-linear
relationship between firm value and the extent of hedging. Nevertheless, out of 12 variants of
the above regressions, δ is statistically significant in one variant where firm value is proxied
by Q2 and hedging is measured as delta reserves. This lack of statistical significance
confirms the non-existence of non-linearity in the current sample and results reported in
preceding sections are not affected by potential non-linearity. Panel A of Table VIII presents
these results.
4.3.2 Outlier Removal
The main purpose of this exercise is to minimise the noise in the data and to improve
the accuracy and the fit of regressions which depict the relationship between hedging and
firm value more reliably. In conducting this exercise, observations with production hedging
ratio (delta) in excess of 1 are removed from the sample. A delta greater than 1 suggests that
the firm hedges more than 100% of its next year production. As a result, derivative usage in
these firms may be driven by factors other than a demand to hedge oil and gas exposures. By
removing outliers for delta production, outliers for delta reserves are automatically removed
as these two variables are highly correlated. 15 firm year observations are removed in total,
for both oil and gas models. The removal of outliers, however, does not produce any
significant difference in the reported data. The essence of our reported data remains largely
unchanged and most notably, hedging continues to be associated with lower firm value.
These results are reported in Panel B of Table VIII
4.3.3 Fixed Effect
As a final robustness check, the fixed effect model is used to estimate the coefficients instead
of the pooled OLS model. The main reason for the use of a balanced panel data model is to
control for the unobservable heterogeneity which can affect the level of Q ratios. There are
characteristics that are difficult to be observed or measured and they vary among across firms
but remain constant overtime or vary among period but remain constant to firms. By using
the simplest and most common method of balanced panel data pooled OLS, the estimator can
be biased because this method does not take into account the effect of heterogeneity.
Two variations of the fixed effect models are employed. The first model assumes that
the coefficients are the same for every company but different between years. The estimates
are equivalent to estimating OLS model and adding a dummy variable for each year in the
sample. The second model assumes that individual companies have different coefficients but
they are constant in different years. The estimates are equivalent to estimating OLS model
and adding a dummy variable for each individual company in the sample. The results derived
from the fixed effect models however do not largely differ from what is reported earlier. Only
one exception exists in relation to the fixed effect model with fixed cross-section. In this
setting, hedging no longer appears to have an impact on firm value as the coefficients on
hedging variables are no longer statistically significant. Fixed effects results are reported in
Panel C of Table VIII.
• The impacts of oil and gas price exposures on firm stock returns are positive and
significant. However, there is lack of relationship between hedging and exposure.

• Firms that hedge have lower firm value compared to those that do not. Oil hedging is
associated with a hedging discount in the region of 14% – 15% while gas hedging
produces a hedging discount to the magnitude of 9.1% – 12.3%.
• The hedging discount is only present in periods of increasing oil and gas prices. On
the contrary, in periods of declining prices, hedging is found to have a positive impact
on firm value. The hedging discount can be as substantial as 48.6% while hedging
policies in periods characterized by falling oil and gas prices produce a hedging
premium between 6.4% – 17.3%.
5. Conclusion
In this paper, we detail an empirical study of the impact of hedging on firm risk and firm
value in a sample of 94 U.S oil and gas companies from 2005 to 2008. Our main findings are
as follows. First, approximately 17%-36% of firms have significant exposures to oil and gas
prices. However, we do not find any evidence to support the hypothesis that hedging reduces
the sensitivity of stock return to commodity’s price exposure. Second, the empirical findings
are strongly suggestive of a negative and significant relationship between hedging and firm
value. The magnitude of the impact differs between oil hedging and gas hedging. Firms with
oil hedging policies experience a decrease in values of 14%-15% while gas hedging is
associated with a 9.1% -12.3% hedging discount. Finally and most interestingly, we find that
the negative impact of hedging on firm value is only evident in periods of increasing oil and
gas prices. In an inflationary environment where oil and gas price increases, hedging plays an
important role in enhancing firm value. This finding is a major contribution of this paper and
has the potential to explain the discrepancies in results previously documented regarding the
relationship between hedging and firm value.

Table Ι: Description of Sample by Exposure and Hedging Decisions Panel A splits the total sample of 322 firm-years into observations with and without oil exposure, and with and without gas exposure. The observation is said to have oil/gas exposure when the firm explore and produce oil/gas and thus are exposed to oil/gas price in that year. Panel B breaks down the sample into observations with or without hedging activities as oil hedgers and non oil hedgers, gas hedger and non gas hedgers.
Panel A: Distribution of Exposures Across Firm-Years
Oil exposure Non-oil exposure Total
Gas exposure 305 17 322
Non-gas exposure 0 0 0
Total 305 17 322
Panel B : Distribution of Hedging Decisions for Firm-Years with Exposure to Both
Factors
Oil Hedgers Non-oil Hedgers Total
Gas hedgers 153 58 211
Non-gas hedgers 17 94 111
Total 170 152 322

Table ΙΙ: Summary Statistic for Firm Characteristics
Panel A describes the sample of 94 U.S oil and gas companies from 2005 to 2008, with a total of 322 firm-year observations. Subsamples of firm-years with oil hedging activities are reported in Panel B and with gas hedging activities are reported in Panel C. Panel D describes firm-years without any hedging activities. Total assets represent BV of assets. The value of reserves is the standardized measure of oil and gas reserves, as reported in 10-Kannual reports. Oil/gas production hedged is the total amount of hedging divided by the actual production next year. Oil/gas reserve hedged is the amount of hedging divided by the oil/gas reserves reported for the same year. The three Q ratios share the same numerator and differ only in the denominator. Numerator = BV total assets − BV common equity + MV common equity. The denominators for Q1, Q2, Q3, respectively, are BV total assets − BV oil/gas proved reserves + NPV proved reserves; BV total assets − BV oil/gas proved reserves + MV proved reserves; and BV of assets. Observation Mean SD Median 10th per 90th per Maximum
Panel A: All Firm-Years
Total Asset ($m) 322 3,553 8,136 668 69 8,852 58,844
MVE ($m) 322 2,807 6,400 547 39 7,079 39,495
Reserve ($m) 322 2,995 6,186 619 70 8,374 48,739
Q1 322 1.72 1.32 1.59 0.86 2.91 5.01
Q2 322 0.56 0.64 0.43 0.21 0.91 1.64
Q3 322 1.82 1.15 1.46 0.91 3.12 10.54
Panel B : Firm-Years with Oil Hedging Activities
Total Asset ($m) 170 4,898 9,388 1,330 244 12,089 58,844
MVE ($m) 170 3,715 6,429 1,252 129 11,746 35,803
Reserve ($m) 170 4,040 7,709 1,081 162 10,329 48,739
Oil Delta Prod (%) 170 41.35 33.99 36.3 4.45 83.68 182.34
Oil Delta Res (%) 170 4.70 9.56 3.06 0.30 9.43 115.58
Q1 170 1.58 0.99 1.51 1.00 2.34 5.01
Q2 170 0.47 0.26 0.43 0.21 0.74 1.71
Q3 170 1.49 0.58 1.33 0.91 2.24 4.35
Panel C : Firm-Years with Gas Hedging Activities
Total Asset ($m) 211 5,145 9,641 1,330 175 15,815 58,844
MVE ($m) 211 4,256 7,295 1,219 128 15,143 39,495
Reserve ($m) 211 4,056 7,572 1,104 130 10,419 48,739
Gas Delta Pro (%) 211 38.98 26.92 34.32 5.21 75.34 137.52
Gas Delta Res (%) 211 4.05 7.28 3.26 0.51 7.44 100.95
Q1 211 1.63 1.26 1.60 0.96 2.52 5.01
Q2 211 0.45 0.21 0.43 0.21 0.68 1.64
Q3 211 1.63 1.05 1.37 0.91 2.48 10.54

Panel D : Firm-Years without Hedging Activities
Total Asset ($m) 94 440 740 132 38 1,495 38,254
MVE ($m) 94 498 799 217 37 1,092 20,440
Reserve ($m) 94 369 915 67 13 1,157 31,281
Q1 94 1.98 1.55 1.62 0.57 3.91 8.06
Q2 94 0.82 1.11 0.44 0.21 1.27 6.78
Q3 94 2.23 1.33 1.92 0.87 4.12 5.93
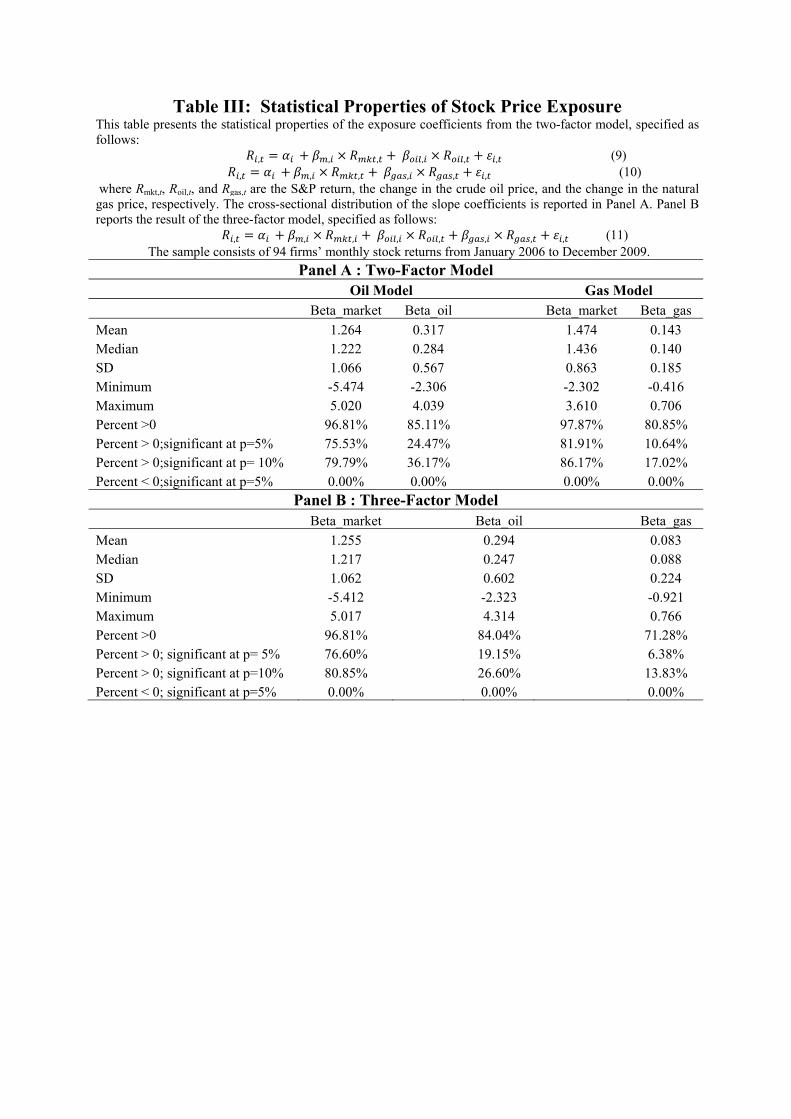
Table ΙΙΙ: Statistical Properties of Stock Price Exposure This table presents the statistical properties of the exposure coefficients from the two-factor model, specified as follows: , , , , , , (9)
, , , , , , (10) where Rmkt,t, Roil,t, and Rgas,t are the S&P return, the change in the crude oil price, and the change in the natural gas price, respectively. The cross-sectional distribution of the slope coefficients is reported in Panel A. Panel B reports the result of the three-factor model, specified as follows: , , , , , , , , (11)
The sample consists of 94 firms’ monthly stock returns from January 2006 to December 2009. Panel A : Two-Factor Model
Oil Model Gas Model Beta_market Beta_oil Beta_market Beta_gas Mean 1.264 0.317 1.474 0.143 Median 1.222 0.284 1.436 0.140 SD 1.066 0.567 0.863 0.185 Minimum -5.474 -2.306 -2.302 -0.416 Maximum 5.020 4.039 3.610 0.706 Percent >0 96.81% 85.11% 97.87% 80.85% Percent > 0;significant at p=5% 75.53% 24.47% 81.91% 10.64% Percent > 0;significant at p= 10% 79.79% 36.17% 86.17% 17.02% Percent < 0;significant at p=5% 0.00% 0.00% 0.00% 0.00%
Panel B : Three-Factor Model Beta_market Beta_oil Beta_gas Mean 1.255 0.294 0.083 Median 1.217 0.247 0.088 SD 1.062 0.602 0.224 Minimum -5.412 -2.323 -0.921 Maximum 5.017 4.314 0.766 Percent >0 96.81% 84.04% 71.28% Percent > 0; significant at p= 5% 76.60% 19.15% 6.38% Percent > 0; significant at p=10% 80.85% 26.60% 13.83% Percent < 0; significant at p=5% 0.00% 0.00% 0.00%

Table IV: Effect of Hedging on Oil and Gas Betas This table summarises pooled cross-sectional time-series regressions of stock returns on the market and oil (gas) price changes, with coefficients adjusted for the effect of hedging and reserves, over the years 2006 to 2009. Panel A models the oil and gas betas separately.
, , ∆ ,
, , ,
(12) where ∆ is the relative production delta and oil reserve/MVE is the dollar value of reserves divided by the total market value of equity. Panel B jointly models the oil and gas beta
, , ∆ ,
, ∆ ,
, ,
(14) In Panel A, regressions include oil (gas) hedging firms only. In the Panel B, regressions include all firms with both oil and gas exposures and some hedging activities. White-adjusted t-statistics are reported between parentheses. ***, **,* denote significance at the 1%, 5% and 10% levels, respectively.
Panel A: Separate Oil and Gas Beta Model Independent Variables Oil Regression Gas regression R_mrt 1.275 1.247
(4.73)*** (5.63)*** R_oil 0.531 0.310
(2.49)** (2.83)*** R_gas 0.048 0.124
(0.42) (0.77) Delta_(oil/gas) x R_(oil/gas) -0.343 -0.192
(-0.95) (-0.58) [Reserve_(oil/gas)/MVE] x R_(oil/gas) -0.001 0.005
(-0.06) (0.30) Adjusted R-squared 2.20% 2.40% Number of Observations 2,059 2,506
Panel B: Joint Oil and Gas Beta Model Independent Variable Coefficients t-Statistics R_mrt 1.29 (4.28)*** R_oil 0.44 (1.83)* Delta_oil x R_Oil -0.23 (-0.58) [Reserve_oil/MVE] x R_oil 0.00 (-0.11) R_gas 0.15 (0.68) Delta_gas x R_gas -0.22 (-0.48) [Reserve_gas/MVE] x R_gas 0.00 (0.05) Adjusted R-squared 1.69% Number of Observations 1,843
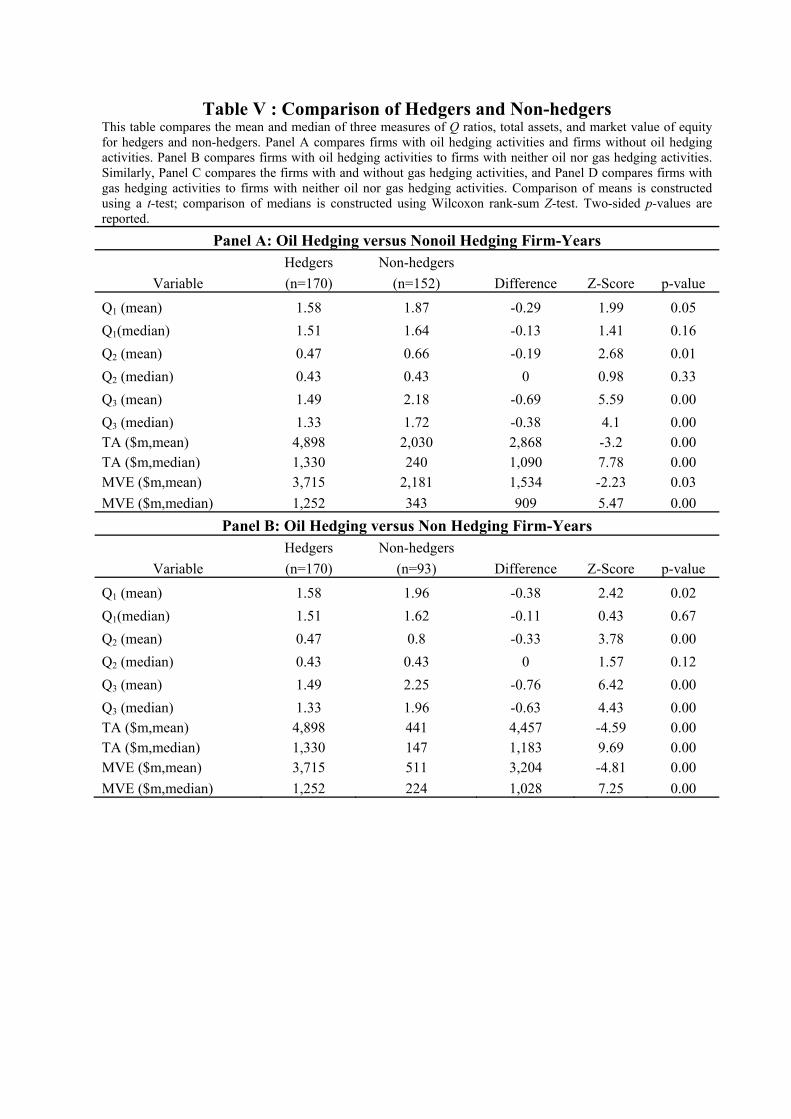
Table V : Comparison of Hedgers and Non-hedgers This table compares the mean and median of three measures of Q ratios, total assets, and market value of equity for hedgers and non-hedgers. Panel A compares firms with oil hedging activities and firms without oil hedging activities. Panel B compares firms with oil hedging activities to firms with neither oil nor gas hedging activities. Similarly, Panel C compares the firms with and without gas hedging activities, and Panel D compares firms with gas hedging activities to firms with neither oil nor gas hedging activities. Comparison of means is constructed using a t-test; comparison of medians is constructed using Wilcoxon rank-sum Z-test. Two-sided p-values are reported.
Panel A: Oil Hedging versus Nonoil Hedging Firm-Years Hedgers Non-hedgers
Variable (n=170) (n=152) Difference Z-Score p-value
Q1 (mean) 1.58 1.87 -0.29 1.99 0.05Q1(median) 1.51 1.64 -0.13 1.41 0.16Q2 (mean) 0.47 0.66 -0.19 2.68 0.01Q2 (median) 0.43 0.43 0 0.98 0.33Q3 (mean) 1.49 2.18 -0.69 5.59 0.00Q3 (median) 1.33 1.72 -0.38 4.1 0.00TA ($m,mean) 4,898 2,030 2,868 -3.2 0.00TA ($m,median) 1,330 240 1,090 7.78 0.00MVE ($m,mean) 3,715 2,181 1,534 -2.23 0.03MVE ($m,median) 1,252 343 909 5.47 0.00
Panel B: Oil Hedging versus Non Hedging Firm-Years Hedgers Non-hedgers
Variable (n=170) (n=93) Difference Z-Score p-value
Q1 (mean) 1.58 1.96 -0.38 2.42 0.02Q1(median) 1.51 1.62 -0.11 0.43 0.67Q2 (mean) 0.47 0.8 -0.33 3.78 0.00Q2 (median) 0.43 0.43 0 1.57 0.12Q3 (mean) 1.49 2.25 -0.76 6.42 0.00Q3 (median) 1.33 1.96 -0.63 4.43 0.00TA ($m,mean) 4,898 441 4,457 -4.59 0.00TA ($m,median) 1,330 147 1,183 9.69 0.00MVE ($m,mean) 3,715 511 3,204 -4.81 0.00MVE ($m,median) 1,252 224 1,028 7.25 0.00

Table V: Comparison of Hedgers and Non-hedgers (cont) Panel C: Gas Hedging versus Non-gas Hedging Firm-Years
Variable Hedgers Non-hedgers n=211 n=111 Difference Z-Score p-value
Q1 (mean) 1.63 1.88 -0.25 1.61 0.11 Q1(median) 1.6 1.49 0.11 0.59 0.55Q2 (mean) 0.44 0.77 -0.33 4.45 0.00Q2 (median) 0.43 0.43 0 2.03 0.04Q3 (mean) 1.64 2.16 -0.52 3.93 0.00Q3 (median) 1.37 1.92 -0.55 3.8 0.00TA ($m,mean) 5,169 480 4,690 -5.1 0.00TA ($m,median) 1,330 178 1,152 9.81 0.00MVE ($m,mean) 4,276 562 3,714 -5.33 0.00MVE ($m,median) 1,237 253 983 7.22 0.00
Panel D: Gas Hedging versus Non Hedging Firm-Years Hedgers Non-hedgers
Variable n=211 n=95 Difference Z-Score p-value
Q1 (mean) 1.63 1.96 -0.32 1.95 0.05Q1(median) 1.6 1.62 -0.02 0.09 0.93Q2 (mean) 0.44 0.79 -0.35 4.47 0.00Q2 (median) 0.43 0.43 0 1.85 0.06Q3 (mean) 1.64 2.23 -0.59 4.2 0.00Q3 (median) 1.37 1.96 -0.59 3.93 0.00TA ($m,mean) 5,169 439 4,731 -4.76 0.00TA ($m,median) 1,330 147 1,184 9.75 0.00MVE ($m,mean) 4,276 512 3,764 -5 0.00MVE ($m,median) 1,237 224 1,013 7.31 0.00

Table VI: Hedging and Firm Value This table presents the pooled cross-sectional time-series least squares regressions of the impact of hedging on firm value. The models are
∑ (15) ∑ (16) ∑ (17)
The dependent variables are measured by the natural log of Q1, Q2, and Q3. The sample includes 94 firms from 2005 to 2008, or a total of 322 firm-years observation. The variable Hedging dummy is a dummy variable equal to one if the company hedges; delta production is the ratio of total hedges to production; and delta reserves is the ratio of total hedges to reserves. The control variables are as follows: log (asset) is the log of BV of total assets; ROA is defined as the ratio of net income to total assets; Investment_growth is measured as the ratio of capital expenditure over total assets; Leverage is defined as the BV of long-term debt over MV of common equity; Payout dummy equals one if the firm has some form of payout including both dividend and share repurchase on its common equity in the current year and Production cost is dollar cost per barrel of oil equivalent. t-statistics are reported in the parentheses. *, **, *** denote significance at the 10%, 5% and 1% levels, respectively Oil Gas 1 2 3 1 2 3
Panel A: Dependent Variable is LnQ1Hedging dummy -0.140 -0.030
(-2.33)** (-0.43) Delta_production -0.057 -0.013
(-0.59) (-0.12) Delta_reserve 0.002 0.118
(0.08) (0.26) Log(asset) 0.077 0.042 0.015 0.052 0.043 0.041
(1.91)* (1.12) (0.40) (1.19) (1.12) (1.12) ROA 0.060 0.082 0.065 0.093 0.093 0.092
(0.44) (0.59) (0.47) (0.68) (0.67) (0.66) Invest_growth 0.421 0.405 0.340 0.420 0.413 0.407
(2.27)** (2.16)** (1.77)* (2.22)** (2.15)** (2.18)** Payout dummy 0.118 0.120 0.117 0.113 0.112 0.112
(2.08)** (2.09)** (2.03)** (1.97)** (1.96)** (1.96)** Leverage -0.036 -0.038 -0.033 -0.045 -0.046 -0.047
(-1.47) (-1.48) (-1.31) (-1.79)* (-1.77)* (-1.89)* Production cost -0.002 -0.002 -0.003 0.008 0.008 0.008 (-0.60) (-0.69) (-1.13) (0.43) (0.44) (0.42) Observation 316 316 316 316 316 316 R-squared 0.062 0.047 0.038 0.045 0.044 0.044

Table VI: Hedging and Firm Value (cont) Oil Gas 1 2 3 1 2 3
Panel B: Dependent Variable is LnQ2 Hedging dummy 0.05 -0.056
-0.66 (-0.66)Delta_production -0.009 -0.166
(-0.07) (-1.27) Delta_reserve 0.019 1.269
-0.88 (2.38)**Log(asset) -0.228 -0.214 -0.257 -0.196 -0.198 -0.217
(-4.68)*** (-4.70)*** (-5.63)*** (-3.76)*** (-4.31)*** (-4.93)***ROA 0.147 0.141 0.134 0.146 0.151 0.133
-0.88 -0.84 -0.81 -0.87 -0.9 -0.8Invest_growth 0.114 0.123 -0.021 0.147 0.188 0.127
-0.5 -0.54 (-0.08) -0.65 -0.82 -0.57Payout dummy 0.2 0.2 0.191 0.201 0.202 0.205
(2.93)*** (2.92)*** (2.76)*** (2.92)*** (2.94)*** (3.00)***Leverage -0.097 -0.094 -0.078 -0.093 -0.085 -0.104
(-3.22)*** (-3.04)*** (-2.61)*** (-3.06)*** (-2.73)*** (-3.46)***Production cost -0.002 -0.002 -0.005 -0.006 -0.004 -0.008 (-0.58) (-0.49) (-1.48) (-0.26) (-0.18) (-0.35)Observation 319 319 303 319 319 319R-squared 0.124 0.123 0.142 0.124 0.127 0.138
Panel C: Dependent Variable is LnQ3 Hedging dummy -0.153 -0.123
(-2.64)*** (-1.84)* Delta_production -0.146 -0.233
(-1.63) (-2.28)** Delta_reserve 0.006 -0.493
-0.36 (-1.17)Log(asset) -0.119 -0.148 -0.188 -0.121 -0.139 -0.159
(-3.12)*** (-4.14)*** (-5.46)*** (-2.98)*** (-3.86)*** (-4.57)***ROA 0.491 0.515 0.469 0.518 0.523 0.516
(3.78)*** (3.95)*** (3.79)*** (3.97)*** (4.03)*** (3.95)***Invest_growth 0.824 0.821 0.723 0.85 0.891 0.803
(4.71)*** (4.66)*** (4.16)*** (4.79)*** (4.97)*** (4.56)***Payout dummy 0.065 0.07 0.053 0.068 0.07 0.065
-1.21 -1.3 -1 -1.26 -1.3 -1.2Leverage -0.111 -0.107 -0.105 -0.111 -0.103 -0.115
(-4.73)*** (-4.42)*** (-4.66)*** (-4.67)*** (-4.20)*** (-4.85)***Production cost -0.002 -0.002 -0.005 -0.015 -0.013 -0.014 (-0.91) (-0.82) (-1.69) (-0.90) (-0.75) (-0.85)Observation 319 319 319 319 319 319
0.233 0.222 0.233 0.222 0.227 0.217

Table VII: Firm Value and Commodity Price Volatility
This table presents the pooled cross-sectional time-series least squares regression of the impact of hedging on firm value. The models are ∑
(18)
(19) ∑ (20)
The dependent variables are measured by the natural log of Q1, Q2, and Q3. The sample includes 94 firms from 2005 to 2008, or a total of 322 firm-years observation. is the dummy variable equal 1 if the observation in year 2005-2007 and equal 0 otherwise. is dummy variable is set to 1 if the observation in year 2008 and equal 0 otherwise. Other variables remain the same as described above. t-statistics are reported in the parentheses. *,**,*** denote significance at the 10%, 5% and 1% levels, respectively. The coefficients relating to control variables are not reported to conserve space. Oil Gas 1 2 3 1 2 3
Panel A: Dependent Variable is LnQ1
Hedging - price increase -0.017 0.059 0.036 0.048 -0.005 -0.167(-0.18) (0.45) (0.47) (0.49) (-0.03) (-0.10)
Hedging – price decrease -0.176 -0.141 0.000 -0.049 -0.019 0.131(-2.74)*** (-1.21) (-0.01) (-0.67) (-0.15) (0.29)
R-squared 0.071 0.052 0.039 0.049 0.044 0.044
Panel B: Dependent Variable is LnQ2 Hedging - price increase -0.350 -0.438 -0.014 -0.484 -0.735 -5.922
(-3.11)*** (-2.83)*** -(0.15) (-4.28)*** (-4.35)*** (-3.08)***Hedging – price decrease 0.153 0.296 0.020 0.044 0.193 1.593
(2.02)** (2.19)** (0.94) (0.52) (1.33) (3.02)***R-squared 0.181 0.166 0.142 0.200 0.193 0.178
Panel C: Dependent Variable is LnQ3 Hedging - price increase -0.376 -0.317 -0.017 -0.406 -0.590 -6.358
(-4.22)*** (-2.56)*** (-0.24) (-4.53)*** (-4.39)*** (-4.18)***Hedging – price decrease -0.096 -0.025 0.007 -0.056 -0.007 -0.229
(-1.61) (-0.23) (0.42) (-0.85) (-0.06) (-0.549)R-squared 0.258 0.232 0.233 0.271 0.265 0.256

Table VIII: Hedging and Firm Value: Robustness Checks
This table presents the results of our robustness checks. Panel A presents results relating to non-linearity tests. Table B shows the results when outliers are removed. Panel C finally shows that results estimated using fixed effects.*,**,*** denote significance at the 10%, 5% and 1% levels. Coefficients relating to control variables are not reported to conserve space.
Oil Gas 1 2 1 2
Panel A: Non-linearity tests Q1 Delta -0.451 0.028 0.043 -1.142
(-2.08)** -0.43 -0.15 (-0.97)Delta2 0.385 -0.001 -0.071 1.48
(2.03)** (-0.42) (-0.21) -1.16Q2 Delta -0.116 0.047 -0.168 1.616
(-0.44) -0.59 (-0.50) -1.17Delta2 0.105 -0.001 0.002 -0.409
-0.45 (-0.37) -0.01 (-0.27)Q3 Delta -0.3 -0.013 -0.13 -2.985
(-1.47) (-0.22) (-0.49) (-2.77)***Delta2 0.151 0.001 -0.129 2.942
-0.84 -0.33 (-0.42) (2.51)**Oil Gas
1 2 3 1 2 3Panel B: Outlier Removal
Hedging - Q1 -0.14 -0.19 0.067 -0.03 -0.003 0.118
(-2.33)** (-1.53) (-0.18) (-0.43) (-0.02) -0.26 Hedging - Q2
0.05 -0.04 1.208 -0.056 -0.175 1.269 -0.66 (-0.28) (2.73)*** (-0.66) (-1.25) (2.38)**
Hedging - Q3 -0.153 -0.203 -0.213 -0.123 -0.226 -0.493
(-2.64)*** (-1.76)* (-0.63) (-1.84)* (-2.06)** (-1.17) Panel C: Fixed Effects Model
Hedging - Q1 -0.136 -0.027 0.014 -0.037 -0.029 -0.106(-2.23)** (-0.29) -0.03 (-0.52) -0.26 (-0.24)
Hedging - Q2 -0.001 0.041 1.079 -0.107 -0.088 1.125(-0.01) -0.38 (2.58)** (-1.34) (-0.70) (2.23)**
Hedging - Q3 -0.199 -0.11 -0.287 -0.157 -0.155 -0.484(-3.76)*** (-1.33) (-0.92) (-2.56)*** (-1.64)* (-1.24)

Figure I: Crude Oil and Natural Gas Prices from 2005-2009
0
2
4
6
8
10
12
0
20
40
60
80
100
120
140
160
Jan‐2005 Jan‐2006 Jan‐2007 Jan‐2008 Jan‐2009
Natural gas price ($/Mmbtu)
Oil price ($/Bbl)
Oil Price
Gas Price

REFERENCE
Allayannis, G Weston, J 2001, “The Use of Foreign Currency Derivatives and Firm
Market Value”, Review of Financial Studies 14, 243–276.
Bartram, S Gregory, B and Frank, F 2003, “International Evidence on Financial
Derivatives Usage", Working Paper, University of North Carolina.
Carter, D Rogers, D, Simkins, B 2006, “Hedging and Value in the U.S. Airline Industry”,
Journal of Applied Corporate Finance, 18, 4, 21-33.
Chen, C Jin, Y and Wen, M 2008,”Executive Compensation, Hedging, and Firm Value”,
Working Paper, California State University and National Tsinghua University.
Gagnon, L Lypny, G and McCurdy, T 1998, “Hedging Foreign Currency Portfolios”,
Journal of Empirical Finance 5, 3, 197-220.
Guay, W and Kothari, S 2003, "How Much Do Firms Hedge with Derivatives?" Journal
of Financial Economics, 70, 423-461.
Jin, Y and Jorion, P 2006, “Firm Value and Hedging: Evidence from U.S. Oil and Gas
Producers,” Journal of Finance, 61,893-919.
Jin, Y, and Jorion, P 2007, “Does Hedging Increase Firm Value? Evidence from the Gold
Mining Industry”, Working paper, California State University-Northridge and University
of California-Irvine .
Jorion, P 1990, “The Exchange-rate Exposure of U.S Multinationals." Journal of Business
63, 331-345.
Kapitsinas, S 2008: “The Impact of Derivatives Usage on Firm Value: Evidence from
Greece”, Working Paper, National and Kapodistrian University of Athens.
Lang, L. and Stulz, R. 1994, ‘Tobin’s Q, corporate diversification and firm performance’, Journal of Political Economy, 102,1248-1280
Lookman, A 2003, “Does Hedging Increase Firm Value? Comparing Premia for Hedging
“Big”versus “Small” risks.” Working Paper, Carnegie Mellon University.
Magee, S 2008,”Foreign Currency Hedging and Firm Value: A Dynamic Panel
Approach”, Working Paper, Macquarie University.
Nance, D Smith, C and Smithson, C 1993, “On the Determinants of Corporate Hedging,”
Journal of Finance, 48, 267-284.

Rajgopal, S 1999, “Early Evidence on the Informativeness of the SEC's Market Risk
Disclosures: The Case of Commodity Price Risk Exposure of Oil and Gas Producers."
Accounting Review 74, 251-280.
Rossi, J and Laham, J, 2008 “The Impact of Hedging on Firm Value: Evidence from
Brazil”, Journal of International Finance and Economics 8, 1.
Stulz, R 1990, “Managerial Discretion and Optimal Hedging Policies.", Journal of
Financial Economics 26, 3-27.
Tufano, P 1996, “Who Manages Risk? An Empirical Examination of Risk Management
Practices in the Gold mining Industry”, Journal of Finance 51, 1097-1137.